today: multiple loci (continued) inbreeding & pedigree analysis discuss outlines
TRANSCRIPT

Today: Multiple loci (continued)Inbreeding & pedigree analysisDiscuss outlines

Gametic disequilibrium:
When should we be concerned about possible nonrandom associations between loci?
(1) Closely linked markers.
(2) Small effective population size
(3) Hybridization
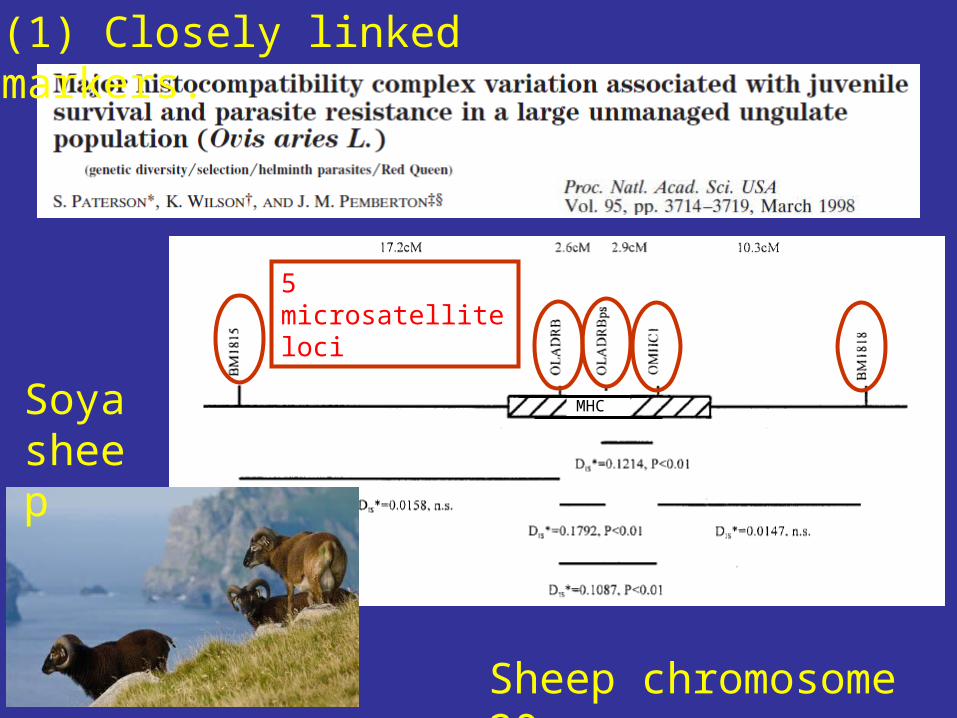
Sheep chromosome 20
5 microsatellite loci
(1) Closely linked markers.
Soya sheep
MHC

Guest Box 10: Phillip Island foxes
(2) Small effective population size

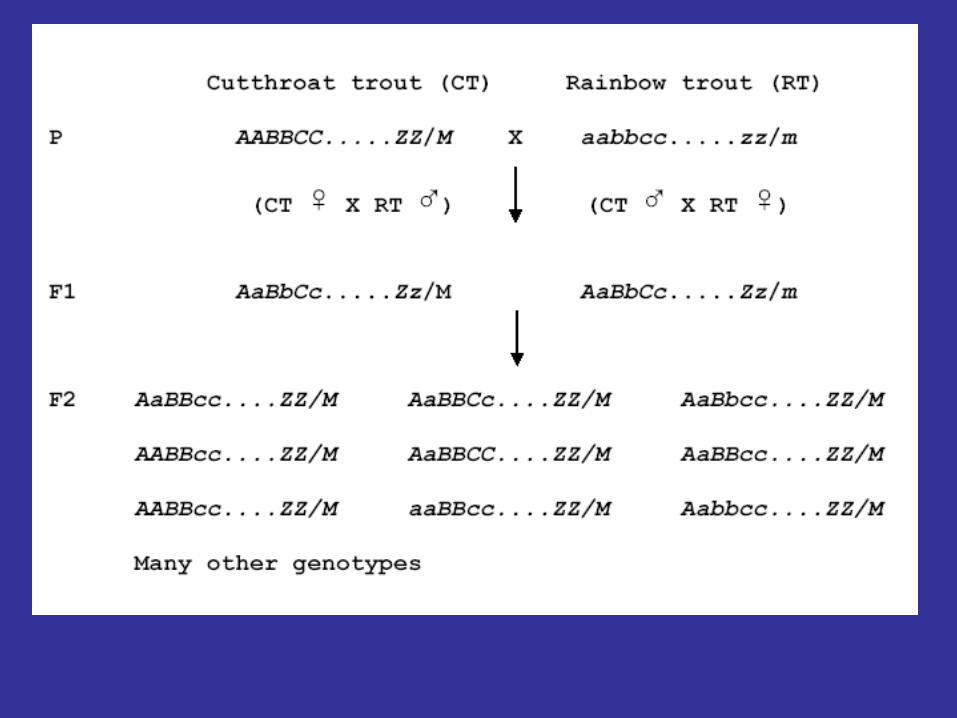
Yellowstone cutthroat trout
(YCT)
O. c. bouvieri
Rainbow trout
(RT)
O. mykiss
Westslope cutthroat trout
(WCT)
Oncorhynchus clarki lewisi
(3) Hybridization

D = coefficient of gametic disequilibrium (measure of nonrandom association of two loci)
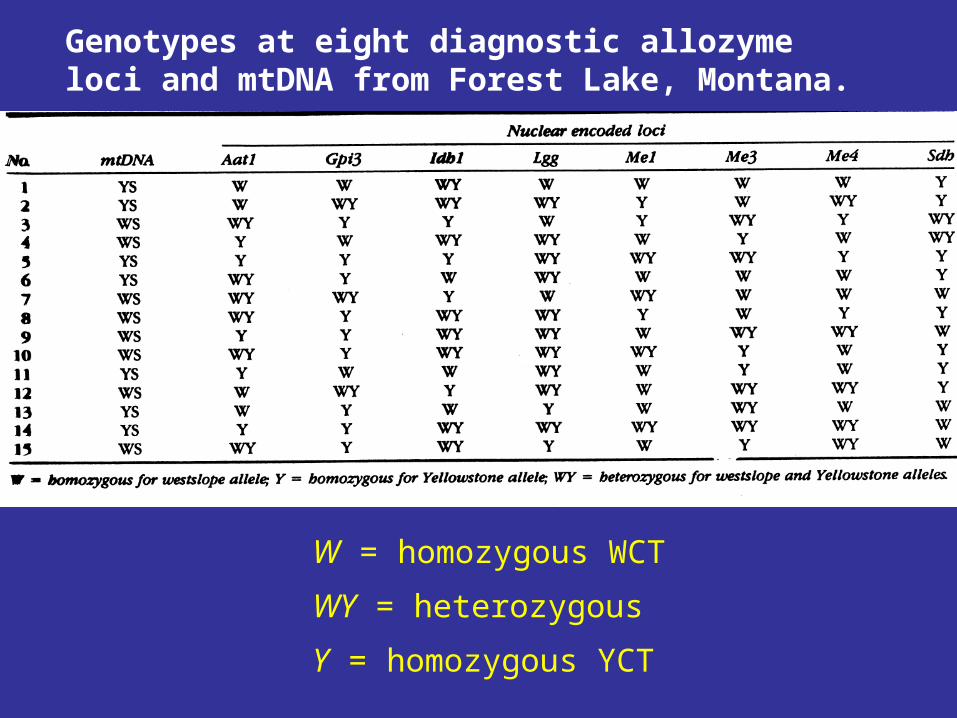
Genotypes at eight diagnostic allozyme loci and mtDNA from Forest Lake, Montana.
W = homozygous WCT
WY = heterozygous
Y = homozygous YCT

Hybrid swarm: a population of individuals that all are hybrids by varying numbers of generations of backcrossing with parental types and mating among hybrids.
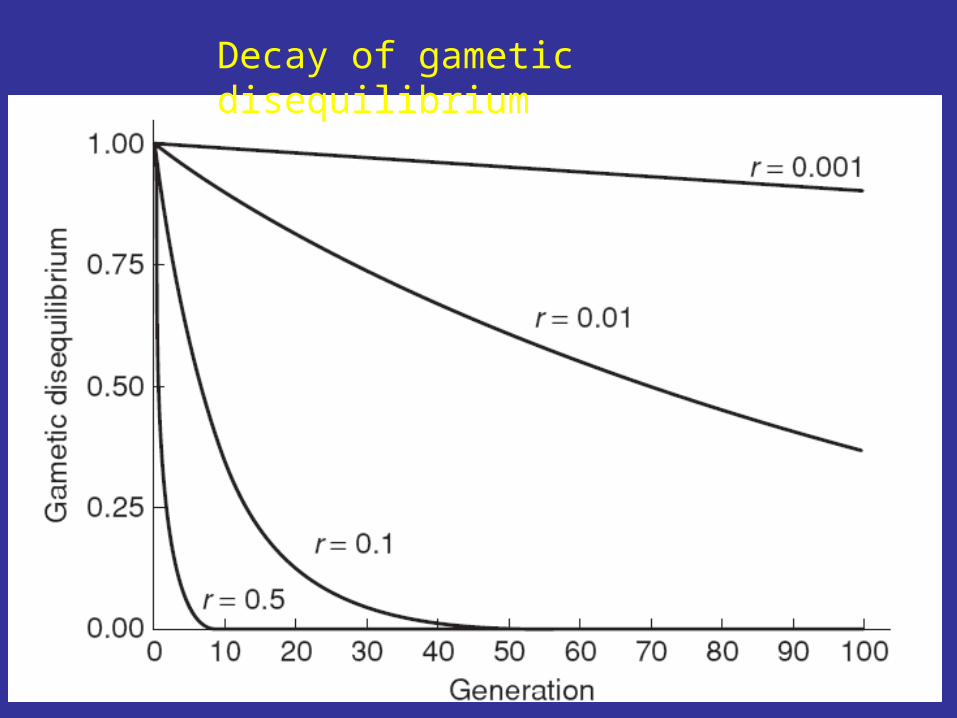
Decay of gametic disequilibrium
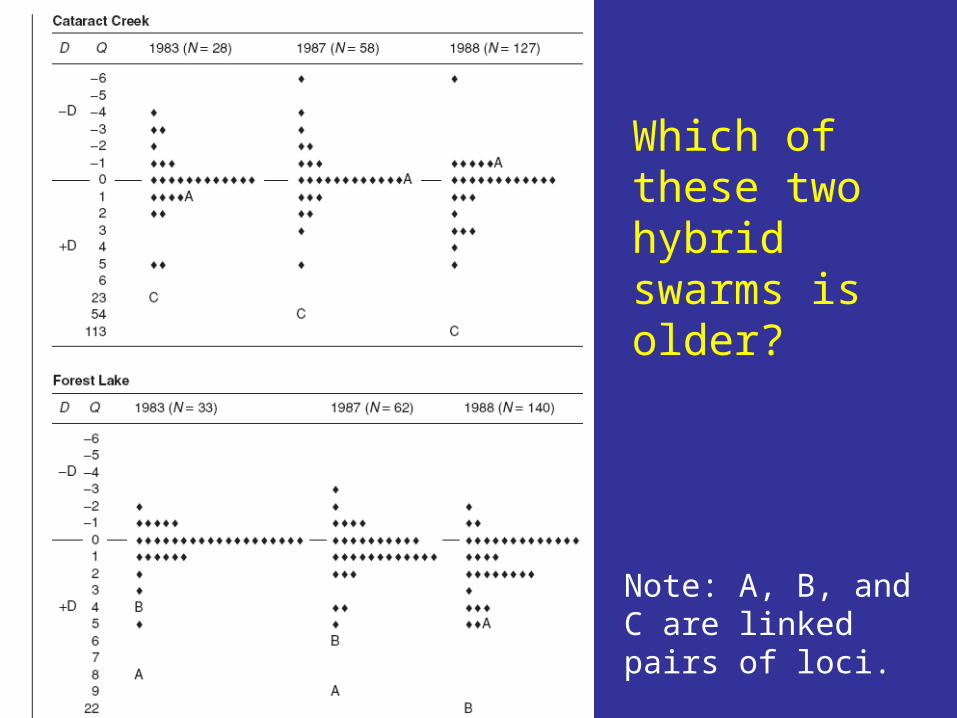
Which of these two hybrid swarms is older?
Note: A, B, and C are linked pairs of loci.


Bull trout = BL (L= homozygous)
Brook trout = BR (R = homozygous)
Chapter 13
Inbreeding (Fred)
What is inbreeding?
How can we estimate F?Pedigree analysisGene drop analysisMolecular markers
Inbreeding Depression (Marty)
What are the causes of inbreeding depression?
How do we measure inbreeding depression?
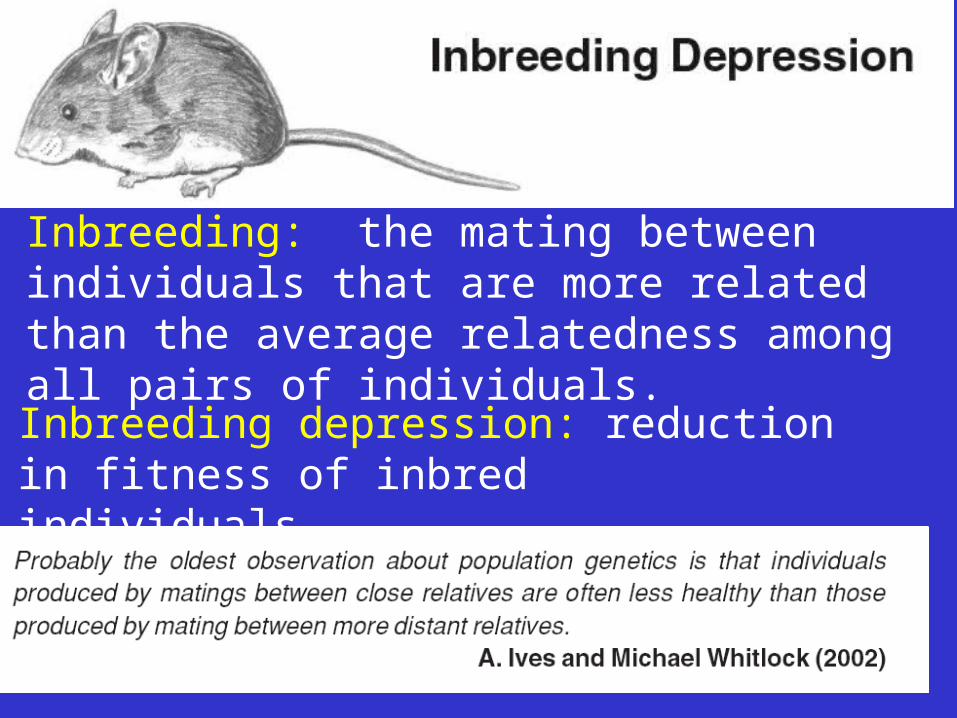
Inbreeding depression: reduction in fitness of inbred individuals.
Inbreeding: the mating between individuals that are more related than the average relatedness among all pairs of individuals.

Reduced survival of progeny from selfing compared to outcrossing in monkey flowers.
Inbreeding depression

The reproductive assurance hypothesis explains how self-fertilization can be advantageous in species with strong inbreeding depression. Self-fertilization is beneficial if it enables the production of seeds when pollinators and/or potential mates are scarce. If opportunities for outcrossing are limited, selfing can be selected even if inbreeding depression is strong. Although the reproductive assurance hypothesis, first championed by Darwin, is now widely accepted as an explanation for the evolution of selfing, it has never been subject to a rigorous experimental test.
(2002)
. . the bad sex is better than no sex at all hypothesis.

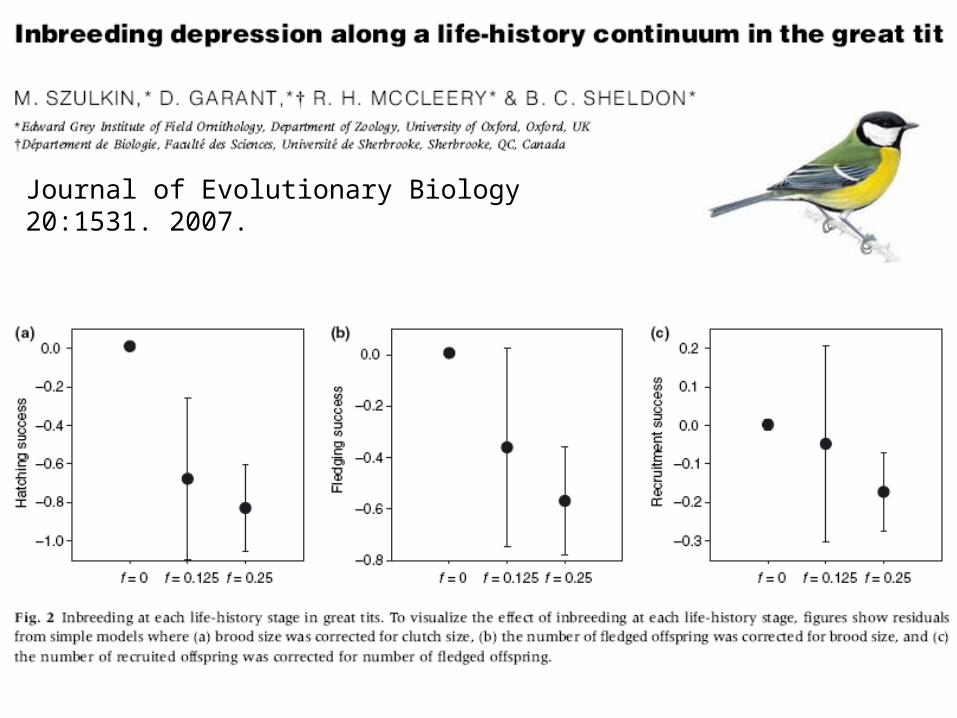
Journal of Evolutionary Biology 20:1531. 2007.

F = 0.25

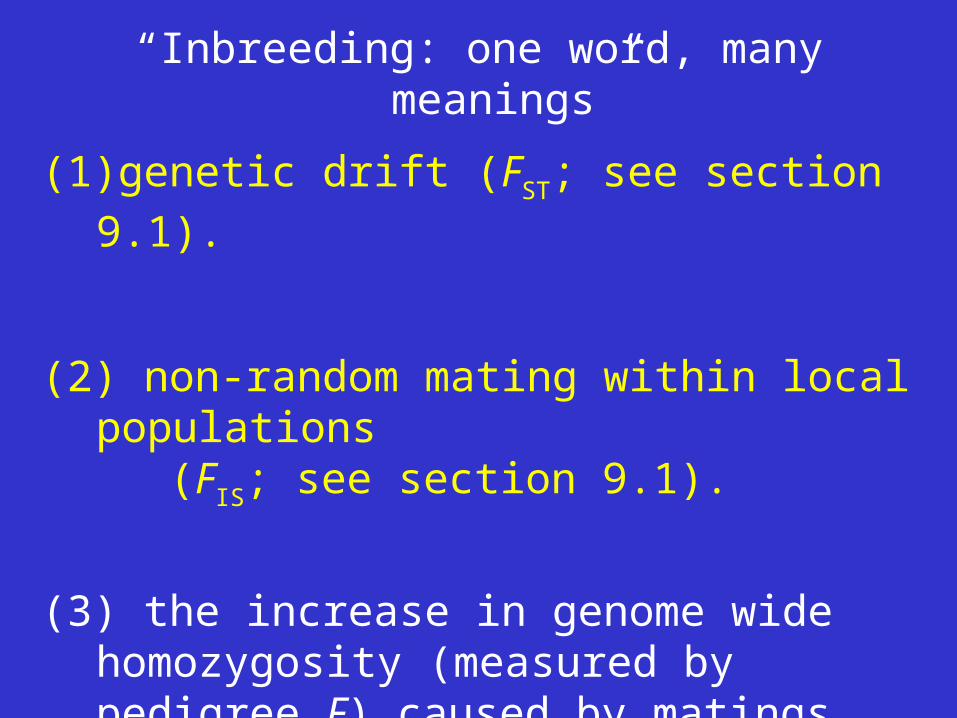
“Inbreeding: one word, many meanings”
(1)genetic drift (FST; see section 9.1).
(2) non-random mating within local populations (FIS; see section 9.1).
(3) the increase in genome wide homozygosity (measured by pedigree F) caused by matings between related individuals

Inbreeding can occur in both large and small populations.
Large: ponderosa pine in the northern Rockies
FIS ~ 0.10
“Inbreeding: one word, many meanings”
(1)genetic drift (FST; see section 9.1).
(2) non-random mating within local populations (FIS; see section 9.1).
(3) the increase in genome wide homozygosity (measured by pedigree F) caused by matings between related individuals

Guam rail

IBD
notIBD
Not identical in state
Identical in state

We are all “inbred”!
An individual is inbred if its mother and father share a common ancestor. However, any two individuals in a population are related if we trace their ancestries back far enough.
How many ancestors did you have 1,000 years ago?
240 = 1,100,000,000,000 = 1,100 billion
G = 25 1,000/25 = 40 generations

Growth of human population

Pedigree analysis
An individual is inbred if its mother and father share a common ancestor. However, any two individuals in a population are related if we trace their ancestries back far enough.
We must therefore define inbreeding relative to some "base" population in which we assume all individuals are unrelated to one another.
We usually define the base population operationally as those individuals in a pedigree beyond which no further information is available (i.e., founders).

Individual H is homozygous (and IBD) for the 1 allele that was present in his grandmother (A) who is a common ancestor of both his mother (D) and father (E).

"Inbred" individuals will have increased homozygosity (and decreased heterozygosity) over their entire genome.
The pedigree inbreeding coefficient (F) is the expected increase in homozygosity for inbred individuals; it is also the expected decrease in heterozygosity throughout the genome.
F ranges from 0 (for non-inbred individuals) to 1 (for totally inbred individuals).

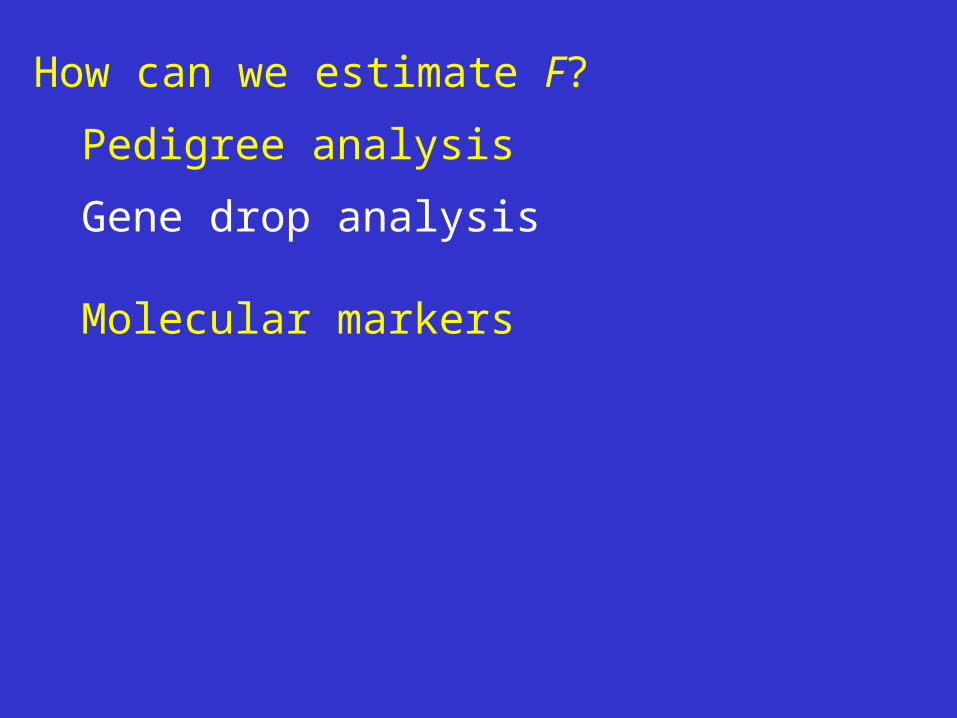
How can we estimate F?
Pedigree analysis
Gene drop analysis
Molecular markers
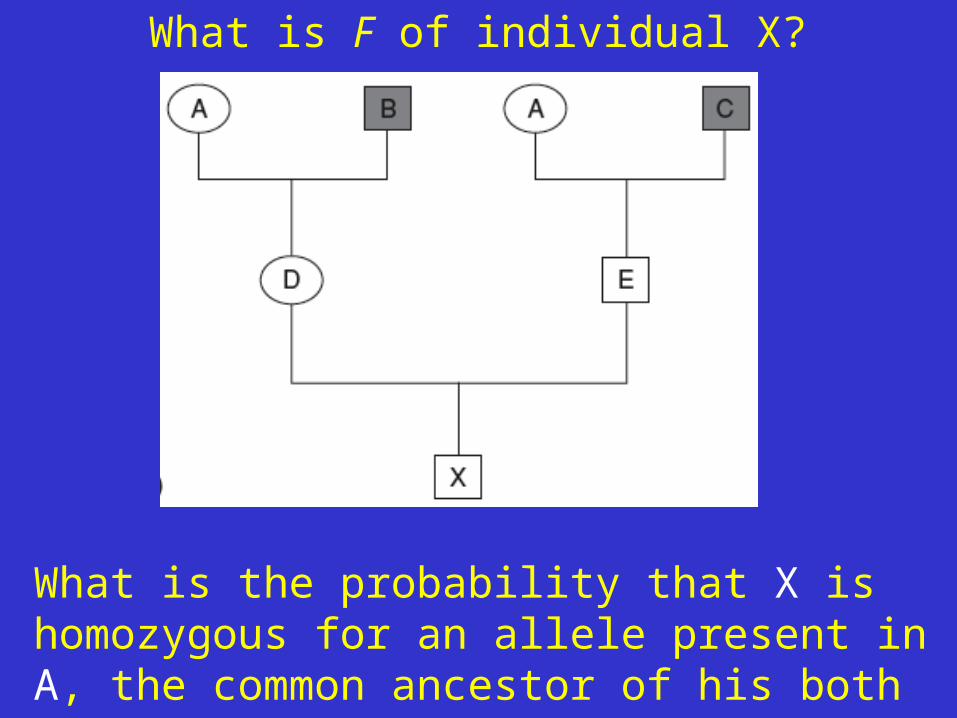
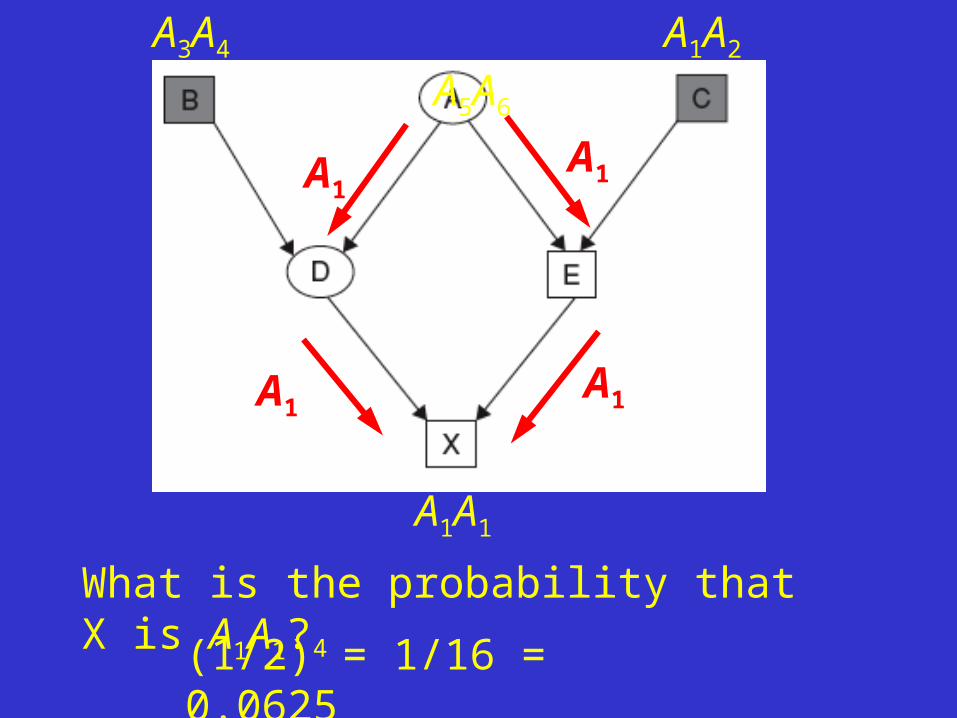
What is F of individual X?
What is the probability that X is homozygous for an allele present in A, the common ancestor of his both mother and father?
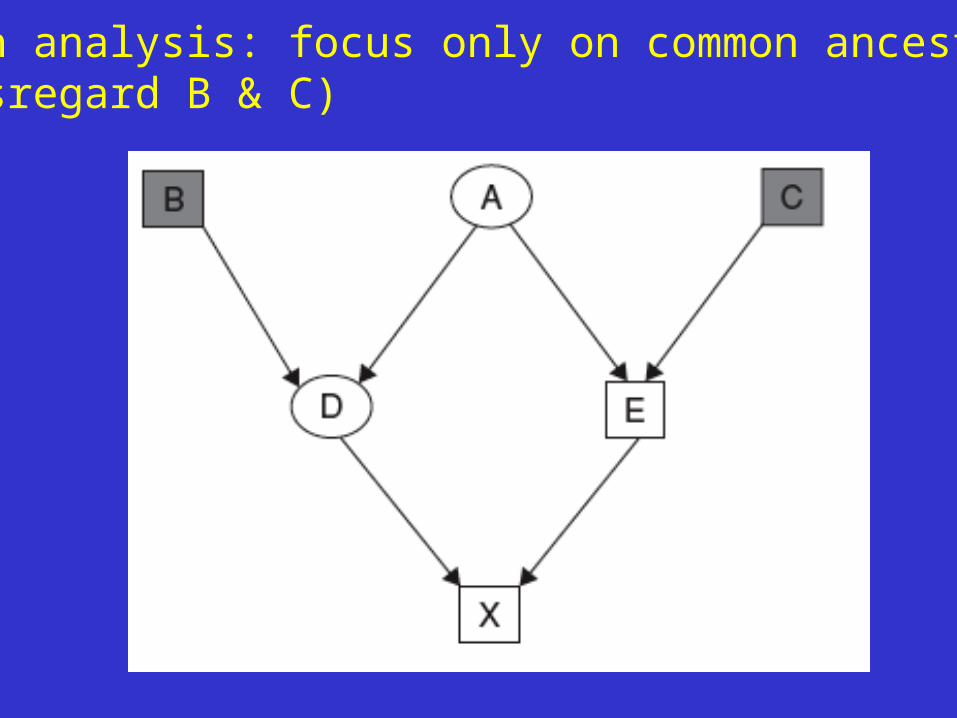
Path analysis: focus only on common ancestor(disregard B & C)

We assume that each “founder” is heterozygous for two unique alleles.
A3A4 A1A2 A5A6

What is the probability that X is homozygous (A1A1 or A2A2 ) for an allele present in A, the common ancestor of his both mother and father?
A3A4 A1A2 A5A6
A3A4 A1A2 A5A6
A1
A1A1
A1
A1A1
What is the probability that X is A1A1?
(1/2)4 = 1/16 = 0.0625

A3A4 A1A2 A5A6
A2
A2A2
A2
A2A2
What is the probability that X is A2A2?
(1/2)4 = 1/16 = 0.0625

A3A4 A1A2 A5A6
What is the probability that X is A1A1 or A2A2?
Sum rule: 0.0625 + 0.0625 = 0.1250

Trace path that connects X’s parents
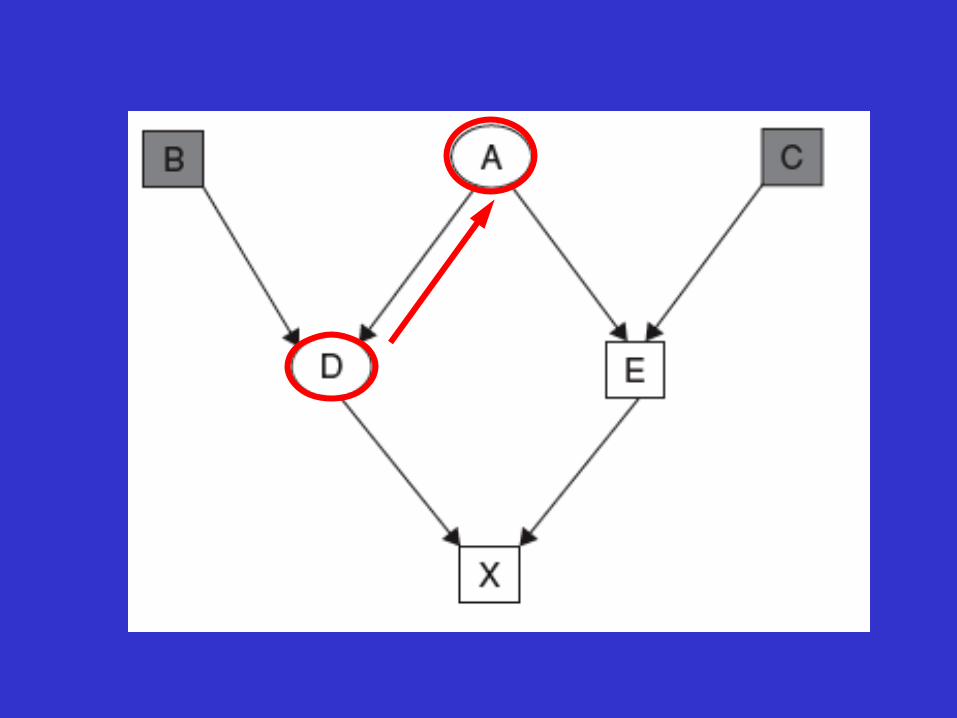
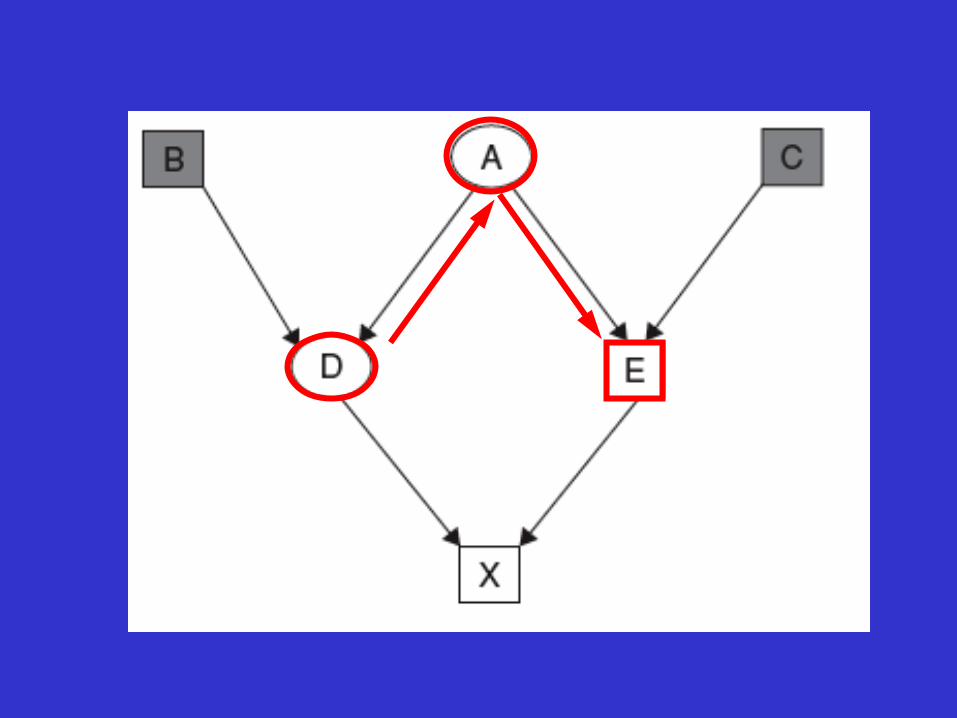

X has three individuals in his loop
DAE
A is common ancestor
F = (1/2)N(1 + FCA)
N = # individuals in loopFCA = F of common ancestor =FA
FX = (1/2)3 = 0.125

Redraw this pedigree as a path diagram and calculate the inbreeding coefficients of individual G.

F = (1/2)N(1 + FCA)

What about multiple levels of common ancestry?
F = (1/2)N(1 + FCA)
FG = (1/2)3 (1+FB)= 0.125
FK = (1/2)3(1+FG)
FK = (0.125)(1+0.125) = 0.141

Pedigree analysis in the wild
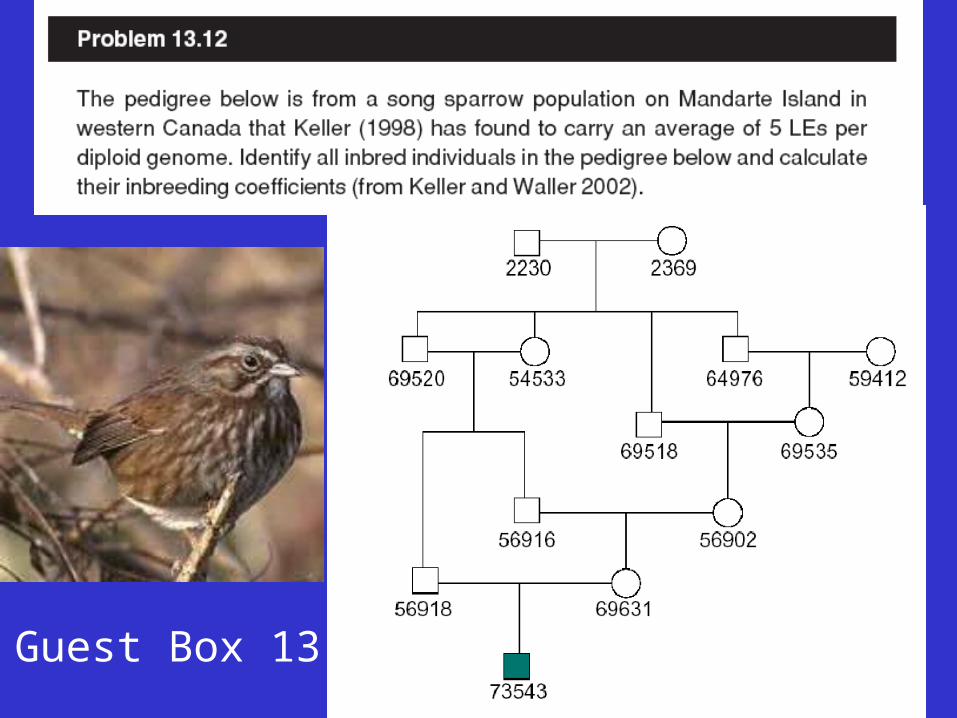
Pedigrees can also be constructed in wild populations using a combination of observations and molecular analysis.
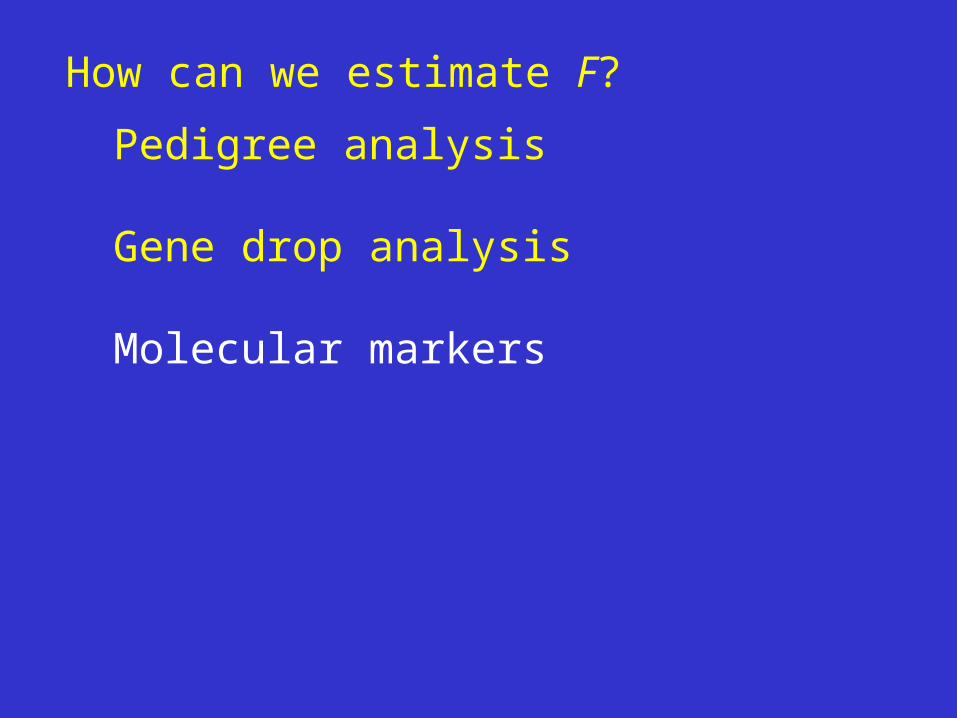
How can we estimate F?
Pedigree analysis
Gene drop analysis
Molecular markers
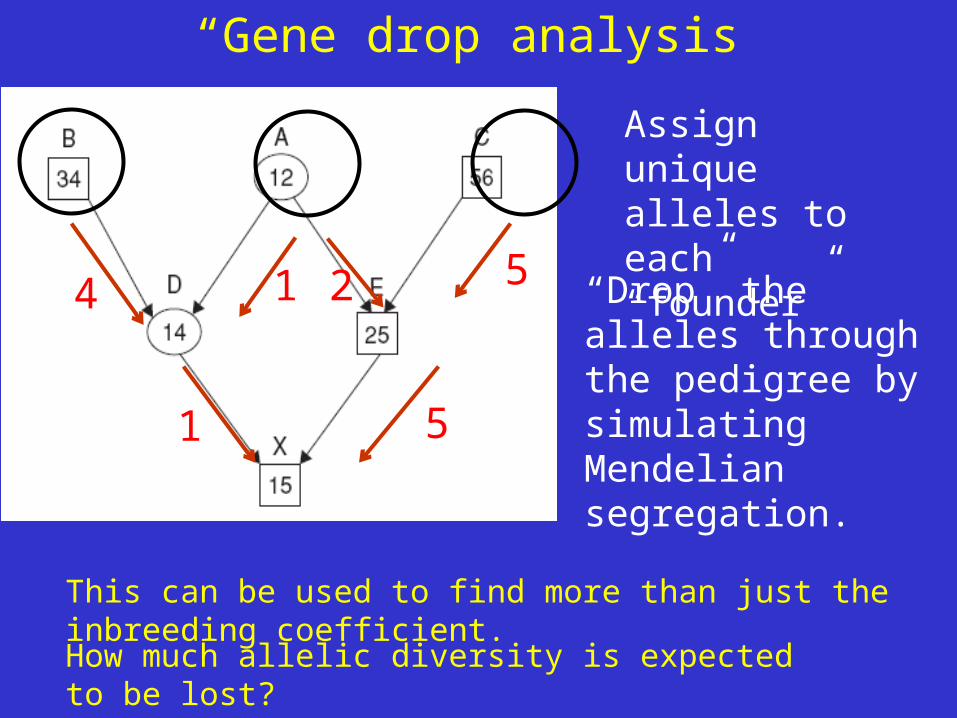
“Gene drop analysis”
This can be used to find more than just the inbreeding coefficient.
Assign unique alleles to each “founder”
“Drop” the alleles through the pedigree by simulating Mendelian segregation.
4 1 2 5
1 5
How much allelic diversity is expected to be lost?

50% loss of heterozygosity and alleles in living animals
Do this 10,000 times and than use the means.

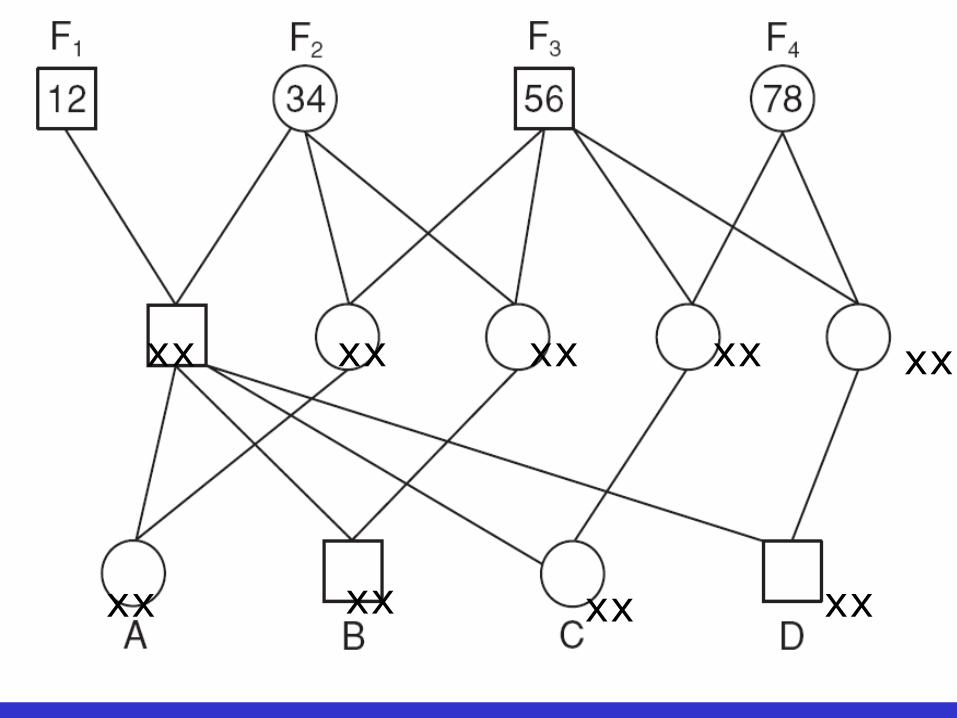
Assume that individuals F1-F4 above are the founders of a captive breeding program. Use coin-flips to derive one possible outcome of a gene-drop analysis for this pedigree.
What are the observed heterozygosities for individuals A-D based upon the outcome of your single gene-drop?
How many of the eight original alleles remain in the captive population based upon your single gene drop outcome? If you performed 10,000 such gene drops, what do you think the average observed heterozygosity would be for individuals A-D?
xx
xx xx xx
xx xx xx xx
xx
How can we estimate F?
Pedigree analysis
Gene drop analysis
Molecular markers

Captive population of wolves

(F)
Pedigree F correlated with heterozygosity (H) at 29 microsatellite loci
observed
predicted
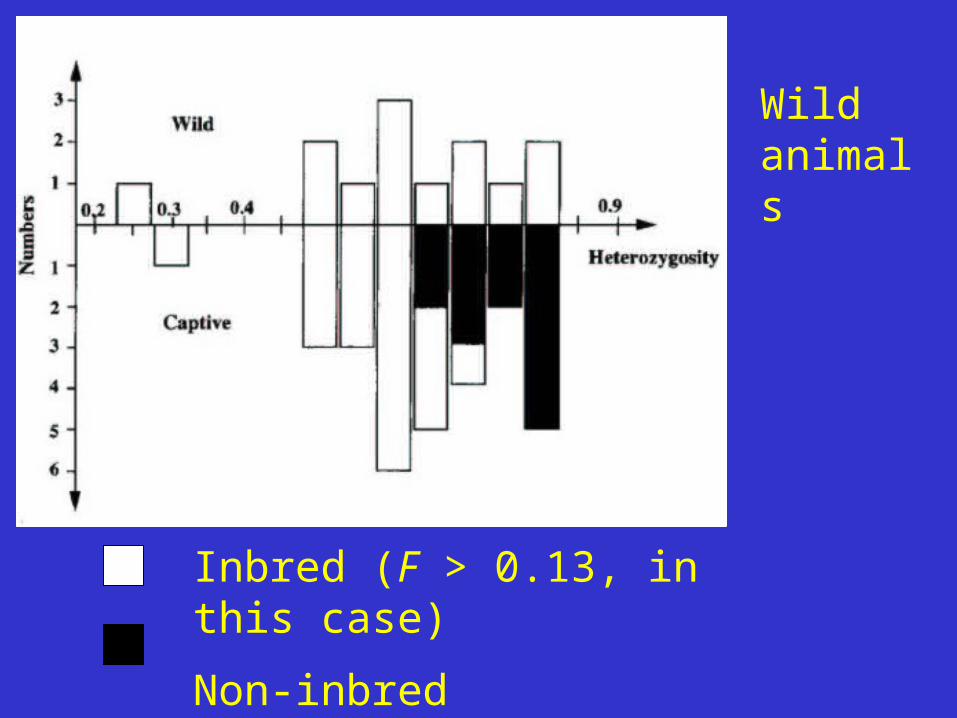
Inbred (F > 0.13, in this case)
Non-inbred
Wild animals

The outline of your paper should include the title, primary and secondary section headings, and a brief description of each section. The more detailed your outline is, the more helpful I can be in making my comments.
Section: Scientific papers are generally divided into discrete sections and subsections that both help the reader follow the writer's presentation and help the writer organize the paper. Make sure that you include sections and subsections in organizing your paper
The first section of the main body of your paper should be an Introduction. The first part of this section should introduce your topic and tell the reader why this is an interesting and important topic. You should include a statement of the purpose and objectives of your paper at the end of your Introduction.
Include 20 or so relevant citations at the end of your outline. Remember to use the Literature Cited format for the journal Conservation Biology.
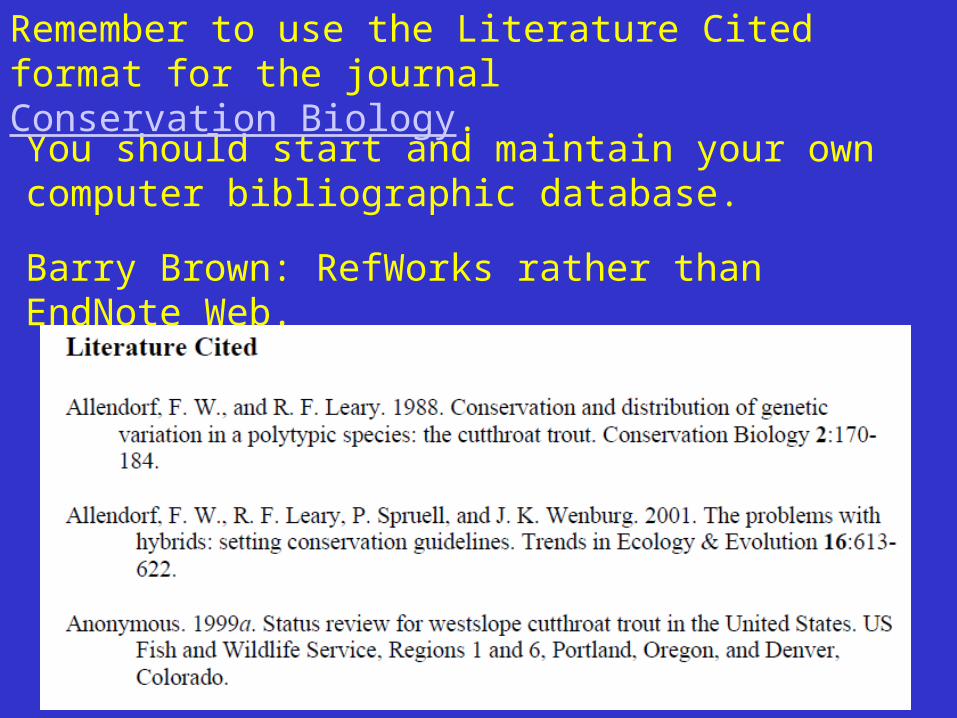
You should start and maintain your own computer bibliographic database.
Barry Brown: RefWorks rather than EndNote Web.
Remember to use the Literature Cited format for the journal Conservation Biology.