wavelet filter analysis of atmospheric pressure effects in
TRANSCRIPT

Physics of the Earth and Planetary Interiors 154 (2006) 70–84
Wavelet filter analysis of atmospheric pressure effects in thelong-period seismic mode band
X.-G. Hua,b,∗, L.-T. Liu a, J. Hindererc, H.T. Hsua, H.-P. Suna
a Institute of Geodesy and Geophysics, Chinese Academy of Sciences, 340 Xudong Street, Wuhan, Chinab Graduate School of Chinese Academy of Sciences, Beijing, China
c Institut de Physique du Globe de Strasbourg (UMR 7516 CNRS-ULP),5 rue Descartes, 67084 Strasbourg Cedex, France
Received 22 June 2005; received in revised form 19 September 2005; accepted 20 September 2005
Abstract
The importance of the reduction of atmospheric pressure effects becomes very clear when investigating seismic normal-modespectra below 1.5 mHz. The usual simple correction method consists in subtracting a term converted from local atmospheric pressure(pressure multiplied by a frequency-independent admittance) from the gravity record in time domain. Thus, estimating an efficientadmittance is the key for an improved correction. Band-pass filters derived from dyadic orthogonal wavelet transform, having narrowpass-bands with good frequency response but without Gibbs phenomenon and causing no phase lag, are very helpful to estimatean efficient admittance, which is both time and frequency-dependent. Processing of high quality superconducting gravimeter (SG)records for the great Sumatra earthquake (Mw = 9.3, Dec 26, 2004) with wavelet filters reveal the three very well resolved splitting
ces. Weer,
idals. Inoidalwitheryntal
toce-
tudytan-
theerm,sure
singlets of overtone2S1 with a single gravity record after correction with time-dependent and frequency-dependent admittanalso observe all coupled toroidal modes below 1.5 mHz, except0T5, 0T7 and1T1, with good signal-to-noise ratio (SNR); moreovtoroidal modes1T2 and1T3 are for the first time unambiguously revealed in vertical components.© 2005 Elsevier B.V. All rights reserved.
Keywords: Wavelet filter; Pressure correction; Free oscillations; Superconducting gravimeter
1. Introduction
The Earth can be excited by large earthquakes andstarts emitting the seismic energy in oscillatory modeswithin a frequency range from 0.3 to 20 mHz. Thesemodes can be represented as spheroidal and toroidalmodes according to their displacement fields. Toroidalmodes only have horizontal displacement component.But the coupling between spheroidal and toroidal modes
∗ Corresponding author. Tel.: +86 27 68881332;fax: +86 27 86783841.
E-mail address: [email protected] (X.-G. Hu).
due to Earth’s ellipticity and rotation causes the toromodes to appear on the vertical gravimeter recordthe frequency bands below 1.5 mHz, some spherand coupled toroidal modes can rarely be observedgood signal-to-noise ratio (SNR) because of their vweak signals and strong environment and instrumenoise at low frequencies.
The atmospheric noise in gravity signals is dueNewtonian attraction of air mass and vertical displament of ground caused by atmospheric loading. In sof earth tide gravity variations, it has become a sdard method to reduced the pressure effects fromgravity signal by subtracting a pressure converted ti.e. simultaneously recorded local atmospheric pres
0031-9201/$ – see front matter © 2005 Elsevier B.V. All rights reserved.doi:10.1016/j.pepi.2005.09.003

X.-G. Hu et al. / Physics of the Earth and Planetary Interiors 154 (2006) 70–84 71
multiplied by pressure admittances (e.g.Warburton andGoodkind, 1977; Spratt, 1982; Richter, 1983). Accu-rate estimation of local atmospheric pressure effects hasbeen studied for long periods (e.g.Doi et al., 1991;Merriam, 1992, 1994; Mukai et al., 1995; Neumeyer,1995; Neumeyer et al., 1998; Kroner and Jentzsch(1999); Meurers, 1999; Crossley et al., 1995, 2002).
Zurn and Widmer (1995)first showed that pres-sure correction with a single admittance value around−3.5 nm s−2 h Pa−1 can significantly improve the reso-lution in observing long-period seismic normal modesat frequencies below 1.5 mHz with the gravity recordof a spring instrument.Virtanen (1996), Freybourgeret al. (1997)andVan Camp (1999)demonstrated thatthis method is equally efficient for superconductinggravimeter (SG) record. The simple correction methodhas now been widely applied for the observation of long-period seismic mode based on the analysis of gravimeterrecords. In fact the correction method is based on thesimple linear model�p/�g =α, Thus, estimation of thefactorsα, the so-called pressure admittance, is the keyto efficient pressure correction. The atmospheric effectsvary with time, for example, strong pressure effects dur-ing the passage of cold fronts (e.g.Muller and Zurn,1983) and in winter of Europe (e.g.Beauduin et al.,1996), and also vary with frequency (e.g.Warburtonand Goodkind, 1977; Merriam, 1994; Neumeyer, 1995;Crossley et al., 1995; Hu et al., 2005). It is reasonableto believe that it is more efficient to correct the pressureeffects with time and frequency-dependent admittances.
andf and-p velet( sualF fil-t oodf itingn ular-i thet o-s thel hod.F mit-t ingu eo Hz.
2t
andc ent a
signal. A discrete signalfN(t) can also be expressed asa wavelet expansion by orthonormal basis derived fromtwo closely related basic functions, scaling functionφ(t)and waveletψ(t).
fN (t) =N/2J−1∑
n=0
aJ (n) 2J/2φ(2J t − n)
+J∑
j=1
N/2j−1∑
n=0
dj(n) 2j/2ψ(2jt − n) (1)
whereJ, j andn are integer indices,N is the length of thediscrete signal andN = 2M, 0 <J < M. The above expan-sion means that by scaling and translatingφ(t) andψ(t),the scaling function family 2J/2φ(2J/2t − n) and waveletfamily 2j/2ψ(2j/2t − n) can form an orthonormal basis forthe signal. Decomposition coefficientsdj(n) are knownas the dyadic discrete wavelet transform of the signalandaJ(n) is a approximation of the signal at scale 2−J.Orthogonal wavelet dilated by 2j carries signal variationsat the resolution 2−j. Thus, Eq.(1) is multi-resolutionanalysis (MRA) (Mallat, 1989a) of the signal within timescale 2J. The scaling functionφ(t) and waveletψ(t) usedto construct the orthonormal basis are derived from two-scale equations (Mallat, 1989a):
φ(t) =∑
k
h(k)φ(2t − k)
ψ(t) =∑
g(k)φ(2t − k)(2)
m,and
8,cal-up-
uchnbe
eletrmas
, for
toThert
We propose wavelet method to estimate the timerequency-dependent admittances. The wavelet bass filters based on high-order Daubechies waDaubechies, 1988) have three advantages over the uIR digital filter when processing gravity signals:
ering a signal into narrow frequency bands with grequency response but causing no phase shift, exhibo Gibbs phenomenon and suppressing some sing
ties. In the following sections, we first introduceheory of wavelet filter. Then we analyze local atmpheric pressure effects on gravity variations inong-period seismic mode bands with wavelet metinally, we demonstrate that wavelet method and ad
ances derived from it are very efficient in sharpenp the resolution of the multiplets of2S1, and show thbservation of coupled toroidal modes below 1.5 m
. Bandpass filter derived from waveletransform
It is well known that a Fourier series uses sinsosines as orthonormal basis functions to repres
k
wherek is an integer index for the infinite or finite suh(k), g(k) are sequence called scaling coefficientswavelets coefficients, respectively.Daubechies (1981992) demonstrated that it is possible for the sing function and the wavelet to have compact sport (i.e. be nonzero only over a finite-region). In sa case, coefficientsg(k) and h(k) have a finite evelengthL, and they are required by orthogonality torelated by
g(k) = (−1)kh(L− 1 − k) k = 0,1, . . . , L− 1. (3)
Fig. 1 shows Daubechies scaling function and wavwith length of 128 and discrete-time Fourier transfoof them. We can see that scaling function workslow-pass filter and wavelet as high-pass filter. Thusthe signal in Nyquist frequency band 0–F, within timescale 2−J multi-resolution analysis splits the signal inJ + 1 logarithmically spaced frequency sub-bands.first summation in Eq.(1) gives a approximation paof the signal in lower frequency sub-band 0–F/2J. Foreach indexj in the second summation givesJ detail

72 X.-G. Hu et al. / Physics of the Earth and Planetary Interiors 154 (2006) 70–84
Fig. 1. Daubechies scaling functionφ(t) and waveletψ(t) with lengthof 128 in the time domain (a) and frequency domain (b).
parts in higher frequency sub-bandF/2j–F/2j − 1, j = 1,2, . . ., J.
Mallat (1989b) proposed a fast algorithm for themulti-resolution analysis of a signal. The algorithm is aniteration procedure which carries out from coefficients tocoefficients and orthonormal basis functions never actu-ally enter into the calculation but scaling coefficientsh(k)and wavelet coefficientsg(k) are used. An analysis pro-cedure determines all decomposition coefficients in Eq.(1) by using two recursion equations:
aj+1(n) = 2−1/2N/2j−1∑
k=0
h(k − 2n)aj(k)
dj+1(n) = 2−1/2N/2j−1∑
k=0
g(k − 2n)aj(k)
n = 0,1,2, . . . , N/2j+1 − 1 (4)
In practice, the discrete signalfN(t) is usually taken asthe initial approximation coefficientsa0(n) (n = 0, 1, 2,. . ., N − 1) to the underlying continuous signal at scaleindex 0.
A synthesis procedure to calculate Eq.(1) fromdecomposition coefficientsaj(n) anddj(n) is determinedby Eq.(4) as
aj−1(k) = 2−1/2N/2j−1∑
n=0
aj(n)h(k − 2n)
There is exactly equivalence between Mallat’salgorithm and a two-channel orthogonal filter bank(e.g.Smith and Barnwell, 1986). The orthogonal filterbank is a structure that decomposes a signal intoa collection of sub-band signals and can perfectlyreconstruct the original signal with these sub-bandsignals. The wavelet two-channel orthogonal filter bankconsists of both analysis and synthesis filter bank.The analysis bank is a set of half band low-pass andhigh-pass filters linked by down-sampling operators(see Fig. 3). The low-pass filter h(k) is associatedwith the scaling function byh(k) = 2−1/2h(L− 1 − k)and high-pass filter ¯g(k) is associated with waveletby g(k) = 2−1/2g(L− 1 − k). The decompositioncoefficientsaJ(n) anddj(n) are sub-band signals outputby the analysis filter bank in sub-band 0–F/2J+1 andF/2j–F/2j−1, j = 1, 2,. . ., J. The synthesis filter bank is aset of half band low-pass and high-pass filters linked byup-sampling operators (seeFig. 3). The low-pass filter ish(k) = 2−1/2h(k) and high-pass filter ˜g(k) = 2−1/2g(k).Considering Eq.(3), the half band filters in synthe-sis bank are associated with these in analysis bankby
h(k) = h(L− 1 − k)
g(k) = g(L− 1 − k)k = 0,1,2, . . . , L− 1 (6)
In such a case, the filter bank is quadrature mirror filter(QMF) bank. The alias, amplitude distortion and phaseshift caused by sampling and filtering are cancelled
ande aresis
s toass
t theomas aentsemesisow-eso-andelet
erassd fre-ncy.t
+ 2−1/2N/2j−1∑
n=0
dj(n)g(k − 2n)
k = 0,1,2 . . . , N/2j−1 − 1 (5)
Note that sequencea0(k) is just the original signalfN(t).
by the special relation between filterh(k), g(k), h(k)and g(k). Fig. 2 shows the frequency responsephase spectra of these filters. We can see thermirror symmetry between half-band filters in analybank and these in synthesis bank, which leadno phase shift for the output of wavelet band-pfilter.
The synthesis filter bank can perfectly reconstrucinput signal with the decomposition coefficients frthe analysis bank. The orthogonal filter-bank actsband-pass filter when only parts of these coefficiare used to reconstruct. The wavelet filtering schis shown inFig. 3. We can see that wavelet analybank only repeatedly split, filter and decimate the lpass bands. This results in logarithmic frequency rlution; the low frequencies have narrow bandwidthsthe high frequencies have wide bandwidth. The wavpacket system proposed byCoifman and Wickerhaus(1992)allows splitting both the low-pass and high-pbands, and thus leads to a completely evenly spacequency band and a finer resolution in high frequeThe multi-resolution of the discretefN(t) from wavele

X.-G. Hu et al. / Physics of the Earth and Planetary Interiors 154 (2006) 70–84 73
Fig. 2. (a) Frequency response of half-band low-pass and high-pass filters in wavelet QMF bank. (b) Phase spectra of half-band low-pass filter inanalysis bank (dashed line) and in synthesis bank (solid line). (c) Phase spectra of half-band high-pass filter in analysis bank (dashed line) and insynthesis bank (solid line).
packet system is expressed as
fN (t) =J∑
j=1
2j−1∑
m=0
N/2j−1∑
n=0
wj,m(n) 2j/2W2j+m(2jt − n)
(7)
wherej is scale index,N the length of the discrete sig-nal andN = 2M, 0 <J < M. wj,m(n) are wavelet packetdecomposition coefficients. The wavelet packet functionW(t) is derived from scaling functionφ(t) by recursionequations
W2k(t) =∑
k
h(k)Wk(2t − k)
W2k+1(t) =∑
k
g(k)Wk(2t − k)(8)
whereh(k), g(k) are scaling and wavelets coefficients,respectively, andW0(t) is the scaling functionφ(t). Thewavelet-packet multi-resolution is implemented with anorthogonal filter bank having a full binary tree structure.For aJ-level wavelet-packet filter bank, the discrete sig-nal can be decomposed into 2J evenly spaced frequencysub-bands: (n − 1)F/2J–nF/2J, n = 1, 2, 3,. . ., 2J. Fig. 4
shows filtering scheme of a three-level wavelet packetfilter bank.
The filter bank derived from Daubechies waveletalso has the ability to suppress short-term singulari-ties in the signal. The reason is because of vanishingmoment of Daubechies wavelet. The moment conditionof Daubechies wavelets can be expressed in terms of thescaling coefficients as
L−1∑
k=0
(−1)kh(k)km = 0 m = 0,1,2, . . . , L/2 − 1 (9)
whereL is the length of scaling coefficientsh(k). Thesewavelets haveL/2 vanishing moments, which means thatthey can suppress parts of the signal which are poly-nomial up to degreeL/2− 1. When gravity signals arefiltered in to a sub-band, some short-term noise approxi-mated by polynomials of low degree can be suppressed,the harmonic components, such as Earth tides and long-period seismic modes, are smoothly represented. Thus,wavelet filtering is particularly suited to accurately filterout the harmonic components from gravity record.
In the next section we apply the Daubechies waveletpacket filter bank to gravity and local atmospheric pres-
F an inp lsa al only nal, isl
ig. 3. The three-level wavelet analysis filter bank decomposes
3, d1, d2 andd3. Synthesis filter banks reconstruct the input signocated in sub-bandF/23–F/22.
ut signalf(t) within Nyquist frequency band 0–F into four sub-band signawithd3, thus the output, which has the same length as the input sig

74 X.-G. Hu et al. / Physics of the Earth and Planetary Interiors 154 (2006) 70–84
Fig. 4. The three-level wavelet packet analysis filter bank decomposes an input signalf(t) within Nyquist frequency band 0–F into eight sub-bandsignals. Synthesis filter banks reconstruct the input signal only withw3,3, thus the output, which has the same length as the input signal, is insub-band 3F/23–4F/23.
sure records to analyze the atmospheric effects in long-period seismic band.
3. Atmospheric pressure effects in long-periodseismic band
Until now about 20 superconducting gravimeters(SGs) have been deployed worldwide for measuringtemporal gravity variations due to their high sensitiv-ity and low drift rates and their records are collectedand exchanged at Global Geodynamics Project (GGP)(e.g.,Crossley et al., 1999; Hinderer and Crossley, 2004)data centre located at the International Centre for EarthTides (ICET) in Brussels. The ability of SGs to measurenormal modes had already been studied for many years(e.g.Kamal and Mansinha, 1992; Richter et al., 1995;Freybourger et al., 1997; Banka and Crossley, 1999; VanCamp, 1999), but these early results demonstrated thatSGs are noisier than broadband seismometers STS-1 andeven spring gravimeters in the long-period seismic nor-mal mode band. But the case is completely different forthe new generation compact type SG (e.g.Warburton andBrinton, 1995; Richter and Warburton, 1998), which hasa sensitivity close to the 1 nGal (0.01 nm s−2) level intidal and long-period seismic mode bands. Recent stud-ies of the SG noise level in seismic band, based on newlow-noise model (NLNM) (Peterson, 1993), have shownthat for frequencies below 1.5 mHz, the new genera-tion SGs are competitive with the best seismometers,
and for frequencies below 1 mHz, they can even reachlower noise levels than that of the STS-1 seismome-ters (e.g.Rosat et al., 2002; Widmer, 2003). Therefore,SGs are particularly suited to observation of the Earthfree oscillations below 1.5 mHz. The large 2004 Sumatraearthquake provides us a very good chance for observa-tion of some hard-to-detect spheroidal modes splittingand toroidal modes coupling below 1.5 mHz with SGrecords.
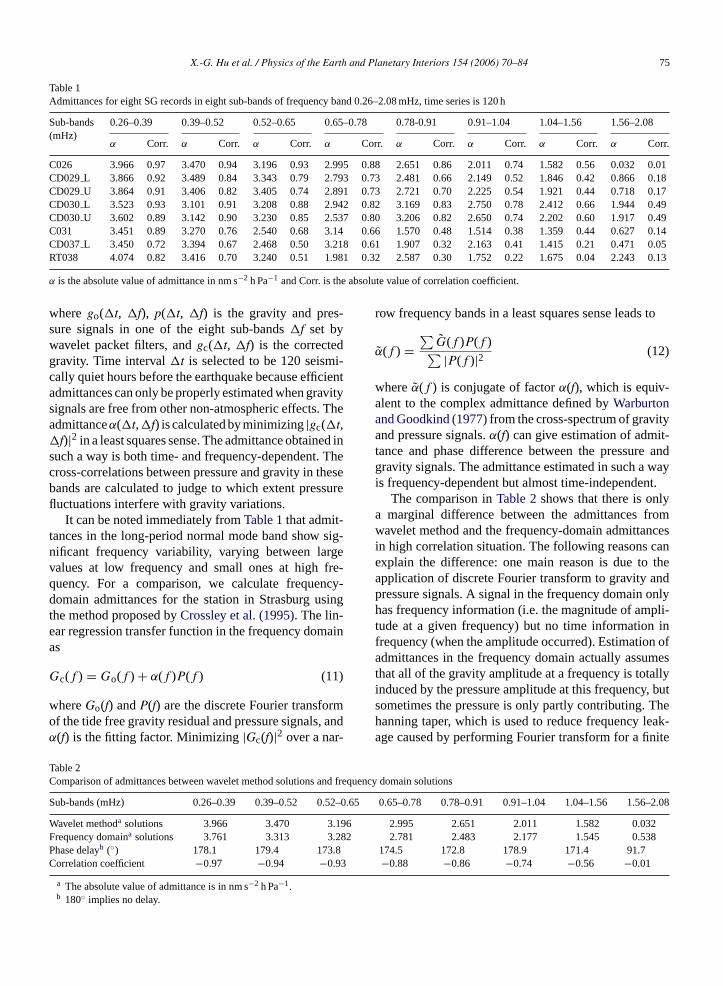
The SG records for the Sumatra earthquake are pro-vided by GGP data centre. We select eight gravity andlocal atmospheric records from six GGP stations: C031(Canberra, Australia), RT038 (Concepcion, Chile), CD-37 (Sutherland, South African), CD029-L and CD029-R (Wettzell, Germany), CD030-L and CD030-R (BadHomburg, Germany), C026 (Strasbourg, France). Theserecords are decimated to 1 min, thus their Nyquistfrequency band is 0–8.33 mHz (periods 2 min to∞).Using wavelet packet filters derived from Daubechieswavelet with length of 128, we filter out observed grav-ity and air pressure signals into eight sub-bands: sixsub-bands in frequency range 0.26–1.04 mHz with band-width 0.13 mHz and two sub-bands in frequency range1.04–2.08 mHz with bandwidth 0.52 mHz (seeTable 1).The admittances between gravity and local atmosphericpressure signals in these sub-bands are determined by alinear regression transfer function as
gc(�t,�f ) = go(�t,�f ) + α(�t,�f ) p(�t,�f )
(10)
X.-G. Hu et al. / Physics of the Earth and Planetary Interiors 154 (2006) 70–84 75
Table 1Admittances for eight SG records in eight sub-bands of frequency band 0.26–2.08 mHz, time series is 120 h
Sub-bands(mHz)
0.26–0.39 0.39–0.52 0.52–0.65 0.65–0.78 0.78-0.91 0.91–1.04 1.04–1.56 1.56–2.08
α Corr. α Corr. α Corr. α Corr. α Corr. α Corr. α Corr. α Corr.
C026 3.966 0.97 3.470 0.94 3.196 0.93 2.995 0.88 2.651 0.86 2.011 0.74 1.582 0.56 0.032 0.01CD029L 3.866 0.92 3.489 0.84 3.343 0.79 2.793 0.73 2.481 0.66 2.149 0.52 1.846 0.42 0.866 0.18CD029U 3.864 0.91 3.406 0.82 3.405 0.74 2.891 0.73 2.721 0.70 2.225 0.54 1.921 0.44 0.718 0.17CD030L 3.523 0.93 3.101 0.91 3.208 0.88 2.942 0.82 3.169 0.83 2.750 0.78 2.412 0.66 1.944 0.49CD030U 3.602 0.89 3.142 0.90 3.230 0.85 2.537 0.80 3.206 0.82 2.650 0.74 2.202 0.60 1.917 0.49C031 3.451 0.89 3.270 0.76 2.540 0.68 3.14 0.66 1.570 0.48 1.514 0.38 1.359 0.44 0.627 0.14CD037L 3.450 0.72 3.394 0.67 2.468 0.50 3.218 0.61 1.907 0.32 2.163 0.41 1.415 0.21 0.471 0.05RT038 4.074 0.82 3.416 0.70 3.240 0.51 1.981 0.32 2.587 0.30 1.752 0.22 1.675 0.04 2.243 0.13
α is the absolute value of admittance in nm s−2 h Pa−1 and Corr. is the absolute value of correlation coefficient.
where go(�t, �f), p(�t, �f) is the gravity and pres-sure signals in one of the eight sub-bands�f set bywavelet packet filters, andgc(�t, �f) is the correctedgravity. Time interval�t is selected to be 120 seismi-cally quiet hours before the earthquake because efficientadmittances can only be properly estimated when gravitysignals are free from other non-atmospheric effects. Theadmittanceα(�t,�f) is calculated by minimizing|gc(�t,�f)|2 in a least squares sense. The admittance obtained insuch a way is both time- and frequency-dependent. Thecross-correlations between pressure and gravity in thesebands are calculated to judge to which extent pressurefluctuations interfere with gravity variations.
It can be noted immediately fromTable 1that admit-tances in the long-period normal mode band show sig-nificant frequency variability, varying between largevalues at low frequency and small ones at high fre-quency. For a comparison, we calculate frequency-domain admittances for the station in Strasburg usingthe method proposed byCrossley et al. (1995). The lin-ear regression transfer function in the frequency domainas
Gc(f ) = Go(f ) + α(f )P(f ) (11)
whereGo(f) andP(f) are the discrete Fourier transformof the tide free gravity residual and pressure signals, andα(f) is the fitting factor. Minimizing|Gc(f)|2 over a nar-
row frequency bands in a least squares sense leads to
α(f ) =∑G(f )P(f )∑ |P(f )|2 (12)
whereα(f ) is conjugate of factorα(f), which is equiv-alent to the complex admittance defined byWarburtonand Goodkind (1977)from the cross-spectrum of gravityand pressure signals.α(f) can give estimation of admit-tance and phase difference between the pressure andgravity signals. The admittance estimated in such a wayis frequency-dependent but almost time-independent.
The comparison inTable 2shows that there is onlya marginal difference between the admittances fromwavelet method and the frequency-domain admittancesin high correlation situation. The following reasons canexplain the difference: one main reason is due to theapplication of discrete Fourier transform to gravity andpressure signals. A signal in the frequency domain onlyhas frequency information (i.e. the magnitude of ampli-tude at a given frequency) but no time information infrequency (when the amplitude occurred). Estimation ofadmittances in the frequency domain actually assumesthat all of the gravity amplitude at a frequency is totallyinduced by the pressure amplitude at this frequency, butsometimes the pressure is only partly contributing. Thehanning taper, which is used to reduce frequency leak-age caused by performing Fourier transform for a finite
Table 2C and fre
S 2–0.6 .56–2.08
W 196 32F 282 38PC
omparison of admittances between wavelet method solutions
ub-bands (mHz) 0.26–0.39 0.39–0.52 0.5
avelet methoda solutions 3.966 3.470 3.requency domaina solutions 3.761 3.313 3.hase delayb (◦) 178.1 179.4 173.8orrelation coefficient −0.97 −0.94 −0.93
a The absolute value of admittance is in nm s−2 h Pa−1.b 180◦ implies no delay.
quency domain solutions
5 0.65–0.78 0.78–0.91 0.91–1.04 1.04–1.56 1
2.995 2.651 2.011 1.582 0.02.781 2.483 2.177 1.545 0.5
174.5 172.8 178.9 171.4 91.7−0.88 −0.86 −0.74 −0.56 −0.01

76 X.-G. Hu et al. / Physics of the Earth and Planetary Interiors 154 (2006) 70–84
length discrete signal, also contributes to the difference.There are small phase differences between pressure fluc-tuations and gravity variations (seeTable 2), but thepresent wavelet method, which actually determines theadmittance in the time domain, takes into no accountthe phase difference. This is another reason for the dif-ference. But in trying to precisely reduce the pressureeffects from gravity records in the search for the weakgeodynamic signals from the Earth’s interior, we believeit is appropriate to use the wavelet method advocated inthe present paper. This method can take into account bothtime and frequency information of atmospheric pressureeffects. This is the advantage over frequency-domaincorrection method, which loses most of the time infor-mation.
The results from eight SG records inTable 1showgravity variations highly correlate with atmosphericpressure fluctuations in frequency range 0.26–0.52 mHz.There is very low correlation between the pressure andgravity above 1.5 mHz, because such high frequencycomponents are very weak in the atmospheric pres-sure signals. Hence, gravity variations at frequenciesabove 1.5 mHz have other physical origins, and the grav-ity records in these bands can be contaminated by thepressure correction estimated with a constant admit-tance.Fig. 5 shows that in Strasbourg SG station the120-h atmospheric pressure fluctuations fit gravity vari-ations very well in time domain as well as in frequency
domain in frequency band 0.26–0.39 mHz using theadmittanceα(120, 0.26–0.39) =−3.966 nm s−2 h Pa−1
calculated by Eq.(2).In long-period normal mode band, admittances some-
times conspicuously change on time scales of hours todays with the variations of local atmospheric pressure.To show such a case, we consider pressure effects atStrasbourg SG station by selecting two continuous andseismically quiet days, the first day with appreciable andthe second with small variations in atmospheric pres-sure.Fig. 6shows that in frequency band 0.26–0.39 mHzstrong atmospheric pressure fluctuations lead to a largeadmittance absolute value of 4.150 nm s−2 h Pa−1 anda high correlation coefficient of−0.987 for the firstday, but admittance and correlation coefficients become3.006 nm s−2 h Pa−1 and −0.974, respectively, duringthe second day because of weaker pressure fluctuations.The standard deviation of gravity signal on the firstday is reduced from 0.202 to 0.033 nm s−2 and on thesecond day from 0.163 to 0.037 nm s−2 after pressurecorrection using the time-dependent admittance, demon-strating hence the effectiveness of the wavelet method.
Analysis of gravity and pressure records from otherSG station also verifies that admittances in the long-period normal mode band show significantly time vari-ability, with large admittance value and high correlationin the time period of strong air pressure fluctuations.Zurnand Widmer (1995)found that, in long-period seismic
gravity 9 mHz. Therted prmatra . A Hanningrier tra
Fig. 5. (a) The time domain local atmospheric pressure signal fitssolid curve stands for gravity variations and the dot curve for conveThe time series is 120 seismically quiet hours before the 2004 Sutaper is applied to the time series before computing discrete Fou
signal well at Strasbourg SG station in frequency range 0.26–0.3essure, i.e. pressure multiplied by admittance value of−3.966 nm s−2 h Pa−1.event. (b) The pressure also fits gravity well in frequency domainnsform.

X.-G. Hu et al. / Physics of the Earth and Planetary Interiors 154 (2006) 70–84 77
Fig. 6. Two continuous day time series of gravity and local atmospheric pressure at Strasbourg SG station in frequency band 0.26–0.39. (a) Stronglocal atmospheric pressure fluctuations lead to a large admittance value of−4.150 nm s−2 h Pa−1 for the first day. (b) There is a smaller admittancevalue of−3.006 nm s−2 h Pa−1 for the second day because of the comparatively weak pressure fluctuations.
Fig. 7. Linear amplitude spectra around2Sl for SG C026 (Strasbourg) after the Sumatra event of 26 December 2004. The time window is 5–173 h.A Hanning taper is applied to the time series before computing discrete Fourier transform. (a) Spectrum obtained from the wavelet method withtime and frequency-admittance and (b) from the usual method with admittance of−3 nm s−2 h Pa−1. The pressure (dot curve) fits raw gravity (thincurve) better by using the wavelet method than by the usual method and the spectrum of pressure corrected gravity (bold curve) from the waveletmethod show higher SNR.

78 X.-G. Hu et al. / Physics of the Earth and Planetary Interiors 154 (2006) 70–84
band by using a constant admittance, the noise level in thecorrected record in the case of strong atmospheric pres-sure variations drops to a value lower than that for weakerpressure variations, but they could not give a clear expla-nation. We believe the dependence of the time-variableadmittance with atmospheric pressure variations canexplain this fact.
High correlation in sub-band 0.26–1.04 mHz meanslocal atmospheric pressure fluctuations is the majornoise origin. The admittance value shows time- andfrequency-dependent. When doing atmospheric correc-tion at frequencies below 1 mHz, most of atmosphericnoise can be reduced from gravity signals by using
the nominal admittance−3 nm s−2 h Pa−1. But whensearching for the weak signals, which are almost hiddenby the atmospheric noise in seismic band at frequenciesbelow 1 mHz, we believe it is appropriate to use waveletmethod and time- and frequency-dependent admittancesto reduce pressure effects precisely from gravity records.The observation of the splitting of2S1 is a good example.
4. Observation of splitting of 2S1
2S1 is the second gravest mode and is the first overtoneof 1S1, the commonly called Slichter mode (Slichter,1961), which corresponds to a translation of the inner
Fig. 8. Linear amplitude spectra around2Sl for (a) SG C029-L (Wettzell) and2004. (c) The product spectrum of corrected gravity records from SG sA Hanning taper is applied to the time series before computing discrete
(b) SG C030-U (Bad Homburg) after the Sumatra event of 26 Decembertation Bad Homburg, Strasbourg and Wettzell. The time window is 5–173 h.
Fourier transform.

X.-G. Hu et al. / Physics of the Earth and Planetary Interiors 154 (2006) 70–84 79
core relative to the mantle.2S1 is such a weak signal thathas not been observed untilRosat et al. (2003)revealed itusing the multi-station experiment to stack records fromfive SG stations after the 2001 Peru event with mag-nitude 8.4. The magnitude 9.3 Sumatra event excited aplethora of free oscillations at frequencies below 1 mHzand, because of the extremely large magnitude, we willshow that it is possible to observe the splitting of2S1with a single SG record.
Fig. 7 shows Fourier spectra of 168-h gravityrecords from SG C026 for detecting the three mul-tiplet of 2Sl by using two different methods. Oneis the usual method which removes the tides bysubtracting synthetic local tides and corrects the
local atmospheric pressure effects using a nomi-nal constant admittance of−3 nm s−2 h Pa−1. Anothermethod is the wavelet method which filter sig-nal into sub-band 0.26–0.52 mHz and make pres-sure correction using two admittance values accord-ing to the frequency band;α(0.26–0.39) =−3.9 andα(0.39–0.52) =−3.8 nm s−2 h Pa−1. Comparing solu-tions of two methods inFig. 7, it can be clearly see thatthe wavelet method is able to extract2S0
1 from atmo-spheric noise with better resolution. This is the first timethe three very well resolved splitting singlets of overtone2S1 have been observed with a single gravity record. Arecent similar work byRosat et al. (2005)shows thatthe usual method with admittance of−3 nm s−2 h Pa−1
Fsd
ig. 9. Amplitude spectra of Hanning-tapered records for modes belopectral peaks of the spheroidal modes, which are about 10 times larisplay. The time window is 5–65 h; vertical dashed lines indicate the th
w 1 mHz for six SGs after the Sumatra event of 26 December 2004. Theger than those of the coupled toroidal modes, have been clipped for bettereoretical positions of modes (Masters and Widmer, 1995).

80 X.-G. Hu et al. / Physics of the Earth and Planetary Interiors 154 (2006) 70–84
Table 3Observed frequencies of 2S1 for three methods and predicted values for the Earth Model 1066A
The wavelet methodresults (�Hz)
The usual methodresults (�Hz)
Product spectrumresults (�Hz)
Model 1066Aa
result (�Hz)
2S−11 398.310± 0.051 398.047± 0.052 398.854± 0.048 398.708
2S01 404.605± 0.077 404.770± 0.078 404.331± 0.075 404.690
2S11 410.835± 0.041 410.838± 0.042 410.835± 0.041 410.880
a The split eigenfrequencies of2Sl for 1066A Earth model (Gilbert and Dziewonski, 1975) are determined by using a perturbation method (Dahlenand Sailor, 1979) to the first order in ellipticity and to the second order in rotation.
does not lead to observation of all of three multiplet of2Sl on individual SG spectra. This further confirms thatwavelet method can really achieve additional gains inthe observation of weak normal modes.
We estimate the observed singlet frequencies derivedfrom the two methods by fitting a synthetic resonancefunction (Masters and Gilbert, 1983) to each singlet ofboth spectra. The results are compared inTable 3, inwhich predicted frequencies of2S1 computed for theearth model 1066A (Gilbert and Dziewonski, 1975) arealso included. We can see that the two different pressure
corrections lead to differences in the frequency of2S01
and2S−11 observations, and that the observations from
the wavelet method are closer to the predicted values,despite that the observed frequency of2S−1
1 is still quitesmaller than the predicted value. Two gravity recordsfrom SG CD029L (Wettzell) and CD030U (Bad Hom-burg) also reveal the three well resolved multiplet peaksof 2S1 after pressure correction using wavelet methodand admittances inTable 1(seeFig. 8a and b). Because ofthe non-negligible impact of atmospheric pressure cor-rections on the frequency estimates of the singlet2S0
1 and
3, (c) 0 2004.pective g discrete
Fig. 10. (a) Time evolution of0T2 recorded by SG RT038 and (b)0TFrom left to right, the time window is 5–45, 5–55 and 5–75 h, res
Fourier transform. The bold curve indicates pressure corrected gravityT4 recorded by C026 after the Sumatra event of 26 Decemberly. A Hanning taper is applied to the time series before computin
and dot curve is raw gravity. The thin curve is converted pressure.
X.-G. Hu et al. / Physics of the Earth and Planetary Interiors 154 (2006) 70–84 81
2S−11 , the product spectrum of the three records may pro-
duce more reasonable results. The product spectrum isa simple stacking method since it is the geometric meanof the product of the individual spectrum. In the highSNR situation, the product spectrum would show onlysignals common to all stations, those not present in oneor more records being eliminated, and systematic errorsaffecting individual stations would also be suppressed(Courtier et al., 2000). We can see fromFig. 8c that theproduct spectrum further sharpens up the resolution ofthe multiplet of2S1. The frequencies estimated from theproduct spectrum are also displayed inTable 3.
5. Observation of coupled toroidal modes
The coupling between spheroidal and toroidal modescauses toroidal modes to appear on the vertical gravime-ter records. The Coriolis coupling effects at frequenciesbelow 1.5 mHz generate such weak signals that it canrarely be observed with reasonable SNR. Several of cou-pled toroidal mode,0T5 and1T1 for example are com-pletely overlapped by nearby mulitiplet of spheroidalmodes and are irresolvable, and the coupled mode0T7and0T8 with very lowQ attenuate rapidly thus can hardlybe observed.
FSp
ig. 11. Amplitude spectra of Hanning-tapered records for modes in frumatra event of 26 December 2004. (a) The time window is 2–45 h; (b)ositions of the modes (Masters and Widmer, 1995).
equency band 1–1.5 mHz for SG C026, CD029-L and CD030-U after thethe time window is 2–62 h. The vertical dashed lines indicate the theoretical

82 X.-G. Hu et al. / Physics of the Earth and Planetary Interiors 154 (2006) 70–84
Only a strong earthquake with a source mecha-nism generating large strike-slip fault motion can excitetoroidal coupling effects at frequencies below 1 mHz toobservable amplitudes for the quietest gravimeters. Therecent work byPark et al. (2005)demonstrates that the26 December 2004 Sumatra Earthquake source actuallyconsists of three large fault rupture events, and one ofthem is such a large strike-slip event that it is equivalentto a seismic event with Mw = 8.9, by itself larger thanany earthquake between 1964 Alaska and 2004 Suma-tra. Thus, the large 2004 Sumatra earthquake provides anopportunity for SGs to show these very weak couplingeffects.
After pressure correction, the amplitude spectra of60-h Hanning-tapered SG records for six SG stationsshow very clear peaks near the theoretical position of0T2, 0T3, 0T4 (seeFig. 9). To check the influence of theair pressure correction, we compare spectra of raw grav-ity, corrected gravity and converted pressure around0T2,0T3, 0T4. Fig. 10shows the amplitude evolution of cou-pled toroidal modes0T2 (recorded by RT038) and0T2,0T3 (recorded by SG C026) with time. It can be notedthat local atmospheric pressure fluctuations make verysmall interference for observing frequencies of coupledmodes. Hence, the frequency of these coupled modescan be accurately estimated.
Zurn et al. (2000)reported the first observation ofthe coupled toroidal modes0T2, 0T3 and 0T4 at fre-quencies 374.7± 1.5, 586.5± 2.0 and 765.0± 1.5�Hz,respectively, using data from spring gravimeters and
theakecon-4ntifysyn-3ncies
.
eis-ghlyou-lain
ated, weing aearuro-
pean SG stations, Strasbourg, Wenzell and Bad Homburgreveals small but clear peaks at the frequencies of cou-pled 0T6, 0T8 and0T9; moreover coupled1T2 and1T3is clearly visible (seeFig. 11a).
These modes have been observed and measured inhorizontal components of seismometers (e.g.Tromp andZanzerkia, 1995; Resovsky and Ritzwoller, 1998) but, tothe best of our knowledge there has been no claim fordetection of coupled1T2, 1T3 from gravimeter recordsand vertical components of seismometers until now. Tofurther confirm our observation of coupled1T2, 1T3, weextended the time window to 2–62 h.Fig. 11b shows0T8decay away for its very lowQ but 1T2 and1T3 still areclearly visible.
6. Conclusion
We used a wavelet method to clearly show that thelocal atmospheric pressure fluctuations highly correlatewith gravity at frequencies below 1 mHz in the long-period seismic band, and pressure admittance is not anominal constant value but varying in a range from 2to 4 nm s−2 h Pa−1, large values at low frequencies andat the time when there are strong pressure fluctuations.Wavelet filters can be very helpful to estimate the admit-tances which are time-dependent as well as frequency-dependent. The detection of the three very well resolvedsplitting singlets of mode2S1 using a single SG recordsfully shows the efficiency of pressure correction withwavelet method. The first observation of coupled mode
aremalthatpassve-ng
ingrch istion
y ofova-is
cting–97.
SGs (one is from SG C026 in Strasbourg) afterstrike-slip Mw = 8.2 1998 Balleny Island earthquand correcting the local pressure effects with astant admittance of−3.75 nm s−2 h Pa−1. The large 200Sumatra–Andaman earthquake allows us to idethese coupled modes with much higher SNR. Fittingthetic resonance function (Masters and Gilbert, 198)to the observed spectra, we estimate the frequeof coupled0T2, 0T3 and 0T4 and obtain 378.23± 0.65, 586.34± 0.47 and 765.86± 0.45�Hz, respectivelyNotice that our observations are close to that of Zurnexcept for the frequency of coupled0T2. After carefullyanalysis of the SG C026 records for Balleny Island smic event, we find that local atmospheric pressure hiinterferes with the observation of the frequency of cpled0T2, so the removal of pressure effects may expthe difference.
In order to observe the weak and rapidly attenucoupling mode in the frequency range 1–1.5 mHzperformed a spectral analysis for gravity records usshort time window 2–47 h. Close inspection of the linamplitude spectra of the records from the three E
1T2 and1T3 demonstrates that new generation SGsalso very sensitive for observation of seismic normode in frequency band 1–1.5 mHz. We concludethe use of SG records corrected with wavelet band-filters for pressure effects can contribute to the improment of the SNR of weak signals in the study of loperiod normal mode seismology.
Acknowledgements
We are grateful to the GGP managers for providthe SG datasets of the Sumatra event. This reseafinanced by the National Natural Sciences Foundaof China (grant 40574009) and Chinese AcademScience (CAS) Hundred Talent Program and Inntion Project (No. KZCX3-SW-131) for supporting thresearch.
References
Banka, D., Crossley, D., 1999. Noise levels of supercondugravimeters at seismic frequencies. Geophys. J. Int. 139, 87

X.-G. Hu et al. / Physics of the Earth and Planetary Interiors 154 (2006) 70–84 83
Beauduin, R., Lognonne, P., Montagner, J.P., Cacho, S., Karczewski,J.F., Morand, M., 1996. Atmospheric pressure changes on seismicsignals or how to improve the quality of a station. Bull. Seism. Soc.Am. 86, 1760–1769.
Coifman, R.R., Wickerhauser, M.V., 1992. Entropy-based algorithmsfor best basis selection. IEEE Trans. Inform. Theory 38 (2),713–718.
Courtier, N., Ducarme, B., Goodkind, J., Hinderer, J., Imanishi, Y.,Seama, N., Sun, H., Merriam, J., Bengert, B., Smylie, D., 2000.Global superconducting gravimeter observations and the searchfor the translational modes of the inner core. Phys. Earth PlanetInt. 117, 3–20.
Crossley, D., Hinderer, J., Casula, G., Francis, O., Hsu, H.-T., Imanishi,Y., Jentzsch, G., Kaarianen, J., Merriam, J., Meurers, B., Neumeyer,J., Richter, B., Shibuya, K., Sato, T., van Dam, T., 1999. Networkof superconducting gravimeters benefits a number of disciplines,EOS, 80, 11, 121–126.
Crossley, D., Jensen, O., Hinderer, J., 1995. Effective barometricadmittance and gravity residuals. Phys. Earth Planet Int. 90, 221–241.
Crossley, D., Hinderer, J., Rosat, S., 2002. Using the atmosphere-gravity correlation to derive a time-dependent admittance. Bull.Inf. Mar. Terr. 136, 10809–10820.
Daubechies, I., 1988. Orthonormal bases of compactly supportedwavelet. Commun. Pure Appl. Math. 41, 909–996.
Daubechies, I., 1992. Ten Lectures on Wavelets, Number 61 in CBMS-NSF Series in Applied Mathematics. SIAM, Philadelphia.
Dahlen, F.A., Sailor, R.V., 1979. Rotational and elliptical splitting ofthe free oscillations of the Earth. Geophys. J. R. Astron. Soc. 58,609–623.
Doi, K., Higashi, T., Nakegawa, I., 1991. An effect of atmosphericchanges on the time change of gravity observed by a supercon-ducting gravity meter. J. Geod. Soc. Jpn. 37, 1–12.
Freybourger, M., Hinderer, J., Trampert, J., 1997. Comparative studyof superconducting gravimeters and broadband seismometers STS-
101,
G odeech-er. A
H e firsting adyn.
H nal-ns. J.
K eter–60.
K etricnces.
M elet.
M Thell. 11,
M uen-
M cies,GU
Reference Shelf Online 1,http://www.agu.org/reference/gephys/9 masters.pdf.
Merriam, J., 1992. Atmospheric pressure and gravity. Geophys. J. Int.109, 488–500.
Merriam, J., 1994. The nearly diurnal free wobble resonance ingravity measured at Cantley. Qubec Geophys. J. Int. 119, 369–380.
Meurers, B., 1999. Gravitational effects of atmospheric processes inSG gravity data. Cahier du Centre Europeen de Geodynamique etde Seismologie 17, 57–65.
Mukai, A., Higashi, T., Takemoto, S., Nakagawa, I., Naito, I., 1995.Accurate estimation of atmospheric effects on gravity observationsmade with a superconducting gravity meter at Kyoto. Phys. EarthPlanet Int. 91, 149–159.
Muller, T., Zurn, W., 1983. Observations of gravity changes during thepassage of cold fronts. J. Geophys. 53 (3), 155–162.
Neumeyer, J., 1995. Frequency-dependent atmospheric pressure cor-rection on gravity variations by means of cross spectral analysis.Bull. Inf. Mar. Terr. 122, 9212–9220.
Neumeyer, J., Barthelmes, F., Wolf, D., 1998. Atmospheric pressurecorrection for gravity data using different methods. In: Ducarme,B., Paquet, P. (Eds.), Proc. 13th Int. Symp. Earth Tides. July 1997,Brussels, pp. 431–438.
Peterson, J., 1993. Observation and modeling of seismic backgroundnoise, U.S. Geol. Surv., Open-File Re 1–45, 93–322.
Park, J., Song, T.R., Tromp, J., Okal, E., Stein, S., Roult, G., Clevede,E., Laske, G., Kanamori, H., Davis, P., Berger, J., Braitenberg, C.,Van Camp, M., Lei, X., Sun, H., Xu, H., Rosat, S., 2005. Earth’s freeoscillations excited by the 26 December 2004 Sumatra–Andamanearthquake. Science 308, 1139–1144.
Richter, B., 1983. Three years of registration with the superconductinggravimeter. Bull. Inf. Mar. Terr. 93, 1–9.
Richter, B., Wenzel, H.G., Zurn, W., Klopping, F., 1995. From Chan-dler wobble to free oscillations: comparison of cryogenic gravime-ters and other instruments in a wide period range. Phys. Earth Planet
duct-n ofents.sels,
ismic35,
1 and001(21),
n, H.,ismicusing3304,
aintselow
inner
ured
varia-
1/Z in subseismic frequency bands. Phys. Earth Planet Int.203–217.
ilbert, F., Dziewonski, A., 1975. An application of normal mtheory to the retrieval of structural parameters and source manisms from seismic spectra. Philos. Trans. R. Soc. Lond. S278, 187–269.
inderer, J., Crossley, D., 2004. Scientific achievements from thperiod (1997–2003) of the Global Geodynamics Project usworldwide network of superconducting gravimeters. J. Geo38, 237–262.
u, X.-G., Liu, L.T., Hinderer, J., Sun, H.P., 2005. Wavelet filter aysis of local atmospheric pressure effects on gravity variatioGeod., 79,doi:10.1007/s00190-005-0486-6.
amal, Mansinha, L., 1992. A test of the superconducting gravimas a long-period seismometer. Phys. Earth Planet Int. 71, 52
roner, C., Jentzsch, G., 1999. Comparison of different barompressure reductions for gravity data and resulting consequePhys. Earth. Planet Int. 115, 205–218.
allat, S., 1989a. Multiresolution approximations and wavorthonormal bases of L2(R). Trans. Am. Math. Soc. 315, 69–87
allat, S., 1989b. A theory for multiscale signals decomposition:wavelet representation. IEEE Trans. Pattern Anal. Mach. Inte674–693.
asters, G., Gilbert, F., 1983. Attenuation in the earth at low freqcies. Philos. Trans. R. Soc. Lond. A308, 479–522.
asters, G., Widmer, R., 1995. Free oscillation: Frequenglobal earth physics, A Handbook of Physical Constants, A
Int. 91, 131–148.Richter, B., Warburton, R., 1998. A new generation of supercon
ing gravimeters enables the in-situ detection and eliminatiooffsets and interruptions from continuous gravity measuremIn: Ducarme, B. (Ed.), Proc. 13th Int. Symp. Earth Tides. Bruspp. 545–555.
Rosat, S., Hinderer, J., Crossley, D., 2002. A comparison of the senoise levels at various GGP stations. Bull. Inf. Mar. Terr. 110689–10700.
Rosat, S., Hinderer, J., Rivera, L., 2003. First observation of 2Sstudy of the splitting of the football mode 0S2 after the June 2Peru earthquake of magnitude 8.4. Geophys. Res. Lett. 302111,doi:10.1029/2003GL018304.
Rosat, S., Sato, T., Imanishi, Y., Hinderer, J., Tamura, Y., McQueeQhashi, M., 2005. High-resolution analysis of the gravest senormal modes after the 2004 Mw = 9 Sumatra earthquakesuperconducting gravimeter data. Geophys. Res. Lett. 32, L1doi:10.1029/2005GL018304.
Resovsky, J., Ritzwoller, M., 1998. New and refined constron three-dimensional Earth structure from normal modes b3 mHz. J. Geophys. Res. 103 (1), 783–810.
Slichter, L.B., 1961. The fundamental free mode of the Earth’score. Proc. Natl. Acad. Sci. 47, 186–190.
Smith, M., Barnwell, T., 1986. Exact reconstruction for tree-structsubband coders. IEEE Trans. ASSP 34, 431–441.
Spratt, R.S., 1982. Modeling the effect of atmospheric pressuretions on gravity. Geophys. J. R. Astron. Soc. 71, 173–186.

84 X.-G. Hu et al. / Physics of the Earth and Planetary Interiors 154 (2006) 70–84
Tromp, J., Zanzerkia, E., 1995. Toroidal splitting observations fromthe great 1994 Bolivia and Kuril Islands earthquakes. Geophys.Res. Lett. 22, 2297–2300.
Virtanen, H., 1996. Observation of free oscillation of the earth by super-conducting gravimeter GWR T-020. Acta Geod. Geophys. Hung.31, 423–431.
Van Camp, M., 1999. Measuring seismic normal modes with the GWRC021 superconducting gravimeter. Phys. Earth Planet Int. 116,81–92.
Warburton, R.J., Goodkind, J.M., 1977. The influence of atmosphericpressure variations on gravity. Geophys. J. R. Astron. Soc. 48,281–292.
Warburton, R.J., Brinton, E.W., 1995. Recent Developments inGWR Instrument’s superconducting Gravimeters, in workshopproceedings, Non-tidal gravity changes, Proc. of Second Work-shop: Non-tidal gravity changes. Cahiers du Centre Europeen deGeodynamique et de Seismologie 11, 23–56.
Widmer, R., 2003. What can superconducting gravimeters contribute tonormal mode seismology? Bull. Seism. Soc. Am. 93, 1370–1380.
Zurn, W., Widmer, R., 1995. On noise reduction in vertical seismicrecords below 2 mHz using local barometric pressure. Geophys.Res. Lett. 22, 3537–3540.
Zurn, W., Laske, G., Widmer, R., Gilbert, F., 2000. Observation of Cori-olis coupled modes below 1 mHz. Geophys. J. Int. 143, 113–118.