water turbidity detection system design and its data
TRANSCRIPT

Water Turbidity Detection System Design and Its Data Processing Zhennan Zhang1, a, Weimin Chen 1, b
1College of Mechanical and Electrical Engineering, China Jiliang University, Hangzhou, 310018, China
aemail: [email protected], bemail: [email protected]
Keywords: sensor structure analysis; circuit design; Chebyshev Filter
Abstract. According to deviation of measurement when most of flowing turbidimeters are used to detect low turbidity water, a new usage of sensor structure is proposed through theoretical analysis and guidance. To meet the needs of the new usage, the constant current source circuit we designed shows its advantage. Considering light intensity changes slightly in low turbidity water, 0-calibration circuit is added to the system to increase the distinctiveness. Chebyshev digital filter is used to filter the noise of sample, so that precision of turbidimeter in low turbidity water is guaranteed. Experiments prove that circuits we designed and Chebyshev digital filter show excellent steady-state characters and a quick response, so a new solution of how to detect low turbidity water is provided.
Introduction It have been proved that organism and parasite are closely related with water turbidity [1].
Therefor it is reasonable to analyze degree of water contamination by water turbidity. In the recent years, theoretic methods of water turbidity detection grow to be mature, including
turbidity detection system based on image recognition [2], water turbidity detection by fuzzy neural network [3]. Under the condition of flowing turbidimeter, majority of them realize precision of 1%FS, resolution ratio of 0.01%, repeatability of 1%. However when it needs to detect low turbidity water, relative error of turbidimeters increase a lot compared to high turbidity, leading to other indexes getting to be unreliable.
Considering transmission method has better linearity than scatter method, two groups of LEDs and probes are used to collect transmission light. Finally Chebyshev digital filter is applied to guarantee precision for better performance in low turbidity condition.
Structure of sensor Majority of methods for turbidity detection are transmission method and scatter method.
Transmission method, with a large range of measurement scale, presents a favorable linearity between turbidity and light intensity. Scatter method shows better repeatability of result and resistance for size of solutes [4]. Because linearity is easily to identify and evaluate the accuracy of transmission light when it comes to calibration process, transmission method is put into use. The structure includes two probes and two infrared LEDs, as shown in Figure. 1. Both of probes receive the transmission light straightly from the opposite LEDs. When LED1 is on, LED2 is off and probeⅡworks. While LED2 is on, LED1 is off and probeⅠworks.
2nd International Conference on Advances in Mechanical Engineering and Industrial Informatics (AMEII 2016)
© 2016. The authors - Published by Atlantis Press 980

Figure.1. Structure of turbidimeter
Circuit design A constant current source is designed to keep LED light intensity stable, as shown in Figure. 2. When VCC is connected to power source, operational amplifier A1 switches to saturated state
from cut-off state immediately, generating high level output voltage. This voltage makes effect on base electrode of triode so that electric potential of emitter equals to collector. Electric potential of M node will be held at VCC, Vp will be obtained in equation (1).
VP = Vcc ∗ R3/(R3 + R4). (1)
Figure. 2. Constant current source circuit Value of voltage in in-phase input end equals to voltage in anti-phase input end for operational
amplifier A1, therefor voltage VQ is deduced in equation (2).
VQ = VP = Vcc ∗ R3/(R3 + R4). (2) Then at N node, we have equation (3).
(VN − VQ)/R6 = (VQ − Vref)/R2. (3) VQ is substituted to equation (3) and VN is solved by equation (4).
VN = (R2+R6R2
)( R6R3+R4
)VQ − (R6R2
)Vref. (4) When R2=R4=R6=R3,VN = Vcc − Vref, VMN equals to
VMN = VM − VN = Vref. (5) Because the electric potential of M, N, P and Q keep stable, current flowing through resistor R7
and R6 also keeps stable. According to Kirchhoff’s theorem, current flowing through R8 would not change. When gate of MOSFET Q1 receives high level voltage, the current coming from R8 flows from LED to GND, otherwise it will flows through resistor R9 to GND.
Hypothetically transmission light should have been the maximum when turbidity is lowest. But causing the light intensity change obscurely when turbidity changes in low turbidity, 0-calibration circuit is introduced so that constant composition is subtracted and feeble variation is amplified. Circuit is shown in Figure. 3.
981
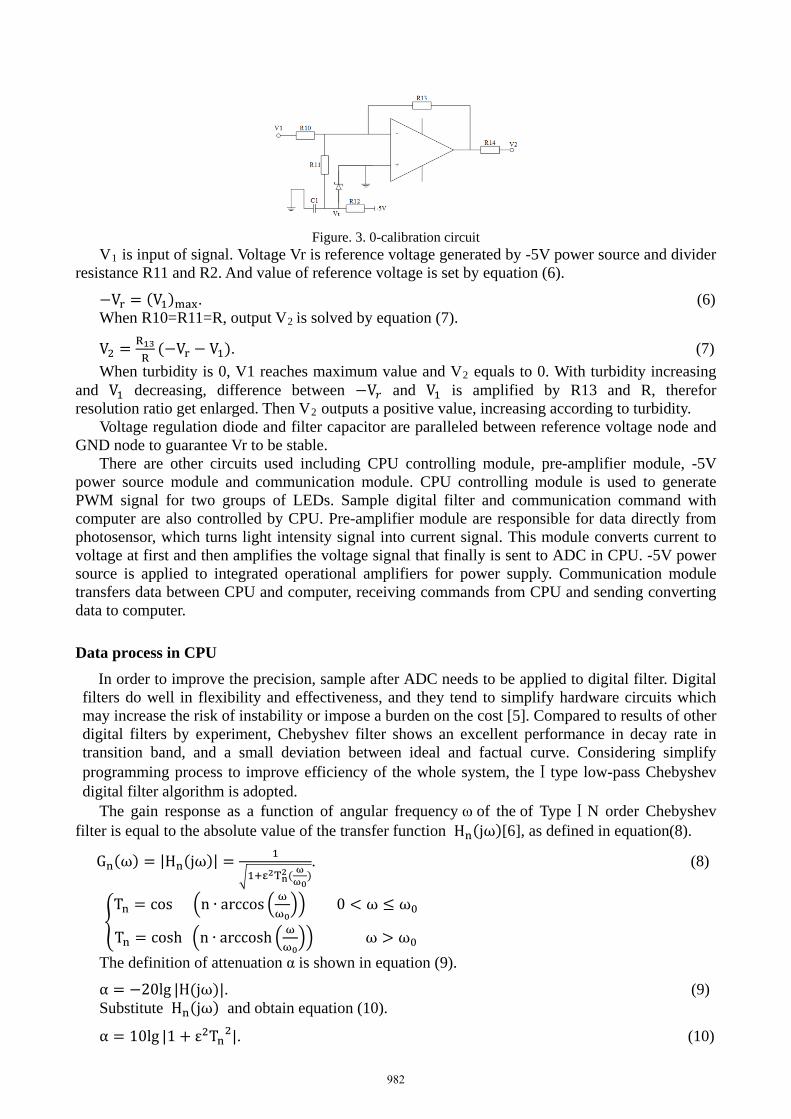
Figure. 3. 0-calibration circuit V1 is input of signal. Voltage Vr is reference voltage generated by -5V power source and divider
resistance R11 and R2. And value of reference voltage is set by equation (6).
−Vr = (V1)max. (6) When R10=R11=R, output V2 is solved by equation (7).
V2 = R13R
(−Vr − V1). (7) When turbidity is 0, V1 reaches maximum value and V2 equals to 0. With turbidity increasing
and V1 decreasing, difference between −V𝑟𝑟 and V1 is amplified by R13 and R, therefor resolution ratio get enlarged. Then V2 outputs a positive value, increasing according to turbidity.
Voltage regulation diode and filter capacitor are paralleled between reference voltage node and GND node to guarantee Vr to be stable.
There are other circuits used including CPU controlling module, pre-amplifier module, -5V power source module and communication module. CPU controlling module is used to generate PWM signal for two groups of LEDs. Sample digital filter and communication command with computer are also controlled by CPU. Pre-amplifier module are responsible for data directly from photosensor, which turns light intensity signal into current signal. This module converts current to voltage at first and then amplifies the voltage signal that finally is sent to ADC in CPU. -5V power source is applied to integrated operational amplifiers for power supply. Communication module transfers data between CPU and computer, receiving commands from CPU and sending converting data to computer.
Data process in CPU In order to improve the precision, sample after ADC needs to be applied to digital filter. Digital
filters do well in flexibility and effectiveness, and they tend to simplify hardware circuits which may increase the risk of instability or impose a burden on the cost [5]. Compared to results of other digital filters by experiment, Chebyshev filter shows an excellent performance in decay rate in transition band, and a small deviation between ideal and factual curve. Considering simplify programming process to improve efficiency of the whole system, theⅠtype low-pass Chebyshev digital filter algorithm is adopted.
The gain response as a function of angular frequency ω of the of TypeⅠN order Chebyshev filter is equal to the absolute value of the transfer function Ηn(jω)[6], as defined in equation(8).
Gn(ω) = |Ηn(jω)| = 1
�1+ε2Tn2( ωω0). (8)
�Tn = cos �n ∙ arccos � ω
ω0�� 0 < ω ≤ ω0
Τn = cosh �n ∙ arccosh � ωω0�� ω > ω0
The definition of attenuation α is shown in equation (9).
α = −20lg |H(jω)|. (9) Substitute Ηn(jω) and obtain equation (10).
α = 10lg |1 + ε2Tn2|. (10)
982

When Tn2 = 1, attenuation α in the passband reach the maximum αmax. ε could be obtained by equation (11).
ε = √100.1αmax − 1. (11) Attenuation α in stopband reaches αmin when ω=ωs (ωs>ω0).
αmin = 10lg|1 + ε2cosh 2(n ∙ arccosh (ωs/ω0))|. (12) The step n is solved by equation (12), as defined by equation (13).
n = arccosh�100.1αmin−1100.1αmax−1
/ arccosh �ωsω0�. (13)
The differential equation description of filter for discrete system is
y[n] = a0x[n] + a1x[n − 1] + ⋯⋯+ anx[0] − b1y[n − 1] − b2y[n − 2]⋯⋯− bny[0]. Based on step n, cut-off angular frequency ωp in passband, and attenuation αmax in passband,
factors for discrete equation also could be determined. Distilled water is used to testify the effects of Chebyshev Filter. Figure. 4 and Figure. 5 show
the results.
Figure. 4. Gradual process for 0 turbidity measurement Because ADC is sampling voltage, sampling data stored as hexadecimal type in CPU is
converted to voltage form. Abscissa stands for time, whose unit is second. Voltage outputs 0.58V when turbidity is 0, because background light is plus to the sampling process. Figure. 4 shows the voltage gradual process from initial state to final state. The upper curve is A/D sample before filter, and the lower curve is sample after filter. When t=30, sample reaches stable state. Figure. 5 shows the enlarged view of stable state. Noise decreases from 20mv to less than 10mv after passing through Chebyshev filter. Even in low turbidity measurement, precision is still guaranteed.
Figure. 5. Enlarged view of stable state for 0 turbidity measurement
Result for experiment Groups of formazine solution are adopted to calibrate water turbidity detection system
according to international standard. Result for 0NTU turbidity water is shown in Figure. 5. Stable states for groups of 20NTU,
60NTU, 100NTU are shown from Figure. 6 to Figure. 8.
Figure. 6. Stable state of 20NTU formazine solution.
983

Figure. 7. Stable state of 60NTU formazine solution.
Figure. 8. Stable state of 80NTU formazine solution.
Conclusion According to the experiment result, excellent linearity, steady-state characters and a quick
response of this detection system are proved. Structure of sensor and constant circuit protect light intensity from deviation. 0-calibrating circuit increases resolution ratio. Finally Chebyshev digital filter effectively helps decrease the noise, keeping turbidimeter staying high precision in low turbidity condition. This water turbidity detection system manages to remedy the deficiency of existing water turbidimeters in low turbidity water without complicating the circuits, proposing a new design for detection.
Acknowledgements In this paper, the work was sponsored by the Zhejiang Key discipline of Instrument Science &
Technology Open Foundation.
Reference [1] Shunling Yue. Problem for water turbidity. China water & Water water [J], 1995 (11):33-35. [2] Ang Li. Design and Implement of Turbidity Detection System Based On Image Recognition (D), Harbin: Harbin Institute of Technology, 2012. [3] Shoubing Xiang, Guangwei Luo, Zhi Zhu.Application of Fuzzy Neural Network in the Turbidity Detection for Water [J].Process Automation Instrumentation,2011 (32):53-56. [4] Kai Zhang, Yugur Zhang, Ggaofang Yin, etc. Measurement of Water Turbidity Combined with Scattering and Transmission Method [J].Journal of Atmospheric and Environment Optics, 2011, 3 (6):100-105. [5] Hu cheng, Qiming Zhang, Xuefeng Sun. Development of Turbidity Meter Based on Dual Frequency Multiple Beams [J]. Information Research, 2014, 2(40):23-26. [6] M.E. Van Valkenburg. Analog Filter Design [M]. New York, CBS College Publishing.1982:227-232
984