water treatment plants annual and life-cycle costs … of tables (cont’d) table r-16 lake...
TRANSCRIPT
APPENDIX R COST ESTIMATES
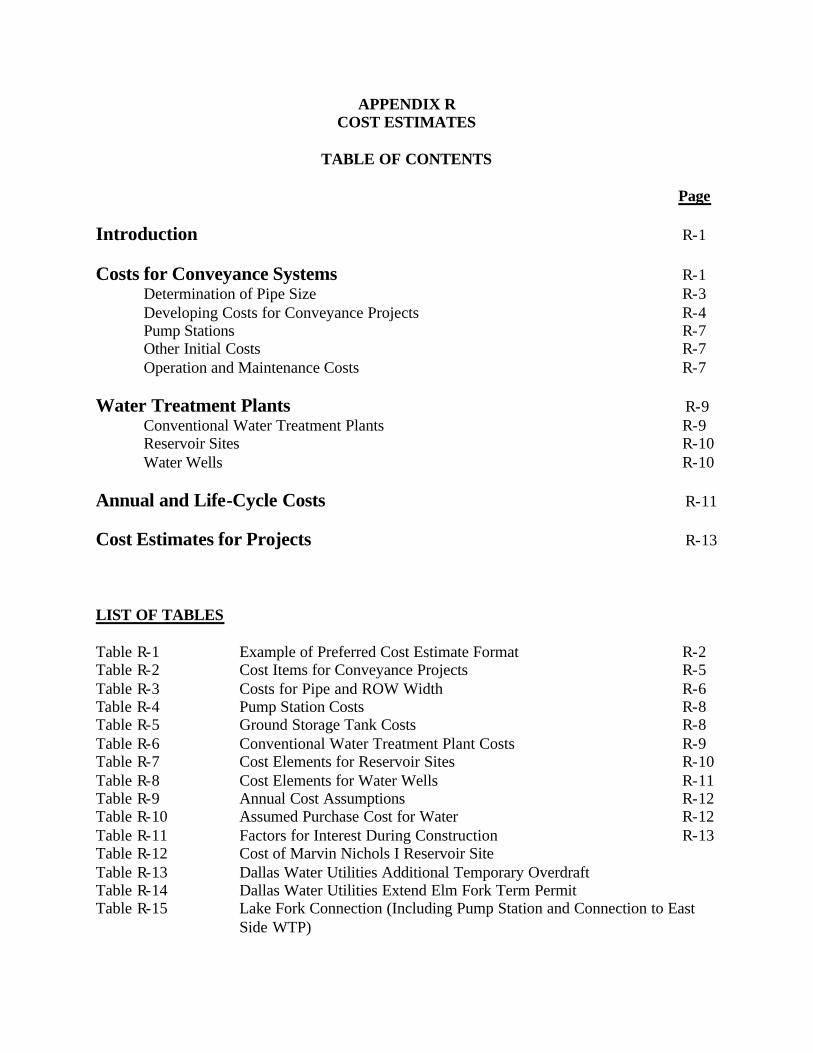
TABLE OF CONTENTS
Page
Introduction R-1 Costs for Conveyance Systems R-1
Determination of Pipe Size R-3 Developing Costs for Conveyance Projects R-4 Pump Stations R-7 Other Initial Costs R-7 Operation and Maintenance Costs R-7
Water Treatment Plants R-9 Conventional Water Treatment Plants R-9 Reservoir Sites R-10 Water Wells R-10 Annual and Life-Cycle Costs R-11 Cost Estimates for Projects R-13 LIST OF TABLES Table R-1 Example of Preferred Cost Estimate Format R-2 Table R-2 Cost Items for Conveyance Projects R-5 Table R-3 Costs for Pipe and ROW Width R-6 Table R-4 Pump Station Costs R-8 Table R-5 Ground Storage Tank Costs R-8 Table R-6 Conventional Water Treatment Plant Costs R-9 Table R-7 Cost Elements for Reservoir Sites R-10 Table R-8 Cost Elements for Water Wells R-11 Table R-9 Annual Cost Assumptions R-12 Table R-10 Assumed Purchase Cost for Water R-12 Table R-11 Factors for Interest During Construction R-13 Table R-12 Cost of Marvin Nichols I Reservoir Site Table R-13 Dallas Water Utilities Additional Temporary Overdraft Table R-14 Dallas Water Utilities Extend Elm Fork Term Permit Table R-15 Lake Fork Connection (Including Pump Station and Connection to East
Side WTP)
List of Tables (cont’d) Table R-16 Lake Palestine Connection (Including Pump Station and Connection to
Southeast WTP) Table R-17 Dallas Water Utilities Reuse Table R-18 Dallas Water Utilities Return Flows Above Lakes Table R-19 Dallas Water Utilities Additional Reuse (After 2030) Table R-20 Expand DWU Water Treatment Plants in Year 2010 Table R-21 Expand DWU Water Treatment Plants in Year 2020 Table R-22 Expand DWU Water Treatment Plants in Year 2030 Table R-23 Expand DWU Water Treatment Plants in Year 2040 Table R-24 Tarrant Regional Water District Cedar Creek, Richland-Chambers
Expansion (Phase I) Table R-25 Tarrant Regional Water District Cedar Creek, Richland-Chambers
Expansion (Phase II) Table R-26 Tarrant Regional Water District Reuse, Trinity River Diversion to
Richland-Chambers Reservoir Table R-27 Tarrant Regional Water District Reuse, Trinity River Diversion to Cedar
Creek Reservoir Table R-28 Tarrant Regional Water District Lake Texoma Table R-29 Tarrant Regional Water District West Fork Connection Table R-30 TRWD Oklahoma Water from Hugo to Eagle Mountain Table R-31 Tarrant Regional Water District Lake Tehuacana Table R-32 Tarrant Regional Water District Freestone County Groundwater Well
Field Table R-33 Expand Fort Worth Water Treatment Plants in Year 2000 Table R-34 Expand Fort Worth Water Treatment Plants in Year 2010 Table R-35 Expand Fort Worth Water Treatment Plants in Year 2030 Table R-36 Expand Fort Worth Water Treatment Plants in Year 2050 Table R-37 Fort Worth Reuse for Tarrant County Steam Electric Table R-38 Trinity River Authority - Tarrant County Customers WTP Expansion for
2010 Table R-39 Trinity River Authority - Tarrant County Customers WTP Expansion for
2030 Table R-40 Trinity River Authority - Tarrant County Customers WTP Expansion for
2040 Table R-41 Trinity River Authority Las Colinas Reuse (Dallas County Other) Table R-42 Trinity River Authority Joe Pool Reuse (Phase I) Table R-43 Trinity River Authority Joe Pool Reuse (Phase II) Table R-44 Trinity River Authority Mountain Creek Reuse Table R-45 Trinity River Authority’s Ellis County Reuse for Steam Electric Power Table R-46 Trinity River Authority Denton Creek Plant Reuse Table R-47 Trinity River Authority - Lake Grapevine Reuse (Phase I) Table R-48 Trinity River Authority - Lake Grapevine Reuse (Phase II) Table R-49 North Texas Municipal Water District Additional Reuse
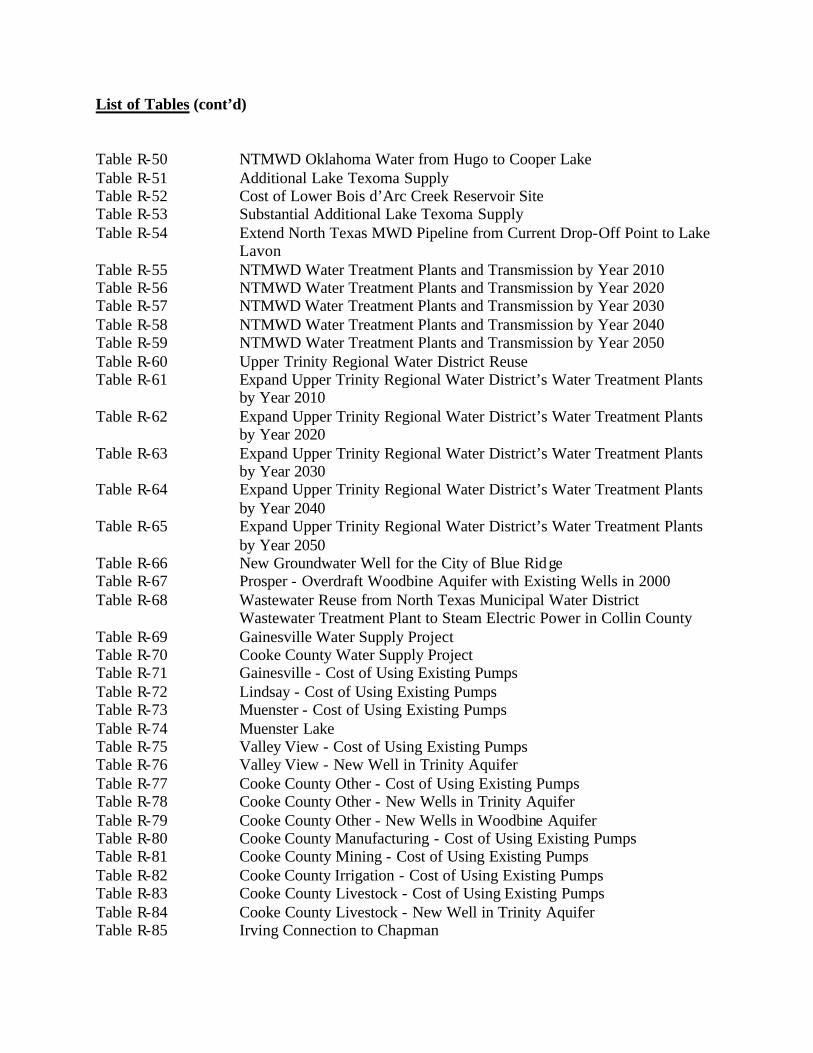
List of Tables (cont’d) Table R-50 NTMWD Oklahoma Water from Hugo to Cooper Lake Table R-51 Additional Lake Texoma Supply Table R-52 Cost of Lower Bois d’Arc Creek Reservoir Site Table R-53 Substantial Additional Lake Texoma Supply Table R-54 Extend North Texas MWD Pipeline from Current Drop-Off Point to Lake
Lavon Table R-55 NTMWD Water Treatment Plants and Transmission by Year 2010 Table R-56 NTMWD Water Treatment Plants and Transmission by Year 2020 Table R-57 NTMWD Water Treatment Plants and Transmission by Year 2030 Table R-58 NTMWD Water Treatment Plants and Transmission by Year 2040 Table R-59 NTMWD Water Treatment Plants and Transmission by Year 2050 Table R-60 Upper Trinity Regional Water District Reuse Table R-61 Expand Upper Trinity Regional Water District’s Water Treatment Plants
by Year 2010 Table R-62 Expand Upper Trinity Regional Water District’s Water Treatment Plants
by Year 2020 Table R-63 Expand Upper Trinity Regional Water District’s Water Treatment Plants
by Year 2030 Table R-64 Expand Upper Trinity Regional Water District’s Water Treatment Plants
by Year 2040 Table R-65 Expand Upper Trinity Regional Water District’s Water Treatment Plants
by Year 2050 Table R-66 New Groundwater Well for the City of Blue Ridge Table R-67 Prosper - Overdraft Woodbine Aquifer with Existing Wells in 2000 Table R-68 Wastewater Reuse from North Texas Municipal Water District
Wastewater Treatment Plant to Steam Electric Power in Collin County Table R-69 Gainesville Water Supply Project Table R-70 Cooke County Water Supply Project Table R-71 Gainesville - Cost of Using Existing Pumps Table R-72 Lindsay - Cost of Using Existing Pumps Table R-73 Muenster - Cost of Using Existing Pumps Table R-74 Muenster Lake Table R-75 Valley View - Cost of Using Existing Pumps Table R-76 Valley View - New Well in Trinity Aquifer Table R-77 Cooke County Other - Cost of Using Existing Pumps Table R-78 Cooke County Other - New Wells in Trinity Aquifer Table R-79 Cooke County Other - New Wells in Woodbine Aquifer Table R-80 Cooke County Manufacturing - Cost of Using Existing Pumps Table R-81 Cooke County Mining - Cost of Using Existing Pumps Table R-82 Cooke County Irrigation - Cost of Using Existing Pumps Table R-83 Cooke County Livestock - Cost of Using Existing Pumps Table R-84 Cooke County Livestock - New Well in Trinity Aquifer Table R-85 Irving Connection to Chapman
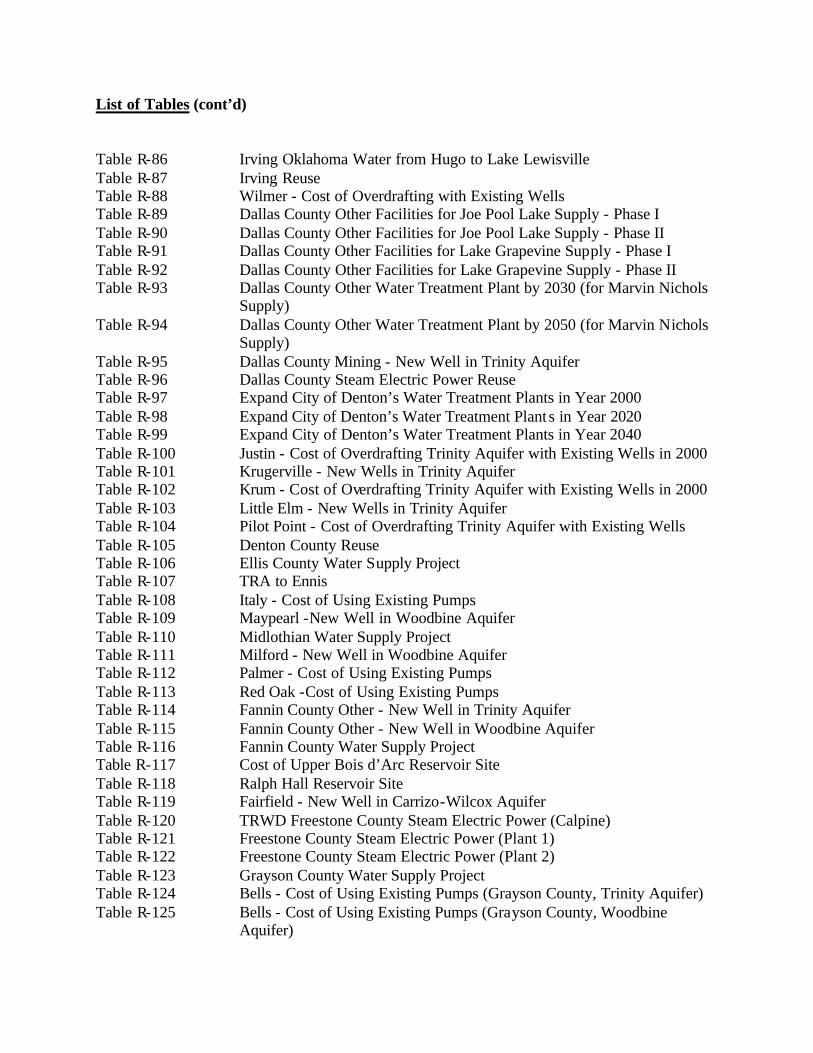
List of Tables (cont’d) Table R-86 Irving Oklahoma Water from Hugo to Lake Lewisville Table R-87 Irving Reuse Table R-88 Wilmer - Cost of Overdrafting with Existing Wells Table R-89 Dallas County Other Facilities for Joe Pool Lake Supply - Phase I Table R-90 Dallas County Other Facilities for Joe Pool Lake Supply - Phase II Table R-91 Dallas County Other Facilities for Lake Grapevine Supply - Phase I Table R-92 Dallas County Other Facilities for Lake Grapevine Supply - Phase II Table R-93 Dallas County Other Water Treatment Plant by 2030 (for Marvin Nichols
Supply) Table R-94 Dallas County Other Water Treatment Plant by 2050 (for Marvin Nichols
Supply) Table R-95 Dallas County Mining - New Well in Trinity Aquifer Table R-96 Dallas County Steam Electric Power Reuse Table R-97 Expand City of Denton’s Water Treatment Plants in Year 2000 Table R-98 Expand City of Denton’s Water Treatment Plant s in Year 2020 Table R-99 Expand City of Denton’s Water Treatment Plants in Year 2040 Table R-100 Justin - Cost of Overdrafting Trinity Aquifer with Existing Wells in 2000 Table R-101 Krugerville - New Wells in Trinity Aquifer Table R-102 Krum - Cost of Overdrafting Trinity Aquifer with Existing Wells in 2000 Table R-103 Little Elm - New Wells in Trinity Aquifer Table R-104 Pilot Point - Cost of Overdrafting Trinity Aquifer with Existing Wells Table R-105 Denton County Reuse Table R-106 Ellis County Water Supply Project Table R-107 TRA to Ennis Table R-108 Italy - Cost of Using Existing Pumps Table R-109 Maypearl -New Well in Woodbine Aquifer Table R-110 Midlothian Water Supply Project Table R-111 Milford - New Well in Woodbine Aquifer Table R-112 Palmer - Cost of Using Existing Pumps Table R-113 Red Oak -Cost of Using Existing Pumps Table R-114 Fannin County Other - New Well in Trinity Aquifer Table R-115 Fannin County Other - New Well in Woodbine Aquifer Table R-116 Fannin County Water Supply Project Table R-117 Cost of Upper Bois d’Arc Reservoir Site Table R-118 Ralph Hall Reservoir Site Table R-119 Fairfield - New Well in Carrizo-Wilcox Aquifer Table R-120 TRWD Freestone County Steam Electric Power (Calpine) Table R-121 Freestone County Steam Electric Power (Plant 1) Table R-122 Freestone County Steam Electric Power (Plant 2) Table R-123 Grayson County Water Supply Project Table R-124 Bells - Cost of Using Existing Pumps (Grayson County, Trinity Aquifer) Table R-125 Bells - Cost of Using Existing Pumps (Grayson County, Woodbine
Aquifer)
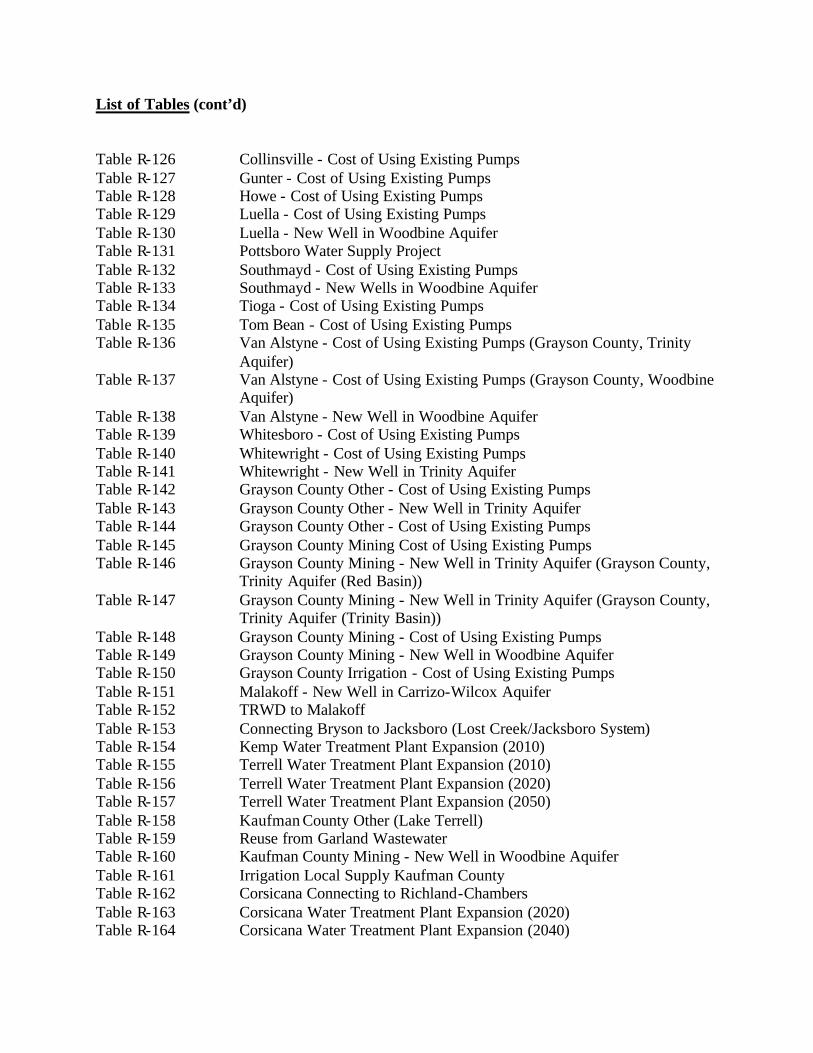
List of Tables (cont’d) Table R-126 Collinsville - Cost of Using Existing Pumps Table R-127 Gunter - Cost of Using Existing Pumps Table R-128 Howe - Cost of Using Existing Pumps Table R-129 Luella - Cost of Using Existing Pumps Table R-130 Luella - New Well in Woodbine Aquifer Table R-131 Pottsboro Water Supply Project Table R-132 Southmayd - Cost of Using Existing Pumps Table R-133 Southmayd - New Wells in Woodbine Aquifer Table R-134 Tioga - Cost of Using Existing Pumps Table R-135 Tom Bean - Cost of Using Existing Pumps Table R-136 Van Alstyne - Cost of Using Existing Pumps (Grayson County, Trinity
Aquifer) Table R-137 Van Alstyne - Cost of Using Existing Pumps (Grayson County, Woodbine
Aquifer) Table R-138 Van Alstyne - New Well in Woodbine Aquifer Table R-139 Whitesboro - Cost of Using Existing Pumps Table R-140 Whitewright - Cost of Using Existing Pumps Table R-141 Whitewright - New Well in Trinity Aquifer Table R-142 Grayson County Other - Cost of Using Existing Pumps Table R-143 Grayson County Other - New Well in Trinity Aquifer Table R-144 Grayson County Other - Cost of Using Existing Pumps Table R-145 Grayson County Mining Cost of Using Existing Pumps Table R-146 Grayson County Mining - New Well in Trinity Aquifer (Grayson County,
Trinity Aquifer (Red Basin)) Table R-147 Grayson County Mining - New Well in Trinity Aquifer (Grayson County,
Trinity Aquifer (Trinity Basin)) Table R-148 Grayson County Mining - Cost of Using Existing Pumps Table R-149 Grayson County Mining - New Well in Woodbine Aquifer Table R-150 Grayson County Irrigation - Cost of Using Existing Pumps Table R-151 Malakoff - New Well in Carrizo-Wilcox Aquifer Table R-152 TRWD to Malakoff Table R-153 Connecting Bryson to Jacksboro (Lost Creek/Jacksboro System) Table R-154 Kemp Water Treatment Plant Expansion (2010) Table R-155 Terrell Water Treatment Plant Expansion (2010) Table R-156 Terrell Water Treatment Plant Expansion (2020) Table R-157 Terrell Water Treatment Plant Expansion (2050) Table R-158 Kaufman County Other (Lake Terrell) Table R-159 Reuse from Garland Wastewater Table R-160 Kaufman County Mining - New Well in Woodbine Aquifer Table R-161 Irrigation Local Supply Kaufman County Table R-162 Corsicana Connecting to Richland-Chambers Table R-163 Corsicana Water Treatment Plant Expansion (2020) Table R-164 Corsicana Water Treatment Plant Expansion (2040)
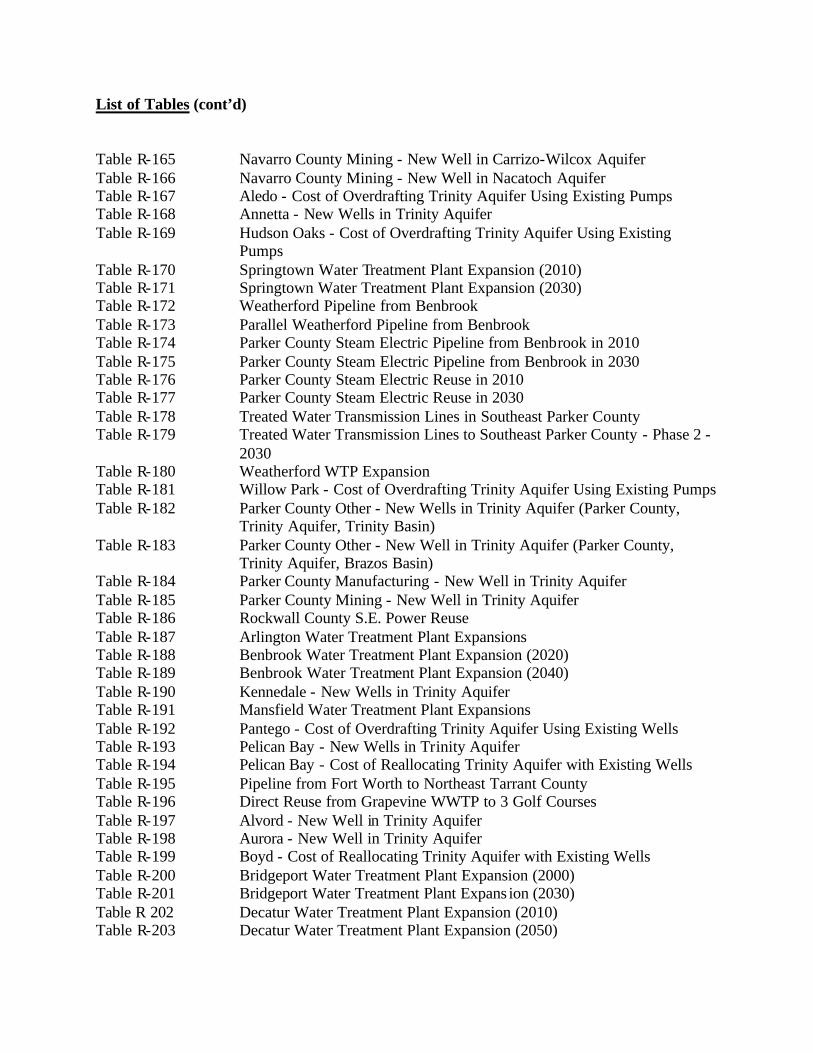
List of Tables (cont’d) Table R-165 Navarro County Mining - New Well in Carrizo-Wilcox Aquifer Table R-166 Navarro County Mining - New Well in Nacatoch Aquifer Table R-167 Aledo - Cost of Overdrafting Trinity Aquifer Using Existing Pumps Table R-168 Annetta - New Wells in Trinity Aquifer Table R-169 Hudson Oaks - Cost of Overdrafting Trinity Aquifer Using Existing
Pumps Table R-170 Springtown Water Treatment Plant Expansion (2010) Table R-171 Springtown Water Treatment Plant Expansion (2030) Table R-172 Weatherford Pipeline from Benbrook Table R-173 Parallel Weatherford Pipeline from Benbrook Table R-174 Parker County Steam Electric Pipeline from Benbrook in 2010 Table R-175 Parker County Steam Electric Pipeline from Benbrook in 2030 Table R-176 Parker County Steam Electric Reuse in 2010 Table R-177 Parker County Steam Electric Reuse in 2030 Table R-178 Treated Water Transmission Lines in Southeast Parker County Table R-179 Treated Water Transmission Lines to Southeast Parker County - Phase 2 -
2030 Table R-180 Weatherford WTP Expansion Table R-181 Willow Park - Cost of Overdrafting Trinity Aquifer Using Existing Pumps Table R-182 Parker County Other - New Wells in Trinity Aquifer (Parker County,
Trinity Aquifer, Trinity Basin) Table R-183 Parker County Other - New Well in Trinity Aquifer (Parker County,
Trinity Aquifer, Brazos Basin) Table R-184 Parker County Manufacturing - New Well in Trinity Aquifer Table R-185 Parker County Mining - New Well in Trinity Aquifer Table R-186 Rockwall County S.E. Power Reuse Table R-187 Arlington Water Treatment Plant Expansions Table R-188 Benbrook Water Treatment Plant Expansion (2020) Table R-189 Benbrook Water Treatment Plant Expansion (2040) Table R-190 Kennedale - New Wells in Trinity Aquifer Table R-191 Mansfield Water Treatment Plant Expansions Table R-192 Pantego - Cost of Overdrafting Trinity Aquifer Using Existing Wells Table R-193 Pelican Bay - New Wells in Trinity Aquifer Table R-194 Pelican Bay - Cost of Reallocating Trinity Aquifer with Existing Wells Table R-195 Pipeline from Fort Worth to Northeast Tarrant County Table R-196 Direct Reuse from Grapevine WWTP to 3 Golf Courses Table R-197 Alvord - New Well in Trinity Aquifer Table R-198 Aurora - New Well in Trinity Aquifer Table R-199 Boyd - Cost of Reallocating Trinity Aquifer with Existing Wells Table R-200 Bridgeport Water Treatment Plant Expansion (2000) Table R-201 Bridgeport Water Treatment Plant Expans ion (2030) Table R 202 Decatur Water Treatment Plant Expansion (2010) Table R-203 Decatur Water Treatment Plant Expansion (2050)
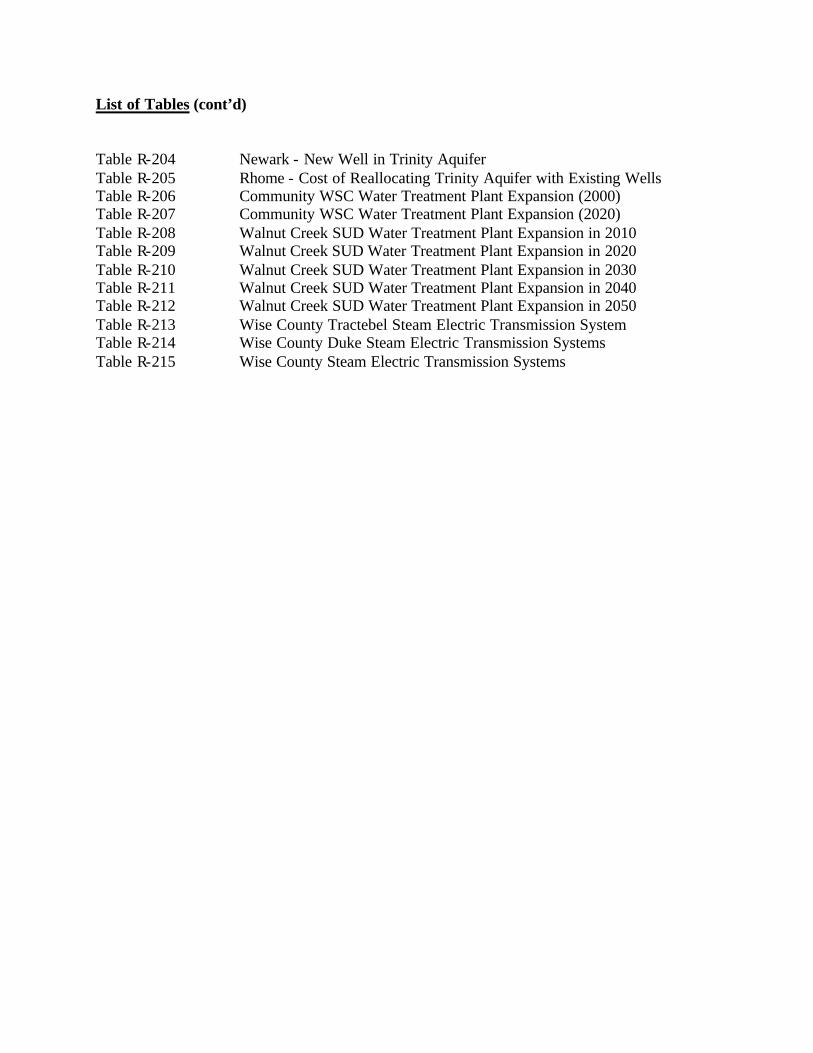
List of Tables (cont’d) Table R-204 Newark - New Well in Trinity Aquifer Table R-205 Rhome - Cost of Reallocating Trinity Aquifer with Existing Wells Table R-206 Community WSC Water Treatment Plant Expansion (2000) Table R-207 Community WSC Water Treatment Plant Expansion (2020) Table R-208 Walnut Creek SUD Water Treatment Plant Expansion in 2010 Table R-209 Walnut Creek SUD Water Treatment Plant Expansion in 2020 Table R-210 Walnut Creek SUD Water Treatment Plant Expansion in 2030 Table R-211 Walnut Creek SUD Water Treatment Plant Expansion in 2040 Table R-212 Walnut Creek SUD Water Treatment Plant Expansion in 2050 Table R-213 Wise County Tractebel Steam Electric Transmission System Table R-214 Wise County Duke Steam Electric Transmission Systems Table R-215 Wise County Steam Electric Transmission Systems
APPENDIX R
COST ESTIMATES
R-1
APPENDIX R COST ESTIMATES
Introduction
The evaluation of water management strategies requires the development of cost
estimates. The strategy evaluations contained in this regional plan represent preliminary
overviews and should not be considered as detailed feasibility analyses. Due to the
forward looking nature of these types of planning efforts, the cost estimates in this plan
do not necessarily represent what actual costs may be to design, build, or operate water
supply systems. Project specific analyses should be developed at the time a project is
undertaken to establish a more accurate estimate.
Costs for pipelines, pump stations and water treatment facilities are based on standard
unit costs that include contractors’ mobilization, overhead and profit. The unit costs do
not include engineering, contingency, financial and legal services, costs for land and
rights-of-way, permits, environmental and archeological studies, or mitigation, all of
which are added separately. Previous cost estimates were used when available.
The cost estimates include two components:
• Initial capital costs, including engineering and construction costs, and
• Average annual costs, including annual operation and maintenance costs, water purchase costs, and debt service.
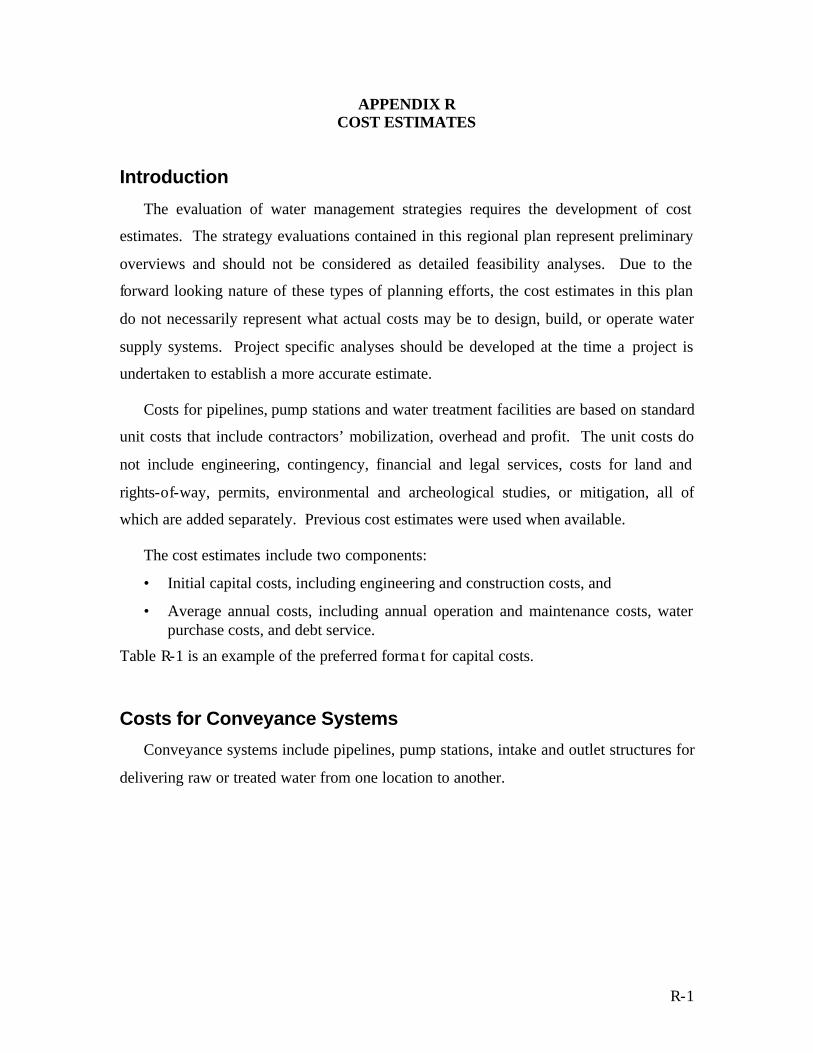
Table R-1 is an example of the preferred format for capital costs.
Costs for Conveyance Systems
Conveyance systems include pipelines, pump stations, intake and outlet structures for
delivering raw or treated water from one location to another.
R-2
Table R-1 Example of Preferred Cost Estimate Format
Construction Costs
Well Field Facilities Size Quantity Unit Unit Price
Cost
Water Wells 12 LS $50,000 $600,000Transmission to Pump Station 10 in. 120,000 LF $28 $3,360,000
$3,960,000 Engineering and Contingencies (30%) $1,188,000
Subtotal for Well Field Facilities $5,148,000
Transmission Facilities Size Quantity Unit Unit Price
Cost
Pipeline 30 in. 368,860 LF $74 $27,296,000
Right of way easements (ROW) 368,860
LF $1 $369,000
Storage Tank at High Point 4 MG 1 LS $746,000 $746,000 $28,411,000
Engineering and Contingencies (30%) $8,523,000
Subtotal for Pipeline $36,934,000
Size Quantity Unit Unit Price
Cost
Pump Station at Well Field 1100 HP 1 LS $2,510,00
0 $2,510,000
Storage Tank at Well Field 4 MG 1 LS $746,000 $746,000
Booster Station 1100 HP
1 LS $2,510,000
$2,510,000
Storage Tank at Booster Station 4 MG 1 LS $746,000 $746,000 $6,512,000
Engineering and Contingencies (35%)
$2,279,200
R-3
Table R-1, Continued Subtotal for Pump Stations $8,791,200
Environmental and Archeological Studies
Quantity Unit Unit Price
Cost
368,860 LF $0.60 $221,000
Construction Total $50,873,200 Interest During Construction $3,978,000 Total Cost $54,851,200 Annual Costs
Debt Service $3,984,880Electricity $1,645,000Operation and Maintenance $487,000Total Annual Costs $6,116,880
Unit Costs Per Acre-Foot $910Per 1000 gallons $2.79
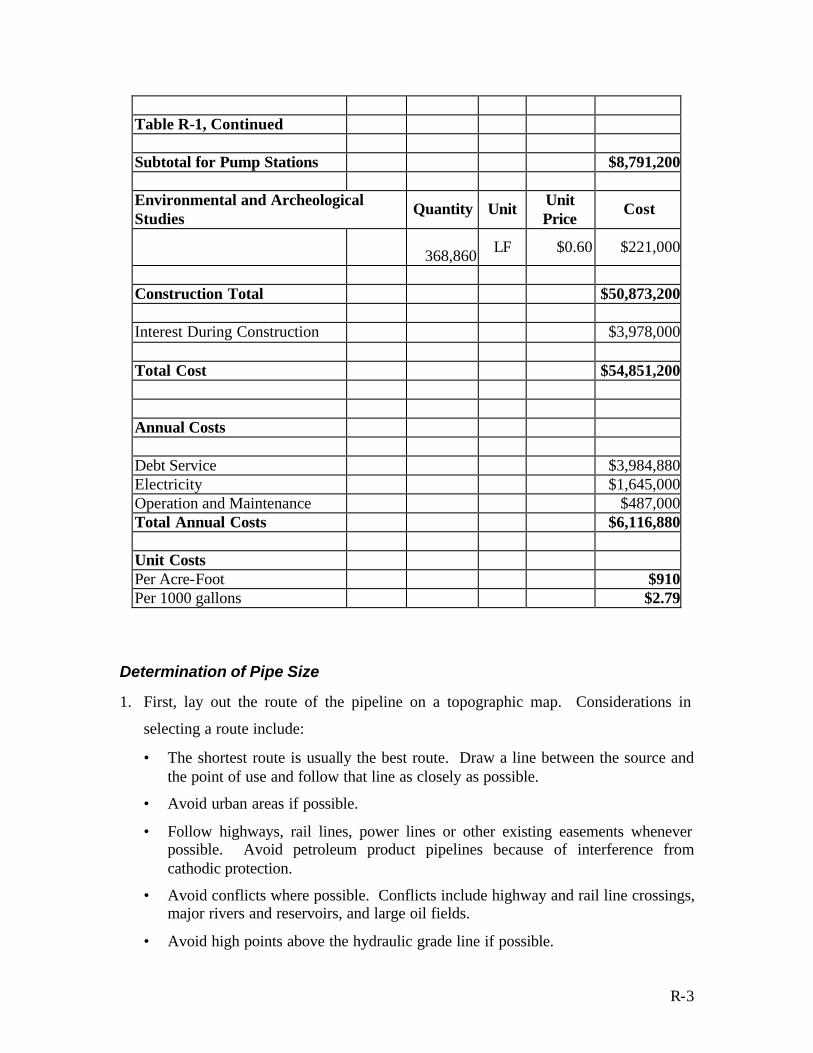
Determination of Pipe Size
1. First, lay out the route of the pipeline on a topographic map. Considerations in
selecting a route include:
• The shortest route is usually the best route. Draw a line between the source and the point of use and follow that line as closely as possible.
• Avoid urban areas if possible.
• Follow highways, rail lines, power lines or other existing easements whenever possible. Avoid petroleum product pipelines because of interference from cathodic protection.
• Avoid conflicts where possible. Conflicts include highway and rail line crossings, major rivers and reservoirs, and large oil fields.
• Avoid high points above the hydraulic grade line if possible.
R-4
2. Develop a profile of the route. A detailed profile is not required, but it is important to
include high and low points.
3. Select a design capacity based upon the amount of water needed. If the pipeline is to
be used to supply a treatment plant, the design capacity should be based upon the
peak-day delivery rate. Assume a 2.0 peaking factor unless other information is
available. If the pipeline is used to deliver water to terminal storage the design
capacity should be from 1.25 to 1.5 times the average annual demand. If the water
were used to supplement another source, the design capacity would be between 1.5 to
2.0 times the annual average demands.
4. Graph a hydraulic grade line using the Hazen-Williams equation at the design flow
and a C factor of 120. Select the pipe size using the following criteria:
• The velocity in the pipe at maximum flow should be between 4 and 6 ft/sec.
• The head loss in the pipe should be between 1.5 and 2.5 feet/1000 feet.
• Pipe sizes should be limited to standard diameters (i.e. the ones in the tables). However, if the pipeline is very long alternative diameters may be considered because the pipe supplier will be willing to manufacture non-standard sizes if the pipe is ordered in sufficient quantity.
5. In most cases assume that pump stations should add a maximum of 461 feet of head
(200 PSI) to the HGL. Station losses of 10 feet should be assumed at each pump
station. Booster pump stations should be added whenever the HGL is below 46 feet
(20 PSI). If possible locate booster pump stations at topographic high points and near
sources of power. Costs of pump stations are based upon number of pumps and the
HP of each pump. The number of pumps is based upon the expected range of
pumping. In general assume one additional pump as a backup. The amount of head
required at a pump station may be converted into horsepower using the following
formula:
HP = 0.17536 * Qmgd * Hft / Efficiency
R-5
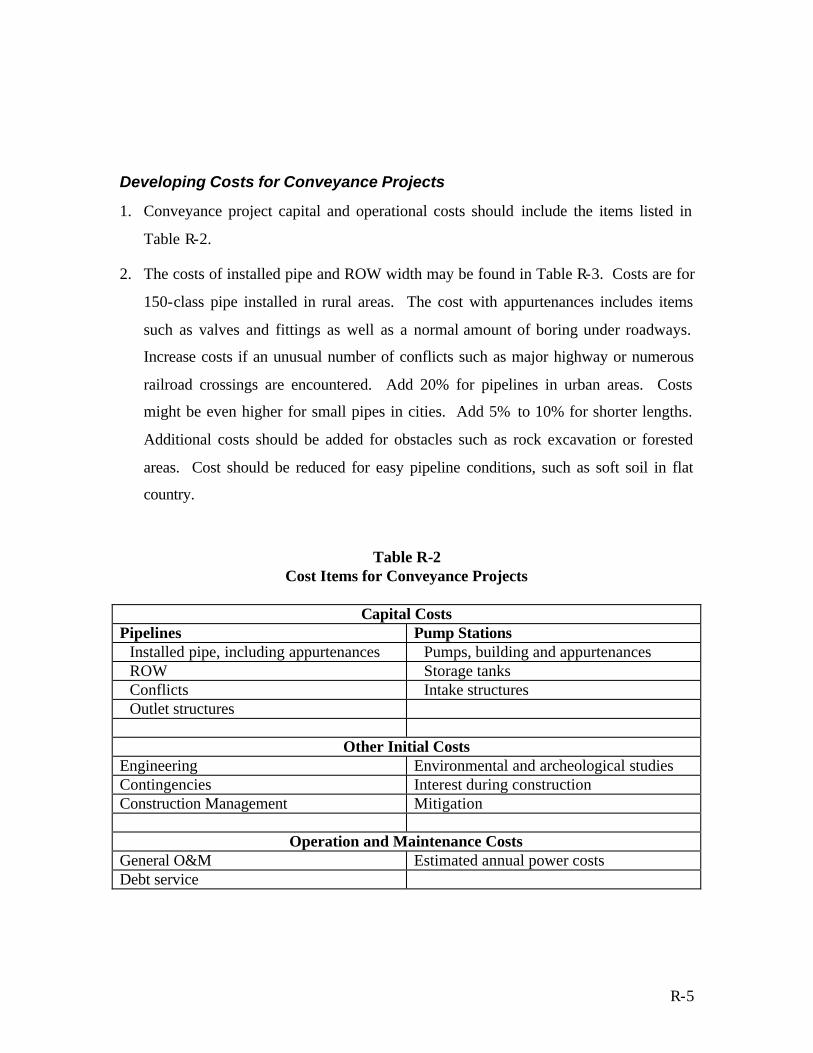
Developing Costs for Conveyance Projects
1. Conveyance project capital and operational costs should include the items listed in
Table R-2.
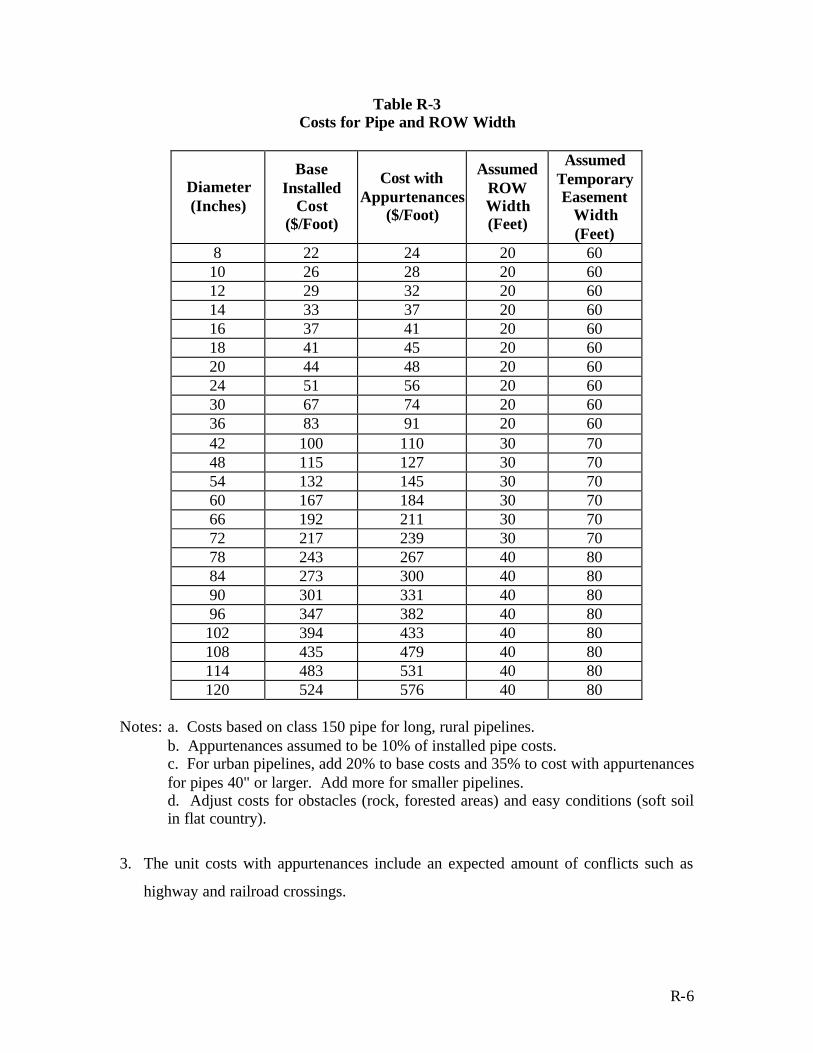
2. The costs of installed pipe and ROW width may be found in Table R-3. Costs are for
150-class pipe installed in rural areas. The cost with appurtenances includes items
such as valves and fittings as well as a normal amount of boring under roadways.
Increase costs if an unusual number of conflicts such as major highway or numerous
railroad crossings are encountered. Add 20% for pipelines in urban areas. Costs
might be even higher for small pipes in cities. Add 5% to 10% for shorter lengths.
Additional costs should be added for obstacles such as rock excavation or forested
areas. Cost should be reduced for easy pipeline conditions, such as soft soil in flat
country.
Table R-2 Cost Items for Conveyance Projects
Capital Costs
Pipelines Pump Stations Installed pipe, including appurtenances Pumps, building and appurtenances ROW Storage tanks Conflicts Intake structures Outlet structures
Other Initial Costs
Engineering Environmental and archeological studies Contingencies Interest during construction Construction Management Mitigation
Operation and Maintenance Costs General O&M Estimated annual power costs Debt service
R-6
Table R-3 Costs for Pipe and ROW Width
Diameter (Inches)
Base Installed
Cost ($/Foot)
Cost with Appurtenances
($/Foot)
Assumed ROW Width (Feet)
Assumed Temporary Easement
Width (Feet)
8 22 24 20 60 10 26 28 20 60 12 29 32 20 60 14 33 37 20 60 16 37 41 20 60 18 41 45 20 60 20 44 48 20 60 24 51 56 20 60 30 67 74 20 60 36 83 91 20 60 42 100 110 30 70 48 115 127 30 70 54 132 145 30 70 60 167 184 30 70 66 192 211 30 70 72 217 239 30 70 78 243 267 40 80 84 273 300 40 80 90 301 331 40 80 96 347 382 40 80 102 394 433 40 80 108 435 479 40 80 114 483 531 40 80 120 524 576 40 80
Notes: a. Costs based on class 150 pipe for long, rural pipelines. b. Appurtenances assumed to be 10% of installed pipe costs.
c. For urban pipelines, add 20% to base costs and 35% to cost with appurtenances for pipes 40" or larger. Add more for smaller pipelines. d. Adjust costs for obstacles (rock, forested areas) and easy conditions (soft soil in flat country).
3. The unit costs with appurtenances include an expected amount of conflicts such as
highway and railroad crossings.
R-7
4. Pipeline easements are additional and consist of a permanent easement and a
construction easement. Table R-3 gives the assumed ROW width for various sizes of
pipe. It should be assumed that a permanent right-of-way is purchased for most
projects.
5. Outlet structure cost is assumed to be $100,000 for most sizes of pipe.
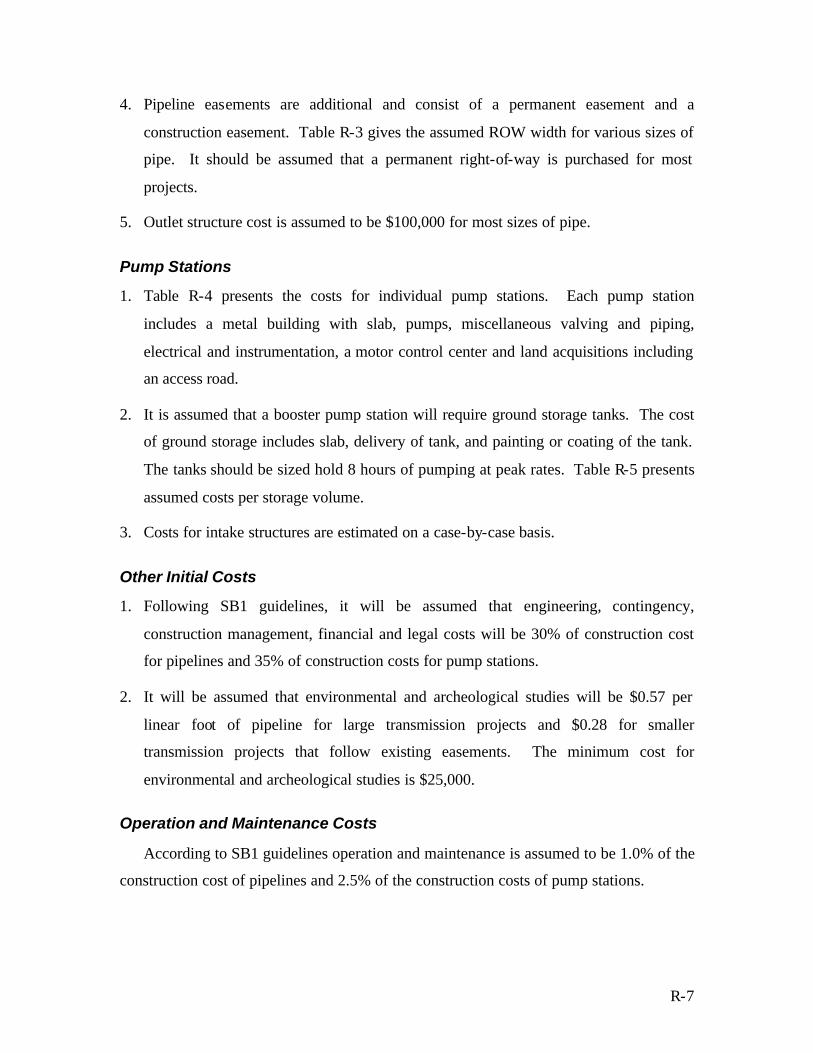
Pump Stations
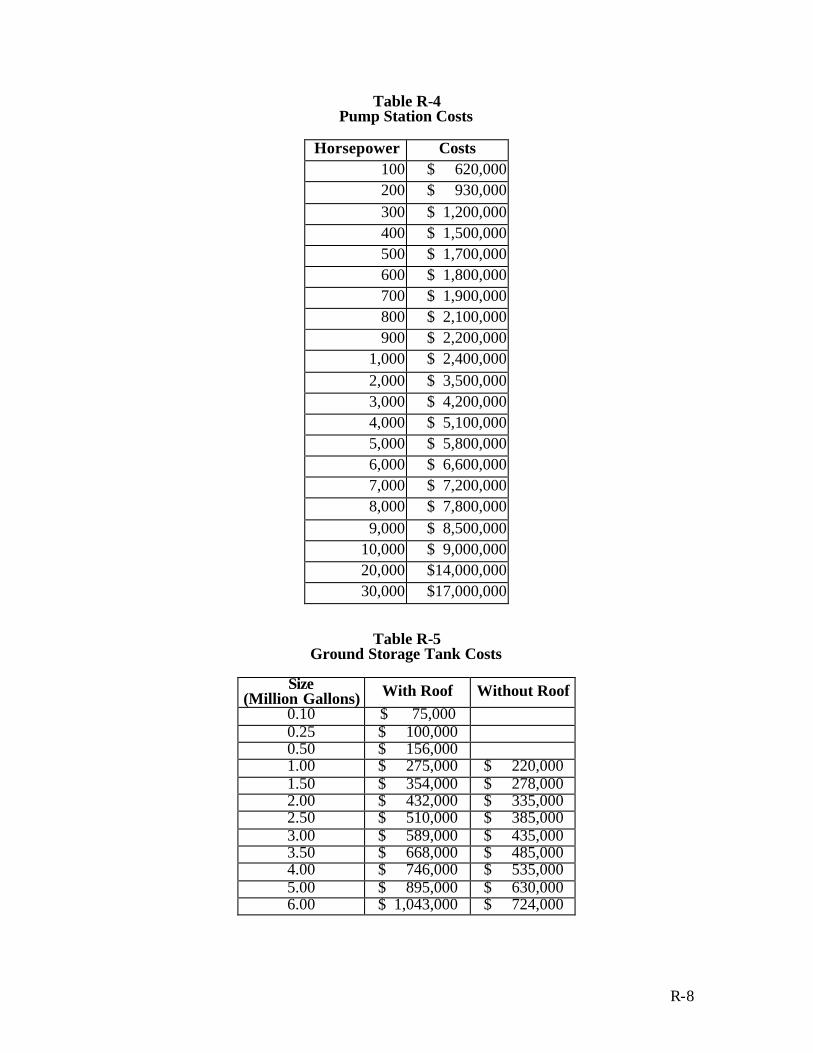
1. Table R-4 presents the costs for individual pump stations. Each pump station
includes a metal building with slab, pumps, miscellaneous valving and piping,
electrical and instrumentation, a motor control center and land acquisitions including
an access road.
2. It is assumed that a booster pump station will require ground storage tanks. The cost
of ground storage includes slab, delivery of tank, and painting or coating of the tank.
The tanks should be sized hold 8 hours of pumping at peak rates. Table R-5 presents
assumed costs per storage volume.
3. Costs for intake structures are estimated on a case-by-case basis.
Other Initial Costs
1. Following SB1 guidelines, it will be assumed that engineering, contingency,
construction management, financial and legal costs will be 30% of construction cost
for pipelines and 35% of construction costs for pump stations.
2. It will be assumed that environmental and archeological studies will be $0.57 per
linear foot of pipeline for large transmission projects and $0.28 for smaller
transmission projects that follow existing easements. The minimum cost for
environmental and archeological studies is $25,000.
Operation and Maintenance Costs
According to SB1 guidelines operation and maintenance is assumed to be 1.0% of the
construction cost of pipelines and 2.5% of the construction costs of pump stations.
R-8
Table R-4 Pump Station Costs
Horsepower Costs
100 $ 620,000 200 $ 930,000 300 $ 1,200,000 400 $ 1,500,000 500 $ 1,700,000 600 $ 1,800,000 700 $ 1,900,000 800 $ 2,100,000 900 $ 2,200,000
1,000 $ 2,400,000 2,000 $ 3,500,000 3,000 $ 4,200,000 4,000 $ 5,100,000 5,000 $ 5,800,000 6,000 $ 6,600,000 7,000 $ 7,200,000 8,000 $ 7,800,000 9,000 $ 8,500,000
10,000 $ 9,000,000 20,000 $14,000,000 30,000 $17,000,000
Table R-5 Ground Storage Tank Costs
Size
(Million Gallons) With Roof Without Roof 0.10 $ 75,000 0.25 $ 100,000 0.50 $ 156,000 1.00 $ 275,000 $ 220,000 1.50 $ 354,000 $ 278,000 2.00 $ 432,000 $ 335,000 2.50 $ 510,000 $ 385,000 3.00 $ 589,000 $ 435,000 3.50 $ 668,000 $ 485,000 4.00 $ 746,000 $ 535,000 5.00 $ 895,000 $ 630,000 6.00 $ 1,043,000 $ 724,000
R-9
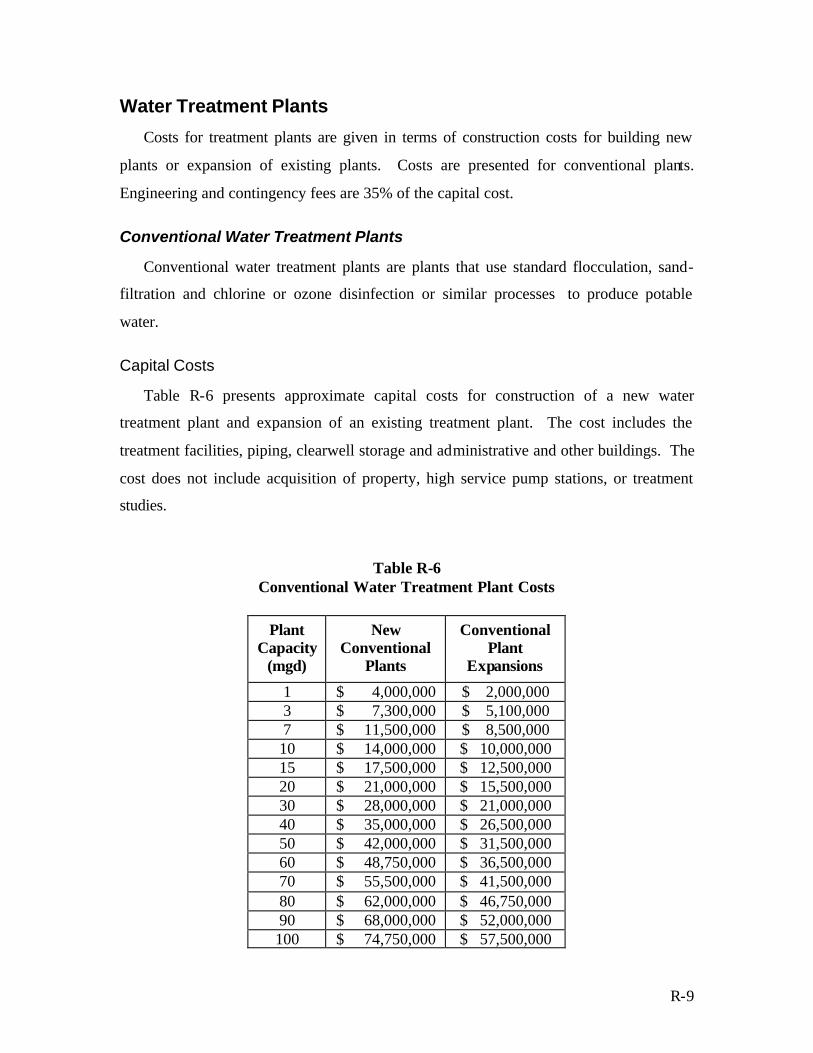
Water Treatment Plants
Costs for treatment plants are given in terms of construction costs for building new
plants or expansion of existing plants. Costs are presented for conventional plants.
Engineering and contingency fees are 35% of the capital cost.
Conventional Water Treatment Plants
Conventional water treatment plants are plants that use standard flocculation, sand-
filtration and chlorine or ozone disinfection or similar processes to produce potable
water.
Capital Costs
Table R-6 presents approximate capital costs for construction of a new water
treatment plant and expansion of an existing treatment plant. The cost includes the
treatment facilities, piping, clearwell storage and administrative and other buildings. The
cost does not include acquisition of property, high service pump stations, or treatment
studies.
Table R-6 Conventional Water Treatment Plant Costs
Plant Capacity
(mgd)
New Conventional
Plants
Conventional Plant
Expansions
1 $ 4,000,000 $ 2,000,000 3 $ 7,300,000 $ 5,100,000 7 $ 11,500,000 $ 8,500,000 10 $ 14,000,000 $ 10,000,000 15 $ 17,500,000 $ 12,500,000 20 $ 21,000,000 $ 15,500,000 30 $ 28,000,000 $ 21,000,000 40 $ 35,000,000 $ 26,500,000 50 $ 42,000,000 $ 31,500,000 60 $ 48,750,000 $ 36,500,000 70 $ 55,500,000 $ 41,500,000 80 $ 62,000,000 $ 46,750,000 90 $ 68,000,000 $ 52,000,000 100 $ 74,750,000 $ 57,500,000
R-10
Operation and Maintenance Costs
The operation and maintenance of a conventional water treatment plant is $0.35 per
1,000 gallons for small systems (less than 6 mgd) and $0.25 per 1,000 gallons for large
systems (greater than 6 mgd). These costs include chemicals, labor and electricity.
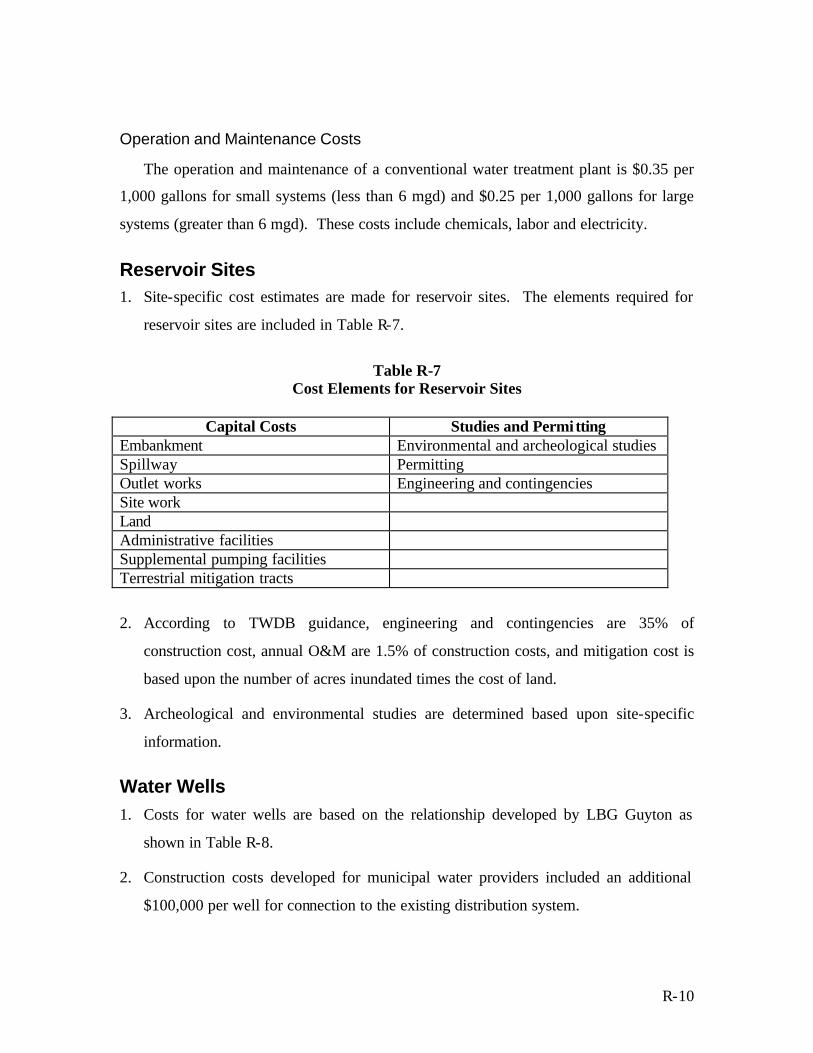
Reservoir Sites 1. Site-specific cost estimates are made for reservoir sites. The elements required for
reservoir sites are included in Table R-7.
Table R-7
Cost Elements for Reservoir Sites
Capital Costs Studies and Permitting Embankment Environmental and archeological studies Spillway Permitting Outlet works Engineering and contingencies Site work Land Administrative facilities Supplemental pumping facilities Terrestrial mitigation tracts
2. According to TWDB guidance, engineering and contingencies are 35% of
construction cost, annual O&M are 1.5% of construction costs, and mitigation cost is
based upon the number of acres inundated times the cost of land.
3. Archeological and environmental studies are determined based upon site-specific
information.
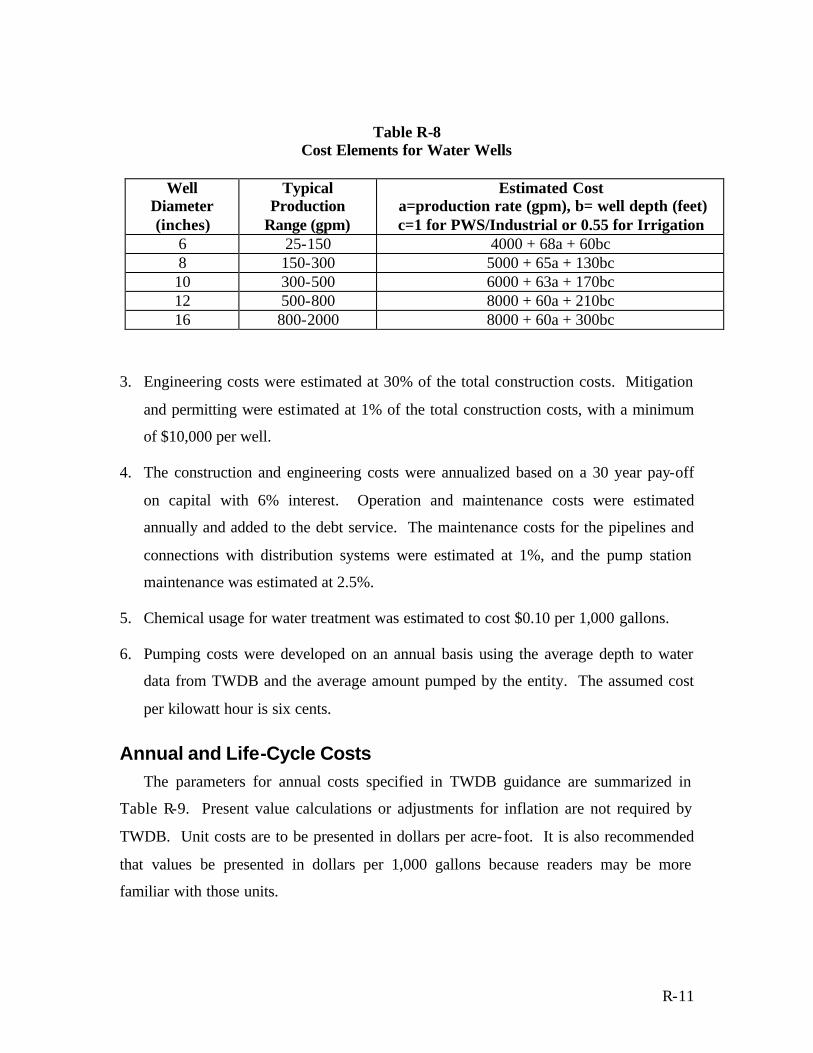
Water Wells 1. Costs for water wells are based on the relationship developed by LBG Guyton as
shown in Table R-8.
2. Construction costs developed for municipal water providers included an additional
$100,000 per well for connection to the existing distribution system.
R-11
Table R-8 Cost Elements for Water Wells
Well
Diameter (inches)
Typical Production
Range (gpm)
Estimated Cost a=production rate (gpm), b= well depth (feet) c=1 for PWS/Industrial or 0.55 for Irrigation
6 25-150 4000 + 68a + 60bc 8 150-300 5000 + 65a + 130bc 10 300-500 6000 + 63a + 170bc 12 500-800 8000 + 60a + 210bc 16 800-2000 8000 + 60a + 300bc
3. Engineering costs were estimated at 30% of the total construction costs. Mitigation
and permitting were estimated at 1% of the total construction costs, with a minimum
of $10,000 per well.
4. The construction and engineering costs were annualized based on a 30 year pay-off
on capital with 6% interest. Operation and maintenance costs were estimated
annually and added to the debt service. The maintenance costs for the pipelines and
connections with distribution systems were estimated at 1%, and the pump station
maintenance was estimated at 2.5%.
5. Chemical usage for water treatment was estimated to cost $0.10 per 1,000 gallons.
6. Pumping costs were developed on an annual basis using the average depth to water
data from TWDB and the average amount pumped by the entity. The assumed cost
per kilowatt hour is six cents.
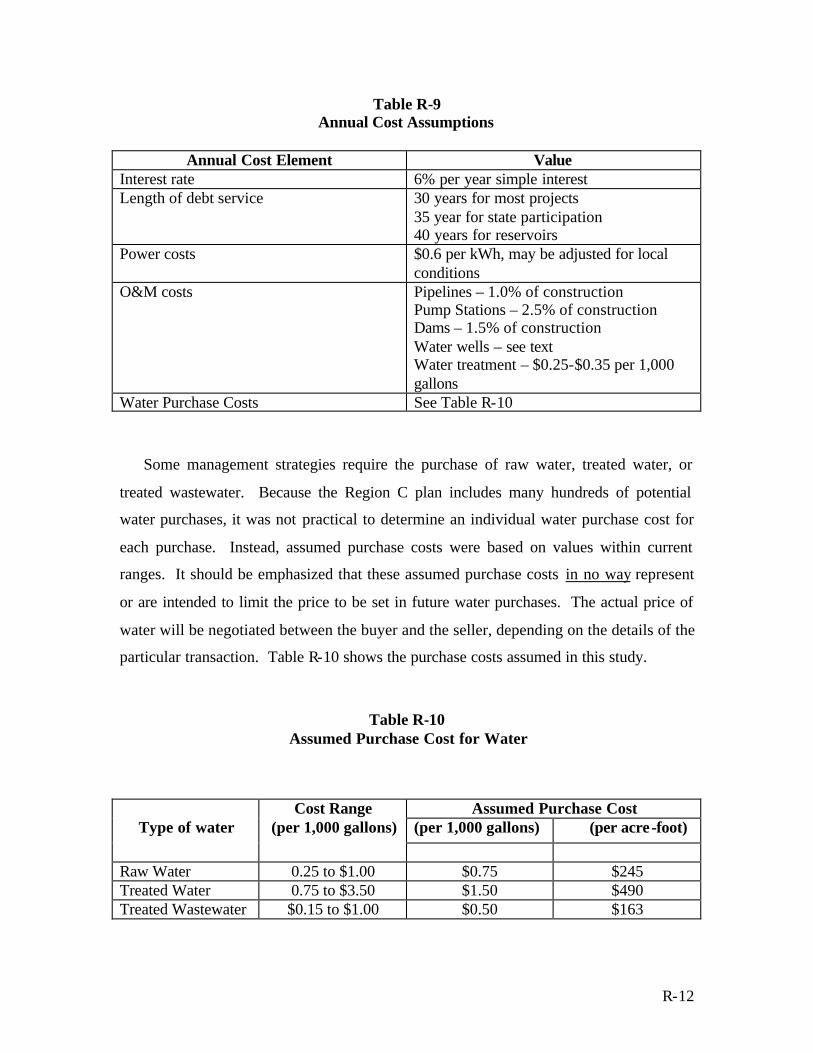
Annual and Life-Cycle Costs The parameters for annual costs specified in TWDB guidance are summarized in
Table R-9. Present value calculations or adjustments for inflation are not required by
TWDB. Unit costs are to be presented in dollars per acre-foot. It is also recommended
that values be presented in dollars per 1,000 gallons because readers may be more
familiar with those units.
R-12
Table R-9 Annual Cost Assumptions
Annual Cost Element Value
Interest rate 6% per year simple interest Length of debt service 30 years for most projects
35 year for state participation 40 years for reservoirs
Power costs $0.6 per kWh, may be adjusted for local conditions
O&M costs Pipelines – 1.0% of construction Pump Stations – 2.5% of construction Dams – 1.5% of construction Water wells – see text Water treatment – $0.25-$0.35 per 1,000 gallons
Water Purchase Costs See Table R-10
Some management strategies require the purchase of raw water, treated water, or
treated wastewater. Because the Region C plan includes many hundreds of potential
water purchases, it was not practical to determine an individual water purchase cost for
each purchase. Instead, assumed purchase costs were based on values within current
ranges. It should be emphasized that these assumed purchase costs in no way represent
or are intended to limit the price to be set in future water purchases. The actual price of
water will be negotiated between the buyer and the seller, depending on the details of the
particular transaction. Table R-10 shows the purchase costs assumed in this study.
Table R-10 Assumed Purchase Cost for Water
Assumed Purchase Cost
(per 1,000 gallons) (per acre-foot)
Type of water Cost Range
(per 1,000 gallons)
Raw Water 0.25 to $1.00 $0.75 $245 Treated Water 0.75 to $3.50 $1.50 $490 Treated Wastewater $0.15 to $1.00 $0.50 $163
R-13
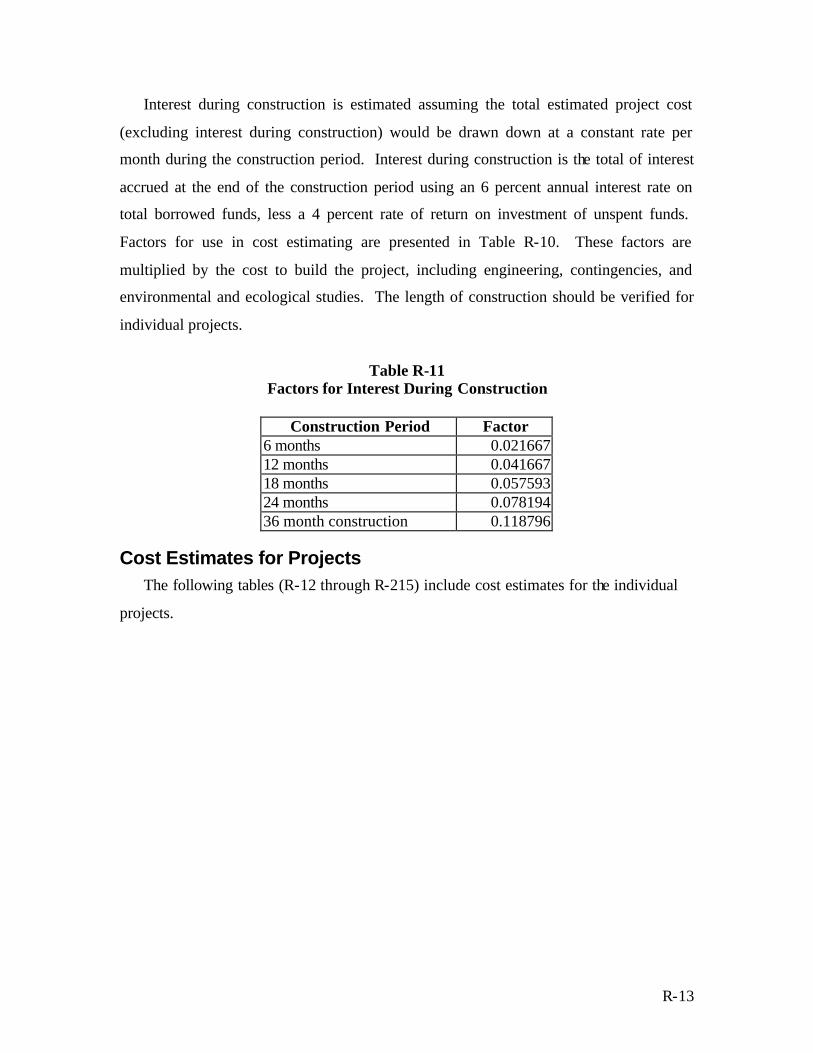
Interest during construction is estimated assuming the total estimated project cost
(excluding interest during construction) would be drawn down at a constant rate per
month during the construction period. Interest during construction is the total of interest
accrued at the end of the construction period using an 6 percent annual interest rate on
total borrowed funds, less a 4 percent rate of return on investment of unspent funds.
Factors for use in cost estimating are presented in Table R-10. These factors are
multiplied by the cost to build the project, including engineering, contingencies, and
environmental and ecological studies. The length of construction should be verified for
individual projects.
Table R-11
Factors for Interest During Construction
Construction Period Factor 6 months 0.021667 12 months 0.041667 18 months 0.057593 24 months 0.078194 36 month construction 0.118796
Cost Estimates for Projects The following tables (R-12 through R-215) include cost estimates for the individual
projects.
