water transport in pem fuel cells approach • lbm models for microscale flow thorough porous media:...
TRANSCRIPT

Water Transport in PEM Fuel Cells: Advanced Modeling, Material Selection, Testing,
and Design Optimization
J. Vernon Cole and Ashok GidwaniCFDRC
Prepared for:DOE Hydrogen Program Annual Review Meeting
May 21, 2009
Project ID: FC_36_Cole
This presentation does not contain any proprietary, confidential, or otherwise restricted information
2
Overview
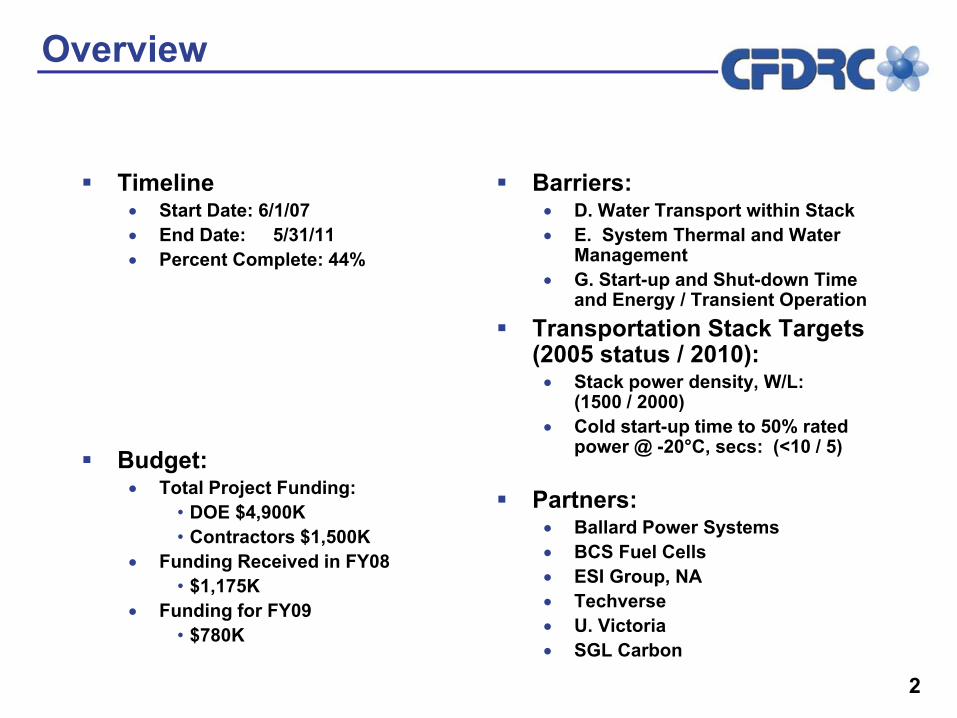
Timeline• Start Date: 6/1/07 • End Date: 5/31/11• Percent Complete: 44%
Budget:• Total Project Funding:
• DOE $4,900K• Contractors $1,500K
• Funding Received in FY08• $1,175K
• Funding for FY09• $780K
Barriers:• D. Water Transport within Stack• E. System Thermal and Water
Management• G. Start-up and Shut-down Time
and Energy / Transient OperationTransportation Stack Targets (2005 status / 2010):• Stack power density, W/L:
(1500 / 2000)• Cold start-up time to 50% rated
power @ -20°C, secs: (<10 / 5)
Partners:• Ballard Power Systems• BCS Fuel Cells• ESI Group, NA• Techverse• U. Victoria• SGL Carbon
3
Program Objectives => Relevance
Overall:• Improve understanding of the effect of various cell component properties
and structure on the gas and water transport in a PEM fuel cell; • Demonstrate improvements in water management in cells and short
stacks; and• Encapsulate the developed understanding in models and simulation tools
for application to future systems.
FY 2008 and 2009:• Complete baseline characterization for Gas Diffusion Layer (GDL) materials
• Key fundamental properties affecting water transport• Gather experimental data under controlled conditions, test and apply
models for water transport in GDLs, channels, and across interfaces• Improved understanding of water transport, initial screening of
improvement concepts to remove water and/or control its distribution• Evaluate performance and water management sensitivity in operational
cells, evaluate cell-scale water transport models on component level, integrate with electrochemistry and test
• Data and tools for screening of concepts to improve water management while increasing power densities, mitigate liquid-water induced pressure drops and transients for system-level benefits
4
Approach
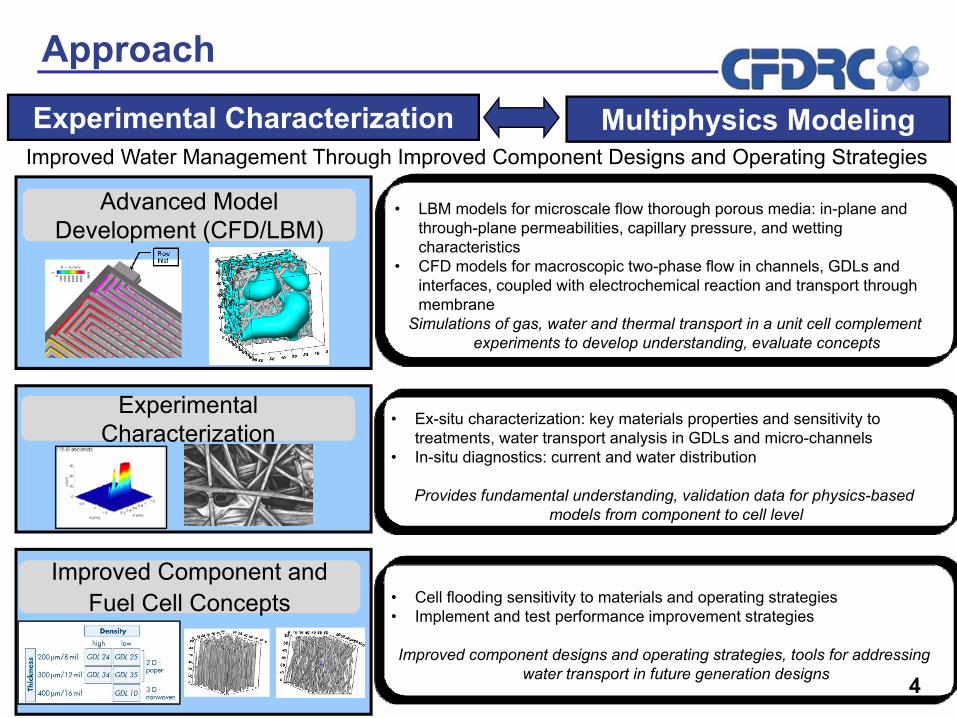
• LBM models for microscale flow thorough porous media: in-plane and through-plane permeabilities, capillary pressure, and wetting characteristics
• CFD models for macroscopic two-phase flow in channels, GDLs and interfaces, coupled with electrochemical reaction and transport through membrane
Simulations of gas, water and thermal transport in a unit cell complement experiments to develop understanding, evaluate concepts
Experimental Characterization
Advanced Model Development (CFD/LBM)
• Ex-situ characterization: key materials properties and sensitivity to treatments, water transport analysis in GDLs and micro-channels
• In-situ diagnostics: current and water distribution
Provides fundamental understanding, validation data for physics-based models from component to cell level
Improved Component and Fuel Cell Concepts • Cell flooding sensitivity to materials and operating strategies
• Implement and test performance improvement strategies
Improved component designs and operating strategies, tools for addressing water transport in future generation designs
Experimental Characterization
Improved Water Management Through Improved Component Designs and Operating StrategiesMultiphysics Modeling

5
FY08-09 Plans and Milestones
Month/Year Milestone Comments % Complete
May 08 Ex-situ GDL materials characterization
Two-phase transport data limited, needs further analysis
100 %
Dec 08 GDL-Channel water transport experimental characterization
Initial data on model systems, GDL data delayed for increased channel studies
50%
May 09 LBM microscale model for two-phase flow
Development complete, testing and application underway
100%
Jun 09 Cell-scale water transport model implemented, component models validated
Ongoing, initial numerical issues resolved and experiments underway for channels. GDL-channel interface experiments and model treatment lagging
75%
6
GDL Materials Characterization
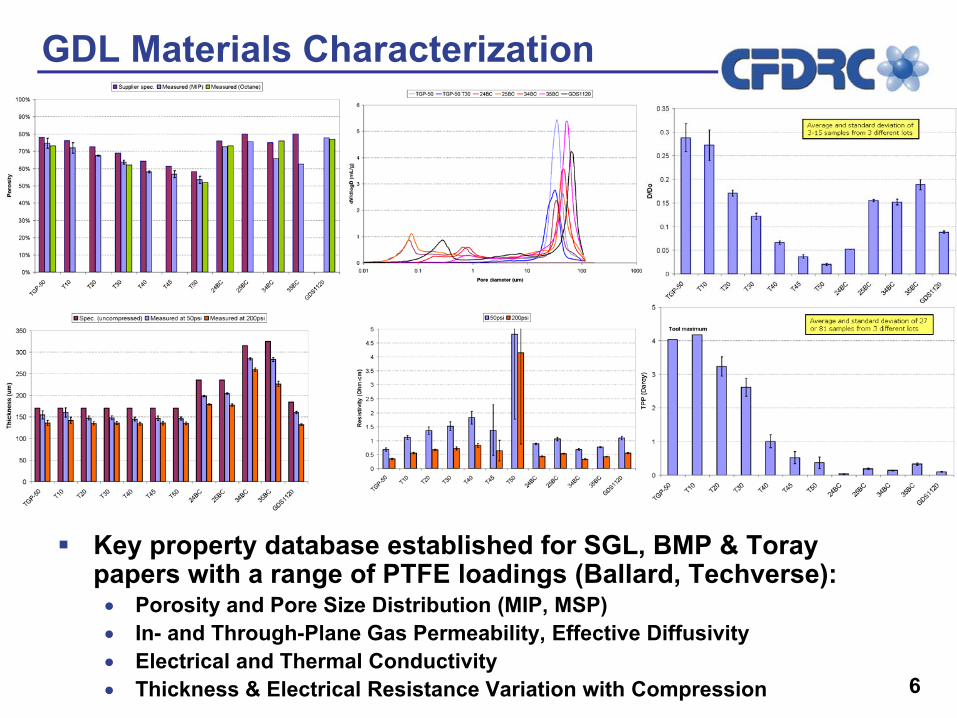
Key property database established for SGL, BMP & Toray papers with a range of PTFE loadings (Ballard, Techverse):• Porosity and Pore Size Distribution (MIP, MSP)• In- and Through-Plane Gas Permeability, Effective Diffusivity• Electrical and Thermal Conductivity• Thickness & Electrical Resistance Variation with Compression
7
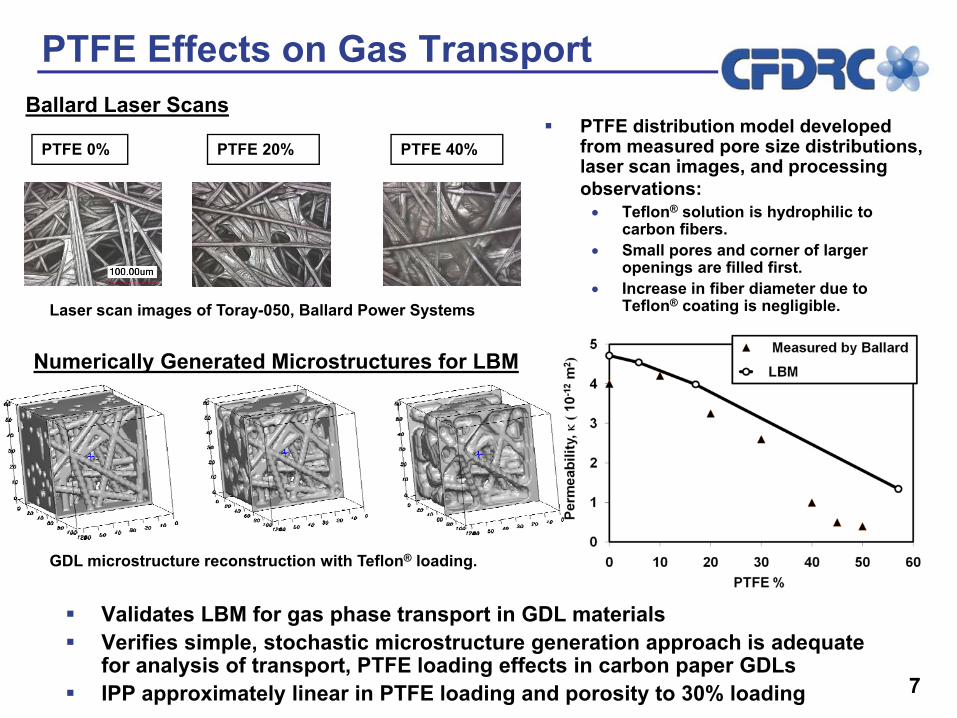
Laser scan images of Toray-050, Ballard Power Systems
GDL microstructure reconstruction with Teflon® loading.
PTFE 0% PTFE 20% PTFE 40%
Ballard Laser Scans
Numerically Generated Microstructures for LBM
PTFE Effects on Gas Transport
Validates LBM for gas phase transport in GDL materialsVerifies simple, stochastic microstructure generation approach is adequate for analysis of transport, PTFE loading effects in carbon paper GDLsIPP approximately linear in PTFE loading and porosity to 30% loading
PTFE distribution model developed from measured pore size distributions, laser scan images, and processing observations:• Teflon® solution is hydrophilic to
carbon fibers. • Small pores and corner of larger
openings are filled first.• Increase in fiber diameter due to
Teflon® coating is negligible.
8
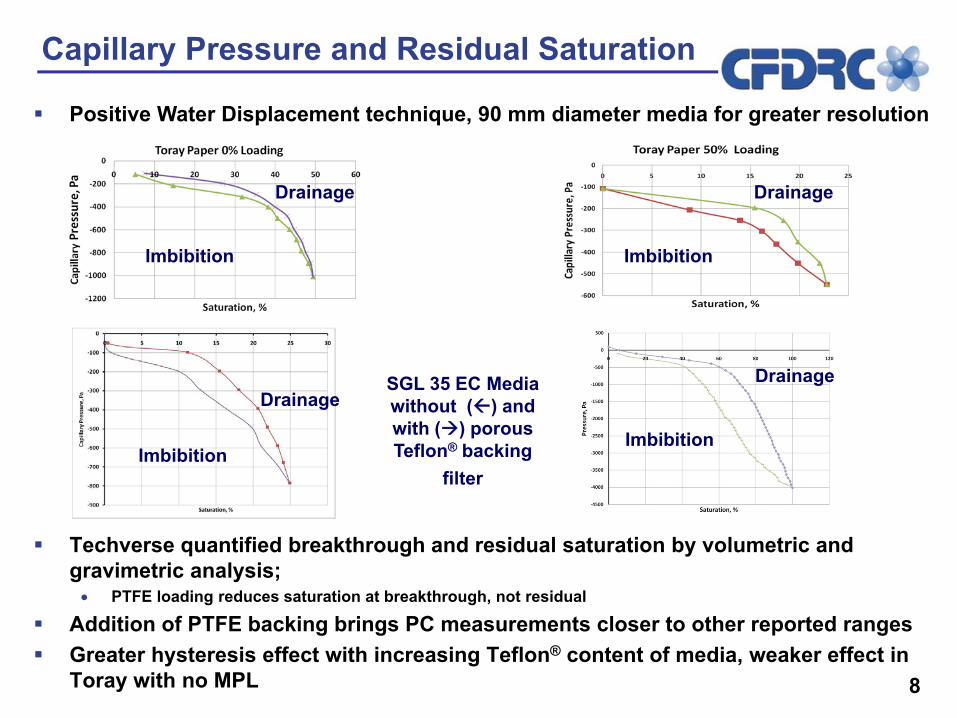
Capillary Pressure and Residual Saturation
Techverse quantified breakthrough and residual saturation by volumetric and gravimetric analysis; • PTFE loading reduces saturation at breakthrough, not residual
Addition of PTFE backing brings PC measurements closer to other reported rangesGreater hysteresis effect with increasing Teflon® content of media, weaker effect in Toray with no MPL
SGL 35 EC Media without ( ) and with ( ) porous Teflon® backing
filterImbibition
Imbibition
DrainageDrainage
Positive Water Displacement technique, 90 mm diameter media for greater resolution
Imbibition
Drainage
Imbibition
Drainage

9
Toray-050 (c) α = 0.7,droplet emergence
(b) α = 0.4, interconnected streams
(a) α = 0.3,dispersed globules
Hydrophobic porous plug to prevent liquid escape from GDL.
α = 0.7
Capillary Pressure Simulation
Similar model definition, with water reservoir and hydrophobic ‘frit’, used to verify capillary pressure implementation in CFD-based two-fluid code LBM Results guided implementation details in CFD continuum model

10
Gas Permeability in Wet Media Water Permeability
Gas and Water Permeability in Wet GDLs
Analysis ongoing to quantify saturation level and extract relative permeability No significant difference between initially humidified and dry gasPTFE loading did not significantly alter the behavior for SGL materials with MPL
Increasing PTFE content reduced water permeabilityThree distinct flow regimes.• 1: No flow. (below breakthrough
pressure)• 2: Constant permeability.
(moderate pressure)• 3: Increase in permeability with
increased pressure, indicating opening of more channels for water flow
11
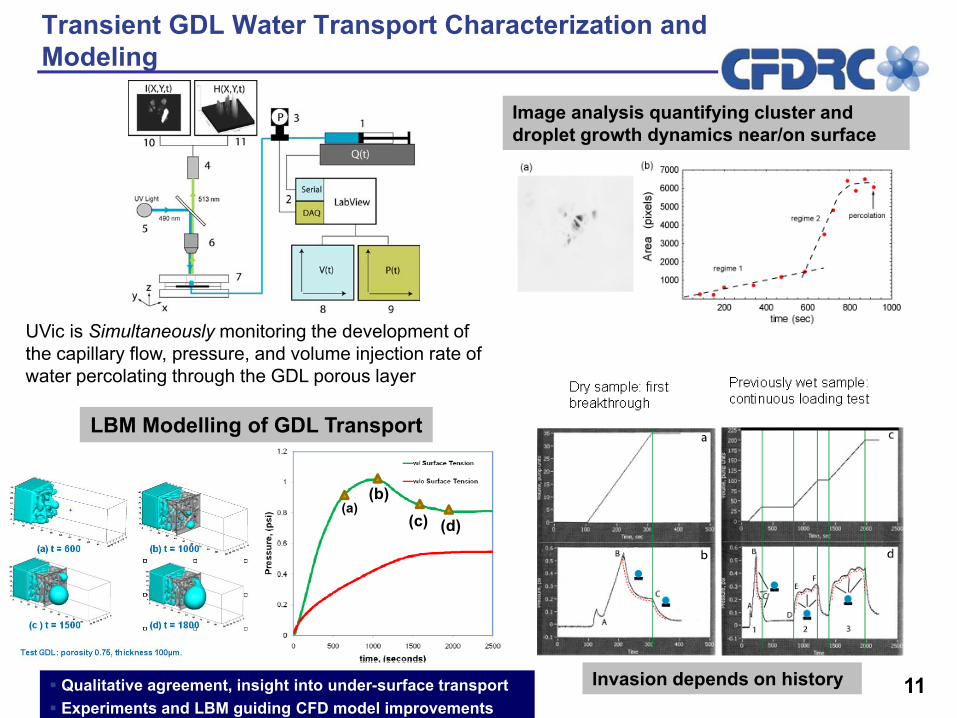
(a)(c)
(b)
(d)
Transient GDL Water Transport Characterization and Modeling
UVic is Simultaneously monitoring the development of the capillary flow, pressure, and volume injection rate of water percolating through the GDL porous layer
Invasion depends on history
LBM Modelling of GDL Transport
Image analysis quantifying cluster and droplet growth dynamics near/on surface
Qualitative agreement, insight into under-surface transportExperiments and LBM guiding CFD model improvements
12
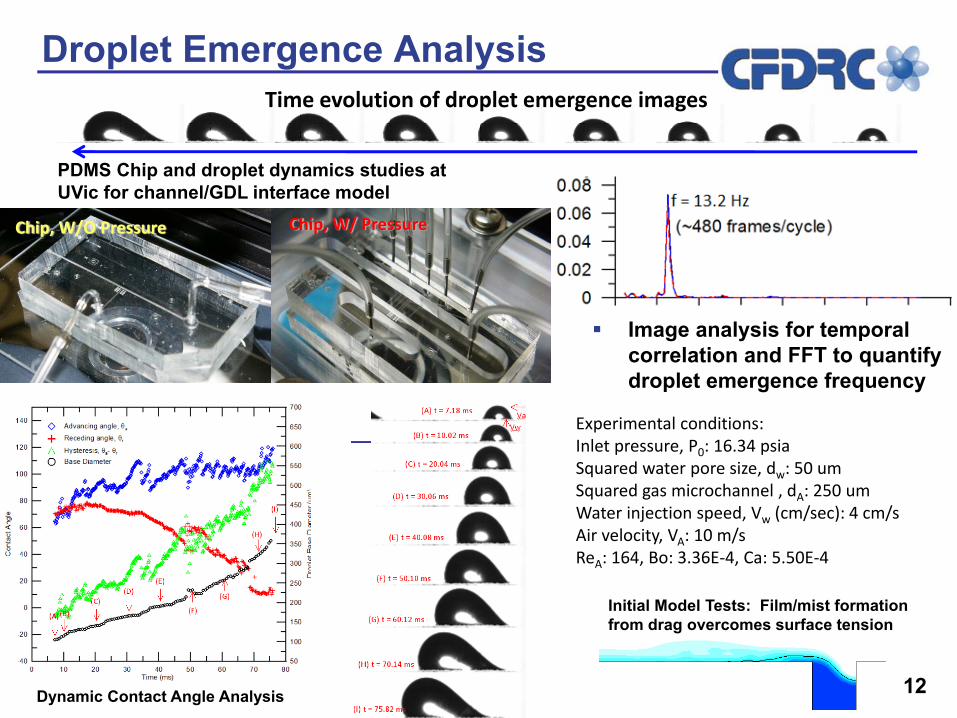
Droplet Emergence Analysis
Image analysis for temporal correlation and FFT to quantify droplet emergence frequency
Time evolution of droplet emergence images
Experimental conditions:Inlet pressure, P0: 16.34 psiaSquared water pore size, dw: 50 umSquared gas microchannel , dA: 250 umWater injection speed, Vw (cm/sec): 4 cm/sAir velocity, VA: 10 m/sReA: 164, Bo: 3.36E‐4, Ca: 5.50E‐4
Chip, W/O Pressure
PDMS Chip and droplet dynamics studies at UVic for channel/GDL interface model
Dynamic Contact Angle Analysis
Chip, W/ Pressure
Initial Model Tests: Film/mist formation from drag overcomes surface tension
13
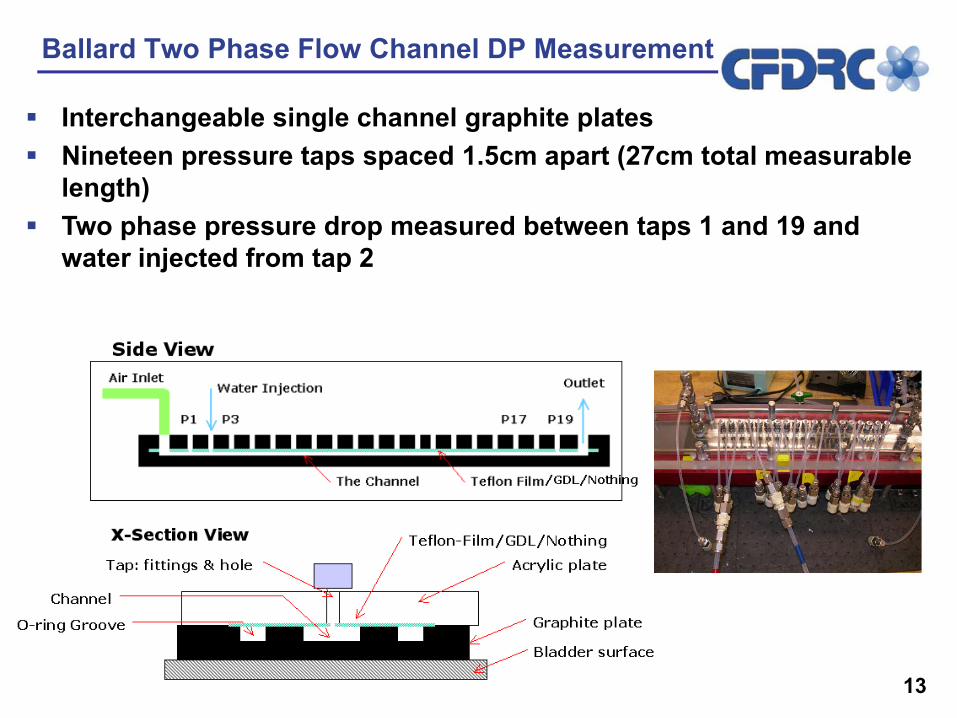
Ballard Two Phase Flow Channel DP Measurement
Interchangeable single channel graphite platesNineteen pressure taps spaced 1.5cm apart (27cm total measurable length)Two phase pressure drop measured between taps 1 and 19 and water injected from tap 2

14
Two Phase Channel Model Validation Test Matrix
Current Density [A/cm2]
Water Flow Rate [μL/min]
Temperature [C]
Outlet Pressure
[bara]
Air Flow Rates [sccm]
0.3 11 20 1.013 61, 204, 306, 407 1 37 20 1.013 61, 204, 306, 407
1.5 56 20 1.013 61, 204, 306, 4072 75 20 1.013 61, 204, 306, 407
Design 2
Experimental error estimation
Baseline
Keyence microscope assessment of micro-channel machining accuracy (within 10 μm)
407 sccm, 37 mL/min

150.9
0.95
1
1.05
1.1
1.15
0.011 0.037 0.056 0.075
Water Flow, ml/min
DP_
wet
/DP_
dry
ExptlCFD
CFD Pressure Drop Validation with Water Flow Rate
0.9
1
1.1
1.2
1.3
1.4
1.5
1.6
1.7
0.011 0.037 0.056 0.075
Water Flow, ml/min
DP_
wet
/DP_
dry
ExptlCFD
Steady two-phase CFD captured trends with water flow rateExperimental repeatability worse at low water and low air
61 SCCM407 SCCM
16
0.8
0.9
1
1.1
1.2
1.3
1.4
1.5
1.6
1.7
407 306 204 61
Air Flow (SCCM)
DP_
wet
/DP
_dry
ExptlCFD
0.8
0.9
1
1.1
1.2
1.3
1.4
1.5
1.6
1.7
407 306 204 61
Air Flow, SCCM
DP_
wet
/DP_
dry
ExptlCFD
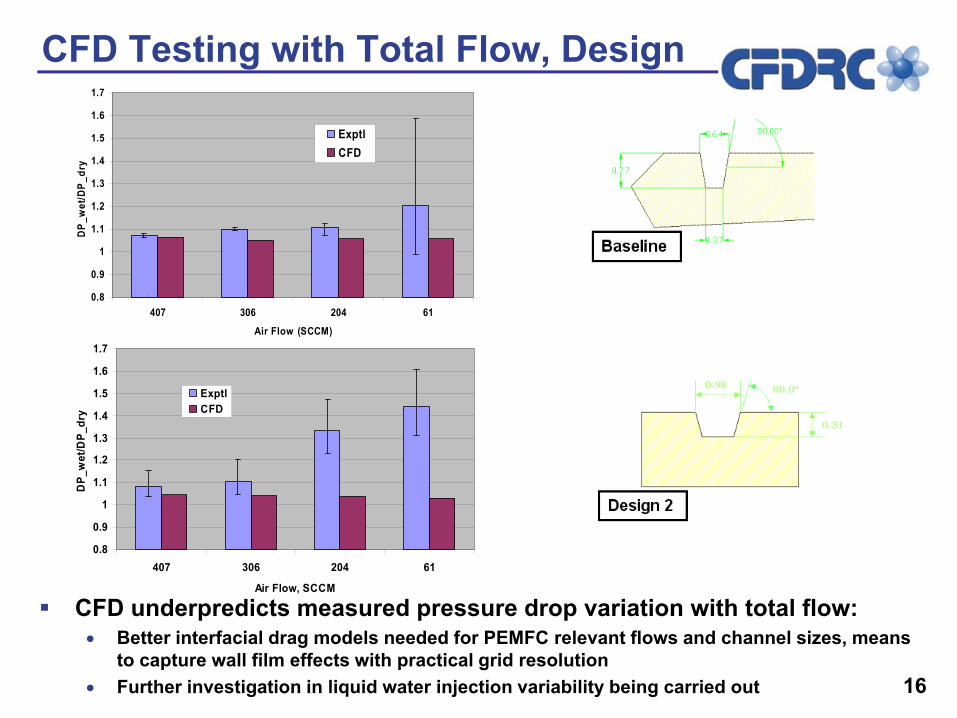
CFD Testing with Total Flow, Design
CFD underpredicts measured pressure drop variation with total flow:• Better interfacial drag models needed for PEMFC relevant flows and channel sizes, means
to capture wall film effects with practical grid resolution • Further investigation in liquid water injection variability being carried out
17
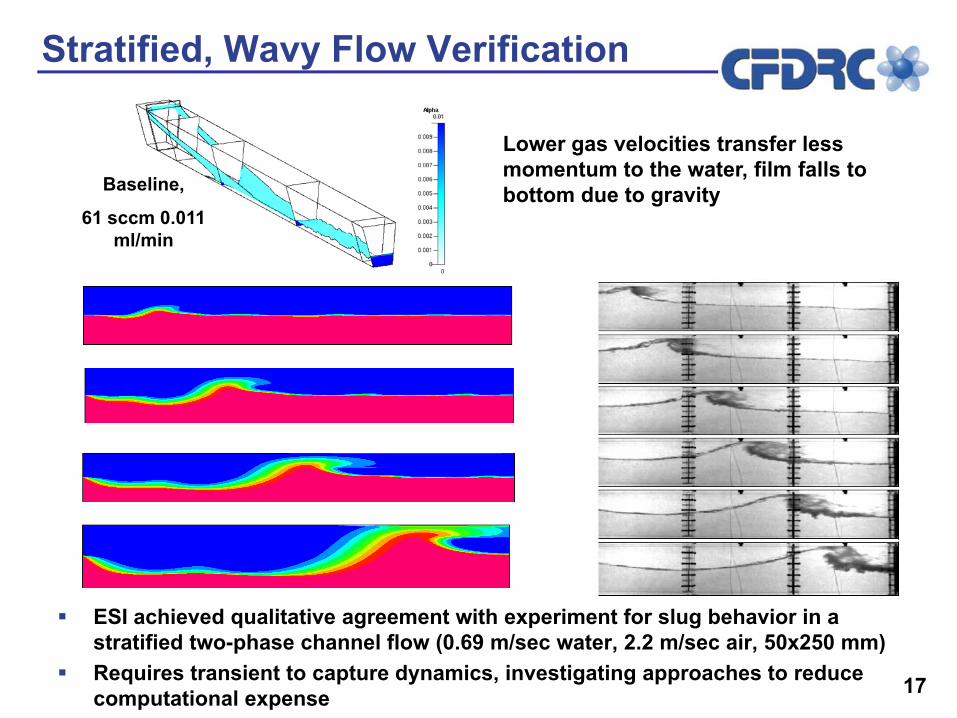
Stratified, Wavy Flow Verification
ESI achieved qualitative agreement with experiment for slug behavior in a stratified two-phase channel flow (0.69 m/sec water, 2.2 m/sec air, 50x250 mm)Requires transient to capture dynamics, investigating approaches to reduce computational expense
Lower gas velocities transfer less momentum to the water, film falls to bottom due to gravityBaseline,
61 sccm 0.011 ml/min
18
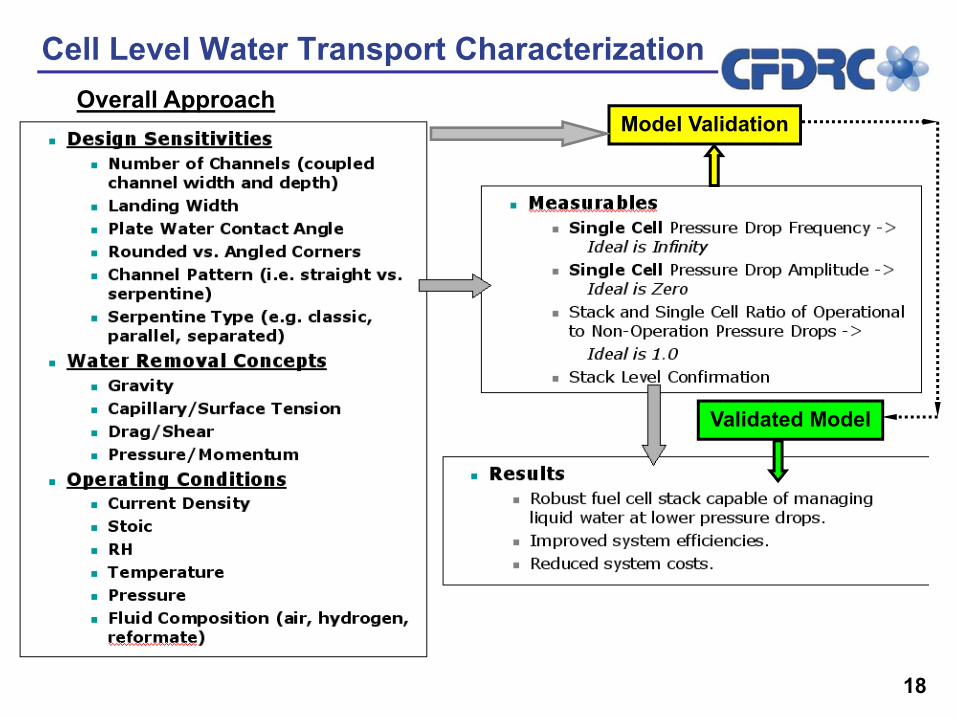
Overall ApproachModel Validation
Validated Model
Cell Level Water Transport Characterization
19
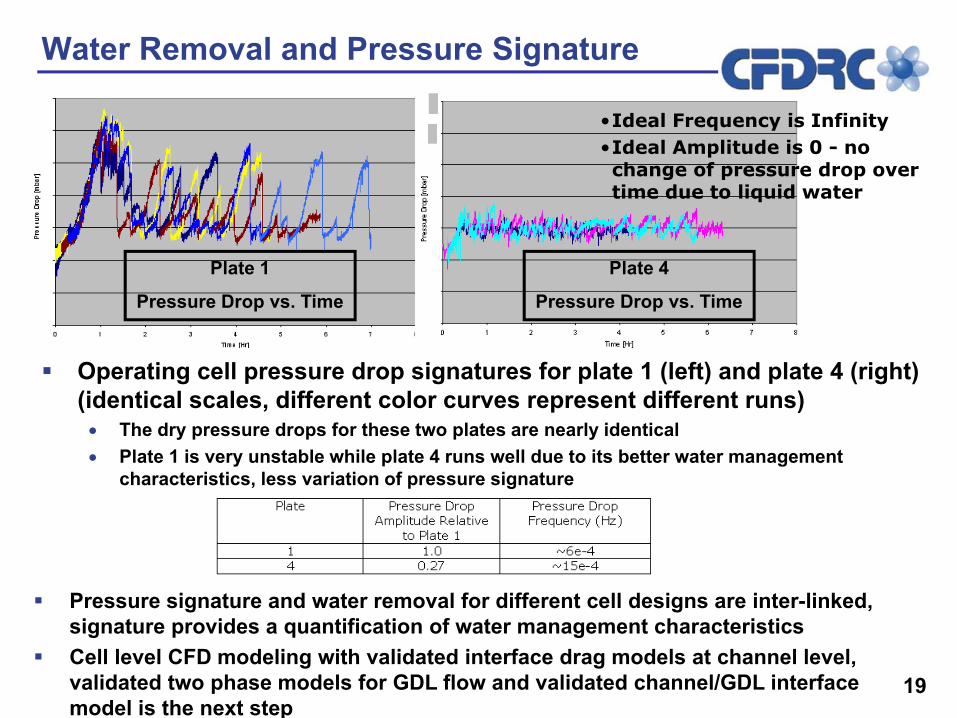
Water Removal and Pressure Signature•Ideal Frequency is Infinity•Ideal Amplitude is 0 - no change of pressure drop over time due to liquid water
Plate 1
Pressure Drop vs. Time
Plate 4
Pressure Drop vs. Time
Water Removal and Pressure Signature
Operating cell pressure drop signatures for plate 1 (left) and plate 4 (right) (identical scales, different color curves represent different runs)• The dry pressure drops for these two plates are nearly identical• Plate 1 is very unstable while plate 4 runs well due to its better water management
characteristics, less variation of pressure signature
Pressure signature and water removal for different cell designs are inter-linked, signature provides a quantification of water management characteristicsCell level CFD modeling with validated interface drag models at channel level, validated two phase models for GDL flow and validated channel/GDL interface model is the next step
20
0.00
0.10
0.20
0.30
0.40
0.50
0.60
0.70
0.80
0.90
1.00
0.00 0.20 0.40 0.60 0.80 1.00 1.20 1.40
Current density (A/cm2)
Pote
ntia
l (V)
0.00
0.05
0.10
0.15
0.20
0.25
0.30
0.35
0.40
0.45
Pow
er d
ensi
ty (W
/cm
2 )
Potential, 40 oC Potential, 50 oC Potential, 60 oC Potential, 70 oC Potential, 75 oC
40oC50oC
60oC
70oC
75oC
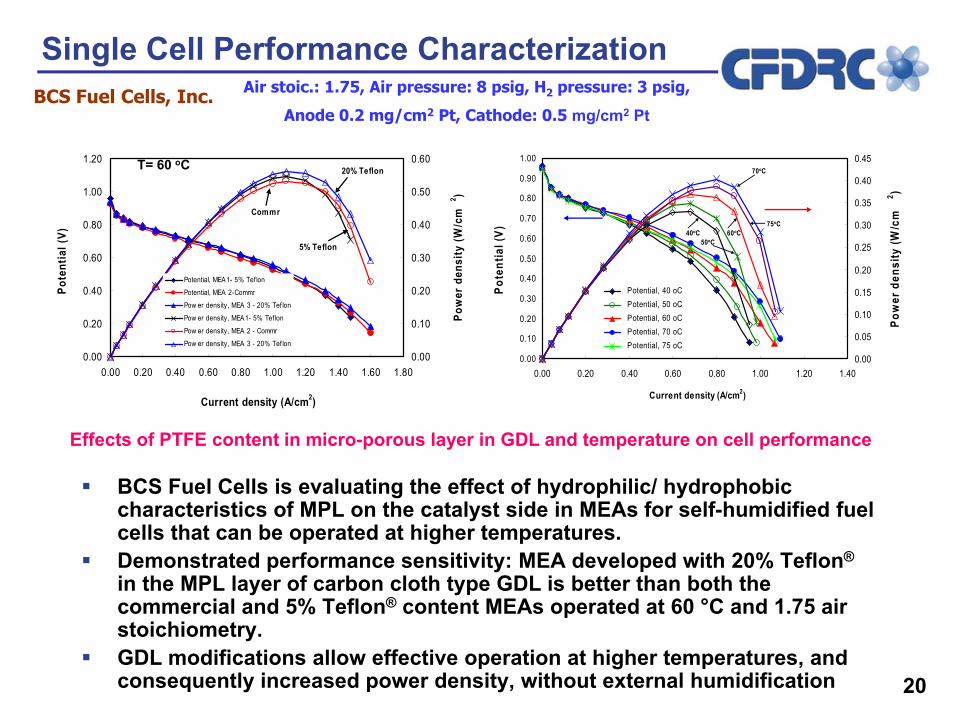
Effects of PTFE content in micro-porous layer in GDL and temperature on cell performance
0.00
0.20
0.40
0.60
0.80
1.00
1.20
0.00 0.20 0.40 0.60 0.80 1.00 1.20 1.40 1.60 1.80
Current density (A/cm2)
Pote
ntia
l (V)
0.00
0.10
0.20
0.30
0.40
0.50
0.60
Pow
er d
ensi
ty (W
/cm
2 )
Potential, MEA1- 5% Tef lon
Potential, MEA 2-Commr
Pow er density, MEA 3 - 20% Tef lon
Pow er density, MEA1- 5% Tef lon
Pow er density, MEA 2 - Commr
Pow er density, MEA 3 - 20% Tef lon
20% Teflon
Commr
5% Teflon
Air stoic.: 1.75, Air pressure: 8 psig, H2 pressure: 3 psig,
Anode 0.2 mg/cm2 Pt, Cathode: 0.5 mg/cm2 Pt
T= 60 oC
BCS Fuel Cells, Inc.
Single Cell Performance Characterization
BCS Fuel Cells is evaluating the effect of hydrophilic/ hydrophobic characteristics of MPL on the catalyst side in MEAs for self-humidified fuel cells that can be operated at higher temperatures.Demonstrated performance sensitivity: MEA developed with 20% Teflon®
in the MPL layer of carbon cloth type GDL is better than both the commercial and 5% Teflon® content MEAs operated at 60 °C and 1.75 air stoichiometry.GDL modifications allow effective operation at higher temperatures, and consequently increased power density, without external humidification

21
GDL Water Permeation into Channel
Techverse will characterize water permeation through GDLs into a BCS serpentine channel design bipolar plateExperimental data for water leaving channels, pressure signals, and water distribution will provide additional sensitivity information and model validationPreliminary modeling results for a single-bend section of the plate:• Highest channel water content, lowest water flux into channels is near outlet due to
higher channel pressure as expected• ‘Tumbling’ flow in the serpentine corners• Transient simulation required for numerical stability
Water in channel
Pressure in channel
Water Reservoir at controlled pressure
Inlets

22
Future Work and Milestones
FY09-10 Plans:Characterization and Diagnostics• Complete GDL-channel transport experiments
Model Development/Testing• Complete integration of heat transfer and electrochemistry with two-
phase CFD models• Cell-scale model evaluation against steady and transient data
Water Management Improvement• Concept development and screening:
• Component interaction and flooding sensitivity studies for performance improvement
• Channel design, surface finish, and GDL design for effective removal with low pressure drop
Upcoming Milestones:• Cell Scale model test/validation against operational cell data
completed Dec 2009• Improvement concept screening complete March 2010, optimization
underway
23
Collaborations
Partners• Ballard Power Systems: Measurement tools, material data, and
operational test results to validate and support the development of models for water transport and management
• BCS Fuel Cells: Operational cell and stack diagnostics, materials sensitivity and serpentine channel design
• ESI Group, NA: Model implementation and software integration, model testing
• Techverse: Materials characterization, ex-situ water transport• SGL Carbon: GDL and bipolar plate materials• U. Victoria: GDL permeation, channel droplet injection and transport
quantification
Technology Transfer• Univ. of South Carolina NSF I/UCRC Center for Fuel Cells: Presented
overview of this work, beneficial follow-on discussions on model formulation, material characterization
24
SummaryRelevance: • Effective water management is necessary to improve automotive fuel cell performance,
freeze/thaw cycle tolerance, and cold startup times Approach: • Integrated characterization and model development to advance understanding,
application of the resulting knowledge to optimization Technical Accomplishments and Progress:• Completed characterization of key physical and transport properties for SGL, BMP and
Toray GDL materials• Validated multiphase LBM applied to analyze impact of microstructure and Teflonation
on permeability, wetting characteristics and breakthrough, and capillary pressure behavior; Also guiding model developments for continuum CFD
• Implemented experimental setup for collecting wet pressure drop and transient pressure signatures in two-phase flows in channels and cells; Data being used for CFD model development and validation
• Started gathering experimental data for droplet emergence at GDL-channel interface; currently being used in model development
• Demonstrated sensitivity of cell operation to water management through materials and design modifications
• Began integration of electrochemistry, heat transfer, and phase change with the CFD two-phase flow models
Proposed Future Work:• Complete GDL-channel transport experiments and channel/cell pressure signature
measurements for different channel types and surface finish• Complete integration of electrochemistry, heat transfer and phase change models with
two-phase CFD models; Test and validate the developed integrated models using operational cell-scale steady and transient data
• Apply validated measurements and simulation tools to identifying optimization strategies: Channel design, surface finish, and GDL design for effective removal with low pressure drop