three-phase relative permeabilities ... - universiteit utrecht · three-phase relative...
TRANSCRIPT

Three-phase relative permeabilities in porous media of heterogeneous
wettability
Rink van Dijke and Ken SorbieInstitute of Petroleum Engineering
Heriot-Watt University Edinburgh, Scotland
Utrecht, The NetherlandsAugust 2006
Outline1. Introduction– Upscaling using network models– 3-Phase relative permeabilities– Wettability– Capillary bundle model
2. Saturation-dependencies of 3-phase relative permeabilities (using a capillary bundle)
– Occupancies and filling sequences– Dependency regions– Probabilistic model for distributed contact angles
3. Applications– Saturation-dependencies from 3D networks– Matching 2-phase field data to predict 3-phase
properties using network model– Software demonstration

Introduction
• Upscaling using network models• 3-Phase relative permeabilities• Wettability• Capillary bundle model

Upscaling using network models• Network model:
Pore → Network (core, REV)

Upscaling using network models• Single-phase:
Pore → Network (core, REV)Conductance Absolute permeability
Poiseuille’s Law Darcy’s Law
(cylindrical tube)Resistor type calculation for network nodal
pressures
4
8p r pq gl l
πµ
∆ ∆= − = −
4mPa s
g⎛ ⎞⎜ ⎟⋅⎝ ⎠
2(m )K
A PQ KLµ∆
= −
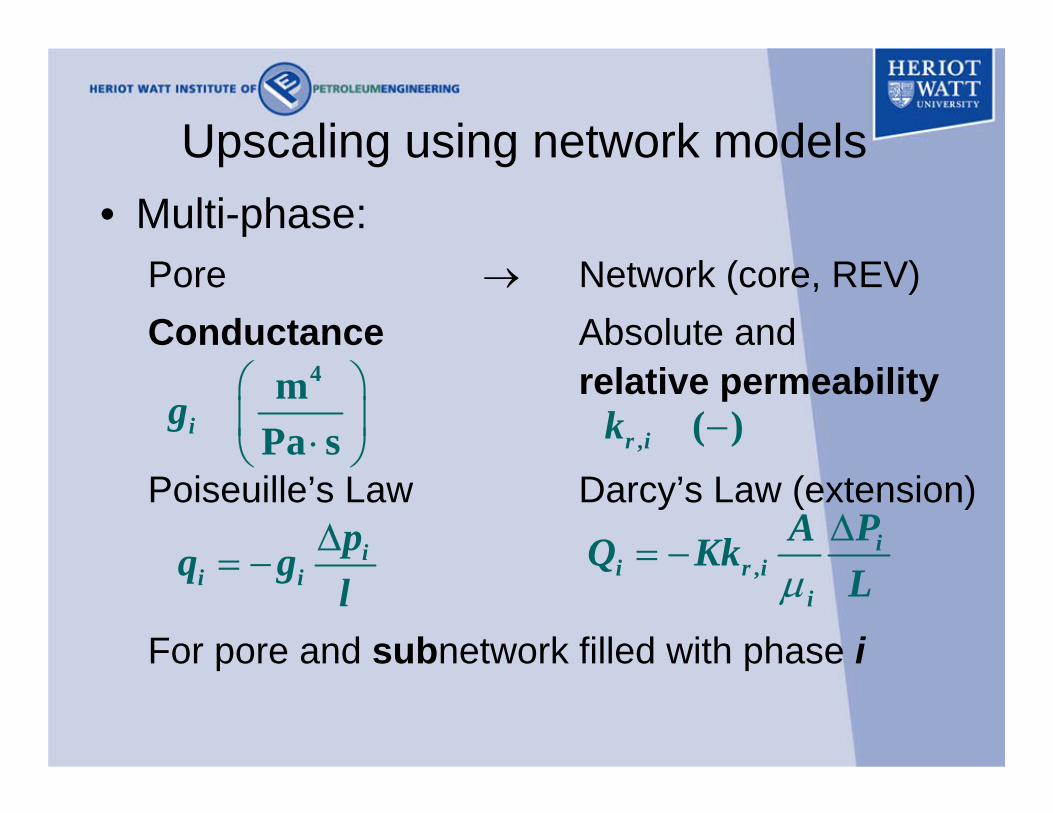
Upscaling using network models• Multi-phase:
Pore → Network (core, REV)Conductance Absolute and
relative permeability
Poiseuille’s Law Darcy’s Law (extension)
For pore and subnetwork filled with phase i
ii i
pq gl∆
= −
4mPa sig
⎛ ⎞⎜ ⎟⋅⎝ ⎠ , ( )r ik −
,i
i r ii
PAQ KkLµ∆
= −

Upscaling using network models• Multi-phase:
Pore → Network (core, REV)Conductance Absolute and
relative permeability
Poiseuille’s Law Darcy’s Law (extension)
For pore and subnetwork filled with phase i
ii i
pq gl∆
= −
4mPa sig
⎛ ⎞⎜ ⎟⋅⎝ ⎠
,i
i r ii
PAQ KkLµ∆
= −
, ( )r ik −

Upscaling using network models• Multi-phase:
Pore → Network (core, REV)Capillary ‘entry’ Capillary pressure
pressurePressure differencebetween phases i and j
(Young-Laplace, cylinder)
Volume function of saturations Si, also
2,
cosij ijc ijP
rσ θ
= ( ), ,c ij i jP S S
( ), ,r i i jk S S

Upscaling using network models• Main aim of network modelling (multi-phase
flow):Determine core-scale relative permeabilities and capillary pressures as functions of phase saturations
• Depending on pore-scale parameters, such as:– Pore geometry– Pore connectivity– Interfacial tensions– Wettability (contact angles)
2,
cosij ijc ijP
rσ θ
=
100% water
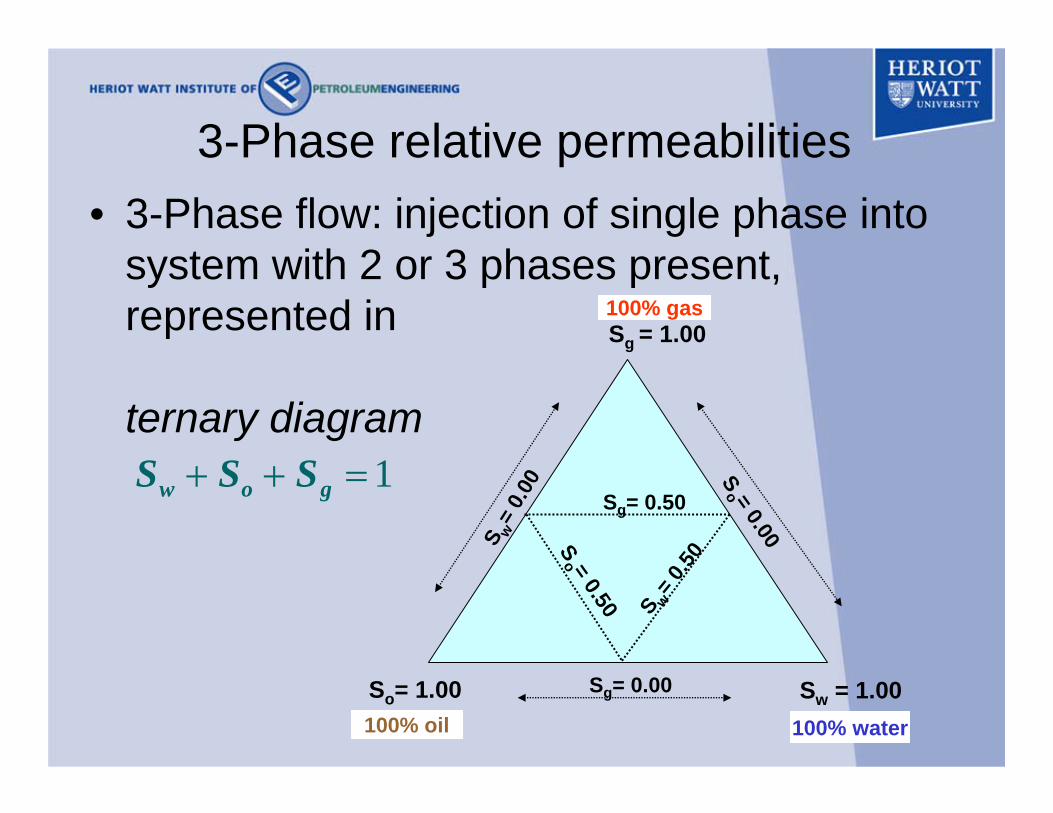
3-Phase relative permeabilities• 3-Phase flow: injection of single phase into
system with 2 or 3 phases present, represented in
ternary diagram
Sg = 1.00
So= 1.00 Sw = 1.00
S w= 0
.50
S w=
0.00
So = 0.50
So = 0.00
Sg= 0.50
Sg= 0.00
100% gas
100% oil
1w o gS S S+ + =

3-Phase relative permeabilities• 3-Phase flow: injection of gas after two-phase
water floodinto oil
100% water
Sg = 1.00
So= 1.00 Sw = 1.00
100% gas
100% oil
water flood
gas flooddisplacing:
oil and water
oil only (Swconstant)

3-Phase relative permeabilities• 3-Phase flow: water-alternating-gas injection
(WAG) / fluctuating ground water table around NAPL spill– Infinite number
of possiblesaturationpaths
100% water
Sg = 1.00
So= 1.00 Sw = 1.00
100% gas
100% oil
water floodgas flood

3-Phase relative permeabilities• Relperms along saturation paths
100% WaterSw = 1
100% Oil, So = 1
100% GasSg = 1
krg
Swi
Cycle 1
Water floodGas flood

3-Phase relative permeabilities• Relperms along saturation paths:
– Different along each path?!
– Hysteresis
100% WaterSw = 1
100% Oil, So = 1
100% GasSg = 1
krg
Swi
Cycle 2
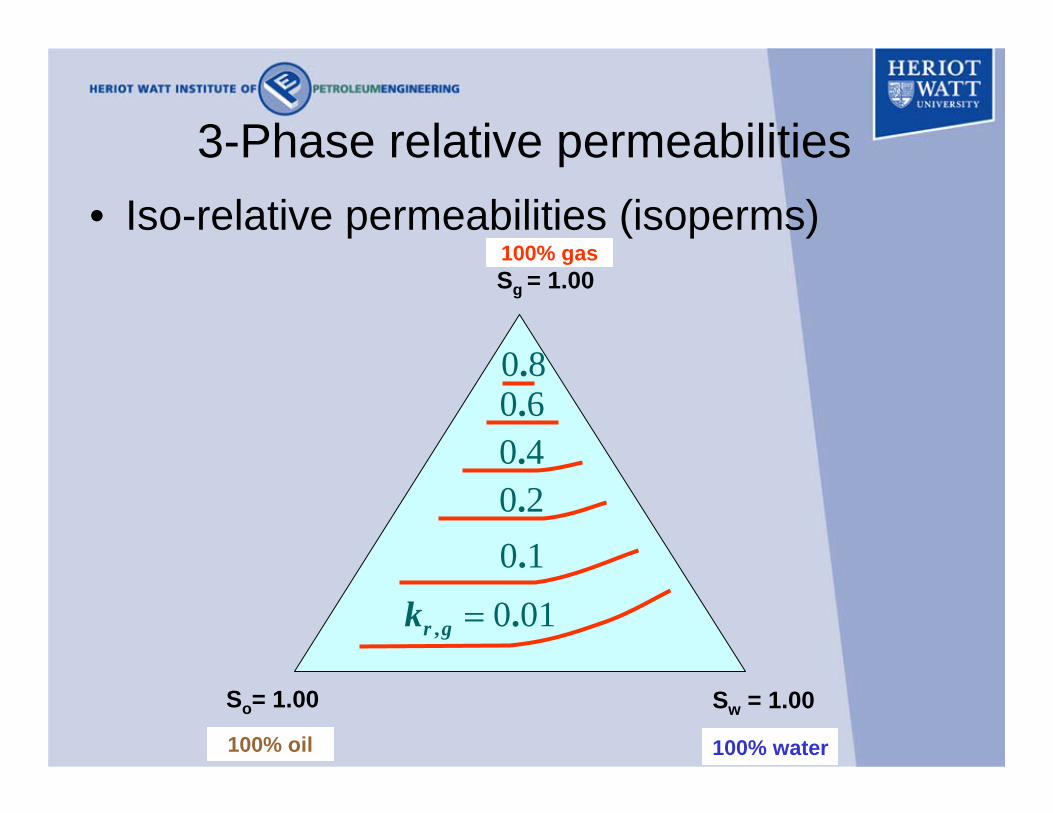
3-Phase relative permeabilities• Iso-relative permeabilities (isoperms)
100% water
Sg = 1.00
So= 1.00 Sw = 1.00
100% gas
100% oil
0 01, .r gk =
0 1.0 2.0 4.0 6.0 8.

3-Phase relative permeabilities• Measurements of 3-phase relperms extremely
difficult, examples:– Corey, Rathjens, Henderson and Wylie (AIME,
1956)– Lenhard and Parker (WRR, 1987)– Oak (SPE, 1990)– Skauge and Larsen (SCA, 1994)– Dicarlo, Sahni and Blunt (TIPM, 1999)
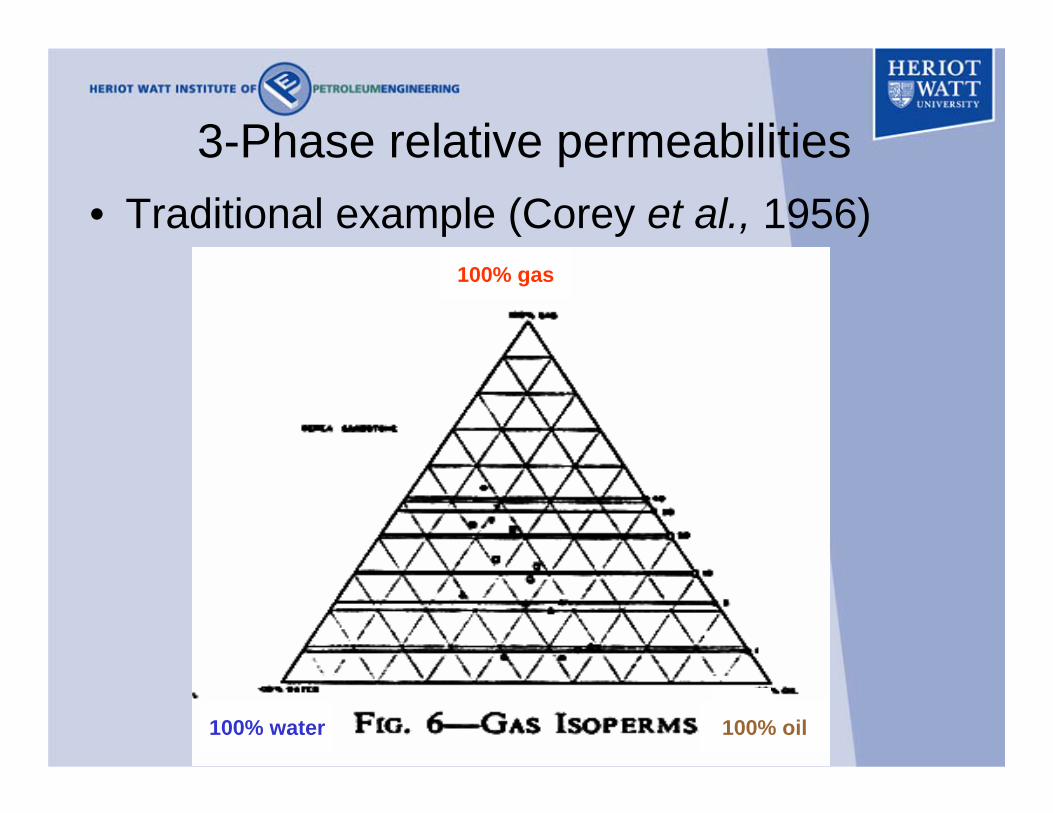
3-Phase relative permeabilities• Traditional example (Corey et al., 1956)
100% gas
100% oil100% water

3-Phase relative permeabilities• Traditional example (Corey et al., 1956)
•Curved oil isoperms
•Straight water and gas isoperms

3-Phase relative permeabilities• Iso-relative permeabilities (isoperms)
– Saturation-dependency
100% water
Sg = 1.00
So= 1.00 Sw = 1.00
100% gas
100% oil
( ),r g gk S ( ), ,r g g ok S S

3-Phase relative permeabilities• Iso-relative permeabilities (isoperms)
– Relation with 2-phaserelperms, e.g.
or
100% water
Sg = 1.00
So= 1.00 Sw = 1.00
100% gas
100% oil
( )2,go
r g ok S
( )2,gw
r g wk S
2, ,
gor g r gk k=
( )?
2 2, , ,,go gw
r g r g r gk f k k=
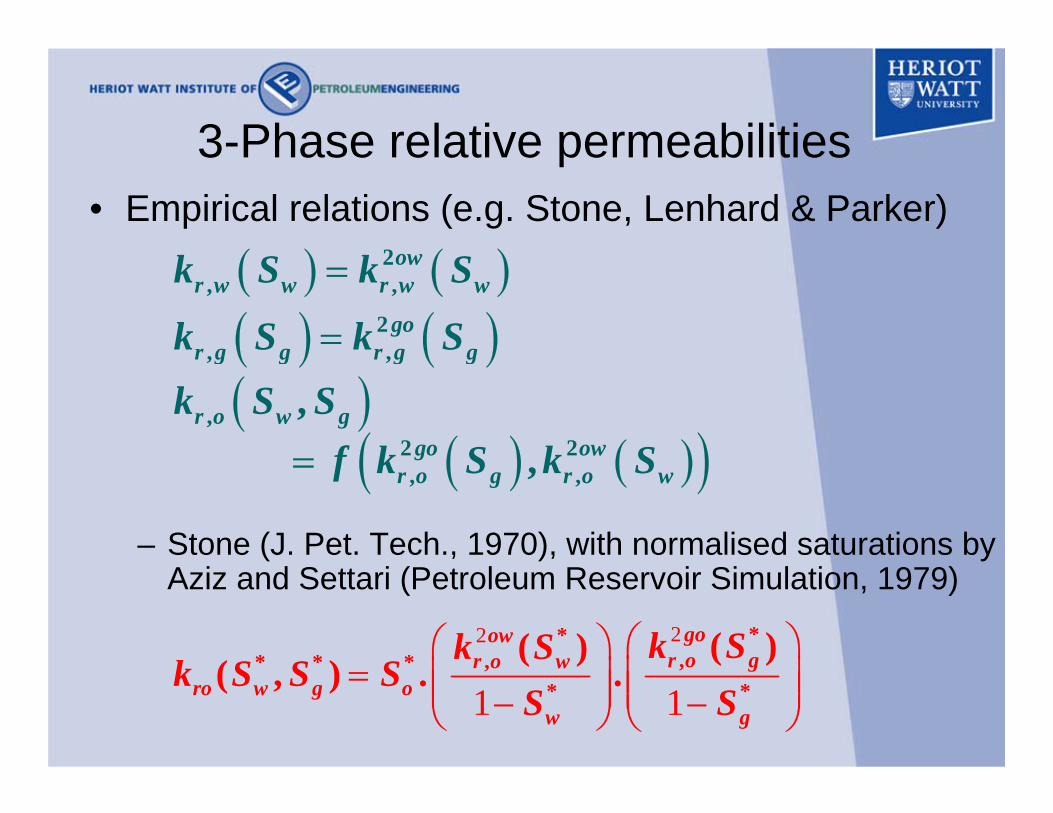
3-Phase relative permeabilities• Empirical relations (e.g. Stone, Lenhard & Parker)
– Stone (J. Pet. Tech., 1970), with normalised saturations by Aziz and Settari (Petroleum Reservoir Simulation, 1979)
( ) ( )2, ,
gor g g r g gk S k S=
( )( ) ( )( )
,2 2, ,
,,
r o w ggo ow
r o g r o w
k S Sf k S k S=
( ) ( )2, ,
owr w w r w wk S k S=
22
1 1
**,,* * *
* *
( )( )( , ) . .
goowr o gr o w
ro w g ow g
k Sk Sk S S S
S S⎛ ⎞⎛ ⎞
= ⎜ ⎟⎜ ⎟⎜ ⎟ ⎜ ⎟− −⎝ ⎠ ⎝ ⎠

3-Phase relative permeabilities• Empirical relations (Stone I)
– Reasonable agreement with some data sets
– Limits correctly to 2-phase relations:
( ) ( )2 20 0 1 1* * * *, , ,,ow go
w r o g o r o r o oS k S S k k S= → = − = → =
( )20* *, ,
owg r o r o wS k k S= → =
22
1 1
1
**,,* * *
* *
* * *
( )( )( , ) . . ,
goowr o gr o w
ro w g ow g
w o g
k Sk Sk S S S
S S
S S S
⎛ ⎞⎛ ⎞= ⎜ ⎟⎜ ⎟⎜ ⎟ ⎜ ⎟− −⎝ ⎠ ⎝ ⎠
+ + =
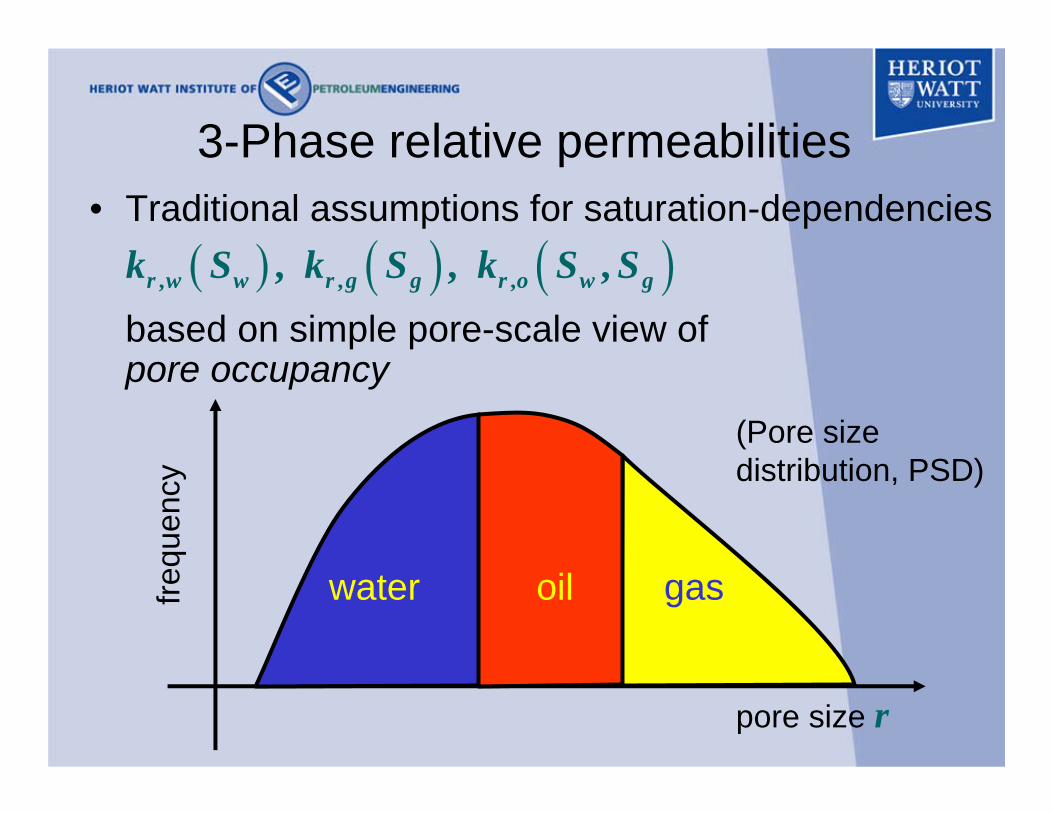
3-Phase relative permeabilities• Traditional assumptions for saturation-dependencies
based on simple pore-scale view ofpore occupancy
( ) ( ) ( ), , ,, , ,r w w r g g r o w gk S k S k S S
frequ
ency
pore size r
(Pore size distribution, PSD)
water oil gas
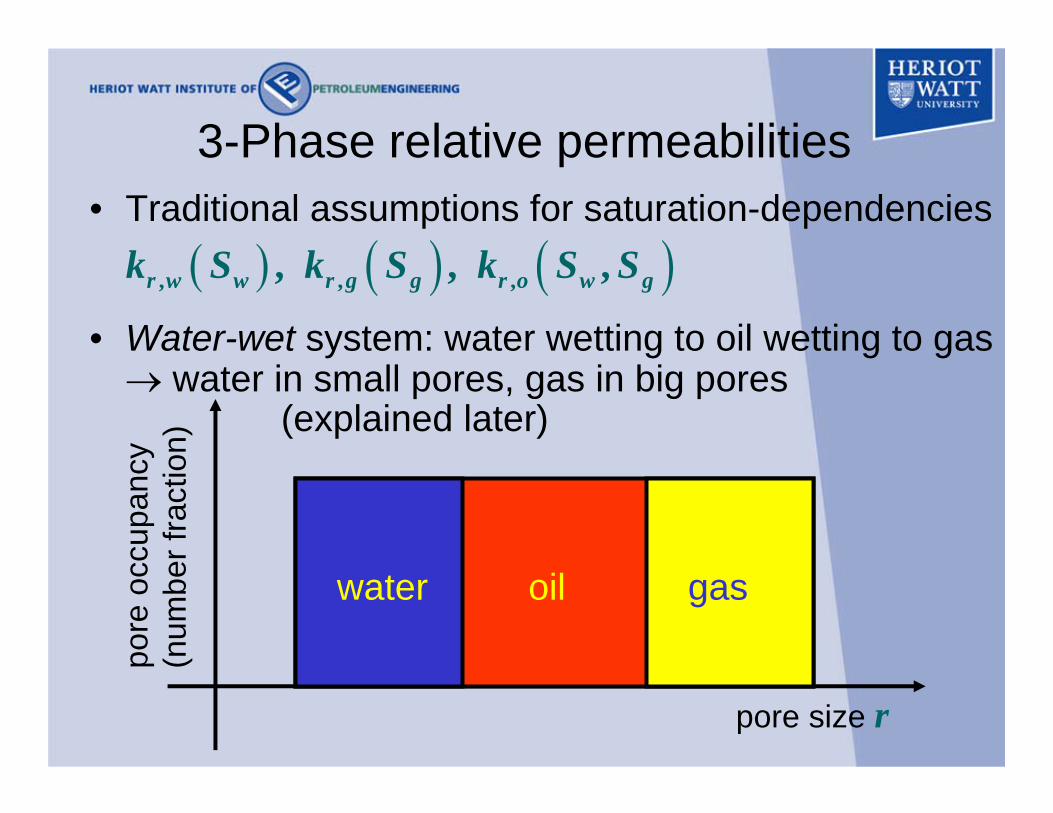
3-Phase relative permeabilities• Traditional assumptions for saturation-dependencies
• Water-wet system: water wetting to oil wetting to gas → water in small pores, gas in big pores
(explained later)
( ) ( ) ( ), , ,, , ,r w w r g g r o w gk S k S k S S
pore
occ
upan
cy
(num
ber f
ract
ion)
pore size r
water oil gas

3-Phase relative permeabilities• Water occupancy same as in two-phase water-oil
system, depends only on water saturation, therefore
( )2, ,
owr w r w wk k S=
pore
occ
upan
cy
(num
ber f
ract
ion)
r
water oil
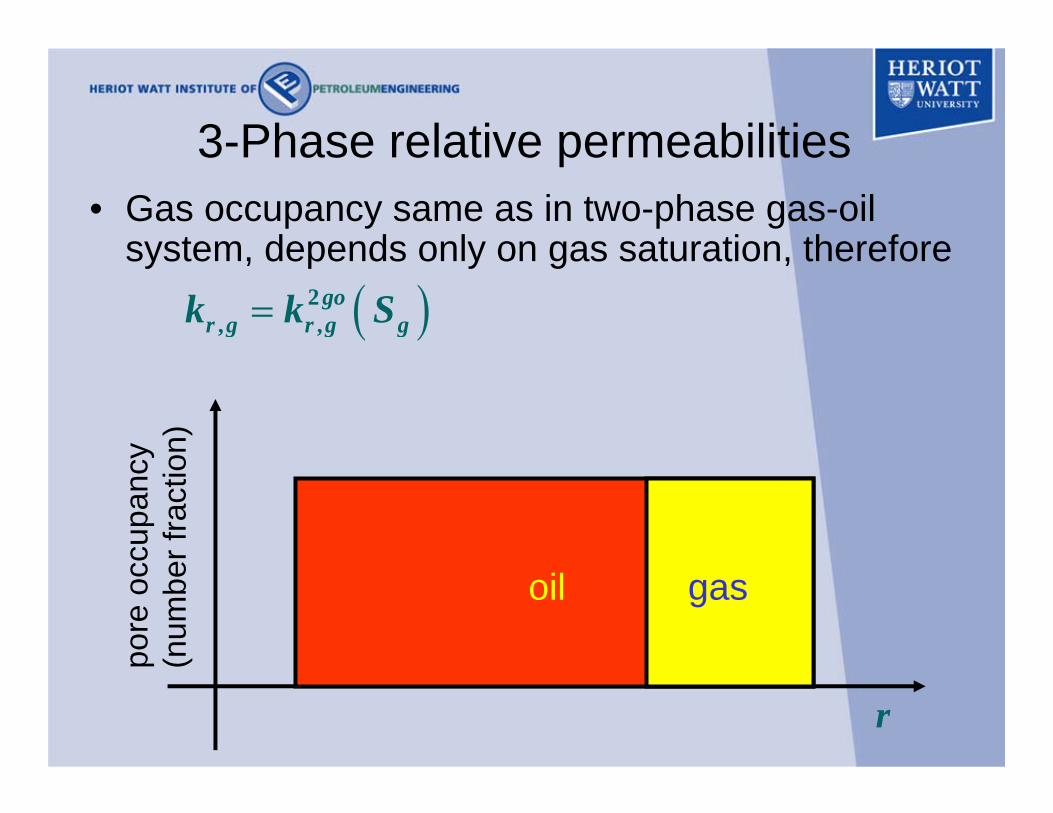
3-Phase relative permeabilities• Gas occupancy same as in two-phase gas-oil
system, depends only on gas saturation, therefore
pore
occ
upan
cy
(num
ber f
ract
ion)
oil gas
( )2, ,
gor g r g gk k S=
r

3-Phase relative permeabilities• Oil occupancy not identical to any two-phase
occupancy, therefore
( ), ,r o w gk S S
pore
occ
upan
cy
(num
ber f
ract
ion)
water oil gas
r

Wettability• Wettability of surface defined in terms of oil-water
contact angle (measured through water)
• Sign of determines wettability of the surface and wetting order of the fluid pair– water-wet if (strongly ww if )
– oil-wet if (strongly ow if )
SOLID SURFACE
wateroilowθ
cos owθ
0cos owθ >0cos owθ <
1cos owθ =1cos owθ = −

Wettability• Wettability of surface defined in terms of oil-water
contact angle (measured through water)
• Sign of determines wettability of the surface and wetting order of the fluid pair (oil and water):– water wetting to oil if
– oil wetting to water if
SOLID SURFACE
wateroilowθ
cos owθ
0cos owθ >0cos owθ <

Wettability• Wettability distributions in a porous medium
– Uniformly water-wet or oil-wet– Distribution of contact angles
0
-1
1water-wet
oil-wet
cos owθ
r 0
-1
1cos owθ
r
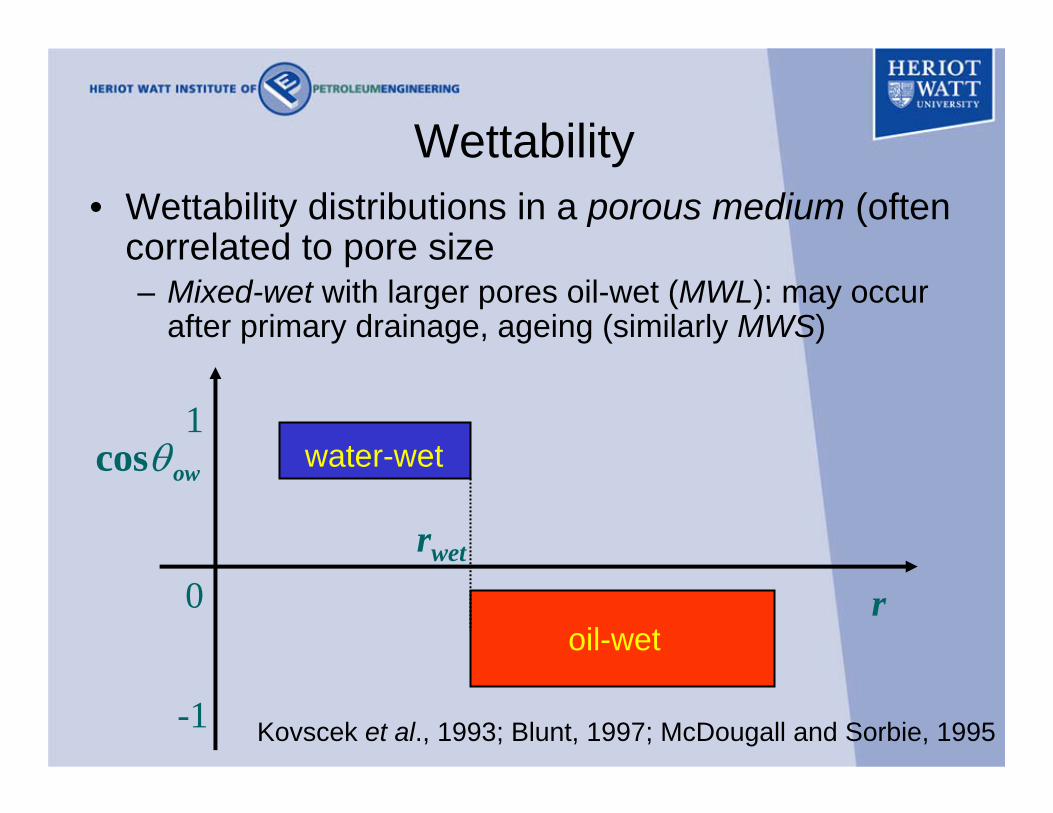
Wettability• Wettability distributions in a porous medium (often
correlated to pore size– Mixed-wet with larger pores oil-wet (MWL): may occur
after primary drainage, ageing (similarly MWS)
r0
-1
1water-wet
oil-wet
cos owθ
rwet
Kovscek et al., 1993; Blunt, 1997; McDougall and Sorbie, 1995

Wettability• Wettability distributions in a porous medium
– Fractionally-wet (FW): caused by mineral distributions, independent of pore size
– Varying fractions of wwet and owet pores
r0
-1
1water-wet
oil-wet
cos owθ
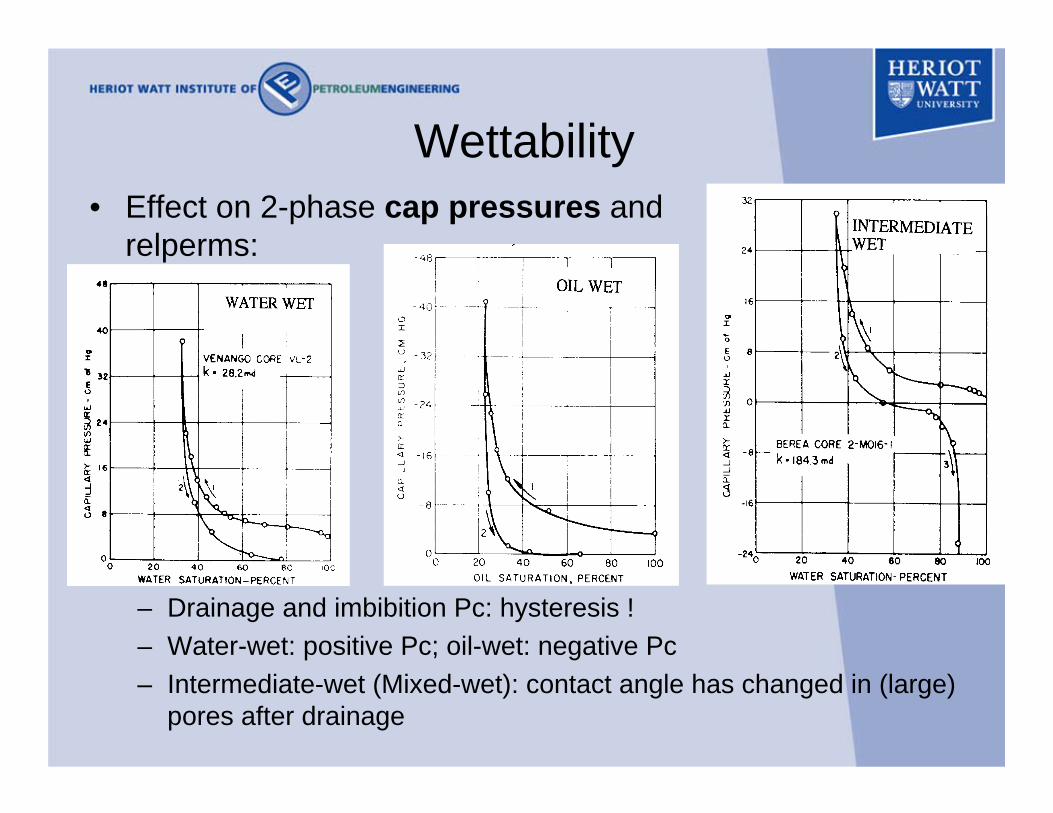
Wettability• Effect on 2-phase cap pressures and
relperms:
– Drainage and imbibition Pc: hysteresis !– Water-wet: positive Pc; oil-wet: negative Pc– Intermediate-wet (Mixed-wet): contact angle has changed in (large)
pores after drainage
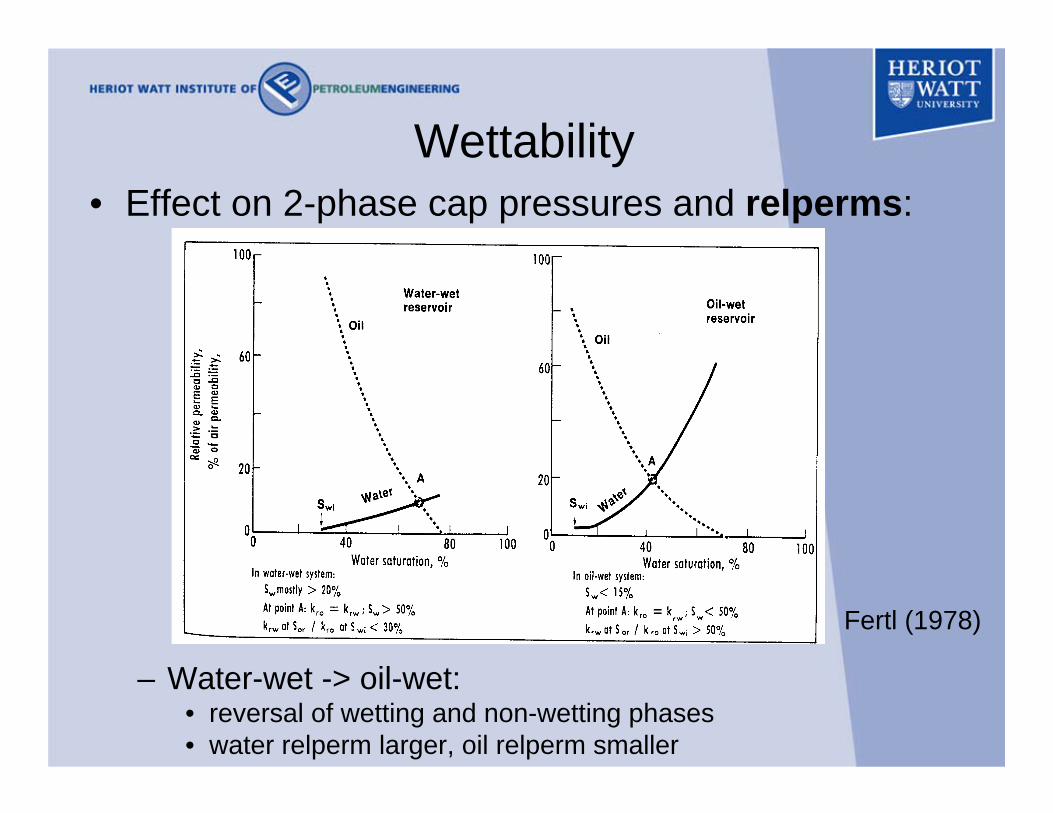
Wettability• Effect on 2-phase cap pressures and relperms:
– Water-wet -> oil-wet: • reversal of wetting and non-wetting phases• water relperm larger, oil relperm smaller
Fertl (1978)
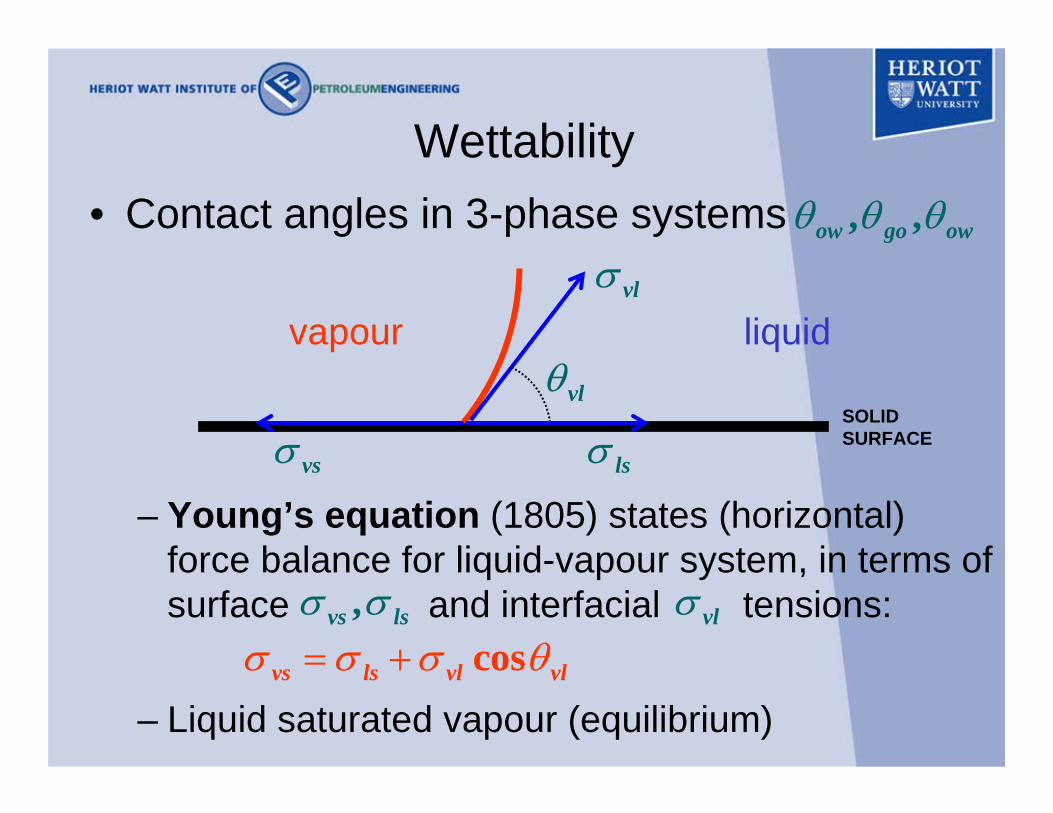
Wettability• Contact angles in 3-phase systems
– Young’s equation (1805) states (horizontal) force balance for liquid-vapour system, in terms of surface and interfacial tensions:
– Liquid saturated vapour (equilibrium)
SOLID SURFACE
liquidvapourvlθ
cosvs ls vl vlσ σ σ θ= +
, ,ow go owθ θ θ
vlσ
lsσvsσ
,vs lsσ σ vlσ

Wettability• Contact angles in 3-phase systems
– Young’s equations for three 2-phase systems, ,ow go owθ θ θ
solid surface
σowoilwater
θow
σws
σos
cosos ws ow owσ σ σ θ= +
solid surface
σgwgaswater
θgw
σws
σgs
cosgs ws gw gwσ σ σ θ= +
solid surface
σgogasoil
θgo
σos
σgs
cosgs os go goσ σ σ θ= +
Eliminateto obtain:
,os ws gsσ σ σand
cos cos cosgw gw ow ow go goσ θ σ θ σ θ= +
(Bartell and Osterhof, 1927; Zhou and Blunt, 1997)

Wettability• Contact angles in 3-phase systems
– 1 constraint: 2 independent contact angle values– To be measured:
• 2 contact angles (difficult)• 3 interfacial tensions
at 3-phase equilibrium: oil spreading coefficient non-positive (Rowlinson & Widom, 1982):
, ,ow go owθ θ θ
0,S o gw go owC σ σ σ= − − ≤
0,S oC <non-spreading: 0,S oC =spreading:
gw ow goσ σ σ> >

Wettability• Contact angles in 3-phase systems
– Usual wetting orders:• water wetting to oil or vice versa both possible
or• oil wetting to gas• water wetting to gas ,
at least for water-wet surface …
, ,ow go owθ θ θ
0cos owθ >0cos goθ >
0cos owθ <
0cos gwθ >

Wettability• Contact angles in 3-phase systems
– Wetting order water to gas:• strongly oil-wet surface:
with Bartell-Osterhof
and :
i.e. gas wetting to water !
, ,ow go owθ θ θ
1cos owθ = − 1cos goθ =
cos coscos go go ow ow go ow
gwgw gw
σ θ σ θ σ σθ
σ σ+ −
= =
ow goσ σ>
0cos gwθ <

Wettability• Contact angles in 3-phase systems
– May use linear relations between (experimentally verified) endpoints for strongly water-wet and oil-wet
– Relations satisfy Bartell-Osterhof
, ,ow go owθ θ θ
+1
cos owθ+1-1
cos goθ
cos gwθ
gw ow
go
σ σσ−
go ow
gw
σ σσ−
wettability ‘below’ which gas wetting to waternon-spreading oil

Capillary bundle model• Invasion of a single tube (cylinder):
– Displacement of water by oil if
with capillary ‘entry’ pressure according to Young-Laplace
– NB: sign of Pc determined by(wettability)
2,
cosow owc owP
rσ θ
=
,ow o w c owP P P P= − >
cos owθ
oP wP

2,
cos( ) ow owc ow j
j
P rr
σ θ=
Capillary bundle model• Invasion of a bundle of tubes (oil into water):
– for increasing oil pressure, tube requiring smallest oil ‘entry’ pressure is invaded first, i.e. for which
is minimum• e.g. uniformly water-wet
oPwP
, ( )o w c owP P P r= +0cos owθ >
1r2r
3r
4r
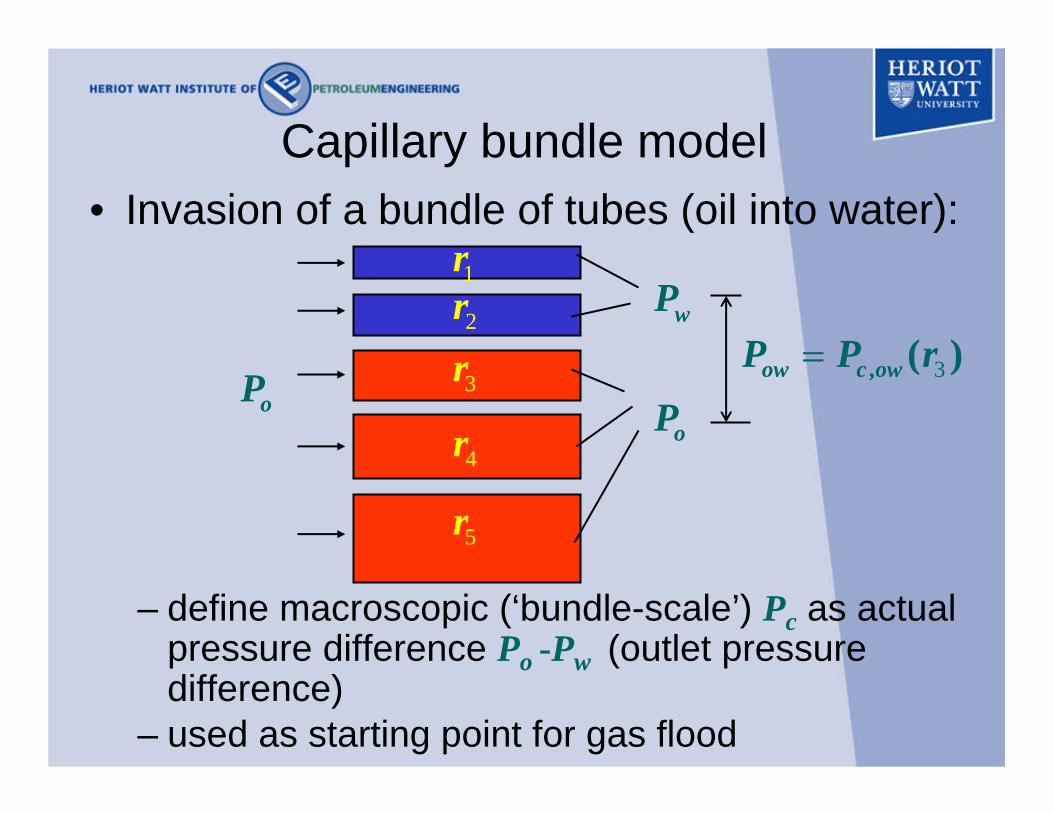
Capillary bundle model• Invasion of a bundle of tubes (oil into water):
– define macroscopic (‘bundle-scale’) Pc as actual pressure difference Po -Pw (outlet pressure difference)
– used as starting point for gas flood
oP
wP
oP3, ( )ow c owP P r=
1r2r
3r
4r
5r
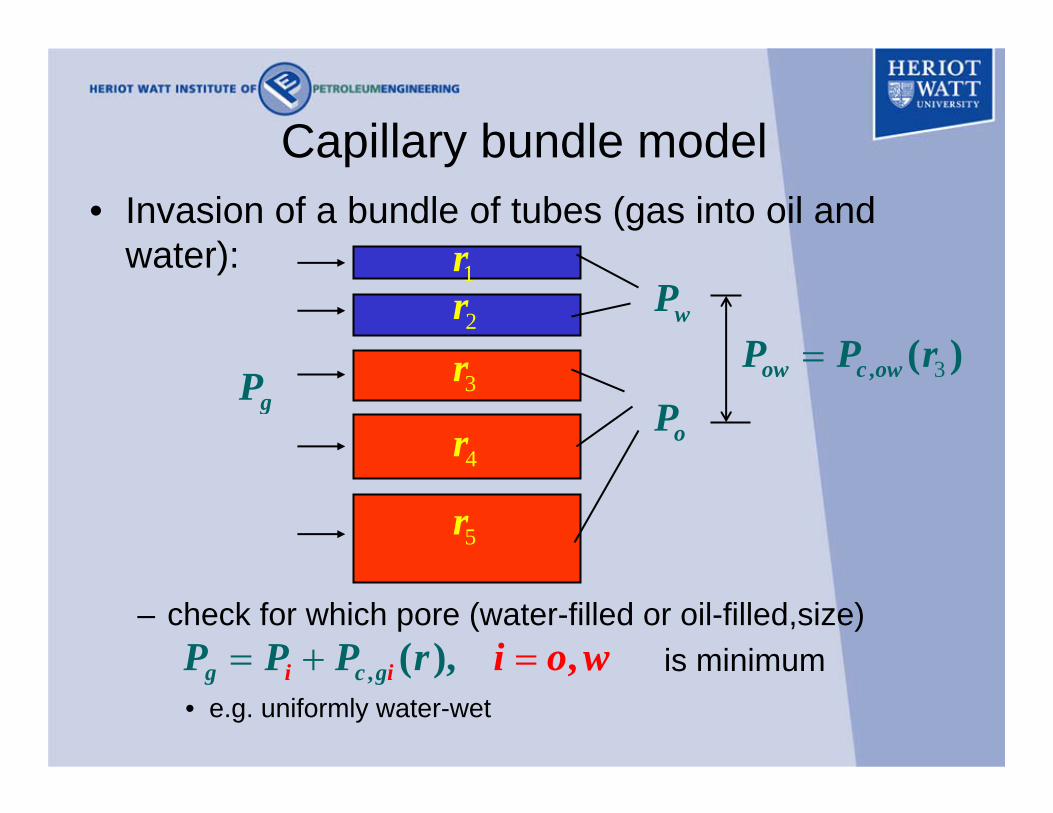
Capillary bundle model• Invasion of a bundle of tubes (gas into oil and
water):
– check for which pore (water-filled or oil-filled,size)is minimum
• e.g. uniformly water-wet
gP
wP
oP
, ,( ),i ig c gP P P r i o w= + =
1r2r
3r
4r
5r
3, ( )ow c owP P r=

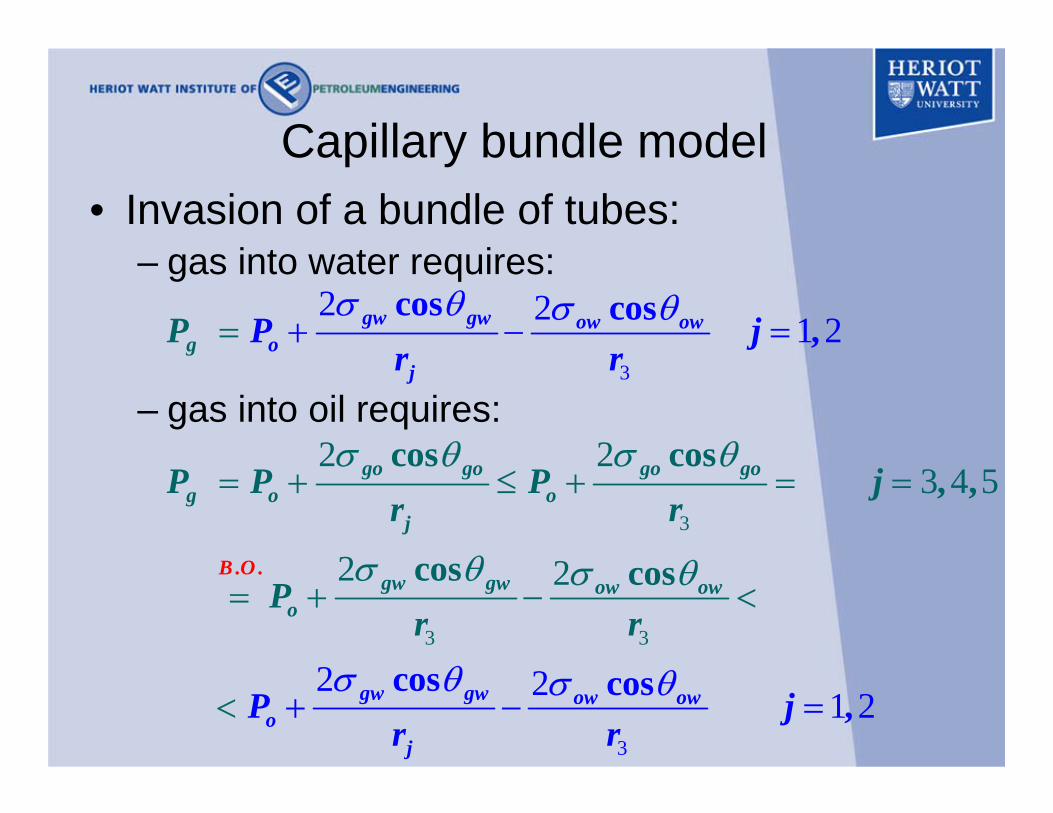
Capillary bundle model• Invasion of a bundle of tubes:
– gas into water requires:
– gas into oil requires:
gP
wP
oP
22
1, ( ) ,cos
g w c gw j wgw gw
j
P P P r P jr
σ θ= + = + =
1r2r
3r
4r
5r
23 4 5,
cos( ) , ,g o c go j
go
go o
j
P P P r P jr
σ θ= + = + =
3, ( )ow c owP P r=

Capillary bundle model• Invasion of a bundle of tubes:
– gas into water requires:
gP
wP
oP
1r2r
3r
4r
5r
3, ( )ow c owP P r=
3
, ,
, ,
( ) ( )
( )( )g c gw o c gw
o c gw
w ow
c ow
P P
P
P P r
r
P P r
P P r
= + = +
+−
=
=
−

Capillary bundle model• Invasion of a bundle of tubes:
– gas into water requires:
– gas into oil requires:3
22 1 2coscos ,gw gwow ow
g oj
P P jr r
σ θσ θ= − + =
23 4 5
cos, ,go go
g oj
P P jr
σ θ= + =
– use Bartell-Osterhof :
and wettability
cos cos cosgo go gw gw ow owσ θ σ θ σ θ= −
0 0cos , cosow goθ θ> >
Capillary bundle model• Invasion of a bundle of tubes:
– gas into water requires:
– gas into oil requires:3
2 2 1 2cos cos ,gw gw w
oj
gow oP j
rP
rσ θ σ θ
+ − ==
3
3 3
3
2 23 4
2 2 1 2
5
2 2. .
cos cos, ,
cos co
cos cos ,
s
go go go gog o o
j
gw gw ow owo
gw gw ow owo
B O
j
P P P jr r
Pr
Pr
r
jr
σ θ σ θ
σ θ σ θ
σ θ σ θ
= + ≤ + = =
= + −
− =
<
< +
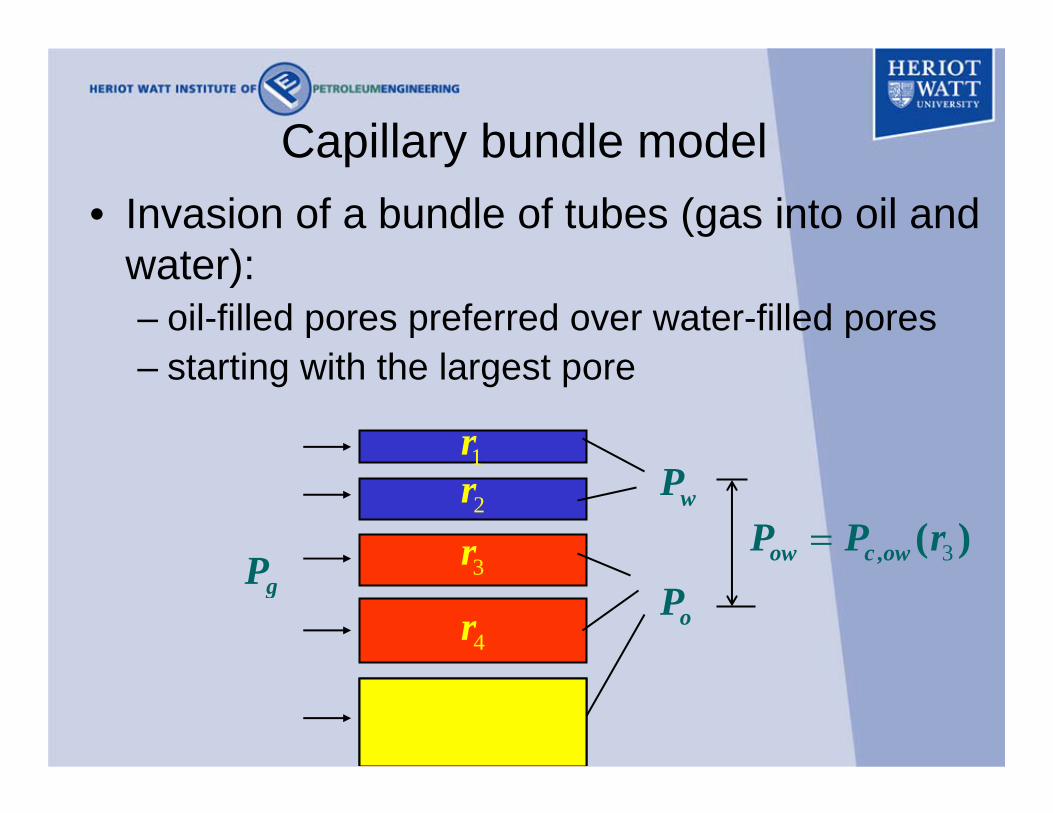
Capillary bundle model• Invasion of a bundle of tubes (gas into oil and
water):– oil-filled pores preferred over water-filled pores– starting with the largest pore
gP
wP
oP
1r2r
3r
4r
5r
3, ( )ow c owP P r=
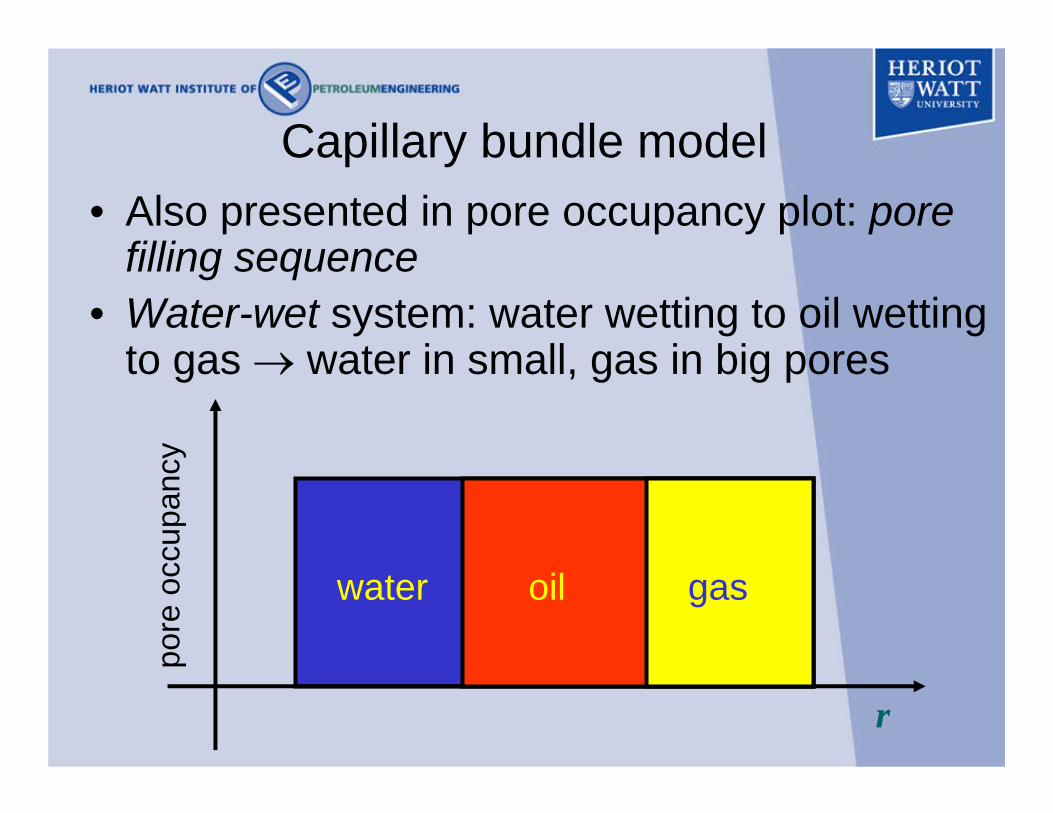
Capillary bundle model• Also presented in pore occupancy plot: pore
filling sequence• Water-wet system: water wetting to oil wetting
to gas → water in small, gas in big pores
pore
occ
upan
cy
oilwater gas
r

2. Saturation-dependencies of 3-phase relative permeabilities (using a
capillary bundle model)
• Occupancies and filling sequences• Dependency regions• Probabilistic model for distributed contact
angles
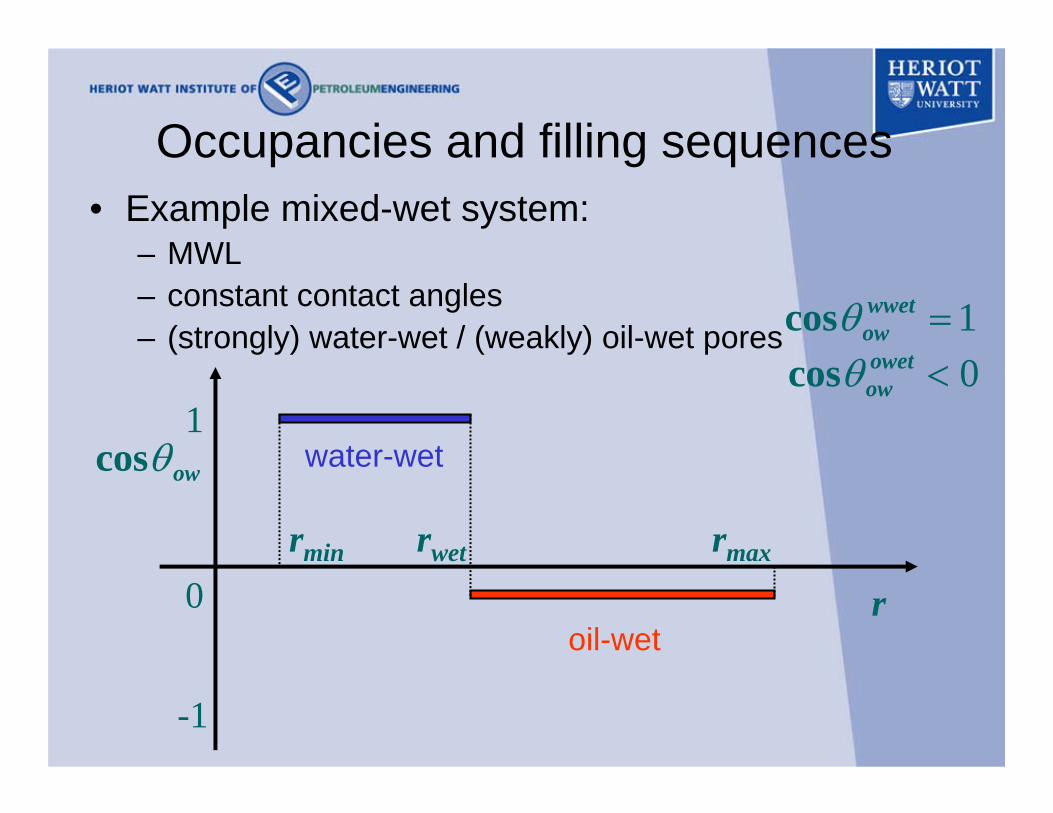
Occupancies and filling sequences• Example mixed-wet system:
– MWL– constant contact angles– (strongly) water-wet / (weakly) oil-wet pores
r0
-1
1water-wet
oil-wet
cos owθ
rwetrmin rmax
1cos wwetowθ =
0cos owetowθ <

rmax
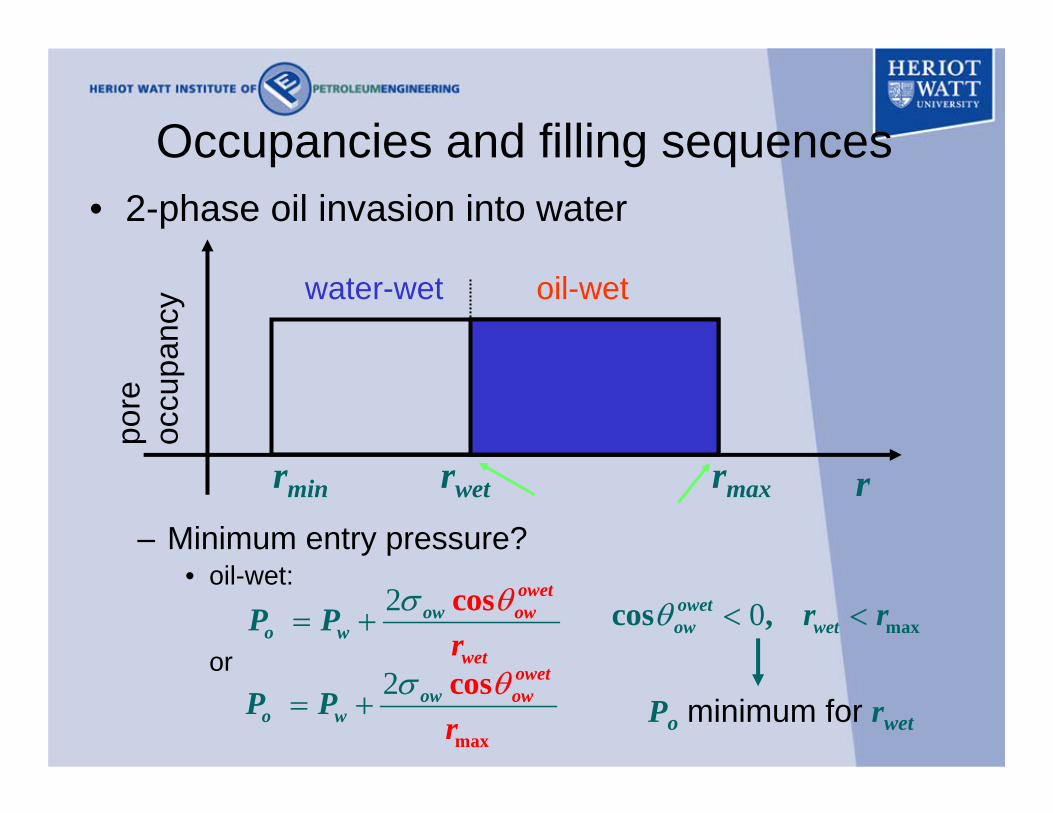
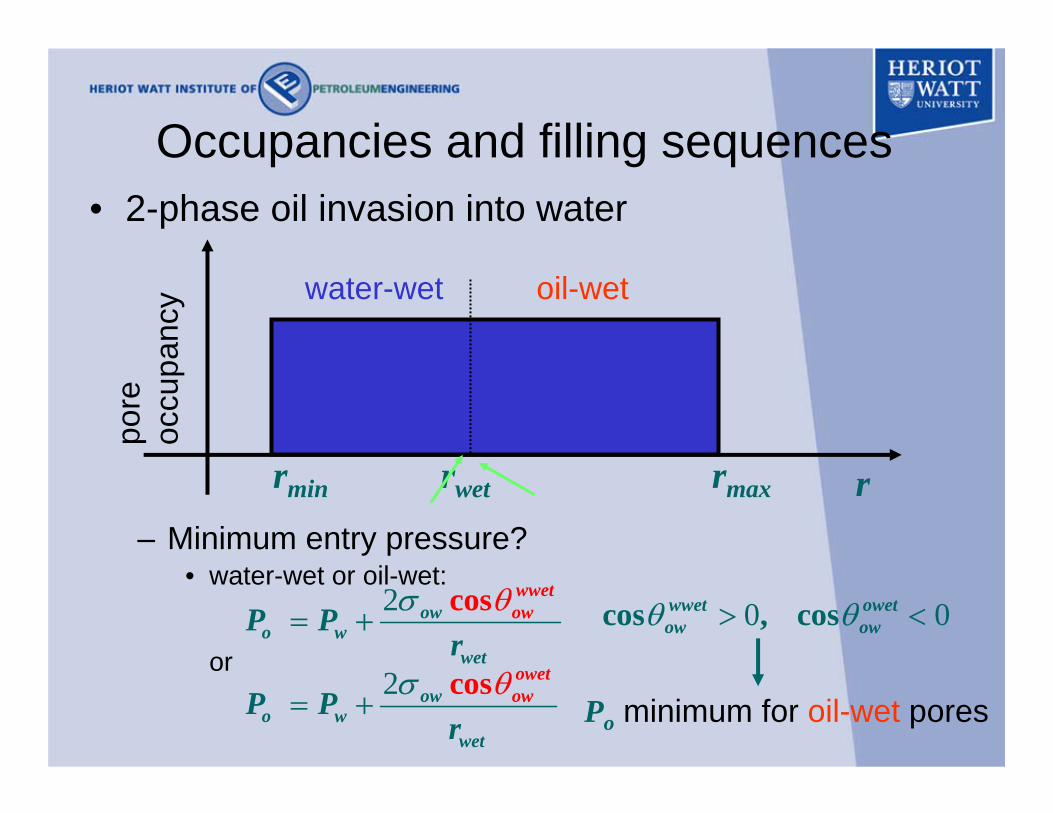
Occupancies and filling sequences• 2-phase oil invasion into water
– Minimum entry pressure?• water-wet:
or
rrwetrmin
pore
oc
cupa
ncy water-wet oil-wet
2
min
cos wwetowow
o wPr
P θσ= +
2 cos wwetoo w
wet
wo w r
P P σ θ= +
0 mincos ,wwetow wetr rθ > <
Po minimum for rwet
rmax
Occupancies and filling sequences• 2-phase oil invasion into water
– Minimum entry pressure?• oil-wet:
or
rrwetrmin
pore
oc
cupa
ncy water-wet oil-wet
2 cos owetoo w
wet
wo w r
P P σ θ= +
2
max
cos owetowow
o wPr
P θσ= +
0 maxcos ,owetow wetr rθ < <
Po minimum for rwet
rmax
Occupancies and filling sequences• 2-phase oil invasion into water
– Minimum entry pressure?• water-wet or oil-wet:
or
rrwetrmin
pore
oc
cupa
ncy water-wet oil-wet
2 cos wwetoo ww
o wwet
P Pr
σ θ= +
2 cos owetoo ww
o wwet
P Pr
σ θ= +
0 0cos , coswwet owetow owθ θ> <
Po minimum for oil-wet pores

rmax
Occupancies and filling sequences• 2-phase oil invasion into water
– Filling occurs in oil-wet pores in increasing size, followed by water-wet pores in decreasing size
– Finishes at row,1 , e.g. related to connate water, with
rrwetrmin
pore
oc
cupa
ncy water-wet oil-wet
row,1
1
2
,
cos wwetow ow
owow
Pr
σ θ=
rmax
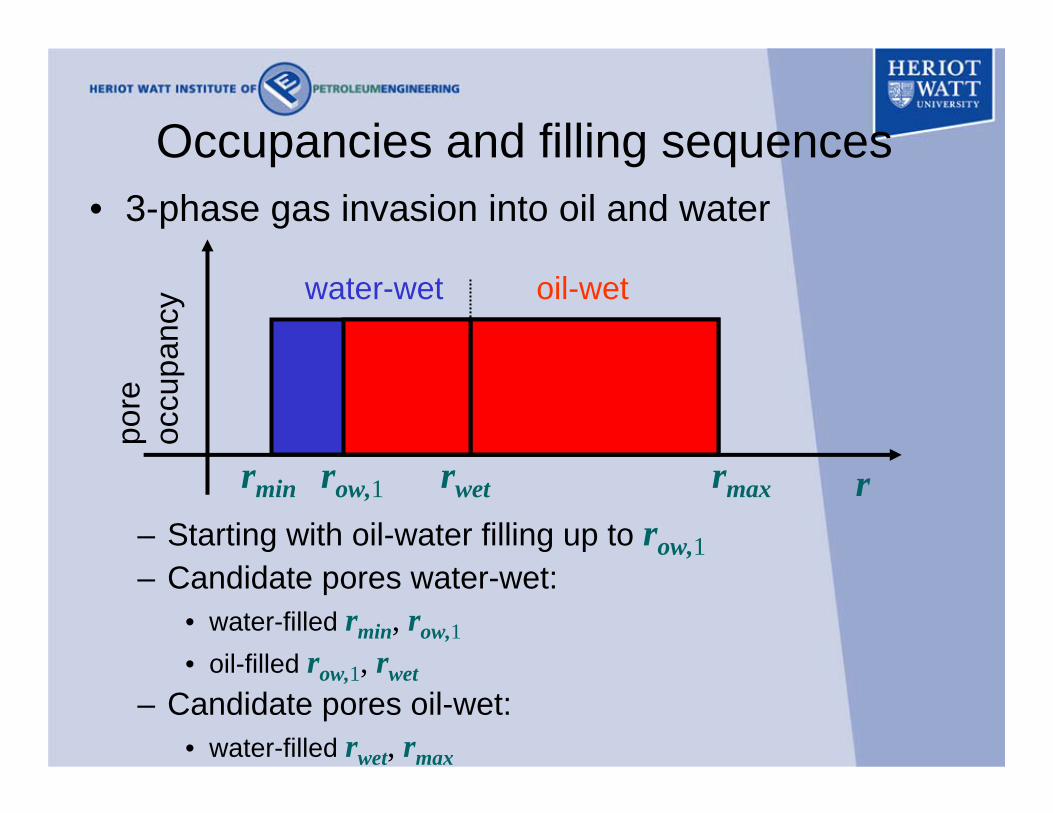
Occupancies and filling sequences• 3-phase gas invasion into oil and water
– Starting with oil-water filling up to row,1– Candidate pores water-wet:
• water-filled rmin, row,1• oil-filled row,1, rwet
– Candidate pores oil-wet: • water-filled rwet, rmax
rrwetrmin
pore
oc
cupa
ncy water-wet oil-wet
row,1
rmax
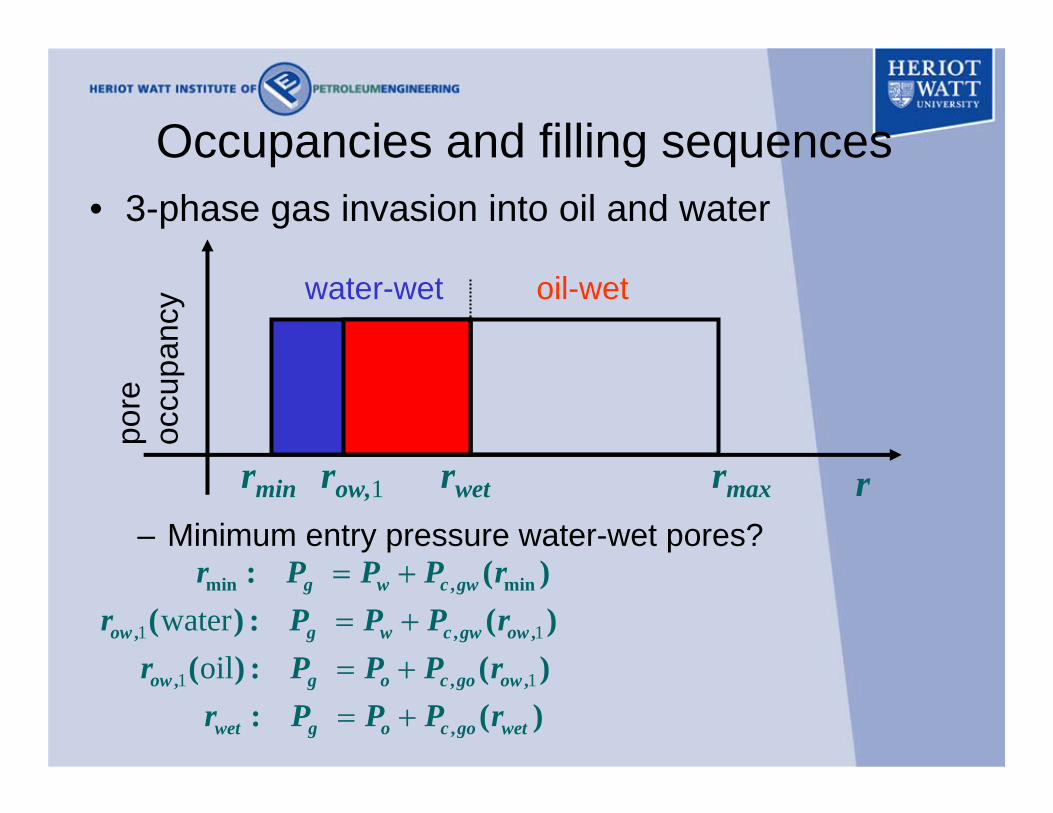
Occupancies and filling sequences• 3-phase gas invasion into oil and water
– Minimum entry pressure water-wet pores?rrwetrmin
pore
oc
cupa
ncy water-wet oil-wet
row,1
min , min: ( )g w c gwr P P P r= +
1 1water, , ,( ) : ( )ow g w c gw owr P P P r= +
,: ( )wet g o c go wetr P P P r= +1 1oil, , ,( ) : ( )ow g o c go owr P P P r= +

rmax
Occupancies and filling sequences• 3-phase gas invasion into oil and water
– Minimum entry pressure water-wet pores?rrwetrmin
pore
oc
cupa
ncy water-wet oil-wet
row,1
1,min , in, m: (( ) )o c og w w go c wP P rr P P r+−=
1 1 1water, , ,, ,( ) (): )(o c oow g c gwow owwP PP rr P r−= +
,: ( )wet g o c go wetr P P P r= +1 1oil, , ,( ) : ( )ow g o c go owr P P P r= +

rmax
Occupancies and filling sequences• 3-phase gas invasion into oil and water
– Minimum entry pressure water-wet pores?rrwetrmin
pore
oc
cupa
ncy water-wet oil-wet
row,1
1min , , , min: ( ) ( )g o c ow ow c gwr P P P r P r= − +
1 11 1water , , , , , ,,
. .( ) ( ) ( )( ) : c ow ow c gw ow c goow wo og o
B OP r P r P rr P P P+− == +
,: ( )wet g o c go wetr P P P r= +1 1oil, , ,( ) : ( )ow g o c go owr P P P r= +
consistency

rmax
Occupancies and filling sequences• 3-phase gas invasion into oil and water
– Minimum entry pressure water-wet pores?rrwetrmin
pore
oc
cupa
ncy water-wet oil-wet
row,1
1min , , , min: ( ) ( )g o c ow ow c gwr P P P r P r= − +
1 1water, , ,( ) : ( )ow g o c go owr P P P r= +
,: ( )wet g o c go wetr P P P r= +1 1oil, , ,( ) : ( )ow g o c go owr P P P r= +
increasing pressure: filling order
minimum

rmax
Occupancies and filling sequences• 3-phase gas invasion into oil and water
– Minimum entry pressure oil-wet pores?rrwetrmin
pore
oc
cupa
ncy water-wet oil-wet
row,1
,: ( )wet g o c go wetr P P P r= +
max , max: ( )g o c gor P P P r= +increasing pressure: filling order
minimum

rmax
Occupancies and filling sequences• 3-phase gas invasion into oil and water
– Minimum entry pressure water-wet vs. oil-wet pores?rrwetrmin
pore
oc
cupa
ncy water-wet oil-wet
row,1
water w2
- et ,( ) : (c s
)o
wet g o c go wet o
wwetgo go
wet
r P P rr
P Pσ θ
= + = +
oi - e2
l w tmax , maxmax
( ) : ( )cos owet
go gg o c go o
or P P P r Pr
σ θ= + = +

Occupancies and filling sequences• 3-phase gas invasion into oil and water
and
• No definiteordering ofentry pressures!– gas may invade
water-wet andoil-wet poressimultaneously
maxwetr r<
cos coswwet owetgo goθ θ<
cos owθ
cos goθ
cos owetowθ cos wwet
owθ
cos wwetgoθ
cos owetgoθ
water-wet2
( )cos
:wet g o
wwetgo go
wetrr P P
σ θ= +
oil-wet2
mmax
ax
( ) :cos
g o
owetgo gor P P
rσ θ
= +

rmax
Occupancies and filling sequences• 3-phase gas invasion into oil and water
– Filling occurs in decreasing size in both oil-wet and water-wet pores and may occur simultaneously
– Arrives at rgo,1 , and rgo,2, with
rrwetrmin
pore
oc
cupa
ncy water-wet oil-wet
1 2
2 2
, ,
cos coswwet owetgo go go go
gogo go
Pr r
σ θ σ θ= =
rgo,1 rgo,2row,1
rmax
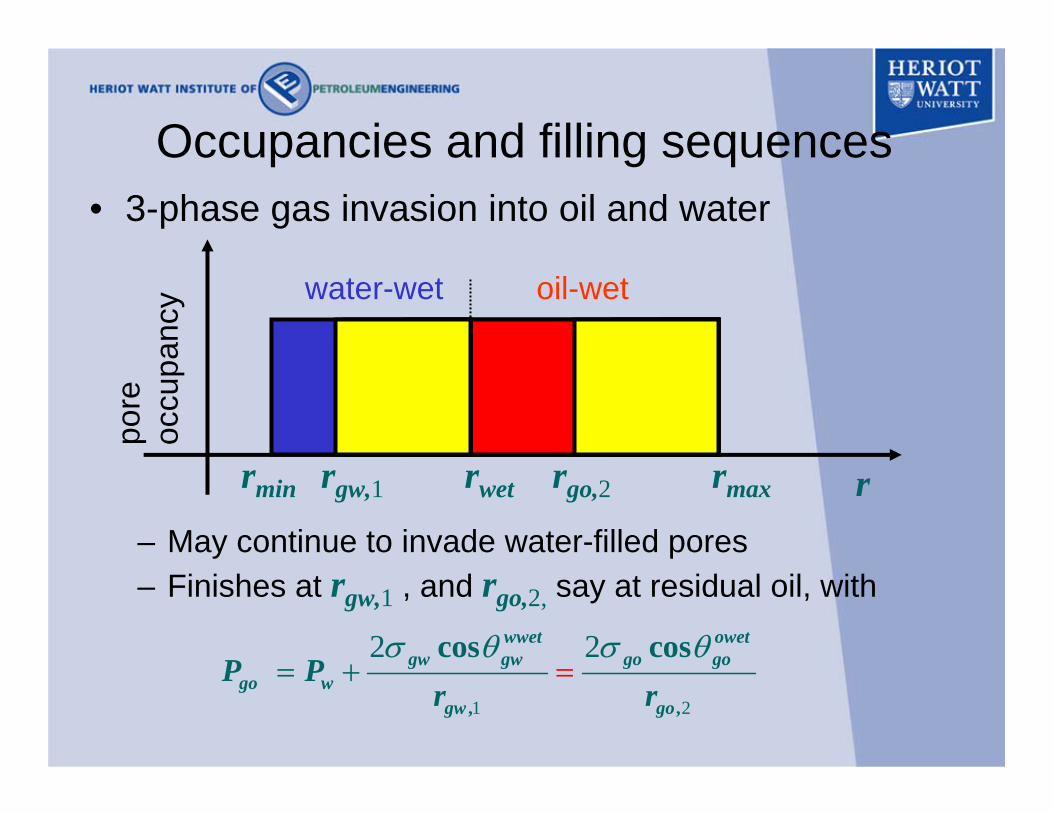
Occupancies and filling sequences• 3-phase gas invasion into oil and water
– May continue to invade water-filled pores– Finishes at rgw,1 , and rgo,2, say at residual oil, with
rrwetrmin
pore
oc
cupa
ncy water-wet oil-wet
1 2
2 2
, ,
cos coswwet owetgw gw go go
go wgw go
P Pr r
σ θ σ θ+ ==
rgw,1 rgo,2

rmax
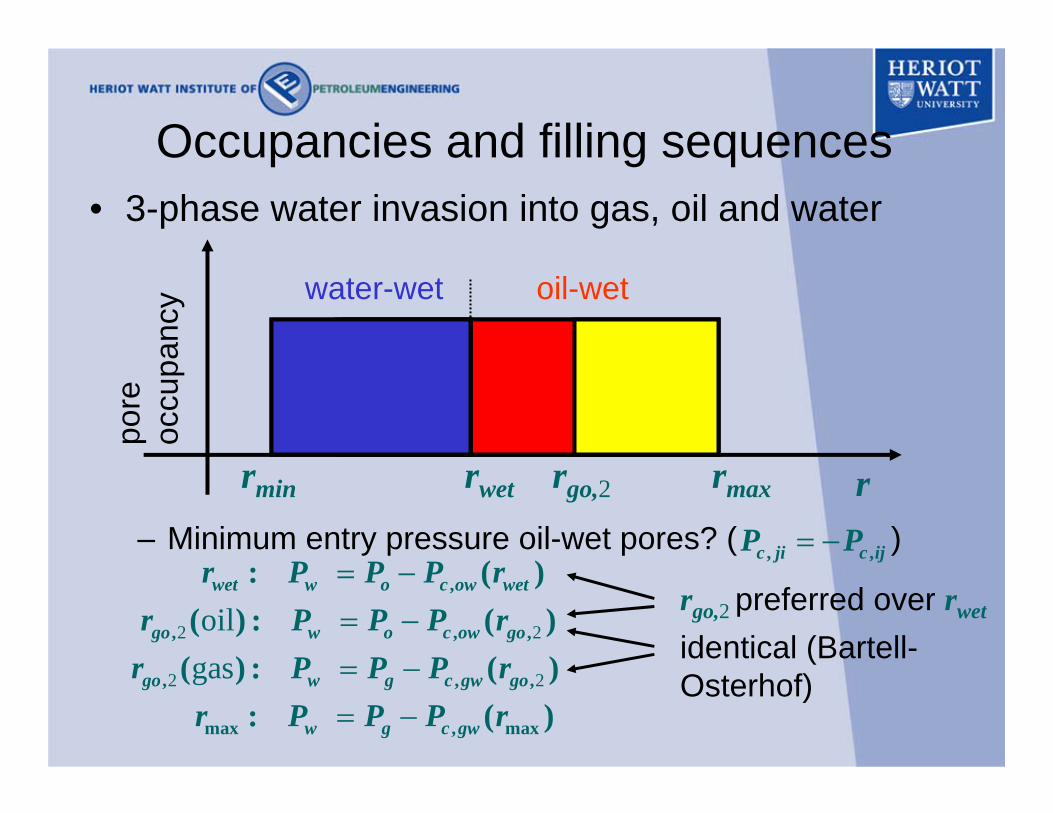
Occupancies and filling sequences• 3-phase water invasion into gas, oil and water
– Starts invading gas-filled water-wet pores at rgw,1– Minimum entry pressure oil-wet pores?
rrwetrmin
pore
oc
cupa
ncy water-wet oil-wet
rgw,1 rgo,2
rmax
Occupancies and filling sequences• 3-phase water invasion into gas, oil and water
– Minimum entry pressure oil-wet pores? ( )
rrwetrmin
pore
oc
cupa
ncy water-wet oil-wet
rgo,2
,: ( )wet w o c ow wetr P P P r= −
2 2oil, , ,( ) : ( )go w o c ow gor P P P r= −
max , max: ( )w g c gwr P P P r= −2 2gas, , ,( ) : ( )go w g c gw gor P P P r= −
rgo,2 preferred over rwet
identical (Bartell-Osterhof)
, ,c ji c ijP P= −
rmax
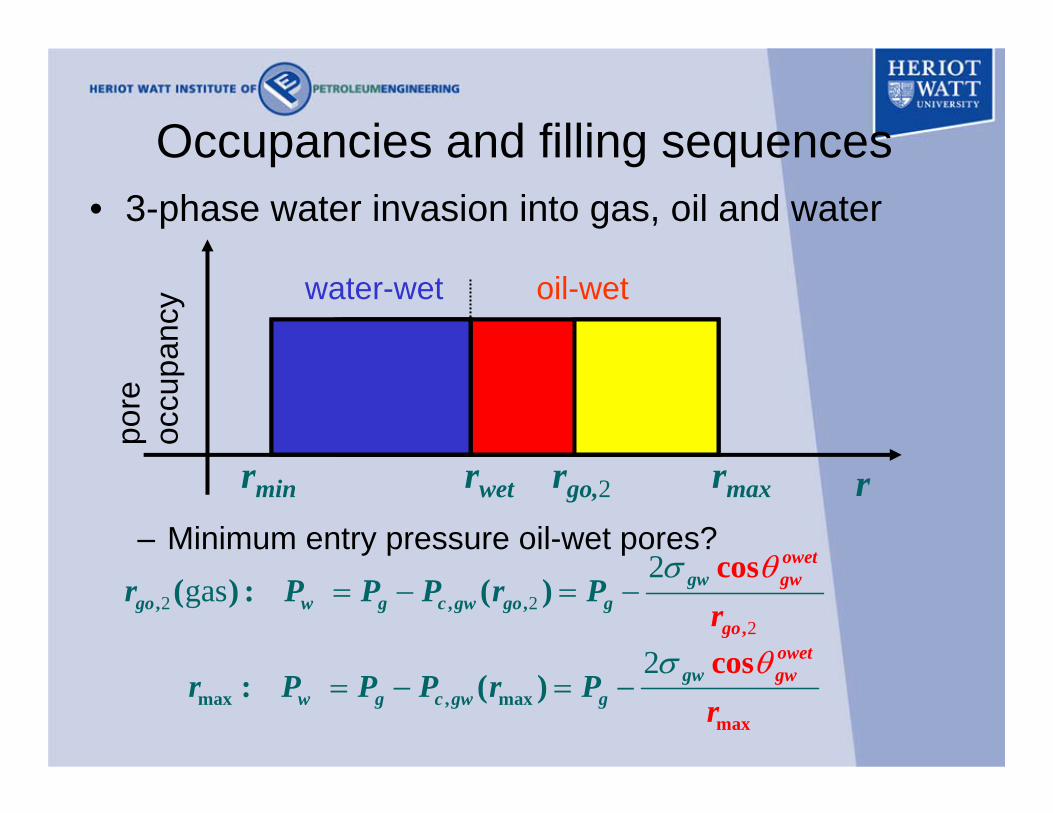
Occupancies and filling sequences• 3-phase water invasion into gas, oil and water
– Minimum entry pressure oil-wet pores?
rrwetrmin
pore
oc
cupa
ncy water-wet oil-wet
rgo,2
2
maxmax , max: ( )
cosgww
ow
g c gww
g
etgr P P P r
rP
θσ= − = −
22
2
2gas, , ,
,
c) )
s(
o( : gw
go w g c gw go g
owetgw
go
r P P P r Pr
σ θ= − = −

Occupancies and filling sequences• 3-phase water invasion into gas, oil and water
and
– Water wetting to gas in weaklyoil-wet pores
– Minimum entry pressure oil-wet pores?
cos owθ
cos gwθ2, maxgor r<
0cos owetgwθ >
cos owetowθ
cos wwetgwθ
2
mama
xx :
cosgwowetg
w gw
rr P P
σ θ= −
22
2gas
,, ( ) :
cosgwgo w
owetgw
gogr P P
rσ θ
= − minimum

rmax
Occupancies and filling sequences• 3-phase water invasion into gas, oil and water
– Water invades oil-filled and gas-filled pores simultaneously, starting from rgo,2
rrwetrmin
pore
oc
cupa
ncy water-wet oil-wet
rgo,2
2 2gas, , ,( ) : ( )go w g c gw gor P P P r= −
2 2 2 2
2
oil. .
,
, , , , , ,
,
,( ) : ( ) ( ) ( )
( )B O
g c gw go
go w o c ow go g c go go c ow gor P P P r P P r P
P P r
r= − = − − =
= −

rmax
Occupancies and filling sequences• Types of occupancies
– Type I: oil has ‘boundaries’ with both water and gas i.e. oil invasion leads to displacement of both gas and water
⇒ oil is the intermediate-wetting phase
rrwetrmin
pore
oc
cupa
ncy water-wet oil-wet

Occupancies and filling sequences• Types of occupancies
– Type II: gas has ‘boundaries’ with both oil and water
⇒ gas is the intermediate-wetting phase
rmax rrwetrmin
pore
oc
cupa
ncy water-wet oil-wet

Occupancies and filling sequences• Types of occupancies
– Type III: water has ‘boundaries’ with both oil and gas
⇒ water is the intermediate-wetting phase
rrmaxrwetrmin
pore
oc
cupa
ncy water-wet oil-wet

Saturation-dependencies• For the different types of occupancies
– how do the relperms depend on phase saturations?– relation between 2-phase and 3-phase relperms?
• Definitions of saturation and relperm for capillary bundle:
– Pore size distribution– Phase j occupancy function– Volume function– Conduction function (e.g. Poiseuille)
( ) ( ) ( )j jo
S r r V r drπ ϕ∞
= ∫
( )j rπ
, ( ) ( ) ( )r j jo
k r r g r drπ ϕ∞
= ∫( )rϕ
2( )V r r∝4( )g r r∝

Saturation-dependencies• Definitions of saturation and relperm for capillary
bundle, for example:
rmax rrwetrmin
pore
oc
cupa
ncy water-wet oil-wet
rgo,2
21 for
0 otherwise,( ) wet go
o
r r rrπ
< <⎧= ⎨⎩
2,
( ) ( )go
wet
r
or
S r V r drϕ= ∫2,
, ( ) ( )go
wet
r
r or
k r g r drϕ= ∫

Saturation-dependencies• Paths in saturation space: gas flood into oil, followed
by water flood into gas and oil
oil water
gas
gas flood
water flood
I
III
II

Saturation-dependencies• Paths in saturation space: water floods starting at
different gas saturations
oil water
gas
lines of constant Pgo
3 regions in saturation space
III
III

Saturation-dependencies• Paths in saturation space: gas floods starting at
different water saturations
oil water
gas
lines of constant Pow
3 regions in saturation space
III
III

Saturation-dependencies• Regions in saturation space: iso-capillary pressure
curves
II II( )go oP S ( , )ow w oP S S
II
gas is “intermediate-wetting”

Saturation-dependencies• Regions in saturation space: iso-relative
permeability curves
II II, ( )r o ok S , ( , )r g w ok S S
gas is “intermediate-wetting”
II

rmax
Saturation-dependencies• Type I: oil is intermediate-wetting
rrwetrmin
pore
oc
cupa
ncy water-wet oil-wet
,
, , ,
( ), ( ), ( )
( ), ( ), ( , )ow w go g gw w g
r w w r gg og r w
P S P S P S
k
S
Sk S SS k

Saturation-dependencies• Type II: gas is intermediate-wetting
rmax rrwetrmin
pore
oc
cupa
ncy water-wet oil-wet
,
, , ,
( ), ( ), ( )
( ), ( ), ( , )gw w go o ow w o
r w w r oo go r w
P S P S P S
k
S
Sk S SS k

Saturation-dependencies• Type III: water is intermediate-wetting
rrmaxrwetrmin
pore
oc
cupa
ncy water-wet oil-wet
,
, , ,
( ), ( ), ( )
( ), ( ), ( , )gw g ow o go o g
r g g r go wo r o
P S P S P S
k
S
Sk S SS k

rmax
Saturation-dependencies• Link 2-phase and 3-phase relperms
– Type I: oil is intermediate-wetting
rrwetrmin
pore
oc
cupa
ncy water-wet oil-wet

rmax
Saturation-dependencies• Link 2-phase and 3-phase relperms
– Type I: oil is intermediate-wetting
rrwetrmin
pore
oc
cupa
ncy water-wet oil-wet
water occupancy same as for oil-water

rmax
Saturation-dependencies• Link 2-phase and 3-phase relperms
– Type I: oil is intermediate-wetting
rrwetrmin
pore
oc
cupa
ncy water-wet oil-wet
water occupancy same as for oil-watergas occupancy same as for gas-oil
oil occupancy different from any 2-phase occupancy

rmax
Saturation-dependencies• Link 2-phase and 3-phase relationships
– Type I: oil is intermediate-wetting
rrwetrmin
pore
oc
cupa
ncy water-wet oil-wet
2,, ,( ) ( )ow
r w w r w wk S k S=

rmax
Saturation-dependencies• Link 2-phase and 3-phase relationships
– Type I: oil is intermediate-wetting
rrwetrmin
pore
oc
cupa
ncy water-wet oil-wet
2,, ,( ) ( )ow
r w w r w wk S k S=2,
, ,( ) ( )gor g g r g gk S k S=
2 21 , ,, , , ,( ) ( ) ( )go ow
r o w g r g g r w wk S S k S k S= − −

Saturation-dependencies• Link 2-phase and 3-phase relationships
– Type II: gas is intermediate-wetting
rmax rrwetrmin
pore
oc
cupa
ncy water-wet oil-wet

Saturation-dependencies• Link 2-phase and 3-phase relationships
– Type II: gas is intermediate-wetting
rmax rrwetrmin
pore
oc
cupa
ncy water-wet oil-wet
2,, ,( ) ( )ow
r w w r w wk S k S=

Saturation-dependencies• Link 2-phase and 3-phase relationships
– Type II: gas is intermediate-wetting
rmax rrwetrmin
pore
oc
cupa
ncy water-wet oil-wet
2,, ,( ) ( )ow
r w w r w wk S k S=2,
, ,( ) ( )gor o o r o ok S k S≠
Non-genuine dependency: result of simultaneous invasion water-wet and oil-wet pores
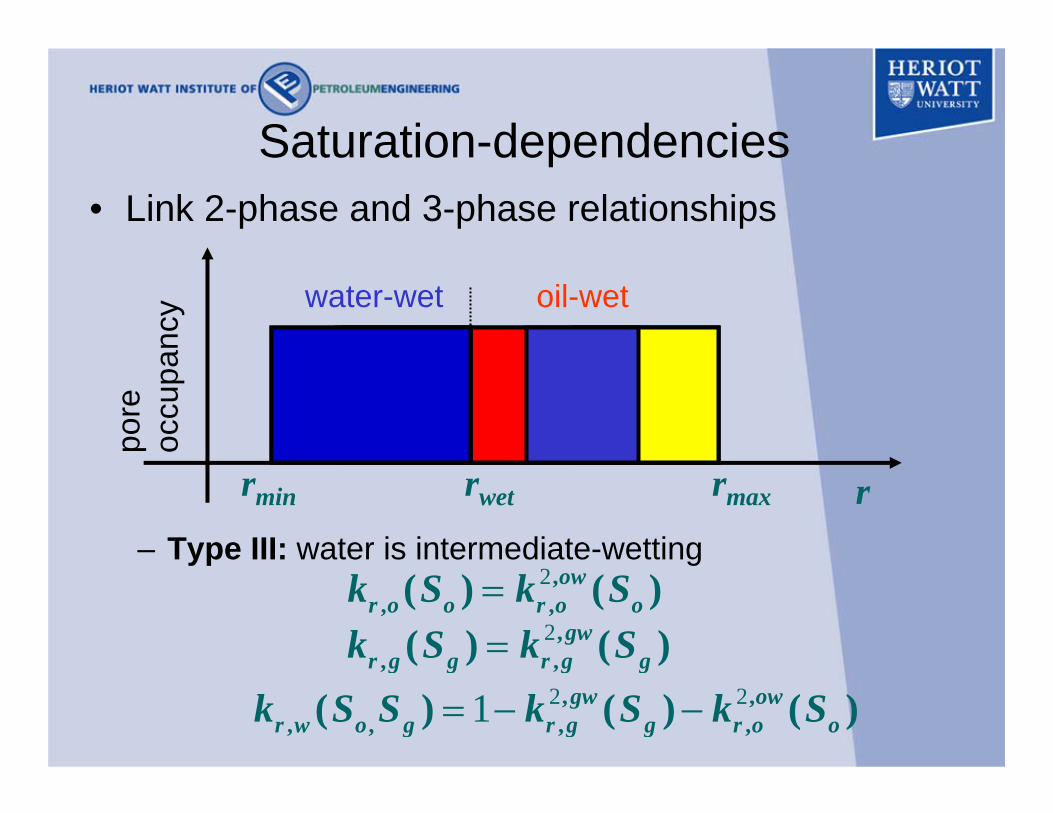
Saturation-dependencies• Link 2-phase and 3-phase relationships
– Type III: water is intermediate-wetting
rrmaxrwetrmin
pore
oc
cupa
ncy water-wet oil-wet
2,, ,( ) ( )gw
r g g r g gk S k S=2 21 , ,
, , , ,( ) ( ) ( )gw owr w o g r g g r o ok S S k S k S= − −
2,, ,( ) ( )ow
r o o r o ok S k S=

Saturation-dependencies• Three phase occupancy / dependency types:
– Type I: oil is intermediate-wetting phase– Type II: gas is intermediate-wetting phase– Type III: water is intermediate-wetting phase
• Relperm of intermediate-wetting phase depends on two saturations (similar conclusion for cap pressures)
• Relperms of remaining two phases depend on their own saturations (single-phase dependency)
• Single-phase dependencies can be non-genuine: no link between 2-phase and 3-phase relperms
• In saturation space regions of each dependency may occur
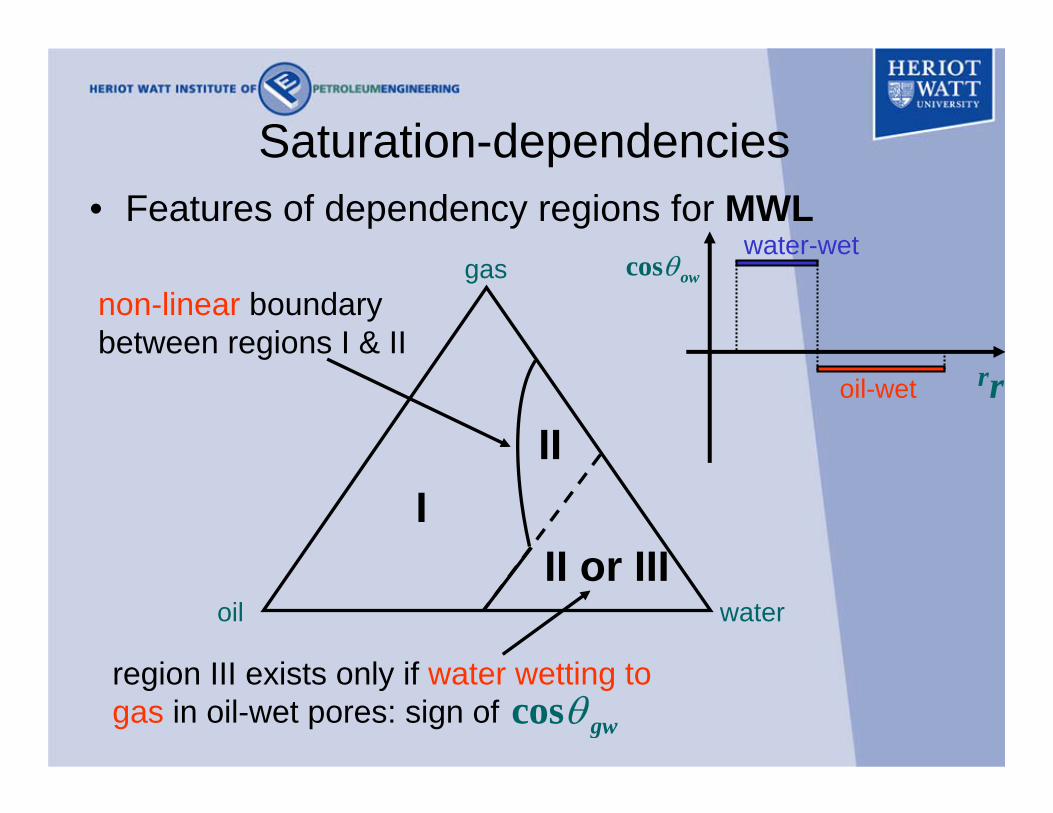
Saturation-dependencies• Features of dependency regions for MWL
II or IIII
II
non-linear boundary between regions I & II
cos gwθregion III exists only if water wetting to gas in oil-wet pores: sign of
gas
oil water
r
water-wet
oil-wet
cos owθ
r

2,, ,( ) ( )go
r o o r o ok S k S≠
2,, ,( ) ( )gw
r w w r w wk S k S≠
Saturation-dependencies• Features of dependency regions for FW
location of boundaries also determines non-genuine behaviour
gas
oil water
r
water-wet
oil-wet
cos owθ
r
IIII
II
2 non-linearboundaries

• numerical example FW
gas isoperms
II
IIII
0.09
0.99
Saturation-dependencies
36 14 29 mN/m, ,gw go owσ σ σ= = = 0 6 0 1cos . , cos .wwet owetow owθ θ= = −
10 m 160 mmin min,r rµ µ= =
oil isoperms
0.01
0.91

Distributed contact angles
• Multiple phase occupancy for given pore size
0
-1
1water-wet
oil-wet
cos owθ
minrwetr maxr
r
rmax rrwetrmin
pore
oc
cupa
ncy water-wet oil-wet

,( ) ( )owo ow c owr P P rπ ⎡ ⎤= >⎣ ⎦P
Distributed contact angles• View occupancy that pore is occupied by a
given phase as the probability that the corresponding entry pressure(s) are overcome– for example in 2-phase oil-water system, pore
occupied by oil if– then oil occupancy given by
,ow c owP P>
( )owo rπ
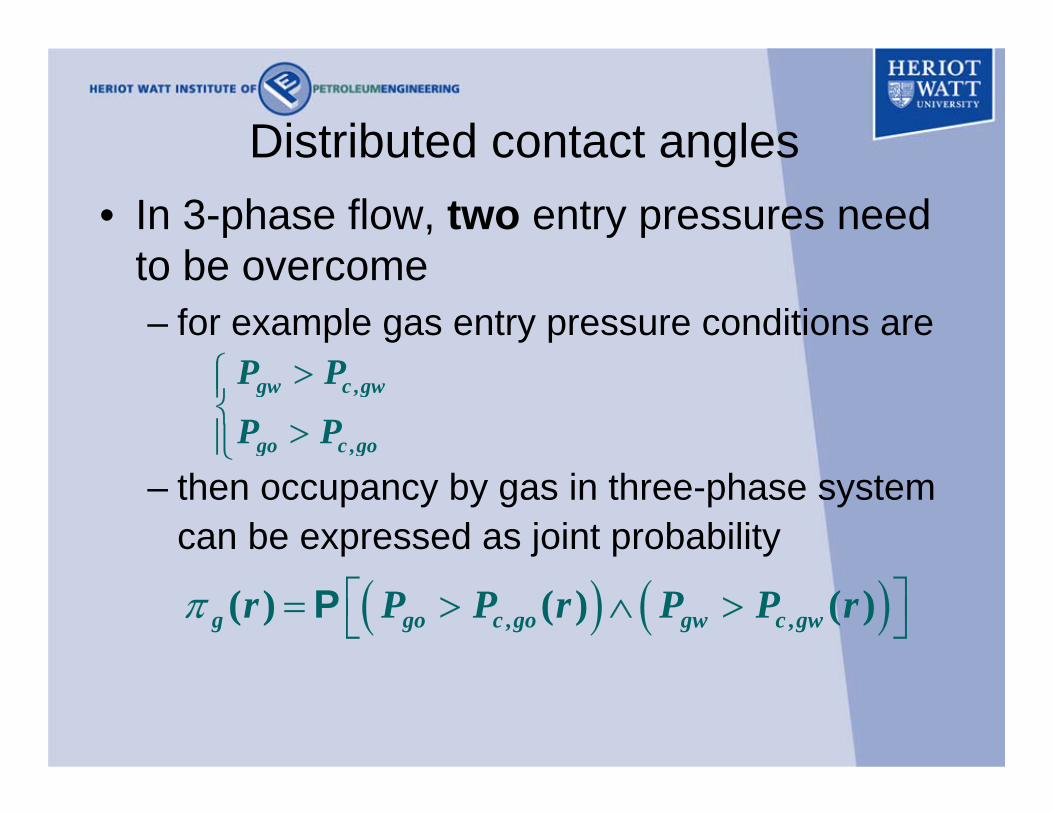
Distributed contact angles• In 3-phase flow, two entry pressures need
to be overcome– for example gas entry pressure conditions are
– then occupancy by gas in three-phase system can be expressed as joint probability
,
,
gw c gw
go c go
P P
P P
>⎧⎪⎨ >⎪⎩
( ) ( ), ,( ) ( ) ( )g go c go gw c gwr P P r P P rπ ⎡ ⎤= > ∧ >⎣ ⎦P
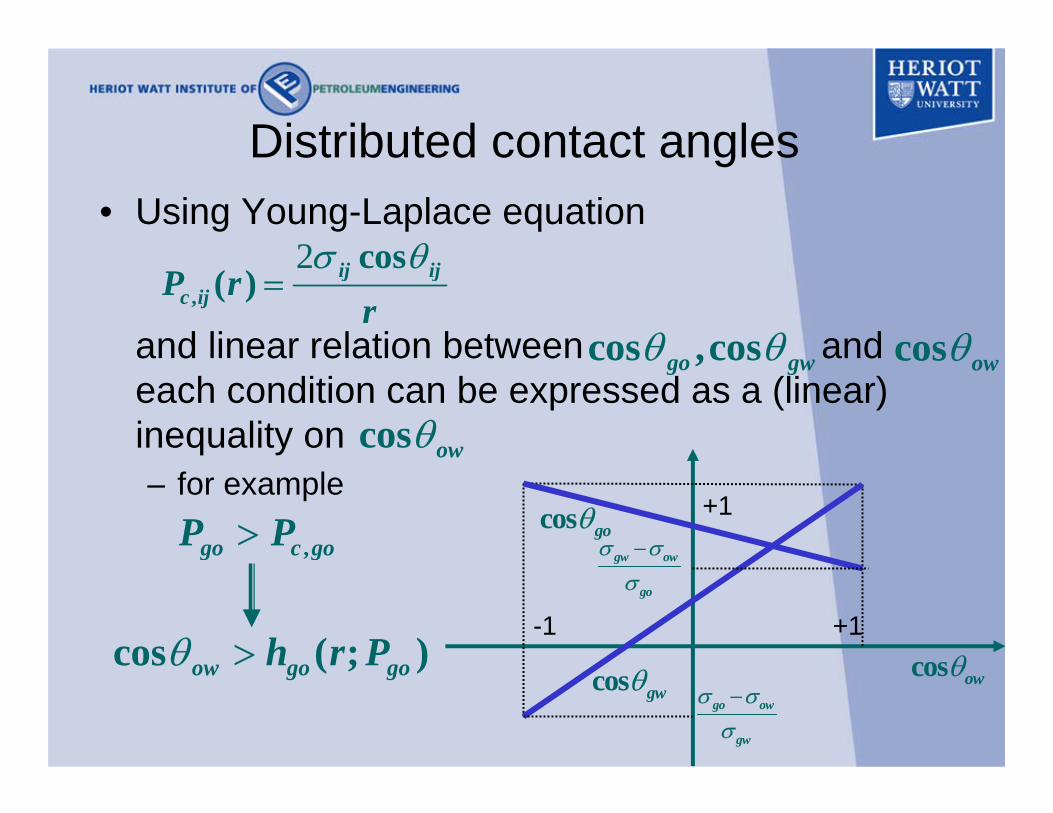
Distributed contact angles• Using Young-Laplace equation
and linear relation between andeach condition can be expressed as a (linear) inequality on– for example
cos ( ; )ow go goh r Pθ >
2,
cos( ) ij ij
c ijP rr
σ θ=
+1
cos owθ+1-1
cos goθ
cos gwθ
gw ow
go
σ σσ−
go ow
gw
σ σσ−
cos ,cosgo gwθ θ cos owθ
cos owθ
,go c goP P>

Distributed contact angles• Three-phase occupancies are joint
probabilities in terms of the randomly distributed variable– e.g. the three-phase gas occupancy becomes
which varies with the actual pressure combinations
• Occupancy calculated according to
cos owθ
( ) ( ; ) cos ( ; )g go go ow gw gor h r P h r Pπ θ⎡ ⎤= < <⎣ ⎦P
,go gwP P
[ ] cosP cos ( , )h
ow h r x dxθθ ψ−∞
< = ∫

• Conditions for these probabilities can be expressed in the ‘wettability’ plane
rrm a x
w etrrm in
o wco sθ
1
1−
watergas
gasoil
oil
o wh
P( ) ( ) cos ( )g go ow gwr h r h rπ θ⎡ ⎤= < <⎣ ⎦
( ,cos )owr θ
g oh
g oc
g wh
g wc
Distributed contact angles

gas
III
I
iso-relperms• Regions I and III
arise• However, mainly
multipledependencies– all 3 relperms
depend on more than one saturation
• Cusp-shape part of region I non-genuine
Distributed contact angles

oil
III
water
I
gas
III
I
Distributed contact angles

Distributed contact angles• Probabilistic model basis for software tool

Distributed contact angles• Probabilistic model basis for software tool

3. Applications
• Saturation-dependencies from a 3D network• Matching 2-phase field data to predict 3-
phase properties using network model• Software demonstration

Saturation-dependencies in network• Dependencies will change in 3D network, mainly
because of:– interconnectivity (causing trapping)– flow in films and layers (directly related to wettability)both reducing phase continuity
WAG flood in water-wet glass micromodel(Sohrabi et al. HWU)
– wetting films around both oil and gas– oil layers separating water and gas
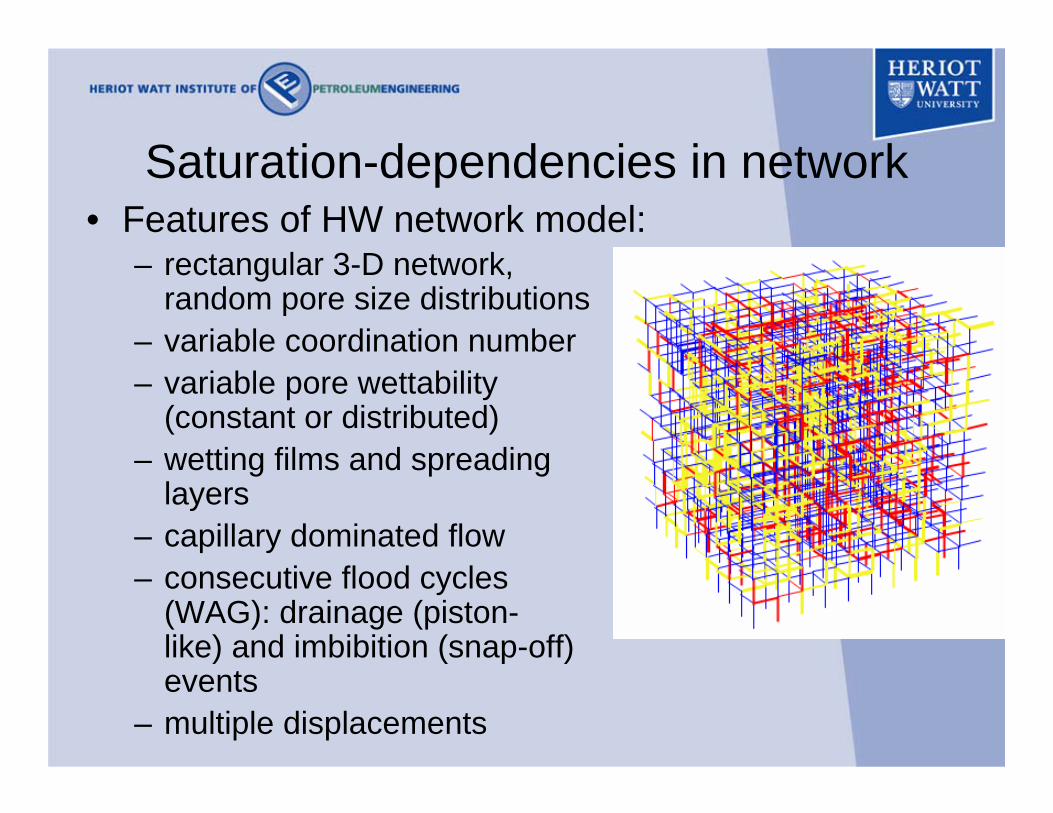
Saturation-dependencies in network• Features of HW network model:
– rectangular 3-D network, random pore size distributions
– variable coordination number– variable pore wettability
(constant or distributed)– wetting films and spreading
layers– capillary dominated flow– consecutive flood cycles
(WAG): drainage (piston-like) and imbibition (snap-off) events
– multiple displacements
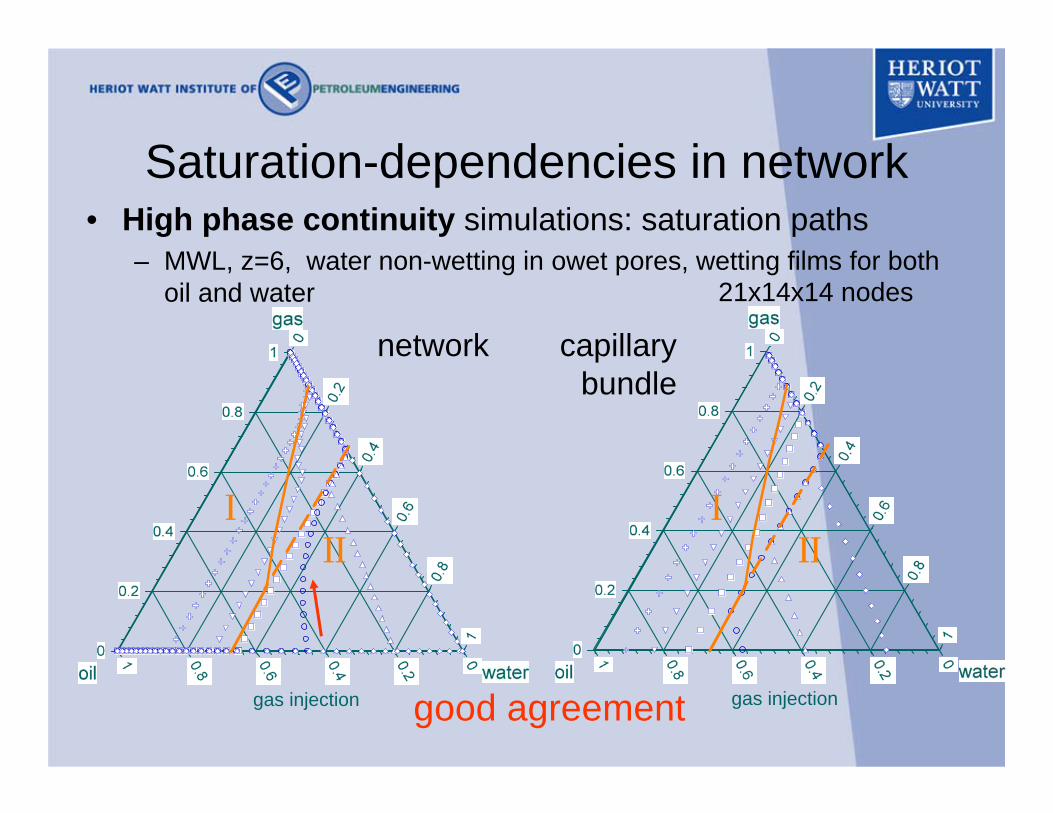
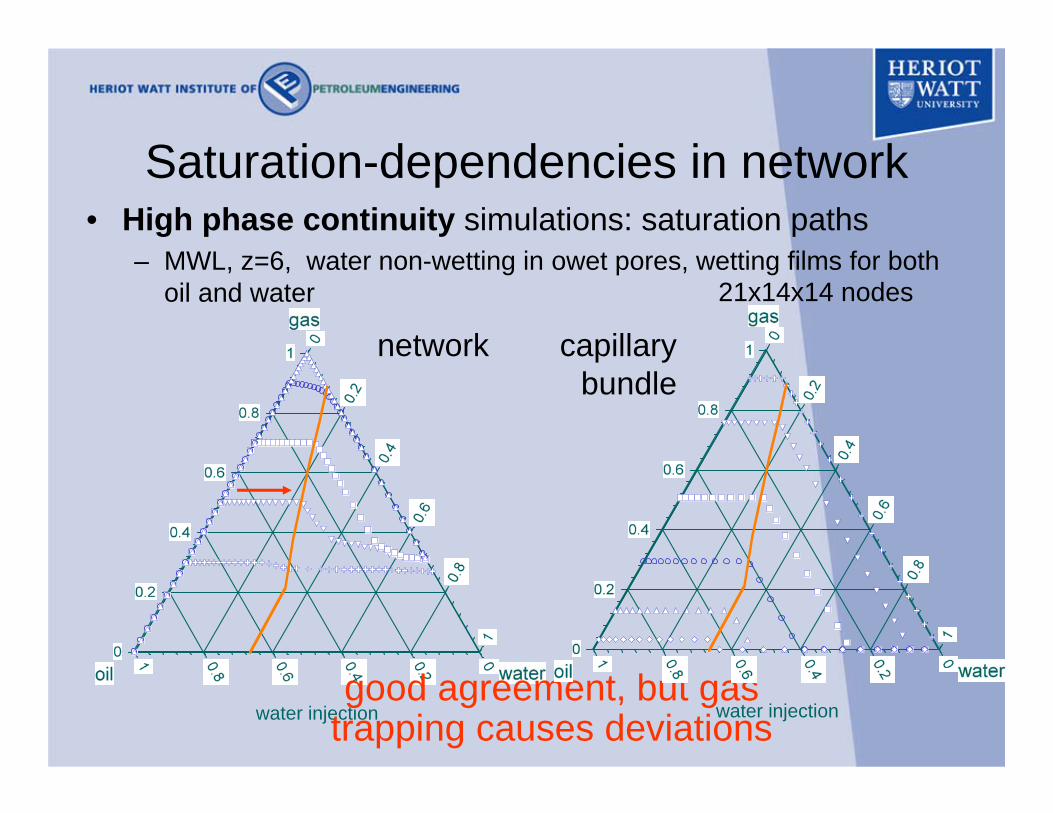
Saturation-dependencies in network• High phase continuity simulations: saturation paths
– MWL, z=6, water non-wetting in owet pores, wetting films for both oil and water 21x14x14 nodes
network capillarybundle
gas injection
III
gas injection
III
good agreement
water injection
Saturation-dependencies in network• High phase continuity simulations: saturation paths
– MWL, z=6, water non-wetting in owet pores, wetting films for both oil and water 21x14x14 nodes
network capillarybundle
good agreement, but gas trapping causes deviationswater injection

o-w-go-w-g
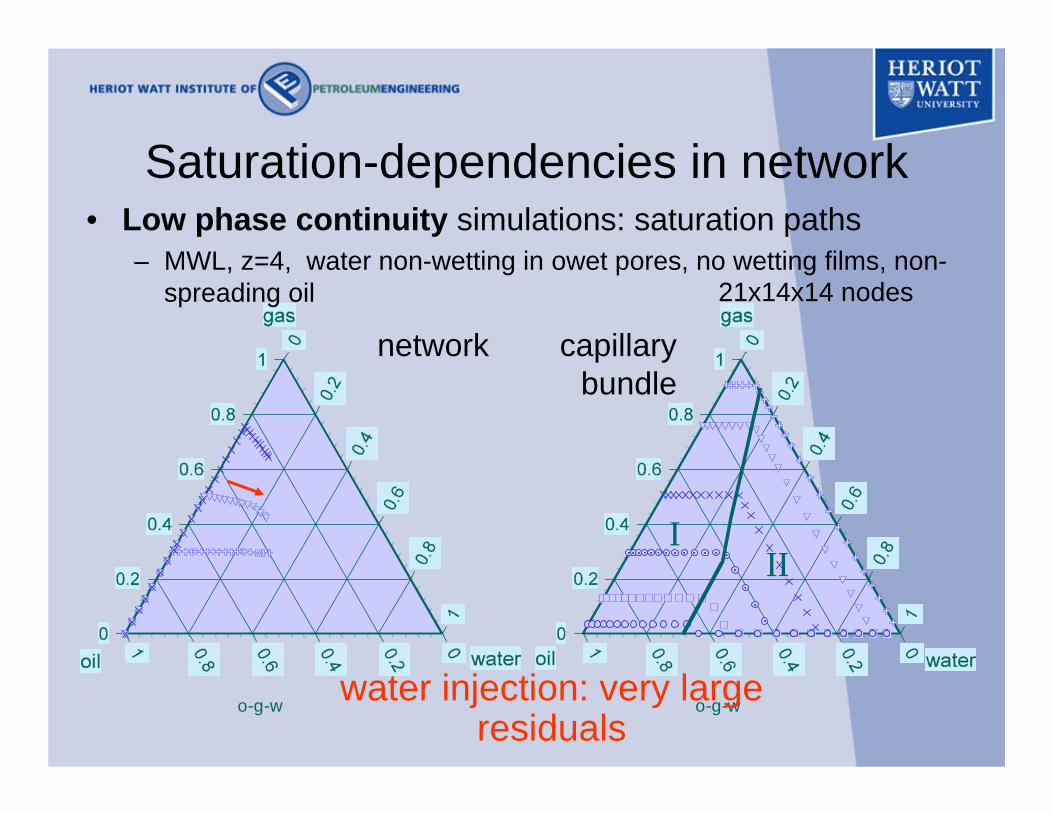
Saturation-dependencies in network• Low phase continuity simulations: saturation paths
– MWL, z=4, water non-wetting in owet pores, no wetting films, non-spreading oil 21x14x14 nodes
network capillarybundle
gas injection: remnant of analytical pattern
o-g-w
III
o-g-w
Saturation-dependencies in network• Low phase continuity simulations: saturation paths
– MWL, z=4, water non-wetting in owet pores, no wetting films, non-spreading oil 21x14x14 nodes
network capillarybundle
water injection: very large residuals

Match and predict with network model• Main parameters (cubic grid)
– connectivity defined by coordination number – pore radius distribution controlled by exponent
– geometry of “pore elements” defined by:• volume exponent
• conductance exponent
– wettability parameters: oil-water contact angle vs. radius
– films and layers
( ) nf r r∝
zn
min maxr r r< <
( )V r rν∝
( )g r rλ∝
ν
λ
with
cos ( )ow rθ wetrinvolving

Match and predict with network model• Field case experimental data (single and two phase)
– absolute permeability– mercury intrusion data (PSD)– initial (connate) water saturations– constant (high) rate water flood data + in situ saturations → imbibition oil-water relperms and cap pressure (indicates non water-wet)
– constant differential pressure gas flood data (ambient) + in situ saturation → gas-oil relperms
– trapped gas saturations to oil and water from oil and water imbibition
– centrifuge gas-oil cap pressure and oil relperm– IFTs not measured !
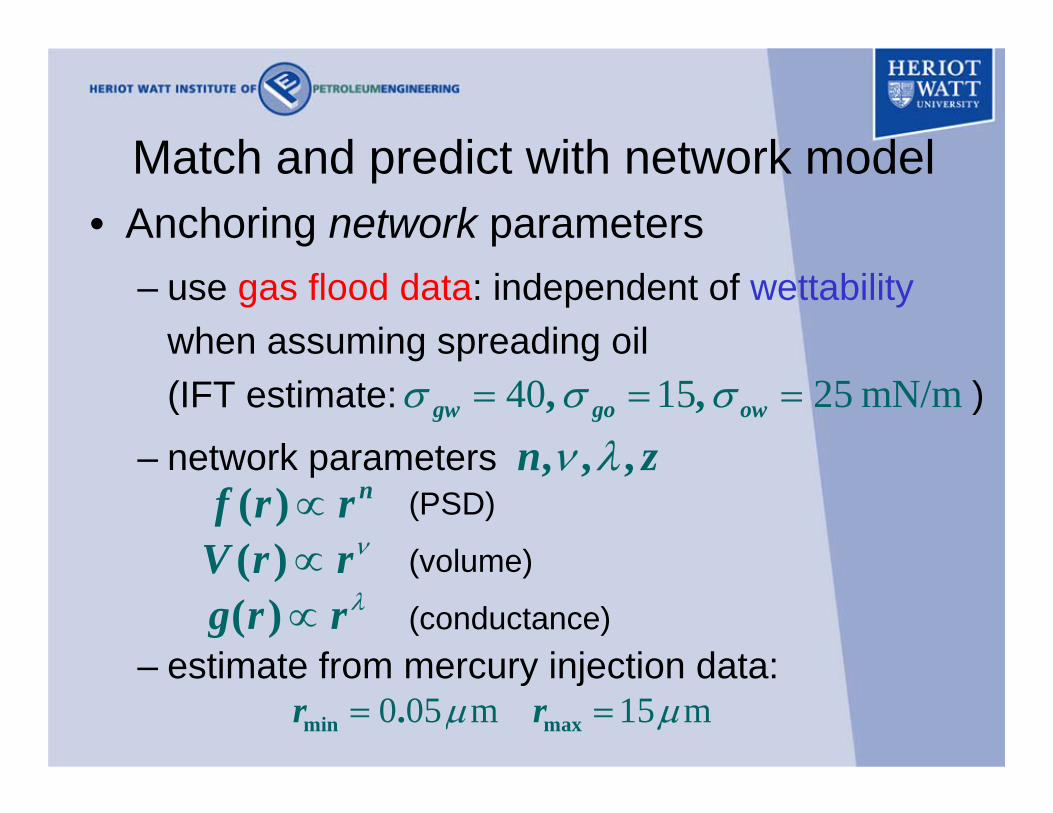
Match and predict with network model• Anchoring network parameters
– use gas flood data: independent of wettabilitywhen assuming spreading oil(IFT estimate: )
– network parameters
– estimate from mercury injection data:
40 15 25 mN/m, ,gw go owσ σ σ= = =
( ) nf r r∝( )V r rν∝( )g r rλ∝
, , ,n zν λ(PSD)
(volume)
(conductance)
0 05 m 15 mmin max.r rµ µ= =

Match and predict with network model• connate water and oil spreading layers present
– all oil drained at connate water ( )
4 0 040 4 3 4
.. .
z nν λ= == =
0
0.2
0.4
0.6
0.8
1
0 0.2 0.4 0.6 0.8 1Sg
Krg
/Kro
Kro
Krg
Sim - Kro
Sim - Krg
0 88.gS =

0.00001
0.0001
0.001
0.01
0.1
10 0.2 0.4 0.6 0.8 1
Sg
Krg
/Kro
Kro
Krg
Sim - Kro
Sim - Krg
Match and predict with network model• connate water and oil spreading layers present
– match of only -> prediction (!) of
4 0 040 4 3 4
.. .
z nν λ= == =
,r gk ,r ok
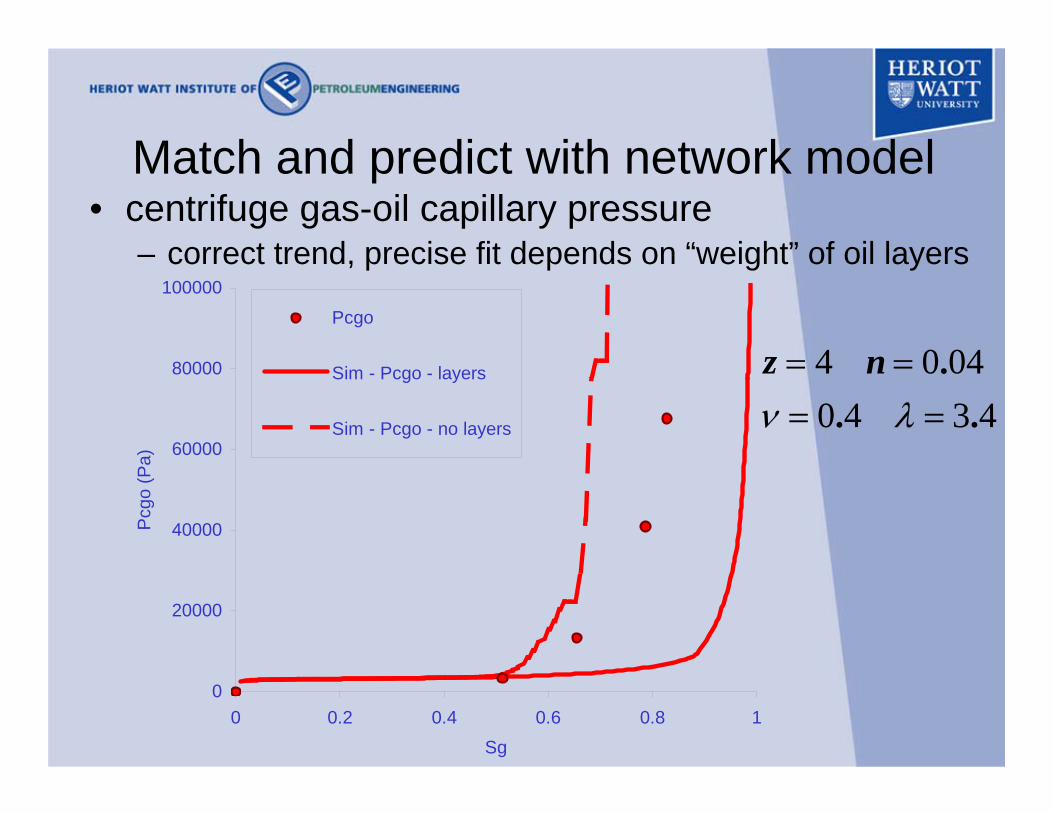
Match and predict with network model• centrifuge gas-oil capillary pressure
– correct trend, precise fit depends on “weight” of oil layers
4 0 040 4 3 4
.. .
z nν λ= == =
0
20000
40000
60000
80000
100000
0 0.2 0.4 0.6 0.8 1Sg
Pcg
o (P
a)
Pcgo
Sim - Pcgo - layers
Sim - Pcgo - no layers

Match and predict with network model• Anchoring wettability parameters
– use water flood data: imbibition after ageing– network parameters determined with gas flood
data– assume MWL system + constant contact angles:
– vary size of largest water-wet pore
– assume water wetting films absent
4 0 04 0 4 3 4. . .z n ν λ= = = =
0 5
0 1
cos .
cos .
wwetow
owetow
θ
θ
=
= −water-wet oil-wet
minr
0 5 0 1cos . cos .w oow owθ θ= = −
wetr maxr
PSD
wetr
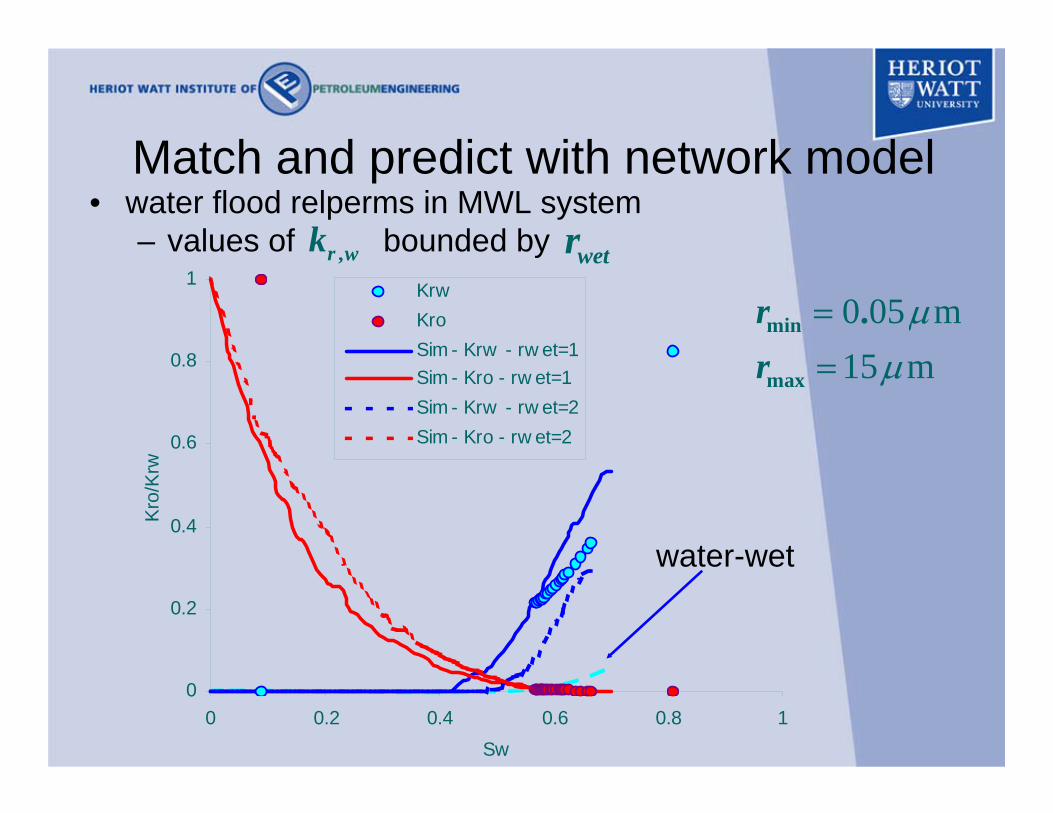
Match and predict with network model• water flood relperms in MWL system
– values of bounded by
0
0.2
0.4
0.6
0.8
1
0 0.2 0.4 0.6 0.8 1Sw
Kro
/Krw
KrwKroSim - Krw - rw et=1Sim - Kro - rw et=1Sim - Krw - rw et=2Sim - Kro - rw et=2
,r wk wetr
water-wet
0 05 m15 m
min
max
.rr
µµ
==
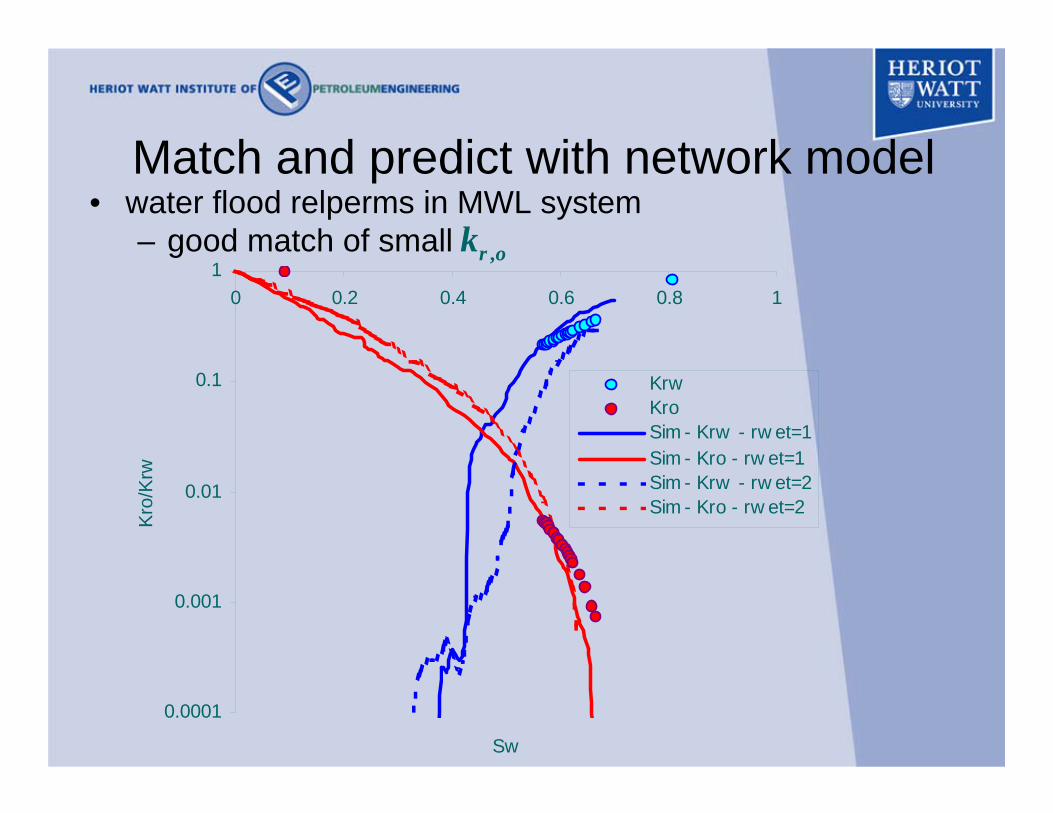
Match and predict with network model• water flood relperms in MWL system
– good match of small
0.0001
0.001
0.01
0.1
10 0.2 0.4 0.6 0.8 1
Sw
Kro
/Krw
KrwKroSim - Krw - rw et=1Sim - Kro - rw et=1Sim - Krw - rw et=2Sim - Kro - rw et=2
,r ok

Match and predict with network model• water flood relperms in MWL system
– location of steep decline of well matched
-5000
-4000
-3000
-2000
-1000
00 0.2 0.4 0.6 0.8 1
Sw
Pco
w (P
a)
Pcow
Sim - Pcow - rw et=1
Sim - Pcow - rw et=2
,c owP
0 05 m15 m
min
max
.rr
µµ
==

Match and predict with network model• Prediction of 3-phase properties:
– network parameters from anchoring– IFTs (estimated):– wettability:
• MWL system, choose = 1•
– films and layers:• suppress wetting films and spreading layers in water-
wet pores (not relevant)• probably oil wetting films in gas filled oil-wet pores
( ), no films around water ( )
40 15 25 mN/m, ,gw go owσ σ σ= = =
0 5 0 1cos . , cos .w oow owθ θ= = −
wetr mµ
1cos goθ = 0 1cos .owθ = −
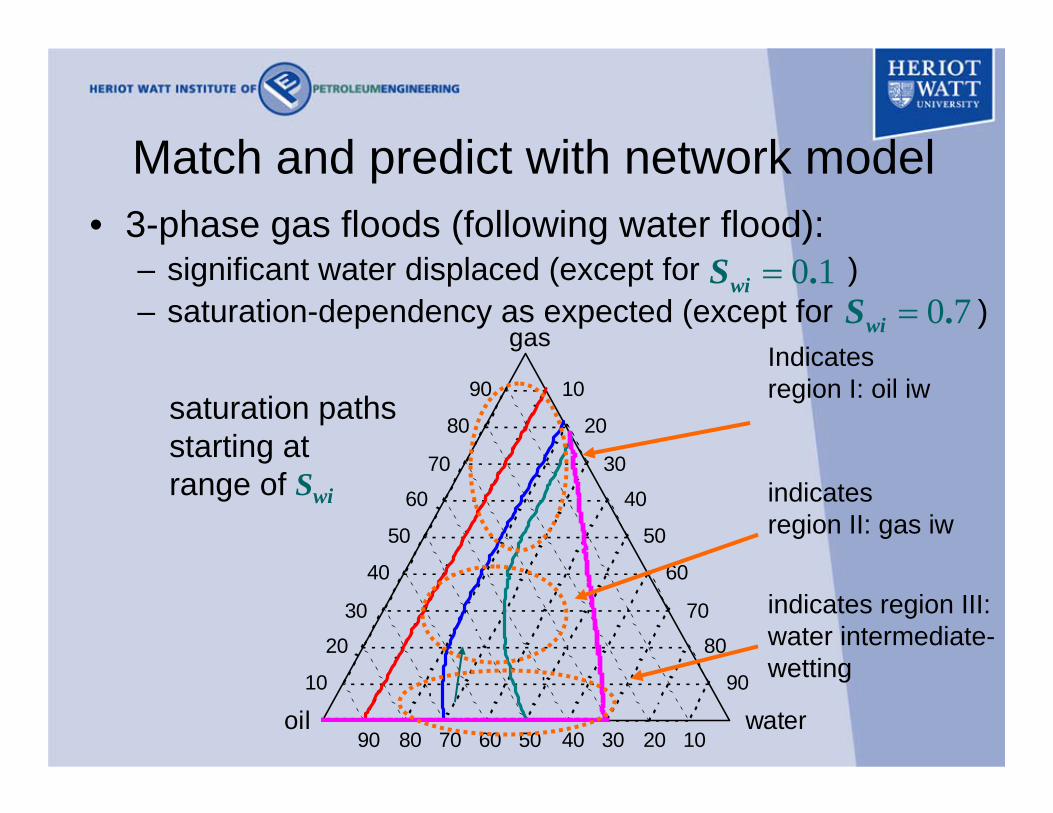
Match and predict with network model• 3-phase gas floods (following water flood):
– significant water displaced (except for )– saturation-dependency as expected (except for )
10 90
8020
30 70
6040
50 50
4060
70 30
2080
90 10
102030405060708090wateroil
gas
0 1.wiS =0 7.wiS =
saturation paths starting at range of Swi
indicates region III: water intermediate-wetting
Indicates region I: oil iw
indicates region II: gas iw

• gas-water cap pressures:– same along different paths for small Sg– different for large Sg
10 90
8020
30 70
6040
50 50
4060
70 30
2080
90 10
102030405060708090wateroil
gas
0
5000
10000
15000
20000
0 0.2 0.4 0.6 0.8 1
Sg
Pcg
w (P
a)
Sw i = 0.1
Sw i = 0.3
Sw i = 0.5
Sw i = 0.7
( ),c gw gP S
Match and predict with network model
( ), ,c gw w gP S S

• water relperms different along different paths(intermediate-wetting phase)
0
0.2
0.4
0.6
0 0.2 0.4 0.6 0.8
Sw
Krw
Sw i = 0.1
Sw i = 0.3
Sw i = 0.5
Sw i = 0.7
10 90
8020
30 70
6040
50 50
4060
70 30
2080
90 10
102030405060708090wateroil
gas
( ), ,r w o gk S S
Match and predict with network model
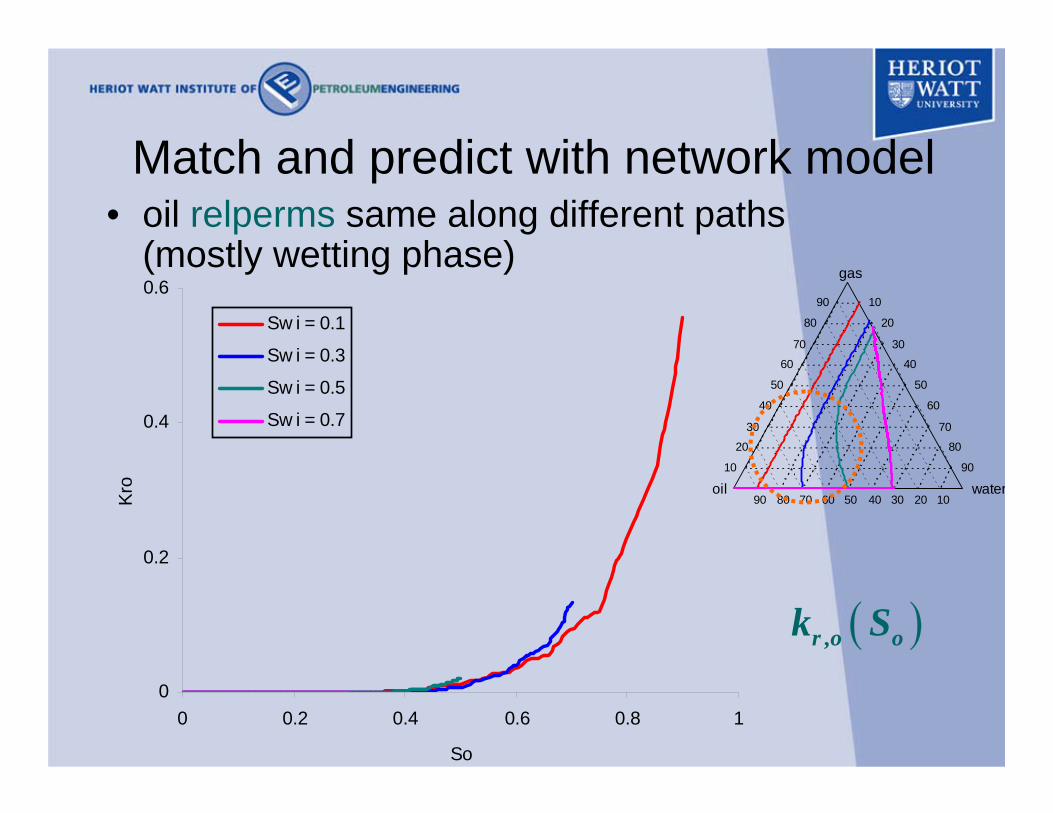
• oil relperms same along different paths(mostly wetting phase)
10 90
8020
30 70
6040
50 50
4060
70 30
2080
90 10
102030405060708090wateroil
gas
0
0.2
0.4
0.6
0 0.2 0.4 0.6 0.8 1
So
Kro
Sw i = 0.1
Sw i = 0.3
Sw i = 0.5
Sw i = 0.7
( ),r o ok S
Match and predict with network model

• gas relperms:– same along different paths for large Sg (non-wetting)– different for small Sg (intermediate-wetting)?!
10 90
8020
30 70
6040
50 50
4060
70 30
2080
90 10
102030405060708090wateroil
gas
0
0.2
0.4
0.6
0.8
1
0 0.2 0.4 0.6 0.8 1
Sg
Krg
Sw i = 0.1
Sw i = 0.3
Sw i = 0.5
Sw i = 0.7( ),r g gk S
Match and predict with network model
( ), ,r g o wk S S
• Conclusions– good anchoring of network parameters using gas-oil data – indication of wettability state from match to water flood
data: mixed-wet with larger pores weakly oil-wet– uncertainties: interfacial tensions, presence of oil wetting
films around gas in ow pores; films have significant effect– qualitative behaviour of predicted 3-phase relperms
mostly as expected– assumed mixed-wet system rather unfavourable for gas
flooding (gas displacing water), although lack of water continuity may force oil displacement
Match and predict with network model

Discussion• Simple capillary bundle model to predict saturation-
dependencies of 3-phase relperms and cap pressures– complex dependency regions found, which no empirical
models a priori include in their formulations (except strongly water-wet case)
– limitations: no interconnectivity (trapping, multiple displacements), limited intra-pore effects (e.g. film flow); however, saturation-dependency regions broadly correct
– applicability:• indication of “need-to-know information” (IFT’s, degree of oil-water
wettability, ranges of pore sizes): measuring wettability !• criteria for combining 2-phase & 3-phase data
– process-based approach necessary: network model