water transfer working group - benton county rural water
TRANSCRIPT

10/29/2019
1
Benton County Rural Water Supply Mitigation Program
Yakima Basin Mitigation Area
This program has been developed for the Yakima Basin Mitigation Area of Benton County consistent with the requirement for counties to determine both legal and physical water availability in accordance with the Growth Management Act.
This program is intended to meet projected adequate water supply determinations for building permit, short plat and subdivision applications for at least a 20‐year period (through 2038).
Background
- Studies have shown that groundwater wells are in direct hydraulic continuity with the Yakima River
- The Lower Yakima watershed is over appropriated
- Counties are being required to mitigate for groundwater wells being placed within the Lower Yakima watershed
- Kittitas and Yakima County Water Supply Programs have already been developed
- The Department of Ecology put Benton County on notice about developing a water supply program
Background – cont’d
- FutureWise appealed the County’s Comprehensive Land Use Plan on the basis of water availability
- Benton County and FutureWise entered into a settlement and the County agreed to develop a water supply program
- As a result, Yakima River surface water rights are being purchased by Benton County and will be placed in Trust with the Department of Ecology to mitigate for groundwater wells
- Benton County presented preliminary program overview to WTWG in early 2019
Water Rights
- Benton County has purchased 125 AF of Yakima River surface water rights.
- These water rights will be the subject of a Trust water right agreement between the Department of Ecology and the County. Mitigation certificates will be issued to offset groundwater wells and will offer 3 different mitigation packages.

10/29/2019
2
Program Overview
• For domestic uses relying on wells that are exempt from groundwater permit requirements under RCW 90.44.050 in the Benton County Yakima Basin Water Bank Mitigation Area
• Applies to a subdivision, short plat, or initial residential building permit for a dwelling unit within the Mitigation Area
• Issue mitigation certificates
• Metering required – paid for by applicants
• Tracking and annual reporting
• See program description handout for additional details
Growth for Benton
Approx. 18,800 population increase
6,961 Households (2.7 per household)
Growth for Mitigation
Projecting 64 to 109 new households per year
Projected Water Use Values
Indoor Only – Estimated 162 GPD/.18 AF
Outdoor Varies by Location in Mitigation Area
Key Assumptions
• 20% indoor domestic consumptive use
• 90% outdoor domestic consumptive use
• Development within irrigation districts can only apply for domestic water use mitigation certificate
• Two options for development outside irrigation districts
Supplemental Analysis on Indoor Consumptive Use
• Benton-Franklin Health District septic system design standards
• Factors affecting indoor consumptive use
• Summary of literature review on indoor consumption
• Benton County on-site septic system permits
Analysis included review of:
Benton-Franklin Health District Septic Drain Field Design Standards

10/29/2019
3
Benton-Franklin Health District Septic System Design Standards
• 330 ft2 Minimum drainfield area for a home with 2 bedrooms
• 165 ft2 For each additional bedroom
• Drainfields are designed for 120 gpd/bedroom
• Additional area is required for less permeable soils
• Drainfields only allowed in soil types 1-4
• Design standards are adequate for infiltration of water quantities in Rural Water Supply Program (200 gpd/home)
Benton-Franklin Health District Septic Drain Field Design Standards
Factors Affecting Indoor Consumptive Use• Most indoor water consumption occurs in the septic drainfield where it evaporates
or is transpired by plants (ET)
• Septic effluent adds water at a constant rate to natural soil moisture which is also consumed by ET
• ET varies seasonably with temperature and precipitation, being highest in the summer and lowest in the winter
• Septic effluent likely increases ET over drainfield April – September when conditions are warm and dry
• Septic effluent impacts on ET are likely negligible October – March when conditions are cold and wet, likely being less than 10% consumed
• To annually consume 20% of indoor water use, a consumption rate of at least 30% would be required during summer months which is unlikely in a properly designed septic drainfield
Summary of Literature Review on Indoor Consumption
• Nine studies regarding consumption of indoor domestic water use were identified and reviewed
• These studies, conducted in New Mexico, Georgia, and Colorado, used a variety of methods to estimate indoor consumption
• Indoor consumption ranged between 9 and 20 percent, averaging 14 percent
• An assumed value of 20 percent consumption for the Rural Water Supply Program is considered adequate and at the high end of values calculated in the available published studies
• The use of 20 percent is also within the range of values used by Ecology for areas east of the Cascades
Benton County Septic System Permits
Benton County On-Site Septic System Permits
Septic System Type Notes Number of Permits Percent of TotalConventional Gravity Flow System Soil type 2-5 472 64.3%Dosed Conventional Gravity Flow Soil type 2-6 50 6.8%Holding Tank controlled part time use 2 0.3%Intermittent Sand Filter & Mound Treatment level A 1 0.1%Mound System Shallow soils & bedrock 39 5.3%Oscar Low Flow Treatment System Enhanced treatment 1 0.1%Pressure Distribution Soil type 2-6 70 9.5%Pressure Distribution Sandlined Trench Soil type 1-6 (mostly 1) 97 13.2%Subsurface Drip System Enhanced treatment/reuse 2 0.3%
TOTAL 734 100%
Table 1 - On-Site Septic System Permits within Project Area 2009-2019
• Shaded rows represent systems designed to be mostly consumptive. These represent 6% of the systems installed between 2009 and 2019.• White rows represent systems designed for infiltration. These represent 94% of the systems installed between 2009 and 2019.• Assuming the infiltration systems annually consume 15% and the consumptive systems consume 100%, overall total consumption would be
equal to 20%.• The type and distribution of systems that have been installed indicate that using an overall value of 20% for indoor consumption is adequate and
reasonably conservative for the Rural Water Supply Program.
Source: Benton-Franklin Health District Septic Drain Field Design Standards
IrrigationDistricts

10/29/2019
4
Mitigation Area Area that Drains to Columbia River
Package A – indoor domestic use only
• This package is for applicants with access to irrigation water from an irrigation district or an irrigation water right, and allows use of an annual average of 200 gallons per day. The daily maximum withdrawal allowed on any given day for Package A is 675 gallons per day, provided the allotted annual average water usage is not exceeded. Metering will be required.
• Consumptive use (.045 AF/year)
Package B – indoor domestic use and limited irrigation
• This package is for applicants without access to irrigation water from an irrigation district or an irrigation water right, and allows use of an annual average of 300 gallons per day for indoor use and outdoor irrigation of an area up to 1500 square feet. The daily maximum withdrawal allowed on any given day for Package B is 1000 gallons per day, provided, the allotted annual average water use is not exceeded. Metering will be required.
• Consumptive use (.146 AF/year)
Package C – indoor domestic use and expanded irrigation
• This package is for applicants without access to irrigation water from an irrigation district or an irrigation water right, allows use of an annual average of 400 gallons per day for indoor use and outdoor irrigation of an area up to 3000 square feet. The daily maximum withdrawal allowed on any given day for Package C is 1300 gallons per day, provided, the allotted annual average water usage is not exceeded. Metering will be required.
• Consumptive use (.247 AF/year)
County Water Bank Summary and Basis of Cost per Acre-foot for Each Package
Table 1 ‐ Water Bank Acre Fee (AF) and Acquisition Costs Bank AF Cost Indirect Costs* Total Average cost per AF
LeeLynn 1 75 $487,500.00 $52,359.00 $539,859.00 $7,198.00
LeeLynn 2 50 $330,790.00 $52,359.00 $383,149.00 $7,663.00
Future TBD
125 $818,290.00 $104,718.00 $923,008.00 $7,384.00
* Assumed value to be updated based on actual costs as more acquisitions are made

10/29/2019
5
Fee Basis – Preliminary Cost Recovery Example
• Preliminary calculation of administrative costs ($433 per applicant) plus mitigation certificate costs = Package costs
• Package A - $765.00
• Package B - $1,511.00
• Package C - $2,757.00
2018 – 2019 DevelopmentMitigation Water Accounting
• Per Settlement Agreement, Benton County is accounting for and covering water mitigation for new homes in Mitigation Area since February 2018 until program in place
• 146 Single Family permits issued (2/18 – 9/19)• 118 within Irrigation District boundaries (81%) – 5.31 acre-feet• 28 outside (19%) – 4.1 acre-feet
• Total Consumptive Water = 9.41 acre-feet
• Current Remaining County Water Bank Balance: 125 – 9.41 = 115.49 acre-feet
Next Steps• Communications with FutureWise – program details
• Continued outreach to Realtor and Home Builders associations
• Take code provisions to Planning Commission (Dec.)
• Setting up all the admin and communication materials for public (Dec./Jan.)
• Hearing on all ordinances pertaining to the water supply program by the BOCC in early Jan/Feb 2020
• FutureWise Settlement Agreement provisions met by early 2020
• Trust Water Right Agreement negotiated with Ecology to manage County water rights in trust planned for early 2020
• Prepare first annual report at the end of 2020 QUESTIONS?

DRAFT
1
Rural Water Supply Mitigation Program Description for the Yakima
Basin Mitigation Area of Benton County
This program has been developed for the Yakima Basin Mitigation Area of Benton County, consistent with the requirement for counties to determine legal water availability. Proposed Program Details 1. Time Period: The County’s program is intended to meet projected adequate water supply determinations (AWSDs) for building permit, short plat and subdivision applications for at least a 20‐year period (through 2038). 2. Geographic Scope: The proposed program will apply only to mitigation certificates to be purchased from the County for AWSDs for domestic uses relying on wells that are exempt from groundwater permit requirements under RCW 90.44.050 in the Benton County Yakima Basin Water Bank Mitigation Area (Mitigation Area), which is identified in the attached mitigation area maps (see Attachments 1 and 2). 3. Applicant Eligibility: Applicants for a subdivision, short plat, or initial residential building permit for a dwelling unit within the Mitigation Area may purchase a mitigation certificate from the County to mitigate for domestic uses of wells that are exempt from the groundwater permit requirements under RCW 90.44.050. Mitigation certificates may only be purchased from the County in conjunction with the filing of one of the above‐referenced applications. The purchase of mitigation certificates must be completed prior to the issuance of building permits, and prior to the final approval of subdivisions and short plats. Applicants may use a County mitigation certificate as mitigation sufficient to meet the County’s AWSD requirements. Applicants need not purchase a mitigation certificate from the County to comply with the County’s mitigation program if they have or can obtain water rights for the property or sufficient mitigation through other water banks. For those initial residential building permits for dwelling units issued within the Mitigation Area after February 13, 2018 and prior to the enactment of permanent regulations, a provision will be included in the Trust Water Right Agreement between Benton County and the Department of Ecology “reserving” the amount of water deemed consumptively used on those parcels.
4. Water Use Limitation and Consumptive Use Estimate: Each building permit for one or more dwelling units requiring a new use of ground water from an exempt well within the Mitigation Area will require a mitigation certificate, unless an applicant has or can obtain mitigation through another water bank. New exempt well ground water uses in the Mitigation Area may purchase of one of three mitigation certificate package options from Benton County. The cost per package will likely need to be revised from time‐to‐time to reflect additional water right purchases and other costs necessary for the program. The packages/limitations for mitigation certificates sold by the County will initially consist of:

DRAFT
2
Package A, which is for applicants with access to irrigation water from an irrigation district or an irrigation water right, allows use of an annual average of 200 gallons per day (est. .045 acre‐feet per year (“AF/yr”) consumptive use).* The daily maximum withdrawal allowed on any given day for Package A is 675 gallons per day, provided the allotted annual average water usage is not exceeded.
Package B, which is for applicants without access to irrigation water from an irrigation district or an irrigation water right, allows use of an annual average of 300 gallons per day (est. .146 AF/yr. consumptive use)* for indoor use and outdoor irrigation of an area up to 1500 square feet. The daily maximum withdrawal allowed on any given day for Package B is 1000 gallons per day, provided, the allotted annual average water use is not exceeded.
Package C, which is for applicants without access to irrigation water from an irrigation district or an irrigation water right, allows use of an annual average of 400 gallons per day (est. .247 AF/yr. consumptive use) * for indoor use and outdoor irrigation of an area up to 3000 square feet. The daily maximum withdrawal allowed on any given day for Package C is 1300 gallons per day, provided, the allotted annual average water usage is not exceeded.
* Consumptive use assumptions and calculations are available upon request.
5. Documentation of Mitigation: Mitigation certificates issued by the County will be issued with conditions such as those set forth below:
i. Water use is to be made within Parcel No. [XXXXX] located within the [XX ¼ XX ¼] of Section [XX], T. [XX] N., R. [XX] E.W.M.
ii. In‐home water use for 1 dwelling unit, resulting in a consumptive use of [0.045] AF/yr or less.
iii. Outdoor irrigation is 1500 square feet (Package B) or 3000 square feet (Package C), resulting in a consumptive use of [0.101] AF/yr or [0.202] AF/yr or less, respectively.
iv. The proposed well will be located in Parcel No. [XXXXX], located within the [XX ¼ XX ¼] of Section [XX], T. [XX] N., R. [XX] E.W.M.
v. Water use shall be recorded and reported as required under BCC Chapter XX.ZZ (under development) for those properties subject to water budget neutral requirements based on the Benton County Code.
vi. Record with the Benton County Auditor a property covenant that restricts or prohibits the planting of trees or shrubs over a septic drain field on Parcel No. [XXXXXX].

DRAFT
3
vii. Record with the Benton County Auditor an appropriate permanent conveyance instrument under which the applicant obtains an interest in Trust Water Right No. [XXXXXXXXX] to offset consumptive use.
viii. While not expected, the Trust Water Right identified in paragraph vii above may be curtailed in extreme low water supply conditions. Any valid priority calls against the Trust Water Right identified in paragraph vii above based on local limitations in water availability and/or impairment of senior rights, shall result in temporary curtailment of the use of water under this program until the priority call for water ends. The approval of groundwater mitigation through this program does not eliminate the right or ability of any person or entity to protect senior water rights from impairment.
6. Metering Requirements: All new uses of groundwater for residential purposes within the Mitigation Area using permit exempt wells pursuant to a mitigation certificate from the County or any other third party as the potable water source will be required to meter their mitigated water usage and pay an annual fee to the County to cover costs associated with metering and monitoring program administration.
Participants will be responsible for paying for the County to install meters and metering equipment and any associated costs as determined by County specifications. 7. Reporting by County: The County’s annual report to Ecology (and available to the public and provided to the Water Transfer Working Group) will include:
Number and location of any new exempt wells/points of withdrawal
Average indoor and outdoor water usage would be summarized as total usage and on an average household basis, including measured/calculated landscape irrigation area for exempt well uses outside of irrigation district boundaries in the mitigation area, permitted since February 2018, along with associated water usage values.
Total building permits issued for the year and building permits issued since February 2018.
Status of existing mitigation quantities. Annual water usage would be compared to the amount of water in the County’s mitigation bank, including the remaining balance.
Any violations or discrepancies requiring Ecology’s technical assistance for compliance and enforcement of the state Water Code
8. Approval of Other Water Bank Water Rights: The County’s water mitigation program is not intended to be limited to water rights held by the County. The County welcomes having other water right holders interested in making water rights available for purchase by the development community that can be used as water mitigation certificates in the County’s process.
DRAFT
4
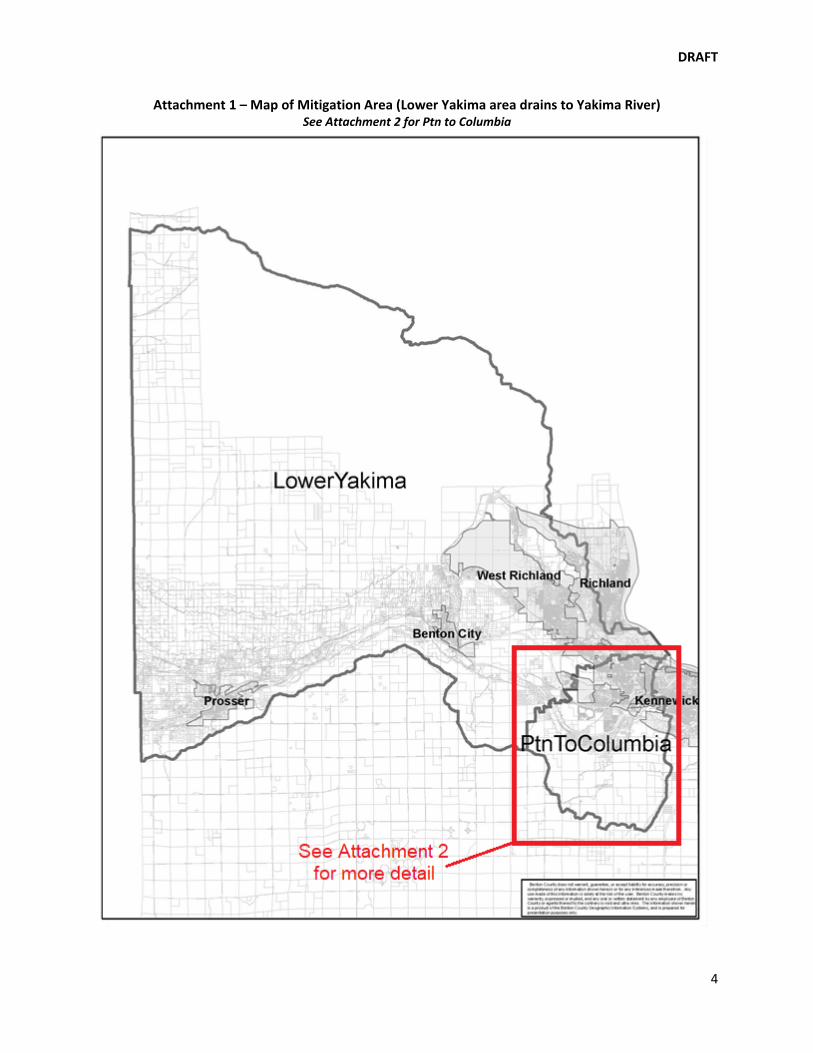
Attachment 1 – Map of Mitigation Area (Lower Yakima area drains to Yakima River) See Attachment 2 for Ptn to Columbia

DRAFT
5
Attachment 2 – Map of Mitigation Area (Ptn to Columbia area drains to Columbia River and is
excluded from the County’s mitigation program)
2200 6th Avenue, Suite 707 Seattle, WA 98121 Telephone: 206-443-7646
www.eaest.com
Benton County, Washington Rural Water Supply Program
EA Engineering, Science, and Technology, Inc., PBC
TECHNICAL MEMORANDUM TO: Ben Floyd, White Bluffs Consulting FROM: Dave Nazy, LHg DATE: July 9, 2018 SUBJECT: Benton County Rural Water Supply Program 1 INTRODUCTION The objective of this technical memorandum (tech memo) is to present an assessment of estimated consumptive water demand for future uses that rely on permit-exempt wells in the Yakima River valley portion of Benton County, Washington (the Project Area). Benton County (County) received a February 13, 2017 letter from Washington State Department of Ecology (Ecology) giving notice that rural water supply is at risk of impairment to senior water right holders in the Yakima Basin portion of Benton County. County Planning staff and Contractor staff met with Ecology on June 15, 2017 to discuss lessons learned from the other counties, and strategies for moving forward. Since meeting with Ecology the County secured a consultant team, outlined steps for developing a rural water supply program, updated the Benton County Comprehensive Plan (Anchor QEA 2018) and future population projections, and organized a technical team to assist the County with its rural supply strategy.
The first Technical Team meeting occurred on May 24, 2018 to discuss the County’s water supply report and plans for conducting the work described in this memo. The Technical Team includes representatives from the County, Ecology, the U.S. Bureau of Reclamation, the Yakama Nation, Roza Irrigation District, Kennewick Irrigation District, Benton Conservation District, and the Consultant team. Other irrigation districts will be invited to future meetings.
The project area generally comprises the County portion of Water Resource Inventory Area (WRIA 37) in the central and west-central portion of the County, bounded on the north and south by the crests of Rattlesnake Mountain and the Horse Heaven Hills, respectively; the west by the County line, and east by the Columbia River near Richland and West Richland (Figure 1). For water demand estimates, the cities of Kennewick, Richland, and West Richland were excluded because these areas are not served by permit-exempt wells. In addition, the southeastern corner of the basin (Badger Canyon and Amon drainage area) was excluded because this area drains to the Columbia rather than the Yakima River, along with the other parts of the County in WRIAs 31 and 40, which also drain to the Columbia River.
The intent of this assessment is to use existing information to estimate future consumptive use and calculate annual and 20-year mitigation targets for permit-exempt uses within the modified project area. The mitigation target represents a reasonable estimate for mitigation of anticipated growth and provides the County a target for acquiring water or implementing projects to offset those impacts. As growth occurs the actual impacts can be tracked and quantified. This will allow the County to adjust implementation of their Rural Water Supply Program as appropriate so that actual

EA Project No. 1563201 Page 2 EA Engineering, Science, and Technology, Inc., PBC July 9, 2018
Benton County, Washington Rural Water Supply Program
impacts can be mitigated.
The assessment is based on publicly available information and reports and includes a discussion of methods used, limitations and uncertainties. It follows the methods discussed and agreed to in the Technical Team meeting on May 24, 2018. Attachment 1 provides a summary of the guidance provided by the Technical Team.
Topics addressed in this tech memo include the following:
• Estimated population growth for areas relying on permit-exempt wells in the modified project area.
• Total estimated water use for permit-exempt wells in the modified project area, broken out by indoor and outdoor use.
• Consumptive and non-consumptive portions of total estimated water use. • Mitigation requirements to offset future impacts to the Yakima River from growth
projected in the County’s Comprehensive Plan. • A discussion of timing and location of the impacts of the consumptive use. • Limitations and Uncertainties • Summary conclusions and recommendations.
2 POPULATION GROWTH PROJECTION IN PROJECT AREA The objective of this task is to estimate rural population growth in the modified project area to calculate the number of homes that will require mitigation over the next 20 years. A range of estimates is provided. The County provided 2013-present building permit data that was used to calculate the low end of the range. Growth projections in the adopted 2017 Comprehensive Plan Update were used to calculate the high end of the range. These projections are based on OFM’s "high" series population growth estimate. The number of people per household (pph) used in the Comprehensive Plan (2.7 pph) was assumed for all estimates.
2.1 20 Year Projection Building permit data for single-family residential homes containing spatial attributes was provided by the County for permits issued since mid-2013. During this period, approximately 1,027 single family building permits (205 permits/year) were issued in the unincorporated areas of the County. Approximately 321, or 31.25% of the total, single family residential building permits (64 permits/year) were issued for parcels within the modified project area. This rate is selected as the low end of the range of projected rural residential building within the modified project area. Continued building at this rate would result in an additional 1,284 homes in the modified project area over the next 20 years. The County’s Comprehensive Plan includes rural population growth estimates for Land Use designations that are assumed to be served by permit-exempt wells in the unincorporated areas of the County. These land use designations include Urban (outside of water system service areas), GMA Agriculture, Rural Transition, Rural Remote, Rural Resource, Rural Commercial, Rural Industrial, and Rural Community Centers. The Comprehensive Plan allocated rural growth to occur primarily in four of these land use designations: Urban, Rural Transition, Rural Remote and Rural Community Centers. Total allocated new households identified for these four Land

EA Project No. 1563201 Page 3 EA Engineering, Science, and Technology, Inc., PBC July 9, 2018
Benton County, Washington Rural Water Supply Program
Use categories are listed in Table 1. As shown in Table 1, an additional 6,961 homes are projected to be built over a 20-year period in unincorporated rural areas of the County at an average of 348 new units/year. Assuming observed growth patterns will continue (31.25% of the rural growth will occur within the modified project area) and applying this pattern to the 20-year growth projections in the Comprehensive Plan, results in an estimated 2,176 additional homes within the modified project area (109 homes/year) over the next 20 years.
Table 1 - Potential Future Rural Population Growth by Land Use Category (Table 3-7 in Comprehensive Plan)
This rate is assumed to be the high end of the range of projected rural residential building within the modified project area. Comparison of the low and high 20-year growth estimates are provided in Table 2.
Table 2 - Range of Projected Rural Residential Growth Rates
3 DOMESTIC WATER USE AND CONSUMPTION ESTIMATES The objective of this section is to describe methods for calculating domestic water use for homes served by permit-exempt wells. Estimates are broken out by indoor and outdoor uses and assumptions for consumptive water use are presented. Indoor uses are assumed to be constant year-round. Outdoor uses are based irrigation of lawn and garden, and rely on the pasture-turf water duties as defined for the project area in Appendix A of the Washington Irrigation Guide (WIG) (USDA, 1997).
3.1 Indoor Water Use The most significant studies regarding indoor domestic water use in North America are the Water Research Foundation’s 1999 Residential End Uses of Water (Mayer et al. 1999) and the Residential
Land Use Category* New UnitsUrban 134Rural Transition 1,142Rural Remote 5,652Rural Community Centers 34
Total 6,961*Data represents all of rural Benton County.
CountyModified
Project AreaModified Project Area 20-yr Total
Low Estimate* 205/yr 64/yr 1280High Estimate^ 348/yr 109/yr** 2176
** Assumes pattern of observed growth will not change (36.5% of total growth will occur in modified project area)
* Rate based on 2013-2018 building permit data
^ Rate based on County Comprehensive Plan

EA Project No. 1563201 Page 4 EA Engineering, Science, and Technology, Inc., PBC July 9, 2018
Benton County, Washington Rural Water Supply Program
End Uses of Water Study Update – Version 2 (DeOreo et al. 2016). These studies included metering 100’s of single family homes in selected water systems across North America to characterize indoor water use and trends. The results of the 2016 study for indoor water use in gallons per capita per day (gpcd) are summarized in Figure 2.
As shown in Figure 2, measured gpcd ranged from 10 to 280, with roughly 60% of the households studied using between 40 and 70 gpcd. Lower values are generally associated with homes containing more people, and water systems that have implemented aggressive conservation efforts.
For the purposes of this study, 60 gpcd is selected for calculating indoor water use in the project area. This value is within the range of values in the available literature and is slightly higher than the average measured in the most recent end use study. It is recommended by Ecology in their June 2018 publication 18-11-007 entitled Recommendations for Water Use Estimates. Using the County’s Comprehensive Plan value of 2.7 pph, total indoor use for domestic supply for a single household is 162 gallons per day (60 gpcd x 2.7 pph).
3.2 Outdoor Water Use Domestic outdoor water use is assumed to be for the purpose of irrigating lawn and garden. Water use estimates are based on irrigation requirements in Appendix A of the WIG. Appendix A includes irrigation requirements for a number of crops and various stations across Washington State. Irrigation requirements for pasture/grass were used to determine outdoor water use for domestic purposes, assuming that those values are the best representation of outdoor domestic uses.
Two stations (Prosser and Richland) are within the project area. Irrigation requirements for these two stations are provided in Table 3.
As shown in Table 3, because of climate factors, there are significant differences between the two stations with Richland being 4.46 inches greater than Prosser on an annual basis. This difference was noted by members of the Technical Team at the May 24, 2018 meeting who recommended that values for both stations be accounted for estimating outdoor water use. For simplicity, a line was drawn across the project area approximately half way between Richland and Prosser (Figure 3). Outdoor water use estimates for areas west of the line are be based on WIG values for the Prosser station. Outdoor water use estimates for areas east of the line are based on WIG values for the Richland station. Approximately 37% of the building permits within the modified project area occur on the Prosser side of the line and 63% occur on the Richland side. (Table 4) This distribution of growth is expected to continue so these percentages are used for estimating future water use by permit-exempt wells.
Station Jan Feb Mar Apr May Jun Jul Aug Sep Oct Nov Dec Total
Prosser 0 0 0 0.75 5.88 7.27 9.27 7.57 4.91 1.64 0 0 37.29
Richland 0 0 0 0.88 6.59 8.05 10.31 8.36 5.49 2.07 0 0 41.75
Table 3 – Pasture/Turf Irrigation Requirements in inches (Appendix A, Washington Irrigation Guide, USDA, 1997)

EA Project No. 1563201 Page 5 EA Engineering, Science, and Technology, Inc., PBC July 9, 2018
Benton County, Washington Rural Water Supply Program
Table 4 - Number & Percentage of Building Permits within Modified Project Area
The irrigation requirements shown in Table 3 are expressed in inches per month. In order to calculate the volume of water used for outdoor uses, the area being irrigated must be known or assumed. For the purposes of this memo, four scenarios are presented to illustrate the range of rural domestic water use that may occur within the project area. The scenarios vary by amount of outdoor use and include indoor only, 1/12, 1/4, and 1/2 acre of irrigated area. Monthly, annual average, and total water use for each scenario, for both WIG stations, is presented in Table 5.
Table 5 - Total Household Water Use in Gallons per Day
The scenario of irrigating 1/12 acre results in an annual average water use of 393 gpd near Prosser and 421 near Richland. The Washington Department of Health’s Water Design Manual includes a standard of 350 gpd/ERU, which is widely assumed to be a typical domestic use. USGS has estimated a daily average of 138 gpcd for self-supplied domestic groundwater uses in the County (Lane and Welch, 2015). This is equivalent to a total household use of 372 gpd. Using the assumptions built into Table 5, an average of 372 gpd is enough water for indoor domestic use and irrigation of approximately 1/14 acre near Prosser and 1/15 acre near Richland.
Although greater than the DOH standard and USGS estimate, the scenario of irrigating 1/12 acre is selected to estimate future water use and calculate mitigation targets. It is anticipated that individual rural domestic uses will vary, however, because individual impacts are being combined, using an average value for calculation of the mitigation target is appropriate. The values associated with irrigation of 1/12 acre are assumed to represent average outdoor domestic water use within the project area. These values are higher than DOH design standards and greater than USGS estimates for Benton County and are selected for the purpose of calculating a suitable mitigation target.
Within Irrigation District
Outside of Irrigation District
Total
Prosser WIG Area 105 14 119Richland WIG Area 105 97 202
Total 210 111 321Prosser WIG Area 33% 4% 37%
Richland WIG Area 33% 30% 63%Total 65% 35% 100%
Jan Feb Mar Apr May Jun Jul Aug Sep Oct Nov DecAnnual Total
(Gallons)
Annual Daily Ave
(GPD)
Annual Total
(Acre-Ft)
162 162 162 162 162 162 162 162 162 162 162 162 59,171 162 0.18
1/12 Acre 162 162 162 219 591 710 839 715 532 282 162 162 143,714 393 0.44
1/4 Acre 162 162 162 332 1,450 1,807 2,192 1,820 1,273 521 162 162 312,478 856 0.96 1/2 Acre 162 162 162 501 2,737 3,452 4,222 3,477 2,384 880 162 162 565,624 1,549 1.74
1/12 Acre 162 162 162 228 643 769 915 772 576 313 162 162 153,807 421 0.47
1/4 Acre 162 162 162 361 1,605 1,984 2,420 1,993 1,404 615 162 162 342,755 938 1.05 1/2 Acre 162 162 162 560 3,048 3,805 4,677 3,823 2,647 1,069 162 162 626,178 1,714 1.92
Indoor + Outdoor Water
Use
Prosser
Richland
Indoor Use Only
EA Project No. 1563201 Page 6 EA Engineering, Science, and Technology, Inc., PBC July 9, 2018
Benton County, Washington Rural Water Supply Program
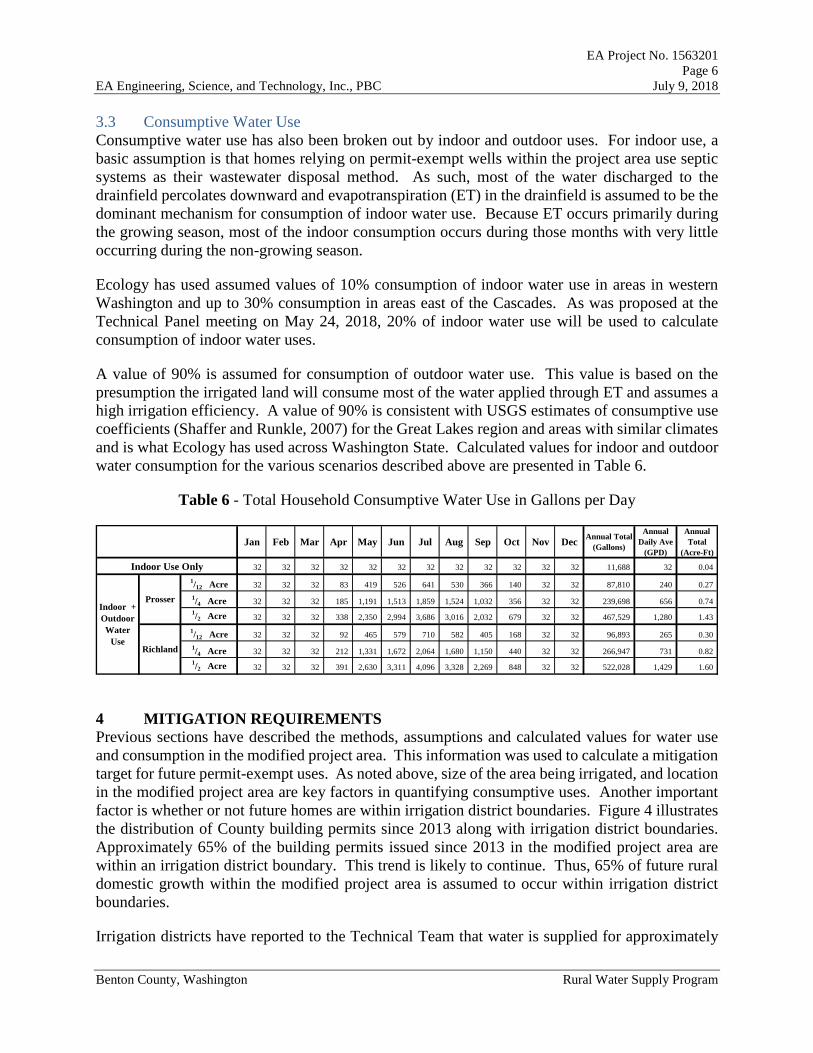
3.3 Consumptive Water Use Consumptive water use has also been broken out by indoor and outdoor uses. For indoor use, a basic assumption is that homes relying on permit-exempt wells within the project area use septic systems as their wastewater disposal method. As such, most of the water discharged to the drainfield percolates downward and evapotranspiration (ET) in the drainfield is assumed to be the dominant mechanism for consumption of indoor water use. Because ET occurs primarily during the growing season, most of the indoor consumption occurs during those months with very little occurring during the non-growing season.
Ecology has used assumed values of 10% consumption of indoor water use in areas in western Washington and up to 30% consumption in areas east of the Cascades. As was proposed at the Technical Panel meeting on May 24, 2018, 20% of indoor water use will be used to calculate consumption of indoor water uses.
A value of 90% is assumed for consumption of outdoor water use. This value is based on the presumption the irrigated land will consume most of the water applied through ET and assumes a high irrigation efficiency. A value of 90% is consistent with USGS estimates of consumptive use coefficients (Shaffer and Runkle, 2007) for the Great Lakes region and areas with similar climates and is what Ecology has used across Washington State. Calculated values for indoor and outdoor water consumption for the various scenarios described above are presented in Table 6.
Table 6 - Total Household Consumptive Water Use in Gallons per Day
4 MITIGATION REQUIREMENTS Previous sections have described the methods, assumptions and calculated values for water use and consumption in the modified project area. This information was used to calculate a mitigation target for future permit-exempt uses. As noted above, size of the area being irrigated, and location in the modified project area are key factors in quantifying consumptive uses. Another important factor is whether or not future homes are within irrigation district boundaries. Figure 4 illustrates the distribution of County building permits since 2013 along with irrigation district boundaries. Approximately 65% of the building permits issued since 2013 in the modified project area are within an irrigation district boundary. This trend is likely to continue. Thus, 65% of future rural domestic growth within the modified project area is assumed to occur within irrigation district boundaries.
Irrigation districts have reported to the Technical Team that water is supplied for approximately
Jan Feb Mar Apr May Jun Jul Aug Sep Oct Nov DecAnnual Total
(Gallons)
Annual Daily Ave
(GPD)
Annual Total
(Acre-Ft)
32 32 32 32 32 32 32 32 32 32 32 32 11,688 32 0.04
1/12 Acre 32 32 32 83 419 526 641 530 366 140 32 32 87,810 240 0.27
1/4 Acre 32 32 32 185 1,191 1,513 1,859 1,524 1,032 356 32 32 239,698 656 0.74 1/2 Acre 32 32 32 338 2,350 2,994 3,686 3,016 2,032 679 32 32 467,529 1,280 1.43
1/12 Acre 32 32 32 92 465 579 710 582 405 168 32 32 96,893 265 0.30
1/4 Acre 32 32 32 212 1,331 1,672 2,064 1,680 1,150 440 32 32 266,947 731 0.82 1/2 Acre 32 32 32 391 2,630 3,311 4,096 3,328 2,269 848 32 32 522,028 1,429 1.60
Indoor Use Only
Indoor + Outdoor Water
Use
Prosser
Richland

EA Project No. 1563201 Page 7 EA Engineering, Science, and Technology, Inc., PBC July 9, 2018
Benton County, Washington Rural Water Supply Program
99% of the outdoor domestic uses within their districts. Because this water is provided using an existing surface water right, mitigation for outdoor uses would not be required for 99% of new domestic growth within irrigation districts. For calculation of the mitigation target it is assumed that 65% (210/year) of all new permit-exempt uses within the modified project area will occur within irrigation district boundaries. As noted, 1%, (2/year) of these new uses will require mitigation for outdoor water use. One was assigned to each of the WIG stations for calculation of estimated consumptive use.
The values in Tables 2, 4 and 6 can be used to calculate a range of annual and 20-year mitigation requirements as described below and shown in Table 7. The indoor use only and 1/12 acre irrigated area scenarios are displayed for the low and high estimated mitigation targets.
Table 7 - Estimated Consumptive Use (Acre-Feet)
The projected growth estimate ranges between 64 and 109 new residential units per year within the modified project area. All of these units require mitigation for indoor water use rounded to an annual quantity of 0.04 acre-feet per unit. Approximately 4% (3-5 units/year) will require mitigation for outdoor water use based on the Prosser WIG station and 30% (20-34 units/year) will require mitigation for outdoor water use based on the Richland WIG station.
The values in the Indoor Only columns are for all homes in the modified project area. The values in the Indoor + 1/12 acre columns represent a distribution of growth based on 2013-18 building permit data. These values account for indoor and outdoor consumptive use based on the distribution of growth within or outside of irrigation district boundaries (Figure 4), as well as using the appropriate WIG values based on the line in Figure 3. Values in the Indoor + 1/12 acre columns represent the best estimate of the anticipated growth and mitigation targets. The actual mitigation requirement is likely to be somewhere between the high and low estimate.
5 TIMING AND LOCATION OF THE IMPACTS OF CONSUMPTIVE USE As described in the Benton County Groundwater Supply Assessment, discharge from the basalt and alluvial aquifer systems is generally toward topographic and structural lows, such as down dip in syncline axes and towards streams and lakes (EA, 2018). Shallow basalts commonly discharge to coulees and surface water systems while deeper units predominantly discharge into the major structural lows.
The shallow basalt system, likely the primary groundwater source in much of the project area, especially for permit exempt wells, likely discharges to the lower reaches of the Yakima River. As such, withdrawals from permit-exempt wells are likely to capture water that would otherwise discharge to the Yakima River. Initially, water withdrawn from the aquifer may reduce groundwater storage. Over the long-term, the amount of water captured and consumed by wells is likely to be equal to amount of reduced discharge from the aquifer. Thus, it is appropriate to
Annual 20 Year Annual 20 YearLow 2.30 46 9.26 185High 3.91 78 15.37 307
Growth Rate
Indoor Only Indoor + 1/12 acre
EA Project No. 1563201 Page 8 EA Engineering, Science, and Technology, Inc., PBC July 9, 2018
Benton County, Washington Rural Water Supply Program
assume that 100% of the consumptive use will impact flows in the lower Yakima River.
Although pumping varies seasonally, especially for irrigation uses, knowledge of the hydrogeologic setting suggests that impacts to the Yakima River are likely to be attenuated and spread out over time so that capture of surface water can be considered on an annual basis. The Technical Team agreed that this is the appropriate approach and that mitigation for permit-exempt withdrawals in the modified project area will be targeted as annual, rather than instantaneous quantities.
6 SUMMARY AND RECOMMENDATIONS This memo presents methods, assumptions, and estimates of growth projections and consumptive impacts from permit-exempt withdrawals in the Benton County portion of the Yakima River Basin. A range of estimates were made using published sources, data provided by the County, and input from the Technical Team.
Rural residential growth estimates were made for the modified project area based on recent build permit data (64 units/year) and the County Comprehensive Plan (109 units/year). The Comprehensive Plan likely over-estimates growth estimates but can be used to target mitigation quantities that may extend beyond the 20-year planning horizon. Mitigation estimates assume that 65% of the growth will be within irrigation district boundaries where outdoor water use will be supplied by the irrigation district to 99% of the homes.
The estimated low end of the projected mitigation requirement is 9.26 acre-feet per year and 185 acre-feet over 20 years. This value uses the low end of the growth rate (64 units/year) and assumes outdoor uses will average 1/12 of an acre. The estimated high end of the projected mitigation requirement is 15.37 acre-feet per year and 307 acre-feet over 20 years. This value uses the high end of the growth rate (109 units/year) and assumes outdoor uses will average 1/12 of an acre.
The actual mitigation requirement will be dependent on the number of homes constructed and the average irrigated area that is not served by irrigation districts. Available data suggests growth rates near the low end of the range, and irrigated area averaging around 1/12 acre or less, suggesting a reasonable mitigation target of approximately 250 acre-feet over the next 20 years.
Recommendations include:
• Pursue pre-1905 water rights for at least 200 acre-feet to mitigate for the lower range of future projected growth. The County should work to acquire higher amounts to potentially extend the period of mitigation coverage for larger growth rates or for growth beyond 20 years into the future. Because the project area is in the lower reaches of the Yakima River, potential mitigation options could be identified and pursued anywhere upstream of the western boundary of the County. Mitigation options can target annual, rather than instantaneous quantities.
• Share findings from this assessment with the Technical Team for feedback and further refine assumptions and analysis methods used in this memo. Key factors include verifying water use practices within irrigation districts and estimates of areas irrigated by permit-exempt wells.
EA Project No. 1563201 Page 9 EA Engineering, Science, and Technology, Inc., PBC July 9, 2018
Benton County, Washington Rural Water Supply Program
• Continue to track building permit data in the project area. Ideally the County could establish and maintain mitigation attributes associated with parcel data to track permit-exempt use and mitigation quantities.
• Continue efforts to establish the County’s rural water supply program.
7 LIMITATIONS AND UNCERTAINTIES This assessment was based on publically available information, published reports, and data provided by the County. Calculation of consumptive quantities, although thought to be representative of site conditions, are based on assumptions. Actual consumption depends on many factors that can vary widely across the modified project area. Projected growth patterns are based on a limited data set. Although existing growth patterns within the modified project area are assumed to continue, variation from this assumption is possible. One factor of uncertainty is the average area assumed to be irrigated (1/12 acre) in this analysis. During program development or implementation, if the County decides to modify the average area irrigated by future domestic uses, they may need to update the target mitigation amount identified in this analysis.
8 REFERENCES Anchor QEA LLC, 2018, Benton County Comprehensive Plan Update, prepared for Benton
County, Kennewick, Washington.
DeOreo, E.M., P.W. Mayer, Davis, B. Dziegielewski, and J.C. Kiefer, 2016, Residential End Uses of Water, Version 2, Denver, CO: Water Research Foundation.
EA (EA Engineering, Science, and Technology, Inc., PBC), 2018, Benton County Groundwater Supply Assessment, Benton County, Washington: Consulting report prepared for White Bluffs Consulting.
Lane, R.C., and Welch, W.B., 2015, Estimated freshwater withdrawals in Washington, 2010: U.S. Geological Survey Scientific Investigations Report 2015-5037, 48 p.
Mayer, P.W., E.M. DeOreo, E.M. Opitz, J.C. Kiefer, W.Y. Davis, B. Dziegielewski, and J.O. Nelson, 1999, Residential End Uses of Water, Denver, CO: Water Research Foundation.
Shaffer, K.H., and Runkle, D.L., 2007, Consumptive water-use coefficients for the Great Lakes Basin and climatically similar areas: U.S. Geological Survey Scientific Investigations Report 2007–5197, 191 p.
United State Department of Agriculture, 1997, Washington Irrigation Guide, Natural Resources Conservation Service.
Washington Department of Ecology, 2018, ESSB 6091 – Streamflow Restoration, Recommendations for Water Use Estimates, Publication 18-11-007.
Washington State Department of Health, 2009, Water System Design Manual, Division of Environmental Health, Office of Drinking Water.

This page intentionally left blank

FIGURES

This page intentionally left blank

Benton County Rural Water Supply Program
Figure 1 - Project Area
Land Use CategoryRural Remote
Rural Resource
Rural Transition
Urban
GMA Ag
Rural Commercial
Rural Community Center
Rural Industrial
J0 4.5 9
Miles
Project AreaYakima BasinYakim a Riv er
Benton County
Yakima Basin
Project Area
Badger Canyon AreaExcluded from Project Area

Figure 2 – Distribution of Indoor Per Capita Water Use (DeOreo et al. 2016)

Benton County Rural Water Supply Program
Figure 3 - WIG Stations for Outdoor Use
Land Use CategoryRural Remote
Rural Resource
Rural Transition
Urban
GMA Ag
Rural Commercial
Rural Community Center
Rural Industrial
J0 4.5 9
Miles
Project AreaYakima BasinYakim a Riv er
Benton County
Yakima Basin
Project Area
Badger Canyon AreaExcluded from Project Area
Prosser WIGIrrigation Requirements
Richland WIGIrrigation Requirements

Benton County Rural Water Supply Program
Figure 4 - Distribution of Building Permits and Irrigation Districts
J0 4.5 9
Miles
Project AreaYakima BasinYakim a Riv er
Benton County
Yakima Basin
Project Area
Badger Canyon AreaExcluded from Project Area
2013-18 Residential Building Permit
LEGENDIrrigation District
ColumbiaKennewickRozaSunnyside Valley
Badger MountainBenton

ATTACHMENTS

This page intentionally left blank

Technical Panel Guidance Provided on May 24, 2018
1. Mitigation Target
• Focus on consumptive use by permit-exempt wells within the Benton County portion of WRIA 37 for establishing the mitigation target.
• Focus on estimate water use and mitigation quantities for two time periods: o 2017 – 2037 consistent with the recently adopted comprehensive plan o 1905 – 2016 as back mitigation to cover existing rural water users
• The mitigation targets can be quantified on an annual basis (i.e., acre-feet/year) and remain focused on estimated consumptive use for rural domestic supply, noting this will also provide some coverage for stock water usage. (Other uses will need to find and fund their own mitigation approach at the time of application)
2. Methods and Assumptions for Calculating Mitigation Target for Rural Domestic Use
• Water use estimates will be 65 gpd/capita for indoor use and pasture irrigation duty [Combination of Richland and Prosser stations in Washington Irrigation Guide (WIG)] for outdoor use. Calculate values for various sizes of irrigated areas as well as consider the WDOH Water System Design Manual (350 gpd/ERU), and USGS estimates for self-supplied groundwater use for Benton County SIR 2015-5037.
• Indoor consumptive rate estimated at 20% • Outdoor consumptive rate of 90%, using WIG Appendix A values for a combination of Richland
and Prosser stations to estimate water duty for pasture/grass. • 20-year population growth estimate based on the County’s 2018 comprehensive plan. • The project area is the Benton County portion of WRIA 37. The Urban and Rural Community
Centers land use categories and other areas served by Group A or B water systems, as well as the Hanford area will be excluded. The estimate will primarily be focused on Rural Transition and Rural Remote land use categories but also include GMA Agriculture lands, which are the primary designated areas to be served by permit-exempt wells. Large portions of this area rely on irrigation district water for outdoor use. Assume 99% of the parcels within the irrigation district service areas use surface water for irrigation.
• Remove areas from the project area that drain to the Columbia River instead of the Yakima River such as much of Badger Canyon, Amon drainage and other associated areas that drain to the McNary pool.
3. Mitigation Water Sources
• Mitigation can occur anywhere in the Yakima basin upstream of Benton County, or even within Benton County for a portion of the offset that would occur downstream of the source.
• Focus on water rights outside of irrigation districts. • Reach out to NGOs, water conservancy boards and others to identify potential sources

2200 6th Ave., Suite 707 Seattle, WA 98121 Telephone: 206-452-5350 www.eaest.com
EA Engineering, Science, and Technology, Inc., PBC
TECHNICAL MEMORANDUM TO: Ben Floyd, White Bluffs Consulting FROM: Dave Nazy, LHg DATE: August 13, 2019 SUBJECT: Consumptive Indoor Domestic Water Use 1 INTRODUCTION
The purpose of this memo is to summarize a literature review conducted by EA of consumptive domestic water use for homes on septic systems. Benton County, with the Technical Team for their Rural Water Supply Program, has proposed using 20% for indoor water use consumption as part of their mitigation program. The County has requested a literature review to evaluate the basis for using 20%, or to update the value, if appropriate.
Consumption of water from septic systems can vary significantly based upon local hydrogeology, soil characteristics, depth to groundwater, distance to receiving waters and septic drainfield design. Little literature information is available regarding techniques to calculate or estimate septic return flows on a basinwide extent. Evapotranspiration would be expected to be the primary factor affecting consumption of water, although some water is consumed indoors through evaporation, cooking, and drinking.
Elements addressed in this memo include:
• Benton-Franklin Health District septic system design standards • Factors affecting consumptive use • Summary of literature review • Benton County On-Site Septic System Permits • Summary and conclusions
2 BENTON-FRANKLIN HEALTH DISTRICT SEPTIC SYSTEM DESIGN STANDARDS
The Benton-Franklin Health District has established standards for the design and construction of gravity flow onsite sewage disposal systems. Any new septic systems within the Rural Water Supply Program area would be required to meet these standards. The standards cover all aspects of septic system construction, although the discussion here is limited to the drainfield design. The Benton-Franklin Health District requires a minimum of 330 ft2 for drainfield area for a home with two bedrooms and 165 ft2 for each additional bedroom. Additional area is required for less

EA Project No.: 1561601 Page 2
EA Engineering, Science, and Technology, Inc., PBC August 2019
permeable soils, as shown in Table 1. Drainfields are designed for 120 gpd/bedroom for the loading rates shown in the table. The Rural Water Supply Program assumes an indoor use of 200 gpd which is equivalent to a loading rate of 0.6 gallons/ft2/day. Thus, a properly designed septic drainfield in soil types 1-4 would be capable of infiltrating the volume of indoor water used for the Rural Water Supply Program as Benton-Franklin Health District design standards require drainfields to be installed in soil types 2-4.
Table 1 - Benton-Franklin Health District Maximum Hydraulic Loading Rates
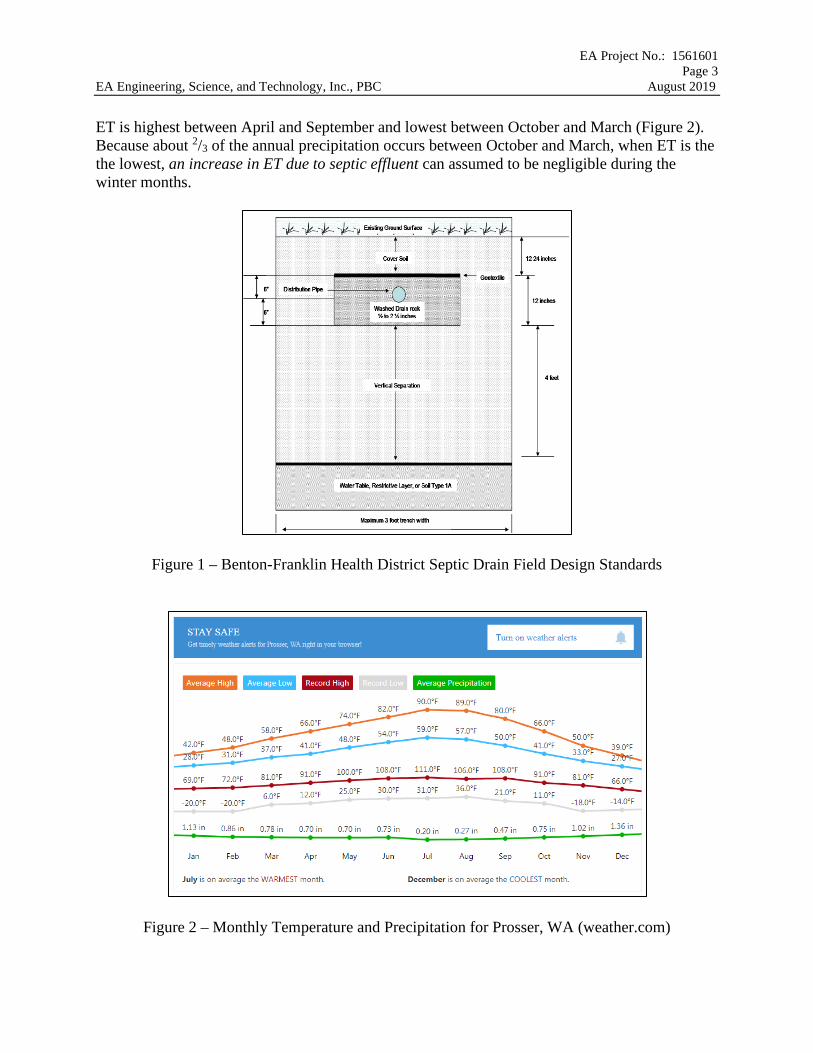
Figure 1 includes a cross-sectional view of a septic drainfield trench design. Distribution pipes must be 12-24 inches below the surface and covered with a geotextile to maintain permeability in the drain rock. Distribution pipes must be at least 4 feet above the water table. Although the root zone for most grasses is within the upper 12 inches, some septic effluent is likely to be taken up by plants over the drainfield. However, a properly constructed drainfield that meets the Benton-Franklin Health District requirements will minimize evapotranspiration losses. 3 FACTORS AFFECTING CONSUMPTIVE USE Water from septic systems goes to the atmosphere because it is taken up by vegetation growing on the lawn or application site and is transpired or moves up to the soil surface and evaporates. Evaporation and plant transpiration represent true consumptive use of water that will not return to streams (except as rainfall). Although indoor water use is assumed to be relatively constant, evapotranspiration (ET) varies seasonally with sunlight, precipitation and temperature.
EA Project No.: 1561601 Page 3
EA Engineering, Science, and Technology, Inc., PBC August 2019
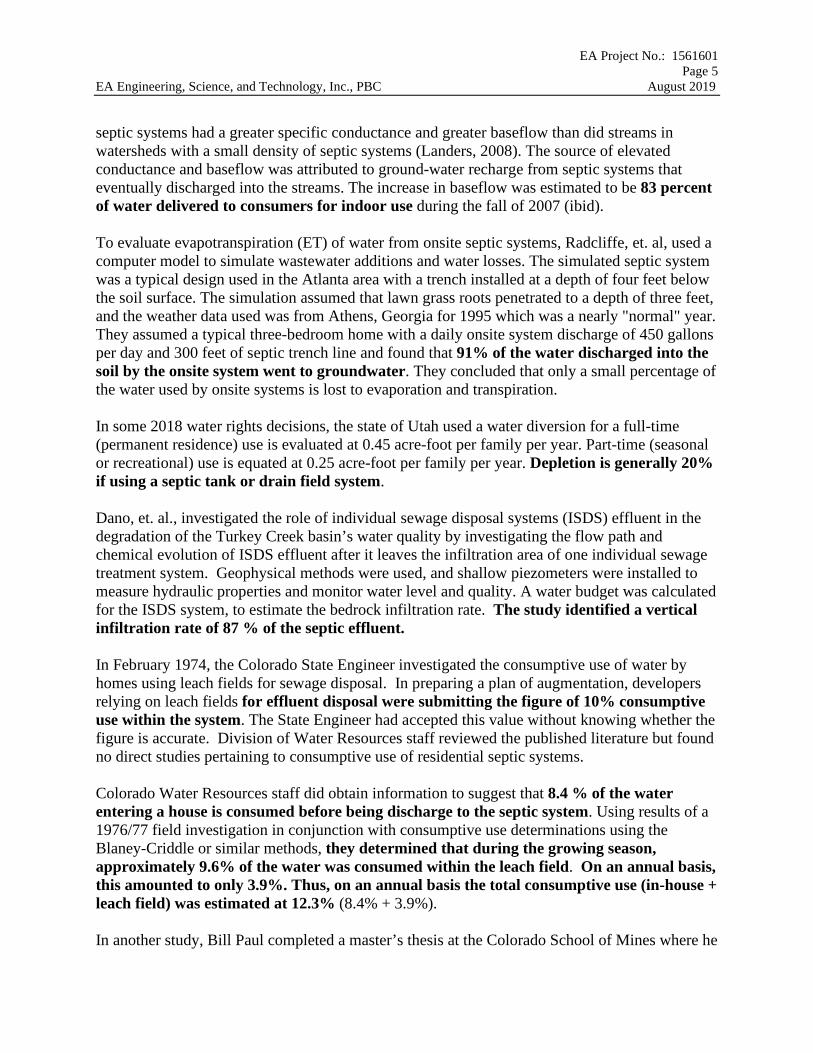
ET is highest between April and September and lowest between October and March (Figure 2). Because about 2/3 of the annual precipitation occurs between October and March, when ET is the the lowest, an increase in ET due to septic effluent can assumed to be negligible during the winter months.
Figure 1 – Benton-Franklin Health District Septic Drain Field Design Standards
Figure 2 – Monthly Temperature and Precipitation for Prosser, WA (weather.com)

EA Project No.: 1561601 Page 4
EA Engineering, Science, and Technology, Inc., PBC August 2019
Thus, it is likely that there is less than 10% consumption of indoor water use (< 20 gpd) between October and March. Between April and September when potential ET exceeds precipitation, some ET of septic effluent likely does occur, as some septic effluent is likely to be taken up by plants over the drainfield and warmer temperatures will increase evaporation from the soil. Capillary forces can move water laterally and upward in the unsaturated soil, making the moisture available for plant roots or direct evaporation into the atmosphere. Because the Rural Water Supply Program is based on annual values and very little ET of septic effluent occurs in the winter months, consumption of at least 30 % of the septic effluent between April and September would be needed in order to consume 20 % on an annual basis. This is not likely with a properly constructed drainfield the meets the Benton-Franklin Health District septic drainfield design standards as gravity will pull most of the water downward. 3 SUMMARY OF LITERATURE REVIEW Although assessment and regulation of consumptive use by permit-exempt wells has become important throughout Washington and in many western states, there are few studies intended to quantify indoor consumptive use for domestic use with septic systems. The Department of Ecology also conducted literature searches in the past decade and has chosen to assume 10 % consumption for basins in western Washington and 20 - 30 % for domestic uses on the east side of the Cascades. These assumptions were selected as reasonable values but are also intended to be on the conservative side (i.e., 30% in the upper Kittitas). A few studies that do attempt to quantify consumption are summarized below. In New Mexico, water-rights credits are approved for the portion of water originally pumped from a well that is returned to an aquifer from onsite wastewater systems. In approving a water-rights permit for the diversion of ground water in Roswell, the New Mexico State Engineer (2001) found that 50 percent of the water delivered to households in a public drinking-water system was discharged to the consumers’ septic system leach fields, and that 85 percent of the water discharged to the leach fields percolated through the vadose zone to the shallow aquifer. The return flow from septic systems in the Roswell case, therefore, was estimated to be 42.5 percent of the water delivered to the consumers which includes outdoor use. Blandford (2006) conducted a field investigation of return flow from septic systems at another site near Roswell. The study involved the review of well logs and other hydrogeologic data for the region, installation of test borings adjacent to active septic leach fields, collection and analysis of water and soil samples from the test borings and laboratory testing of soil hydraulic properties. The amount and timing of return flow was estimated using numerical simulation of several representative subsurface geologic configurations. The study estimated that an average return flow of 0.37 ac-ft/yr per household, which is 47 percent of the average amount of water delivered per household, reached the water table within a period of several months to 2 years. This value includes outdoor use. A hydrologic study in Georgia discovered that streams in watersheds with a large density of
EA Project No.: 1561601 Page 5
EA Engineering, Science, and Technology, Inc., PBC August 2019
septic systems had a greater specific conductance and greater baseflow than did streams in watersheds with a small density of septic systems (Landers, 2008). The source of elevated conductance and baseflow was attributed to ground-water recharge from septic systems that eventually discharged into the streams. The increase in baseflow was estimated to be 83 percent of water delivered to consumers for indoor use during the fall of 2007 (ibid). To evaluate evapotranspiration (ET) of water from onsite septic systems, Radcliffe, et. al, used a computer model to simulate wastewater additions and water losses. The simulated septic system was a typical design used in the Atlanta area with a trench installed at a depth of four feet below the soil surface. The simulation assumed that lawn grass roots penetrated to a depth of three feet, and the weather data used was from Athens, Georgia for 1995 which was a nearly "normal" year. They assumed a typical three-bedroom home with a daily onsite system discharge of 450 gallons per day and 300 feet of septic trench line and found that 91% of the water discharged into the soil by the onsite system went to groundwater. They concluded that only a small percentage of the water used by onsite systems is lost to evaporation and transpiration. In some 2018 water rights decisions, the state of Utah used a water diversion for a full-time (permanent residence) use is evaluated at 0.45 acre-foot per family per year. Part-time (seasonal or recreational) use is equated at 0.25 acre-foot per family per year. Depletion is generally 20% if using a septic tank or drain field system. Dano, et. al., investigated the role of individual sewage disposal systems (ISDS) effluent in the degradation of the Turkey Creek basin’s water quality by investigating the flow path and chemical evolution of ISDS effluent after it leaves the infiltration area of one individual sewage treatment system. Geophysical methods were used, and shallow piezometers were installed to measure hydraulic properties and monitor water level and quality. A water budget was calculated for the ISDS system, to estimate the bedrock infiltration rate. The study identified a vertical infiltration rate of 87 % of the septic effluent. In February 1974, the Colorado State Engineer investigated the consumptive use of water by homes using leach fields for sewage disposal. In preparing a plan of augmentation, developers relying on leach fields for effluent disposal were submitting the figure of 10% consumptive use within the system. The State Engineer had accepted this value without knowing whether the figure is accurate. Division of Water Resources staff reviewed the published literature but found no direct studies pertaining to consumptive use of residential septic systems. Colorado Water Resources staff did obtain information to suggest that 8.4 % of the water entering a house is consumed before being discharge to the septic system. Using results of a 1976/77 field investigation in conjunction with consumptive use determinations using the Blaney-Criddle or similar methods, they determined that during the growing season, approximately 9.6% of the water was consumed within the leach field. On an annual basis, this amounted to only 3.9%. Thus, on an annual basis the total consumptive use (in-house + leach field) was estimated at 12.3% (8.4% + 3.9%). In another study, Bill Paul completed a master’s thesis at the Colorado School of Mines where he

EA Project No.: 1561601 Page 6
EA Engineering, Science, and Technology, Inc., PBC August 2019
estimated that 84% of the ground water pumped returns to the subsurface. 4 BENTON COUNTY ON-SITE SEPTIC SYSTEM PERMITS A draft of this memo was discussed with Tom Ring, a hydrogeologist with the Yakama Nation and member of the Technical Team, for review in June 2019. Tom provided comments to Benton County on the draft on July 2, 2019. Tom’s comments centered around soil and septic system variability within the project area and how this would affect the amount of consumptive use locally. For example, project area soils include more permeable sandy soils to less permeable silty loam, as well as areas with persistent hardpan. Additionally, mound systems are permitted within the project area and these systems are expected to consume a much higher percentage of septic effluent water than conventional gravity flow systems. Tom suggested that variability within the project area should be considered rather than just use one set of assumptions when variability is known to exist. In response, Benton County contacted the Benton-Franklin Health District and requested septic system permit data, including system and soil type, as well as parcel number. Data was provided in July 2019 for permits issued since 2009 within the Benton County portion of the Yakima Basin. Because on-site soil data is only available within each permit file, the Health District could not provide soil data for each permitted system. However, the Health District did state that septic systems are not allowed in type 7 soils. (Dawson, 2019). Data provided by the county is summarized in Table 1 and illustrated on Figure 1.
The Benton-Franklin Health District provided coordinates and permit type for 734 permits. Using the coordinates provided, 54 of the permits fall within the Badger Canyon area that is excluded from the Rural Water Supply Program. Another 68 records do not plot within the Project Area due to lack of coordinates or errors in the data. Of the permits within the Project Area, approximately 75% are within Irrigation District boundaries. Holding tanks, mound and reuse systems are designed to prevent water from infiltrating into the water table, as these systems are built in areas that are not suitable for infiltration and are thus more consumptive than gravity flow systems. As shown in Table 1, these types of systems make up approximately 6% of the on-site septic systems permitted within the project area. If it is assumed that higher consumptive use systems (6% of the total) consume 100% of the septic effluent and the lower consumptive systems (94% of the total) consume 20%, indoor
Septic System Type Notes Number of Permits Percent of TotalConventional Gravity Flow System Soil type 2-5 472 64.3%Dosed Conventional Gravity Flow Soil type 2-6 50 6.8%Holding Tank controlled part time use 2 0.3%Intermittent Sand Filter & Mound Treatment level A 1 0.1%Mound System Shallow soils & bedrock 39 5.3%Oscar Low Flow Treatment System Enhanced treatment 1 0.1%Pressure Distribution Soil type 2-6 70 9.5%Pressure Distribution Sandlined Trench Soil type 1-6 (mostly 1) 97 13.2%Subsurface Drip System Enhanced treatment/reuse 2 0.3%
TOTAL 734 100%
Table 1 - On-Site Septic System Permits within Project Area 2009-2019

EA Project No.: 1561601 Page 7
EA Engineering, Science, and Technology, Inc., PBC August 2019
consumption averaged across all systems would be equal to 24.8%. However, as noted above, 20% consumption of indoor use is higher than almost all published estimates by as much as 11% As such, 20% is considered conservative for gravity flow and pressurized systems. It is also unlikely that all mound and reuse systems are 100% consumptive. If it is assumed that 15% is consumed by gravity fed and pressurized systems, which is more representative of other published studies, indoor consumption averaged across all systems would be equal to 20.1%. 5 SUMMARY AND CONCLUSIONS The available literature suggests that Benton County’s assumption of 20 % consumption of domestic indoor water use is a conservative estimate. Most of the studies intended to quantify indoor consumption have been closer to 10%. Benton County’s Rural Water Supply Program assumes 200 gpd indoor use with 40 gpd consumption with is equivalent to 14,600 gallons consumed annually. Actual indoor use is likely closer to 60 gpd per capita which is equal to 180 gpd for a 3-person home. This is also higher than the average household of around 2.5 people per home in Benton County. Properly constructed septic systems likely increase evapotranspiration on the drainfield by a small amount. However, this increase occurs primarily during the growing season between April and September. Benton-Franklin Health District data was evaluated to determine the type and number of septic systems permitted within the Project Area. This evaluation showed that approximately 94% of the septic systems being permitted are gravity flow and pressurized systems that are designed discharge septic effluent for infiltration and treatment. Six percent of the systems being permitted are designed primarily for consumption by ET or reuse. Assuming a value of 15% for the gravity flow and pressurized systems, which is more representative of published estimates, and 100% consumption for mound and reuse systems equates to an area-wide average of 20%. Assuming an actual use of 180 gpd/home and daily indoor consumption of 8.4 % (Colorado study) is equal to 5519 gallons consumed indoors annually (180 gpd x 365 days x 0.084 = 5519 gpy). Because the indoor consumptive volume is assumed by Benton County and the Technical Team to be 14,600 gpy (200 gpd x 365 days x 0.20 = 14,600 gpy), and increased ET from the drainfield likely only occurs between April and September, 9081 gallons would need to be consumed from the drainfield during the irrigation season to equal 14,600 gpy (14,600 – 5519 = 9081 gallons). Thus, 49.6 gpd (27.6 % of assumed actual use) would need to be consumed by increased ET from drainfield between April and September to equal the indoor water use mitigation volume selected by Benton County. Added with the assumed 8.4 % consumption indoors equals a total growing season consumption of 36 % of estimated actual indoor use (180 gpd x 0.36 = 64.8 gpd). Because it is unlikely that indoor consumption would be as high as 36 %, even in the summer months, assuming an annual rate of 20 % likely over-estimates the total volume of annual indoor consumptive use. Although there are many uncertainties, available information suggests that the assuming 20 % consumption of indoor domestic water use is conservative. This value is likely to adequately

EA Project No.: 1561601 Page 8
EA Engineering, Science, and Technology, Inc., PBC August 2019
mitigate indoor water uses within the Rural Water Supply Program area and is consistent with other investigations intended to quantity consumption of domestic indoor water use on a septic system. 5 REFERENCES Blandford, T.N. 2006. Evaluation of return flow from municipal type domestic water uses for return flow credits, Application RA -130 et al. Daniel B. Stephens and Associates consulting report prepared for Berrendo Cooperative Water Users Association, Roswell, New Mexico.
Dano, K., Poeter, E., and Thyne, G., 2004, Investigation of the Fate of Individual Sewage Disposal System Effluent in Turkey Creek Basin, Colorado, Department of Geology and Geological Engineering, Colorado School of Mines, Completion Report No. 200. Dawson, J.R., July 9, 2019, Email correspondence with Jerrod MacPherson regarding Septic tank/drainfield information – WRIA 37 (modified). Division of Water Resources Memorandum, February 13, 1974, Consumptive Use of Water by Homes Utilizing Leach Fields for Sewage Disposal: unpublished. Landers, M.N. 2008. Consumptive use of septic wastewater treatment systems: demonstration of a paired watershed approach. U.S. Geological Survey presentation material for the Metropolitan North Georgia Water Planning District, July 10, 2008. http://ga.water.usgs.gov/download/septic/OWTS_WU_USGS_ARC_handout.pdf
McQuillan, D., and Bassett, E., 2009, Return Flow to Ground Water from Onsite Wastewater Systems, Presentation at 18th Annual NOWRA Technical Conference and Expo, April 6-9, 2009, Milwaukee, WI. New Mexico State Engineer. 2001. Order in the matter of the application by Fambrough Water Cooperative Association for permit request for return flow credit for diversion of ground water within the Rowell artesian underground water basin in New Mexico. Hearing No. 99-060, OSE File 12 No. RA-406-A-A. 8 pp. http://www.ose.state.nm.us/water-info/hearing-decisions/hu99-060.pdf
Paul, B., 2007, Water Budget of Mountain Residence: Colorado School of Mines, M.S. thesis, 68 p.
Radcliffe, D., West, L., Morris, and Rasmussen, T., 2006, Onsite Wastewater and Land Application Systems: Consumptive Use and Water Quality, University of Georgia. Topper, Ralf, 2007, Consumptive Use Estimates for Return Flows from Individual Sewage Disposal Systems, Colorado Groundwater Association Newsletter, October 2007.

Preliminary Draft Cost per Acre Feet (AF) Basis Provided in Table 1 is a description of the costs associated with existing water rights acquired by the County, the amount acquired, purchase price for the water rights and some placeholder indirect costs, which includes consultant and outside legal counsel costs for supporting the water right acquisition process. The total cost is divided by the acquired acre‐feet (AF) of water acquired to identify the average cost per AF illustrated in this preliminary analysis. Table 2 identifies the preliminary costs for the three different draft mitigation packages being considered by the County, along with their consumptive water usage in AF/year. The consumptive portion of the mitigation certificate for each package is also identified on a cost/AF basis.
Table 1 ‐ Water Bank Acre Fee (AF) and Acquisition Costs Bank AF Cost Indirect Costs* Total Average cost per AF
LeeLynn 1 75 $487,500.00 $52,359.00 $539,859.00 $7,198.00
LeeLynn 2 50 $330,790.00 $52,359.00 $383,149.00 $7,663.00
Future TBD
125 $818,290.00 $104,718.00 $923,008.00 $7,384.00
* Assumed value to be updated based on actual costs as more acquisitions are made
Table 2 ‐ Unit Water Usage (AF/yr) and Cost/AF
Products Per unit AF/yr Cost/AF
Package A 0.045 $332.00
Package B 0.146 $1,078.00
Package C 0.247 $1,824.00

Package Fee Basis (A, B, C)
Fee Basis ‐ Package A Item Unit(hrs) Rate ($) Total Cost ($) NOTES
Planning Staff 3.65 $73.87 $269.91
Pre‐application review/assistance/research with applicant (.5 hrs), Application review and research (.5 hrs), Database entry & certificate issuance (0.25 hrs), Notifying applicant of group (0.25 hrs), Metering inspection (1.75 hrs), Approval status (0.15 hrs), Planning management (0.25 hrs), and Archiving files (0.25 hrs)
Support Staff 1 $49.82 $49.82 Application intake and assistance (0.5 hrs), Database entry (0.25 hrs), and Receipting & handling monies (0.25 hrs)
Planning Manager 0.1 $100.88 $10.09 Consultation (0.1 hrs)
Subtotal $329.51
Recording fees $103.50 One page; water bank tracking per parcel
Mitigation Certificate Costs $332.00 County cost recovery for 0.045 AF
$765.01
Fee Estimate $765.00
Fee Basis ‐ Package B Item Unit(hrs) Rate ($) Total Cost ($) NOTES
Planning Staff 3.65 $73.87 $269.91
Pre‐application review/assistance/research with applicant (.5 hrs), Application review and research (.5 hrs), Database entry & certificate issuance (0.25 hrs), Notifying applicant of group (0.25 hrs), Metering inspection (1.75 hrs), Approval status (0.15 hrs), Planning management (0.25 hrs), and Archiving files (0.25 hrs)
Support Staff 1 $49.82 $49.82 Application intake and assistance (0.5 hrs), Database entry (0.25 hrs), and Receipting & handling monies (0.25 hrs)
Planning Manager 0.1 $100.88 $10.09 Consultation (0.1 hrs)
Subtotal $329.51
Recording fees $103.50 One page; water bank tracking per parcel
Mitigation Certificate Costs $1,078.00 County cost recovery for 0.146 AF
$1,511.01
Fee Estimate $1,511.00
Fee Basis ‐ Package C Item Unit(hrs) Rate ($) Total Cost ($) NOTES
Planning Staff 3.65 $73.87 $269.91
Pre‐application review/assistance/research with applicant (.5 hrs), Application review and research (.5 hrs), Database entry & certificate issuance (0.25 hrs), Notifying applicant of group (0.25 hrs), Metering inspection (1.75 hrs), Approval status (0.15 hrs), Planning management (0.25 hrs), and Archiving files (0.25 hrs)
Support Staff 1 $49.82 $49.82 Application intake and assistance (0.5 hrs), Database entry (0.25 hrs), and Receipting & handling monies (0.25 hrs)
Planning Manager 0.1 $100.88 $10.09 Consultation (0.1 hrs)
Subtotal $329.51
Recording fees $103.50 One page; water bank tracking per parcel
Mitigation Certificate Costs $1,824.00 County cost recovery for 0.247 AF
$2,257.01
Fee Estimate $2,257.00