appendix l: water balance – surface water transfer to ... · black butte copper project mine...
TRANSCRIPT
Black Butte Copper Project Mine Operating Permit Application
APPENDIX L: Water Balance – Surface Water Transfer to Water Treatment Plant
Tintina Montana, Inc. December 2, 2015
www.k n i g ht pi e s ol d .com
October 7, 2015
Mr. Bob Jacko Vice President Operations Tintina Resources Inc. 1110 - 1111 West Georgia Street Vancouver, British Columbia Canada, V6E 4M3
Dear Bob,
File No.:VA101-00460/03-A.01 Cont. No.:VA15-03200
Re: Black Butte Copper Project Water Balance - Surface Water Transfer to Water Treatment Plant The Black Butte Copper Project (the Project) is a proposed underground copper mine located approximately 32 km north of White Sulphur Springs, Montana. An update to the life-of-mine site wide water balance model has been completed by Knight Piésold (KP) to incorporate the transfer of surface water from the Process Water Pond and the Cemented Tailings Facility to the Water Treatment Plant, with subsequent treatment and release to the environment. Surface water includes direct precipitation on mine facilities, as well as runoff contributing to mine facilities. This letter details the model objectives, parameters, assumptions, and results.
1 – MODEL OBJECTIVES
This water balance is an update to the KP letter Updated Water Balance with Wet and Dry Years (KP, 2015a) issued to Tintina Resources Inc. (Tintina) on September 2, 2015. The primary objective of this update is to reflect the design change to convey all surface water from the Cemented Tailings Facility (CTF) and the Process Water Pond (PWP) to the Water Treatment Plant (WTP), which proportionally increases the water requirement from the underground source.
The model was developed using the GoldSim© modeling platform. Deterministic and stochastic approaches were used, and 15 years were modeled including two pre-production years and 13 years of operations.
2 – MODEL PARAMETERS AND ASSUMPTIONS
The following sections outline the parameters and assumptions that were used to create the water balance model. The model results are dependent on these assumptions, and only valid if the parameters remain as outlined below.
2.1 GENERAL
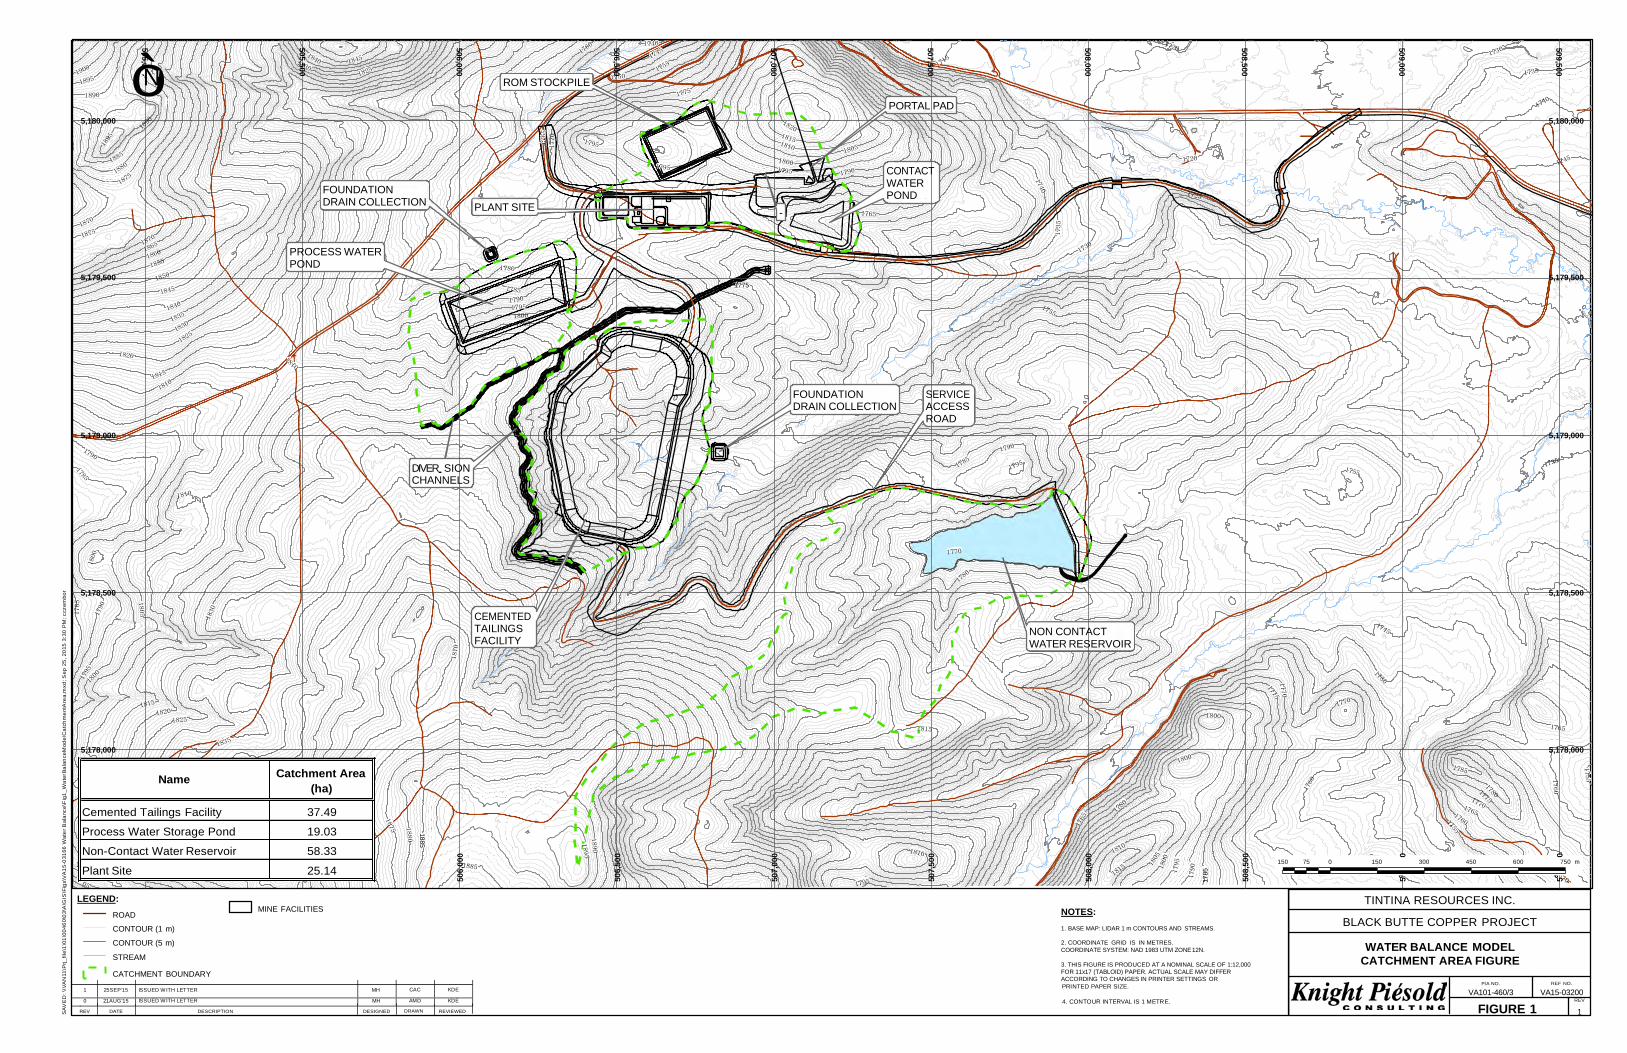
Cemented tailings disposal is the chosen waste management method for the Project. The tailings will be impounded in the CTF, as shown on Figure 1. The PWP will store water from various inputs such as mill circulating load and the mill reclaim water. The PWP also collects surface water runoff and precipitation reporting to the PWP, including the water transferred from the CTF; all of which will be conveyed to the WTP, treated, and released to the environment.
Make-up water for the PWP will be sourced from underground dewatering and is assumed to not require treatment. In addition, freshwater will be supplied to the mill for special uses from underground dewatering after it has been treated in the WTP. Any treated water not being used for mine operations will be released to the environment.
Meteorological parameters for the model were developed by KP using site specific data in conjunction with regional data as described in KP’s meteorological data analysis memo VA15-02445 (KP, 2015b). The
Knight Piésold Ltd. | Suite 1400 – 750 West Pender St, Vancouver, BC Canada V6C 2T8 | p. +1.604.685.0543 f. +1.604.685.0147
2 of 6 VA15-03200 October 7, 2015
determined mean monthly precipitation and evaporation values are used as inputs in the model for each year. It is also assumed that the precipitation from November through to March falls as snow and accumulates as snowpack until the spring, when it melts during April and May. Therefore, the precipitation that accumulates between November and March will report to the PWP during April and May. A stochastic model was created with monthly coefficient of variations for the precipitation record to simulate dry year and wet year conditions.
The mill input and output requirements, along with miscellaneous freshwater requirements (truck wash, dust control etc.), were provided to KP by Tetra Tech (TT) via email correspondence with Jianhui Huang, dated September 16, 2015 (TT, 2015). The mill requirements were provided as annual rates for the life of mine. The preliminary inputs to the water balance model are shown in Table 1.
Table 1 Water Balance Inputs
Component Units Value Source
Hydrometeorology Mean Annual Precipitation mm 416 KP Mean Annual Pond Evaporation mm 514 KP Runoff Coefficient (Undisturbed Ground) mm 0.2 KP Runoff Coefficient (Disturbed Ground /Facility Footprints) mm 1.0 KP (Assumes no seepage
from facilities) Ore Production
Ore Water to Mill m3/yr 12,000 to 52,000 John Huang, TT1
Tailings Production Nominal Mill Process rate tonne/day 3,300 Tintina Tailings Dry Density tonne/m3
2.0 Tintina Tailings Specific Gravity - 3.77 Tintina Tailings Solids Content - 74% Tintina Tailings Water to CTF m3/yr 51,000 to 221,000 John Huang, TT1
Tailings Water to Underground m3/yr 42,000 to 186,000 John Huang, TT1
Water Lost to Voids % 100% Assumption Mill Process
Freshwater Requirements m3/yr 44,000 to 192,000 John Huang, TT1
Water lost to Concentrate m3/yr 4,000 to 16,000 John Huang, TT1
Thickener Overflow m3/yr 938,000 to 4,107,000 John Huang, TT1
Required Water from the PWP m3/yr 979,000 to 4,286,000 John Huang, TT1
Other Freshwater Use m3/yr 49,000 John Huang, TT Underground Dewatering gpm 500 Hydrometrics
NOTES: 1. Range of values for the life of mine, based on the production schedule.
2.2 WATER MANAGEMENT
The PWP has been designed for a maximum operating volume of 200,000 m3. This analysis assumes a minimum allowable pond volume of 120,000 m3 and a maximum allowable volume of 200,000 m3, thereby defining the operating range as 120,000 m3 to 200,000 m3.
The PWP starting volume of 120,000 m3, likely sourced from underground dewatering, will be in-place two months prior to the start of operations. The PWP monthly make-up water is calculated as additional water required to satisfy mill water requirements once the minimum allowable volume is reached in the PWP.
Each modeled mine year starts in June, as it was assumed that the mill would initially begin operations following the spring freshet period (April and May) of the first year of operations. It is assumed that pond water
3 of 6 VA15-03200 October 7, 2015
accumulating in the CTF will be pumped to the PWP immediately. Surface water, as runoff, and direct precipitation reporting to the mill is assumed to be routed to the WTP.
A large percentage of runoff within the CTF and PWP catchment areas will be diverted via a surface water diversion ditch system and discharged downstream (Figure 1); however, there is still a portion of the catchment area surface runoff that reports to the respective facilities. The runoff coefficient for undisturbed ground was assumed to be 0.2 based on the Manhattan Design Standards report (Thomas, et al. 2008). A runoff coefficient of 1.0 was assumed for disturbed ground surfaces, as the facilities will be geomembrane-lined and therefore impervious. It was also conservatively assumed that there would be no seepage from lined facilities.
The portion of the surface water runoff that is not diverted around the CTF and PWP (Figure 1), as well as the precipitation that falls directly on the two facilities will be collected in the PWP and routed to the WTP for treatment prior to release to the environment. The make-up water required to operate the mill will be sourced from underground dewatering.
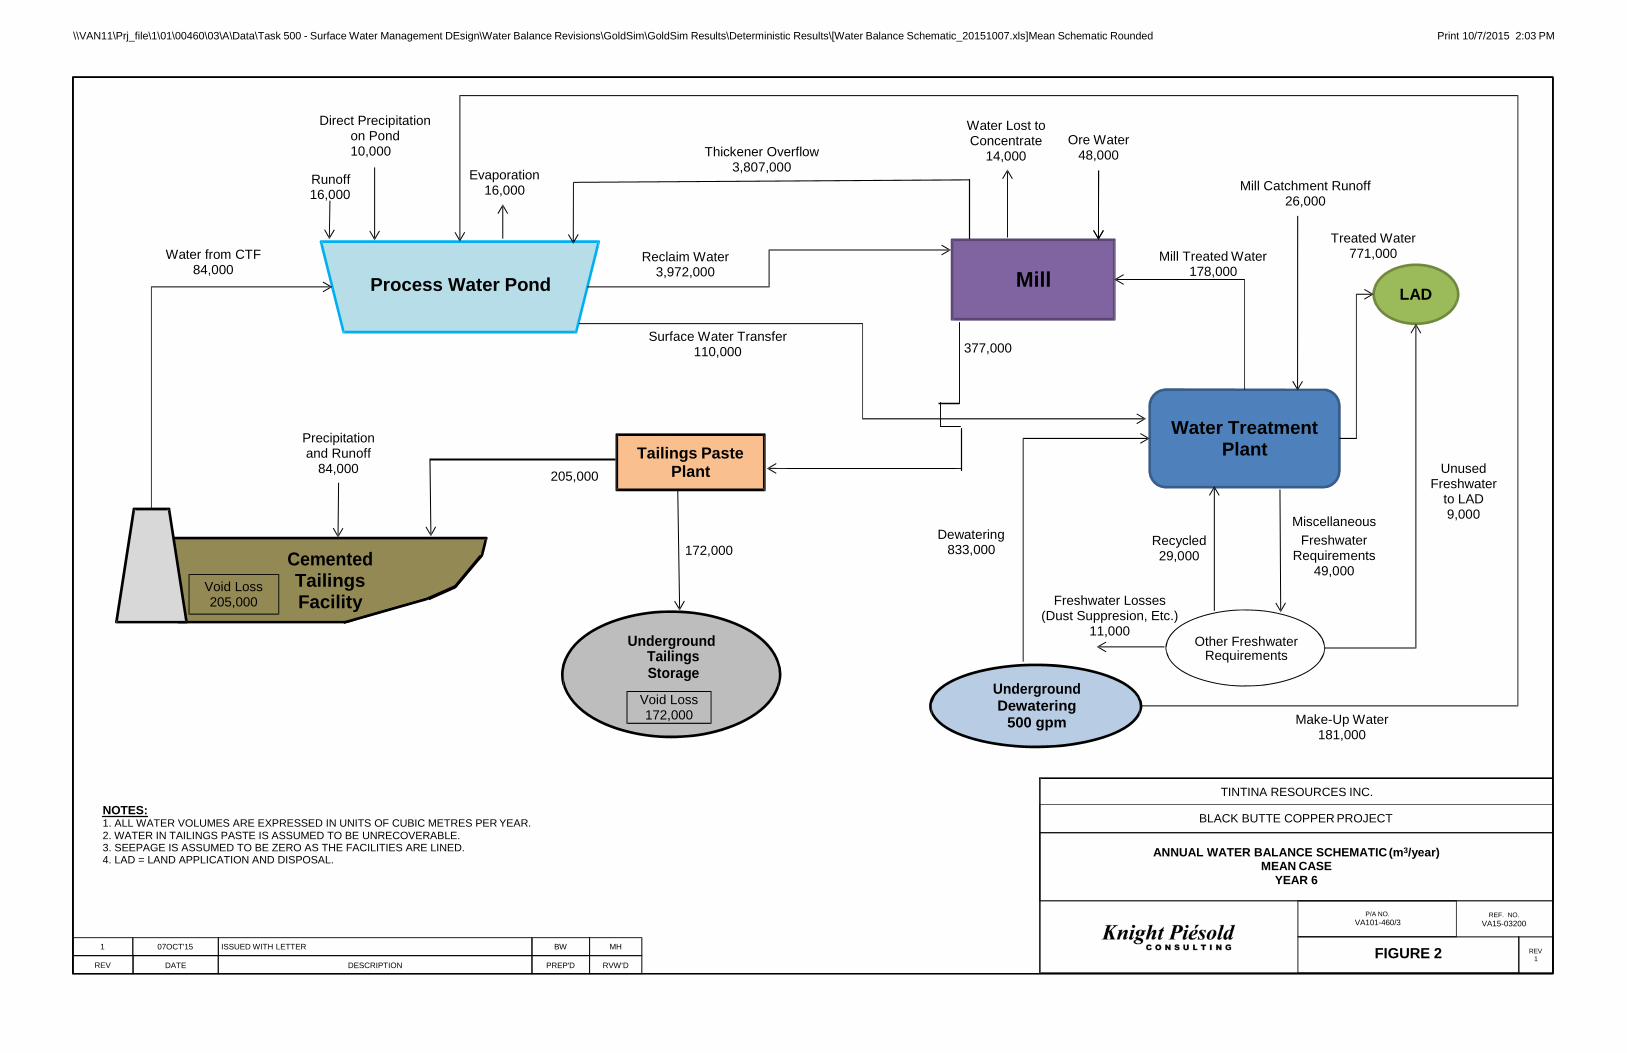
The water balance schematic, shown on Figure 2, was used as the basis for model development and shows the annual inflows and outflows from the facilities during the sixth year of production (year 6) under mean climatic conditions.
The site water management plan, as interpreted by KP based on discussions with Tintina, is described below: • The primary source of reclaim water for the mill is the PWP. • Surface water reporting to the CTF will be transferred to the PWP. • Surface water reporting to the PWP, including that transferred from the CTF, will be transferred to the WTP
where it will be treated prior to discharge to the environment. • Additional make-up water required by the mill is assumed to be supplied from underground dewatering and
stored in the PWP. o Note that make-up water required by the PWP is assumed to be untreated; however, freshwater
required by the mill is assumed to be treated by the WTP.
Evaporation and direct precipitation on the PWP pond were accounted for in the water balance. The surface area was calculated for each time-step using the Depth-Area-Capacity (DAC) data for the facility.
2.3 GENERAL MODEL LIMITATIONS
The following limitations should be considered when reviewing the results of the water balance model. • Increasing consolidation of the tailings was not accounted for in the model; instead it was assumed that all
water locked in the cemented tailings voids is not recoverable (void loss). • Snowpack, snowmelt and sublimation parameters are based on estimates as no detailed study has been
conducted.
3 – WATER BALANCE MODEL RESULTS
Three separate scenarios were modeled using the life-of-mine water balance in order to obtain an understanding of the water requirements of the PWP during operations. The model was run deterministically for the mean case, and stochastically for the abnormally wet (95th percentile) and abnormally dry (5th percentile) cases. A gamma distribution was assumed for the precipitation data in the stochastic models and a Monte Carlo simulation was executed using 5,000 iterations. The estimated monthly precipitation volumes reporting to the proposed mine site, and the resulting effects on the volumes in the PWP, have been presented in terms of probabilities of occurrence for the three scenarios: • Scenario 1 – Mean: The model was run deterministically and the results correspond to mean monthly
climatic conditions (Figure 2). • Scenario 2 – 95th Percentile (Wet): The results correspond to abnormally wet conditions, and represent the
climatic conditions to be exceeded once every 20 years, on average.
4 of 6 VA15-03200 October 7, 2015
• Scenario 3 – 5th Percentile (Dry): The results correspond to abnormally dry conditions, and represent the climatic conditions expected to be exceeded 19 years out of 20, on average (i.e. volumes will not exceed these values more than once every 20 years, on average).
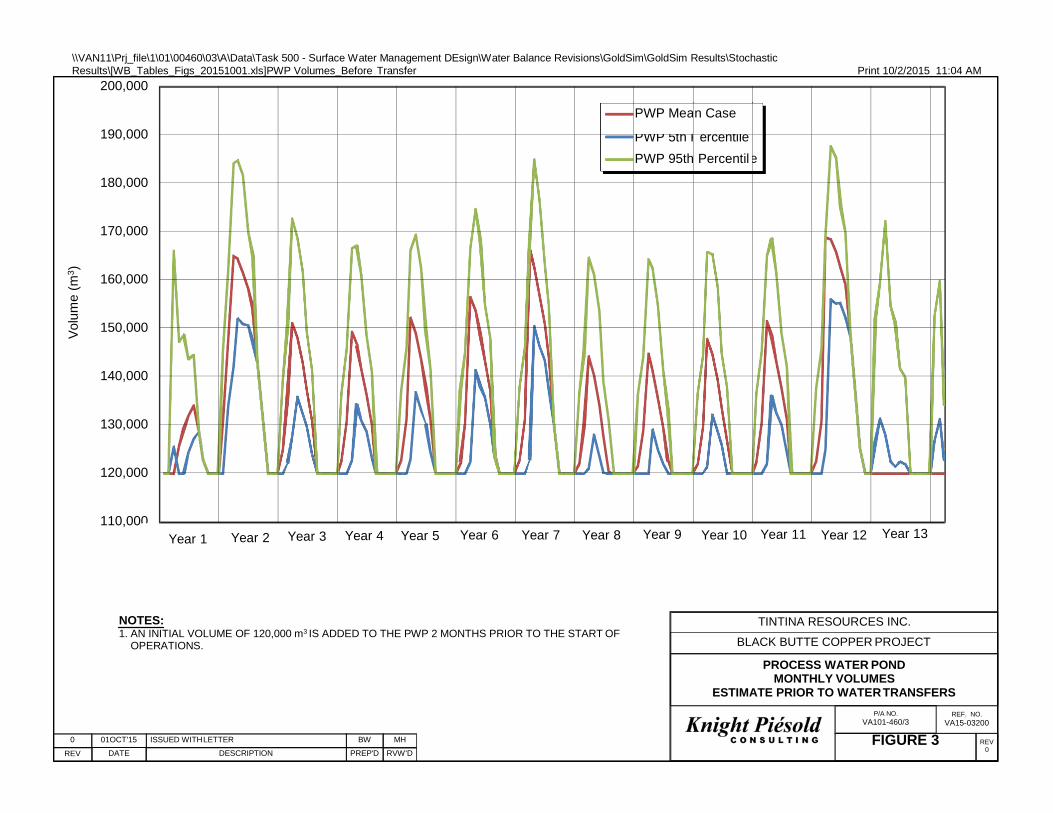
The estimated PWP pond volume prior to the surface water transfer to the WTP and groundwater transfer to the PWP is shown on Figure 3, for all three climatic scenarios. The volume trends show that there is sufficient storage capacity in the PWP during abnormally wet year scenarios (95th percentile). There is also sufficient volume to support the project in a dry year (5th percentile), when the groundwater source is used as make-up water.
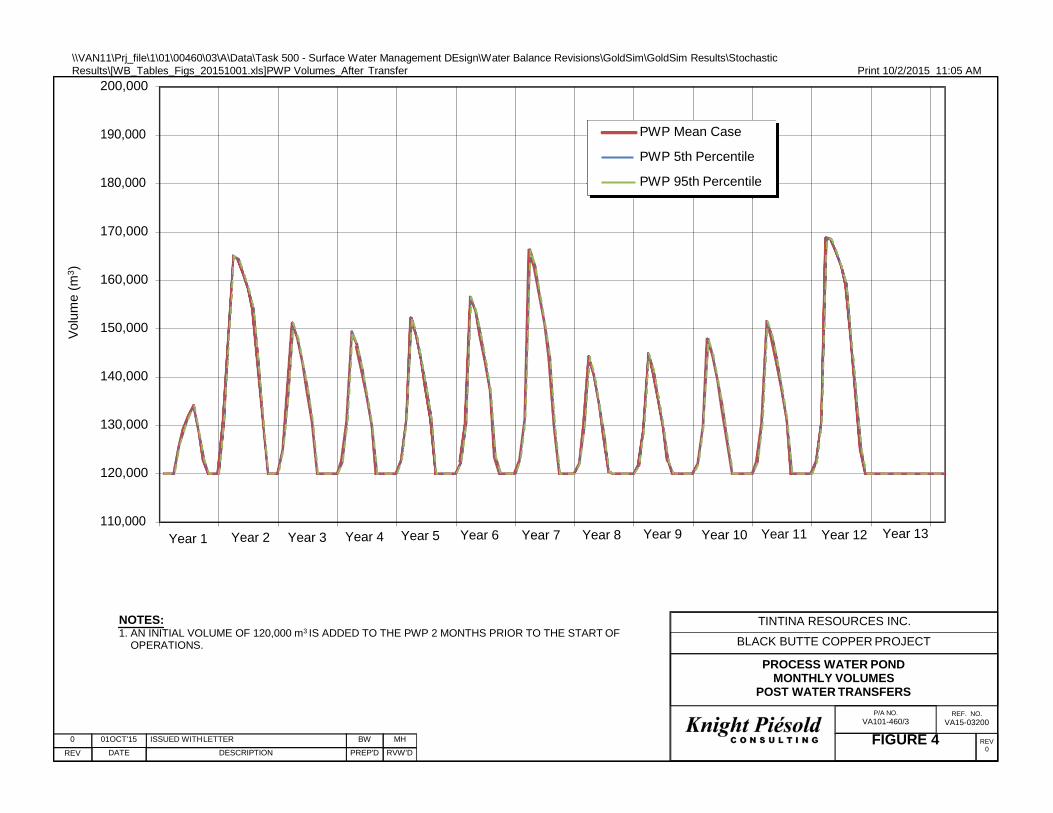
The PWP pond volume, after surface water transfer to the WTP and groundwater transfer to the PWP, is shown on Figure 4; which shows that the pond volume for each scenario is similar after the water transfer is included in the model. The amount of water transferred to the WTP and released to the environment is greater than the amount required to keep the pond volume within the mean scenario operating range for mean and abnormally wet conditions. The results for all 3 scenarios are outlined in the sections below.
3.1 SCENARIO 1 RESULTS (MEAN)
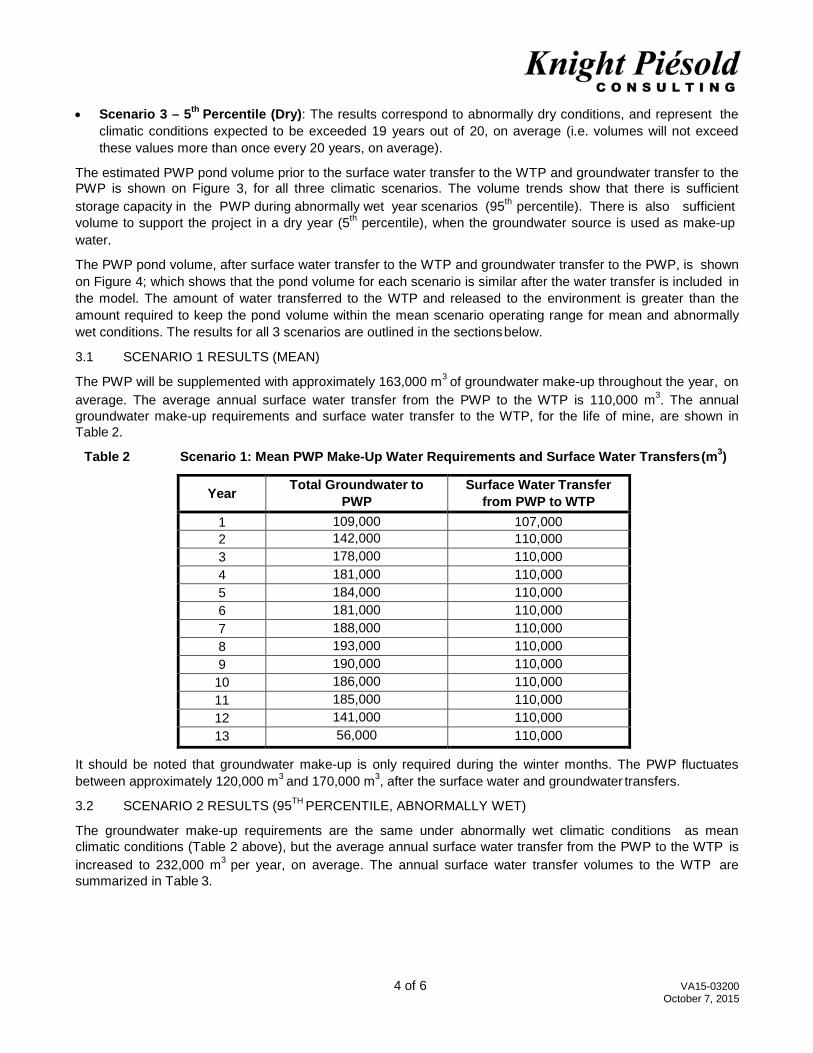
The PWP will be supplemented with approximately 163,000 m3 of groundwater make-up throughout the year, on average. The average annual surface water transfer from the PWP to the WTP is 110,000 m3. The annual groundwater make-up requirements and surface water transfer to the WTP, for the life of mine, are shown in Table 2.
Table 2 Scenario 1: Mean PWP Make-Up Water Requirements and Surface Water Transfers (m3)
Year Total Groundwater to PWP
Surface Water Transfer from PWP to WTP
1 109,000 107,000 2 142,000 110,000 3 178,000 110,000 4 181,000 110,000 5 184,000 110,000 6 181,000 110,000 7 188,000 110,000 8 193,000 110,000 9 190,000 110,000
10 186,000 110,000 11 185,000 110,000 12 141,000 110,000 13 56,000 110,000
It should be noted that groundwater make-up is only required during the winter months. The PWP fluctuates between approximately 120,000 m3 and 170,000 m3, after the surface water and groundwater transfers.
3.2 SCENARIO 2 RESULTS (95TH PERCENTILE, ABNORMALLY WET)
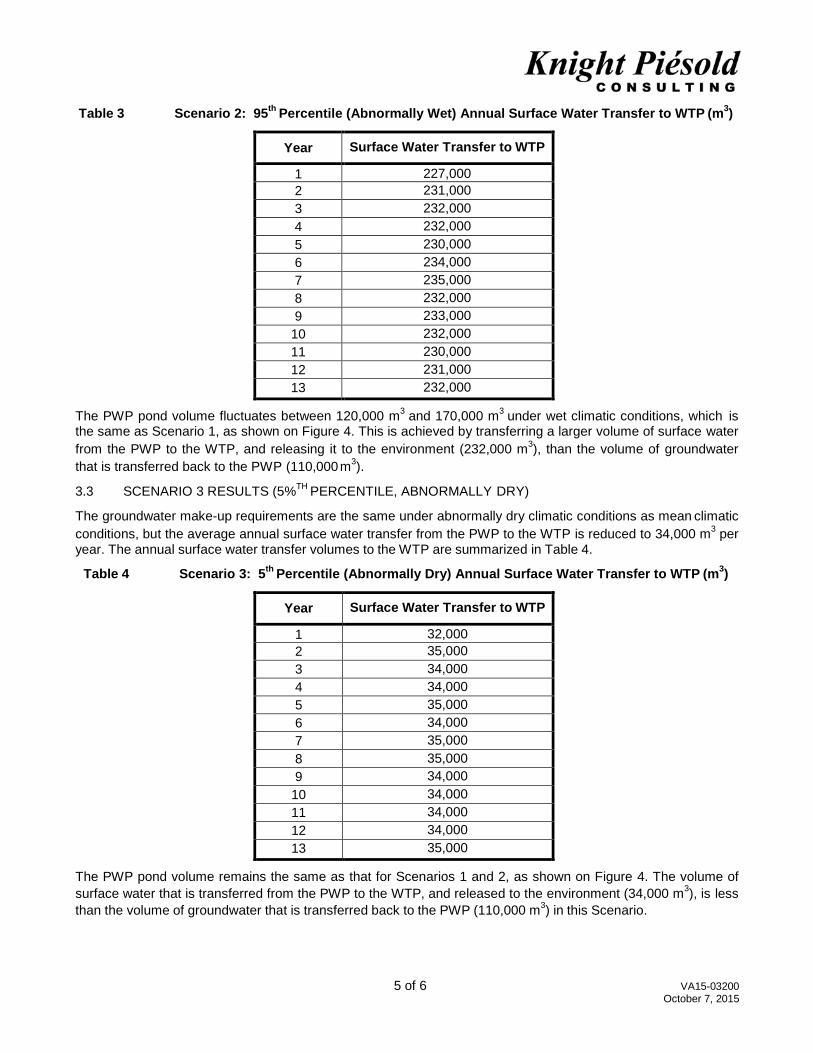
The groundwater make-up requirements are the same under abnormally wet climatic conditions as mean climatic conditions (Table 2 above), but the average annual surface water transfer from the PWP to the WTP is increased to 232,000 m3 per year, on average. The annual surface water transfer volumes to the WTP are summarized in Table 3.
5 of 6 VA15-03200 October 7, 2015
Table 3 Scenario 2: 95th Percentile (Abnormally Wet) Annual Surface Water Transfer to WTP (m3)
Year Surface Water Transfer to WTP
1 227,000 2 231,000 3 232,000 4 232,000 5 230,000 6 234,000 7 235,000 8 232,000 9 233,000
10 232,000 11 230,000 12 231,000 13 232,000
The PWP pond volume fluctuates between 120,000 m3 and 170,000 m3 under wet climatic conditions, which is the same as Scenario 1, as shown on Figure 4. This is achieved by transferring a larger volume of surface water from the PWP to the WTP, and releasing it to the environment (232,000 m3), than the volume of groundwater that is transferred back to the PWP (110,000 m3).
3.3 SCENARIO 3 RESULTS (5%TH PERCENTILE, ABNORMALLY DRY)
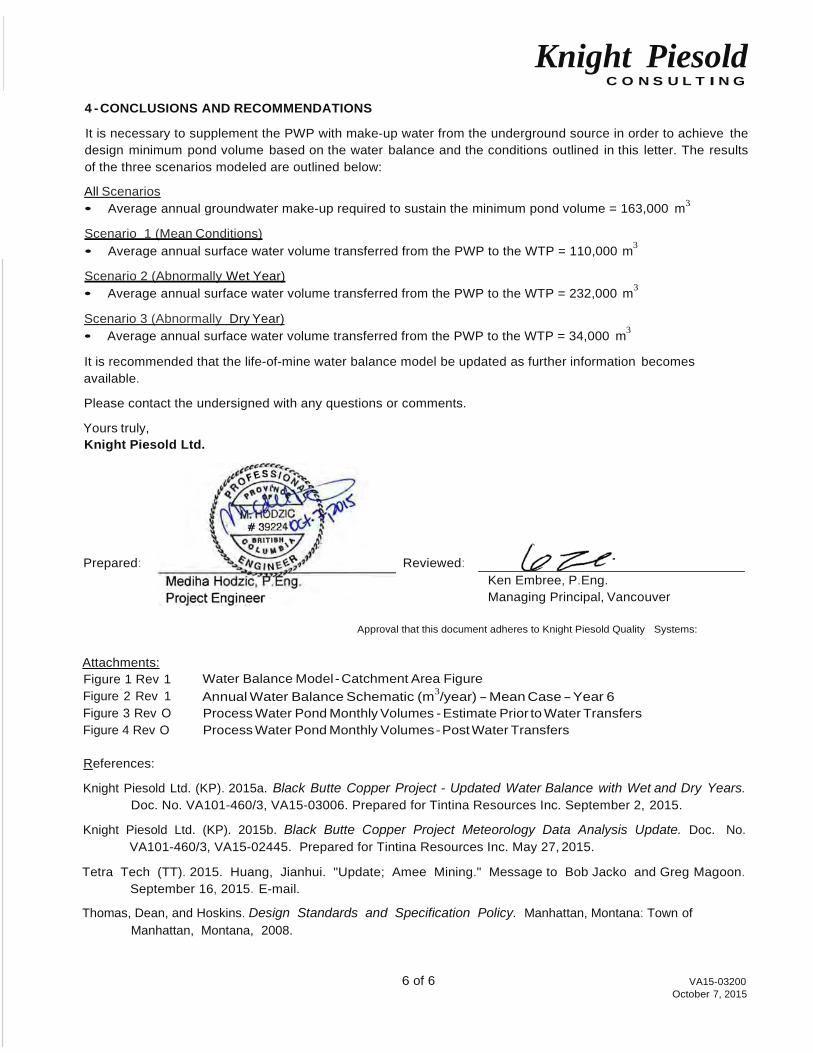
The groundwater make-up requirements are the same under abnormally dry climatic conditions as mean climatic conditions, but the average annual surface water transfer from the PWP to the WTP is reduced to 34,000 m3 per year. The annual surface water transfer volumes to the WTP are summarized in Table 4.
Table 4 Scenario 3: 5th Percentile (Abnormally Dry) Annual Surface Water Transfer to WTP (m3)
Year Surface Water Transfer to WTP
1 32,000 2 35,000 3 34,000 4 34,000 5 35,000 6 34,000 7 35,000 8 35,000 9 34,000
10 34,000 11 34,000 12 34,000 13 35,000
The PWP pond volume remains the same as that for Scenarios 1 and 2, as shown on Figure 4. The volume of surface water that is transferred from the PWP to the WTP, and released to the environment (34,000 m3), is less than the volume of groundwater that is transferred back to the PWP (110,000 m3) in this Scenario.
6 of 6 VA15-03200 October 7, 2015
Knight Piesold C O N S U L T I N G
4 - CONCLUSIONS AND RECOMMENDATIONS
It is necessary to supplement the PWP with make-up water from the underground source in order to achieve the design minimum pond volume based on the water balance and the conditions outlined in this letter. The results of the three scenarios modeled are outlined below:
All Scenarios • Average annual groundwater make-up required to sustain the minimum pond volume = 163,000 m3
Scenario 1 (Mean Conditions) • Average annual surface water volume transferred from the PWP to the WTP = 110,000 m3
Scenario 2 (Abnormally Wet Year) • Average annual surface water volume transferred from the PWP to the WTP = 232,000 m3
Scenario 3 (Abnormally Dry Year) • Average annual surface water volume transferred from the PWP to the WTP = 34,000 m3
It is recommended that the life-of-mine water balance model be updated as further information becomes available.
Please contact the undersigned with any questions or comments.
Yours truly, Knight Piesold Ltd.
Prepared: Reviewed:
Ken Embree, P.Eng. Managing Principal, Vancouver
Approval that this document adheres to Knight Piesold Quality Systems:
Attachments: Figure 1 Rev 1 Figure 2 Rev 1 Figure 3 Rev O Figure 4 Rev O
Water Balance Model - Catchment Area Figure Annual Water Balance Schematic (m3/year) - Mean Case - Year 6 Process Water Pond Monthly Volumes - Estimate Prior to Water Transfers Process Water Pond Monthly Volumes - Post Water Transfers
References:
Knight Piesold Ltd. (KP). 2015a. Black Butte Copper Project - Updated Water Balance with Wet and Dry Years. Doc. No. VA101-460/3, VA15-03006. Prepared for Tintina Resources Inc. September 2, 2015.
Knight Piesold Ltd. (KP). 2015b. Black Butte Copper Project Meteorology Data Analysis Update. Doc. No. VA101-460/3, VA15-02445. Prepared for Tintina Resources Inc. May 27, 2015.
Tetra Tech (TT). 2015. Huang, Jianhui. "Update; Amee Mining." Message to Bob Jacko and Greg Magoon. September 16, 2015. E-mail.
Thomas, Dean, and Hoskins. Design Standards and Specification Policy. Manhattan, Montana: Town of Manhattan, Montana, 2008.
0 0 0 5 , , 9 9 0 107
5 184
50 18 55
18 1860
5 0 6 84 8 1 1 0 7 8 1
0 0 0 0 0 5 , , 1800 0 5 5 0 18 5 5
505,000 >
0 0
ò"N
ROM STOCKPILE
PORTAL PAD 5,180,000 5,180,000
FOUNDATION DRAIN COLLECTION
PLANT SITE
CONTACT WATER POND
-
PROCESS WATER POND
5,179,500 5,179,500 1775
FOUNDATION DRAIN COLLECTION
SERVICE ACCESS ROAD
5,179,000 5,179,000
DIVER- SION CHANNELS
5,178,500 5,178,500
CEMENTED TAILINGS FACILITY
NON CONTACT WATER RESERVOIR
2
5,178,000 5,178,000
Name Catchment Area (ha)
Cemented Tailings Facility 37.49
Process Water Storage Pond 19.03
Non-Contact Water Reservoir 58.33
Plant Site 25.14 150 75 0 150 300 450 600 750 m
LEGEND: ROAD
CONTOUR (1 m)
CONTOUR (5 m)
STREAM
CATCHMENT BOUNDARY
MINE FACILITIES
NOTES: 1. BASE MAP: LIDAR 1 m CONTOURS AND STREAMS.
2. COORDINATE GRID IS IN METRES. COORDINATE SYSTEM: NAD 1983 UTM ZONE 12N.
3. THIS FIGURE IS PRODUCED AT A NOMINAL SCALE OF 1:12,000 FOR 11x17 (TABLOID) PAPER. ACTUAL SCALE MAY DIFFER ACCORDING TO CHANGES IN PRINTER SETTINGS OR
TINTINA RESOURCES INC.
BLACK BUTTE COPPER PROJECT
WATER BALANCE MODEL CATCHMENT AREA FIGURE
P/A NO.
REF NO.
VA101-460/3 VA15-03200 REV
REV DATE DESCRIPTION DESIGNED
DRAWN
REVIEWED FIGURE 1 1
509,500
509,000
508,500
508,000
507,500
507,000
506,500
506,000
1885
505,500
SAV
ED
: \\V
AN
11\P
rj_fil
e\1\
01\0
0460
\03\
A\G
IS\F
igs\
VA
15-0
3166
Wat
er B
alan
ce\F
ig1_
Wat
erB
alan
ceM
odel
Cat
chm
entA
rea.
mxd
; Sep
25,
201
5 3:
30 P
M; c
czem
bor
506,
000
506,
500
507,
000
507,
500
508,
000
1785
508,
500
5 5
2
1
25SEP'15
ISSUED W ITH LETTER
MH
CAC
KDE PRINTED PAPER SIZE.
0 21AUG'15 ISSUED W ITH LETTER MH AMD KDE 4. CONTOUR INTERVAL IS 1 METRE.
\\VAN11\Prj_file\1\01\00460\03\A\Data\Task 500 - Surface Water Management DEsign\Water Balance Revisions\GoldSim\GoldSim Results\Deterministic Results\[Water Balance Schematic_20151007.xls]Mean Schematic Rounded Print 10/7/2015 2:03 PM
Direct Precipitation on Pond 10,000
Runoff 16,000
Evaporation 16,000
Thickener Overflow 3,807,000
Water Lost to Concentrate
14,000
Ore Water 48,000
Mill Catchment Runoff 26,000
Water from CTF 84,000
Process Water Pond
Reclaim Water 3,972,000
Mill
Mill Treated Water
178,000
Treated Water 771,000
LAD
Surface Water Transfer 110,000
377,000
Precipitation and Runoff
84,000
205,000
Tailings Paste Plant
Water Treatment Plant
Miscellaneous
Unused Freshwater
to LAD 9,000
Void Loss 205,000
Cemented Tailings Facility
172,000
Dewatering 833,000
Recycled 29,000
Freshwater Losses (Dust Suppresion, Etc.)
11,000
Freshwater Requirements
49,000
Underground Tailings Storage
Void Loss 172,000
Underground Dewatering
500 gpm
Other Freshwater Requirements
Make-Up Water 181,000
NOTES: 1. ALL WATER VOLUMES ARE EXPRESSED IN UNITS OF CUBIC METRES PER YEAR. 2. WATER IN TAILINGS PASTE IS ASSUMED TO BE UNRECOVERABLE. 3. SEEPAGE IS ASSUMED TO BE ZERO AS THE FACILITIES ARE LINED. 4. LAD = LAND APPLICATION AND DISPOSAL.
TINTINA RESOURCES INC.
BLACK BUTTE COPPER PROJECT
ANNUAL WATER BALANCE SCHEMATIC (m3/year) MEAN CASE
YEAR 6
P/A NO. VA101-460/3
REF. NO.
VA15-03200
1 07OCT'15 ISSUED WITH LETTER BW MH FIGURE 2
REV 1
REV DATE DESCRIPTION PREP'D RVW'D
\\VAN11\Prj_file\1\01\00460\03\A\Data\Task 500 - Surface Water Management DEsign\Water Balance Revisions\GoldSim\GoldSim Results\Stochastic
0 12 24 36 48 60 72 84 96 108 120 132 144 156
Results\[WB_Tables_Figs_20151001.xls]PWP Volumes_Before Transfer Print 10/2/2015 11:04 AM 200,000
190,000
180,000
170,000
160,000
150,000
140,000
130,000
120,000
110,000
NOTES: 1. AN INITIAL VOLUME OF 120,000 m3 IS ADDED TO THE PWP 2 MONTHS PRIOR TO THE START OF
OPERATIONS.
TINTINA RESOURCES INC. BLACK BUTTE COPPER PROJECT
PROCESS WATER POND MONTHLY VOLUMES
ESTIMATE PRIOR TO WATER TRANSFERS
0 01OCT'15 ISSUED WITH LETTER BW MH
P/A NO.
VA101-460/3 FIGURE 3
REF. NO.
VA15-03200
REV
REV DATE DESCRIPTION PREP'D RVW'D 0
Volu
me
(m3 )
PWP Mea
n Case
PWP 5th P PWP 95th
ercentile Percentil
e
Year 1 Year 2 Year 3 Year 4 Year 5 Year 6 Year 7 Year 8 Year 9 Year 10 Year 11 Year 12 Year 13
\\VAN11\Prj_file\1\01\00460\03\A\Data\Task 500 - Surface Water Management DEsign\Water Balance Revisions\GoldSim\GoldSim Results\Stochastic
0 12 24 36 48 60 72 84 96 108 120 132 144 156
Results\[WB_Tables_Figs_20151001.xls]PWP Volumes_After Transfer Print 10/2/2015 11:05 AM 200,000
190,000
180,000
PWP Mean Case
PWP 5th Percentile
PWP 95th Percentile
170,000
160,000
150,000
140,000
130,000
120,000
110,000 Year 1 Year 2 Year 3 Year 4
Year 5 Year 6 Year 7
Year 8
Year 9
Year 10
Year 11
Year 12
Year 13
NOTES: 1. AN INITIAL VOLUME OF 120,000 m3 IS ADDED TO THE PWP 2 MONTHS PRIOR TO THE START OF
OPERATIONS.
TINTINA RESOURCES INC. BLACK BUTTE COPPER PROJECT
PROCESS WATER POND MONTHLY VOLUMES
POST WATER TRANSFERS
0 01OCT'15 ISSUED WITH LETTER BW MH
P/A NO.
VA101-460/3 FIGURE 4
REF. NO.
VA15-03200
REV
REV DATE DESCRIPTION PREP'D RVW'D 0
Volu
me
(m3 )