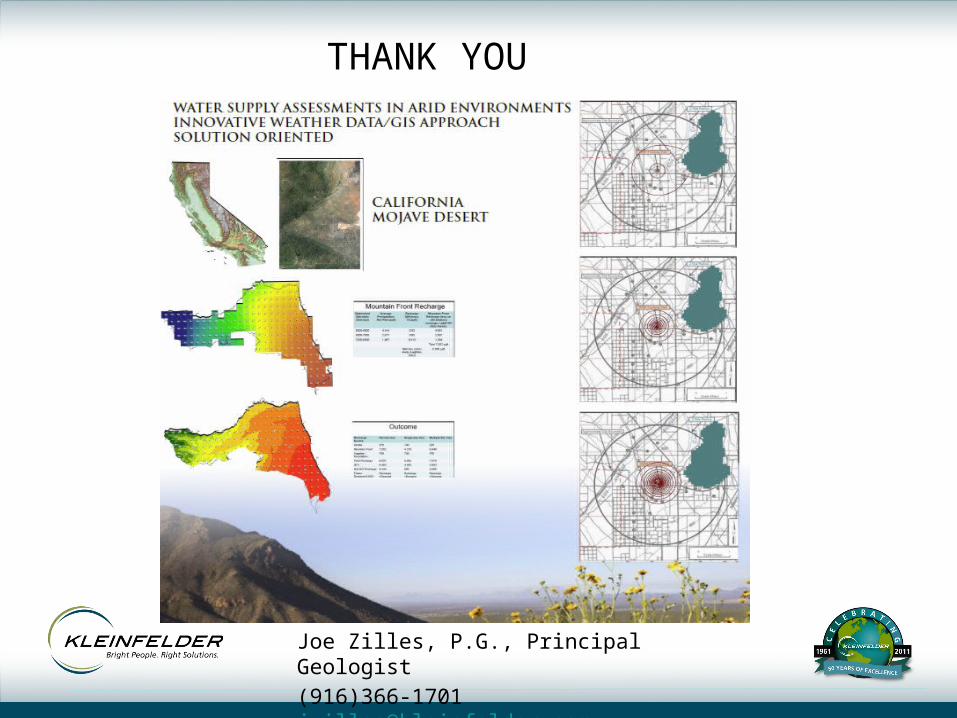
water supply assessments in arid environments, a gis solution
TRANSCRIPT

WATER SUPPLY ASSESSMENTS IN ARID ENVIRONMENTS-
INNOVATIVE WEATHER DATA/GIS APPROACHCALCIMA 2014 Annual Education Conference
November 5, 2014San Diego, California
Joe Zilles, P.G.GIS by Alex Makovics
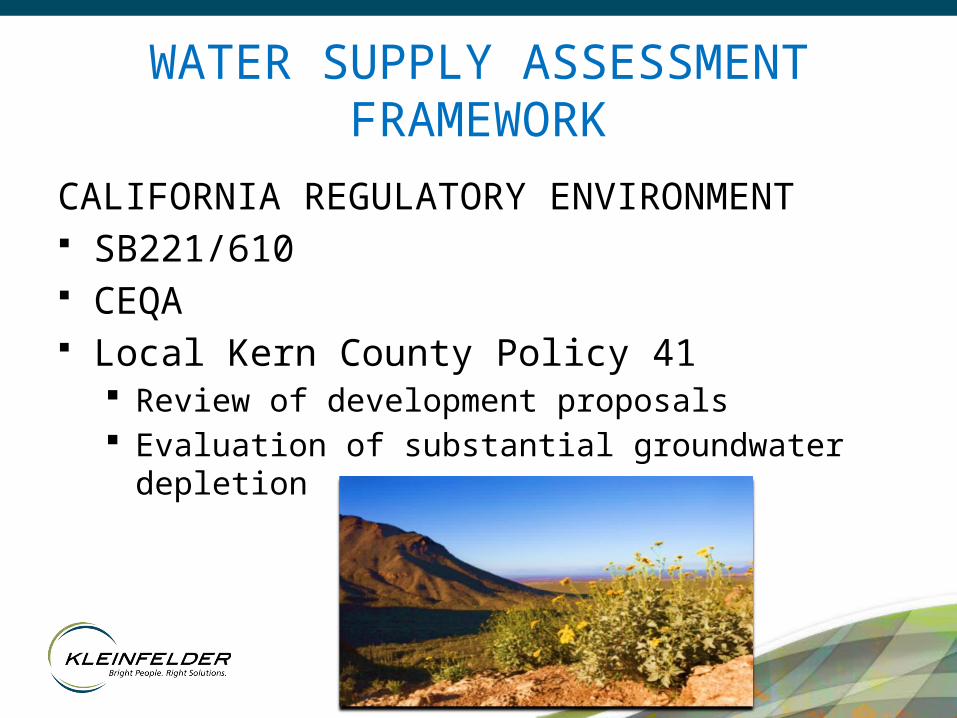
WATER SUPPLY ASSESSMENT FRAMEWORK
CALIFORNIA REGULATORY ENVIRONMENT SB221/610 CEQA Local Kern County Policy 41
Review of development proposals Evaluation of substantial groundwater depletion
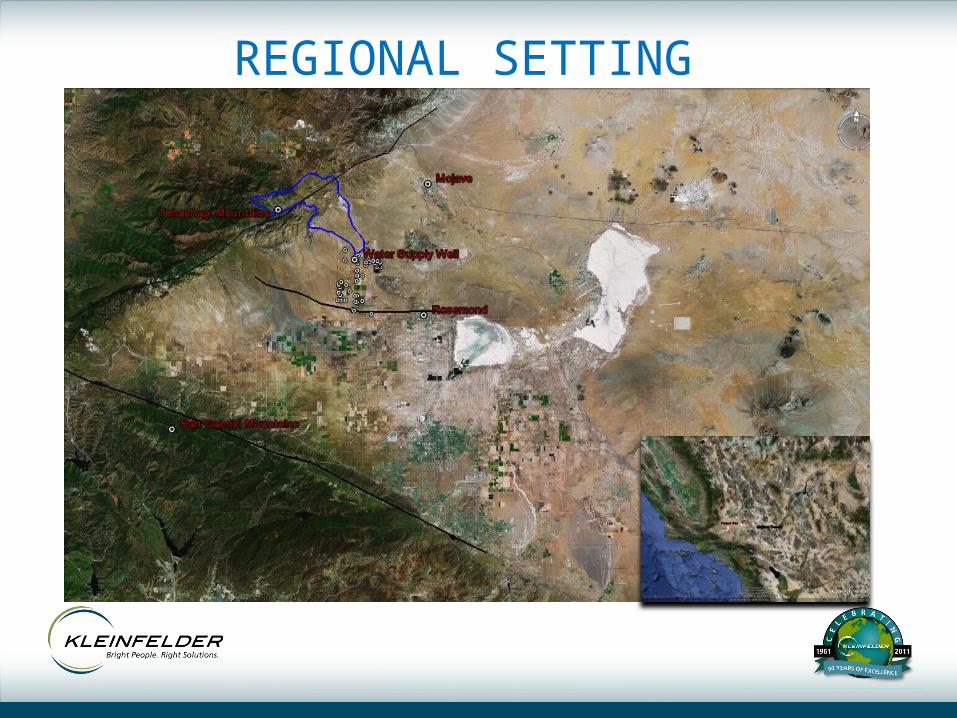
REGIONAL SETTING
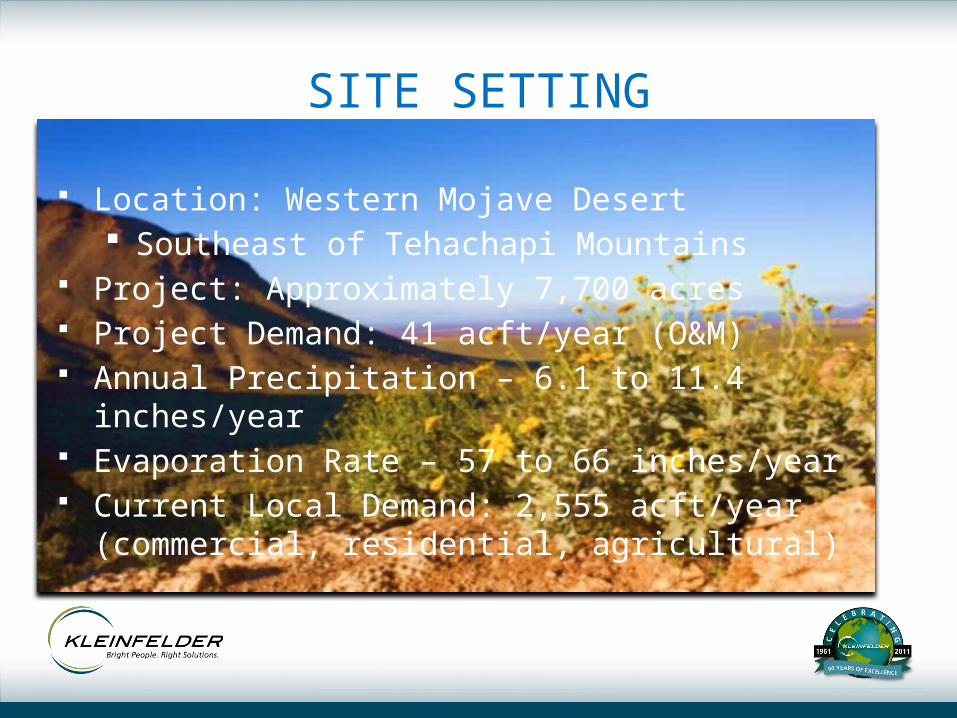
SITE SETTING Location: Western Mojave Desert
Southeast of Tehachapi Mountains Project: Approximately 7,700 acres Project Demand: 41 acft/year (O&M) Annual Precipitation – 6.1 to 11.4 inches/year Evaporation Rate – 57 to 66 inches/year Current Local Demand: 2,555 acft/year
(commercial, residential, agricultural)
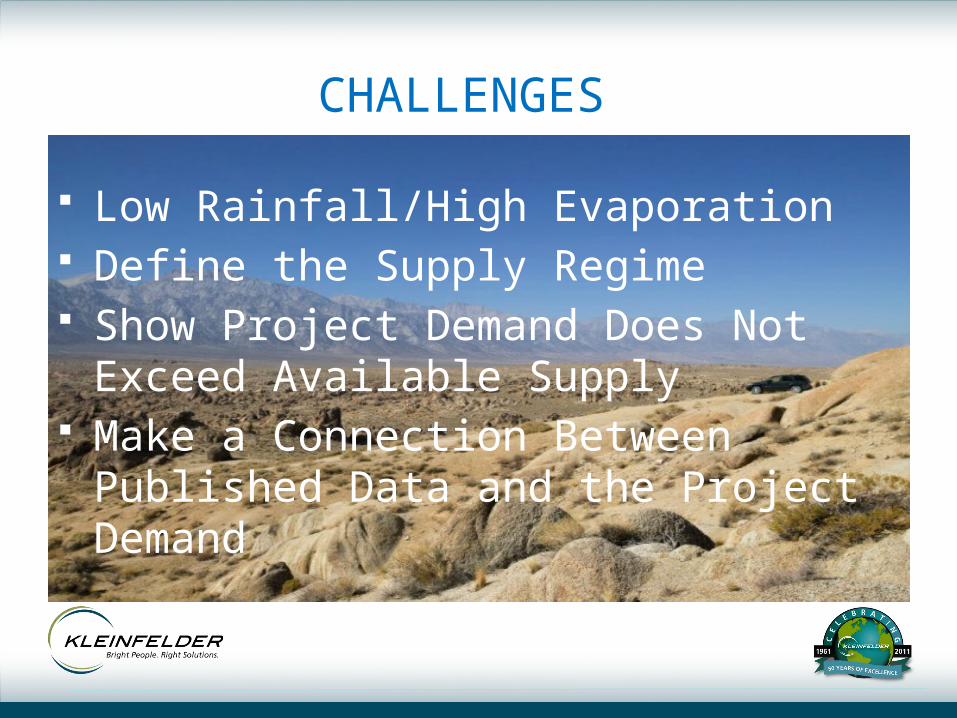
CHALLENGESs Low Rainfall/High Evaporation Define the Supply Regime Show Project Demand Does Not
Exceed Available Supply Make a Connection Between
Published Data and the Project Demand
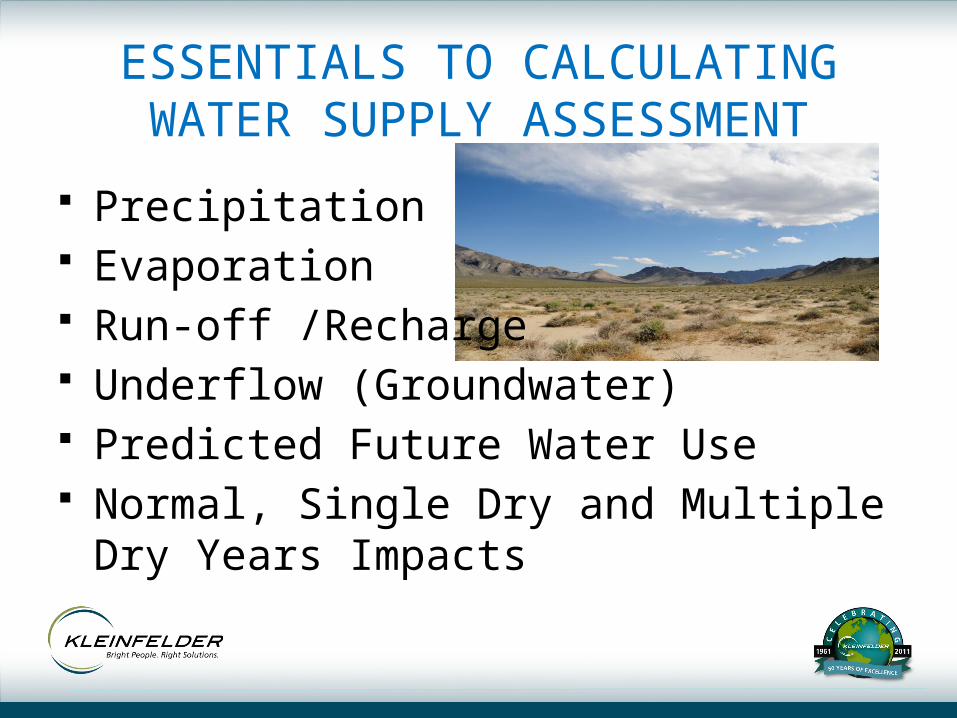
ESSENTIALS TO CALCULATING WATER SUPPLY ASSESSMENT
Precipitation Evaporation Run-off /Recharge Underflow (Groundwater) Predicted Future Water Use Normal, Single Dry and Multiple Dry
Years Impacts
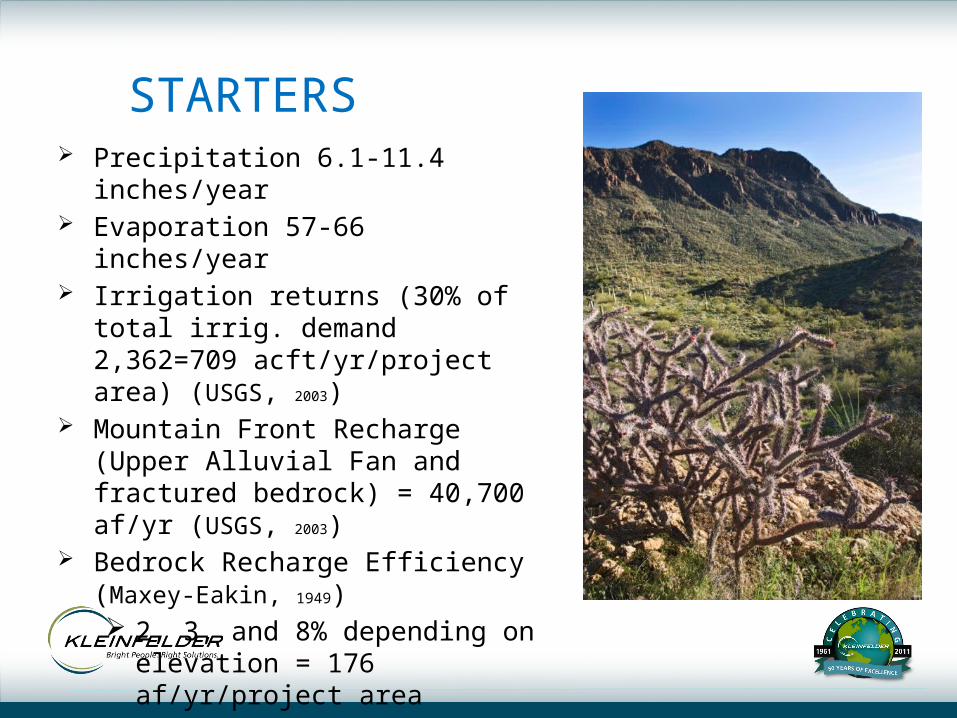
STARTERS Precipitation 6.1-11.4 inches/year Evaporation 57-66 inches/year Irrigation returns (30% of total
irrig. demand 2,362=709 acft/yr/project area) (USGS, 2003)
Mountain Front Recharge (Upper Alluvial Fan and fractured bedrock) = 40,700 af/yr (USGS, 2003)
Bedrock Recharge Efficiency (Maxey-Eakin, 1949) 2, 3, and 8% depending on
elevation = 176 af/yr/project area
Current Area Demand = 2,555 af/yr
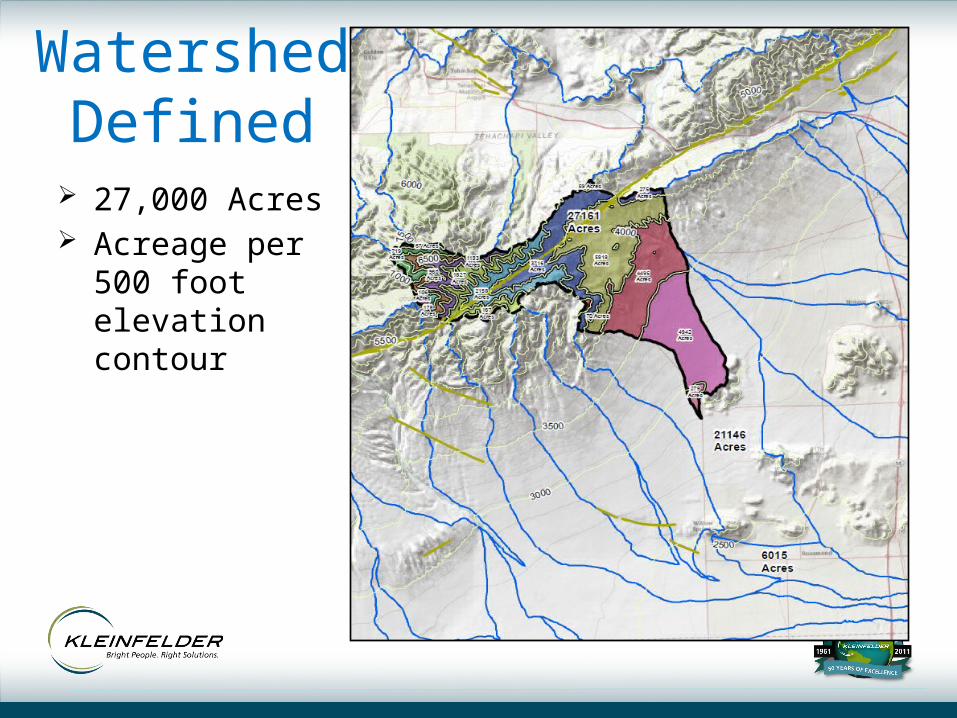
WatershedDefined
27,000 Acres Acreage per
500 foot elevation contour
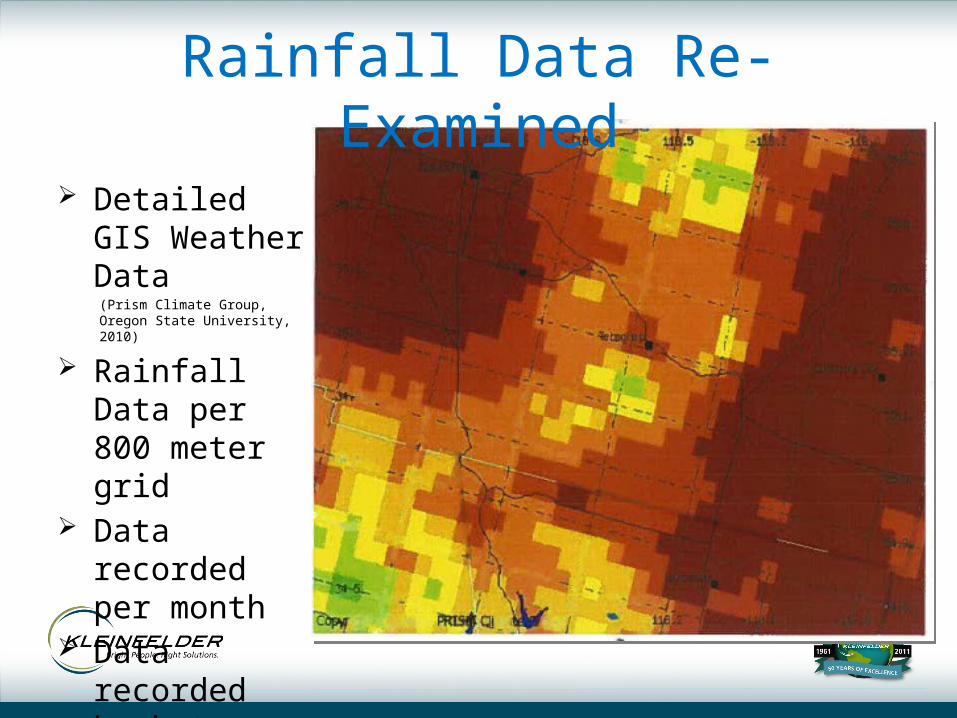
Rainfall Data Re-Examined Detailed GIS
Weather Data (Prism Climate Group, Oregon State University, 2010)
Rainfall Data per 800 meter grid
Data recorded per month
Data recorded back to 1971
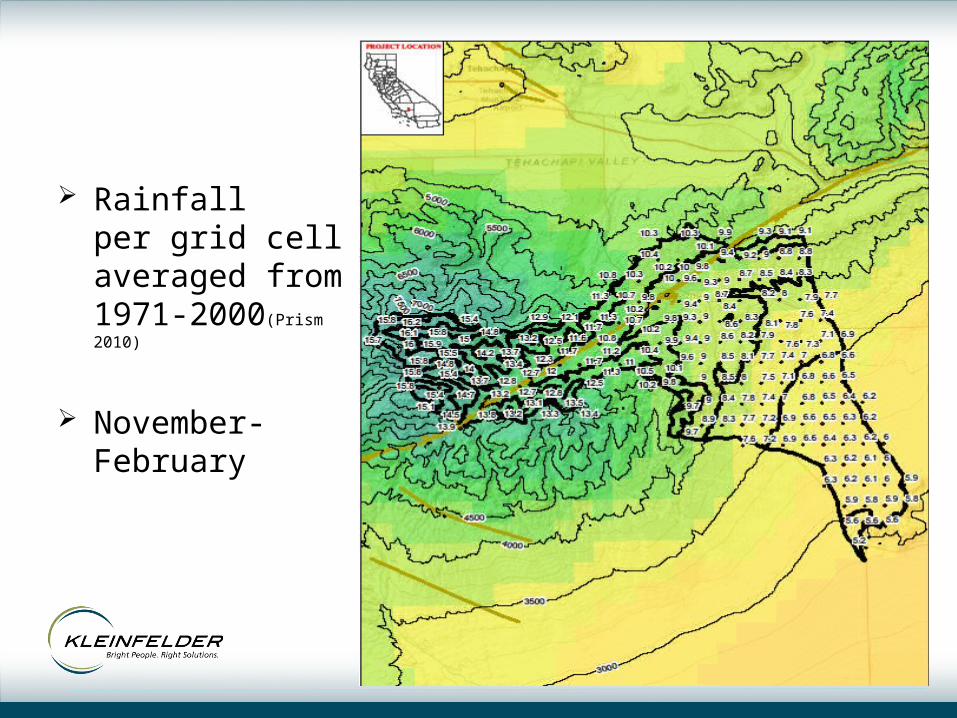
Rainfallper grid cellaveraged from 1971-2000(Prism 2010)
November-February
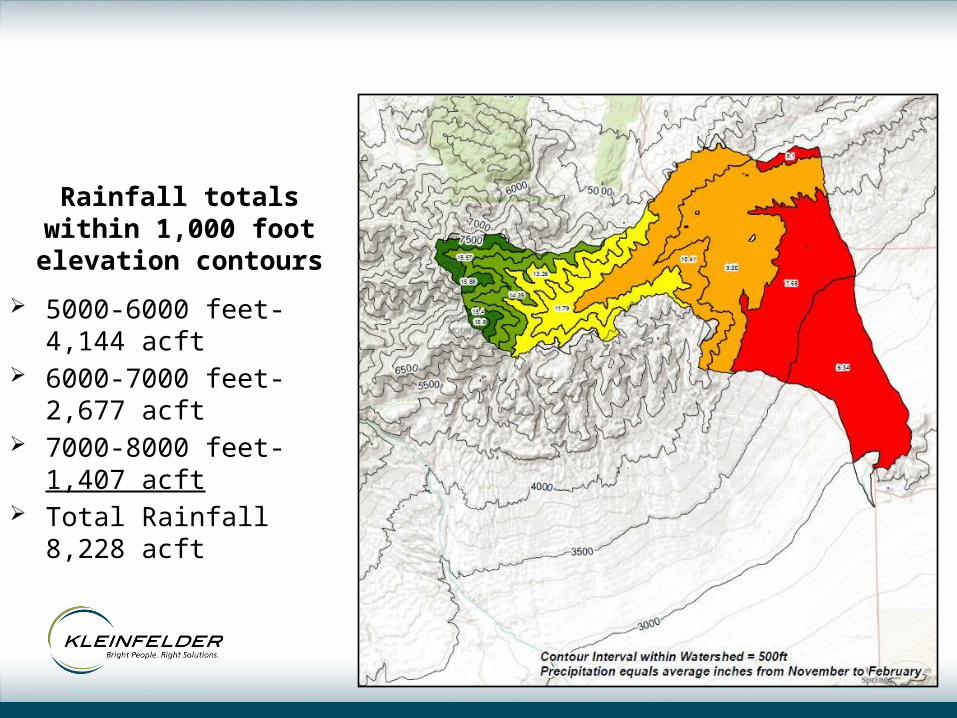
Rainfall totals within 1,000 foot elevation
contours 5000-6000 feet-4,144
acft 6000-7000 feet-2,677
acft 7000-8000 feet-1,407
acft Total Rainfall 8,228
acft
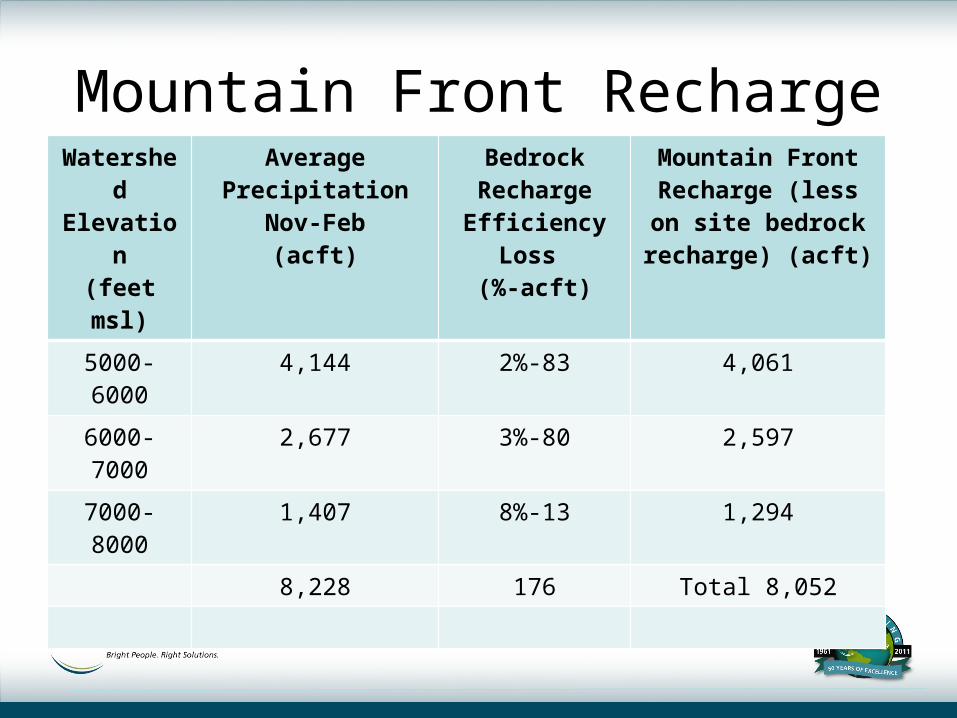
Mountain Front RechargeWatersh
ed Elevatio
n(feet msl)
Average Precipitation
Nov-Feb (acft)
Bedrock Recharge Efficiency
Loss (%-acft)
Mountain Front Recharge (less on site bedrock recharge) (acft)
5000-6000
4,144 2%-83 4,061
6000-7000
2,677 3%-80 2,597
7000-8000
1,407 8%-13 1,294
8,228 176 Total 8,052
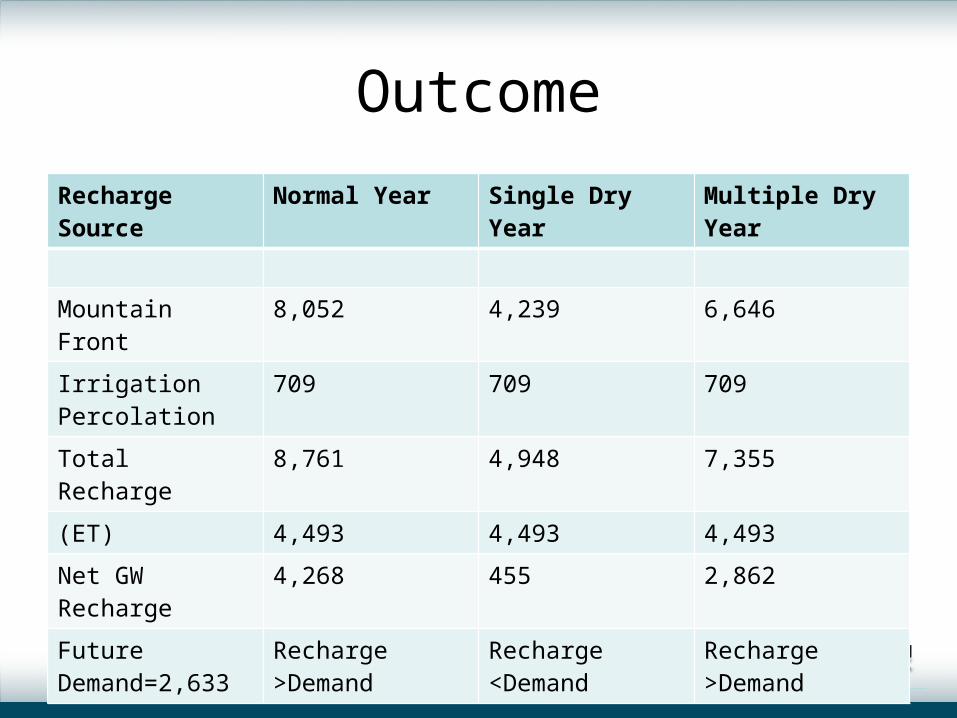
OutcomeRecharge Source
Normal Year Single Dry Year
Multiple Dry Year
Mountain Front 8,052 4,239 6,646Irrigation Percolation
709 709 709
Total Recharge 8,761 4,948 7,355(ET) 4,493 4,493 4,493Net GW Recharge
4,268 455 2,862
Future Demand=2,633
Recharge>Demand
Recharge<Demand
Recharge>Demand