water reuse technology demonstration project - king county, washington
TRANSCRIPT
WATER REUSE TECHNOLOGYDEMONSTRATION PROJECT
Demonstration Facility Pilot StudyBallasted Flocculation (Actiflo)
Primary Treatment ApplicationFinal Draft Report
June 2002
By
HDR Engineering, Inc.
BLACK & VEATCH
Department of Natural Resources and ParksWastewater Treatment DivisionTechnology Assessment Program

King County Department of Natural Resources and Parks
June 2002 i King County Water Reuse Technology Demonstration ProjectActiflo Report (Final Report)
ContentsExecutive Summary.................................................................................................................... 1
Demonstration Facility and Testing Goals and Objectives....................................................................... 1Results and Conclusions .......................................................................................................................... 1
Introduction ................................................................................................................................. 3Description of the Technology .................................................................................................. 3
Comparison of Actiflo and Conventional Treatment................................................................................. 4North American Actiflo Installations.......................................................................................................... 4
Pilot Testing ................................................................................................................................ 5Goals and Objectives................................................................................................................................ 5Demonstration Setup and Operation ........................................................................................................ 6
Instrument Calibration .......................................................................................................................... 7Daily Startup and Shutdown Procedure ............................................................................................... 7
Testing Plan.............................................................................................................................................. 8Sample Collection and Analyses .............................................................................................................. 9Chemical Doses........................................................................................................................................ 9
Results ......................................................................................................................................... 9Stage 1 – Coagulant and Polymer Optimization Trials........................................................................... 10Stage 2A – Continuous Run Trials – Optimum Polymer and Coagulant Doses .................................... 11Stage 2B – Continuous Run Trials – Optimum Polymer and Low Coagulant Doses............................. 12Stage 2C – Continuous Run Trials – Low Polymer and Optimum Coagulant Doses ............................ 15Stage 2D – Continuous Run Trials – Low Polymer and Low Coagulant Doses..................................... 16Stage 2E – Continuous Run Trials – Wet and Dry Startups and Loss of Chemical Feed ..................... 19Stage 2F – Continuous Run Trials – Metals Removal Assessment....................................................... 21
Evaluation of Pilot Results....................................................................................................... 23Effectiveness of Technology to Achieve Performance Goals................................................................. 25Sand Recovery ....................................................................................................................................... 26Residual Characteristics ......................................................................................................................... 27Reliability Considerations and Comparison of Coagulation Chemicals ................................................. 27Metals Removal ...................................................................................................................................... 29
Implementation ......................................................................................................................... 30Design Criteria ........................................................................................................................................ 30Full-Scale Considerations....................................................................................................................... 30Design Features ..................................................................................................................................... 31
Control, monitoring, special................................................................................................................ 31Pretreatment requirements................................................................................................................. 31Residual treatment ............................................................................................................................. 32
Issues Not Resolved By Pilot Test Program .......................................................................................... 32
References................................................................................................................................. 32
TablesTable 1. Summary of Physical Parameters..................................................................................................7Table 2. Stage 1 Operating Conditions......................................................................................................10Table 3. Selected Coagulant Doses ..........................................................................................................11

King County Department of Natural Resources and Parks
June 2002 ii King County Water Reuse Technology Demonstration ProjectActiflo Report (Final Report)
Table 4. Stage 2A Operating Conditions ...................................................................................................11Table 5. Stage 2A Performance - Optimum Polymer and Coagulant Doses.............................................13Table 6. Stage 2B Operating Conditions. ..................................................................................................14Table 7. Stage 2B Performance- Optimum Polymer and Low Coagulant Doses ......................................14Table 8. Stage 2C Operating Conditions ...................................................................................................15Table 9. Stage 2C Performance- Low Polymer and Optimum Coagulant Doses......................................16Table 10. Stage 2D Operating Conditions .................................................................................................17Table 11. Stage 2D Performance - Low Polymer and Low Coagulant Doses Followed by
Optimum Doses..................................................................................................................................17Table 12. Stage 2F Performance - Metals Analysis Results .....................................................................21Table 13. Comparison of Conventional Primary Clarification and Actiflo Operation and
Performance. ......................................................................................................................................25Table 14. Effectiveness of Process to Achieve Performance Goals .........................................................25Table 15. Comparison of Chemical Coagulants Effluent Turbidity Statistics.............................................28Table 16. Comparison of Alkalinity and Sludge Production.......................................................................28Table 17. Comparison of Coagulant Costs ................................................................................................28Table 18. Comparison of Pilot Results and Conventional Treatment Process for Copper and Zinc
Removal .............................................................................................................................................29
FiguresFigure 1. Actiflo Flow Diagram. (figure obtained from the US Filter/Kruger website). .................................3Figure 2. Trailer Mounted Actiflo Pilot Unit. .................................................................................................6Figure 3. Stage 1 Performance - Comparison of Polymer Types. .............................................................11Figure 4. Stage 2D Low Alum Doses Followed By Optimum Alum Doses – Polymer Dose 0.95
mg/L....................................................................................................................................................17Figure 5. Stage 2D - Low PACL Doses Followed By Optimum PACL Doses - Polymer Dose 0.95
mg/L....................................................................................................................................................17Figure 6. Stage 2E Continuous Run Dry Start, Coagulant Loss and Recovery, and Wet Start
Trial.....................................................................................................................................................19Figure 7. Process Reliability and Coagulant Comparison. ........................................................................27
Appendices
Appendix A - Test Plan
Appendix B - Testing Data
Appendix C - Pilot Unit Photos

King County Department of Natural Resources and Parks
June 2002 1 King County Water Reuse Technology Demonstration ProjectActiflo Report (Final Report)
Executive SummaryThe King County Department of Natural Resources conducted a nine-month pilot-testingprogram to assess the performance of emerging wastewater treatment technologies. TheActiflo process (ballasted flocculation) was tested to determine its utility for primary treatment.This report presents the findings of that testing.
Demonstration Facility and Testing Goals and ObjectivesA 50-ft-long Actiflo demonstration unit was brought on-site for a total of six weeks for the pilottest. The unit arrived as a complete packaged system consisting of a rotary drum, fine screen,tanks for injection, flocculation, maturation, and settling, chemical feed equipment, and aSCADA system.
A testing plan was prepared prior to the pilot study and updated throughout the test. The targetperformance goals were:
Total Suspended Solids (TSS) removal efficiency > 80 %
Chemical Oxygen Demand (COD) removal efficiency > 60 %
Total phosphorus removal efficiency > 80 %
Sand recovery > 95 %
Testing was conducted to:
Determine optimum polymer and coagulant types and doses.
Collect long-term performance data at optimum and sub-optimum chemical doses.
Evaluate the impact of wet and dry start-ups and loss of chemical feed.
Collect data pertaining to metals removal.
Results and ConclusionsFollowing is a summary of the results derived from the pilot testing data:
Target Performance Goals
TSS removal efficiency - The Actiflo process consistently achieved removalefficiencies of 93 and 94 %, achieving the performance goal of greater than 80 %.
COD removal efficiency – Removal efficiencies were between 67 and 71 %,achieving the performance goal of greater than 60 %.
Total phosphorus removal efficiency – Poly aluminum chloride and ferric chlorideachieved 92 and 91 % removal efficiencies, respectively. Both of these values areabove the performance goal of greater than 80 %. Aluminum sulfate was less
King County Department of Natural Resources and Parks
June 2002 2 King County Water Reuse Technology Demonstration ProjectActiflo Report (Final Report)
effective and was determine to remove only 75 % of the total phosphorus, which isbelow the 80 % goal. The reason for the lower removal efficiency is unclear.
Comparison of coagulants – With the exception of aluminum sulfate for phosphorusremoval, all three coagulants achieved the target performance goals. However, polyaluminum chloride was found to provide the highest overall removal.
Comparison to Convention Primary Treatment
Pilot testing results demonstrated that the Actiflo process performed better thanconventional primary clarification in terms of measured COD and TSS removalefficiencies.
While the Actiflo process was shown to achieve good removal for BOD5, TSS, andtotal phosphorus, it is considerably more expensive to operate than a conventionalprimary treatment because large volumes of chemicals are required, there ismechanical equipment to operate and maintain, and the process produces moresludge.
The Actiflo process requires much less space than primary clarifiers. However, thisdoes not result in lower capital costs. Capital costs associated with the Actifloprocess were estimated to be between 10 and 25 % higher than for conventionalprimary clarifiers, based on a treatment capacity of 1 mgd.
To accurately compare Actiflo and a conventional primary treatment, all of thedifferences and their impacts on the whole treatment plant must be examined. Forexample, are the extra chemical costs for the Actiflo process offset by reducedenergy costs or smaller basins in the subsequent activated sludge treatment process?
Issues Not Resolved by Pilot Tests
Due to the limited length of time for the pilot study, sand recovery and the potentialfor long-term sand fouling could not be investigated. If this technology is selectedfor implementation, it may be appropriate to contact staff at the full-scaleinstallations listed in this report to determine whether sand fouling and recoveryhave been an issue.

King County Department of Natural Resources and Parks
June 2002 3 King County Water Reuse Technology Demonstration ProjectActiflo Report (Final Report)
IntroductionThe King County Department of Natural Resources (King County) conducted a nine-monthdemonstration pilot-testing project to assess the performance of emerging wastewater treatmenttechnologies. The focus of this project was to assess technologies that had the potential tominimize the footprint, impacts, and costs of producing reclaimed water (Class A or better) atsmall satellite facilities. The particular unit process assessed in this report (Actiflo) would haveto be used in conjunction with a secondary treatment process to produce reclaimed water.
The objective of this unit process report is to present a summary of the findings of the ballastedflocculation (Actiflo) pilot tests. The Actiflo demonstration facility was configured to receiveprimary influent since the focus of these particular pilot tests was to evaluate the Actifloprocess as a primary treatment system.
Description of the TechnologyActiflo is a compact clarification process using micro-sand enhanced flocculation and settling.A coagulant is added to the raw water in a separate coagulation tank, as shown in Figure 1. Thecoagulated water is conveyed to an injection tank where micro-sand (NSF approved inert puresilica sand) and polymer are added. The micro-sand provides a large contact area and acts asparticle ballast, thereby accelerating the settling rate of particle flocs. Polymer bridging bindsdestabilized suspended solids to the micro-sand particles. In the maturation tank, the particlesagglomerate and grow into high-density flocs, which settle to the bottom of the settling tank.Lamella tubes are used in the settling tank.
Figure 1. Actiflo Flow Diagram. (figure obtained from the US Filter/Kruger website).
The particle/micro-sand mixture collected at the bottom of the clarifier is pumped tohydrocyclones where the particles are separated from the micro-sand by centrifugal force. The
King County Department of Natural Resources and Parks
June 2002 4 King County Water Reuse Technology Demonstration ProjectActiflo Report (Final Report)
recovered clean micro-sand is recycled back to the injection tank, and the separated solids arecontinuously discharged to solids-handling facilities.
The following is a summary of the benefits of this physical/chemical process as described in themanufacturer’s literature:
The process offers a high degree of flexibility since it has a short start-up time andreaches steady-state performance quickly.
The high concentration of micro-sand and injection tank mixing intensity allows theprocess to handle sudden variations in flow and water quality (such as turbidity ortemperature) without compromising effluent quality.
Chemical (coagulant and polymer) feed can be adjusted to accommodate variations infeed water quality.
Comparison of Actiflo and Conventional TreatmentCompared to conventional primary treatment, the benefits of the Actiflo process are:
Smaller Footprint and Basin Requirements: Surface overflow rates of the Actifloprocess are approximately 10 times greater than for conventional primary clarification.The higher loading rates significantly decrease basin volume and surface arearequirements.
Better Pollutant Removal Efficiencies: Bench scale tests have demonstrated that theActiflo process can remove more pollutants compared to a conventional or enhancedprimary treatment.1
Ability to Compensate for Influent Variability: Due to the high concentration ofmicro-sand relative to influent particulates, the Actiflo process has the ability toaccommodate variations in flow and influent quality without compromising effluentquality.
North American Actiflo InstallationsCurrently there are no North American facilities that employ the Actiflo process for primarytreatment of wastewater. However, there are several facilities that utilize this technology forother purposes. The following is a summary of locations utilizing the Actiflo process and theyear in which they were installed:
Raw Water Settling (Water Treatment Applications)
Ecole Vaudreuil, Canada - 0.3 mgd (2000)
Placer County Water Agency - Auburn, CA - 40 mgd (2002)
1 Comparison results based on the bench scale tests conducted at the Russian River Wastewater Treatment Facility(HDR Engineering, June 2000).

King County Department of Natural Resources and Parks
June 2002 5 King County Water Reuse Technology Demonstration ProjectActiflo Report (Final Report)
Treatment of Combined or Sanitary Sewer Overflows (CSO or SSO)
St. Bernard, Louisiana - 10 mgd (2001)
Lawrence, Kansas - 40 mgd (2002)
Bremerton, Washington - 10 mgd (2002)
Ft. Smith, Arizona – 31 mgd (2003)
Secondary Effluent Polishing Prior to Discharge or Filtration (WastewaterTreatment Application)
Lindsay, Canada - 8 mgd (1999)
Deseronto, Canada - 1.3 mgd (2000)
Antioch California - Calpine / Delta Diablo Sanitation District - 14 mgd (2000)
Strathroy, Canada - 6.2 mgd (2000)
Boisbriand, Canada - 4 mgd (2000)
West Palm Beach, Florida - 10 mgd (2002)
Pampa, Texas - 10 mgd (2002)
Onondaga, New York - 126 mgd (2003)
Side Stream Treatment (Wastewater Treatment Application)
Burlington, Canada - 5.8 mgd (2001)
Santa Fe, California - 4 mgd (2002)
Pilot Testing
Goals and ObjectivesThe goal of the pilot study was to evaluate the Actiflo process and determine its utility forprimary treatment. The pilot study was designed to:
Evaluate system performance when receiving primary influent by assessing Actiflo’sability to remove 5-day Biochemical Oxygen Demand (BOD5), COD, TSS, and totalphosphorus.
Determine the optimum combination of polymer and coagulant doses for conventionaland advanced (phosphorus removal) primary treatment.
Quantify process performance during dry start, wet start, and chemical-feed failureconditions.
Evaluate the process based on operational and maintenance considerations such aslabor, chemical and energy requirements, and ease and duration of startup.
King County Department of Natural Resources and Parks
June 2002 6 King County Water Reuse Technology Demonstration ProjectActiflo Report (Final Report)
Evaluate the potential for long-term sand fouling.
Target the following performance goals:
TSS removal efficiency > 80 %
COD removal efficiency > 60 %
Total phosphorus removal efficiency > 80 %
Sand Recovery > 95 %
Demonstration Setup and OperationThe US Filter/Kruger Actiflo demonstration facility arrived at the West Point WastewaterTreatment Plant on August 27, 2001. The unit was on-site for a total of six weeks and wasshipped back to the manufacturer on October 5, 2001. Two full-time US Filter/Kruger operatorsoperated the unit five days per week eight hours per day, collected data and laboratory samples,and prepared reports summarizing pilot study results.
The demonstration pilot, which has a nominal capacity of 350 gpm, was brought on-site in a50-foot-long trailer that was parked outside of the testing facility as shown in Figure 2. The unitarrived on-site as a complete packaged system, consisting of: a rotary drum fine screen; tanksfor injection, flocculation, maturation, and settling; chemical feed equipment; and a SCADAsystem. A description of the physical attributes of the pilot unit is presented in Table 1.
Figure 2. Trailer Mounted Actiflo Pilot Unit.

King County Department of Natural Resources and Parks
June 2002 7 King County Water Reuse Technology Demonstration ProjectActiflo Report (Final Report)
Table 1. Summary of Physical Parameters
Parameter Unit Value a
Injection Tank Length inches 36.5 Height (total) inches 62 Width inches 36 Volume gallon 343.0 Mixer HP 1.5Maturation Tank Length inches 68 Height (total) inches 62 Width inches 60 Volume gallon 1,060.9 Mixer HP 1.5Settling Tank square feet 5.8Hydrocyclone Influent Flow gpm 22 Sludge Flow gpm 17.6 Underflow gpm 4.4 Power Requirement HP 6.2
a Information provided by Daniel Austria Jr. (US Filter/Kruger pilot study engineer).
Instrument CalibrationInstruments used for process monitoring were calibrated in accordance with the manufacturer’srecommendations. Instruments were calibrated prior to initiating the pilot test as described inthe US Filter/Kruger Pilot Testing Report (US Filter/Kruger Products, 2002).
The chemical feed pumps were calibrated using a draw down method to measure flow rates.Draw downs were performed using graduated cylinders and a stop watch. The flow accuracyof the feed pumps was checked later in the pilot test as described in the US Filter/Kruger PilotTesting Report (US Filter/Kruger Products, 2002).
Daily Startup and Shutdown ProcedureA description of the daily startup and shutdown procedures is presented in the US Filter/KrugerPilot Testing Report (US Filter/Kruger Products, 2002). In general, daily startups consisted ofmanually starting process equipment and instruments and verifying the metering accuracy ofthe chemical feed pumps.
Shutdown consisted of reversing the startup procedure and allowing the sand pump to run for aperiod of ten minutes after all the equipment had been shutdown to remove sand from thesettling tank hopper.

King County Department of Natural Resources and Parks
June 2002 8 King County Water Reuse Technology Demonstration ProjectActiflo Report (Final Report)
Testing PlanA testing plan was prepared prior to the pilot study and updated throughout the pilot test. Acopy of the final testing plan is contained in Appendix A. Following is a summary of keyinformation presented in the testing plan:
The pilot test consisted of two testing stages. Note that each testing stage was run threetimes to accommodate the three polymer/coagulant combinations:
Stage 1 – Coagulant and Polymer Optimization Trials. This testing stage wasconducted to select a single polymer for all subsequent tests and to determineoptimum polymer and coagulant doses.
1. Three different polymer solutions were tested during the Stage 1 tests.From these results, a single polymer was selected for all subsequent tests.
2. The second phase of the Stage 1 tests consisted of evaluating differentpolymer- and coagulant-dose combinations. Selection of optimumchemical doses was based on a review of measured COD, TSS, andturbidity removal efficiencies. For each chemical-dose combinationtested, the samples were collected after the pilot unit was operated for atleast two hydraulic residence times, which should be sufficient to reachsteady-state.
Stage 2 – Continuous Run Trials. This testing stage was conducted to collectlong-term performance data at optimum and sub-optimal polymer and coagulantdoses. Stage 2 tests were conducted using the selected polymer and the followingthree coagulants: alum, ferric chloride, and polyaluminum chloride (PACL). Stage 2consists of six sub-stages as shown below:
1. An eight-hour trial run at the optimum polymer and coagulant dose(Stage 2A).
2. A four-hour trial run at the optimum polymer dose and a low coagulantdose to determine the impact of a low coagulant dose on effluent quality(Stage 2B).
3. A four-hour trial run at a low polymer dose and the optimum coagulantdose to determine the impact of a low polymer dose on effluent quality(Stage 2C).
4. A four-hour trial run at a low polymer and a low coagulant doses.Following this period, the chemical doses were returned to optimumlevels. Once the process achieved steady-state performance, hourlysamples were collected for a minimum of three hours. Data collectedduring these tests were used to determine (1) effluent quality during lowchemical dose periods, and (2) how much time was required for theprocess to achieve steady-state performance. (Stage 2D).
King County Department of Natural Resources and Parks
June 2002 9 King County Water Reuse Technology Demonstration ProjectActiflo Report (Final Report)
5. Evaluate the impact of wet and dry start-ups and loss of chemical feedconditions. (Stage 2E)
6. Samples for metals analysis (Stage 2F) were collected and analyzed.
Information collected during Stages 2A through 2D could be used in the future to optimize theActiflo process with regard to coagulant costs and performance implications.
Sample Collection and AnalysesAs described earlier, all samples were collected by the US Filter/Kruger operators throughoutthe pilot test and analyzed in accordance with Standard Methods. Sample analyses wereconducted in the following locations:
US Filter/Kruger Operators - pH and turbidity (field measurements).
King County Environmental Laboratory - Stage 2F metal analyses.
West Point Treatment Plant Process Laboratory – All remaining sample analyses.
Chemical DosesThe coagulants evaluated in the Stage 1 and 2 tests were:
Alum – 46% active and specific gravity of 1.3
Ferric Chloride – 40% active and specific gravity of 1.42
PACL – 100% active, specific gravity of 1.37, and 17.1% Al2O3
Alum and ferric chloride doses discussed in this report were calculated using their activity andspecific gravity; therefore these doses are based on the dry weight of each chemical (reported asalum or as ferric chloride).
PACL doses discussed in this report were calculated based on the Al2O3 activity and specificgravity. Therefore, PACL doses described in this report are based on the dry weight of Al2O3
(reported as Al2O3). This is different than the approach used in the pilot testing report producedby US Filter/Kruger. Doses described in the US Filter Report are based on the wet weight ofthe PACL product.
ResultsFollowing is a summary of the results for the testing trials. A summary of the testing data iscontained in Appendix B.

King County Department of Natural Resources and Parks
June 2002 10 King County Water Reuse Technology Demonstration ProjectActiflo Report (Final Report)
Stage 1 – Coagulant and Polymer Optimization TrialsPilot testing trials were conducted on September 5, 6, 7, and 10, 2001, to determine theoptimum polymer type and the optimum chemical doses for the selected polymer and the threecoagulant combinations. Pilot-scale trial tests (as opposed to jar testing) were performed todetermine these parameters since the Actiflo process responds quickly to chemical dosechanges (i.e. it has a short hydraulic detention time). Summaries of operating conditions areshown in Table 2. All Stage 1 optimization trials were conducted at a flow rate of 310 gpm.
Table 2. Stage 1 Operating Conditions.
Operating Condition Units ValueFlow Rate gpm 310Polymer Dose M155 mg/L 0.85 E700 mg/L 0.85 AE1125 mg/L 5.20Coagulant Dose Alum mg/L 60 – 160 Ferric Chloride mg/L 60 – 140 PACL mg/L 10 – 45Hydraulic Residence Time Injection Tank minutes 1.1 Maturation Tank minutes 3.4Surface Overflow Rate gpm/sf 53.4
Optimization trial results were reviewed during a conference call on September 11, 2001. Thepurpose of the conference call was to discuss and select the optimal polymer and coagulantdoses based on Stage 1 testing results. A copy of the tables and figures that summarize Stage 1testing results is presented in Appendix B. Below is a summary of the testing and discussionresults.
Optimum Polymer Type: Figure 3 shows the turbidity removal efficiencies of thethree polymer types evaluated for this study at the same alum dose of 60 mg/L. The twodry polymers evaluated were M155 (anionic-product of CIBA Specialty Chemicals) andE700 (cationic product of Polydyne). The liquid polymer evaluated was PolyflocAE1125 (anionic product of BetzDearborn). A polymer dose of 0.85 mg/L was used forM155 and E700, and a polymer dose of 5.20 mg/L was used for AE1125. Anionicpolymer type M155 was selected as the optimum polymer type due to its higher removalefficiency coupled with lower polymer dose. This polymer type was used in allsubsequent pilot tests.
Selection Criteria for Optimum Chemical Doses: Selection of optimum polymer andcoagulant doses was based on a review and discussion of measured COD, TSS, andturbidity removal efficiencies. A total of five sample sets, consisting of influent andeffluent samples at a constant polymer dose and a varying coagulant dose, were

King County Department of Natural Resources and Parks
June 2002 11 King County Water Reuse Technology Demonstration ProjectActiflo Report (Final Report)
collected for each polymer/coagulant combination. Optimum chemical doses wereselected based on the “best” performance (as opposed to achieving a desired removalefficiency) obtained from various coagulant doses coupled with a constant polymer doseof 0.85 mg/L.
Selection Criteria for Low Chemical Doses: The selections of the “low” polymer andcoagulant doses were based on reviews of TSS and turbidity removal efficiency data.The low chemical doses were selected based on the minimum coagulant dose (coupledwith a polymer dose of 0.85 mg/L) that would achieve a TSS removal efficiency of 80%or better.
Optimum and Low Chemical Doses: Following is a summary of optimum and lowchemical doses:
The optimum and low polymer doses were selected to be 0.952 and 0.75 mg/L,respectively.
Selected coagulant doses are presented in Table 3.
Figure 3. Stage 1 Performance - Comparison of Polymer Types.
Table 3. Selected Coagulant Doses
Coagulant Units Optimum Dose Low DoseFerric Chloride mg/L 110 60
PACL mg/L 34 17Alum mg/L 110 60
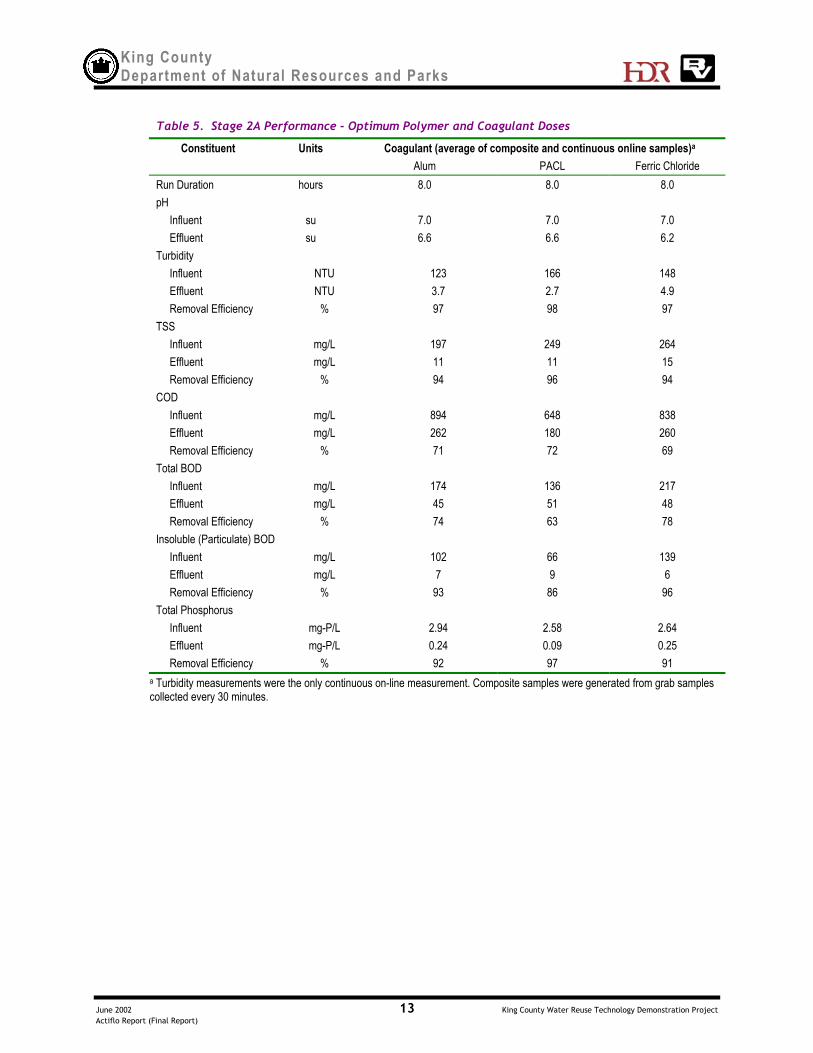
Stage 2A – Continuous Run Trials – Optimum Polymer and Coagulant DosesStage 2A pilot testing trials were conducted on September 12, 17, and 19, 2001, for each of thethree optimum coagulant- and polymer-dose combinations. Table 4 summarizes the operatingconditions during this testing stage. All tests were conducted at a flow rate of 350 gpm. Table 5summarizes the influent and effluent performance data for the various coagulants.
Table 4. Stage 2A Operating Conditions
Operating Condition Units ValueFlow Rate gpm 350
2 The optimum polymer dose was increased from 0.85 to 0.95 mg/L based on performance testing conducted afterthe September 11th conference call.
King County Department of Natural Resources and Parks
June 2002 12 King County Water Reuse Technology Demonstration ProjectActiflo Report (Final Report)
Operating Condition Units ValuePolymer Type -- M155Polymer Dose mg/L 0.95Coagulant Dose Alum mg/L 110 PACL mg/L 34 Ferric Chloride mg/L 110Hydraulic Residence Time Injection Tank minutes 1.0 Maturation Tank minutes 3.0Surface Overflow Rate gpm/sf 60.3
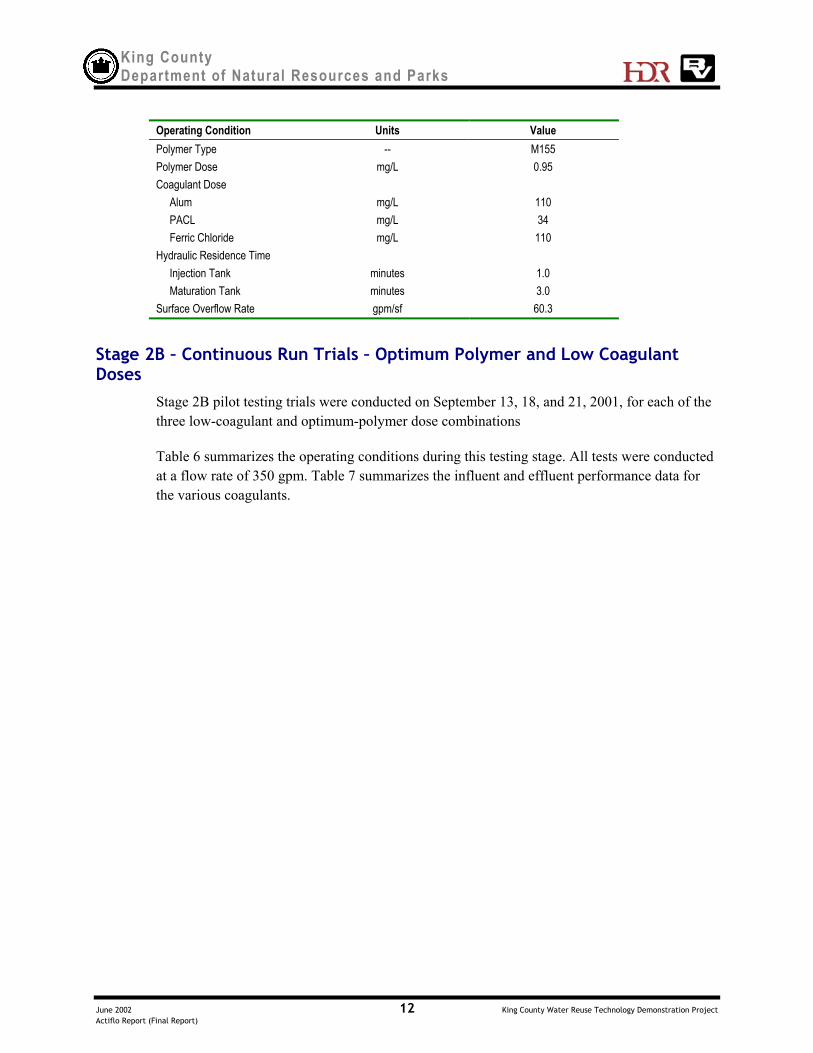
Stage 2B – Continuous Run Trials – Optimum Polymer and Low CoagulantDoses
Stage 2B pilot testing trials were conducted on September 13, 18, and 21, 2001, for each of thethree low-coagulant and optimum-polymer dose combinations
Table 6 summarizes the operating conditions during this testing stage. All tests were conductedat a flow rate of 350 gpm. Table 7 summarizes the influent and effluent performance data forthe various coagulants.
King County Department of Natural Resources and Parks
June 2002 13 King County Water Reuse Technology Demonstration ProjectActiflo Report (Final Report)
Table 5. Stage 2A Performance - Optimum Polymer and Coagulant Doses
Constituent Units Coagulant (average of composite and continuous online samples)a
Alum PACL Ferric ChlorideRun Duration hours 8.0 8.0 8.0pH Influent su 7.0 7.0 7.0 Effluent su 6.6 6.6 6.2Turbidity Influent NTU 123 166 148 Effluent NTU 3.7 2.7 4.9 Removal Efficiency % 97 98 97TSS Influent mg/L 197 249 264 Effluent mg/L 11 11 15 Removal Efficiency % 94 96 94COD Influent mg/L 894 648 838 Effluent mg/L 262 180 260 Removal Efficiency % 71 72 69Total BOD Influent mg/L 174 136 217 Effluent mg/L 45 51 48 Removal Efficiency % 74 63 78Insoluble (Particulate) BOD Influent mg/L 102 66 139 Effluent mg/L 7 9 6 Removal Efficiency % 93 86 96Total Phosphorus Influent mg-P/L 2.94 2.58 2.64 Effluent mg-P/L 0.24 0.09 0.25 Removal Efficiency % 92 97 91
a Turbidity measurements were the only continuous on-line measurement. Composite samples were generated from grab samplescollected every 30 minutes.

King County Department of Natural Resources and Parks
June 2002 14 King County Water Reuse Technology Demonstration ProjectActiflo Report (Final Report)
Table 6. Stage 2B Operating Conditions.
Operating Condition Units ValueFlow Rate gpm 350Polymer Type -- M155Polymer Dose mg/L 0.95Coagulant Dose Alum mg/L 60 PACL mg/L 17 Ferric Chloride mg/L 60Hydraulic Residence Time Injection Tank minutes 1.0 Maturation Tank minutes 3.0Surface Overflow Rate gpm/sf 60.3
Table 7. Stage 2B Performance- Optimum Polymer and Low Coagulant Doses
Constituent Units Coagulant (average of composite and continuous online samples)Alum PACL Ferric Chloride
Run Duration hours 4.0 4.0 4.0pH Influent su 7.0 7.1 7.0 Effluent su 6.8 6.9 6.6Turbidity Influent NTU 147 142 107 Effluent NTU 13.1 4.3 9.6 Removal Efficiency % 91 97 91TSS Influent mg/L 446 251 180 Effluent mg/L 28 15 29 Removal Efficiency % 94 94 84COD Influent mg/L 1,252 604 460 Effluent mg/L 1,035 156 280 Removal Efficiency % 17 74 39Total Phosphorus Influent mg-P/L 3.86 2.61 2.08 Effluent mg-P/L 1.40 0.63 1.53 Removal Efficiency % 64 76 26

King County Department of Natural Resources and Parks
June 2002 15 King County Water Reuse Technology Demonstration ProjectActiflo Report (Final Report)
Stage 2C – Continuous Run Trials – Low Polymer and Optimum CoagulantDoses
Stage 2C pilot testing trials were conducted on September 13 and 18, 2001 and October 3,2001, for each of the three optimum-coagulant and low-polymer dose combinations. Table 8summarizes the operating conditions during this testing stage. All tests were conducted at aflow rate of 350 gpm.
Table 9 summarizes the influent and effluent performance data for the various coagulants.
Table 8. Stage 2C Operating Conditions
Operating Condition Units ValueFlow Rate gpm 350Polymer Type -- M155Polymer Dose mg/L 0.75Coagulant Dose Alum mg/L 100 PACL mg/L 34 Ferric Chloride mg/L 110Hydraulic Residence Time Injection Tank minutes 1.0 Maturation Tank minutes 3.0Surface Overflow Rate gpm/sf 60.3

King County Department of Natural Resources and Parks
June 2002 16 King County Water Reuse Technology Demonstration ProjectActiflo Report (Final Report)
Table 9. Stage 2C Performance- Low Polymer and Optimum Coagulant Doses
Constituent Units Coagulant (average of composite and continuous online samples)Alum PACL Ferric Chloride
Run Duration hours 4.0 4.0 4.0pH Influent su 7.0 7.0 6.9 Effluent su 6.6 6.7 6.3Turbidity Influent NTU 146 161 143 Effluent NTU 7.7 26.5 31.6 Removal Efficiency % 95 84 78TSS Influent mg/L 227 270 249 Effluent mg/L 28 86 107 Removal Efficiency % 88 68 57COD Influent mg/L 640 557 428 Effluent mg/L 248 261 472 Removal Efficiency % 61 53 -10Total Phosphorus Influent mg-P/L 3.02 3.33 2.18 Effluent mg-P/L 0.46 0.58 1.35 Removal Efficiency % 85 83 38
Stage 2D – Continuous Run Trials – Low Polymer and Low Coagulant DosesStage 2D pilot testing trials were conducted on September 14 and 25, 2001, for low-polymerand low-coagulant dose combinations for alum and PACL. There was no trial run using ferricchloride as a coagulant. As previously described, this testing stage consisted of a four-hour trialrun at low-polymer and low-coagulant doses followed by an increase in chemical doses tooptimum levels. Hourly samples were collected during the low chemical dose period and werecombined to produce a single, hand composite for subsequent analysis. Once the processachieved steady-state performance, hourly samples were collected for a minimum of threehours and combined to produce a single, hand composite sample at optimum chemical doses forsubsequent analysis. Turbidity and pH were continuously monitored throughout the test on a30-minute time interval. Table 10 summarizes the operating conditions during this testingstage. All tests were conducted at a flow rate of 350 gpm.

King County Department of Natural Resources and Parks
June 2002 17 King County Water Reuse Technology Demonstration ProjectActiflo Report (Final Report)
Table 10. Stage 2D Operating Conditions
Operating Condition Units ValueFlow Rate gpm 350Polymer Type -- M155Low Chemical Dose Interval Polymer Dose mg/L 0.75 Coagulant Dose Alum mg/L 60 PACL mg/L 17Optimum Chemical Dose Interval Polymer Dose mg/L 0.95 Coagulant Dose Alum mg/L 110 PACL mg/L 34Hydraulic Residence Time Injection Tank minutes 1.0 Maturation Tank minutes 3.0Surface Overflow Rate gpm/sf 60.3
Figure 4 and Figure 5 present raw influent and effluent turbidities. As shown, the change inchemical doses appears to have a more dramatic impact when alum is used as a coagulantcompared to PACL. Table 11 summarizes the influent and effluent performance data for thevarious components.
Figure 4. Stage 2D Low Alum Doses Followed By Optimum Alum Doses – Polymer Dose 0.95 mg/L.
Figure 5. Stage 2D - Low PACL Doses Followed By Optimum PACL Doses - Polymer Dose 0.95 mg/L.
Table 11. Stage 2D Performance - Low Polymer and Low Coagulant Doses Followed by OptimumDoses
Constituent Units Low Chemical Dose Perioda Optimum Chemical Dose Perioda
Alum PACL Alum PACLpH Influent su 7.0 7.1 7.0 7.0 Effluent su 6.8 6.9 6.6 6.7

King County Department of Natural Resources and Parks
June 2002 18 King County Water Reuse Technology Demonstration ProjectActiflo Report (Final Report)
Constituent Units Low Chemical Dose Perioda Optimum Chemical Dose Perioda
Alum PACL Alum PACLTurbidity Influent NTU 112 119 142 155 Effluent NTU 12.8 4.4 4.7 3.6 Removal Efficiency % 89 96 97 98TSS Influent mg/L 185 229 252 262 Effluent mg/L 26 11 21 15 Removal Efficiency % 86 95 92 94COD Influent mg/L 610 579 633 666 Effluent mg/L 190 221 233 173 Removal Efficiency % 69 62 63 74Total BOD Influent mg/L 181 203 na 264 Effluent mg/L 56 39 na 51 Removal Efficiency % 69 81 --- 81Insoluble (Particulate) BOD Influent mg/L na 129 na 176 Effluent mg/L na 8 na 11 Removal Efficiency % -- 84 -- 94Total Phosphorus Influent mg-P/L 3.04 3.36 2.32 2.81 Effluent mg-P/L 1.74 0.77 0.52 0.16 Removal Efficiency % 43 77 78 94
a Average of composite and continuous online samples.na = data not collected.
King County Department of Natural Resources and Parks
June 2002 19 King County Water Reuse Technology Demonstration ProjectActiflo Report (Final Report)
Stage 2E – Continuous Run Trials – Wet and Dry Startups and Loss ofChemical Feed
The Stage 2E pilot testing trial was conducted on October 1, 2001, using polymer and PACL.The intent of this trial was to determine the responsiveness of the Actiflo process to wet and drystartups and loss of chemical feed. The trial duration was approximately seven hours andconsisted of the following components:
Dry Startup. This test consisting of bringing the pilot unit on-line with all process tanksempty (i.e. pilot unit is shutdown, drained, then restarted).
Loss of Chemical Feed. Both polymer and coagulant addition was stopped.
Chemical Feed Re-initiated. Both polymer and coagulant addition was restarted.
Loss of Polymer Feed. Polymer addition was stopped.
Polymer Feed Re-initiated – polymer addition was started.
Loss of Coagulant (PACL) Feed. PACL addition was stopped.
Process Shutdown.
Wet Startup. This test consists of bringing the pilot unit on-line with all process tanksfull (i.e. pilot unit was shutdown but not drained; then restarted, and both polymer andcoagulant addition was started).
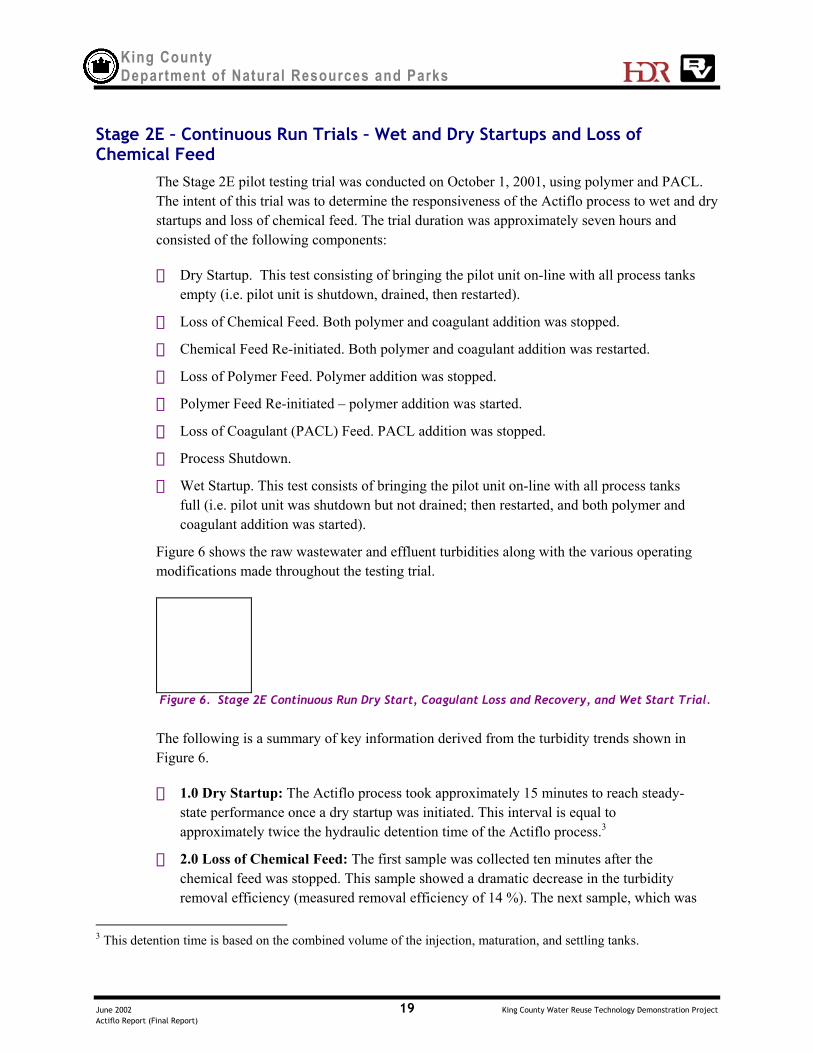
Figure 6 shows the raw wastewater and effluent turbidities along with the various operatingmodifications made throughout the testing trial.
Figure 6. Stage 2E Continuous Run Dry Start, Coagulant Loss and Recovery, and Wet Start Trial.
The following is a summary of key information derived from the turbidity trends shown inFigure 6.
1.0 Dry Startup: The Actiflo process took approximately 15 minutes to reach steady-state performance once a dry startup was initiated. This interval is equal toapproximately twice the hydraulic detention time of the Actiflo process.3
2.0 Loss of Chemical Feed: The first sample was collected ten minutes after thechemical feed was stopped. This sample showed a dramatic decrease in the turbidityremoval efficiency (measured removal efficiency of 14 %). The next sample, which was
3 This detention time is based on the combined volume of the injection, maturation, and settling tanks.

King County Department of Natural Resources and Parks
June 2002 20 King County Water Reuse Technology Demonstration ProjectActiflo Report (Final Report)
collected 20 minutes after the chemical feed was stopped, showed essentially noturbidity removal (measured removal efficiency of 1 %). Although this samplinginterval is not sufficient to provide a detailed characterization of how performancedeteriorates with loss of chemical feed, it does indicate that performance will deterioratequickly and within a time period equivalent to one hydraulic detention time.
3.0 Chemical Feed Re-Initiated: The Actiflo process took approximately ten minutesto reach steady-state performance once the chemical feed was re-initiated. This is equalto approximately 1.5 times the hydraulic detention time of the Actiflo process.
4.0 Loss of Polymer Feed: Loss of polymer had a dramatic impact on performance. Asshown in Figure 6, effluent turbidities were actually higher than influent values. Thefirst sample, collected 15 minutes after polymer feed was stopped, showed negativeremoval efficiency. As in the loss-of-chemical event, this sampling interval was notsufficient to provide a detailed characterization of how performance deteriorates withloss of polymer feed. However, this data does indicate that performance will deterioratequickly and within a time period equivalent to two hydraulic detention times.
5.0 Polymer Feed Re-Initiated: The first sample, which was collected five minutesafter polymer feed was re-initiated, showed a dramatic improvement in turbidityremoval. Although the removal efficiency was high (measured removal efficiency of 91%), it was slightly lower than the values achieved under steady-state conditions(measured removal efficiencies in the range of 97 to 98 %). These data indicate that theActiflo process responds very quickly when polymer feed is re-initiated. Overall, theActiflo process took approximately ten minutes to reach steady-state performance oncethe polymer feed was re-initiated. This interval is equal to approximately 1.5 times thehydraulic detention time of the Actiflo process.
6.0 Loss of Coagulant: As with the loss of polymer feed, the loss of coagulant feed hada dramatic impact on performance, although, negative removal efficiencies were notencountered. As shown in Figure 6, effluent turbidities were approximately equal toinfluent turbidities (no removal) within ten minutes after the coagulant feed wasstopped. As with to the loss of chemical event, the sampling interval was not sufficientto provide a detailed characterization of how performance deteriorates with loss ofcoagulant feed. However, this data does indicate that performance will deterioratequickly and within a time period equal to 1.5 times the hydraulic detention time of theActiflo process.
7.0 Shutdown: Influent flow was discontinued and process tanks were maintained fullfor ten minutes.
8.0 Wet Startup: The Actiflo process took approximately ten minutes to reach steady-state performance once a wet startup was initiated. This interval is equal toapproximately 1.5 times the hydraulic detention time of the Actiflo process, which isslightly less than the interval required for a dry startup.

King County Department of Natural Resources and Parks
June 2002 21 King County Water Reuse Technology Demonstration ProjectActiflo Report (Final Report)
In addition to turbidity measurements, samples were collected for TSS and COD analysesthroughout the continuous trial runs. Samples were also collected for total and insoluble BODanalyses near the beginning of a change and sometime after the process had achieved steady-state performance (typically about 10 minutes). A copy of the detailed laboratory analysesresults is contained in Appendix B. A review of these results indicates that TSS and CODremoval efficiencies require the same amount of time to achieve steady-state performance asthose shown in Figure 6.
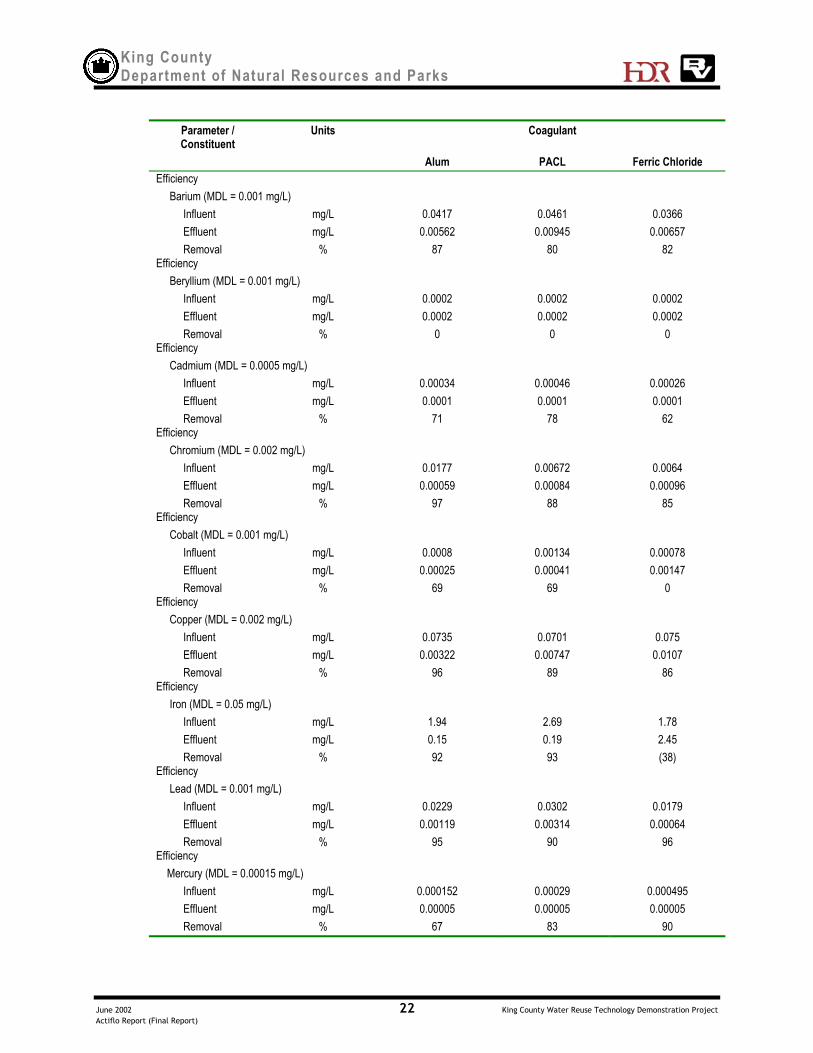
Stage 2F – Continuous Run Trials – Metals Removal AssessmentThe Stage 2F pilot testing trial was conducted on September 19 and 26, 2001. The intent ofthese trials was to evaluate the potential of the Actiflo process to remove various metalconstituents. All three trials were operated at optimum coagulant and polymer dosecombinations and a constant flow rate of 350 gpm. Table 12 summarizes the results that weredeveloped from this testing trial along with the method detection limits (MDL) for eachconstituent.
Table 12. Stage 2F Performance - Metals Analysis Results
Parameter /Constituent
Units Coagulant
Alum PACL Ferric ChlorideOperating Parameters Flow Rate gpm 350 350 350 Polymer Type - M155 M155 M155 Polymer Dose mg/L 0.95 0.95 0.95 Coagulant Dose mg/L 110 34 110Performance Results Turbidity Influent NTU 105 123 144 Effluent NTU 2.4 3.6 4.89 RemovalEfficiency
% 98 97 97
Aluminum (MDL = 0.01 mg/L) Influent mg/L 1.45 1.96 1.32 Effluent mg/L 0.19 0.511 0.04 RemovalEfficiency
% 87 74 97
Antimony (MDL = 0.0025 mg/L) Influent mg/L 0.0011 0.0011 0.00061 Effluent mg/L 0.00063 0.00063 0.0005 RemovalEfficiency
% 43 43 18
Arsenic (MDL = 0.0025 mg/L) Influent mg/L 0.00356 0.00563 0.0024 Effluent mg/L 0.0013 0.0018 0.00097 Removal % 63 68 60
King County Department of Natural Resources and Parks
June 2002 22 King County Water Reuse Technology Demonstration ProjectActiflo Report (Final Report)
Parameter /Constituent
Units Coagulant
Alum PACL Ferric ChlorideEfficiency Barium (MDL = 0.001 mg/L) Influent mg/L 0.0417 0.0461 0.0366 Effluent mg/L 0.00562 0.00945 0.00657 RemovalEfficiency
% 87 80 82
Beryllium (MDL = 0.001 mg/L) Influent mg/L 0.0002 0.0002 0.0002 Effluent mg/L 0.0002 0.0002 0.0002 RemovalEfficiency
% 0 0 0
Cadmium (MDL = 0.0005 mg/L) Influent mg/L 0.00034 0.00046 0.00026 Effluent mg/L 0.0001 0.0001 0.0001 RemovalEfficiency
% 71 78 62
Chromium (MDL = 0.002 mg/L) Influent mg/L 0.0177 0.00672 0.0064 Effluent mg/L 0.00059 0.00084 0.00096 RemovalEfficiency
% 97 88 85
Cobalt (MDL = 0.001 mg/L) Influent mg/L 0.0008 0.00134 0.00078 Effluent mg/L 0.00025 0.00041 0.00147 RemovalEfficiency
% 69 69 0
Copper (MDL = 0.002 mg/L) Influent mg/L 0.0735 0.0701 0.075 Effluent mg/L 0.00322 0.00747 0.0107 RemovalEfficiency
% 96 89 86
Iron (MDL = 0.05 mg/L) Influent mg/L 1.94 2.69 1.78 Effluent mg/L 0.15 0.19 2.45 RemovalEfficiency
% 92 93 (38)
Lead (MDL = 0.001 mg/L) Influent mg/L 0.0229 0.0302 0.0179 Effluent mg/L 0.00119 0.00314 0.00064 RemovalEfficiency
% 95 90 96
Mercury (MDL = 0.00015 mg/L) Influent mg/L 0.000152 0.00029 0.000495 Effluent mg/L 0.00005 0.00005 0.00005 Removal % 67 83 90

King County Department of Natural Resources and Parks
June 2002 23 King County Water Reuse Technology Demonstration ProjectActiflo Report (Final Report)
Parameter /Constituent
Units Coagulant
Alum PACL Ferric ChlorideEfficiency Molybdenum (MDL = 0.0025 mg/L) Influent mg/L 0.0129 0.00964 0.0371 Effluent mg/L 0.0105 0.00788 0.0224 RemovalEfficiency
% 19 18 40
Nickel (MDL = 0.0015 mg/L) Influent mg/L 0.00596 0.00695 0.007 Effluent mg/L 0.00263 0.00299 0.0091 RemovalEfficiency
% 56 57 (3))
Selenium (MDL = 0.0075 mg/L) Influent mg/L 0.0015 0.0015 0.0015 Effluent mg/L 0.0015 0.0015 0.0015 RemovalEfficiency
% 0 0 0
Silver (MDL = 0.001 mg/L) Influent mg/L 0.00363 0.00429 0.00924 Effluent mg/L 0.0002 0.0003 0.00051 RemovalEfficiency
% 94 93 94
Thallium (MDL = 0.001 mg/L) Influent mg/L 0.0002 0.0002 0.0002 Effluent mg/L 0.0002 0.0002 0.0002 RemovalEfficiency
% 0 0 0
Vanadium (MDL = 0.0015 mg/L) Influent mg/L 0.00369 0.00537 0.00315 Effluent mg/L 0.0014 0.0015 0.0003 RemovalEfficiency
% 62 72 90
Zinc (MDL = 0.0025 mg/L) Influent mg/L 0.175 0.193 0.135 Effluent mg/L 0.025 0.0406 0.0222 RemovalEfficiency
% 86 79 84
Note values shown in () represents negative removals.
Evaluation of Pilot ResultsTable 13 contains a comparison of conventional primary clarification and the Actiflo processwith regard to operating (design) parameters and performance. As shown in Table 13, theActiflo process performed significantly better than conventional primary clarification. Overallthis process was determined to out-perform conventional treatment with regard to averageremoval efficiencies and performance variability. This finding is based on a comparison of

King County Department of Natural Resources and Parks
June 2002 24 King County Water Reuse Technology Demonstration ProjectActiflo Report (Final Report)
Actiflo pilot results and King County primary clarification performance data obtained forOctober 2001.

King County Department of Natural Resources and Parks
June 2002 25 King County Water Reuse Technology Demonstration ProjectActiflo Report (Final Report)
Table 13. Comparison of Conventional Primary Clarification and Actiflo Operation and Performance.
Units Conventional Primary Treatment Ballasted Flocculation (Actiflo)Operation / PerformanceParameter Average Peak Range Average Peak Range
Overflow Ratea Gpm/sf 0.7b 1.7 -- 40 60 --Hydraulic Retention Timec minutes 120 -- -- 9 6 --COD Removald % 36 -- 25 – 47 70 -- 63 – 74TSS Removald % 78 -- 71 – 86 93 -- 90 – 96
a Overflow rate based on primary clarifier surface area and Actiflo settling tank surface area. Primary clarifier overflow rate is based ontypical criteria for process design.b Actual 2001 average overflow rate for King County was 0.80 gpm/sf (1,150 gpd/sf).c Hydraulic retention time based on primary clarifier volume and the total combined volume of all Actiflo process tanks. Primary clarifierhydraulic retention time is based on typical criteria for process design.d Average performance values and ranges are based on October 2001 King County primary clarifier performance data and optimumchemical dose trials.
Effectiveness of Technology to Achieve Performance GoalsTable 14 summarizes target performance goals and continuous run trial results at optimumchemical doses. Values shown in Table 14 are based on an average of all continuous trialsperformed at optimum chemical doses. BOD5 (both total and particulate), COD, and turbidityperformance measurements were included in the table for comparison purposes.
Table 14. Effectiveness of Process to Achieve Performance Goals
Goal Description Target Measured PerformanceAluma PACLb Ferric Chloridec
(%) (%) (%) (%)BOD5 Removal NE 74 75 78Particulate BOD5 Removal NE 93 87 96COD Removal > 60 70 71 67TSS Removal > 80 93 93 94Turbidity Removal NE 97 97 97Total Phosphorus Removal > 80 75 92 91
NE = Performance goal was not established.a Average of trial tests conducted on September 17, 25, and 26 at optimum polymer and coagulant doses.b Average of trial tests conducted on September 12, 14, 26, and 28 at optimum polymer and coagulant doses.a Average of trial tests conducted on September 19 and 20 at optimum polymer and coagulant doses.
The data presented in Table 14 show the following:
BOD5 Removal. BOD removal in the Actiflo was excellent, ranging from 74 to 78 %for the three coagulants tested. Comparison of particulate and total BOD5 influentconcentrations obtained throughout the trials tests shows that the particulate BODfraction is consistently between 60 and 67 % of total BOD5 concentrations in theinfluent stream. A comparison of removal efficiencies and particulate BOD fractionsshows that some “soluble” BOD was removed in the Actiflo process. Most likely, this

King County Department of Natural Resources and Parks
June 2002 26 King County Water Reuse Technology Demonstration ProjectActiflo Report (Final Report)
“soluble” BOD removal was associated with small colloidal particles that were slightlysmaller than the pore size of the membrane used for suspended solids analysis.
COD Removal. As evident by the high TSS removal efficiencies, the Actiflo process ishighly effective at removing particulates/solids from raw wastewater. However, since itis a physical/chemical process and relies on particle-to-sand (or particle-to-particle)interaction for removal, it lacks the ability to remove soluble organic constituents. Somecolloidal particles can be coagulated and removed as evidenced by the BOD removal.COD removal efficiency is between 67 and 71 % for the three coagulants tested,achieving the 60 % removal target for the Actiflo.
TSS and Turbidity Removal. The Actiflo process consistently achieved excellent TSSremoval of 93 and 94 %, achieving the goal of 80 %. Turbidity removal averages 97%for the coagulants tested. This process is highly effective for removal of suspendedsolids and turbidity.
Total Phosphorus Removal. PACL and ferric chloride achieved 92 and 91 %phosphorus removal, achieving the goal of 80 % removal. Surprisingly, alum additionwas less effective for phosphorus removal. The reason for lower phosphorus removal isnot clear. Phosphorus removal efficiency is proportional to TSS removal. In otherwords, reduction in suspended solids removal is expected to cause a reduction inphosphorus removal. Pilot testing results appear to following this relationship.However, changes in influent pH, temperature, and wastewater composition could affectthe aluminum-phosphate reaction. It is possible that for this particular wastewater, alumreactions are less favorable to precipitate phosphate and particulate coagulation.
Comparison of Coagulants. With the exception of alum for phosphorus removal, allthree coagulants were found to achieve the target performance goals. However, PACLwas found to provide the highest overall removal based on a comparison of COD, TSS,and phosphorus removal efficiencies.
Sand RecoveryInitially, approximately 800 pounds of micro-sand was added to the pilot unit during startup.On fifteen occasions between September 20 and October 3, 2001, 50 pounds of micro-sand wasadded for a total of 750 pounds. The total combined effluent production throughout the testingwas approximately 3,070,000 gallons. Based on these values, the estimated sand loss is about250 pounds per million gallons produced.
According to the pilot facility operators, sand was added as needed and was not monitored;therefore the pilot testing was not operated to minimize sand loss. Typically the initial sandcharge during full-scale startup is in the range of 800 pounds per mgd of treatment capacity;additional sand is added thereafter to compensate for dead zones within the process tanks.Under typical optimal conditions sand loss would be expected to be in the range of 8 to 12pounds per MG of water treated.
King County Department of Natural Resources and Parks
June 2002 27 King County Water Reuse Technology Demonstration ProjectActiflo Report (Final Report)
Residual CharacteristicsSludge concentrations ranged between 3,900 and 8,020 mg/L. The overall average sludgeconcentration for all testing stages was 6,000 mg/L. This concentration is considered to bedilute compared to conventional primary sludge, which is typically in the range of 20,000 to40,000 mg/L (2 to 4 %).
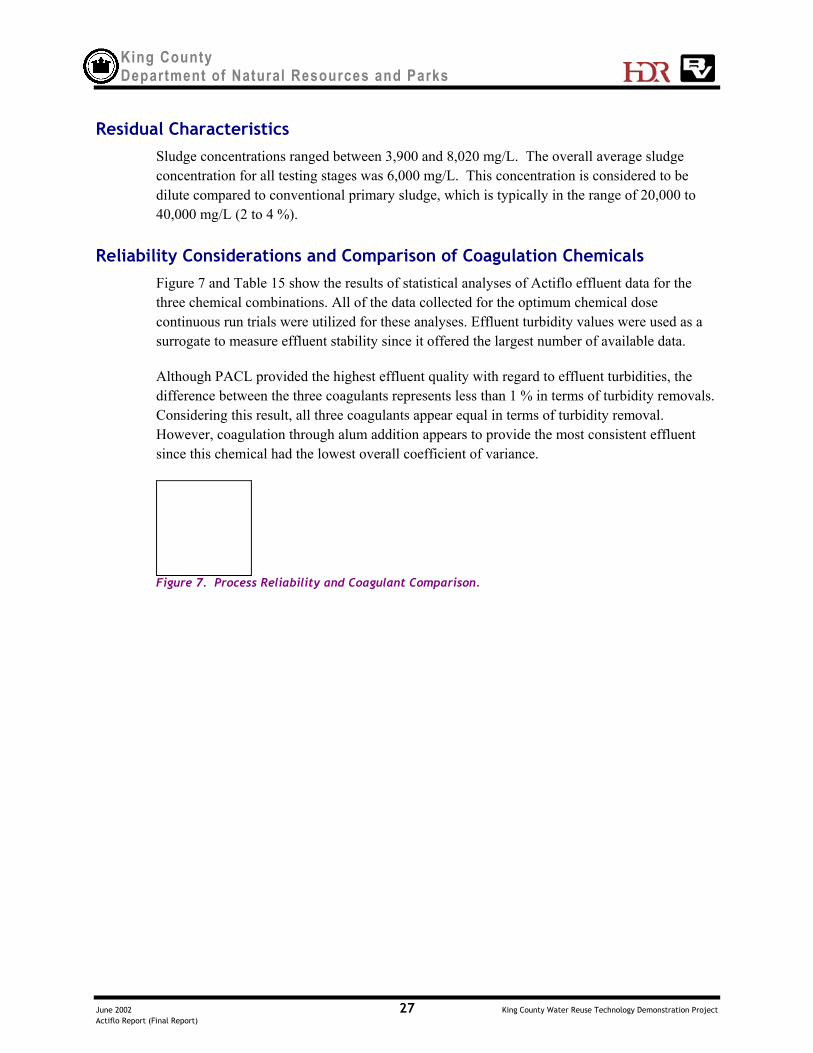
Reliability Considerations and Comparison of Coagulation ChemicalsFigure 7 and Table 15 show the results of statistical analyses of Actiflo effluent data for thethree chemical combinations. All of the data collected for the optimum chemical dosecontinuous run trials were utilized for these analyses. Effluent turbidity values were used as asurrogate to measure effluent stability since it offered the largest number of available data.
Although PACL provided the highest effluent quality with regard to effluent turbidities, thedifference between the three coagulants represents less than 1 % in terms of turbidity removals.Considering this result, all three coagulants appear equal in terms of turbidity removal.However, coagulation through alum addition appears to provide the most consistent effluentsince this chemical had the lowest overall coefficient of variance.
Figure 7. Process Reliability and Coagulant Comparison.

King County Department of Natural Resources and Parks
June 2002 28 King County Water Reuse Technology Demonstration ProjectActiflo Report (Final Report)
Table 15. Comparison of Chemical Coagulants Effluent Turbidity Statistics.
Units Actiflo Effluent TurbidityValue
Alum PACL Ferric ChlorideAverage (50-percentile Value) NTU 3.64 3.22 4.0310th percentile value NTU 2.60 2.11 2.7690th percentile value NTU 5.10 4.91 5.88Standard Deviation NTU 1.09 1.26 1.38Coefficient of Variance % 30.0 39.0 34.3
In addition to removal efficiencies, alkalinity consumption and sludge production should alsobe considered when selecting the best chemical for this application. Table 16 contains asummary of the optimum coagulant doses and estimated sludge production and alkalinityconsumptions based on stoichiometry and a flow rate of 1 mgd. For reference, the additionalsludge production attributed to alum and ferric chloride addition represents an increased ofapproximately 20 % in the overall primary sludge production on a dry weight basis.4
Table 16. Comparison of Alkalinity and Sludge Production
Coagulant Optimum Coagulant Dose Estimated Sludge Productiona Estimated Alkalinity Consumption(mg/L) (lb TSS / mgd) (lb Alkalinity / mgd) mg/L
Alum 110 240 470 55PACL 34 460 1,700 205
Ferric Chloride 110 285 845 100a Dry weight basis.
Table 17 contains a summary of chemical dose requirements and estimated chemical costsobtained from a local vendor. Chemical costs (both unit and daily chemical costs) areexpressed in terms of the weight basis previously described. Daily chemical costs are based ona flow rate of 1.0 mgd.
Table 17. Comparison of Coagulant Costs
Optimum Coagulant Dose Unit CostCoagulant
(mg/L) ($/pound)a
Daily Chemical Costs($/day)
Alum 110 0.146 135PACL 34 1.75 495Ferric Chloride 110 0.15 140
a Unit costs are reports based on a dry weight basis for alum and ferric chloride and on a dry weight of Al2O3 basis for PACL.
As shown, the costs associated with PACL are significantly higher than those associated withalum and ferric chloride. Overall ferric chloride and alum are approximately equal with regardto cost. Ferric chloride is a considered to be more corrosive than alum due to its low pH andability to stain surfaces. In addition, ferric produces more sludge and requires more alkalinity
4 This value is based on an assumed influent TSS concentration of 175 mg/L and a 95 % removal efficiency. Both ofthese assumed values are equal to the average of values reported for the Stage 2A trials.

King County Department of Natural Resources and Parks
June 2002 29 King County Water Reuse Technology Demonstration ProjectActiflo Report (Final Report)
addition compared to alum. Based on these findings, the most favorable coagulant for thisapplication appears to be alum.
Metals RemovalPrimary, secondary, and tertiary treatment processes have been shown to have the potential forsignificantly reducing pollutant metal concentrations.5 During primary treatment, metalsremoval occurs by sedimentation of particle-associated metals. However, when chemicals suchas iron salts or alum are added, interactions may occur between the added chemicals and metalcomplexes that enhance the overall removal of these pollutants. Removal of both particle-associated and dissolved metals can occur in the activated sludge process through theincorporation of particle-associated metals in flocs and dissolved metal uptake or adsorption.
Table 18 contains a summary of metals removal data for copper and zinc obtained from theCity of Lansing, MI.6 This facility consists of primary, secondary, and tertiary filtrationprocesses. These data correspond to the average of 12 months of daily monitoring data.Information derived from average influent and effluent copper and zinc data for the Actiflopilot unit are presented in Table 18 for comparison purposes.
Table 18. Comparison of Pilot Results and Conventional Treatment Process for Copper and ZincRemoval
Constituent Lansing, MI Facility Actiflo PilotAverage
Concentration(µg/L)
Overall RemovalEfficiency
(%)
AverageConcentration
(µg/L)
Overall RemovalEfficiency
(%)Copper Influent 47.2 -- 72.9 -- Primary Effluent 24.3 48.5 7.1 97.4 Secondary Effluent 6.1 87.1 -- -- Final (Filtered)Effluent
2.8 94.1 -- --
Zinc Influent 121.2 -- 167.7 -- Primary Effluent 56.9 53.1 29.3 82.5 Secondary Effluent 25.0 79.4 -- -- Final (Filtered)Effluent
20.0 83.5 -- --
The results presented in Table 18 demonstrate that the performance of the Actiflo process iscomparable to the combined performance of the primary, secondary, and tertiary treatmentprocesses at the City of Lansing wastewater treatment facility with regard to copper and zincremoval efficiencies. These results are impressive considering that the Actiflo process was
5 Water Environment Research Federation (2000).6 Data obtained from Water Environment Research Federation (2000).

King County Department of Natural Resources and Parks
June 2002 30 King County Water Reuse Technology Demonstration ProjectActiflo Report (Final Report)
functioning as a primary treatment process and does not have the ability for metals removal viabiological uptake or adsorption.
Implementation
Design CriteriaThe following is a summary of the recommended design criteria for this application.
Injection tank detention time = 1 minute (Lawrence, Kansas - 1 minute)
Maturation tank detention time = 3 minutes (Lawrence, Kansas - 3 minutes)
Settling tank overflow rate = 60 gpm/sf (Lawrence, Kansas – 60 gpm/sf at maximumdesign flow)
These criteria were developed based on the pilot study testing results. It is anticipated thatthese criteria will be applicable for primary treatment applications that have similar rawwater characteristics as those measured throughout the pilot test. Because there are no full-scale Actiflo primary treatment applications, a comparison of recommended and full-scaledesign criteria cannot be made at this time. However, the criteria used for the design of theLawrence, Kansas facility is presented above for comparison purposes. Criteria for theKansas facility was selected for comparison purposes because this facility is one of the latestfull-scale Actiflo installations and represents the most similar type of application (treatmentof sanitary sewer overflows). As shown above, these criteria are identical to therecommended criteria. The only difference between the two sets of criteria is that the full-scale application has a coagulation chamber immediately upstream of the injection tank.This chamber is designed to provide a hydraulic detention time of 48 seconds at themaximum design flow. However, based on the excellent results of the pilot test, it appearsthat this coagulation chamber is not required to maximize the impact of chemical addition.
Full-Scale ConsiderationsThe following is a summary of items that should be considered prior to the design of a full-scale Actiflo process.
Pilot testing results demonstrate that the Actiflo process performed better thanconventional primary clarification in terms of measured COD and TSS removalefficiencies. However, this assessment was based on pilot testing results and may notbe indicative of full-scale performance due to the following considerations:
Wall Effects: Small-scale pilot tests do not perform as well as full-scaleapplications due to wall effects which impact particulate settling.
Constant Flow Rate: The pilot test was operated at a constant flow rate. This isconsidered to be a significant advantage compared to full-scale applications, whichmust compensate for diurnal variations.

King County Department of Natural Resources and Parks
June 2002 31 King County Water Reuse Technology Demonstration ProjectActiflo Report (Final Report)
While the Actiflo process was shown to achieve good removal for BOD5, TSS, and totalphosphorus, it is considerably more expensive to operate than conventional primarytreatment because it requires large volumes of chemicals, there is more mechanicalequipment to operate and maintain, and it produces more sludge.
The Actiflo process requires much less space than primary clarifiers. However, thisdoes not result in lower capital costs. Capital costs associated with the Actiflo processwere estimated to be between 10 and 25 % higher than conventional primary clarifiers,based on a treatment capacity of 1.0 mgd.
To accurately compare Actiflo and conventional primary treatment, all of thedifferences and their impacts on the whole treatment plant must be examined. Forexample, are the extra chemical costs for the Actiflo process offset by reduced energycosts or smaller basins in the subsequent activated sludge treatment process.
Design Features
Control, monitoring, specialThe following features should be included in a full-scale Actiflo application for primarytreatment:
Chemical Addition Facilities. As shown in Figure 6, the Actiflo process is highlydependant on both polymer and coagulant addition for pollutant removal. When feed ofeither of these chemicals was stopped, effluent turbidities were found to be essentiallyequal to influent turbidities (i.e. no turbidity removal was achieved). Providingredundant feed pumps, chemical feed and turbidity monitoring equipment, andautomatic switchover capability for changing feed pumps should be considered for full-scale applications. These attributes should minimize the potential for process upsets dueto loss of chemical feed.
Monitoring and Process Control. Turbidity is used as the primary instrument formonitoring and controlling the Actiflo process. At a minimum, turbidimeters should beinstalled to monitor the influent and effluent Actiflo streams. Streaming currentdetectors could be considered for optimizing chemical addition.
Pretreatment requirements Fine Screen. Providing fine screening prior to the Actiflo process will lessen the
potential of clogging or damaging process equipment. In addition, it will minimize theamount of fine particles being recycled and accumulated within the process. Themanufacturer recommends that a three- to ten-mm fine screen be provided upstream ofthe Actiflo process in primary treatment applications. The selected screen opening sizeis dependant on the diameter of the hydrocyclone apex tip, which in turn, is dependenton the capacity of the Actiflo process. The recommended minimum screen opening for asingle, 1 mgd Actiflo unit is 3 millimeters.
King County Department of Natural Resources and Parks
June 2002 32 King County Water Reuse Technology Demonstration ProjectActiflo Report (Final Report)
Grit Removal. The manufacturer recommends grit removal for primary treatmentapplications to minimize solids accumulation in the process tanks and the amount ofparticles being recycled within the process. The removal system should be designed toremove all particles larger than 100 microns.
Residual treatmentDue to the higher TSS removal efficiency, the Actiflo process will generate more sludge thanthe conventional primary treatment process. Moreover, the Actiflo sludge stream has asignificantly lower solids concentration. Typically, the sludge concentration from conventionalprimary clarifiers ranges between 10,000 and 40,000 mg solids/L. As previously described,Actiflo sludge stream concentrations ranged between 4,000 and 8,000 mg/L during the pilotstudy. Based on the average sludge concentration of 6,000 mg/L, Actiflo sludge flow rates areestimated to be in the range of 330 and 660 % greater than those of conventional primaryclarification if the two systems achieve equal removal efficiencies.
In a conventional wastewater treatment plant, where solids stabilization is performed on-site, anintermediate thickening process would be required between the Actiflo and sludge digestionprocesses. However, King County is considering the Actiflo process for a satellite treatmentplant where the solids stream would be routed to back into the collection system for subsequenttreatment and disposal at a different wastewater treatment plant. In this scenario, a more dilutesolids stream is not detrimental because a higher flow rate would provide more carrier water tominimize solids deposition within the collection system. The biological and chemical sludgesproduced by the Actiflo process are not expected to have any detrimental effects on thecollection system.
The generation and handling of chemical sludge is another factor that should be consideredwhen determining if the Actiflo process is a viable alternative to conventional primarytreatment. As previously described, alum and ferric chloride addition can increase the overallsludge production by approximately 20 %, on a dry weight basis, when used in primarytreatment applications.
Issues Not Resolved By Pilot Test ProgramDue to the limited time of the Actiflo pilot study, sand recovery and the potential for long-termsand fouling (inability to completely clean sand) were not investigated during the study.
ReferencesUS Filter/Kruger Products (2002) ACTIFLO Pilot Study for King County, WA at West PointWWTP Seattle, WA.
Water Environmental Research Federation (2000) Assessing Methods of Removing Metals fromWastewater: A Review of Data and Methodologies. WERF Project 97-CTS-4 Final Report.

King County Department of Natural Resources and Parks
June 2002 King County Water Reuse Technology Demonstration ProjectActiflo Report (Final Report)
Appendix A - Test Plan

King County Department of Natural Resources and Parks
June 2002 King County Water Reuse Technology Demonstration ProjectActiflo Report (Final Report)
Appendix B - Testing Data

King County Department of Natural Resources and Parks
June 2002 King County Water Reuse Technology Demonstration ProjectActiflo Report (Final Report)
Appendix C - Pilot Unit Photos

King CountyDepartment of Natural Resources and Parks
June 2002 1 King County Water Reuse Technology Demonstration ProjectActifloTest Plan
Actiflo Testing Protocol (Version 2)The USFilter ACTIFO pilot unit arrived at the West Point WWTP on August 27. It will be on-site for a total of six weeks and is scheduled to leave the site on October 5. This unit will beoperated 5 days per week, 8 hours per day by two full-time USFilter operators. The unit isbeing tested as one of 8 treatment process for the Demonstration Project. The demonstrationtesting facilities are configured to convey West Point WWTP primary influent to the ACTIFLOunit. The focus of the testing will be to evaluate this ballasted sedimentation process as aprimary treatment plant. If possible, the primary influent feed source will be diluted with WestPoint secondary effluent to simulate a Combined Sewer Overflow (CSO) event. This versionof the test plan addresses the testing for the next several weeks for the primary treatmentapplication. A revision to this plan will be released in the near future to address the CSOapplication testing.
Primary Treatment Application Test GoalsUnder constant flow conditions evaluate one polymer and three coagulants with the followingperformance goals:
TSS removal: >80%
COD removal: >60%
BOD removal under optimum dose conditions
Phosphorus removal: > 80%
Metals removal under one optimum dose condition
BOD sampling is limited due to the current workload for the West Point Process lab. Theintent is to use COD and TSS removal as the primary evaluation parameters for evaluating thistechnology for primary treatment. Under optimal conditions, BOD analysis will be conducted.
Metals analysis will be limited to one test condition to minimize the county laboratory’sworkload.
Once a range of coagulant and polymer doses are tested, selected chemical feeds will be used toassess the following:
How long it takes the unit to achieve effective treatment during a dry startup
How long it takes the unit to achieve effective treatment during a wet startup
The impacts on treatment performance due to loss of chemical feed
The impacts on treatment performance under peak flow conditions
The impacts of peak solids loading on treatment performance in a rain event
King CountyDepartment of Natural Resources and Parks
June 2002 2 King County Water Reuse Technology Demonstration ProjectActifloTest Plan
With the exception of the peak flow test, all of the testing will be conducted at a constant feedflow rate. Initially the maximum flow rate was 310 gpm (equivalent to a hydraulic loading rateof 53 gpm/sf). The County replaced the feed pump impeller to increase its capacity. Thismodification was made on September 11, 2001 and resulted in an increase in pumping capacityfrom 310 to 370 gpm (equivalent to a hydraulic loading rate of 60 gpm/sf). A throttling valvewill be used to adjust the feed flow to the desired level of 350 gpm during a portion of the tests.
Test StagesThere will be two stages in the primary treatment evaluation. Both are defined below.
Stage 1 – Optimization/Coagulant & Polymer Trials (Conducted on September 5, 6, 7, and10, 2001)
Optimization will be used to quickly determine an optimal polymer and coagulant dose. Wealso refer to this as the polymer and coagulant trials phase. Each test condition is expected tolast only one to two hours in order to evaluate a wide range of coagulant and polymer doses in abrief period. This is possible with this test unit because the hydraulic residence time is under30 minutes. Typically, the unit is operated under one test condition for only two hydraulicresidence times before taking a sample that is representative of that test condition.
The data collected will be used to develop U-shaped curves for dose-versus-effluent turbidity,COD and TSS. BOD will not be measured because of the long turn-around time for theanalysis and impacts to the West Point Process lab workload.
Optimization test results1 were reviewed and discussed during a conference call on September11, 2001. The purpose of the discussion was to determine the optimal polymer and coagulantdoses for the various chemicals. Below is a list of the testing results:
The selection of the optimum coagulant doses was based on a review and discussion ofmeasured COD, TSS, and turbidity removal efficiencies. Optimum chemical doses wereselected based on the “best” (as opposed to achieving desired removal efficiencies)performance obtained from various coagulant doses coupled with a constant polymerdose of 0.85mg/L.
The selections of “low” coagulant doses were based on reviews of TSS and turbidityremoval efficiency data. The overall goal of the selection process was to determine theminimum coagulant dose (coupled with a polymer dose of 0.85 mg/L) that wouldachieve 80 percent TSS removal efficiencies.
Polymer doses for subsequent testing phases: The optimal polymer dose was determinedto be 0.95 mg/L. Polymer doses will be reduced to 0.75 mg/L during the reducedcoagulant tests.2
1 See Preliminary Actiflo performance data and figures developed by US Filter operators (data collected September5, 6, 7, and 10).

King CountyDepartment of Natural Resources and Parks
June 2002 3 King County Water Reuse Technology Demonstration ProjectActifloTest Plan
Coagulant doses for subsequent testing phases:
1. Alum: The optimal alum dose was determined to be 110 mg/L. Alum doses will bereduced to 60 mg/L during the reduced coagulant tests.
2. Ferric Chloride: The optimal ferric dose was determined to be 110 mg/L. Ferric doseswill be reduced to 60 mg/L during the reduced coagulant tests.
3. Poly Aluminum Chloride: The optimal poly aluminum chloride dose was determined tobe 30 mg/L. Poly aluminum chloride doses will be reduced to 15 mg/L during thereduced coagulant tests.
Stage 2 – Continuous Run
This stage will be used to confirm the optimal coagulant and polymer doses for COD, TSS andBOD removal. A sustained (up to eight-hour run) for the optimal test conditions will beconducted. Also, the impacts of reducing the coagulant and polymer will be evaluated. Wetand dry startup, loss of chemical feed, peak flow and peak solids testing will also occur in thisstage.
Test Conditions and SamplingThe test conditions and number of samples/analyses for the Optimization and Continuous Runstages are listed in Table 1 along with the number of samples. The sample locations and typeare listed below. All sample locations are within the ACTIFLO trailer and will be collected bythe USFilter operators.
2 Originally the optimum and low polymer doses were selected to be 0.85 and 0.65 mg/L, respectively. The valuewas later changed to 0.95 and 0.75 mg/L, respectively based on discussion with Bob Bucher.

King CountyDepartment of Natural Resources and Parks
June 2002 4 King County Water Reuse Technology Demonstration ProjectActifloTest Plan
SAMPLING
Table 1 describes the sample designation and types for the various testing phases. Table 1contains a description of the anticipated duration for each testing phase and conditions.
Table 1. Sample Designation and Types
SampleDescription
SampleDesignation
Sampling Make-up / Methodology
OptimizationPhase
Continuous Run Phase
Influent Sample# S1BF Single grab sample Hand composite ofhourly grab samples
Actiflo Effluent Sample# S5 Single grab sample Hand composite ofhourly grab samples
HydrocycloneSludge
none required -- Hand grab sample
Sand none required -- Hand grab samplea
a Analyses shall be performed by US Filter operators during the Continuous Run testing phase. Data shall be provided to King County so itcan be put into the County’s data management system.
TEST CONDITIONS
Stage 1 – Optimization: Coagulant and Polymer Trials
Operate unit at constant flow rate of 310 gpm.
Test two polymers at various dose rates with alum at a constant dose.
USFilter operators will develop U-shaped curves for polymer dose versus turbidity, COD andTSS. Select the polymer and its dose for subsequent coagulant trials.
Test alum, poly aluminum chloride (PaCl), and ferric chloride at varying doses to achieve atarget clarifier effluent turbidity of <5 NTU and the target percent removals for TSS and CODof 80% and 60%, respectively. Use selected polymer and a constant dose as described above.
US Filter operators will develop U shape curves showing dose versus effluent turbidity, CODand TSS. From these curves, select the optimal alum, ferric chloride and PaCl doses for theContinuous Run stage.
Stage 2 – Continuous Run
With the exception of the peak flow test, operate the unit at 350 gpm under the following testconditions:

King CountyDepartment of Natural Resources and Parks
June 2002 5 King County Water Reuse Technology Demonstration ProjectActifloTest Plan
Alum
8 hour run: optimal alum and polymer dose from optimization
4 hour run: half the alum dose, optimal polymer dose
4 hour run: optimal alum dose, half the polymer dose
8 hour run: 4 hour run of half the alum and polymer optimal doses. Following this 4-hour test, alum and polymer additions will be increased to optimum doses. Turbiditymeasurements to be recorded during all test runs. This data will be used to determine howmuch time is required for the process to achieve steady-state performance. Once theprocess has achieved steady-state performance, hourly samples are to be collected for aminimum of three hours to produce a single hand composite sample.
Ferric Chloride
8 hour run: optimal alum and polymer dose from optimization
4 hour run: half the alum dose, optimal polymer dose
4 hour run: optimal alum dose, half the polymer dose
8 hour run: 4 hour run of half the ferric chloride and polymer optimal doses. Followingthis 4-hour test, ferric chloride and polymer additions will be increased to optimum doses.Turbidity measurements to be recorded during all test runs. This data will be used todetermine how much time is required for the process to achieve steady-state performance.Once the process has achieved steady-state performance, hourly samples are to becollected for a minimum of 3 hours to produce a single hand composite sample.
Poly Aluminum Chloride
8 hour run: optimal alum and polymer dose from optimization
4 hour run: half the alum dose, optimal polymer dose
4 hour run: optimal alum dose, half the polymer dose
8 hour run: four-hour run of half the poly aluminum chloride and polymer optimaldoses. Following this four-hour test, poly aluminum chloride and polymer additions willbe increased to optimum doses. Turbidity measurements to be recorded during all testruns. This data will be used to determine how much time is required for the process toachieve steady-state performance. Once the process has achieved steady-stateperformance, hourly samples are to be collected for a minimum of three hours to producea single hand composite sample.

King CountyDepartment of Natural Resources and Parks
June 2002 6 King County Water Reuse Technology Demonstration ProjectActifloTest Plan
Further Alum, Ferric Chloride, and Poly Aluminum Chloride Testing
4 hour run: (if needed) further reduction of alum dose to assess the impact of chemicaldose on COD, TSS, or phosphorus removal efficiencies.
4 hour run: (if needed) further reduction of ferric chloride dose to assess the impact ofchemical dose on COD, TSS, or phosphorus removal efficiencies.
4 hour run: (if needed) further reduction of poly aluminum chloride dose to assess theimpact of chemical dose on COD, TSS, or phosphorus removal efficiencies.
Develop curves for effluent COD, TSS and P versus coagulant and polymer dose. Calculatepercent removals for the parameters measured. As indicated in Table 1, BOD (total andsoluble) will be measured for the two optimal runs, both coagulant and polymer doses, for eachof the three coagulants. For one of these coagulants, influent and effluent metals will bemeasured during a single test condition (i.e., optimal coagulant and polymer doses).
Dry Start
Shut down unit.
Restart with all tanks empty. Operate at 350 gpm. Assume this test will last only four hours.
Use a single coagulant/dose and polymer/dose at optimal treatment conditions from previoustesting. Selection of the coagulant will be based on review of the Optimization and ContinuousRun data. Based on the on-line effluent turbidity monitoring, collect a minimum of four grabsamples once the effluent turbidity is <5 NTU. Combine these grabs into a composite foranalysis per Table 1. It is expected that this test will last four hours. USFilter operators willnote how long it takes for the effluent turbidity to reach <5NTU.
Wet Start
Shut down unit. Wait for a minimum of one hour. Keep tanks full.
Restart unit. Operate at 350 gpm.
Use the same coagulant/dose and polymer/dose that were used in the Dry Start test. Based onthe on-line effluent turbidity monitoring, collect a minimum of four grab samples once theeffluent turbidity is <5 NTU. Combine these grabs into a composite for analysis per Table 1.This test is also expected to last four hours. USFilter operators will note how long it takes forthe effluent turbidity to reach <5NTU.

King CountyDepartment of Natural Resources and Parks
June 2002 7 King County Water Reuse Technology Demonstration ProjectActifloTest Plan
Chemical Feed Failure
Shut off coagulant and polymer feed for one hour. Keep operating unit at 350 gpm. In the nexthour, collect four grab samples and combine these into a composite for analysis per Table 1.USFilter operators will note how long it takes for the effluent turbidity to exceed 5 NTUs.
Restart chemical feed and operate the unit for one hour at same flow rate. In the next hour,collect four grab samples and combine these into a composite for analysis per Table 1. It isanticipated that this test will last four hours. USFilter operators will note how long it takes,since the chemical feed is restarted, for the clarifier effluent turbidity to drop back down below5 NTUs.
Peak Flow Stress Test
The County will test maximum flow conditions for the ACTIFLO unit’s primary influent feedpump. This will be the maximum flow used in this test. The average flow rate will be 275 gpmor 25 percent lower than the peak flow of 370 gpm to allow enough of a difference in flow ratesto evaluate the impacts on the treatment performance.
The unit will be operated at the average flow condition for two hours. Four grab samples willbe collected and combined into a composite sample for analysis per Table 1.
The unit will then be operated at the peak flow condition for two hours. Four grab samples willbe collected and combined into a composite sample for analysis per Table 1.
Finally, the unit will be operated back at the average flow rate for another two hours. Four grabsamples will be collected and combined into a composite sample for analysis per Table 1.
SCHEDULE
The duration of the testing and associated dates are listed in Table 1. It is assumedoptimization will start on September 7, 2001. Per the proposed schedule, the primary treatmenttesting will be finished on October 1, 2001. With the unit leaving the site on October 5, thisonly leaves three days of testing for CSO treatment. October 5th will be reserved fordisassembling and packing up the unit.
CONTACTS
Since this testing is occurring in a very brief period, and many test conditions will be evaluated,it is important to maintain frequent, if not daily communications between the USFilteroperators and staff, King County and the consultant team (HDR and Black & Veatch). Thefollowing is a list of the project team members.

King CountyDepartment of Natural Resources and Parks
June 2002 8 King County Water Reuse Technology Demonstration ProjectActifloTest Plan
King CountyBob Bucher206-263-3883, [email protected]
John Smyth206-684-1774, [email protected]
HDRJB Neethling916-351-3830, [email protected]
Mike Norton425-450-6250, [email protected]
Kevin Kennedy916-351-3886, [email protected]
Black & Veatch
Cindy Wallis-Lage913-458-3603, [email protected]
USFilter/KrugerChris White, Pilot Program Manager919-677-8310, Cell 919-349-5836, [email protected]
Daniel Austria, Onsite Pilot Unit Operator919-677-8310, Cell 919-349-2279, [email protected]
It is essential that the project team hold frequent conference calls as needed. Bob Bucher willcoordinate the calls. At a minimum, they will include Daniel Austria and/or Chris White fromUSFilter and JB Neethling and Kevin Kennedy, HDR.
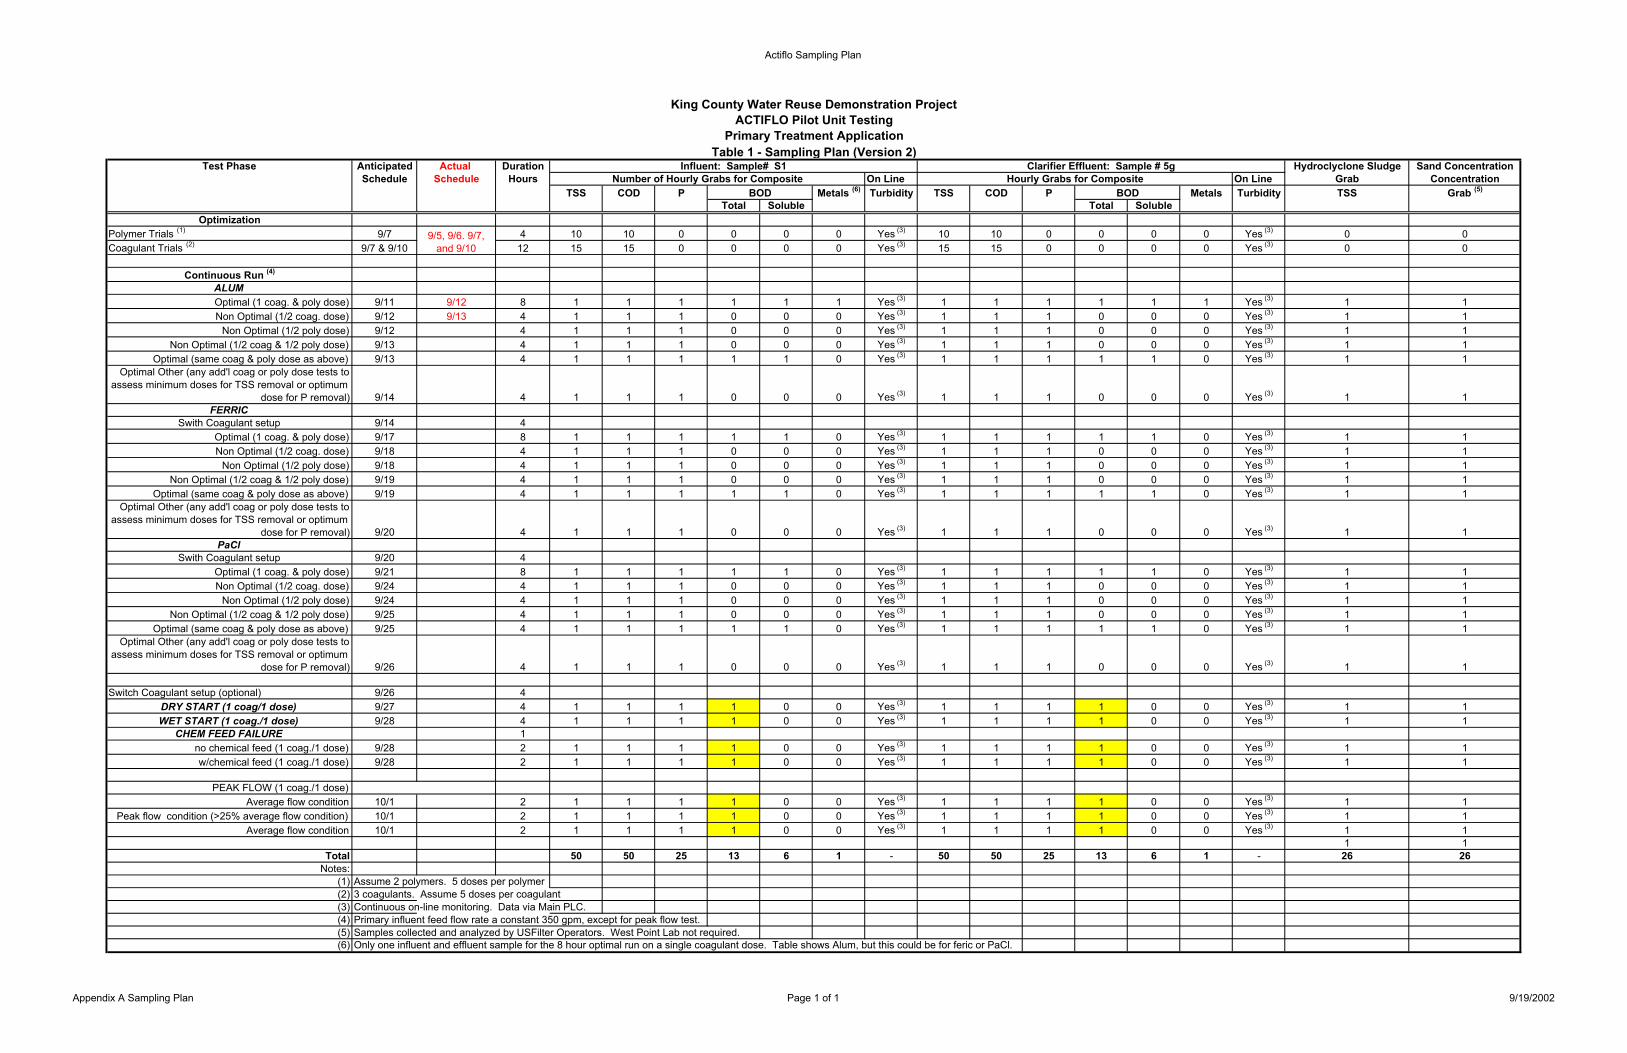
Actiflo Sampling Plan
Test Phase Anticipated Actual Duration Hydroclyclone Sludge Sand ConcentrationSchedule Schedule Hours On Line On Line Grab Concentration
TSS COD P Metals (6) Turbidity TSS COD P Metals Turbidity TSS Grab (5)
Total Soluble Total SolubleOptimization
Polymer Trials (1) 9/7 4 10 10 0 0 0 0 Yes (3) 10 10 0 0 0 0 Yes (3) 0 0Coagulant Trials (2) 9/7 & 9/10 12 15 15 0 0 0 0 Yes (3) 15 15 0 0 0 0 Yes (3) 0 0
Continuous Run (4)
ALUMOptimal (1 coag. & poly dose) 9/11 9/12 8 1 1 1 1 1 1 Yes (3) 1 1 1 1 1 1 Yes (3) 1 1Non Optimal (1/2 coag. dose) 9/12 9/13 4 1 1 1 0 0 0 Yes (3) 1 1 1 0 0 0 Yes (3) 1 1
Non Optimal (1/2 poly dose) 9/12 4 1 1 1 0 0 0 Yes (3) 1 1 1 0 0 0 Yes (3) 1 1Non Optimal (1/2 coag & 1/2 poly dose) 9/13 4 1 1 1 0 0 0 Yes (3) 1 1 1 0 0 0 Yes (3) 1 1
Optimal (same coag & poly dose as above) 9/13 4 1 1 1 1 1 0 Yes (3) 1 1 1 1 1 0 Yes (3) 1 1Optimal Other (any add'l coag or poly dose tests to
assess minimum doses for TSS removal or optimum dose for P removal) 9/14 4 1 1 1 0 0 0 Yes (3) 1 1 1 0 0 0 Yes (3) 1 1
FERRICSwith Coagulant setup 9/14 4
Optimal (1 coag. & poly dose) 9/17 8 1 1 1 1 1 0 Yes (3) 1 1 1 1 1 0 Yes (3) 1 1Non Optimal (1/2 coag. dose) 9/18 4 1 1 1 0 0 0 Yes (3) 1 1 1 0 0 0 Yes (3) 1 1
Non Optimal (1/2 poly dose) 9/18 4 1 1 1 0 0 0 Yes (3) 1 1 1 0 0 0 Yes (3) 1 1Non Optimal (1/2 coag & 1/2 poly dose) 9/19 4 1 1 1 0 0 0 Yes (3) 1 1 1 0 0 0 Yes (3) 1 1
Optimal (same coag & poly dose as above) 9/19 4 1 1 1 1 1 0 Yes (3) 1 1 1 1 1 0 Yes (3) 1 1Optimal Other (any add'l coag or poly dose tests to
assess minimum doses for TSS removal or optimum dose for P removal) 9/20 4 1 1 1 0 0 0 Yes (3) 1 1 1 0 0 0 Yes (3) 1 1
PaClSwith Coagulant setup 9/20 4
Optimal (1 coag. & poly dose) 9/21 8 1 1 1 1 1 0 Yes (3) 1 1 1 1 1 0 Yes (3) 1 1Non Optimal (1/2 coag. dose) 9/24 4 1 1 1 0 0 0 Yes (3) 1 1 1 0 0 0 Yes (3) 1 1
Non Optimal (1/2 poly dose) 9/24 4 1 1 1 0 0 0 Yes (3) 1 1 1 0 0 0 Yes (3) 1 1Non Optimal (1/2 coag & 1/2 poly dose) 9/25 4 1 1 1 0 0 0 Yes (3) 1 1 1 0 0 0 Yes (3) 1 1
Optimal (same coag & poly dose as above) 9/25 4 1 1 1 1 1 0 Yes (3) 1 1 1 1 1 0 Yes (3) 1 1Optimal Other (any add'l coag or poly dose tests to
assess minimum doses for TSS removal or optimum dose for P removal) 9/26 4 1 1 1 0 0 0 Yes (3) 1 1 1 0 0 0 Yes (3) 1 1
Switch Coagulant setup (optional) 9/26 4DRY START (1 coag/1 dose) 9/27 4 1 1 1 1 0 0 Yes (3) 1 1 1 1 0 0 Yes (3) 1 1WET START (1 coag./1 dose) 9/28 4 1 1 1 1 0 0 Yes (3) 1 1 1 1 0 0 Yes (3) 1 1
CHEM FEED FAILURE 1no chemical feed (1 coag./1 dose) 9/28 2 1 1 1 1 0 0 Yes (3) 1 1 1 1 0 0 Yes (3) 1 1w/chemical feed (1 coag./1 dose) 9/28 2 1 1 1 1 0 0 Yes (3) 1 1 1 1 0 0 Yes (3) 1 1
PEAK FLOW (1 coag./1 dose)Average flow condition 10/1 2 1 1 1 1 0 0 Yes (3) 1 1 1 1 0 0 Yes (3) 1 1
Peak flow condition (>25% average flow condition) 10/1 2 1 1 1 1 0 0 Yes (3) 1 1 1 1 0 0 Yes (3) 1 1Average flow condition 10/1 2 1 1 1 1 0 0 Yes (3) 1 1 1 1 0 0 Yes (3) 1 1
1 1Total 50 50 25 13 6 1 - 50 50 25 13 6 1 - 26 26
Notes:(1) Assume 2 polymers. 5 doses per polymer(2) 3 coagulants. Assume 5 doses per coagulant(3) Continuous on-line monitoring. Data via Main PLC.(4) Primary influent feed flow rate a constant 350 gpm, except for peak flow test.(5) Samples collected and analyzed by USFilter Operators. West Point Lab not required.(6) Only one influent and effluent sample for the 8 hour optimal run on a single coagulant dose. Table shows Alum, but this could be for feric or PaCl.
BOD
9/5, 9/6. 9/7, and 9/10
Influent: Sample# S1 Clarifier Effluent: Sample # 5gHourly Grabs for CompositeNumber of Hourly Grabs for Composite
BOD
King County Water Reuse Demonstration ProjectACTIFLO Pilot Unit Testing
Primary Treatment ApplicationTable 1 - Sampling Plan (Version 2)
Appendix A Sampling Plan Page 1 of 1 9/19/2002

10-02-01
ACTIFLO Pilot Study @ King County, WA Final SummaryAugust 27 - October 5, 2001
Date Time Flow Rise CommentsRate Rate
2001 gpm gpm/sf Type mg/l Type mg/l Inf. Eff. Inf. Eff. %Rem.
2-Oct 8:30 350 60 Alum 60 M155 0.659:00 6.97 6.70 107 7.20 939:30 7.01 6.73 105 8.82 9210:00 7.03 6.77 110 7.02 9410:30 7.03 6.76 98 7.15 9311:00 7.03 6.76 98 9.27 9111:30 7.04 6.78 100 9.90 9012:00 7.02 6.78 110 12.10 8912:30 6.94 6.73 115 11.10 9012:45 3013:45 7.13 6.99 140 34.60 7514:15 7.06 6.94 148 45.60 6914:45 6.93 6.88 137 48.80 6415:15 6.94 6.83 150 49.30 6715:45 6.91 6.82 145 64.00 5616:15 6.85 6.76 153 62.60 5916:30 6.88 6.78 140 64.20 54
Shutdown3-Oct 8:15 350 60 Alum 60 M155 0.95
8:45 6.91 6.72 90 7.61 929:15 7.00 6.71 92 7.62 929:45 7.00 6.75 102 7.24 9310:15 7.05 6.76 98 4.93 9510:45 6.95 6.71 115 6.30 9511:15 7.00 6.69 100 6.05 9411:45 7.02 6.70 111 6.12 9412:15 7.07 6.74 115 5.95 9512:20 100 0.7513:15 6.96 6.56 122 8.61 9313:45 7.05 6.59 150 7.54 9514:15 7.06 6.62 145 7.93 9514:45 7.02 6.59 165 7.56 9515:15 6.94 6.56 150 7.96 9515:45 6.90 6.52 147 7.33 9516:15 6.95 6.52 140 6.99 9516:20 110 0.9516:45 7.06 6.60 140 3.01 98
Shutdown4-Oct 8:30 350 60 FeCl3 110 M155 0.75
9:00 6.84 6.14 115 10.80 919:30 6.90 6.13 106 7.21 9310:00 6.95 6.19 120 9.86 9210:30 6.91 6.17 109 7.16 9311:00 6.92 6.18 99 7.52 9211:30 6.81 6.08 105 12.50 88
Shutdown
NTUCoagulant Polymer pH Turbidity
Appendix B Testing Data 9/19/2002

King CountyDepartment of Natural Resources and Parks
June 2002 1 King County Water Reuse Technology Demonstration ProjectActiflo Appendix C Photos
Actiflo Pilot Unit Photos
IntroductionThe following photos of the USFilter/Kruger Actiflo pilot unit were taken during the pilottesting. Each photo includes a caption, and several photos include text boxes to point out keypieces of equipment.
Figure 1. USFilter/Kruger Pilot Unit Located Adjacent to West Point WWTP Technology Assessment TestFacility

King CountyDepartment of Natural Resources and Parks
June 2002 2 King County Water Reuse Technology Demonstration ProjectActiflo Appendix C Photos
Figure 2. USFilter/Kruger Pilot Unit Side View
Feed
Clarified Effluentto Drain
ScreeningsCollection
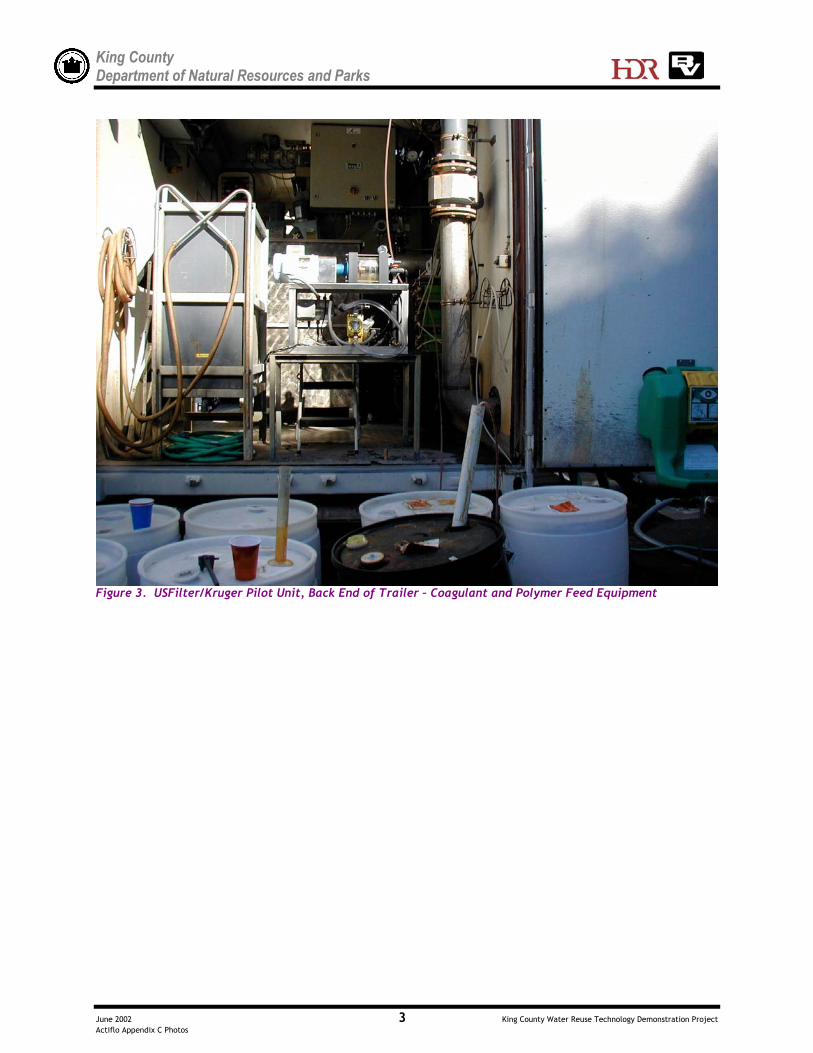
King CountyDepartment of Natural Resources and Parks
June 2002 3 King County Water Reuse Technology Demonstration ProjectActiflo Appendix C Photos
Figure 3. USFilter/Kruger Pilot Unit, Back End of Trailer – Coagulant and Polymer Feed Equipment

King CountyDepartment of Natural Resources and Parks
June 2002 4 King County Water Reuse Technology Demonstration ProjectActiflo Appendix C Photos
Figure 4. Rotary Screen Top View
HydrocycloneSand/Sludge Feed Stream
Separated Sludge Steam

King CountyDepartment of Natural Resources and Parks
June 2002 5 King County Water Reuse Technology Demonstration ProjectActiflo Appendix C Photos
Figure 5. MaturationTank/Clarifier Effluent Top View
MaturationTank
Top of Lamella Tube Settler Clarified Effluent