water retention performance of newly constructed …
TRANSCRIPT

WATER RETENTION PERFORMANCE OF NEWLY
CONSTRUCTED GREEN ROOFS IN COLD CLIMATES
EMMI SILVENNOINEN
UNIVERSITY OF HELSINKI Department of Environmental Sciences Master’s Degree Programme in Multidiciplinary
Studies on Urban Environmental Issues MASTER’S THESIS 12.12.2014

Tiedekunta/Osasto – Fakultet/Sektion – Faculty Department Of Environmental Sciences
Laitos – Institution – Department Environmental Ecology
Tekijä – Författare – Author Emmi Silvennoinen Työn nimi – Arbetets titel – Title Water retention performance of newly constructed green roofs in cold climates Oppiaine – Läroämne – Subject Master’s Degree Programme in Multidiciplinary Studies on Urban Environmental Issues Työn laji – Arbetets art – Level Master´s thesis
Aika – Datum – Month, year December 2014
Sivumäärä – Sidoantal – Number of pages 58 + Appendices 10 p.
Tiivistelmä – Referat – Abstract Infiltration rates in urban areas are low due to a high proportion of impervious structures. Impermeability results in increased rates of urban runoff, which often leads to degradation in receiving waters. Stormwater retention in urban areas can be increased, for instance, with green, vegetated roofs. While impervious, normal roofs produce the runoff immediately, studies with green roofs have shown that they cause delays in peak runoff and reduce the runoff rate and volume by water retention and attenuation. The water retaining capacity of green roofs vary due to local weather conditions and roof characteristics. Several studies and experiments considering stormwater management and other ecosystem services that green roofs provide have been performed worldwide, mainly in temperate regions, while more studies are needed in cold climates especially to quantify the performance of green roofs in winter. The purpose of this thesis was to evaluate the effects of various types of precipitation events on runoff rates, timing and water retention in locally built new green roofs from late summer to early winter in southern Finland. Data on precipitation and green roof runoff as well as soil temperature and humidity were monitored automatically. Green roofs included a) precultivated readymade vegetation mats and b) built on site novel substrate mixture with plug plants and seedlings. My principal aim was to study the capability of green roofs in retaining and attenuating water in relation to the intensity and duration of precipitation, the length of the antecedent dry weather period as well as to temperature and moisture of the green roof substrate. I hypothesised that green roofs retain low intensity events better than high intensity events and more effectively in dry and warm than in wet and cold weather, being negligible at temperatures below 0 ºC. Furthermore, I studied whether retention capacity can be improved by the amendment of biochar. Finally, readymade green roofs with dense vegetation was hypothesised to have better retention capacity than the newly created roofs with very sparse vegetation but only in summer due to evaporation. Based on cumulative runoff, green roofs retained 52 % of rainfall, which is close to the retention capability found in previous studies. Retention was generally higher at warm temperatures and for biochar-amended roofs,in agreement with my hypothesis. Against expectations, roofs with readymade vegetation mats had lower retention than those built on site. In summer and autumn, before freezing temperatures occurred, results were generally according to the hypotheses and previous research: retention rates decreased as rain depth or rain peak intensity increased. When the amount of rain preceding the measurement event was low, and the substrate moisture content was low, retention was better. During wintertime, results were contrary to my hypotheses: Total retention rates increased with the amount of rain and rain intensity, or when substrate moisture content increased. However, a long antecedent dry weather period resulted in better retention, especially during winter. Mean peak flow attenuation for rain events in this study was 64 % and results are in accordance with my hypothesis and previous research. Furthermore, delay times from when the rain event started to when runoff started and from rain peak to runoff peak were detected in this study, mean values of more than 1 h being comparable to what has been reported in the literature. Results from my thesis can be used to improve hydrological models for local stormwater management purposes. Furthermore, results can be compared with those of other ecological stormwater treatment methods. Possible future research topics include the functioning of green roofs during different seasons and especially during freezing and melting periods with assumedly complex hydrological interactions. Avainsanat – Nyckelord – Keywords Stormwater management, Green roof, Retention, Attenuation, Runoff Säilytyspaikka – Förvaringställe – Where deposited Helsinki University, Department of Environmental Ecology, Lahti. Muita tietoja – Övriga uppgifter – Additional information PhD Kirsi Kuoppamäki, and Doc. Johan Kotze, Helsinki University.

Contents 1. Introduction 3
1.1. Characteristics of urban stormwater runoff 3
1.2. Ecological runoff management for urban areas in cold climates 4
1.3. The role of green roofs in ecological stormwater management in cold
climates 6
1.4. Factors affecting green roof stormwater management 8
1.4.1. Roof characteristics 9 1.4.2. Weather conditions 10
1.5. The retention and attenuation capability of green roofs 11
1.6. Study questions and hypotheses 11
2. Material and methods 12 2.1. Local climatic conditions 12
2.2. Study area and setup 13
2.3. Study parameters 15
2.3.1. Rain and runoff 16 2.3.2. Duration of rain and runoff events 17 2.3.3. Rain intensity 17 2.3.4. Delay and peak flow attenuation 18 2.3.5. Antecedent dry weather period and preceding rain sum 18 2.3.6. Substrate moisture and temperature 19
2.4. Statistical analysis 20
3. Results 21 3.1. Precipitation and temperature 21
3.2. Water retention capacity of green roofs 24
3.3 Rain event hydrograph of a heavy rain event in August 2013 27
3.4 Factors affecting the water retention capacity of green roofs 29
3.4.1 The effects of rain depth on water retention of green roofs 29 3.4.2 The effects of rain intensity on water retention of green roofs 32 3.4.3 The effects of temperature on water retention of green roofs 34 3.4.4 Effects of the antecedent dry weather period on water retention of green roofs 35
3.5 Rain and runoff duration 38
1

3.5.1 Runoff duration comparison between green roof treatments 39 3.5.2 The effects of rain depth and duration on runoff duration 39 3.5.3 The effects of substrate moisture content on runoff duration 40
3.6 Delay and attenuation 41
3.6.1 The effects of temperature on peak flow attenuation and delay 41 3.6.2 Effects of the antecedent dry weather period on delay 41 3.6.3 Effects of the preceding rain sums and substrate moisture content on the delay in runoff 42
4. Discussion 42 4.1 Retention 43
4.2. Runoff duration 48
4.3 Delay and peak flow attenuation 49
4.4 Green roofs as part of a combined ecological stormwater treatment method
51
5. Acknowledgments 53 6. References 53 APPENDIX A. Parameters of green roof retention rates and statistical comparisons between rain depth categories in built-on-site and readymade green roofs. 59 APPENDIX B. Parameters of green roof retention rates and statistical comparisons between green roof treatments for rain depth categories. 60 APPENDIX C. Parameters of green roof retention rates and statistical comparisons between low and high rain mean intensity and peak intensity categories. 61 APPENDIX D. Parameters of green roof retention rates and statistical comparisons between mild, freezing, freezing-melting and melting event categories. 62 APPENDIX E. Parameters of green roof retention rates and statistical comparisons between warm and cold substrate temperature event categories for green roof treatments. 63 APPENDIX F. Parameters of green roof retention rates and statistical comparisons between short and longer antecedent dry weather periods. 64 APPENDIX G. Parameters of green roof runoff duration and statistical comparisons between green roof treatments. 65 Appendix H. Parameters of green roof delay times and statistical comparisons between green roof treatments. 66 APPENDIX I. Parameters of green roof delay times (h) from the beginning of the rain event to the onset of runoff and statistical comparisons between short and longer antecedent dry weather periods. 67 APPENDIX J. Parameters of green roof delay times (h) from the beginning of the rain event to the onset of runoff and statistical comparisons between low and high preceding 7 d rain sums. 68
2
1. Introduction
Urban areas have high levels of impervious structures such as buildings,
pavements, roads and parking areas, which result in an increased rate of
stormwater runoff and thus increasing the risk of flooding, erosion and water
pollution. Imperviousness can be seen as an indicator of expanding urbanization,
which leads to degradation of the environment (Arnold & Gibbons 1996).
Stormwater retention in urban areas can be increased, for instance, with green,
vegetated roofs. While impervious, normal roofs produce runoff with minor or no
delay, green roofs increase lag times in the peak runoff by water attenuation and
they also reduce the runoff rate and volume by water retention and
evapotranspiration (Carter & Rasmussen 2006). The water detaining and retaining
capacity of green roofs vary due to local weather conditions and roof
characteristics (Carter & Rasmussen 2006).
1.1. Characteristics of urban stormwater runoff
Urban stormwater runoff causes negative effects on receiving waters (Oberts et al.
2000, Walsh et al. 2005) and often exceeds the carrying capability of the drainage
system resulting in local floods. High runoff rates have been related to heavy
contaminant rates (Oberts et al. 2000). Pollutants and contaminants in urban
runoff consist of heavy metals, nutrients, organic contaminants and particulates
(Oberts et al. 2000, Göbel et al. 2007). Considering the risks of water pollution,
ground waters are of most concern and the treatment of stormwater runoff and
infiltration practices should be designed carefully in groundwater forming areas
(Ellis 2000).
Defining parameters for urban stormwater include high loads of contaminants and
compounds such as total suspended solids (TSS), total dissolved solids (TDS),
ammonium (NO3), nitrates (NH4), phosphates (PO4), sulphates (SO4), polycyclic
aromatic hydrocarbons (PAH), mineral oil hydrocarbons (MOH), cadmium (Cd),
copper (Cu), zinc (Zn), and also lead (Pb) (Göbel et al. 2007) even though the use
3
of lead is banned in fuels nowadays. Pollutant concentrations and loads vary
depending on local traffic densities, atmospheric deposition and wind and rain
event characteristics (Oberts et al. 2000, Göbel et al. 2007).
1.2. Ecological runoff management for urban areas in cold climates
Local legislation defines applicable stormwater treatment methods. In Finland
there are several laws concerning stormwater treatment such as the Water Act
(1961/264), the Act of Water Services (2001/119), the Land Use and Building Act
(1999/132) and the Environmental Protection Act (2000/86) (City of Lahti 2011).
The Government has submitted a proposal to parliament for a new Act of Water
Services and a New Land Use and Building Act. According to the Environmental
Protection Act, local councils or water utility companies may require that
stormwater is treated at place, for example with green roofs, ponds, depressions or
infiltration structures and channels (Parliament of Finland 2013). The city of
Helsinki (2013) is already developing a Green Roof Strategy. Furthermore,
several EU directives guide management of stormwater and water resources in
member countries (see City of Lahti 2011). The European commission (2013)
recommends the development and promotion of Green Infrastructure for
sustainable development.
Ecological runoff management options for urban areas include infiltration,
retention and detention or attenuation with many variations. Choices of suitable
methods vary depending on local conditions such as available space and the
presence of groundwater. Cost also affects decision-making (Clar et al. 2004a).
Site specific design is required to ensure the capacity of treatment facilities.
The objectives of different management options are stormwater convey,
infiltration, retention and attenuation of the runoff volume and contaminants by
mechanical, chemical and biological processes. Management methods for cold
climates have been developed for decades. The USA has best management
practice (BMP) guidelines that include traditional ecological stormwater treatment
4

systems and some of them can be adapted to Finland when climatic conditions are
similar. Arnold & Gibbons (1996) defined BMPs as general methods to manage
stormwater runoff, including structural and non-structural techniques and common
maintenance procedures. They emphasized that the focus should be in retaining
hydrological functioning on-site. Factors to be taken in account in the design
phase are flow rates, estimated rainfall and the quantity of pollutants. Infiltration
practices should be considered carefully in groundwater forming areas due to the
risk of harmful contaminants entering groundwater. However, maintaining
groundwater levels is a challenge in urban areas and controlled infiltration
removes and retains substances from runoff (Ellis 2000). In these areas, combined
treatment systems and the selective treatment of runoff, depending on the local
contaminant rates, could be applicable. Low impact development practices (LIDs)
have been introduced in the USA to more specific and small-scale ecological
stormwater management that aim to retain or copy natural, pre-development
hydrological conditions on site (Dietz 2007, Roseen et al. 2009). LIDs are also
known as WSUD, water sensitive urban design in Australia and SUDS,
sustainable urban drainage systems in the UK. Despite different terminology,
results can be compared and applied to different countries with similar
environmental and climatic conditions.
There have been contradictory results in the winter performance of ecological
stormwater management practices due to air temperature, ice, snow, frost and
delayed biological functions. Air temperature (Muthanna 2007) and ice
(Semadeni-Davies 2006) affect the hydraulical functioning of infiltration and
bioretention structures. Snow alters the hydrological cycle and challenges the
treatment of stormwater. Stormwater is stored in snow until it melts, which causes
peaks in runoff flow rate and, thus, peaks in pollutant loads (Oberts et al. 2000,
Roseen et al. 2009). Frost often has negative impacts on the infiltration capacity of
soils (Roseen et al. 2009). Altered water temperatures have an effect on water
chemistry, ion exchange capacity and water density (Roseen et al. 2009). The
growing season is short in cold climates and transpiration and biological activities
are limited in wintertime. Yet, effective results in hydraulic functioning,
5

infiltration and contaminant removal rates have been observed in winter with
some LID practices such as bioretention (Dietz 2007). In addition, there are
satisfactory results with infiltration systems during the snowy season (Semadeni-
Davies 2006, Muthanna 2007, Roseen et al. 2009).
Infiltration is an important method in runoff treatment since contaminants are
most often adsorbed into particulates that can be retained during the infiltration
process (Jokela 2008). Infiltration rates vary depending on the materials in the
system. Organic matter is shown to have an effect on binding heavy metals,
especially copper and lead (Bäckström et al. 2004, Muthanna et al. 2007).
Infiltration systems should consist of different soil layers to ensure sufficient
results (Clar et al. 2004b). Even though frost may have negative impacts on
infiltration capacity of the soil, frozen soil may still be permeable (Roseen et al.
2009) especially when frost is granular or porous. An impermeable frost layer can
also be avoided by high infiltration rates that prevent water filled soil pores from
freezing (Muthanna 2007). Furthermore, plant roots are shown to enhance
infiltration rates and prevent soil clogging (Muthanna 2007, Valtonen et al. 2012).
Besides increasing and maintaining infiltration rates, plants are able to degrade
and bind organic and metal pollutants in stormwater (Clar et al. 2004a). However,
it has to be remembered that there are differences in how different species manage
under various circumstances, and thus vegetation should be site specific.
1.3. The role of green roofs in ecological stormwater management in cold
climates
Green roofs provide several ecosystem services including stormwater
management, energy conservation, biodiversity (habitat for wildlife), regulation of
the urban heat island effect by evapotranspiration and insulation, improvement of
air quality, aesthetical values (Getter & Rowe 2006, Obendorfer et al. 2007) and
carbon sequestration (Getter et al. 2009). Green roofs are part of the urban green
environment and therefore maintain biogeochemical processes to cycle water,
nutrients and carbon (Pataki et al. 2011). Several studies considering stormwater
6

management and other ecosystem services that green roofs provide have been
performed worldwide, mainly in temperate regions, while more studies are needed
in cold climates especially to quantify the performance of green roofs in winter
(Berndtsson 2010).
Green, or vegetated roofs are an option to increase stormwater retention in densely
built urban areas where a lack of space often limits construction possibilities
(Obendorfer et al. 2007). Roofs may potentially cover between 40-50 % of city
areas (Villarreal & Bengtsson 2005, Stovin et al. 2012). While impervious,
normal roofs produce the runoff immediately, green roofs cause a delay in the
peak runoff and reduce the runoff rate and volume through water retention,
attenuation and evapotranspiration (Getter & Rowe 2006, Berndtsson 2010; Fig.
1).
Figure 1. Runoff from a green roof (dashed line) generated by a given rain event (black line) modified from Berndtsson (2010, p. 353).
Even though green roofs retain stormwater, effects on runoff quality are more
complicated. According to Berndtsson (2010), green roofs may act as a source of
nutrients due to fertilization, and also other pollutants. Rainwater may contain
nitrates and traces of heavy metals and pesticides, depending on local airborne
sources, and they are leached through green roofs (Berndtsson 2010). Fertilization
of green roofs should be considered with judgment. Especially phosphorus and
Rai
n/ru
noff
inte
nsity
Time
RainRunoff
7

occasionally nitrogen are leached through, although nitrogen is better retained
(Berndtsson et al. 2006).
Green roofs are broadly divided into two categories: extensive and intensive green
roofs. Extensive green roofs have a shallow (2–20 cm), lightweight substrate with
hardy, drought-tolerant plant species (Obendorfer et al. 2007). Sedum species are
amongst the most suitable plants for dry conditions (VanWoert et al. 2005a),
along with succulent Sempervivum species (Getter & Rowe 2006), mosses
(Anderson et al. 2010) and grasses (Nagase & Dunnett 2012). Local, native
species are of interest, but success is not always certain and more research is
needed (Getter & Rowe 2006). Extensive roofs are easy to maintain and costs for
construction are low compared with intensive green roofs. Intensive green roofs
are characterized by thicker substrates (20 cm or more) that can even maintain
woody plant species. Due to heavier loads, requirements for the roof structure are
higher and thus intensive green roof sites have to be selected with judgment. Plant
community selection for both green roof types depend on local climatic conditions
in addition to substrate depth and moisture retaining capacity (Obendorfer et al.
2007).
1.4. Factors affecting green roof stormwater management
The water retaining capacity of green roofs depend on roof characteristics and
local weather conditions. Characteristics include thickness of the growing media,
soil type, vegetation type, vegetation cover, roof age and slope. Weather
conditions include intensity and duration of precipitation events, length of dry
periods and air temperature (Berndtsson 2010). Key hydrological mechanisms of
green roofs include the interception of rainfall by the plant layer, infiltration and
storage in the substrate and drainage layers, while additional moisture either forms
runoff, or evapotranspires (Stovin 2010).
8

1.4.1. Roof characteristics
Generally, retention rates between different green roof types vary and
comparisons are challenging. Substrate thickness and porosity determine part of
the storage capacity. According to Bengtsson et al. (2005), runoff occurs after
water content exceeds the roof substrate field capacity (i.e. maximum water-
holding capacity) and thus maximum roof storage can simply be calculated as the
difference between precipitation depth and runoff depth. Stovin (2010) claims that
the water holding capacity of a roof is better defined in the field by measuring
rainfall and runoff from real rain events than from measurements in the
laboratory. Substrate field capacity, depending on substrate porosity, is usually
determined in oven dry conditions and thus potential retention levels are not
achieved in field conditions. Preceding moisture content of the soil affects the
retaining capability of roofs so that under dry conditions more of the runoff tends
to be retained, even though moderate rains can be retained even under wet roof
conditions (Villarreal & Bengtsson 2005, Teemusk & Mander 2007).
Besides soil characteristics, retention rates can be improved with high plant
coverage (Dunnett et al. 2008) although the impacts of plants vary. According to
VanWoert et al. (2005b), the water retaining effect of vegetation was minimal
compared to the effects of the substrate. Schroll et al. (2011) found vegetated
roofs to retain water significantly more than non-vegetated roofs with similar
substrate in summertime when evapotranspiration rates are high, while in winter
there was no significant difference between the roof types. The substrate retains
runoff, and as depth increases, the retaining ability increases (Mentens et al.
2006). In addition, biochar amendment to soil has been observed to increase
retention rates (Beck et al. 2011). Contradicting results exist of the effects of roof
slope. According to Mentens et al. (2006) and Bengtsson (2005), the effect of
slope cannot be detected, whereas VanWoert et al. (2005b), Villarreal &
Bengtsson (2005) and Getter et al. (2007) found and effect, with a decreasing
slope reducing runoff. Generally, the older the roof, the better are retention rates
(Getter et al. 2007), although Mentens et al. (2006) did not find a significant effect
9

of roof age. Getter et al. (2007) argued that increased free air space in aged roofs
due to root and faunal channelization may also result in quicker initial runoff.
1.4.2. Weather conditions
Key hydrological determinants of retention and average peak reduction include
rain depth, rain intensity and the antecedent dry weather period ADWP (Stovin
2010). Earlier studies indicate that low intensity rain events are retained more
effectively than heavy intensity events (Carter & Rasmussen 2006, Carter &
Jackson 2007, Teemusk & Mander 2007). Furthermore, maximum possible
retention percentages per event decrease as rain depth increases, since the storage
capacity of roofs is restricted (Stovin et al. 2012). According to Berndtsson
(2010), evapotranspiration and water uptake by plants explain the reduction of
runoff. However, season and weather have an influence on this. Bengtsson et al.
(2005) calculated the monthly water balance in Malmö, Southern Sweden, where
average temperatures are below zero from January to February, and noted that
winter months generally have lower evapotranspiration and lower retention
capability. In Germany, green roofs retained nearly 50 % during warmer seasons
but only 20 % in winter (Mentens et al. 2006). Schroll et al. (2011) compared
vegetated and non-vegetated green roofs in the United States Northwest wet
winter climate and found retention rates to be significantly better for both roof
types in summertime compared with wintertime. However, the influence of
vegetation on retention was significant only in summer. Moreover, the retention
capacity of green roofs recovers with shorter antecedent dry weather period in
summer, more so than in winter (Stovin 2010). However, Carson et al. (2013)
found that the median retention of heavy storms (> 40 mm) was lower in summer.
They suggest that factors of high seasonal variability, such as evapotranspiration,
have lower proportional effects as the precipitation event depth increases.
10

1.5. The retention and attenuation capability of green roofs
Sedum roofs have shown 78 % mean retention in the subtropical southern United
States (Carter & Rasmussen 2006) and 34 % mean retention during the rainy UK
spring season (Stovin 2010). Smaller storms are generally retained better: 88 %
mean retention for smaller storms decreased to 48 % for large storms in the
southern United States (Carter & Rasmussen 2006). There is still a lack of
research in colder climates. In Estonia, Teemusk & Mander (2007) noticed that
snow cover melted fast and caused a peak in the runoff, whereas the substrate
melting period lasted up to 12 days with high plant coverage improving the
retention rate. Graceson et al. (2013) noticed that green roof runoff exceeds rain
runoff in two winter months in the UK after and during the period of freezing
temperatures. Even though they did not present exact runoff rates, they mentioned
that retention had distinctive seasonal variation.
Runoff from green roofs is delayed compared to that from impervious roofs due to
the time needed to saturate the substrate and drain through it (Getter & Rowe
2006). Delay time is referred to as lag time between the rain event and runoff.
Green roofs attenuate water, reduce the peak volume of runoff and cause a delay
in both the start and peak of the runoff, especially with smaller storms (Carter &
Rasmussen 2006). Delay times can be calculated by comparing the rain and runoff
hydrographs, either with median, mean or peak values (Stovin et al. 2012). In a
review by Berndtsson (2010), peak to peak delay times vary, on average, between
ca. 1 min and 2 hours, and the start of runoff is delayed up to several hours. Mean
attenuation rates of the rain volume vary from 20 to 60 %, (Villarreal 2007, Bliss
et al. 2009, Stovin et al. 2012). Villarreal (2007) summarized that under dry
conditions, precipitation is retained and attenuated, while under wet conditions
precipitation is only attenuated. Overall, attenuation rates are reported to increase
with retention rates as substrate thickness and substrate organic matter content
increase and as rain duration decreases (Yio et al. 2013).
1.6. Study questions and hypotheses
11

The purpose of this thesis was to investigate the effects of various types of
precipitation events on runoff rates, timing and water retention of green roofs
from the end of the growing season until winter, under field conditions in southern
Finland. Green roofs included a) precultivated readymade vegetation mats with
dense coverage of mosses, Sedum, herbs and grasses and b) very sparse built-on-
site vegetation with plug plants and seedlings. The first hypothesis was that the
readymade green roof type with dense vegetation has better retention capacity
than the built-on-site one but only in summer (cf. Schroll et al. 2011). My
principal aim was to study the capability of green roofs in retaining and
attenuating water in relation to the intensity and duration of precipitation, the
length of the antecedent dry weather period as well as to temperature and moisture
of the green roof substrate. The second hypothesis was that green roofs retain and
attenuate low intensity rain events better than high intensity events and more
effectively in dry and warm than in wet and cold weather, being negligible at
temperatures below 0 oC. The third hypothesis was that the retention capacity of
green roofs can be improved by the amendment of biochar.
2. Material and methods
2.1. Local climatic conditions
According to the Finnish Meteorological Institute, (FMI 2014a) the mean annual
temperature in southwestern Finland is about 5.5 °C. Annual precipitation for
southern and central Finland is approximately 600–700 mm. The driest month is
March and the wettest July and August. Annual rainfall can vary between 200 and
1100 mm. Daily precipitation of 10 mm or more occurs in 10 to 15 days every
year, with the highest recorded daily precipitation being ca. 150 mm, excluding
some rare exceptions. According to measurements by the FMI (2014b) from the
Laune weather station, which is situated only 4.5 km from Jokimaa, the long-term
(1981-2010) average annual rainfall in Lahti is 550-600 mm. Mean annual
temperature in the Lahti region is between 4 and 5 °C.
12

2.2. Study area and setup
Altogether 20 experimental green roofs, each 2 m² in size were built and installed
at Jokimaa research station, Lahti City in Southern Finland, in early July 2013
(Fig. 2). Ten roofs had readymade green roof mats with dense vegetation of
mosses, Sedum, herbs and grasses, hereafter referred to as “readymade” (acronym
R), while 10 roofs were planted on site with plug plants and seedlings, hereafter
referred to as “built-on-site” (acronym S). Five roofs of each vegetation type were
amended with biochar (acronym B) and the rest were left as controls without
biochar addition. The readymade mats were produced by Veg Tech in Sweden
from where they were imported by Envire Ltd., Finland.
The treatments were randomly installed in a block design on platforms that were
made of plywood at a ca 4o angle, with 15 cm high separating walls between the
treatments. Floors and walls of the green roof plots were first covered with a
roofing membrane made of HD polyethylene, above which a 11 mm thick
Nophadrain ND 220 drainage mat (weight 1.060 g/m, drainage capacity 0.64 l/s/m
at 3 % slope) was installed. This drainage mat is made of a molded, contoured
carpet of polystyrene. A 10 mm thick water holding fabric (“VT-filt”: weight
1280 g/m², water storage capacity 8 l/m²) was placed under the substrate layer. A
60 mm layer of experimental substrate, containing 5 % compost, 5 % crushed bark
material, 5 % Sphagnum and 85 % crushed brick, was placed below the 40 mm
thick readymade green roof mats, while the built-on-site green roofs contained
100 mm of the experimental substrate. For the treatments with biochar
amendment, a 10 mm thick layer of biochar, made of birch (Betula spp.) was
added in the middle of the substrate at a depth of 5 cm. The final amount of
biochar was 4 kg m-2. The final total height of each green roof construction was
100 mm.
According to the Veg Tech Company (2014), Sedum species in the readymade
mats were Sedum acre, Sedum album and Sedum sexangulare. Herb species were
13

Achillea millefolium, Campanula rotundifolia, Dianthus arenarius, Dianthus
deltoids, Galium verum, Leucanthemum vulgare, Veronica spicata and Pilosella
officinarum. Drought-resistant grasses include Festuca ovina, Poa alpina and Poa
compressa. The mats were also densely covered by mosses, which were identified
as Bryum argenteum, Ceratodon purpureus and Syntrichia ruralis in October
2013. In addition, a mixture of seeds of selected Finnish meadow plant species
from Suomen Niittysiemen Ltd. were sown evenly on top of the prefabricated
roofs upon establishment in July 2013. Species included Antennaria dioica,
Allium schoenoprasum, Thymus serpyllum, Viola tricolor and Sedum telephium.
As roofs were placed outdoors, the natural germination of airborne spores and
seeds was also possible.
Eight species of plug plants, Campanula rotundifolia, Centaurea jacea, Fragaria
vesca, Knautia arvensis, Lotus corniculatus, Pilosella officinarum, Veronica
Spicata and Viola canina, were planted on each built-on-site roof, which were
divided into eight squares of 0.25 m2 and the plants were put randombly in the
middle of these squares. Species sown on top of the built-on-site roof substrates
were Antennaria dioica, Allium Schoenoprasum, Dianthus deltoides, Galium
verum, Leucanthemum vulgare, Sedum acre, Sedum telephium, Thymus serpyllum
and Viola tricolor.
Runoff quantity and intensity, as well as the length of each runoff event were
monitored automatically by using ECRN-100 rain gauges in five replicates of the
readymade treatment without biochar amendment and in three replicates of the
other green roof treatments. Runoff from the roof was diverted via a gutter into
the rain gauge. Runoff was also collected into containers, which were emptied and
the water volume measured after precipitation events in order to control the
reliability of the rain gauge readings. Soil temperature and moisture were
measured with digital Decagon volumetric sensors that were installed in the top,
middle and bottom of the substrate of the selected readymade green roofs. One
ECRN-100 rain gauge, “Decagon rain gauge”, was placed next to the green roof
treatments, 2 m from the ground to measure precipitation. Furthermore, a local
14

weather station collected data on precipitation events, wind velocity and air
temperature.
Figure 2. The experimental setup at Jokimaa research station, Lahti, showing green roof tables, rain gutters, rain gauges and separate water containers.
2.3. Study parameters
Parameters defined for rain-runoff events were rain event depth, rain duration,
runoff duration, runoff depth and antecedent dry weather period (ADWP).
Furthermore, the following variables were determined: retention rate, mean rain
intensity and peak 20-min rain intensity, peak 20-min runoff intensity, runoff
delay (from the beginning of the rain event to when runoff starts), runoff delay
(from the rain peak to runoff peak), peak flow attenuation and the sum of the
preceding rain for 7 days. Cumulative values for rain and runoff as well as
retention rate for cumulative depth were also calculated.
For substrate moisture, parameters defined were mean moisture content during a
rain event, moisture content at the beginning and the end of a rain event, as well
as at the beginning and the end of runoff. Mean temperature values of substrate
sensors were calculated at the start and end of the runoff event. Furthermore,
event mean temperature values were determined for the whole runoff event.
15

All the data were checked for anomalies and outliers were removed from the
dataset. Some sensors malfunctioned only temporarily, e.g. crushed brick in the
substrate blocked some of the rain gauges on occasion. However, one rain gauge
of a readymade roof with biochar amendment did not function during the whole
research period. Furthermore, one built-on-site roof with biochar amendment had
to be excluded from the analysis due to a high number of of anomalies in the
dataset. As such, two of each treatment with biochar amendment was left for
further data analysis. Raw data from the ECRN-100 rain gauges were transformed
to millimetres per square metre by dividing the treatment surface (2 m²) with the
surface of the ECRN-100 rain gauge (0.22698 m²), and then dividing the raw data
with this ratio.
2.3.1. Rain and runoff
The total research period lasted for 6 months. Measurements started on 10.7.2013
at 10:40 and ended on 10.1.2014 at 20:00, when air temperature dropped well
below 0 oC for several weeks. In addition, calculations for monthly rain event
sums were made separately for July-January. Rain events (mm) were determined
either from the Vaisala rain gauge (28 out of 95 events, i.e. 29 %) or from the
Decagon rain gauge, (67 out of 95 events, i.e. 71 %) depending on which one
showed greater value after anomalies had been excluded from the dataset. Greater
values were chosen due to possible gutter blockages, e.g. leaves or bird faeces, in
either of the precipitation recorders. Furthermore, the Vaisala gauge did not work
properly under freezing and thawing conditions. The interval of all recordings,
except for the Vaisala gauge, was 20 minutes. The Vaisala gauge had an interval
of 10 min and every second recording was added to be in agreement with the
ECRN-100 data. A threshold value of 0.2 mm was chosen as a minimum
precipitation amount for a single rain event according to the 0.2 mm tip that the
ECRN-100 rain gauge gave as the minimum recording. Separate small rain events
below the 0.2 mm threshold (0.01-0.16 mm; recognized by the Vaisala gauge)
were not included in event sums and length calculations.
16
A rain event sum was calculated as rainfall with less than 6 h time dry weather
breaks without registered precipitation inbetween, according to previous research
(Speak et al. 2013, Carson et al. 2013, Stovin et al. 2012, Getter et al. 2007,
VanWoert et al. 2005b). Event breaks were identified when the precipitation or
runoff ended or the next rain event started. Occasionally, runoff stopped before
the end of a rain event. This indicated possible retention capability so the
remaining rain after runoff ended was still calculated at the same event, although
it created moisture load for the next runoff event. Retention rate calculations were
also for the total series of this kind of continuous rain events if runoff was clearly
continuous. Rain events were separated into three categories for further analysis:
events with event sum < 2 mm (n = 49), 2-9.8 mm (due to the 0.2 mm threshold of
the rain gauge) (n = 34) and ≥ 10 mm (n = 12) according to Speak et al. (2013)
and Getter et al. (2007).
Runoff volume (mm) was measured for each rain event and for each individual
roof. Data that showed clear anomalies were excluded. Threshold value for runoff
was set as 0.01 mm per square meter. Runoff values were calculated per treatment
amongst the remaining replicates. These mean values were used to define
retention rate (%) per rain event separately for each treatment.
2.3.2. Duration of rain and runoff events
To determine the duration of rain and runoff events, the first monitored record
was calculated as 0.33 h (20 min) of duration. Runoff duration was calculated as
the time of recorded tips until the next rain event started. Division of < 10 h (n =
59) and ≥ 10 h rain duration (n = 36) was chosen to divide the data for further
analyses according to Speak et al. (2013).
2.3.3. Rain intensity
17

Mean rain intensity (mm h-1) for a rain event was calculated by dividing the event
sum (mm) with rain duration (h). Small values were numerically dominant (mean
= 0.66 mm h-1) but a division of < 0.60 mm h-1 (n = 71) and ≥ 0.60 mm h-1 (n =
24) was chosen to divide the data more evenly in order to compare the two
intensity categories with each other.
Peak 20-min intensity (mm h-1) for a rain event was determined from the peak 20-
min recordings of each rain event. Small values were dominant (mean = 2.87 mm
h-1) and a division was determined as < 2 mm h-1 (n = 61) and ≥ 2 mm h-1 (n = 34)
for further comparative analysis to split the data more evenly.
2.3.4. Delay and peak flow attenuation
Decagon rain gauge data often had a clear lag time compared to the Vaisala gauge
data, which is able to recognise minor precipitation events. Therefore, the more
sensible Vaisala gauge precipitation logger was used to calculate delay times from
the beginning of a rain event to when runoff start, in 56 out of 95 events.
However, if the Decagon rain gauge recorded the first tip before the Vaisala
gauge, it was used for the starting time calculations, as occurred in 39 events.
Delay times were calculated as 0.33 h (20 min) interval sums for each of the green
roof treatments until the time when the monitored runoff started. If runoff started
at the same time when the rain event started, delay was marked as zero. Delay
times between rain peak and runoff peak were determined from the green roof
treatment that showed the highest peak runoff value. Peak flow attenuation was
presented as percentage values by comparing the rain peak and runoff peak values
per event.
2.3.5. Antecedent dry weather period and preceding rain sum
18

The antecedent dry weather period, ADWP (h), was defined as a period that
experienced no such precipitation that could be classified as a rain event.
According to previous research (Stovin et al. 2012, Carson et al. 2013, Speak et al.
2013, amongst others) ADWP of ≥ 6 h was chosen to divide different rain events.
According to Stovin et al. (2012), a distinction was made between events with
short (6–24 h, n = 54) and longer (> 24 h, n = 41) ADWP.
According to Stovin et al. (2012), the cumulative amount of rainfall for 7 days
preceding the rain event was calculated to determine if previous moisture load
affects the retention rate or delay. Division was made between < 12 mm (n = 47)
or ≥ 12 mm rain (n = 48) to divide the events evenly.
2.3.6. Substrate moisture and temperature
Temperature and moisture sensors were located in the middle of the substrate at a
depth of 5 cm in three readymade green roofs. Mean values (%) for substrate
moisture sensors in different roofs were calculated for each event: first, when the
precipitation event started and second, when the runoff event started in order to
determine the possible effect of moisture content on retention. In addition, peak
substrate moisture values and mean substrate moisture values were determined for
each rain-runoff event. The sensitive Vaisala precipitation gauge was used to
determine the starting time of the precipitation event. Moisture contents (%) were
divided into two categories by the mean value of each group; at rain start < 17 %
(n = 42) and ≥ 17 % (n = 53), at event average < 17.8 % (n = 38) and ≥ 17.8 % (n
= 57), and at event peak < 18.6 % (n = 44) and ≥ 18.6 % (n = 51), for pairwise
comparisons inside the group to test the effect of moisture content on retention
rate.
Substrate temperature values were calculated at the start and end of each runoff
event. In addition, substrate temperature values were determined for the whole
runoff event. To study the retention rates of the green roofs with different
substrate temperatures, events were divided into two groups according to the
19

determined values: if temperatures at beginning or the end of an event, or if the
mean value of the event was < 10 ̊C, the event was classified as cold, otherwise it
was considered warm (≥ 10 ̊C). With this classification, all the rain-runoff events
with freezing air temperatures at some point could be listed as cold events.
Substrate temperature values were also used for event categorization for the built-
on-site roofs besides the readymade roofs.
Mean air temperature during the preceding 24 h was calculated for autumn and
winter rain events to determine whether an event included a melting period after
freezing. Rain-runoff events were divided into four categories according to the air
temperature measurements during or before the event: 1. mild events (excluding
thaw; melting events), with temperatures above zero, 2. freezing events when
temperatures dropped below zero at the end of the event, which possibly paused
runoff, 3. freezing-melting events when temperatures dropped below zero at some
point during the event, but rain or runoff continued after thaw, and 4. melting
events following freezing or freezing-melting events, when temperatures were
constantly above zero. Melting events contained stored runoff from the last
freezing events. Thus, a series of events were classified as melting events if their
runoff was continuous and runoff volume exceeded the rain event sum.
2.4. Statistical analysis
IBM SPSS Statistics 21 software was used to analyse the data. Data were checked
for normality by using the Kolmogorov-Smirnov test and by studying the
histograms and residuals of the dataset. For parametric data, t-test was used for
paired comparisons. For non-parametric data, applicable transformations were
made. If data were not normally distributed even after transformations, Mann
Whitney U test was used for pairwise comparisons with independent variables and
Kruskal Wallis test for more than two independent variables. Wilcoxon test was
used for pairwise comparisons of non-parametric related variables and Friedman
test for testing the difference between several related samples. Significances were
tested by Monte Carlo test. Two-tailed test of significance was chosen due to
20
unstated directions of possible differences. Data had large variation and were
generally non-parametric - even after transformations. Regression analyses were
not found viable in most cases, as also suggested by Voyde et al. (2010), Stovin et
al. (2012) and Speak et al. (2013) from similar studies. Hypotheses were tested
mainly by grouping the data and using non-parametric comparisons.
3. Results
3.1. Precipitation and temperature
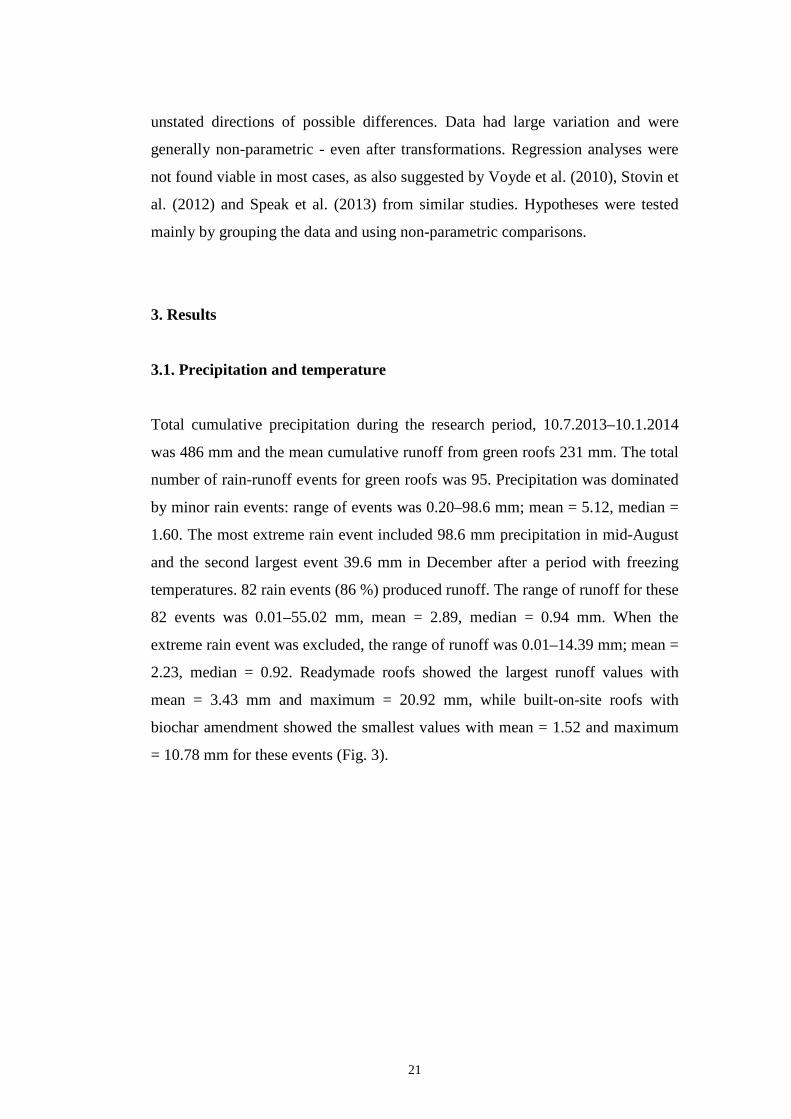
Total cumulative precipitation during the research period, 10.7.2013–10.1.2014
was 486 mm and the mean cumulative runoff from green roofs 231 mm. The total
number of rain-runoff events for green roofs was 95. Precipitation was dominated
by minor rain events: range of events was 0.20–98.6 mm; mean = 5.12, median =
1.60. The most extreme rain event included 98.6 mm precipitation in mid-August
and the second largest event 39.6 mm in December after a period with freezing
temperatures. 82 rain events (86 %) produced runoff. The range of runoff for these
82 events was 0.01–55.02 mm, mean = 2.89, median = 0.94 mm. When the
extreme rain event was excluded, the range of runoff was 0.01–14.39 mm; mean =
2.23, median = 0.92. Readymade roofs showed the largest runoff values with
mean = 3.43 mm and maximum = 20.92 mm, while built-on-site roofs with
biochar amendment showed the smallest values with mean = 1.52 and maximum
= 10.78 mm for these events (Fig. 3).
21

Figure 3. Rainfall and runoff from green roofs during the study period without the extreme 98.6 mm event.
Precipitation in Jokimaa during the study period was 50 mm higher than the sum
of the average monthly values and all other months. However, July 2013 and
January 2014 were more rainy than the long-term average monitored by the
Finnish Meteorological Institute in Lahti (Fig. 4). August was particularly wet
with 137 mm precipitation, compared with the average 75–80 mm, and January
was especially dry with only 16.8 mm precipitation compared with the average of
50–55 mm.
Figure 4. Monthly rainfall at Jokimaa lysimeter station and long-term average values for rainfall in the Lahti region.
0
10
20
30
40
0 10 20 30 40
Run
off (
mm
)
Rainfall (mm)
Readymade
Readymade+biochar
Built on site
Built on site +biochar
Readymade
Readymade+ biochar
Built on site
Built on site +biochar
020406080
100120140
July
Aug
ust
Sep
tem
ber
Oct
ober
Nov
embe
rD
ecem
ber
Janu
aryPre
cipi
tatio
n (m
m) Long-term
average inLahti 1981-2010Measuredprecipitation inJokimaa 2013-2014
22

Mean temperature for the study period was 1.8 °C higher than the mean long-term
average and all months were warmer than their long-term averages (Fig. 5).
Figure 5. Monthly mean air temperatures at Jokimaa lysimeter station and the long-term monthly averages in the Lahti region.
Eight events could be classified as heavy rain events during the study period
according to the classification by FMI (2014c) and they were rather evenly
distributed across the study period (Table 1).
According to the calculator accessible from the Climateguide.fi (2014) website,
rain intensities for a 1 year return period in Finland can be determined for events
with duration equal to or less than 60 minutes as 6.2 mm rain in 20 minutes, 9.2
mm rain in 40 minutes or 9.6 mm rain in 60 minutes. Only three rain events
exceeded this definition: Events with 1 year return period were observed on
18.7.2013 and 1.12.2013, while an event with a 1.9 year return period occurred on
1.9.2013 (Table 1).
Event mean temperatures of the air and the substrate were -7.2– 21.2 ̊C and 1.1–
21.7 ̊C, respectively. The highest substrate mean temperature for a runoff event
with freezing air temperatures at some point of the event was 12 ̊C, when the air
temperature fell from 11 to -0.1 ̊C in 34 hours.
-10-505
101520
July
Aug
ust
Sep
tem
ber
Oct
ober
Nov
embe
rD
ecem
ber
Janu
ary
Air
tem
pera
ture
( ̊C)
Long-termaverage inLahti 1981-2010Measuredtemperature inJokimaa 2013-2014
23

Table 1. Measured heavy rain events during the study period between July 2013 and January 2014. Rain Rain Event depth Mean Peak 20-min HEAVY event start duration ≥ 0.2 mm intensity intensity RAIN (h) (mm) (mm h-1) (mm h-1) SCALE* 18.7.2013 11.00 18.88 1.72 19.35 15 mm/12 h 9.8.2013 3.00 14.13 4.71 9.57 10 mm/4 h 13.8.2013 45.67 98.63 2.16 11.67 20 mm/24 h 1.9.2013 12.67 29.67 2.34 26.46 15 mm/12 h 17.10.2013 24.33 25.20 1.04 7.80 20 mm/24 h 22.10.2013 10.00 10.18 1.02 4.29 10 mm/4 h 28.10.2013 5.67 13.29 2.35 7.29 10 mm/4 h 1.12.2013 15.00 39.60 2.64 18.60 7 mm/1 h *According to the classification by FMI (2014c).
3.2. Water retention capacity of green roofs
Total retention rates from cumulative depths were determined for each treatment
for the whole study period, for the three different rain event depth groups (< 2, 2-
9.8, ≥ 10 mm) and the two substrate temperature groups (< 10, ≥ 10 ̊C).
Over the course of the study period, total retention rates for the green roof
treatments ranged from 32 % to 64 %, with a mean rate of 52 %, being generally
higher for built-on-site roofs compared to readymade roofs and roofs with biochar
amendment (Table 2, Fig. 6). Biochar amendment increased total retention rates,
especially when the substrate temperature was low (< 10 ̊C) (Table 2). An
exception was that retention rates from built-on-site roof with biochar were
slightly lower compared with roofs without biochar in warm (≥ 10 ̊C)
temperatures (Table 2). Total retention rates were higher during warm
temperatures (Table 2, Fig. 7). Unexpectedly, total retention rates for the study
period from summer to winter increased as rain depth increased but this effect was
likely caused by the poor retention of light rain events during cold temperatures
(Table 2). The average retention rate of readymade roofs for < 2 mm rain events
decreased to negative values as measured runoff event depths exceeded rain event
24

depths repeatedly during winter. At warm temperatures, retention rates decreased
as rain depth increased as was expected (Table 2).
Table 2. Rain events and total retention rates calculated from cumulative depths from four green roof treatments (S = built-on-site, SB = built-on-site+biochar, R = readymade, RB = readymade+biochar) during the study period. Numbers in square brackets show the number of events. Mean retention rates for separate rain events are also presented for the three rain event depth classes (< 2, 2-9.8, ≥ 10 mm) and the two substrate temperature classes (< 10, ≥ 10 ̊C). TREATMENT S SB R RB Green roof mean
Total number (#) of events 95 95 95 95 # Replicates in group used 3 2 5 2 % of data set used 79 53 97 66 Retention % < 2mm [49] 26 51 -27 32 21
Retention % 2-9.8mm [34] 58 63 14 43 45
Retention % ≥10mm [12] 68 66 48 59 60
Retention % ≥ 10 ̊C, [39] 73 68 59 63 66
Retention % < 10 ̊C, [56] 45 54 -7 32 41
Retention % < 2mm ≥ 10 ̊C [23] 88 89 81 84 85
Retention % < 2mm < 10 ̊C [26] -13 28 -95 -1 -20
Retention % 2-9.8mm ≥ 10 ̊C [11] 90 89 78 79 84
Retention % 2-9.8 mm < 10 ̊C [23] 40 49 -22 22 22
Retention % ≥ 10 mm ≥ 10 ̊C [5] 65 59 50 56 57
Retention % ≥ 10 mm < 10 ̊C [7] 71 74 46 63 63
Retention % with biochar 58
Retention % no biochar 47
Retention % with biochar ≥ 10 ̊C 66
Retention % no biochar ≥ 10 C̊ 66
Retention % with biochar < 10 ̊C 51
Retention % no biochar < 10 C̊ 31
TOTAL RETENTION % 62 64 32 52 52
25

Figure 6. Cumulative rainfall and cumulative average runoff from green roofs during the study period.
Figure 7. Total retention rates (%) calculated from cumulative precipitation and runoff depths of built-on-site and readymade green roofs with and without biochar amendment for warm (≥ 10 ̊C) and cold (< 10 ̊C) substrate temperatures.
When comparing separate rain events, built-on-site roofs had significantly higher
mean retention rates (Wilcoxon Z = -7.477, p < 0.001) compared with readymade
roofs (Table 3). Biochar amendment increased retention of both built-on-site
(Wilcoxon Z = -2.830, p = 0.005) and readymade roofs (Wilcoxon Z = -6.205, p <
050
100150200250300350400450500
10.7. 19.8. 8.10. 5.11. 21.12.
Rai
nfal
l / R
unof
f (m
m)
Rainfall
Readymade32% retention
Readymade +biochar 52%retentionBuilt on site62% retention
Built on site +biochar 64%retention
26

0.001) (Table 3). After September, nine events included continuous runoff, while
precipitation had several pauses. When these rain events were combined, the
number of events decreased to 55 and event-based retention rates increased (Table
3). The last 30 events after mid-November were categorized as freezing, freezing-
melting or melting events. When this last period was combined as one freezing-
melting event, the number of separate events decreased to 35 and calculated
retention rates for the remaining events increased even more and only readymade
roofs had negative retention rates (runoff exceeding precipitation) (Table 3).
Table 3. Mean retention rates (%) of the green roofs per rain event, calculated for individual and combined rain events. Retention rate (%)
Built-on-site Built-on-site +biochar
Readymade Readymade +biochar
Individual rain events (n = 95) Mean rate 46 59 0 43 Median 71 74 33 53 Range -310 - 100 -171 - 100 -562 - 100 -355 - 100 Combined rain events due to continuous runoff (n = 55) Mean rate 74 77 50 65 Median 90 96 67 75 Range -42 - 100 13 - 100 -162 - 100 -40 - 100 Combined rain events with the last freezing-melting period as one event (n = 35) Mean rate 90 92 84 87 Median 98 98 98 97 Range 40 -100 43 - 100 -12 - 100 38 -100
3.3 Rain event hydrograph of a heavy rain event in August 2013
The heaviest storm event during the research period occurred in mid-August with
98.6 mm precipitation, which lasted over 45 hours, while runoff lasted over 59
hours. The highest runoff peak 7.7 mm h-1 was observed from the readymade
treatment 20 min after the 11.7 mm h-1 rain peak. Peak flow attenuation was thus
34 % for this roof. The antecedent dry weather period was 34 h and the mean
delay time from the beginning of rainfall to that of slight runoff was 100 min, but
proper runoff started only six hours after the rain had started. Mean retention was
44 %, being lowest in the readymade treatment (38 %) and highest in the built-on-
27

site treatment without biochar (52 %). Biochar amended roofs were close to
average with 43 % retention (RB) and 44 % retention (SB) (Fig. 8). Substrate
moisture content rose from 13.3 % to 23.1 % during the rain event (Fig. 9) in 42
hours after the rain event started and 20 min after the rain peak.
Figure 8. Runoff from green roof treatments during the heavy rain event in August 2013. The green roof mean retention rate is also shown.
Figure 9. Runoff in relation to substrate moisture content of readymade green roofs during the heavy rain event on 13-15.8.2013.
0
0,5
1
1,5
2
2,5
3
3,5
4
4,5
13.8. 14.8. 15.8.
Rai
n/ru
noff
(mm
)
Rainfall
Readymade
Readymade+biocharBuilt on site
Built on site+biochar
44 % mean retention
0
0,5
1
1,5
2
2,5
13% 15% 17% 19% 21% 23%
Run
off (
mm
)
Substrate moisture
28

3.4 Factors affecting the water retention capacity of green roofs
3.4.1 The effects of rain depth on water retention of green roofs
No significant differences between retention rates per event were detected when
compared between three different rain depth categories; light < 2 mm (mean =
0.73, SD = 0.54, n = 47), medium 2-9.8 mm (mean = 4.57, SD = 1.92, n = 34) and
heavy ≥ 10 mm (mean = 24.68, SD = 25.04, n = 12) for built-on-site or readymade
roofs (Appendix A). When mild events (temperature > 0 oC excluding the melting
events) were studied separately, retention was highest during light rain, although
differences remained statistically insignificant for built-on-site roofs (Appendix
A) and marginally significant for readymade roofs (Kruskal Wallis test p = 0.062,
Fig. 10). However, during the winter period when all the freezing, freezing-
melting and melting events were combined, differences between rain depth
categories were significant for both built-on-site and readymade roofs (Kruskal
Wallis test p < 0.05) with an unexpected result: observed mean retention was
significantly lower for light rain compared to medium or heavy rain events (Mann
Whitney U-test p < 0.05, Fig. 11).
When retention rates were compared within each rain depth category, significant
differences were detected between green roof treatments during the whole study
period (Friedman´s test p < 0.05, Appendix B). Retention rates were generally
highest for built-on-site roofs compared with readymade roofs and for roofs with
biochar amendment during mild events (Fig. 12) and also during combined
freezing, freezing-melting and melting events (Fig. 13).
29

Figure 10. Mean retention rates (± standard error) of built-on-site and readymade green roofs at light (< 2 mm), medium (2-9.8 mm) and heavy (≥ 10 mm) rain during mild summer and autumn events.
Figure 11. Mean retention rates (± standard error) of built-on-site and readymade green roofs at light (< 2 mm), medium (2-9.8 mm) and heavy (≥ 10 mm) rain, when freezing, freezing-melting and melting events were combined.
30

Figure 12. Mean retention rates (± standard error) for green roof treatments in light (< 2 mm), medium (2-9.8 mm) and heavy (≥ 10 mm) rain depth categories for mild summer and autumn events.
Figure 13. Mean retention rates (± standard error) for green roof treatments in light (< 2 mm), medium (2-9.8 mm) and heavy (≥ 10 mm) rain depth categories, when freezing, freezing-melting and melting events were combined.
31

3.4.2 The effects of rain intensity on water retention of green roofs
The range of calculated mean intensity values for separate rain events was 0.01-
4.71 mm h-1 (mean = 0.66). Peak 20-min intensity values ranged from 0.12 mm h-
1 to 26.46 mm h-1 (mean = 2.87). No significant differences were detected
between low and high rain intensity categories during mild events (Appendix C).
However, in contrast to expectations, retention rates were significantly higher at
high than low intensity rain events, when freezing, freezing-melting and melting
events were included in the analysis or when those events were analyzed
separately (Mann Whitney U-test p < 0.05, Fig. 14).
Figure 14. Mean retention rates (± standard error) of green roofs between low (< 0.60 mm h-1) and high (≥ 0.60 mm h-1) rain intensity categories for combined freezing, freezing-melting and melting events. Similar, unexpected results were obtained when retention rates were compared
between low and high rain peak intensities; retention increased at higher peak
intensity, when combined freezing, freezing-melting and melting events were
studied (Mann Whitney U-test p < 0.05, Fig. 15). However, during mild events,
retention rates were significantly lower as rain peak intensity increased, as was
expected (Mann Whitney U-test < 0.05, Fig. 16).
32

Figure 15. Mean retention rates (± standard error) of green roofs between low (< 2 mm h-1) and high (≥ 2 mm h-1) rain peak intensity categories for combined freezing, freezing-melting and melting events.
Figure 16. Mean retention rates (± standard error) of green roofs between low (< 2 mm h-1) and high (≥ 2 mm h-1) rain peak intensity categories for mild summer and autumn events.
33

3.4.3 The effects of temperature on water retention of green roofs
Green roof mean retention rates (%) differed significantly between mild, freezing,
freezing-melting and melting events (Kruskal Wallis H = 40.072, p < 0.001, Fig.
17). Retention rates were highest for mild events and differences were statistically
significant compared with other event categories (Mann Whitney U-test p < 0.05).
Retention was significantly higher for freezing than for melting events (Mann
Whitney U-test p = 0.021) and also higher for freezing than for freezing-melting
events but not statistically significantly so (Appendix D). During freezing-melting
and melting events, retention rates decreased and runoff exceeded precipitation
repeatedly, and differences between these event categories were insignificant
(Appendix D).
Figure 17. Mean retention rates (± standard error) of green roofs between mild, freezing, freezing-melting and melting event categories.
Mean retention rates of the readymade and built-on-site roofs, including the
biochar amended treatments, were significantly lower when substrate temperature
was cold < 10 ̊C (mean 4.8 ̊C + 2.2 (SE)) than when it was warm ≥ 10 ̊C (mean
15.8 ̊C + 2.8 (SE)), (Mann Whitney U-test p < 0.01, Fig. 18, Appendix E).
34

Figure 18. Mean retention rates (± standard error) of built-on-site and readymade green roofs between high (≥ 10 ̊C) and low (< 10 ̊C) substrate temperature categories.
3.4.4 Effects of the antecedent dry weather period on water retention of green
roofs
The range of antecedent dry weather periods (ADWP) was 6-306 h (mean = 41.9).
Mean retention rates of green roofs were lower with shorter (6-24 h) compared
with longer (> 24 h) ADWP, although differences between groups were not
statistically significant (Appendix F). When mild temperature events were studied
separately, high retention values were detected for both ADWP groups but with
insignificant differences (Appendix F, Fig. 19). When winter events, i.e. freezing,
freezing-melting and melting events were combined and studied separately,
ADWP had a moderate effect on retention rates, being significantly lower for all
treatments with shorter ADWP (Mann Whitney U-test p < 0.05, Fig. 20).
35

Figure 19. Mean retention rates (± standard error) for green roof treatments between short (6–24 h) and longer (> 24 h) antecedent dry weather periods (ADWP) for mild summer and autumn events.
Figure 20. Mean retention rates (± standard error) for green roof treatments between short (6–24 h) and longer (> 24 h) antecedent dry weather periods (ADWP) for combined freezing, freezing-melting and melting events.
36

3.4.5 The effects of substrate moisture on water retention
Substrate moisture content (%) at a depth of 5 cm in readymade green roofs
during mild events increased generally from the beginning of a rain event (mean =
17.2, range 7.4–20.9, n = 52) and when runoff started (mean = 17.3, range 7.4–
20.9, n = 52) to runoff event peak values (mean = 18.9, range 8.9–24.6, n = 52)
and decreased towards runoff end (mean = 18.1, range 8.9–21.0, n = 52) (Fig 21).
Event mean values ranged between 8 % and 21.5 % (mean = 18.1, n = 52).
Substrate moisture content showed variation and increased rapidly during heavy
rain events (Fig. 22).
Figure 21. Rain, runoff and moisture variation at the depth of 5 cm in the substrate of readymade green roofs during rain event in September in 20 min resolution.
Figure 22. Moisture variation at the depth of 5 cm in the substrate of readymade green roofs from August to September 2013 in 20 min resolution. Three sharp rises in moisture are due to heavy intensity rain events in 9.8, 13.8. and 1.9.
18%18%19%19%20%20%21%21%22%22%
0
0,5
1
1,5
2
2,5
3
20.9.2013 21.9.2013 21.9.2013
Sub
stra
te m
oist
ure
Rai
n (m
m)
Rain
Runoff
Substratemoisture
0%
5%
10%
15%
20%
25%
30%
31.7.2013 20.8.2013 9.9.2013 29.9.2013
Subs
trate
moi
stur
e
37

The effect of moisture content on the retention rate of readymade roofs was
moderate to large during mild events. Retention rates decreased significantly with
increasing moisture content (Table 4).
Table 4. Parameters of readymade green roof retention rates and statistical comparisons between low and high substrate moisture content (%) at the beginning of the rain event, at the event peak or the event mean, for mild events. Green roof retention rates (%)
Substrate moisture content at rain start < 17 / ≥ 17
Substrate moisture content event mean < 17.8 / ≥ 17.8
Substrate moisture content event peak < 18.6 / ≥ 18.6
Mild events Mean 95 / 50
83 / 58
98 / 45 SD 14 / 48
42 / 45
2 / 47 n 18 / 35 16 / 37 20 / 33
Mann-Whitney U 120.5 167.5 74 Z 3.653 -2.490 -4.698 p (two-tailed) < 0.001 0.012 < 0.001 Effect size (r) 0.50 0.34 0.65
r: small effect ≥ 0.1, medium effect ≥ 0.3, large effect ≥ 0.5 (Cohen 1988)
3.5 Rain and runoff duration
The range for rain duration was from 20 min (0.33 h) to 45 h 40 min (45.67 h) and
runoff lasted from 20 min (0.33 h) to 87 h 34 min (87.56 h). Mean rain duration
was 58 % shorter than the mean duration of runoff from green roofs, since runoff
often continued some time after precipitation had ended. Rain duration had only
minor effects on retention rates (%) when events with duration < 10 h (mean = 35,
SD = 83, n = 59) and ≥ 10 h (mean = 40, SD = 60, n = 36) were compared (Mann
Whitney U = 1054.5, p = 0.954, r = 0.06).
Event depth (mm) was slightly smaller during winter events (mean = 4.36, SD =
7.17) than during mild summer and autumn events (mean = 5.72, SD = 14.17)
although the mean rain duration (h) for winter events was longer, (mean = 9.55,
SD = 9.09) compared to mild events (mean = 8.40, SD = 9.50).
38

3.5.1 Runoff duration comparison between green roof treatments
Runoff duration was longer from readymade roofs compared to that from built-on-
site roofs during all events (paired-samples T-test p < 0.01, Fig. 23) and mild
events (paired-samples T-test p < 0.01) but not for combined freezing, freezing-
melting and melting events (Appendix G). Biochar amendment had a negligible
effect on runoff duration with insignificant differences between treatments
(Appendix G) except during mild events, when runoff duration was slightly
shorter with biochar amended roofs with marginally insignificant differences
(paired-samples T-test p = 0.069).
Figure 23. Runoff duration mean values (± standard error) for built-on-site and readymade green roofs.
3.5.2 The effects of rain depth and duration on runoff duration
Runoff duration increased slightly with rainfall depth and also with rain duration
although the relationship was only marginally significant (Table 5).
39

Table 5. Parameters of green roof runoff duration and statistical comparisons between light (< 2 mm), medium (2-9.8 mm) and heavy (≥ 10 mm) rain depth categories and between short (< 10 h) and longer (≥ 10 h) rain duration classes. Runoff Rain depth (mm) Rain duration (h) Rain depth x duration (h): < 2 / 2-9.8 / ≥ 10 < 10 / ≥ 10 Rain duration Mean 16.43 / 25.26 / 28.14 17.20 / 27.74 SD 18.06 / 18.80 / 15.53 17.63 / 18.30 n 47 / 34 / 12 58 / 35 Two-way ANOVA F 1.68 3.444 0.915 d.f. 87 87 87 p (two-tailed) 0.192 0.067 0.404 Effect size (η2) 0.37 0.38 0.021
η2: small effect ≥ 0.1, medium effect ≥ 0.6, large effect ≥ 0.14 (Cohen 1988)
3.5.3 The effects of substrate moisture content on runoff duration
The duration of runoff from readymade green roofs was significantly longer
when event mean values or event peak values of the substrate moisture content
were higher than 17.8 and 18.6 %, respectively, during mild events (Table 6).
Table 6. Parameters of readymade green roof runoff duration and statistical comparisons between low and high substrate moisture content (%) for mild events. Runoff duration (h):
Substrate moisture content event mean (%) < 17.8 / ≥ 17.8
Substrate moisture content event peak (%) < 18.6 / ≥ 18.6
Mild events Mean 8.23 / 17.05 4.76 / 19.74 SD 9.64 / 15.02 6.50 / 14.46 n 15 / 36 18 / 33 t-test -2.095 -5.083 d.f. 49 47.767 p (two-tailed) 0.041 < 0.001 95 % CI -17.28169, -0.36060 -20.90300, -9.05256 Effect size (d) 0.60 1.45
d: small effect ≥ 0.2, medium effect ≥ 0.5, large effect ≥ 0.8 (Cohen 1988).
40

3.6 Delay and attenuation
3.6.1 The effects of temperature on peak flow attenuation and delay
The average delay (h) in runoff start did not differ between the different green
roof treatments (Appendix H), but peak flow attenuation rates differed
significantly between mild, freezing, freezing-melting and melting events
(Kruskal Wallis H = 21.371, p < 0.001). Attenuation was largest in mild events
and lowest in melting events, while the delay from peak rainfall to that in runoff
did not vary between events (Table 7).
Table 7. Parameters of green roof delay times (h), rain and runoff peak intensity rates (mm h-1) and peak flow attenuation rates (%) for mild and freezing, freezing-melting and melting events separately. Negative delay times indicate an onset of runoff before the start of the precipitation event.
Delay from rain peak to runoff peak (h)
Rain peak intensity (mm h-1)
Runoff peak intensity (mm h-1)
Peak flow attenuation (%)
Mild events (n = 50) Mean 1.23 3.64 0.75 79 Range -0.33–17.33 0.12–26.46 0.01–7.70 10–99 Freezing events (n = 8)
Mean -0.68 4.65 1.36 41 Range -8.40–1.67 0.60–18.60 0.11–4.69 -62–99 Freezing-melting events (n = 10)
Mean 3.50 1.79 0.58 56 Range -0.33–28 0.33–9.12 0.01–1.78 -30–98 Melting events (n = 24) Mean 3.06 1.44 0.75 38 Range 0–37.67 0.60–4.80 0.03–19.95 -62–95
3.6.2 Effects of the antecedent dry weather period on delay
The time from the beginning of a rain event to the onset of runoff decreased with
decreasing ADWP, yet the difference was not statistically significant (Appendix
I). When green roof treatments were analysed separately and all events were
included, delay time was shorter with shorter ADWP, although differences were
marginally significant only in treatments without biochar (Mann Whitney U-test p
41
< 0.1). When only rain events of the cold season were analysed, delay times were
significantly shorter with shorter ADWP but only in treatments without biochar
(Mann Whitney U-test p < 0.05). During mild events, slightly shorter delay times
were observed with shorter ADWP although differences were insignificant
(Appendix I).
3.6.3 Effects of the preceding rain sums and substrate moisture content on the delay in runoff The range of the preceding 7 d rain sum was 0-100 mm, mean = 17, median = 13.
Mean delay times for green roofs from the start of a rain event to the onset of
runoff decreased with the increasing preceding rain sum but the difference was
marginally significant (Mann Whitney U-test p = 0.061). When green roof
treatments were studied separately, delay was significantly shorter with higher
preceding rain sum during mild events in other treatments, except the readymade
roofs with biochar (Mann Whitney U-test p < 0.05). However, during rain events
of the cold season, the opposite was detected: mean delay increased slightly as the
rain sum increased, but differences were insignificant (Appendix J).
Delay from the start of a rain event to the start of runoff decreased significantly
(Mann Whitney U = 125, Z = -3.300, p = 0.001, r = 0.46) when substrate moisture
content at the start of the rain event was higher than the average 17 % in mild
events.
4. Discussion
In contrast to my first hypothesis, I showed that green roofs with dense vegetation
did not have better water retention capacity than those with sparse vegetation.
Being in accordance with my second hypothesis, retention increased and runoff
duration decreased with decreasing rain depth and duration and decreasing
substrate moisture content, although only during the warm season. In contrast to
my second hypothesis, retention was increased with increasing rain intensity
42
during wintertime. According to my second hypothesis, retention rates were
generally lower during cold temperatures compared to warm temperatures. Delay
for runoff as well as peak flow attenuation were detected in this study and
supported my second hypothesis for timing and attenuation. According to the third
hypothesis predicting better retention capacity with biochar, retention rates of
green roofs were generally increased with the amendment of biochar, especially
during cold temperatures.
4.1 Retention
Readymade Sedum-herb grass mats with high vegetation cover were not superior
in retaining precipitation than the selfmade plantings in all rain event sizes and
temperature categories, also in summertime. Thus, substrate has an important role
in water retention as stated by Graceson et al. (2013). They noted that Sedum
roofs with a substrate made from coarse crushed tile retained less water than other
treatments in their study; pelletised power station fly ash or crushed brick. Their
results showed that substrate pore space distribution determined water holding
capacity and rainwater retention. As built-on-site roof retained more water in my
study, even without vegetation cover and a high proportion of crushed brick, more
research is needed to determine the best available construction for local green
roofs. Another option for porous water retaining material, instead of crushed
brick, could be second grade products like crushed concrete.
My results supported the expectations for green roof water retaining capability in
that green roofs retained 52% of the cumulative runoff. This rate falls within the
range of those found in previous studies (Table 8). However, cumulative retention
rate can be misleading. According to Stovin et al. (2012), the capability to retain a
large rainfall event can be considerably lower than retaining a small event.
Furthermore, large events are of concern due to peak loads to the surrounding
environment.
43

Table 8. Rainfall retained by green roofs comparing several studies with variable monitoring periods. Rainfall retained in green roofs, average during study period (%)
Length of study period
Climatic conditions
Reference
52 6 months July-January cool semi-continental Lahti, Southern Finland
This study
49 4 rainfall events
Season not mentioned, temperate, Michigan Northern US
Monterusso et al. (2004)*
48.6 17 months July- December, temperate, Malmö, Southern Sweden
Bengtsson et al. (2005)
60.6 (vegetated) 50.4 (non-vegetated)
14 months August- October, temperate, Michigan, Northern US. Only events above 0 ̊C
VanWoert et al. (2005b)
45 2 months
October-November, humid continental, Pennsylvania, Northeastern US
DeNardo et al. (2005)*
63 (roof 1) 55 (roof 2)
18 months 15 months
April/July-September, humid subtropical, North Carolina, Southern US
Moran et al. (2005)*
78 13 months November-November, humid subtropical, Georgia, Southern US
Carter & Rasmussen (2006)
34 11 rainfall events
Wet spring, temperate, Sheffield, Northern England
Stovin (2010)
50.2 29 months January-May, temperate, Sheffield, Northern England
Stovin et al.(2012)
44 6 months December-June,temperate, Shropshire, Western England
Graceson et al. (2013)
*Data from the review by Berndtsson (2010, p. 354).
When retention rates are studied on an event-by-event basis, results are
contradictory to a certain extent when compared to those found in some other
studies. 1.6 mm was the median amount of precipitation per rain event indicating
the large amount of light events (< 2 mm) in this study. According to previous
44

research, light storms are generally retained better than heavy storms (e.g., Carter
& Rasmussen 2006, Carter & Jackson 2007, Teemusk & Mander 2007). However,
in contrast to my second hypothesis, when all events were included in this study,
retention rates were highest with heavy storms (≥ 10 mm, 60 %) decreasing to
medium storms (2-9.8 mm, 45 %) and light storms (< 2 mm, 21 %). This can be
explained by freezing-melting events: when events that were categorized as cold
(< 10 ̊C) were excluded, retention rates increased to 85 % for light rain events
and 84 % for medium rain events, and decreased to 57 % for heavy rain events.
These results are in accordance with previous studies that are often conducted at
temperatures above freezing. Therefore, studies made in temperate regions are
not to be applied in northern climates as such. Voyde et al. (2010) reported a mean
of 78 % retention and Stovin et al. (2012) 61 % retention for storm events > 2
mm. Carson et al. (2013) notes that weather conditions affect results and mean
retention rates vary according to rain event sizes. If light rain events are prevalent,
better retention rates can be expected.
Retention rates were significantly lower for higher rain peak intensities during
mild events. This is in accordance with my second hypothesis as well as with
previous research (Mentens et al. 2006, Bengtsson et al. 2005, Villarreal &
Bengtsson 2005), even though Stovin et al. (2012) noted that retention and both
peak and mean rain intensities were not significantly related. Furthermore,
retention rates in my study were higher for low-intensity rain events during the
whole study period, but not statistically significantly so. Conversely, during
combined freezing, freezing-melting and melting events, increasing mean
intensity or peak intensity of a rain event seemed to increase retention, which was
contrary to my second hypothesis. Freezing and melting phenomena, obviously
having stored moisture in the substrate, seem to alter the outcomes and thus event-
based patterns for retention rates and rain intensity cannot be detected in
temperatures below zero. It has to be noted that many of the freezing-melting and
melting events could have been combined due to continuous, yet decreasing
runoff at the event break; for instance, the last 30 events of the study period, from
45

12.11.2013 to 10.1.2014 could have been combined as one event as there was
water stored as ice in the substrate (Table 9).
Table 9. Retention rates during rain events with continuous runoff (combined) for green roof treatments during the study period.
Green roof retention rate (%)
Built-on-site
Built-on-site +biochar
Ready-made
Ready-made +biochar
12.11.-17.11. Freezing-melting period, 2
events 28 30 -38 29 17.11.-28.11. Freezing-melting period, 4 events 34 38 -28 18 28.11.-20.12.
Freezing-melting period, 7 events 83 90 69 81 20.12.-30.12. Melting period, 10 events -42 13 -162 -40 30.12.-10.1. Freezing-melting period, 7 events -6 35 -108 -26 30 last events together: 40 76 -12 39
Total retention rates calculated from cumulative depths were generally lower for
cold temperatures (41 %) compared with warm temperatures (66 %) and
especially for melting events, supporting my second hypothesis. Freezing events
produced no runoff in some cases, while melting events often had negative
retention values, meaning more runoff than precipitation. Such negative values
can be observed when accumulated runoff drain from the roof as noted by Stovin
(2010), and this phenomenon was typical during melting events in my study. In a
study by Graceson et al. (2013) in the UK, runoff exceeded precipitation in
January and February. Freezing temperatures were observed in January and this
influenced the hydrological function of the roof in the following month as well.
Furthermore, the substrate was saturated and determined evapotranspiration rates
close to zero during winter months (Graceson et al. 2013). Overall, freezing-
melting periods showed no clear pattern in my study as hydrological interactions
are complex in winter. Snow, frost and ice alter infiltration and frozen substrates
may prevent rain water from entering the substrate causing initial runoff.
46

Furthermore, the proportion of available pores for water storage in the substrate
may be limited.
Retention rates were higher with longer antecedent dry weather periods (ADWP)
but significantly so only during freezing, freezing-melting and melting events.
Thus, results from winter events are in accordance with my second hypothesis,
expecting higher retention rates following longer antedecent dry weather periods.
They are also in accordance with previous studies conducted during warm
temperatures (Voyde et al. 2010, Stovin et al. 2012, Speak et al. 2013). However,
differences during the warm period were smaller than expected based on previous
research. Besides ADWP, stored moisture from previous rain events as well as
evapotranspiration rates affect retention rates and thus ADWP cannot be
considered as a reliable predictor of the retention capacity of a green roof (Stovin
et al. 2012). Carson et al. (2013) showed that inter-seasonal variation between
retention rates was greater with medium-sized storms than light storms and
explain this phenomenon as the combined effect of evapotranspiration and
ADWP.
Obviously, moisture content of the substrate has a major impact on water
retention, as has been found also by Voyde et al. (2010) and Bengtsson (2005). In
my study, when mild events were studied separately, low moisture content of the
substrate at the beginning of a rain event resulted in better retention and also
longer delay time, which is in accordance with my second hypothesis. There were
no clear threshold values for moisture content and runoff initiation moisture
content, which varied at the beginning of runoff from 7.4 % to 20.9 % during
warm season.
Biochar generally increased retention rates of readymade green roofs at all
temperatures, in accordance with my third hypothesis. At cold temperatures,
biochar also improved the retention capability of built-on-site roofs. Beck et al.
(2011) showed that biochar amendment resulted in a 4.4 % increase in water
retention of nearly saturated substrates. In my study, when all events were
47

included, biochar amendment increased retention rates from 47 to 58 % when
calculated from cumulative depths. During warm temperatures, results were not as
hypothesised, as biochar amendment did not increase the retention rate during
medium and heavy rain events, although differences between retention rates were
only 1 % for medium rain events for both built-on-site and readymade roofs
compared with biochar amended treatments. Runoff volumes from roofs with
biochar amendment were higher during all heavy rain events during warm
temperatures. One obvious explanation could be differences in novel substrate
construction. During the first weeks of this study in July-September, when the
temperature was still warm, substrate layers had not yet settled properly, probably
resulting in excess runoff. Even though anomalies were excluded from the dataset
during the first weeks, it can be that substrate structure was more stable towards
the winter months. During the warm season in 2014 biochar has improved the
water retention capacity of the experimental green roofs (K. Kuoppamäki, pers.
comm.), supporting the assumption that stabilisation of the substrate is an
important factor that affects the impacts of biochar. However, differences between
retention rates were greater during the cold period, especially with readymade
roofs; roofs with biochar having 32 % retention but roofs without biochar
amendment resulting in a negative retention value of -7 %.
4.2. Runoff duration
Runoff from readymade green roofs lasted significantly longer than from built-on-
site green roofs, which is contrary to what was expected in my first hypothesis
and to previous research for high vegetation cover decreasing runoff duration
(Teemusk & Mander 2007). According to my second hypothesis, runoff duration
increased as rain depth and duration increased, although insignificantly. This is in
accordance with Teemusk & Mander (2007) who noted rapid runoff after heavy
rain events. Furthermore, runoff duration increased as substrate moisture content
increased. No other factors affecting runoff duration were detected in this study,
including the third hypothesis of biochar amendment. However, some potential
factors such as the antecedent dry weather period or the preceding rain sum were
not studied separately. Pairwise comparisons for runoff duration at different
48

temperatures were not studied as rain events were not equal across temperature
groups. Nevertheless, mean runoff lasted longer, around 30 h in winter than in
summer and autumn, when mean runoff duration was less than 15 h. This
difference is interesting since great differences between rain depth and duration
during different periods were not observed. However, Teemusk & Mander (2007)
noted that winter runoff was prolonged due to melting of the snow cover and
melting of the water in frozen media.
Thus, runoff duration is affected by various factors, including precipitation
characteristics, substrate moisture content, temperature, and possibly also the
preceding weather.
4.3 Delay and peak flow attenuation
Delays for both the start of a rain event to the start of runoff and from rain peak to
runoff peak as well as peak flow attenuation were detected in this study and
supported my the second hypothesis for timing and attenuation. However, they
were underestimated due to precipitation entering the gutters and rain gauges also
directly, as rain gauges were not entirely covered. Furthermore, the rain gauge
time resolution of 20 min enabled only rough estimations. Delay times from the
start of a rain event to the start of runoff for all green roofs ranged from 0 to 35 h,
mean = 1 h 6 min and median = 20 min. Voyde et al. (2010) showed a mean start-
to-start delay time of more than 1 h and Stovin et al. (2012) of more than 2 h,
whereas Speak et al. (2013) reported a mean value of only 18 min. The range of
delay times from rain peak to runoff peak in this study was -8 h 24 min to 37 h 40
min, mean = 1 h 47 min, median = 20 min. Values are slightly greater compared
with previous studies, as reported delay times range from 1 min to several hours
(Berndtsson 2010). Voyde et al. (2010) reported a mean delay time value, from
rain peak to runoff peak, of 10 min. Results by Stovin et al. (2012) ranged from
negative values, -49 min to several hours. However, they noticed that the
determination of these lag times was problematic due to irregular patterns for
rainfall.
49

Speak et al. (2013) reported that only roofs with > 80 % vegetation coverage had
an effect on delay, which contradicts my study and my first hypothesis, as no
significant differences were detected between prefabricated roofs and roofs with
only seedlings and eight plants.
Supporting my second hypothesis, delay times from the start of a rain event to the
start of runoff were longer with longer ADWP, but significantly only for
treatments without biochar amendment and only for freezing, freezing-melting
and melting events. Similar results were obtained when the effect of ADWP on
retention rates was investigated. To compare, delay times from the start of a rain
event to the start of runoff were longer with a lower 7 d preceding rain sum but
significant differences were observed only for mild weather events. During
winter, results were the opposite; a higher preceding rain sum increased delay
times but only marginally. It seems that the effect of the preceding rain sum and
the antecedent dry weather period varies with season. However, it was observed
that high moisture content at the start of a rain event, shortened the start of runoff
significantly, supporting my second hypothesis. This effect was detected only
during summer and autumn; i.e, when freezing or melting events were not
included, as the sensors measuring moisture content of the substrate do not work
at temperatures below 0 oC. As results rejecting my second hypothesis were found
only for winter events with complex hydrological interactions, no further
conclusions can be made without further research. The effect of rain depth on
delay, i.e. depth between the start of a rain event to the start of runoff was not
determined in my study.
Mean peak flow attenuation for rain events in this study was 64 %, in accordance
with my second hypothesis and previous research. Stovin et al. (2012) reported 60
% mean peak flow reduction whereas Bliss et al. (2009) reported peak flow
attenuation rates varying from -5 to 71 %, mean = 30 % and Voyde et al. (2010)
reported 92 % mean flow reduction rates. Freezing temperatures affected
attenuation in this study. During winter, peak runoff rates exceeded rain peak nine
times, resulting in negative attenuation rates: once during a freezing event, once
50
during a freezing-melting event and seven times during melting events. During
mild summer and autumn events, the lowest attenuation rate was 10 %
(4.11.2013). Interestingly, mean substrate moisture content for this event was the
highest measured during the study period, 21.5 %. Villarreal (2007) studied peak
flow attenuation of a Sedum green roof with artificial rain events in Sweden.
Lowest attenuation volumes were recorded for experiments with constant rain
intensity, of which 20–29 % of the rain volume was detained. With variable rain
intensity, attenuation increased up to 34–52 %. They argued that under dry
conditions, precipitation is retained and attenuated, while under wet conditions
precipitation is only attenuated. It is possible that variation in rain intensity has an
effect on retention, but this was not studied here.
It is possible that the small roof area in this study has an effect on attenuation rates
(cf. Stovin et al. 2012), and thus attenuation could be even greater with larger
green roofs, as it takes more time for the water to flow through the substrate
allowing more time for evapotranspiration.
4.4 Green roofs as part of a combined ecological stormwater treatment method
Mentens et al. (2006) showed that runoff from individual buildings could be
reduced by 54 % and regional runoff by 2.7 % if 10 % of the rooftops were
greened. Results from this study are similar, as green roofs may retain 52 % of the
rainfall from individual roofs. As roofs could cover 50 % of city areas (Villarreal
& Bengtsson 2005, Stovin et al. 2012), a 10 % green roof coverage could reduce
regional runoff by 2.5 %. Including the other hydrological benefits that green
roofs provide, such as peak flow attenuation, which was more than 60 % in this
study, modellers, hydrologists and city planners could utilize the results on
stormwater management planning at both smaller and larger scales. The benefits
of green roofs can be expected to be highest in densely built urban centres with
large proportions of rooftops and other impervious surfaces, where flooding
following intensive precipitation events are most probable.
51

Combined ecological management techniques are often needed when runoff rates,
particle loads and contaminant loads are high, as often is the case in urban
environments. Green roofs could function as a pretreatment facility as it filtrates
atmospheric loads and controls the stormwater load to receiving treatment systems
and thus help in flood control. According to Clar et al. (2004a), suitable post
treatment methods include conveying bioswales and receiving pond. Furthermore,
the possible reuse of runoff water on-site, such as for irrigation purposes, could be
considered.
Ecological stormwater treatment systems need to be taken into account already at
the urban planning phase in the future. Available space defines if stormwater can
be treated locally in urban areas. Methods have to be time and place oriented and
site specific. Results are not comparable between different regions but general
guidelines are applicable with local adjustments such as the use of local
vegetation and the calculation of possible frost levels on-site. A lack of space is
often the major factor determining applicable stormwater treatment methods in
high density urban areas, and therefore the function of space could be redesigned.
Below- and above-ground solutions become valuable when there is no room at the
surface level. Roofs cover a remarkable area of city surfaces and thus replacing
these impervious surfaces with green roofs would help in stormwater retention.
Possible future research topics include the functioning of green roofs during
different seasons, especially during freezing and melting periods. Future studies
should also concentrate on hydrological processes within a rain event in cold
climates. The list of factors that have an effect on runoff dynamics and runoff
retention capabilities is long: roof slope, shadiness, soil characteristics, roof
vegetation, roof age, season, weather and rainfall characteristics, and length of
antecedent dry period, rain event duration and intensity (Berndtsson 2010). My
focus was in direct relationships between rainfall and green roof runoff, following
studies by Voyde et al. (2010) and Stovin et al. (2012). Relating to the water
balance, rates for evapotranspiration, an essential process, were not determined in
this study. However, there are several approaches for this (Gregoire & Clausen
52

2011, Stovin et al. 2012) and determining the evapotranspiration rates of green
roofs in the Finnish climate would possibly help in developing hydrological
models for the role of green roofs in stormwater management. Modelling tools are
needed, even though approaches and results vary (Villarreal & Bengtsson 2005).
Conclusions of modelling methods have been made, for instance, of water balance
(Metselaar 2012), substrate characteristics (Yio et al. 2013) and stormwater
mitigation (Hilten et al. 2008). Further studies should aim to standardize the
methods for local conditions.
5. Acknowledgments
I would like to thank the Master’s Degree Programme in Multidisciplinary Studies
on Urban Environmental Issues (MURE, University of Helsinki) and my
supervisors PhD Kirsi Kuoppamäki and Doc. Johan Kotze for help and precious
comments. I also thank research technician Tuukka Ryynänen for valuable work
at Jokimaa research station. Veli-Matti Sorvala (Viikki campus, University of
Helsinki) provided advice regarding statistical analyses.
6. References Anderson, M., Lambrinos, J. & Schroll, E. 2010: The potential value of mosses
for stormwater management in urban environments. — Urban Ecosystems 13: 319-332.
Arnold, C. & Gibbons, C. 1996: Impervious surface coverage: the emergence of a
key environmental indicator. — Journal of the American Planning Association 62: 243-258.
Beck, D. A., Johnson, G. R. & Spolek, G. A. 2011: Amending greenroof soil with
biochar to affect runoff water quantity and quality. — Environmental Pollution 159: 2111-2118.
Bengtsson, L. 2005: Peak flows from thin sedum-moss roof. –Nordic Hydrology
36 (3): 269-280.
53

Bengtsson, L., Grahn, L. & Olsson, J. 2005: Hydrological function of a thin extensive green roof in southern Sweden. — Nordic Hydrology 36 (3): 259-268.
Berndtsson, J. C. 2010: Green roof performance towards management of runoff water quantity and quality: A review. — Ecological Engineering 36: 351-360. Berndtsson, J.C., Emilsson, T. & Bengtsson. L. 2006: The influence of extensive
vegetated roofs on runoff water quality. — Science of the Total Environment 355:48-63.
Bliss, D.J., Neufeld, R.D. & Ries, R.J. 2009: Storm water runoff mitigation using
a green roof. – Environmental Engineering Science 26 (2):407-417. Bäckström, M., Karlsson, S., Bäckman, L., Folkeson, L. & Lind, B. 2004:
Mobilisation of heavy metals by deicing salts in a roadside environment. — Water Research 38:720-732.
Carson, T.B., Marasco, D.E., Culligan, P.J. & McGillis, W.R. 2013: Hydrological
performance of extensive green roofs in New York City: observations and multi-year modelling of three full-scale systems. — Environmental Research Letters 8 (024036):1-13.
Carter, T. & Jackson, C.R. 2007: Vegetated roofs for stormwater management at
multiple spatial scales. — Landscape and Urban Planning 80: 84-94.
Carter T. & Rasmussen T. 2006: Hydrologic behavior of vegetated roofs. — Journal of the American Water Resources Association 42 (5): 1261-1274.
City of Helsinki 2013: Valtuutettu Anni Sinnemäen aloite viherkattojen
rakentamisesta [Councilmember Anni Sinnemäki´s bill for green roof strategy]. Document no HEL 2012-013805 <http://dev.hel.fi/paatokset/asia/hel-2012-013805/kvsto-2013-9/> (7.6.2014).
City of Lahti 2011: Lahden kaupungin hulevesiohjelma. [Stormwater program for
City of Lahti]. Lahden seudun ympäristöpalvelut, Lahti. 56 p. Clar M., Barfield B. & O'Connor T. 2004a: Stormwater best management 500
practice design guide, volume 1 general considerations. Technical Report EPA/600/R-04/121, National Risk Management Research Laboratory, U.S. Environmental Protection Agency, Cincinnati, Ohio. 179 p.
Clar, M., Barfield B. & O'Connor, T. 2004b: Stormwater best management 500
practice design guide, volume 2 vegetative biofilters. Technical Report EPA/600/R-04/121A, National Risk Management Research Laboratory, U.S. Environmental Protection Agency, Cincinnati, Ohio. 194 p.
54

Climateguide.fi 2014: Lyhytkestoisten sateiden rankkuus ja toistuvuusaika Suomessa. [Intensities and return periods for short-term rain events in Finland] <http://ilmasto-opas.fi/fi/ilmastonmuutos/videot-ja-visualisoinnit//artikkeli/
b4df9633-7e1f-4389-9dd0-a0539588f211/visualisoinnit.html#rankkasateiden -toistuvuus> (1.2.2014). Cohen, J. 1988: Statistical power analysis for the behavioral sciences. 2nd edition.
Lawrence Erlbaum, New Jersey. 567 p. Dietz, M. 2007: Low impact development practices: a review of current research
and recommendations for future directions. — Water, Air, & Soil Pollution 186: 351-363.
Dunnett, N., Nagase, A., Booth, R. & Grime, P. 2008: Influence of vegetation composition on runoff in two simulated green roof experiments. — Urban
Ecosystems 11: 385-398. Ellis, J. 2000: Infiltration systems: a sustainable source-control option for urban
stormwater quality management? — Water and Environment Journal 14: 27-34.
European Commission 2013: Green Infrastructure (GI) — Enhancing Europe’s
Natural Capital. <http://eur-lex.europa.eu/LexUriServ/LexUriServ.do?uri= COM:2013:0249:FIN:EN:PDF.> (7.6.2014). Finnish Meteorological Institute 2014a: Climate elements.
<http://en.ilmatieteenlaitos.fi/climate-elements>. (1.2.2014). Finnish Meteorological Institute 2014b: Normal period.
<http://en.ilmatieteenlaitos.fi/normal-period>. (1.2.2014).
Finnish Meteorological Institute 2014c: Rankkasadeasteikko [Heavy rain scale]. <http://ilmatieteenlaitos.fi/sade>. [In Finnish]. (1.2.2014).
Getter, K. & Rowe, B. 2006: The role of extensive green roofs in sustainable
development. — HortScience 41 (5): 1276-1285. Getter, K., Rowe, B. & Andresen, J. 2007: Quantifying the effect of slope on
extensive green roof stormwater retention. — Ecological engineering 31: 225-231.
Getter, K., Rowe, B., Robertson, G., Cregg, B. & Andresen, J., 2009: Carbon sequestration potential of extensive green roofs. — Environmental Science &
Technology 43:7564-7570. Graceson, A., Hare, M., Monaghan, J. & Hall, N.2013: The water retention
capabilities of growing media for green roofs. — Ecological Engineering 61: 328-334.
55

Gregoire, B.G. & Clausen, J.C. 2011: Effect of a modular extensive green roof on
stormwater runoff and water quality. — Ecological engineering 37: 963-969. Göbel, P., Dierke, C. & Coldewey, W.G. 2007: Storm water runoff concentration
matrix for urban areas. — Journal of contaminant hydrology 91: 26-42. Hilten R.N., Lawrence T.M. & Tollner E.W. 2008: Modeling stormwater runoff
from green roofs with HYDRUS-1D. — Journal of Hydrology 358: 288-293. Jokela, H. 2008: Maanteiden huleveden laatu. [Stormwater quality in highways].
Tiehallinnon sisäisiä julkaisuja 81/2008. [In Finnish]. Mentens, J., Raes, D. & Hermy, M. 2006: Green roofs as a tool for solving the
rainwater runoff problem in the urbanised 21st century. — Landscape and Urban Planning 77: 217-226.
Metselaar, K. 2012: Water retention and evapotranspiration of green roofs and
possible natural vegetation types. — Resources, Conservation and Recycling 64: 49-55.
Muthanna, T. 2007: Bioretention as a sustainable stormwater management option
in cold climates. PhD thesis. Norwegian University of Science and Technology, Faculty of Civil Engineering. 191 p.
Muthanna, T., Viklander, M., Blecken, G. & Thorolfsson, S. 2007: Snowmelt
pollutant removal in bioretention areas. — Water Research 41: 4061-4072. Nagase, A. & Dunnett, N. 2012: Amount of water runoff from different vegetation
types on extensive green roofs: Effects of plant species, diversity and plant structure. — Landscape and Urban Planning 104:356-363.
Oberts, G., Marsalek, J. & Viklander, M. 2000: Review of water quality impacts
of winter operation of urban drainage. — Water Quality Research Journal of Canada 35 (4): 781-808.
Obendorfer, E., Lundholm, J., Bass, B., Coffman, R., Doshi, H., Dunnett, N.,
Gaffin, S., Köhler, M., Liu, K. & Rowe, B. 2007: Green Roofs as Urban Ecosystems: Ecological Structures, Functions, and Services. — BioScience 57 (10): 823-833.
Parliament of Finland 2013: Hallituksen esitys eduskunnalle laeiksi vesihuoltolain
sekä maankäyttö- ja rakennuslain muuttamisesta. [The Government Proposal to Parliament for a New Act of Water Services and New Land Use and Building Act]. Document no HE 218/2013 vp.
Pataki, D.E., Carreiro, M.M., Cherrier, J., Grulke, N.E., Jennings, V., Pincetl, S.,
Pouyat, R.V., Whitlow, T.H. & Zipperer, W.C. 2011: Coupling
56

biogeochemical cycles in urban environments: ecosystem services, green solutions, and misconceptions. — Frontiers in Ecology and Environment 9: 27-36.
Roseen, R., Ballestero, T., Houle, J., Avellaneda, P., Briggs, J., Fowler, G. &
Wildey, R. 2009: Seasonal performance variations for storm-water management systems in cold climate conditions. — Journal of Environmental Engineering 135 (3): 128-137.
Semadeni-Davies, A. 2006: Winter performance of an urban stormwater pond in
southern Sweden. — Hydrological processes 20: 165-182. Schroll, E., Lambrinos, J., Righetti, T. & Sandrock, D. 2011: The role of
vegetation in regulating stormwater runoff from green roofs in awinter rainfall climate. — Ecological Engineering 37: 595-600.
Speak, A.F., Rothwell, J.J., Lindley, S.J. & Smith, C.L. 2013: Rainwater runoff
retention on an aged intensive green roof. — Science of the Total Environment 461-462: 28-38.
Stovin, V. 2010: The potential of green roofs to manage urban stormwater. —
Water and Environment Journal 24 (3): 192-199. Stovin, V., Vesuviano, G. & Kasmin, H. 2012: The hydrological performance of a
green rooftest bed under UK climatic conditions. — Journal of Hydrology 414-415: 148-161.
Teemusk, A. & Mander, Ü. 2007: Rainwater runoff quantity and quality
performance from a greenroof: the effects of short-term events. — Ecological Engineering 30: 271-277.
Valtonen, M., Sillanpää, N. & Setälä, H. 2012: Lysimetrikoe hulevesien
biosuodatuksesta kylmässä ilmastossa. [Lysimeter test on biofiltration in cold climates]. — In: Sänkiaho L. & Sillanpää N. (eds.), STORMWATER-hankkeen loppuraportti - Taajamien hulevesihaasteiden ratkaisut ja liiketoimintamahdollisuudet [STORMWATER project - Final report]. 19-24. Department of Civil and Environmental Engineering. [In Finnish].
VanWoert, N., Rowe, D., Andresen, J., Rugh, C. & Xiao, L. 2005a: Watering regime and green roof substrate design affect sedum plant growth. — HortScience 40 (3): 659-664.
VanWoert, N., Rowe, D., Andresen, J., Rugh, C., Fernandez, R. & Xiao, L.
2005b: Green Roof Stormwater Retention: Effects of Roof Surface, Slope, and Media Depth. – Journal of Environmental Quality 34:1036–1044.
Villarreal, E. 2007: Runoff detention effect of a sedum green roof. — Nordic
Hydrology 38 (1): 99-105.
57

Villarreal, E.L. & Bengtsson, L. 2005: Response of a sedum green-roof to
individual rain events. — Ecological Engineering 25: 1-7. Walsh, C., Roy A., Feminella, J., Cottingham, P., Groffman, P. & Morgan, II R.
2005: The urban stream syndrome: current knowledge and the search for a cure. — Journal of the North American Benthological Society 24 (3): 706-723.
Veg Tech 2014: Sedum-ört-grästak. [Sedum-herb-grass mat.]
<http://www.vegtech.se/grona-tak---gardar/naturtak/sedum-ort-grastak/> [in Swedish]. (1.5.2014.)
Voyde, E., Fassman, E.& Simcock, R., 2010: Hydrology of an extensive living roof under sub-tropical climate conditions in Auckland, New Zealand. — Journal of Hydrology 394:384-395.
Yio, M.H.N., Stovin, V.,Werdin, J. & Vesuviano, G. 2013: Experimental analysis of green roof substrate detention characteristics. — Water Science and Technology 68 (7): 1477-1486.
58

APPENDIX A. Parameters of green roof retention rates and statistical comparisons between rain depth categories in built-on-site and readymade green roofs. Green roof retention rates (%)
Built-on-site (S & SB) Readymade (R & RB) Rain depth classes (mm) < 2 / 2-9.8 / ≥ 10
Rain depth classes (mm) < 2 / 2-9.8 / ≥ 10
All events (n = 49 / 34 / 12) Mean 45 / 58 / 69 14 / 24 / 46 SD 77 / 42 / 29 116 / 65 / 48 Kruskal Wallis H 0.716 1.643 p (two-tailed) 0.693 0.450 Mild events (n = 30 / 16 / 7) Mean 87/ 80 / 76 77 / 63 / 63 SD 19 /19 / 25 37 / 33 / 32 Kruskal Wallis H 3.891 5.443 p (two-tailed) 0.140 0.062 Combined freezing, freezing-melting and melting events (n = 19 / 18 / 5) Mean -23 / 39 / 59 -86 / -12 / 24 SD 85 / 47 / 34 128 / 67 / 62 Kruskal Wallis H 7.106 6.594 p (two-tailed) 0.023 0.032
Comparison between light rain (L), medium rain (M) and heavy (H) rain classes for combined freezing, freezing-melting and melting events
L & M / L & H / M & H L & M / L & H / M & H Mann Whitney U 100 / 102 / 179 18 / 20 / 157 Z -2.157 / -2.097 / -0.625 -2.097 / -1.955 / -1.176 p (two-tailed) 0.033 / 0.038 / 0.548 0.035 / 0.052 / 0.246 Effect size (r) 0.35 / 0.34 / 0.13 0.43 / 0.40 / 0.25 r: small effect > 0.1, medium effect > 0.3, large effect > 0.5 (Cohen 1988)
59

APPENDIX B. Parameters of green roof retention rates and statistical comparisons between green roof treatments for rain depth categories. Green roof treatment Green roof S / SB / R / RB S / SB / R / RB S / SB / R / RB retention Rain depth classes (mm) rates (%) Light (< 2) Medium (2-9.8) Heavy (≥ 10) Mild events
Mean 87 / 88 / 72 / 82 80 / 80 / 56 / 70 77 / 74 / 57 /69 SD 21 / 19/ 48 / 28 20 / 20 / 43 / 25 21 / 29 / 39 / 25 n 30 16 7 Friedman´s test 22.856 29.025 10.543 p (two-tailed)
< 0.001 < 0.001 0.011 Combined freezing, freezing-melting and melting events
Mean -46 / 0 / -152 / -20 32 / 46 / -35 / 12 55 / 64 / 8 / 39 SD 115 / 71 / 167 / 98 54 / 43 / 78 / 57 40/ 30 / 77 / 46 n 19 18 5 Friedman´s test 28.074 39.400 14.040 p (two-tailed) < 0.001 < 0.001 < 0.001
60

APPENDIX C. Parameters of green roof retention rates and statistical comparisons between low and high rain mean intensity and peak intensity categories.
r: small effect ≥ 0.1, medium effect ≥ 0.3, large effect ≥ 0.5 (Cohen 1988)
Green roof retention rate (%)
Rain mean intensity (mm h-1) < 0.60 / ≥ 0.60
Rain peak 20-min intensity (mm h-1) < 2.0 / ≥ 2.0
All events Mean 18 / 60 21 / 66 SD 83 / 56 87 / 31 n 52 / 43 61 / 34 Mann-Whitney U 802.5 811 Z -2.359 -1.755 p (two-tailed) 0.019 0.077 Effect size (r) 0.24 0.18 Mild events Mean 75 / 79 82 / 72 SD 29 / 26 28 / 26 n 25 / 28 27 / 26 Mann-Whitney U 318.5 228 Z -0.561 -2.188 p (two-tailed) 0.588 0.026 Effect size (r) 0.08 0.30 Combined freezing, freezing-melting and melting events Mean -35 / 24 -28 / 46 SD 82 / 78 86 / 41 n 27 / 15 34 / 8 Mann-Whitney U 108 63 Z -2.481 -2.338 p (two-tailed) 0.013 0.018 Effect size (r) 0.38 0.36
61

APPENDIX D. Parameters of green roof retention rates and statistical comparisons between mild, freezing, freezing-melting and melting event categories. Green roof retention rates (%)
Mild events
Freezing events
Freezing-melting events
Melting events
Mean 77 44 -32 -26 SD 27 35 99 84 n 53 8 10 24 Range 7 - 100 9 - 100 -174 - 97 -267 - 87 Mild events Mann Whitney U 96 73 125 Z -2.478 -3.611 -5.620 p (two-tailed) 0.013 < 0.001 < 0.001 Effect size (r) 0.32 0.45 0.64 Freezing events Mann Whitney U 24 44 Z -1.422 -2.263 p (two-tailed) 0.179 0.021 Effect size (r) 0.34 0.40 Freezing-melting events Mann Whitney U 115 Z -0.189 p (two-tailed) 0.860 Effect size (r) 0.03 r: small effect ≥ 0.1, medium effect ≥ 0.3, large effect ≥ 0.5 (Cohen 1988).
62

APPENDIX E. Parameters of green roof retention rates and statistical comparisons between warm and cold substrate temperature event categories for green roof treatments. Green roof retention rates (%)
Built-on-site (S & SB) Substrate temperature (̊C) < 10 / ≥ 10
Readymade (R & RB) Substrate temperature (̊C) < 10 / ≥ 10
Mean 27 90 -21 82 SD 68 16 100 25 n 39 56 39 56 Mann-Whitney U 256 201 Z -6.325 -6.733 p (two-tailed) <0.001 <0.001 Effect size (r) 0.65 0.69 r: small effect ≥ 0.1, medium effect ≥ 0.3, large effect ≥ 0.5 (Cohen 1988).
63

APPENDIX F. Parameters of green roof retention rates and statistical comparisons between short and longer antecedent dry weather periods. Green roof retention rate (%)
Green roof mean 6-24 / >24
Built on site 6-24 / >24
Built on site+biochar 6-24 / >24
Readymade 6-24 / >24
Readymade +biochar 6-24 / >24
All events (n = 54 / 41) Mean 27 / 49 40 / 55 56 / 63 -20 / 26 34 / 55 SD 79 / 67 73 / 81 46 / 58 138 / 96 76 / 53 Mann-Whitney U
949 933 966 920 954.5
Z -1.187 -1.308 -1.060 -1.405 -1.146 p (two-tailed) 0.235 0.194 0.287 0.160 0.250 Effect size (r) 0.12 0.13 0.11 0.14 0.12 Mild events (n = 33 / 20)
Mean 78 / 89 81 / 89 57 / 80 71 / 85 SD 21 / 18 22 / 20 49 / 35 29 / 21 Mann-Whitney U 273 301 286 269.5 Z -1.046 -0.532 -0.807 -1.111 p (two-tailed) 0.305 0.609 0.422 0.277 Effect size (r) 0.14 0.07 0.11 0.15 Freezing, freezing-melting and melting events (n = 21/ 21) Mean -22 / 22 16 / 39 -141 / -25 -24 / 26 SD 83 / 102 47 / 72 146 / 108 90 / 58 Mann-Whitney U 130 133 107 140 Z -2.277 -2.201 -2.855 -2.025 p (two-tailed) 0.024 0.030 0.005 0.046 Effect size (r) 0.35 0.34 0.44 0.31
r: small effect > 0.1, medium effect > 0.3, large effect > 0.5 (Cohen 1988)
64

APPENDIX G. Parameters of green roof runoff duration and statistical comparisons between green roof treatments. Runoff duration (h): Built-on-site S & SB /
Readymade R & RB Biochar SB & RB / Without biochar S & R
All events Mean 20.84 / 22.34 21.94 / 21.49 SD 18.21 / 18.95 19.18 / 18.34 n 91 93 T-test (paired samples) 3.262 -1.548 d.f. 90 91 p (two-tailed) 0.002 0.125 95 % CI 0.01703, 0.07009 -0.03834, 0.00476 Effect size (d) 0.08 0.02 Mild events Mean 13.33 / 14.52 13.59 / 14.28 SD 13.18 / 13.68 13.36 / 13.51 n 49 50 T-test (paired samples) 3.512 -1.862 d.f. 48 49 p (two-tailed) 0.001 0.069 95 % CI 0.02102, 0.07733 -0.06950, 0.00265 Effect size (d) 0.09 0.05 Combined freezing, freezing-melting and melting events Mean 29.60 / 31.45 30.93 / 30.12 SD 19.46 / 20.28 20.63 / 18.97 n 42 42 T-test (paired samples) 1.539 0.308 d.f. 41 41 p (two-tailed) 0.132 0.760 95 % CI -0.01156, 0.08557 0.01677, 0.02280 Effect size (d) 0.09 0.04 d: small effect ≥ 0.2, medium effect ≥ 0.5, large effect ≥ 0.8 (Cohen 1988)
65

Appendix H. Parameters of green roof delay times and statistical comparisons between green roof treatments. Delay from rain start to runoff start (h):
Built-on-site S & SB
Ready-made R & RB
Biochar SB & RB
Without biochar S & R
Mean 0.91 1.00 0.94 0.96 SD 1.99 1.98 1.94 2.04 n 88 88 88 88 Range 0–13.75 0–13.60 0–13.17 0 –14.18 Wilcoxon Z 0.380 0.968 p (two-tailed) 0.702 0.330
66

APPENDIX I. Parameters of green roof delay times (h) from the beginning of the rain event to the onset of runoff and statistical comparisons between short and longer antecedent dry weather periods. Delay time from rain start to runoff start (h):
Green roof mean ADWP (h) 6-24 / >24
Built-on-site ADWP (h) 6-24 / >24
Built-on-site +biochar ADWP (h) 6-24 / >24
Readymade ADWP (h) 6-24 / >24
Readymade +biochar ADWP (h) 6-24 / >24
All events Mean 1.05 / 1.84 0.97 / 1.08 0.86 / 0.81 0.99 / 1.89 1.22 / 1.00 SD 2.34 / 5.51 2.41 / 1.65 2.28 / 1.42 2.43 / 5.51 2.36 / 1.49 n 52 / 41 50 / 40 51 / 39 52 / 41 50 / 39 Mann-Whitney U
902.5 794.5 878 818 922
Z -1.273 -1.709 -0.999 -1.968 -0.445 p. (two-tailed) 0.205 0.085 0.325 0.051 0.662 Effect size (r) 0.13 0.18 0.11 0.20 0.05
Mild events (n= 28 / 17) Mean 1.46 / 1.68 1.34 / 1.35 1.39 / 1.52 1.57 / 1.38 SD 3.09 / 1.87 2.98 / 0.67 3.11 / 1.91 2.91 / 1.92 Mann-Whitney U 200.5 243 240.5 246.5 Z -1.594 -0.585 -1.350 -0.319 p (two-tailed) 0.112 0.566 0.177 0.754 Effect size (r) 0.23 0.08 0.19 0.05 Combined freezing, freezing-melting and melting events (n= 21 / 21) Mean 0.32 / 0.41 0.21 / 0.41 0.25 / 0.63 0.58 / 0.55 SD 0.71 / 0.54 0.49 / 0.56 0.70 / 0.97 0.99 / 0.65 Mann-Whitney U 141.5 165.5 135.5 180.5 Z -2.150 -1.618 -2.312 -1.067 p (two-tailed) 0.033 0.110 0.019 0.291
Effect size (r) 0.33 0.25 0.36 0.16
r: small effect ≥ 0.1, medium effect ≥ 0.3, large effect ≥ 0.5 (Cohen 1988)
67

APPENDIX J. Parameters of green roof delay times (h) from the beginning of the rain event to the onset of runoff and statistical comparisons between low and high preceding 7 d rain sums.
r: small effect ≥0.1, medium effect ≥0.3, large effect ≥0.5 (Cohen 1988)
Delay time from rain start to runoff start (h):
Green roof mean pre 7d rain sum (mm) <12 / ≥12
Built-on-site pre 7d rain sum (mm) <12 / ≥12
Built-on-site+biochar pre 7d rain sum (mm) <12 / ≥12
Ready-made pre 7d rain sum (mm) <12 / ≥12
Readymade +biochar pre 7d rain sum (mm) <12 / ≥12
All events Mean 1.83 / 0.99 1.05 / 1.00 0.79 / 0.88 1.82 / 0.98 1.16 / 1.09 SD 5.28 / 2.37 1.63 / 2.45 1.40 / 2.37 5.28 / 2.50 1.65 / 2.30 n 45 / 48 42 / 48 42 / 48 45 / 48 41 / 48 Mann-Whitney U 838.5 852 867.5 743.5 908.5 Z -1.867 -1.292 -1.197 -2.653 -0.631 p (two-tailed) 0.061 0.201 0.234 0.007 0.538 Effect size (r) 0.19 0.14 0.13 0.28 0.07 Mild events Mean 1.83 / 1.42 1.36 / 1.25 3.15 / 1.30 1.86 / 1.44 SD 2.00 / 3.15 1.81 / 3.03 7.02 / 3.17 2.03 / 2.93 n 21 / 27 21 / 27 24 / 27 20 / 27 Mann-Whitney U 170 185.5 150 189 Z -2.378 -2.074 -3.306 -1.754 p (two-tailed) 0.017 0.039 0.000 0.079 Effect size (r) 0.34 0.30 0.46 0.26 Combined freezing, freezing-melting and melting events Mean 0.27 / 0.46 0.23 / 0.40 0.31 / 0.56 0.48 / 0.65 SD 0.38 / 0.80 0.31 / 0.68 0.44 / 1.12 0.70 / 0.94 n 21 / 21 21 / 21 21 / 21 21 / 21 Mann-Whitney U 211.5 216 196 205.5 Z -0.245 -0.132 -0.666 -0.400 p (two-tailed) 0.817 0.906 0.507 0.694 Effect size (r) 0.04 0.02 0.10 0.06
68