water quality of rameswaram island, southeast coast … island, located on the southeast coast of...
TRANSCRIPT

International Research Journal of Environment Sciences________________________________ ISSN 2319–1414
Vol. 3(10), 12-23, October (2014) Int. Res. J. Environment Sci.
International Science Congress Association 12
Water Quality of Rameswaram Island, Southeast Coast of India – A
Statistical Assessment
Kathiravan K., Natesan Usha* and Vishnunath R. Centre for Water Resources, Anna University, Chennai – 600 025, Tamil Nadu, INDIA
Available online at: www.isca.in, www.isca.me Received 14th July 2014, revised 20th September 2014, accepted 16th October 2014
Abstract
Rameswaram Island, located on the southeast coast of India in Tamil Nadu, is the main pilgrimage site influenced by
anthropogenic intercessions. Assessment of physicochemical characteristics of nearshore water quality was carried out
during April 2011 – March 2012 to explicate its quality variations. Principal component analysis was applied to the whole
data to be factorized from which the total variability extraction and existing set of different physicochemical parameters
linear relationships were obtained. In PCA, high loadings were obtained for pH, temperature, SPM, salinity, DO, BOD,
nutrient species of nitrogen, phosphorus and chlorophyll-a. Seasonal variations of the physicochemical parameters are
observed with high deterioration of the water quality during summer.
Keywords: Rameswaram Island, Nearshore water, physicochemical, seasonal variation, principal component analysis.
Introduction
Regular monitoring of coastal water quality is the mandatory in developing countries like India, because of urbanization and industrial developments are moving towards coastal area. The inshore areas usually get disturbed with more critical water pollution problems than offshore1. At present, nearshore waters are in various stages of degradation as they are increasingly exploited by human for food, recreation, transport and other needs2,3. Considerable attentions have been paid in the recent years to study the physico-chemical parameters of the coastal waters around India in order to ascertain the water quality and productivity4. In tropical countries, the cyclic phenomenon of the rainfall pattern brings important changes in hydrographical characteristics of the marine ecosystem. Monitoring activities of coastal ecosystems have acquired great importance for better understanding of the past process, present patterns, and future trajectories in aquatic health5,6. To understand about the external driving forces as well as internal coastal processes, it is required to analyze the patterns and relationships among the water quality parameters. To detect the spatial and temporal variations of complicated data sets, multivariable statistical methods such as, principal component analysis (PCA), correlation matrix and box plots etc.,7-9 were applied for better understanding of water quality variations and the factors linked to seasonality. To reduce the dimensionality of multivariate attributes into two or three; PCA is applied to display graphically with minimal loss of information10. PCA summarizes the variation in a correlated multiattribute to a set of uncorrelated components that is principal components (PCs), each of which is particular linear combination of the original variables and is estimated from the Eigen values of the covariance or correlation matrix of the original values3. The use of PCA to water quality assessment has increased in recent years, mainly due to the need to obtain appreciable data reduction for analysis and decision11, 12.
In the coastal environment, the supply of nutrients is mainly influenced by the amount of fresh water inflow, rate of the rainfall, invasion of tidal pattern and also biological activities. The rainfall in India is largely influenced by two monsoons viz., southwest(SW) monsoon on the west coast, northern and northeastern India and by the northeast(NE) monsoon on the southeast coast13,14. Rameswaram Island, located in southeast coast of Tamil Nadu in India, surrounded by Palk Bay (PB) and Gulf of Mannar (GoM) acting as a physical barrier with limiting of water and sediment exchange, which is unique in nature and subjected to reversible monsoon activities during SW and NE monsoons. During southwest monsoon (June to September), the direction of current is clockwise in PB and the reverse in northeast monsoon (October to December), induced littoral currents in PB and GoM, which is buffered by the moving sandbar in Adams Bridge15. Transported by water flow, the distribution of water quality constituents are greatly influenced by the advection and diffusion processes of water movement16. Limited observations have been studied about the pollution aspects of Rameswaram Island. The objective of the present study is to evaluate the seasonal variation of nearshore water quality of the Rameswaram Island through statistical approach.
Material and Methods
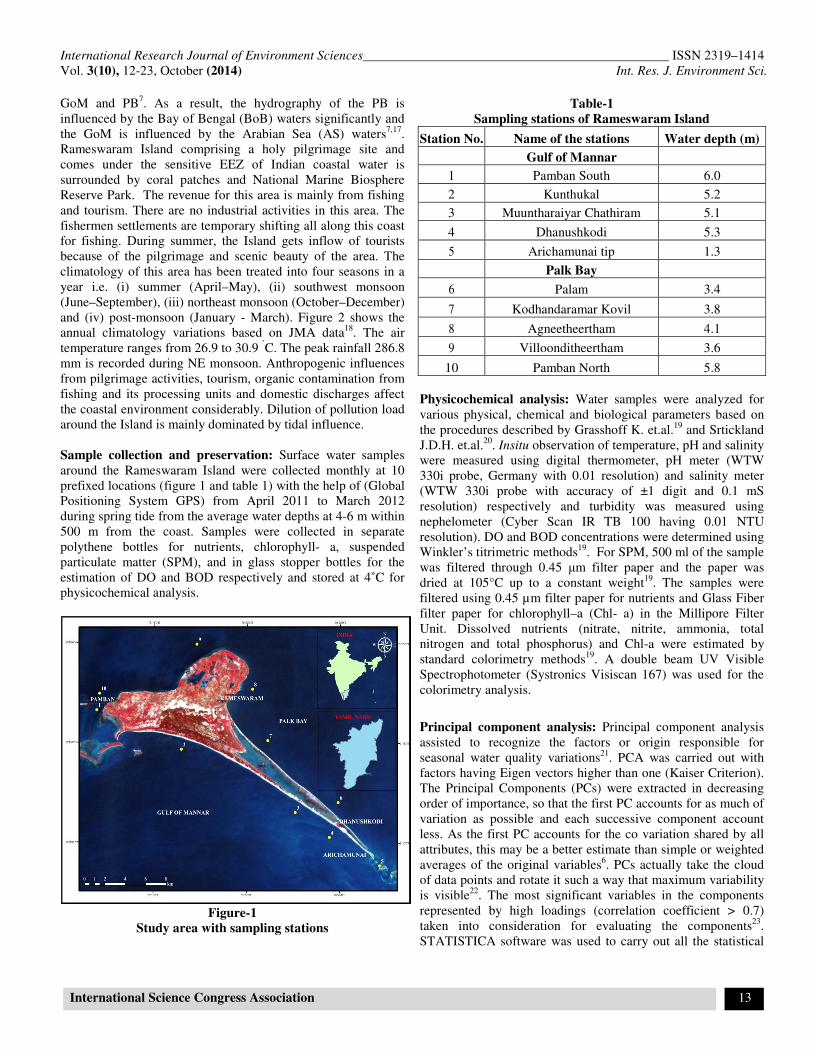
Study area: Rameswaram Island is bounded between the longitudes 79˚12’30” E to 79˚21’30” E and the latitudes 9˚8’55” N to 9˚19’25” N with PB on its north and GoM on its south (figure-1). The length of the island is about 28 km in the east-west direction. The extreme southeastern part of Rameswaram Island, known as Dhanushkodi Foreland, a long sand spit of about 4 km length is formed up to Arichamunai (tip) from Dhanushkodi and it tends to grow longer and wider and also it is well-known in Hindu mythology and is of religious importance. The Rameswaram Island, submerged chains of Islands in the Palk strait and Mannar Island act as physical barriers between
International Research Journal of Environment Sciences______________________________________________ ISSN 2319–1414 Vol. 3(10), 12-23, October (2014) Int. Res. J. Environment Sci.
International Science Congress Association 13
GoM and PB7. As a result, the hydrography of the PB is influenced by the Bay of Bengal (BoB) waters significantly and the GoM is influenced by the Arabian Sea (AS) waters7,17. Rameswaram Island comprising a holy pilgrimage site and comes under the sensitive EEZ of Indian coastal water is surrounded by coral patches and National Marine Biosphere Reserve Park. The revenue for this area is mainly from fishing and tourism. There are no industrial activities in this area. The fishermen settlements are temporary shifting all along this coast for fishing. During summer, the Island gets inflow of tourists because of the pilgrimage and scenic beauty of the area. The climatology of this area has been treated into four seasons in a year i.e. (i) summer (April–May), (ii) southwest monsoon (June–September), (iii) northeast monsoon (October–December) and (iv) post-monsoon (January - March). Figure 2 shows the annual climatology variations based on JMA data18. The air temperature ranges from 26.9 to 30.9 ˚C. The peak rainfall 286.8 mm is recorded during NE monsoon. Anthropogenic influences from pilgrimage activities, tourism, organic contamination from fishing and its processing units and domestic discharges affect the coastal environment considerably. Dilution of pollution load around the Island is mainly dominated by tidal influence. Sample collection and preservation: Surface water samples around the Rameswaram Island were collected monthly at 10 prefixed locations (figure 1 and table 1) with the help of (Global Positioning System GPS) from April 2011 to March 2012 during spring tide from the average water depths at 4-6 m within 500 m from the coast. Samples were collected in separate polythene bottles for nutrients, chlorophyll- a, suspended particulate matter (SPM), and in glass stopper bottles for the estimation of DO and BOD respectively and stored at 4˚C for physicochemical analysis.
Figure-1
Study area with sampling stations
Table-1
Sampling stations of Rameswaram Island
Station No. Name of the stations Water depth (m)
Gulf of Mannar
1 Pamban South 6.0
2 Kunthukal 5.2
3 Muuntharaiyar Chathiram 5.1
4 Dhanushkodi 5.3
5 Arichamunai tip 1.3
Palk Bay
6 Palam 3.4
7 Kodhandaramar Kovil 3.8
8 Agneetheertham 4.1
9 Villoonditheertham 3.6
10 Pamban North 5.8
Physicochemical analysis: Water samples were analyzed for various physical, chemical and biological parameters based on the procedures described by Grasshoff K. et.al.19 and Srtickland J.D.H. et.al.20. Insitu observation of temperature, pH and salinity were measured using digital thermometer, pH meter (WTW 330i probe, Germany with 0.01 resolution) and salinity meter (WTW 330i probe with accuracy of ±1 digit and 0.1 mS resolution) respectively and turbidity was measured using nephelometer (Cyber Scan IR TB 100 having 0.01 NTU resolution). DO and BOD concentrations were determined using Winkler’s titrimetric methods19. For SPM, 500 ml of the sample was filtered through 0.45 µm filter paper and the paper was dried at 105°C up to a constant weight19. The samples were filtered using 0.45 µm filter paper for nutrients and Glass Fiber filter paper for chlorophyll–a (Chl- a) in the Millipore Filter Unit. Dissolved nutrients (nitrate, nitrite, ammonia, total nitrogen and total phosphorus) and Chl-a were estimated by standard colorimetry methods19. A double beam UV Visible Spectrophotometer (Systronics Visiscan 167) was used for the colorimetry analysis.
Principal component analysis: Principal component analysis assisted to recognize the factors or origin responsible for seasonal water quality variations21. PCA was carried out with factors having Eigen vectors higher than one (Kaiser Criterion). The Principal Components (PCs) were extracted in decreasing order of importance, so that the first PC accounts for as much of variation as possible and each successive component account less. As the first PC accounts for the co variation shared by all attributes, this may be a better estimate than simple or weighted averages of the original variables6. PCs actually take the cloud of data points and rotate it such a way that maximum variability is visible22. The most significant variables in the components represented by high loadings (correlation coefficient > 0.7) taken into consideration for evaluating the components23. STATISTICA software was used to carry out all the statistical

International Research Journal of Environment Sciences______________________________________________ ISSN 2319–1414 Vol. 3(10), 12-23, October (2014) Int. Res. J. Environment Sci.
International Science Congress Association 14
analyses, including PCA.
Results and Discussion
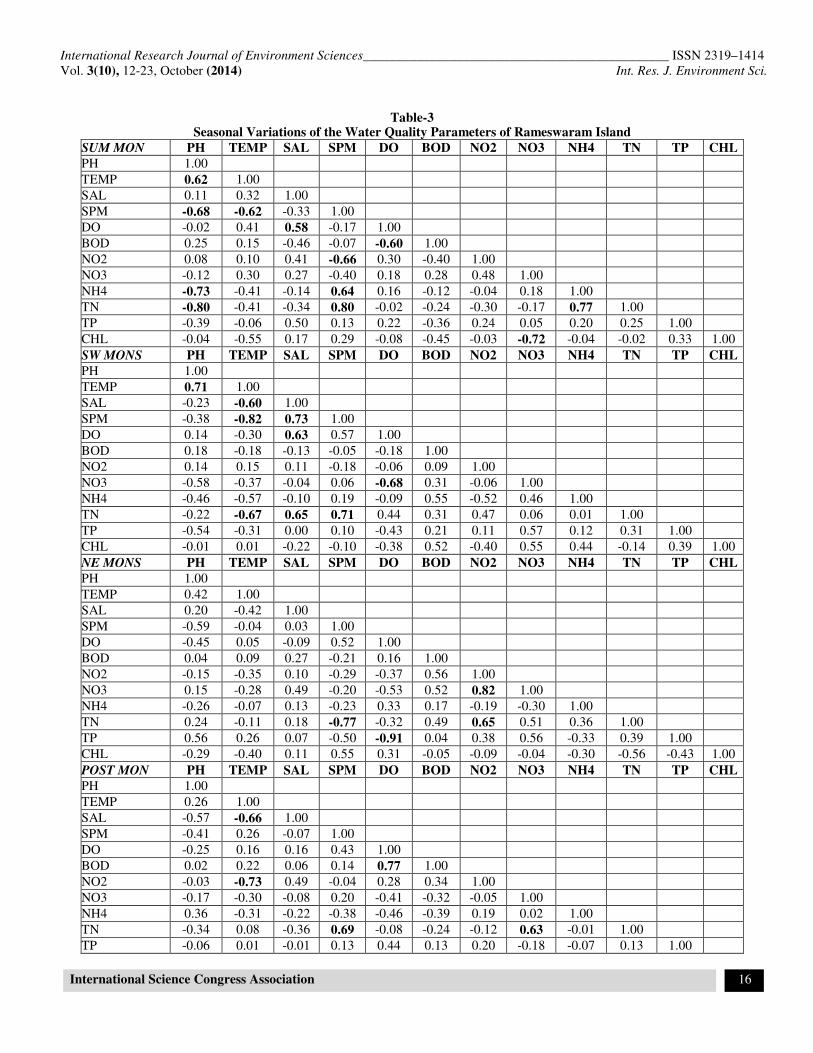
The descriptive statistics of the physicochemical parameters of Rameswaram Island are shown in table-2 and the seasonal fluctuation of mean values of water quality parameters are illustrated in box plot (figures 3 - 10). The box plot is composed of a box around the midpoint (i.e., mean or median) representing of the selected range (i.e., standard error, standard deviation, min-max, or constant) with whiskers outside of the box representing a selected range. Significant seasonal spatial and temporal variations of the all water quality parameters are revealed. pH remains alkaline throughout the study period at all stations registering a maximum during SW monsoon, which could be attributed to the high salinity of water24. Fluctuations in pH during different seasons is attributed to factors such as removal of CO2 photosynthesis through bicarbonate degradation, dilution of seawater by freshwater influx, low primary productivity, reduction of salinity and temperature besides decomposition of organic materials25. The analogous trend in pH in the coastal waters was reported from Point Calimere26 and from Parangipettai and Cuddalore27. The surface water temperature is higher during summer, because of longer photoperiod, clear sunshine and parched wind during summer and is lower in post monsoon, due to obscure sky and heavy rainfall. Similar observations have been recorded12, 26, 28, 29. A significant seasonal fluctuation of Salinity shows with high values in SW and low during NE. This can be due to the high degree of evaporation in SW as well as freshwater input due to precipitation during NE. Similar trend in the salinity values is also observed from various parts in southeast coast of India4,
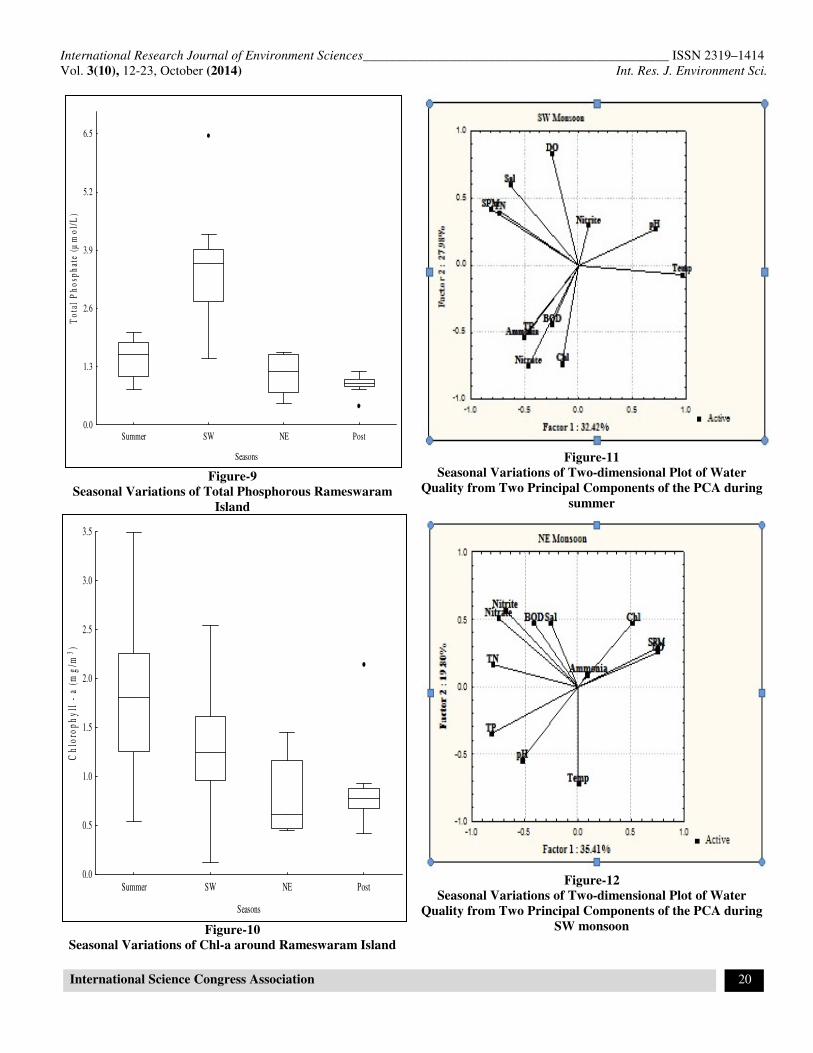
13,24, 26, 30-32. Higher SPM is recorded during NE monsoon, because of the turbulence experienced in the shallow nearshore waters onset of NE monsoon. DO vary between 5.55 and 7.57 mgL-1 and 4.16–5.55 mgL-1 during post monsoon and NE monsoon respectively. This could be attributed to the solubility of DO saturated with minimum temperature during post monsoon13,24,26,27&28 and increased organic inputs from the urban areas during NE monsoon. BOD varies extensively higher in summer (1.50–9.30 mgL-1) and lowers in NE (0.88–1.90 mgL-1). High BOD is recorded at Agnitheertham where the main pilgrimage activities as well as the discharge of dissolved organic matter added from land-based resources, such as domestic wastewater from the township33, 34. During NE and SW monsoon seasons, nutrient species of nitrogen (N) and phosphorus (P) show higher values than other seasons. Nitrite-N (NO2-N) is the least during NE while nitrate-N (NO3-N) has more than triple the concentration during SW. Similarly, ammonia-N (NH3-N) and total nitrogen (TN) also recorded high values during NE monsoon compared to the other seasons. The maximum values of nitrogen compounds are recorded at Agnitheertham. Total phosphorus (TP) is high during SW. One of the key factors that enrich the phosphate concentration is the exchange of phosphorous between water
and sediment through interstitial water as well as the regenerative property of the sediment is known to play an indispensable role on the distribution of the nutrient6,35,36. High Chlorophyll-a values are noticed during summer season and it is low during NE monsoon. High nitrogen content associated with low chlorophyll concentrations during NE monsoon indicates that the nitrogen concentration is regulated by phytoplanktonic growth. The Chl-a in the upper layer of tropical oceans is limited by the availability of nutrients. Therefore, oceanic processes that can bring nutrients into the euphotic zone are of prime importance37, 38. The water quality trend is inferred by correlation matrix and PCA. The seasonal correlation matrix of 12 variables is given in table 3. During summer and SW monsoon, pH is positively correlated with temperature, while pH is negatively correlated with SPM, ammonia and TN during summer. A negative correlation of temperature with SPM, salinity, nitrite and TN is observed in all seasons. A positive correlation of salinity with SPM, DO and TN during SW monsoon and chlorophyll-a in post monsoon is observed. SPM is positively correlated with TN in all seasons except NE monsoon and it is negatively correlated with nitrite during summer. DO is negatively correlated with BOD in all seasons except in post monsoon. A negative correlation is observed between BOD and DO during summer. A positive correlation of nitrite with nitrate and TN is observed during NE and ammonia with TN during summer. A negative correlation of TP with DO is observed during NE monsoon. Negative correlation of chlorophyll-a, with nitrate in summer and positive correlation with salinity in post monsoon is observed. It is found that a strong linear relationship exists between some of the variables from the correlation matrix. Thus, PCA was conducted to characterize the linear correlations and the loadings of 12 variables for each of the PCs were obtained. The first PC is influenced by each original variable. For each season three factors were obtained through the factor analysis performed on the PCs. Results of varimax rotated components matrix of FA including factor loadings, eigenvalues, percentage of total variance and cumulative variance values are presented in table 4. Figure 11-14 represents the results obtained for the first and second factors in different seasons. Classification of factor loading is ‘strong’, ‘moderate’ and ‘weak’ corresponding to absolute loading values of >0.75, 0.75 – 0.50, and 0.50 -0.30 respectively21, 39. It is observed that the factor 1 is dominant in all seasons and together accounted for 34.01% in summer, 32.21% in SW, 35.24% in NE and 26.17% in post monsoon of the total variance. During NE monsoon the maximum eigen values of 4.23 is observed due to the nutrients associated with strong loadings of TN, TP and ammonia (0.80, 0.81 and 0.75), and strong negative loadings of SPM and DO (-0.75). Due to the monsoon impacts, the nutrient enrichment induces the domination factor1. Factors 2 and 3 are accounted for 23.68% and 17.57% in summer, 27.94% and 14.37% in SW, 20.13% and 16.46% in NE and 22.91% and 19.30% in post monsoon of

International Research Journal of Environment Sciences______________________________________________ ISSN 2319–1414 Vol. 3(10), 12-23, October (2014) Int. Res. J. Environment Sci.
International Science Congress Association 15
the total variance. Factor 2 and 3 are dominant during SW monsoon and post monsoon respectively. During SW monsoon, factor 2 records an Eigen values of 3.35, because of the nutrients associated with strong and moderate positive loadings of nitrate and chlorophyll (0.76 and 0.74) respectively, and strong negative loadings of DO (-0.82). The maximum Eigen values of 2.32 for factor 3 during post monsoon may be attributed to the nutrients associated with moderate negative loadings of nitrate and TN (-0.74) correlate significantly with each other, suggesting a common source. Factor 2 portrays a strong positive loading with BOD and a strong negative loading with DO and salinity during summer. This is because of the organic loadings which indicates that the increased the concentration of pollution. In PCA outputs, the positive loadings of nutrients along with negative loadings of DO, pH and temperature indicates that nutrients contribution related with pollution sources and also it might be due to the consumption of large amounts of oxygen by the organic matter3,
6, 14, 40. The major source of ammonia from the sewage which is the indicative of pollution and the presence of nitrate is mainly due to processes such as nitrification42. PCA supported these observations in all seasons.
Conclusion
Nearshore water quality around Rameswaram Island, show the maximum enrichment of nutrients during NE monsoon compared with other seasons because of the precipitation. At Agnitheertham, high BOD with low DO is observed during
summer, due to pilgrimage and tourism in addition to the domestic pollution. The major anthropogenic impacts on the coastal waters of the study area are due to the intensification of tourism, fishing and urbanization by discharging sewage from hotels and settlements directly into the sea. These discharges lead to degradation of coastal water quality causing significant negative impacts on marine ecosystem in water quality, aquatic organisms and coral reefs in particular8,14,41. High salinity and high DO are observed during SW monsoon in Mukuntharaiyar Chathiram and during post monsoon at Pamban south respectively. The minimum concentration of nutrients, temperature and salinity are found during post monsoon period and DO, SPM are low during summer monsoon around the Rameswaram Island. The pragmatic values of physicochemical parameters of water mass around Rameswaram do not show much of spatial variations, but temporal changes in nutrients separates the water quality of PB and GoM regions, because of monsoonal behavior such as precipitation and reversible current patterns prevailing in this study area.
Acknowledgement
Authors are thankful to the Ministry of Earth Sciences (MoES), Govt. of India for financial assistance; Principal Chief Conservator of Forests and Chief Wildlife Warden, Tamil Nadu Forest Department and Wildlife Warden, Gulf of Mannar Marine National Park for research permission.
Table-2
Descriptive Statistics for Surface Waters of the Sampling Stations in Rameswaram Island
Parameter
Summer SW Monsoon NE Monsoon Post Monsoon
Range Mean± SD Range Mean± SD Range Mean± SD Range Mean± SD
pH 8.08–8.32 8.22±0.07 8.12-8.29 8.24±0.06 8.03-8.25 8.16±0.06 7.92-8.10 8.01±0.06
Temperature (o C) 29.00-
30.65
30.25±0.48 28.95-
30.03
29.53±0.43 27.87-
30.80
28.98±0.85 27.47-
29.53
28.58±0.72
Salinity (psu) 29.40-
30.50
29.94±0.41 31.00-
32.50
31.55±0.47 27.81-
31.05
28.89±1.04 28.87-
29.90
29.28±0.33
SPM (mg/L) 31.60-
57.10
45.01±8.48 44.00-
64.20
52.95±7.35 48.40-
73.73
63.69±8.69 36.67-
53.33
42.36±4.42
DO (mg/L) 4.15-6.65 5.45±0.68 4.43-6.30 5.25±0.71 4.16-5.55 4.86±0.49 5.55-7.57 6.58±0.68
BOD (mg/L) 1.50-9.30 3.48±2.25 1.58-5.39 2.60±1.09 0.88-1.90 1.29±0.30 0.69-2.67 1.60±0.59
Nitrite (µmol/L) 0.18-0.64 0.35±0.12 0.12-0.27 0.21±0.04 0.26-0.71 0.42±0.12 0.06-0.35 0.18±0.10
Nitrate (µmol/L) 0.35-2.08 1.27±0.59 0.72-2.06 1.44-0.43 0.94-1.92 1.36±0.33 0.19-1.50 0.67±0.39
Ammonia (µmol/L) 1.35-7.04 4.19±1.84 0.85-4.62 1.98±1.26 3.03-7.12 5.31±1.53 0.62-4.77 2.31±1.18
Total Nitrogen
(µmol/L)
9.58-
30.42
19.67±5.99 20.00-
26.67
23.75±2.69 34.72-
51.65
41.29±4.69 22.22-
40.00
29.22±5.99
Total Phosphorus
(µmol/L)
0.78-2.05 1.50±0.78 1.49-6.46 3.46±1.38 0.49-1.63 1.16-0.44 0.42-1.19 0.90±0.21
Chlorophyll – a
(mg/m3)
0.27-3.50 1.65±0.27 0.12-2.55 1.34±0.68 0.45-1.45 0.82±0.41 0.42-2.15 0.86±0.49
International Research Journal of Environment Sciences______________________________________________ ISSN 2319–1414 Vol. 3(10), 12-23, October (2014) Int. Res. J. Environment Sci.
International Science Congress Association 16
Table-3
Seasonal Variations of the Water Quality Parameters of Rameswaram Island
SUM MON PH TEMP SAL SPM DO BOD NO2 NO3 NH4 TN TP CHL
PH 1.00
TEMP 0.62 1.00
SAL 0.11 0.32 1.00
SPM -0.68 -0.62 -0.33 1.00
DO -0.02 0.41 0.58 -0.17 1.00
BOD 0.25 0.15 -0.46 -0.07 -0.60 1.00
NO2 0.08 0.10 0.41 -0.66 0.30 -0.40 1.00
NO3 -0.12 0.30 0.27 -0.40 0.18 0.28 0.48 1.00
NH4 -0.73 -0.41 -0.14 0.64 0.16 -0.12 -0.04 0.18 1.00
TN -0.80 -0.41 -0.34 0.80 -0.02 -0.24 -0.30 -0.17 0.77 1.00
TP -0.39 -0.06 0.50 0.13 0.22 -0.36 0.24 0.05 0.20 0.25 1.00
CHL -0.04 -0.55 0.17 0.29 -0.08 -0.45 -0.03 -0.72 -0.04 -0.02 0.33 1.00
SW MONS PH TEMP SAL SPM DO BOD NO2 NO3 NH4 TN TP CHL
PH 1.00
TEMP 0.71 1.00
SAL -0.23 -0.60 1.00
SPM -0.38 -0.82 0.73 1.00
DO 0.14 -0.30 0.63 0.57 1.00
BOD 0.18 -0.18 -0.13 -0.05 -0.18 1.00
NO2 0.14 0.15 0.11 -0.18 -0.06 0.09 1.00
NO3 -0.58 -0.37 -0.04 0.06 -0.68 0.31 -0.06 1.00
NH4 -0.46 -0.57 -0.10 0.19 -0.09 0.55 -0.52 0.46 1.00
TN -0.22 -0.67 0.65 0.71 0.44 0.31 0.47 0.06 0.01 1.00
TP -0.54 -0.31 0.00 0.10 -0.43 0.21 0.11 0.57 0.12 0.31 1.00
CHL -0.01 0.01 -0.22 -0.10 -0.38 0.52 -0.40 0.55 0.44 -0.14 0.39 1.00
NE MONS PH TEMP SAL SPM DO BOD NO2 NO3 NH4 TN TP CHL
PH 1.00
TEMP 0.42 1.00
SAL 0.20 -0.42 1.00
SPM -0.59 -0.04 0.03 1.00
DO -0.45 0.05 -0.09 0.52 1.00
BOD 0.04 0.09 0.27 -0.21 0.16 1.00
NO2 -0.15 -0.35 0.10 -0.29 -0.37 0.56 1.00
NO3 0.15 -0.28 0.49 -0.20 -0.53 0.52 0.82 1.00
NH4 -0.26 -0.07 0.13 -0.23 0.33 0.17 -0.19 -0.30 1.00
TN 0.24 -0.11 0.18 -0.77 -0.32 0.49 0.65 0.51 0.36 1.00
TP 0.56 0.26 0.07 -0.50 -0.91 0.04 0.38 0.56 -0.33 0.39 1.00
CHL -0.29 -0.40 0.11 0.55 0.31 -0.05 -0.09 -0.04 -0.30 -0.56 -0.43 1.00
POST MON PH TEMP SAL SPM DO BOD NO2 NO3 NH4 TN TP CHL
PH 1.00
TEMP 0.26 1.00
SAL -0.57 -0.66 1.00
SPM -0.41 0.26 -0.07 1.00
DO -0.25 0.16 0.16 0.43 1.00
BOD 0.02 0.22 0.06 0.14 0.77 1.00
NO2 -0.03 -0.73 0.49 -0.04 0.28 0.34 1.00
NO3 -0.17 -0.30 -0.08 0.20 -0.41 -0.32 -0.05 1.00
NH4 0.36 -0.31 -0.22 -0.38 -0.46 -0.39 0.19 0.02 1.00
TN -0.34 0.08 -0.36 0.69 -0.08 -0.24 -0.12 0.63 -0.01 1.00
TP -0.06 0.01 -0.01 0.13 0.44 0.13 0.20 -0.18 -0.07 0.13 1.00

International Research Journal of Environment Sciences______________________________________________ ISSN 2319–1414 Vol. 3(10), 12-23, October (2014) Int. Res. J. Environment Sci.
International Science Congress Association 17
CHL -0.13 -0.44 0.75 -0.23 -0.01 0.01 0.40 -0.11 -0.10 -0.45 0.31 1.00
Table-4
Seasonal Factor Loadings from a Principle Component Factor Analysis (rotated) for Rameswaram Coastal Waters
Variable (Sum) Factor 1 Factor 2 Factor 3 Variable (SW) Factor 1 Factor 2 Factor 3
pH -0.81 0.32 0.36 pH -0.69 -0.28 -0.05
Temperature -0.75 -0.04 -0.24 Temperature -0.97 0.04 0.12
Salinity -0.39 -0.76 0.13 Salinity 0.65 -0.58 0.04
SPM 0.94 0.10 0.01 SPM 0.83 -0.39 -0.18
DO -0.21 -0.73 -0.11 DO 0.28 -0.82 -0.35
BOD -0.17 0.78 -0.36 BOD 0.23 0.46 0.08
Nitrite -0.44 -0.59 -0.12 Nitrite -0.09 -0.29 0.88
Nitrate -0.38 -0.21 -0.42 Nitrate 0.44 0.76 0.23
Ammonia 0.71 -0.27 -0.49 Ammonia 0.50 0.55 -0.51
Total Nitrogen 0.87 -0.13 -0.30 Total Nitrogen 0.74 -0.37 0.42
Total Phosphate 0.21 -0.68 0.08 Total Phosphate 0.44 0.51 0.50
Chlorophyll 0.34 -0.23 0.86 Chlorophyll 0.12 0.74 -0.17
Eigen value 4.08 2.84 2.11 Eigen value 3.87 3.35 1.72
% Total Variance 34.01 23.68 17.57 % Total Variance 32.21 27.94 14.37
Cumulative % 34.01 57.69 75.26 Cumulative% 32.21 60.15 74.52
Variables (NE) Factor 1 Factor 2 Factor 3 Variables (PM) Factor 1 Factor 2 Factor 3
pH 0.52 0.55 -0.16 pH -0.30 0.34 0.67
Temperature 0.01 0.73 0.11 Temperature -0.62 -0.52 0.47
Salinity 0.25 -0.48 -0.06 Salinity 0.87 0.10 -0.30
SPM -0.75 -0.30 -0.36 SPM -0.19 -0.71 -0.51
DO -0.75 -0.24 0.45 DO 0.40 -0.83 0.18
BOD 0.42 -0.47 0.36 BOD 0.36 -0.64 0.38
Nitrite 0.68 -0.58 -0.05 Nitrite 0.72 0.10 -0.14
Nitrate 0.75 -0.52 -0.30 Nitrate -0.30 0.21 -0.74
Ammonia -0.09 -0.07 0.88 Ammonia -0.15 0.68 0.07
Total Nitrogen 0.80 -0.15 0.51 Total Nitrogen -0.51 -0.28 -0.74
Total Phosphate 0.81 0.34 -0.36 Total Phosphate 0.28 -0.34 0.01
Chlorophyll -0.51 -0.48 -0.47 Chlorophyll 0.78 0.22 -0.04
Eigen value 4.23 2.42 1.98 Eigen value 3.14 2.75 2.32
% Total Variance 35.24 20.13 16.46 % Total Variance 26.17 22.91 19.30
Cumulative % 35.24 55.37 71.84 Cumulative % 26.17 49.08 68.39

International Research Journal of Environment Sciences______________________________________________ ISSN 2319–1414 Vol. 3(10), 12-23, October (2014) Int. Res. J. Environment Sci.
International Science Congress Association 18
Figure-2
Annual Precipitation and Mean Air Temperature of Rameswaram Island
Figure-3
Seasonal Variations of DO around Rameswaram Island
Figure-4
Seasonal Variations of BOD around Rameswaram Island
24
25
26
27
28
29
30
31
32
0
50
100
150
200
250
300
350
Apr-11 May-11 Jun-11 Jul-11 Aug-11 Sep-11 Oct-11 Nov-11 Dec-11 Jan-12 Feb-12 Mar-12
Me
an
Te
mp
era
ture
(oC
)
Pre
cip
ita
tio
n (
mm
)
Months
Precip. (mm)
Mean Temp. (oC)
Summer SW NE Post
Seasons
4
5
6
7
8
DO
(m
g/L
)
Summer SW NE Post
Seasons
0
2
4
6
8
10
BO
D (
mg
/L)

International Research Journal of Environment Sciences______________________________________________ ISSN 2319–1414 Vol. 3(10), 12-23, October (2014) Int. Res. J. Environment Sci.
International Science Congress Association 19
Figure-5
Seasonal Variations of No2-N around Rameswaram Island
Figure-6
Seasonal Variations of NO3-N around Rameswaram Island
Figure-7
Seasonal Variations of NH3-N around Rameswaram Island
Figure-8
Seasonal Variations of Total Nitrogen Rameswaram Island
Summer SW NE Post
Seasons
0.0
0.2
0.4
0.6
0.8
Nit
rite
(µ
mo
l/L
)
Summer SW NE Post
Seasons
0.00
0.55
1.10
1.65
2.20
Nit
rate
(µ
mo
l/L
)
Summer SW NE Post
Seasons
0
2
4
6
8
Am
mo
nia
(µ
mo
l/L
)
Summer SW NE Post
Seasons
0
10
20
30
40
50
To
tal
Nit
rog
en (
µm
ol/
L)
International Research Journal of Environment Sciences______________________________________________ ISSN 2319–1414 Vol. 3(10), 12-23, October (2014) Int. Res. J. Environment Sci.
International Science Congress Association 20
Figure-9
Seasonal Variations of Total Phosphorous Rameswaram
Island
Figure-10
Seasonal Variations of Chl-a around Rameswaram Island
Figure-11
Seasonal Variations of Two-dimensional Plot of Water
Quality from Two Principal Components of the PCA during
summer
Figure-12
Seasonal Variations of Two-dimensional Plot of Water
Quality from Two Principal Components of the PCA during
SW monsoon
Summer SW NE Post
Seasons
0.0
1.3
2.6
3.9
5.2
6.5
To
tal
Ph
osp
hat
e (µ
mo
l/L
)
Summer SW NE Post
Seasons
0.0
0.5
1.0
1.5
2.0
2.5
3.0
3.5
Ch
loro
ph
yll
- a
(m
g/m
3)

International Research Journal of Environment Sciences______________________________________________ ISSN 2319–1414 Vol. 3(10), 12-23, October (2014) Int. Res. J. Environment Sci.
International Science Congress Association 21
Figure-13
Seasonal Variations of Two-dimensional Plot of Water
Quality from Two Principal Components of the PCA during
NE monsoon
Figure-14
Seasonal Variations of Two-dimensional Plot of Water
Quality from Two Principal Components of the PCA during
Post monsoon
Reference
1. Rao.V.J., Kavitha P., Srikanth K., Usman P.K. and Gnaneshwar Rao T., Environmental contamination using accumulation of metals in marine sponge, Sigmadocia fibulata inhabiting the coastal waters of Gulf of Mannar, India, Toxicological and Environmental Chemistry, 89(3), 487-498, (2007)
2. Alongi D.M., Coastal ecosystem processes, CRC Press, Boca Raton, (1998)
3. Bong. C.W. and Lee. C.W., Nearshore and Offshore Comparison of Marine Water Quality Variables Measured During SESMA 1, Malaysian Journal of
Science, 27(3), 25–31, (2008)
4. Sulochana B. and Muniyandi K., Hydrographic parameters off Gulf of Mannar and Palk Bay during an year of abnormal rainfall, J. Mar. Biol. Assoc. India,
47(2), 198- 200, (2005)
5. Buzelli C., Akman O., Buck T., Koepfler E., Morris J. and Lewitus A., Relationships among water quality parameters from the north inlet-Winyah bay national eatuarine research reserve, South Carolina, Journal of
Coastal Research, 45, 59-74, (2004)
6. Babu K.N., Omana P.K. and Mohan M., Water and Sediment quality of Ashtamudi estuary, a Ramsar site, southwest coast of India - A statistical appraisal, Environmental Monit Assess, 165:307–319, doi: 10.1007/s10661-009-0947-0. 217, (2010)
7. Jyothibabu R., Mohan Arya P., Jagadeesan L.,
Anjusha A., Muraleedharan K.R., Lallu K.R., Krishna Kiran and Ullas N., Ecology and trophic preference of picoplankton and nanoplankton in the Gulf of Mannar and the Palk Bay, southeast coast of India, J. Mar. Syst,
http://dx.doi.org/10.1016/j.jmarsys.2012.09.006 (2012)
8. Mokhtar M.B., Aris A.Z., Munusamy V., Praveena S.M., Assessment level of heavy metals in Penaeus Monodon and Oreochromis Spp in selected aquaculture ponds of high densities development area, European Journal of
Scientific Research, 30, 348– 360, (2009)
9. O’Boyle S., Mcdermott G., Wilkes R., Dissolved oxygen levels in estuarine and coastal waters around Ireland, Marine Pollution Bulletin, 58, 1657–1663, http://dx.doi.org/10.1016/j.marpolbul.2009.07.002.,
(1999)
10. Zhou F., Liu Y. and Guo H.C., Application of multivariate statistical methods to the water quality assessment of the watercourses in the northwestern New Territories, Hong Kong. Environmental Monitoring and
Assessment, 132 (1-3), 1-13. Doi:10.1007/s10771-006-9497-x., (2007)
11. Astel A., Tsakovski S., Simeonov V., Reisenhofer E., Piselli S. and Barbieri P., Multivariate classification and modeling in surface water pollution estimation, Analytical and Bioanalytical Chemistry, 390(5),1283-1292, (2008)
12. Govindasamy. C., Kannan. L. and Jayapal Azariah, Seasonal variation in physic- chemical properties and primary production in the coastal water biotopes of

International Research Journal of Environment Sciences______________________________________________ ISSN 2319–1414 Vol. 3(10), 12-23, October (2014) Int. Res. J. Environment Sci.
International Science Congress Association 22
Coromandel Coast, India. J. Environ. Biol., 21 (1), 1-7,
(2000)
13. Prabu V.A., Rajkumar M. and Perumal P, Seasonal variations in physico-chemical characteristics of Pichavaram mangroves, southeast coast of India, J.
Environ. Biol., 29(6), 945-950, (2008)
14. Praveena S.M. and Aris A.Z., A baseline study of tropical coastal water quality in Port Dickson, Strait of Malacca, Malaysia, Marine Pollution Bulletin, 67, 196–199, (2013)
15. Bindu Sulochanan, Kumaraguru A.K. and Laxman Shankar Korabu, Hydrological conditions in seagrass beds in Palk Bay and Gulf of Mannar, southeast coast of India, J. Mar. Biol. Ass. India, 53 (1), 108 – 115, (2011)
16. Wang. C.F, Ming-Hsi Hsu, Wen-Cheng Liu., Jiang-Shiou Hwang., Jiunn-Tzong Wu. and Albert Y. Kuo, Simulation of water quality and plankton dynamics in the Danshuei River estuary, Taiwan, Journal of
Environmental Science and Health, Part A: Toxic/Hazardous Substances and Environmental Engineering, 42(7), 933-953. 231, (2007)
17. Murty A.V.S. and Varma P.U., The hydrographical features of Palk Bay during March 1963, Mar. Biol.
Assoc. India, 6, 207–216, (1964)
18. Tokyo Climate Centre, Climate Prediction Division, 1-3-4 Otemachi, Chiyoda-ku, Tokyo, Japan. http://ds.data.jma.go.jp/gmd/tcc/climatview/obsmonth.jsp?n=43363&dt=2013-06-02&t=60&prt=1, (2014)
19. Grasshoff K., Ehrhordt M. and Kremling K., ‘Methods of Seawater Analysis’, Weinhim: Verlag Chemie, (1983)
20. Srtickland J.D.H. and Parsons T.R., A practical hand book of seawater analysis. Bull. Krish. Res. Bd. Cananda, 167, 310, (1972)
21. Zare Garizi A, Sheikh V and Sadoddin A, Assessment of chemical characteristics in surface water using multivariate statistical methods, Int. J. Environ. Sci.
Tech., 8(3), 581 – 592, (2011)
22. Fathy S.A.H., Hamid F.F.A, Shreadah M.A., Mohamed L.A. and El-Gazar M.G., Application of Principal Component Analysis for developing Water Quality Index for selected coastal areas of Alexandria Egypt, Resources
and Environment, 2(6), 297 – 305, (2012)
23. Narire Mazlum, Adem Ozer. and Suleyman Mazlum, Interpretation of water quality data by principal component analysis, Tr. J. of Egg and Env. Sci., 23, 19-26, (1999)
24. Manikannan R., Asokan S. and Samsoor A.H.M., Seasonal variations of physico- chemical properties of the Great Vedaranyam Swamp, Point Calimare Wildlife Sanctuary, South - East coast of India, African
Journal of Environmental Science and Technology, 5(9), 673- 681, (2011)
25. Rajasegar M., Physico-chemical characteristics of the Vellar estuary in relation to shrimp farming., J. Environ.
Biol., 24(1), 95 – 101, (2003)
26. Damotharan P., Vengadesh Perumal. N., Arumugam. M., Vijayalakshmi. S. and Balasubramania. T., Seasonal variation of Physico-chemical characteristics in Point Calimere coastal waters (South East Coast of India), Middle-East Journal of Scientific Research, 6(4), 333 – 339, (2010)
27. Sundaramanickam A., Sivakumar T., Kumaran R., Ammaiappan V. and Velappan R, A comparative study of physico-chemical investigation along Parangipettai and Cuddalore coast, J. Environ. Sci. Technol., 1(1), 1-10, (2008)
28. Das. J., Sad. S.N. and Sahoo. R.K., Semidiurnal variation of some physic-chemicalparameters in the Mahanadhi estuary, East coast of India, Indian J. Mar. Sci., 26, 323 – 326, (1997)
29. Hannien J., Vuorinen T., Helminen. H., Kirkkala. T. and Lehtila, Trends and gradients in nutrient concentrations and loading in the archipielago sea, North Baltic, in 1997, East. Coast. Shelf Sci., 50, 153 – 171,
(2000)
30. Palanichamy S and Rajendran A, Heavy metal concentration in seawater and sediments of Gulf of Mannar and Palk Bay, southeast coast of India, Indian J.
Mar. Sci., 29, 116-119, (2000)
31. Seenivasan R, Spectral reflectance properties of the Vellar estuarine environment, southeast coast of India, M.Phil. Thesis, Annamalai University, India, (1998)
32. Soundarapandian P., Premkumar T. and Dinakaran G.K, Studies on the physico- chemical characteristic and nutrients in the Uppanar estuary of Cuddalore, South east coast of India, Curr. Res. J. Biol. Sci., 1(3), 102-105,
(2009)
33. Wu M.L., Wang Y.S., Sun C.C., Wang H. and Dong J.D., Using chemometrics toidentify water quality in Daya Bay, China. Oceanologia, 52, 217–232. 357, (2009)
34. Wu M.L., Wang Y.S., Sun C.C., Wang H., Dong J.D., Yin. J.P. and Han S.H., Identification of coastal water quality by statistical analysis methods in Daya Bay, South China Sea, Mar. Pollut. Bull., doi:10.1016/j.marpolbul.2010.01.007, (2010)
35. Babu K.N., Ouseph P. and Padmalal D., Interstitial water–sediment geochemistry of N, P and Fe and its response to overlying waters of tropical estuaries: a case from the south west coast of India, Environmental Geology, 39(6), 633–640. doi:10.1007/s002540050475, (2000)
36. Reddy C.V.G., Sankaranarayanan V.N., Phosphate regenerative activity in the muds of tropical estuary,

International Research Journal of Environment Sciences______________________________________________ ISSN 2319–1414 Vol. 3(10), 12-23, October (2014) Int. Res. J. Environment Sci.
International Science Congress Association 23
Indian Journal of Marine Sciences, 1, 57–60, (1972)
37. Kumar S.P., Muraleedharan P.M., Prasad T.G., Gauns. M., Ramaiah N., de Souza S.N., Sardesai S. and Madhupratap M., Why is the Bay of Bengal less productive during summer monsoon compared to the Arabian Sea?, Geophys, Res. Lett., 29(24), 88.1-88.4,
(2002)
38. Vinayachandran P.N., Chauhan P., Mohan M., Nayak S., Biological response of the sea around Sri Lanka to summer monsoon, Geophysical Research Letters, 31, L01302, doi: 10.1029/2003GL018533, (2004)
39. Liu C.W., Lin K.H. and Kuo Y.M., Application of factor analysis in the assessment of ground water quality in a Blackfoot disease area in Taiwan, Sci. Total Environ.,
313 (1-3), 77 – 89, (2003)
40. Singh K.P., Malik A. and Sinha S., Water quality assessment and appropriation of pollution sources of Gomti River (India) using multivariate statistical techniques – a case study, Analytica Chimica Acta, 538, 355-374. Doi:10.1016/j.aca.2005.02.006., (2005)
41. Chua T.E., Ross S.A. and Yu H., Malacca Straits Environmental Profile. In Aquatic Resource and Environmental Studies of the Straits of Malacca: Managing the Straits through Science and Technology. Serdang, Malaysia. (1997)
42. Radojevic M., Bashkin V.N., Practical Environmental Analysis, Royal Society of Chemistry, Cambridge,
(2006)