water quality annual report east gippsland water 2013 2014
TRANSCRIPT
133 Macleod Street, PO Box 52, Bairnsdale Victoria 3875
TTTT 03 5150 4444 FFFF (03) 5150 4477
EEEE [email protected] WWWW www.egwater.vic.gov.au
Water Quality Annual Report Water Quality Annual Report Water Quality Annual Report Water Quality Annual Report 2013/20142013/20142013/20142013/2014
East Gippsland WaterEast Gippsland WaterEast Gippsland WaterEast Gippsland Water
October 2014October 2014October 2014October 2014

EAST GIPPSLAND WATER: WATER QUALITY ANNUAL REPORT 2013 /2014
TABLE OF CONTENTSTABLE OF CONTENTSTABLE OF CONTENTSTABLE OF CONTENTS
1111 INTRODUCTIONINTRODUCTIONINTRODUCTIONINTRODUCTION........................................................................................................................................................................................................................................................................................................................................................................................................................................................................................................................................................ 4444
1.1 CHARACTERISATION OF THE SYSTEM ........................................................................................................... 4
2222 WATER TREATMENT AND WATER TREATMENT AND WATER TREATMENT AND WATER TREATMENT AND QUALITY MANAGEMENT SQUALITY MANAGEMENT SQUALITY MANAGEMENT SQUALITY MANAGEMENT SYSTEMSYSTEMSYSTEMSYSTEMS ............................................................................................................................................................................................................................................................ 6666
2.1 SYSTEM SUMMARY .................................................................................................................................. 6 2.2 SYSTEM ISSUES ...................................................................................................................................... 8 2.3 SYSTEM IMPROVEMENTS .......................................................................................................................... 8
3333 QUALITY OF DRINKING QUALITY OF DRINKING QUALITY OF DRINKING QUALITY OF DRINKING WATER FOR 2013/2014WATER FOR 2013/2014WATER FOR 2013/2014WATER FOR 2013/2014 ........................................................................................................................................................................................................................................................................................................................................ 9999
3.1 REGULATED PARAMETERS- ESCHERICHIA COLI (E. COLI) ............................................................................... 9 3.2 REGULATED PARAMETERS- TRIHALOMETHANES ........................................................................................ 10 3.3 REGULATED PARAMETERS - CHLOROACETIC ACID ...................................................................................... 11 3.4 REGULATED PARAMETERS- DICHLOROACETIC ACID .................................................................................... 12 3.5 REGULATED PARAMETERS- TRICHLOROACETIC ACID ................................................................................... 13 3.6 REGULATED PARAMETERS- ALUMINIUM (ACID SOLUBLE)............................................................................. 14 3.7 REGULATED PARAMETERS- TURBIDITY ..................................................................................................... 15 3.8 FLUORIDE ............................................................................................................................................ 16 3.9 OTHER SUBSTANCES- BLUE GREEN ALGAE ............................................................................................... 18 3.10 OTHER SUBSTANCES- CADMIUM ............................................................................................................. 20 3.11 OTHER SUBSTANCES- CHROMIUM ........................................................................................................... 21 3.12 OTHER SUBSTANCES- ARSENIC ............................................................................................................... 22 3.13 OTHER SUBSTANCES- CYANIDE ............................................................................................................... 23 3.14 OTHER SUBSTANCES- COPPER ............................................................................................................... 24 3.15 OTHER SUBSTANCES- LEAD ................................................................................................................... 25 3.16 OTHER SUBSTANCES- BIOCIDES.............................................................................................................. 26 3.17 OTHER SUBSTANCES- RADIOLOGICAL ...................................................................................................... 29 3.18 AESTHETIC CHARACTERISTICS- PH........................................................................................................... 30 3.19 AESTHETIC CHARACTERISTICS- HARDNESS ............................................................................................... 31 3.20 AESTHETIC CHARACTERISTICS- FREE CHLORINE ......................................................................................... 32 3.21 AESTHETIC CHARACTERISTICS- COLOUR ................................................................................................... 34 3.22 AESTHETIC CHARACTERISTICS- MANGANESE ............................................................................................. 35 3.23 AESTHETIC CHARACTERISTICS- IRON ........................................................................................................ 36 3.24 AESTHETIC CHARACTERISTICS- ZINC ........................................................................................................ 37 3.25 ANALYSIS OF RESULTS .......................................................................................................................... 38
4444 EMERGENCY AND INCIDEEMERGENCY AND INCIDEEMERGENCY AND INCIDEEMERGENCY AND INCIDENT MANAGEMENTNT MANAGEMENTNT MANAGEMENTNT MANAGEMENT ............................................................................................................................................................................................................................................................................................................................................................ 39393939
4.1 NOTIFICATION EVENTS UNDER SECTION 22 OR SECTION 18 ...................................................................... 39 4.2 OTHER ................................................................................................................................................ 39
5555 COMPLAINTS RELATING COMPLAINTS RELATING COMPLAINTS RELATING COMPLAINTS RELATING TO WATER QUALITYTO WATER QUALITYTO WATER QUALITYTO WATER QUALITY ........................................................................................................................................................................................................................................................................................................................................................ 40404040
5.1 DISCOLOURED WATER ........................................................................................................................... 40 5.2 TASTE AND ODOUR ............................................................................................................................... 40 5.3 AIR IN THE WATER ................................................................................................................................. 40 5.4 OTHER ................................................................................................................................................ 41
6666 ACTIONS ARISING FROMACTIONS ARISING FROMACTIONS ARISING FROMACTIONS ARISING FROM THE MOST RECENT RISKTHE MOST RECENT RISKTHE MOST RECENT RISKTHE MOST RECENT RISK MANAGEMENT PLAN AUDIMANAGEMENT PLAN AUDIMANAGEMENT PLAN AUDIMANAGEMENT PLAN AUDITTTT ................................................................................................................................ 42424242
7777 UNDERTAKINGS UNDER SUNDERTAKINGS UNDER SUNDERTAKINGS UNDER SUNDERTAKINGS UNDER SECTION 30 OF THE ACTECTION 30 OF THE ACTECTION 30 OF THE ACTECTION 30 OF THE ACT ........................................................................................................................................................................................................................................................................................................................ 43434343
8888 REGULATED WATERREGULATED WATERREGULATED WATERREGULATED WATER ................................................................................................................................................................................................................................................................................................................................................................................................................................................................................................................ 43434343
9999 FURTHER INFORMATIONFURTHER INFORMATIONFURTHER INFORMATIONFURTHER INFORMATION .................................................................................................................................................................................................................................................................................................................................................................................................................................................................................... 43434343
10101010 GLOSSARY OF TERMSGLOSSARY OF TERMSGLOSSARY OF TERMSGLOSSARY OF TERMS .................................................................................................................................................................................................................................................................................................................................................................................................................................................................................................... 44444444
EAST GIPPSLAND WATER: WATER QUALITY ANNUAL REPORT 2013 /2014
Picture on front cover: Woodglen water treatment facility and water storages Document StatusDocument StatusDocument StatusDocument Status
Revision Revision Revision Revision No.No.No.No.
CommentsCommentsCommentsComments Issue DateIssue DateIssue DateIssue Date Prepared ByPrepared ByPrepared ByPrepared By Approved ByApproved ByApproved ByApproved By
1 Draft for Comment (Internal) 22 Aug. 2014 RMK n.a.
2 For approval 29 Aug. 2014 RMK/LC Frank McShane
3 Dept. Health 03 Oct. 2014 Dept. Health/RMK Frank McShane
4 Dept. Health 28 Oct. 2014 RMK/Lara Caplygin
Lara Caplygin

East Gippsland Water: Water Quality Annual Report 2013/2014
Page 4
1111 Introduction Introduction Introduction Introduction
At East Gippsland Water we aim to provide safe and reliable drinking water. This means supplying our customers with water that meets or exceeds all health requirements and ensuring it reaches our customers when they need it.
Last financial year we treated and delivered over 4.7 billion litres. This water was distributed to over 22,500 customer connections across East Gippsland.
In East Gippsland most of the water we deliver to our customers comes from local river systems, but underground aquifers are utilised in our Mallacoota and Mitchell systems to supplement supply. Dinner Plain is our only locality where all drinking water is sourced from local aquifers.
We continue to work with stakeholders (such as East Gippsland Catchment Management Authority) to influence activities undertaken in our catchments. This improves the quality of water before it is processed by our plants and delivered to customer taps as drinking water.
Our drinking water quality consistently performs well against Department of Health standards. Last financial year over 27,000 individual tests were completed to ensure our water met stringent Australian standards. From these tests, all drinking water supplied to our customers was found to be fully compliant during the 2013/2014 financial year.
Each year we continue to improve our supplies through strong investment in new infrastructure as well as maintaining existing infrastructure. We also continue to improve our operational activities to identify and reduce risks. Last year we were audited under the Safe Drinking Water Act 2003, and passed, with no non-conforming issues identified. A number of opportunities for improvement were identified, which we are currently implementing.
In 2013, we received numerous prestigious water industry awards, including one for the best tasting tap water in Victoria. The corporation went into competition with water corporations from across the State in this year’s Orica Victorian Water Taste Test, with a tap water sample from the Bairnsdale area judged the best by an independent panel of experts. The announcement was made at the 76th Annual Victorian Water Industry Operators Conference, where the Best Young Operator of the Year was also named as East Gippsland Water’s Aaron Mitchell - team leader for the operations and maintenance team based at Omeo.
1.1 Characterisation of the SystemCharacterisation of the SystemCharacterisation of the SystemCharacterisation of the System
We supply a region covering approximately 21,000 square kilometres in the far south east corner of Victoria (Figure 1).
The area extends east from Lindenow and Bairnsdale, through Lakes Entrance to Mallacoota near the New South Wales border, and as far north as Dinner Plain in the High Country of the Victorian Alps.
Nine separate water supply systems serve the communities of Bairnsdale, Bemm River, Bruthen, Buchan, Cann River, Dinner Plain, Eagle Point, Johnsonville, Lakes Entrance, Lake Tyers Aboriginal Trust, Lake Tyers Beach, Lindenow, Lindenow South, Mallacoota, Marlo, Metung, Newlands Arm, Newmerella, Nicholson, Nowa Nowa, Omeo, Orbost, Paynesville, Raymond Island, Sarsfield, Swan Reach and Swifts Creek.

East Gippsland Water: Water Quality Annual Report 2013/2014
Page 5
A summary of our water supply and treatment systems is provided in Section 2.1.
Figure 1: East Gippsland Water’s region of operation

East Gippsland Water: Water Quality Annual Report 2013/2014
Page 6
2222 Water Water Water Water TTTTreatment and reatment and reatment and reatment and QQQQuality uality uality uality MMMManagement anagement anagement anagement SSSSystemsystemsystemsystems
As described above, we manage nine separate water supply systems. A detailed summary of these systems is provided in Table 2.1.
To manage these supplies, we have a Drinking Water Quality Risk Management System (after this referred to as ‘the system’) which identifies key risks and ensures they are managed appropriately. Our system has been developed in accordance with Australian Drinking Water Guidelines 2011. An overview of its structure is shown in Figure 2 below.
Internal audits of the system are undertaken routinely to ensure we continually improve our systems. We undertook an external audit at the request of the Department of Health in March-April 2014, and passed, with no non-conforming issues identified (refer to Section 6 for more details).
Figure 2: Structure of the Drinking Water Quality Risk Management System
2.1 SystemSystemSystemSystem SummarySummarySummarySummary
A summary of the methods undertaken to process our drinking water is presented in Table 2.1 below. No significant changes were made to the water treatment processes in our sampling localities in 2013/14.

East Gippsland Water: Water Quality Annual Report 2013/2014
Page 7
Table 2.1 Water sampling locality and treatment summary table
Water Sampling Water Sampling Water Sampling Water Sampling LocalityLocalityLocalityLocality
Population Population Population Population Supplied Supplied Supplied Supplied
(Connections)(Connections)(Connections)(Connections)
Source WaterSource WaterSource WaterSource Water Catchment DescriptionCatchment DescriptionCatchment DescriptionCatchment Description Raw Water StorageRaw Water StorageRaw Water StorageRaw Water Storage Treatment Treatment Treatment Treatment PlantPlantPlantPlant
Treatment processTreatment processTreatment processTreatment process Added substancesAdded substancesAdded substancesAdded substances Comments Comments Comments Comments
Bairnsdale 7,468 Mitchell River
Aquifer (5 bores, seasonal supplemental supply)
Primarily forest (> 90%) with some human, forestry and agricultural impacts some cattle and some septic tanks particularly around the town of Dargo. The non-forested area is around 5-10% of the catchment, but is mostly located near the river banks
Woodglen No. 1 (850ML) & 2 (713ML) storage basins
Woodglen Coagulation, flocculation, clarification (dissolved air flotation), filtration (granular media filter), disinfection, fluoridation
Caustic soda, poly (LT 251 & 272), fluoride3, poly aluminium chlorohydrate3 (PAC 23), chlorine (chlorine dioxide and sodium hypochlorite); fluoride (fluorosilicic acid)3; powder activated carbon4
1LT 25 used for backwash water clarification
2LT 27 used for centrifuge
3Fluoride dosing commenced in August 2010
4Capacity for powder activated carbon addition exists, but is not currently in use
Lindenow 221
Lindenow South 157
Sarsfield-Bruthen 577
Merrangbaur 880
Sunlakes-Toorloo 2,939
Kalimna 643
Eagle Point-Paynesville 3,609
Nicholson-Swan Reach 688
Metung 1,188
Nowa Nowa 101
Buchan 108 Buchan River 80% forest with some
impacts (forestry, agriculture, cattle and camping)
n/a Buchan Coagulation, flocculation, clarification (dissolved air flotation), filtration (granular media filter), disinfection
Caustic soda, poly aluminium chlorohydrate (PAC 23), poly (LT 251), chlorine (sodium hypochlorite)
1LT 25 used for backwash water clarification
Cann River 194 Cann River Forest, agricultural land
(cattle), some septic tanks, roads and logging
n/a Cann River
Swifts Creek 129 Tambo River Forest, agricultural land
(cattle), some septic tanks, roads and logging
4.6ML basin (shade-cloth covered)
Swifts Creek
Bemm River 97 Bemm River 90% forest, with some
forestry, agricultural and human impacts
n/a Bemm River
Orbost 1,985 Brodribb River & Rocky River
90% Forest, with some forestry, agricultural and human impacts
6ML basin Orbost Coagulation, flocculation, clarification (upflow clarifier), filtration (granular media filter), disinfection
Soda ash, poly aluminium chlorohydrate (PAC 23), poly (LT 20), chlorine (sodium hypochlorite)
Nil
Omeo 255
Butchers Creek State forest with minimal human impacts (some grazing)
5ML (shade-cloth covered) and 10ML basin
Omeo
Mallacoota 942
Betka River & Aquifer
(2 bores)
State forest with minimal human impacts (some forestry)
41ML basin (shade-cloth covered)
Mallacoota Caustic soda, poly aluminium chlorohydrate (PAC 23), poly (LT 20 & 251), chlorine (sodium hypochlorite)
1LT 25 used for backwash water clarification
Dinner Plain 383 Aquifer
(2 bores)
Supply is extracted from bores deeper than 70m, with an exclusion zone
700kL tank Dinner Plain Ultraviolet (UV) disinfection Nil Nil

East Gippsland Water: Water Quality Annual Report 2013/2014
Page 8
2.2 System System System System IssuesIssuesIssuesIssues
Our supply systems operated as designed last financial year and no significant issues were identified with their capacity to routinely meet the required water quality standards. No Section 18 or 22 notifications were made to the Department of Health under the Safe Drinking Water Act (2003) during 2013/2014. A summary of the opportunities for improvement identified during the 2014 Drinking Water Quality Regulatory Audit, alongside their current progress, is provided in Section 6.
2.3 System ImprovementsSystem ImprovementsSystem ImprovementsSystem Improvements
Last financial year, the following improvements were made to our systems:
• significant electrical and plant control upgrades took place at the Orbost and Mallacoota water treatment facilities to improve process control and provide drinking water quality assurance into the future
• the aging Aerodrome elevated intermediate water tank was replaced with variable speed drive pumps, thereby removing a potential source of microbiological contamination
• high-pressure cleaning of water mains across our Mitchell, Swifts Creek and Mallacoota water sampling localities
• electrical and control upgrade of Lindenow disinfection plant to minimise the risk of disinfection system failure
• construction of a $640,000 shade cloth cover over a treated water storage in Orbost to improve water quality and reduce evaporation losses
• purchase of emergency generators for key water treatment facilities to ensure continuity and quality of water supply during power outages including our largest facility at Woodglen
• control upgrades across all water treatment plants to reduce the risk of non-disinfected water being supplied to customers.
Figure 3: Orbost water treatment plant shade cloth cover commissioned in 2013/2014

East Gippsland Water: Water Quality Annual Report 2013/2014
Page 9
3333 QuQuQuQuality of Drinking Water for 2013ality of Drinking Water for 2013ality of Drinking Water for 2013ality of Drinking Water for 2013/201/201/201/2014444
3.1 Regulated ParametersRegulated ParametersRegulated ParametersRegulated Parameters---- Escherichia coliEscherichia coliEscherichia coliEscherichia coli (E. coli)(E. coli)(E. coli)(E. coli)
E. coli is a microorganism that may cause illness in susceptible individuals. E. coli is associated with recent contamination of water supplies with faecal material and is therefore considered to be an important indicator of the safety of the water supply. Samples are taken at least weekly in each of the water sampling localities. Compliance is measured as: ≥ 98% of all samples collected in any 12-month period contain no E. coli.
Water Sampling LocalityWater Sampling LocalityWater Sampling LocalityWater Sampling Locality Minimum Minimum Minimum Minimum Sampling Sampling Sampling Sampling
FrequencyFrequencyFrequencyFrequencyaaaa
No. of No. of No. of No. of Samples Samples Samples Samples
takentakentakentaken
Maximum Maximum Maximum Maximum Result Result Result Result
(orgs/100mL)(orgs/100mL)(orgs/100mL)(orgs/100mL)
% samples % samples % samples % samples with no with no with no with no E. coliE. coliE. coliE. coli
Complying Complying Complying Complying (Yes / No)(Yes / No)(Yes / No)(Yes / No)
Bairnsdale Weekly 71 0 100% Yes
Bemm River Weekly 53 0 100% Yes
Buchan Weekly 52 0 100% Yes
Cann River Weekly 53 0 100% Yes
Dinner Plain Weekly 53 0 100% Yes
Eagle Point- Paynesville Weekly 52 0 100% Yes
Kalimna Weekly 52 0 100% Yes
Lindenow Weekly 52 0 100% Yes
Lindenow South Weekly 52 0 100% Yes
Mallacoota Weekly 53 0 100% Yes
Merrangbaur Weekly 52 0 100% Yes
Metung Weekly 52 0 100% Yes
Nicholson-Swan Reach Weekly 52 0 100% Yes
Nowa Nowa Weekly 52 0 100% Yes
Omeo Weekly 53 0 100% Yes
Orbost Weekly 53 0 100% Yes
Sarsfield-Bruthen Weekly 53 0 100% Yes
Sunlakes-Toorloo Weekly 57 0 100% Yes
Swifts Creek Weekly 53 0 100% Yes aAdditional samples may be recorded due to population size (both fixed and seasonal) and the number of sampling days per calendar year.
3.1.1 Comments on results
All water quality sampling localities were compliant for the E. coli water quality standard for the 2013/2014 reporting period.

East Gippsland Water: Water Quality Annual Report 2013/2014
Page 10
3.2 Regulated ParametersRegulated ParametersRegulated ParametersRegulated Parameters---- TrihalomethanesTrihalomethanesTrihalomethanesTrihalomethanes
Trihalomethanes are compounds that may be produced when chlorine disinfectant reacts with organic material present in the water. These compounds may impact public health if they are present in drinking water in high concentrations over a long period of time. Samples are taken monthly in each of the water sampling localities. Compliance is measured as: trihalomethanes < 0.25 milligrams per litre.
Water Sampling LocalityWater Sampling LocalityWater Sampling LocalityWater Sampling Locality Sampling Sampling Sampling Sampling FrequencyFrequencyFrequencyFrequency
No. of No. of No. of No. of SamplesSamplesSamplesSamples
No. of NonNo. of NonNo. of NonNo. of Non----CCCComplying omplying omplying omplying SSSSamplesamplesamplesamples
Maximum Maximum Maximum Maximum (mg/L)(mg/L)(mg/L)(mg/L)
Complying Complying Complying Complying (Yes / No)(Yes / No)(Yes / No)(Yes / No)
Bairnsdale Monthly 12 0 0.053 Yes
Bemm River Monthly 12 0 0.033 Yes
Buchan Monthly 12 0 0.080 Yes
Cann River Monthly 12 0 0.037 Yes
Dinner Plain n/aa n/aa n/aa n/aa n/aa
EaglePoint- Paynesville Monthly 12 0 0.058 Yes
Kalimna Monthly 12 0 0.068 Yes
Lindenow Monthly 12 0 0.031 Yes
Lindenow South Monthly 12 0 0.033 Yes
Mallacoota Monthly 12 0 0.094 Yes
Merrangbaur Monthly 12 0 0.072 Yes
Metung Monthly 12 0 0.070 Yes
Nicholson-Swan Reach Monthly 12 0 0.064 Yes
Nowa Nowa Monthly 12 0 0.093 Yes
Omeo Monthly 12 0 0.051 Yes
Orbost Monthly 12 0 0.062 Yes
Sarsfield-Bruthen Monthly 12 0 0.058 Yes
Sunlakes-Toorloo Monthly 12 0 0.080 Yes
Swifts Creek Monthly 12 0 0.058 Yes
an/a– not applicable; Dinner Plain water sampling locality is not sampled for chlorine-based disinfection by-products as ultra-violet disinfection is employed in place of chlorine.
3.2.1 Comments on results
All water quality sampling localities were compliant for the trihalomethane water quality standard for the 2013/2014 reporting period.

East Gippsland Water: Water Quality Annual Report 2013/2014
Page 11
3.3 Regulated Parameters Regulated Parameters Regulated Parameters Regulated Parameters ---- Chloroacetic acidChloroacetic acidChloroacetic acidChloroacetic acid
Chloroacetic acid is a compound that may be produced when chlorine disinfectant reacts with organic material that may be present in the water. These compounds may impact public health if they are present in drinking water in high concentrations over a long period of time. Samples are taken monthly in each of the water sampling localities. Compliance is measured as: chloroacetic acid < 0.15 milligrams per litre.
Water Sampling Water Sampling Water Sampling Water Sampling LocalityLocalityLocalityLocality
Sampling Sampling Sampling Sampling FrequencyFrequencyFrequencyFrequency
No. of No. of No. of No. of SamplesSamplesSamplesSamples
No. of NonNo. of NonNo. of NonNo. of Non----Complying Complying Complying Complying SamplesSamplesSamplesSamples
Maximum Maximum Maximum Maximum (mg/L)(mg/L)(mg/L)(mg/L)
Complying Complying Complying Complying (Yes / No)(Yes / No)(Yes / No)(Yes / No)
Bairnsdale Monthly 12 0 0.005 Yes
Bemm River Monthly 12 0 0.005 Yes
Buchan Monthly 12 0 0.005 Yes
Cann River Monthly 12 0 0.005 Yes
Dinner Plain n/aa n/aa n/aa n/aa n/aa
Eagle Point- Paynesville Monthly 12 0 0.005 Yes
Kalimna Monthly 12 0 0.005 Yes
Lindenow Monthly 12 0 0.005 Yes
Lindenow South Monthly 12 0 0.005 Yes
Mallacoota Monthly 12 0 0.005 Yes
Merrangbaur Monthly 12 0 0.005 Yes
Metung Monthly 12 0 0.005 Yes
Nicholson-Swan Reach Monthly 12 0 0.005 Yes
Nowa Nowa Monthly 12 0 0.005 Yes
Omeo Monthly 12 0 0.005 Yes
Orbost Monthly 12 0 0.005 Yes
Sarsfield-Bruthen Monthly 12 0 0.005 Yes
Sunlakes-Toorloo Monthly 12 0 0.005 Yes
Swifts Creek Monthly 12 0 0.005 Yes
an/a– not applicable; Dinner Plain water sampling locality is not sampled for chlorine-based disinfection by-products as ultra-violet disinfection is employed in place of chlorine.
3.3.1 Comments on results
All water quality sampling localities were compliant for the chloroacetic acid water quality standard for the 2013/2014 reporting period.

East Gippsland Water: Water Quality Annual Report 2013/2014
Page 12
3.4 Regulated ParametersRegulated ParametersRegulated ParametersRegulated Parameters---- Dichloroacetic acidDichloroacetic acidDichloroacetic acidDichloroacetic acid
Dichloroacetic acid is a compound that may be produced when chlorine disinfectant reacts with organic material present in the water. These compounds may impact public health if they are present in drinking water in high concentrations over a long period of time. Samples are taken monthly in each of the water sampling localities. Compliance is measured as: dichloroacetic acid < 0.1 milligrams per litre.
Water Sampling LocalityWater Sampling LocalityWater Sampling LocalityWater Sampling Locality Sampling Sampling Sampling Sampling FrequencyFrequencyFrequencyFrequency
No. of No. of No. of No. of SamplesSamplesSamplesSamples
No. of NonNo. of NonNo. of NonNo. of Non----Complying Complying Complying Complying SamplesSamplesSamplesSamples
Maximum Maximum Maximum Maximum (mg/L)(mg/L)(mg/L)(mg/L)
Complying Complying Complying Complying (Yes / No)(Yes / No)(Yes / No)(Yes / No)
Bairnsdale Monthly 12 0 0.016 Yes
Bemm River Monthly 12 0 0.005 Yes
Buchan Monthly 12 0 0.008 Yes
Cann River Monthly 12 0 0.005 Yes
Dinner Plain n/aa n/aa n/aa n/aa n/aa
Eagle Point- Paynesville Monthly 12 0 0.014 Yes
Kalimna Monthly 12 0 0.013 Yes
Lindenow Monthly 12 0 0.005 Yes
Lindenow South Monthly 12 0 0.007 Yes
Mallacoota Monthly 12 0 0.010 Yes
Merrangbaur Monthly 12 0 0.010 Yes
Metung Monthly 12 0 0.005 Yes
Nicholson-Swan Reach Monthly 12 0 0.013 Yes
Nowa Nowa Monthly 12 0 0.010 Yes
Omeo Monthly 12 0 0.017 Yes
Orbost Monthly 12 0 0.012 Yes
Sarsfield-Bruthen Monthly 12 0 0.009 Yes
Sunlakes-Toorloo Monthly 12 0 0.015 Yes
Swifts Creek Monthly 12 0 0.016 Yes
an/a– not applicable; Dinner Plain water sampling locality is not sampled for chlorine-based disinfection by-products as ultra-violet disinfection is employed in place of chlorine.
3.4.1 Comments on results
All water quality sampling localities were compliant for the dichloroacetic acid water quality standard for the 2013/2014 reporting period.

East Gippsland Water: Water Quality Annual Report 2013/2014
Page 13
3.5 Regulated ParametersRegulated ParametersRegulated ParametersRegulated Parameters---- Trichloroacetic acidTrichloroacetic acidTrichloroacetic acidTrichloroacetic acid
Trichloroacetic acid is a compound that may be produced when chlorine disinfectant reacts with organic material that may be present in the water. These compounds may impact public health if they are present in drinking water in high concentrations over a long period of time. Samples are taken monthly in each of the water sampling localities. Compliance is measured as: trichloroacetic acid < 0.1 milligrams per litre.
Water Sampling Water Sampling Water Sampling Water Sampling LocalityLocalityLocalityLocality
Sampling Sampling Sampling Sampling FrequencyFrequencyFrequencyFrequency
No. of No. of No. of No. of SamplesSamplesSamplesSamples
No. of NonNo. of NonNo. of NonNo. of Non----Complying Complying Complying Complying SamplesSamplesSamplesSamples
Maximum Maximum Maximum Maximum (mg/L)(mg/L)(mg/L)(mg/L)
Complying Complying Complying Complying (Yes / No)(Yes / No)(Yes / No)(Yes / No)
Bairnsdale Monthly 12 0 0.011 Yes
Bemm River Monthly 12 0 0.005 Yes
Buchan Monthly 12 0 0.015 Yes
Cann River Monthly 12 0 0.005 Yes
Dinner Plain n/aa n/aa n/aa n/aa n/aa
Eagle Point- Paynesville Monthly 12 0 0.013 Yes
Kalimna Monthly 12 0 0.016 Yes
Lindenow Monthly 12 0 0.007 Yes
Lindenow South Monthly 12 0 0.007 Yes
Mallacoota Monthly 12 0 0.009 Yes
Merrangbaur Monthly 12 0 0.019 Yes
Metung Monthly 12 0 0.014 Yes
Nicholson-Swan Reach Monthly 12 0 0.014 Yes
Nowa Nowa Monthly 12 0 0.021 Yes
Omeo Monthly 12 0 0.018 Yes
Orbost Monthly 12 0 0.011 Yes
Sarsfield-Bruthen Monthly 12 0 0.013 Yes
Sunlakes-Toorloo Monthly 12 0 0.018 Yes
Swifts Creek Monthly 12 0 0.018 Yes
an/a– not applicable; Dinner Plain water sampling locality is not sampled for chlorine-based disinfection by-products as ultra-violet disinfection is employed in place of chlorine.
3.5.1 Comments on results
All water quality sampling localities were compliant for the trichloroacetic acid water quality standard for the 2013/2014 reporting period.

East Gippsland Water: Water Quality Annual Report 2013/2014
Page 14
3.6 Regulated ParametersRegulated ParametersRegulated ParametersRegulated Parameters---- Aluminium (acid soluble)Aluminium (acid soluble)Aluminium (acid soluble)Aluminium (acid soluble)
Aluminium-based compounds are used to assist the water treatment process to ensure high quality, safe drinking water is produced. Acid-soluble aluminium may be present in trace amounts following the water treatment process. Long-term exposure to high concentrations of this compound may impact public health. Samples are taken monthly in each of the water sampling localities. Compliance is measured as: aluminium (acid soluble) < 0.2 milligrams per litre.
Water Sampling Water Sampling Water Sampling Water Sampling LocalityLocalityLocalityLocality
Minimum Minimum Minimum Minimum Sampling Sampling Sampling Sampling
FrequencyFrequencyFrequencyFrequencyaaaa
No. of No. of No. of No. of SamplesSamplesSamplesSamples
No. of NonNo. of NonNo. of NonNo. of Non----Complying Complying Complying Complying SamplesSamplesSamplesSamples
Maximum Maximum Maximum Maximum (mg/L)(mg/L)(mg/L)(mg/L)
Complying Complying Complying Complying (Yes / No)(Yes / No)(Yes / No)(Yes / No)
Bairnsdale Monthly 12 0 0.02 Yes
Bemm River Monthly 12 0 0.03 Yes
Buchan Monthly 12 0 0.06 Yes
Cann River Monthly 12 0 0.08 Yes
Dinner Plain n/aa n/aa n/aa n/aa n/aa
Eagle Point- Paynesville Monthly 12 0 0.02 Yes
Kalimna Monthly 12 0 0.02 Yes
Lindenow Monthly 12 0 0.02 Yes
Lindenow South Monthly 12 0 0.02 Yes
Mallacoota Monthly 12 0 0.01 Yes
Merrangbaur Monthly 12 0 0.02 Yes
Metung Monthly 12 0 0.02 Yes
Nicholson-Swan Reach Monthly 12 0 0.02 Yes
Nowa Nowa Monthly 12 0 0.03 Yes
Omeo Monthly 12 0 0.02 Yes
Orbost Monthly 12 0 0.07 Yes
Sarsfield-Bruthen Monthly 12 0 0.02 Yes
Sunlakes-Toorloo Monthly 12 0 0.02 Yes
Swifts Creek Monthly 12 0 0.07 Yes
an/a– not applicable; Dinner Plain water sampling locality is exempt from aluminium testing requirements as aluminium-based compounds are not used for treatment within this locality.
3.6.1 Comments on results
All water quality sampling localities were compliant for the acid soluble aluminium water quality standard for the 2013/2014 reporting period.

East Gippsland Water: Water Quality Annual Report 2013/2014
Page 15
3.7 Regulated ParametersRegulated ParametersRegulated ParametersRegulated Parameters---- TurbidityTurbidityTurbidityTurbidity
Turbidity measures the presence of fine suspended material present in the water and may result in the ‘cloudy’ appearance of water. Turbidity is an indirect indicator for the general quality of water and may represent fine particles such as clays, minerals or microscopic organisms. Samples are taken monthly in each of the water sampling localities. Compliance is measured as: 95% upper confidence limit (UCL) of the mean ≤ 5.0 nephelometiric turbidity units (NTU).
Water Sampling Water Sampling Water Sampling Water Sampling LocalityLocalityLocalityLocality
Minimum Minimum Minimum Minimum Sampling Sampling Sampling Sampling
FrequencyFrequencyFrequencyFrequencyaaaa
No. of No. of No. of No. of SamplesSamplesSamplesSamples
MaxMaxMaxMaximumimumimumimum (NTU)(NTU)(NTU)(NTU)
95% UCL of 95% UCL of 95% UCL of 95% UCL of mean mean mean mean
Complying Complying Complying Complying (Yes / No)(Yes / No)(Yes / No)(Yes / No)
Bairnsdale Weekly 71 0.2 0.1 Yes
Bemm River Weekly 53 1.4 0.7 Yes
Buchan Weekly 52 0.4 0.1 Yes
Cann River Weekly 53 1.3 0.4 Yes
Dinner Plain Weekly 53 0.6 0.1 Yes
Eagle Point-Paynesville
Weekly 52 0.1 0.1 Yes
Kalimna Weekly 52 0.1 0.1 Yes
Lindenow Weekly 52 0.7 0.2 Yes
Lindenow South Weekly 52 0.7 0.1 Yes
Mallacoota Weekly 53 0.8 0.3 Yes
Merrangbaur Weekly 52 0.2 0.1 Yes
Metung Weekly 52 0.4 0.1 Yes
Nicholson-Swan Reach Weekly 52 0.6 0.1 Yes
Nowa Nowa Weekly 52 0.1 0.1 Yes
Omeo Weekly 53 1.1 0.2 Yes
Orbost Weekly 53 1.1 0.2 Yes
Sarsfield-Bruthen Weekly 53 0.1 0.1 Yes
Sunlakes-Toorloo Weekly 57 0.3 0.1 Yes
Swifts Creek Weekly 53 0.4 0.1 Yes aAdditional samples may be recorded due to population size (both fixed and seasonal) and the number of sampling days per calendar year.
3.7.1 Comments on results
All water quality locations were compliant for the turbidity water quality standard for the 2013/2014 reporting period.

East Gippsland Water: Water Quality Annual Report 2013/2014
Page 16
3.8 FluorideFluorideFluorideFluoride
Fluoride is added to the water sampling localities in the Mitchell system to promote oral health under direction of the Victorian Department of Health. Fluoride samples are taken monthly in each of the fluoridated water sampling localities, such that a weekly sample is taken at different locations in the fluoridated Mitchell system.
Complying is measured as: annual average fluoride level must not exceed 1 milligram per litre and all individual samples must be < 1.5 milligram per litre.
Meeting Obligation is measured as: annual average fluoride level > 0.6 milligram per litre in fluoridated systems.
Water Water Water Water Sampling Sampling Sampling Sampling LocalityLocalityLocalityLocality
SamplSamplSamplSampling ing ing ing FrequencyFrequencyFrequencyFrequency
Operating Operating Operating Operating Target Target Target Target (mg/L)(mg/L)(mg/L)(mg/L)
No. of No. of No. of No. of SamplesSamplesSamplesSamples
Min. Min. Min. Min. (mg/L)(mg/L)(mg/L)(mg/L)
Max. Max. Max. Max. (mg/L) (mg/L) (mg/L) (mg/L)
Average Average Average Average (mg/L)(mg/L)(mg/L)(mg/L)
Complying Complying Complying Complying (Yes/No)(Yes/No)(Yes/No)(Yes/No)
Meeting Meeting Meeting Meeting ObligationObligationObligationObligation (Yes/No)(Yes/No)(Yes/No)(Yes/No)
Bairnsdaleb Monthly 0.9 12 0.82 0.90 0.87 Yes Yes
Bemm River Biannually n/aa 2 0.05 0.05 0.05 Yes n/aa
Buchan Biannually n/aa 2 0.05 0.06 0.06 Yes n/aa
Cann River Biannually n/aa 2 0.05 0.05 0.05 Yes n/aa
Dinner Plain Biannually n/aa 2 0.05 0.05 0.05 Yes n/aa
Eagle Point-
Paynesvilleb Monthly 0.9 12 0.72 0.90 0.88 Yes Yes
Kalimnab Monthly 0.9 12 0.84 0.88 0.87 Yes Yes
Lindenowb Monthly 0.9 12 0.78 0.91 0.85 Yes Yes
Lindenow
Southb Monthly 0.9 12 0.79 0.91 0.84 Yes Yes
Mallacoota Biannually n/aa 2 0.05 0.06 0.06 Yes n/aa
Merrangbaurb Monthly 0.9 12 0.80 0.89 0.86 Yes Yes
Metungb Monthly 0.9 12 0.79 0.90 0.86 Yes Yes
Nicholson-
Swan Reachb Monthly 0.9 12 0.79 0.90 0.87 Yes Yes
Nowa Nowab Monthly 0.9 12 0.80 0.92 0.86 Yes Yes
Omeo Biannually n/aa 2 0.05 0.05 0.05 Yes n/aa
Orbost Biannually n/aa 2 0.05 0.05 0.05 Yes n/aa
Sarsfield-
Bruthenb Monthly 0.9 12 0.66 0.90 0.86 Yes Yes
Sunlakes-
Toorloob Monthly 0.9 12 0.80 0.90 0.86 Yes Yes
Swifts Creek Biannually n/aa 2 0.07 0.11 0.09 Yes n/aa an/a – not applicable as these systems are not fluoridated.
bIndicates fluoridated water sampling localities.

East Gippsland Water: Water Quality Annual Report 2013/2014
Page 17
3.8.1 Comments on results
All water quality locations were compliant for fluoride for the 2013/2014 reporting period. East Gippsland Water has been 100% compliant for this standard at each fluoridated sampling locality since fluoridation began in 2010.
Low level fluoride detected in non-fluoridated water sampling localities is due the natural occurrence of fluoride in source waters.

East Gippsland Water: Water Quality Annual Report 2013/2014
Page 18
3.9 Other SubstancesOther SubstancesOther SubstancesOther Substances---- Blue green algae Blue green algae Blue green algae Blue green algae
Blue green algae (or ‘cyanobacteria’) are microscopic organisms that may thrive in warm, nutrient rich waters. They may impact water quality by releasing taste and odour compounds. In some extreme circumstances, these organisms may release concentrations of toxins that may impact public health. Samples are taken seasonally in each of the relevant water sampling localities. In addition to routine monitoring samples, additional samples may be taken to monitor the progression of algal growth during the summer/autumn seasons.
The Department of Health must be notified under section 22 of the Safe Drinking Water Act 2003 if any of the following are true:
• total microcystins are detected at greater than or equal to 1.3 micrograms per litre
• Microcystis aeruginosa is present at greater than or equal to 6,500 cells per millilitre
• total combined biovolume of known toxic cyanobacterial species is greater than or equal to 0.6 millimetres cubed per litre
• total combined biovolume of all cyanobacterial species is greater than or equal to 10 millimetres cubed per litre.
Raw Water StorageRaw Water StorageRaw Water StorageRaw Water Storagessss Clear Water StorageClear Water StorageClear Water StorageClear Water Storagessss
Water Sampling LocalityWater Sampling LocalityWater Sampling LocalityWater Sampling Locality No. of SamplesNo. of SamplesNo. of SamplesNo. of Samples Maximum Maximum Maximum Maximum (mm(mm(mm(mm3333/L)/L)/L)/L)
No. of SamplesNo. of SamplesNo. of SamplesNo. of Samples Maximum Maximum Maximum Maximum (mm(mm(mm(mm3333/L)/L)/L)/L)
Bairnsdale 64 0.494 12 0.000
Bemm River n/aa n/aa 12 0.056
Buchan n/aa n/aa n/aa n/aa
Cann River n/aa n/aa 12 0.170
Dinner Plain n/aa n/aa n/aa n/aa
Eagle Point- Paynesville n/aa n/aa n/aa n/aa
Kalimna n/aa n/aa n/aa n/aa
Lindenow n/aa n/aa 12 0.001
Lindenow South n/aa n/aa n/aa n/aa
Mallacoota 12 0.014 12 0.003
Merrangbaur n/aa n/aa 12 0.005
Metung n/aa n/aa n/aa n/aa
Nicholson-Swan Reach n/aa n/aa n/aa n/aa
Nowa Nowa n/aa n/aa n/aa n/aa
Omeo 26 0.742 n/aa n/aa
Orbost 33 0.071 24 0.055
Sarsfield-Bruthen n/aa n/aa n/aa n/aa
Sunlakes-Toorloo n/aa n/aa 12 0.001
Swifts Creek 12 0.015 n/aa n/aa an/a – not applicable; this may be due to the absence of the specified storage within this locality, or due to the low risk from algal growth due to the presence of a fully sealed storage tank.

East Gippsland Water: Water Quality Annual Report 2013/2014
Page 19
3.9.1 Comments on results
No samples exceeded the reporting criteria for Section 22 of the Safe Drinking Water Act (2003) in 2013/2014.
Any blue green algae biovolumes > 0.200 millimetres cubed per litre were reported to the Department of Environment and Primary Industries Blue Green Algae Circular (2013-14).

East Gippsland Water: Water Quality Annual Report 2013/2014
Page 20
3.10 Other SubstancesOther SubstancesOther SubstancesOther Substances---- Cadmium Cadmium Cadmium Cadmium
Cadmium may be introduced into drinking water supplies through pipes and fittings. Exposure to high concentrations of cadmium may result in potential health implications. Samples are taken quarterly in each of the water sampling localities. The health-based guideline is ≤ 0.002 milligrams per litre (Australian Drinking Water Guidelines 2011).
Water Sampling LocalityWater Sampling LocalityWater Sampling LocalityWater Sampling Locality FrequencyFrequencyFrequencyFrequency No. of No. of No. of No. of SamplesSamplesSamplesSamples
No. No. No. No. of Samplesof Samplesof Samplesof Samples Exceeding Exceeding Exceeding Exceeding GuidelinesGuidelinesGuidelinesGuidelines
Maximum Maximum Maximum Maximum (mg/L)(mg/L)(mg/L)(mg/L)
Meets Meets Meets Meets GuidelineGuidelineGuidelineGuideline (Yes / No)(Yes / No)(Yes / No)(Yes / No)
Bairnsdale Quarterly 4 0 0.0002 Yes
Bemm River Quarterly 4 0 0.0002 Yes
Buchan Quarterly 4 0 0.0002 Yes
Cann River Quarterly 4 0 0.0002 Yes
Dinner Plain Quarterly 4 0 0.0002 Yes
Eagle Point- Paynesville Quarterly 4 0 0.0002 Yes
Kalimna Quarterly 4 0 0.0002 Yes
Lindenow Quarterly 4 0 0.0002 Yes
Lindenow South Quarterly 4 0 0.0002 Yes
Mallacoota Quarterly 4 0 0.0002 Yes
Merrangbaur Quarterly 4 0 0.0002 Yes
Metung Quarterly 4 0 0.0002 Yes
Nicholson-Swan Reach Quarterly 4 0 0.0002 Yes
Nowa Nowa Quarterly 4 0 0.0002 Yes
Omeo Quarterly 4 0 0.0002 Yes
Orbost Quarterly 4 0 0.0002 Yes
Sarsfield-Bruthen Quarterly 4 0 0.0002 Yes
Sunlakes-Toorloo Quarterly 4 0 0.0002 Yes
Swifts Creek Quarterly 4 0 0.0002 Yes
3.10.1 Comments on results
All water quality locations were compliant for cadmium for the 2013/2014 reporting period.

East Gippsland Water: Water Quality Annual Report 2013/2014
Page 21
3.11 Other SubstancesOther SubstancesOther SubstancesOther Substances---- ChromiumChromiumChromiumChromium
Chromium may occur naturally in the environment or be introduced through human activity. Samples are taken quarterly in each of the water sampling localities. The health-based guideline value is ≤ 0.05 milligrams per litre of Cr(VI) (Australian Drinking Water Guidelines 2011).
Water Sampling Water Sampling Water Sampling Water Sampling LocalityLocalityLocalityLocality
Sampling Sampling Sampling Sampling FrequencyFrequencyFrequencyFrequency
No. of No. of No. of No. of SamplesSamplesSamplesSamples
No. No. No. No. of of of of SamplesSamplesSamplesSamples
Exceeding Exceeding Exceeding Exceeding GuidelinesGuidelinesGuidelinesGuidelines
Maximum Maximum Maximum Maximum (mg/L)(mg/L)(mg/L)(mg/L)
Meets Meets Meets Meets GuidelineGuidelineGuidelineGuideline (Yes / No)(Yes / No)(Yes / No)(Yes / No)
Bairnsdale Quarterly 4 0 0.001 Yes
Bemm River Quarterly 4 0 0.001 Yes
Buchan Quarterly 4 0 0.001 Yes
Cann River Quarterly 4 0 0.001 Yes
Dinner Plain Quarterly 4 0 0.001 Yes
Eagle Point- Paynesville
Quarterly 4 0 0.001 Yes
Kalimna Quarterly 4 0 0.001 Yes
Lindenow Quarterly 4 0 0.001 Yes
Lindenow South Quarterly 4 0 0.001 Yes
Mallacoota Quarterly 4 0 0.001 Yes
Merrangbaur Quarterly 4 0 0.001 Yes
Metung Quarterly 4 0 0.001 Yes
Nicholson-Swan Reach Quarterly 4 0 0.001 Yes
Nowa Nowa Quarterly 4 0 0.001 Yes
Omeo Quarterly 4 0 0.001 Yes
Orbost Quarterly 4 0 0.001 Yes
Sarsfield-Bruthen Quarterly 4 0 0.001 Yes
Sunlakes-Toorloo Quarterly 4 0 0.001 Yes
Swifts Creek Quarterly 4 0 0.001 Yes
3.11.1 Comments on results
All water quality localities were compliant for chromium for the 2013/2014 reporting period.
East Gippsland Water: Water Quality Annual Report 2013/2014
Page 22
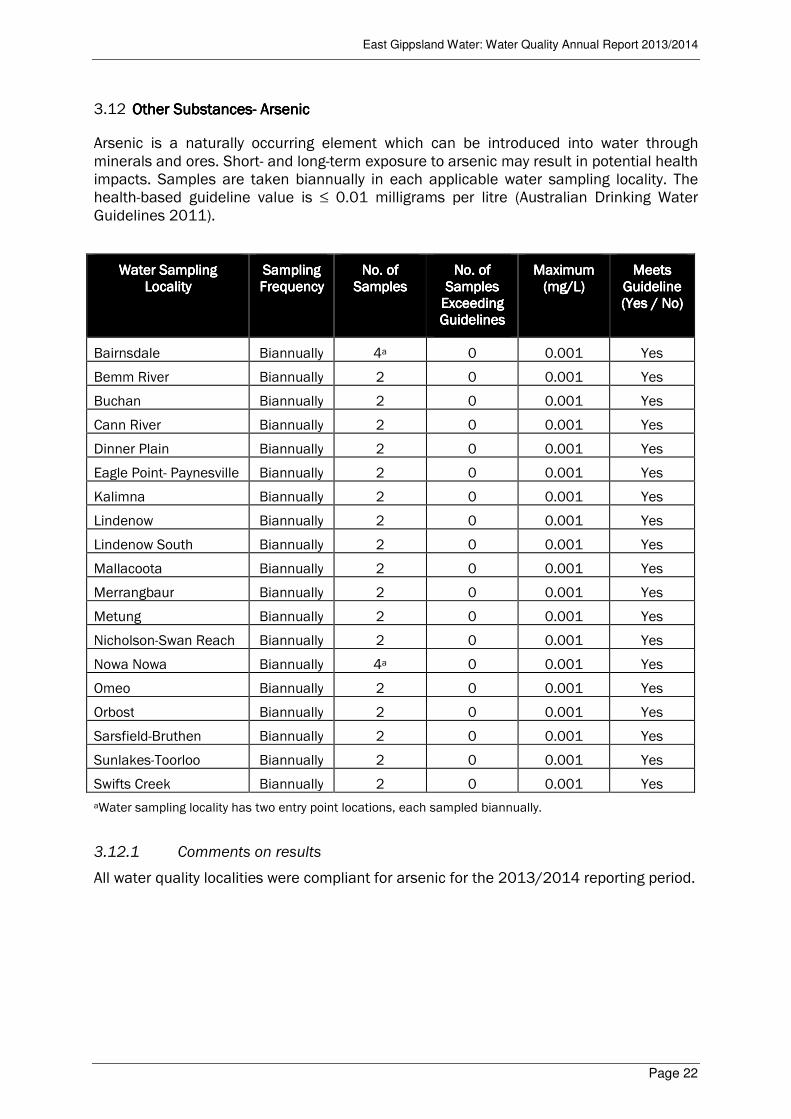
3.12 Other SubstancesOther SubstancesOther SubstancesOther Substances---- Arsenic Arsenic Arsenic Arsenic
Arsenic is a naturally occurring element which can be introduced into water through minerals and ores. Short- and long-term exposure to arsenic may result in potential health impacts. Samples are taken biannually in each applicable water sampling locality. The health-based guideline value is ≤ 0.01 milligrams per litre (Australian Drinking Water Guidelines 2011).
Water SWater SWater SWater Sampling ampling ampling ampling LocalityLocalityLocalityLocality
Sampling Sampling Sampling Sampling FrequencyFrequencyFrequencyFrequency
No. of No. of No. of No. of SamplesSamplesSamplesSamples
No. No. No. No. of of of of SamplesSamplesSamplesSamples
Exceeding Exceeding Exceeding Exceeding GuidelinesGuidelinesGuidelinesGuidelines
Maximum Maximum Maximum Maximum (mg/L)(mg/L)(mg/L)(mg/L)
Meets Meets Meets Meets GuidelineGuidelineGuidelineGuideline (Yes / No)(Yes / No)(Yes / No)(Yes / No)
Bairnsdale Biannually 4a 0 0.001 Yes
Bemm River Biannually 2 0 0.001 Yes
Buchan Biannually 2 0 0.001 Yes
Cann River Biannually 2 0 0.001 Yes
Dinner Plain Biannually 2 0 0.001 Yes
Eagle Point- Paynesville Biannually 2 0 0.001 Yes
Kalimna Biannually 2 0 0.001 Yes
Lindenow Biannually 2 0 0.001 Yes
Lindenow South Biannually 2 0 0.001 Yes
Mallacoota Biannually 2 0 0.001 Yes
Merrangbaur Biannually 2 0 0.001 Yes
Metung Biannually 2 0 0.001 Yes
Nicholson-Swan Reach Biannually 2 0 0.001 Yes
Nowa Nowa Biannually 4a 0 0.001 Yes
Omeo Biannually 2 0 0.001 Yes
Orbost Biannually 2 0 0.001 Yes
Sarsfield-Bruthen Biannually 2 0 0.001 Yes
Sunlakes-Toorloo Biannually 2 0 0.001 Yes
Swifts Creek Biannually 2 0 0.001 Yes
aWater sampling locality has two entry point locations, each sampled biannually.
3.12.1 Comments on results
All water quality localities were compliant for arsenic for the 2013/2014 reporting period.

East Gippsland Water: Water Quality Annual Report 2013/2014
Page 23
3.13 Other SubstancesOther SubstancesOther SubstancesOther Substances---- Cyanide Cyanide Cyanide Cyanide
Cyanide may occur naturally in the environment or be introduced through human activity. Testing for cyanide is performed biannually in each applicable water sampling locality. The health-based guideline value is ≤ 0.08 milligram per litre (health-based guideline value under the Australian Drinking Water Guidelines 2011).
Water Sampling LocaWater Sampling LocaWater Sampling LocaWater Sampling Localitylitylitylity Sampling Sampling Sampling Sampling FrequencyFrequencyFrequencyFrequency
No. of No. of No. of No. of SamplesSamplesSamplesSamples
No. No. No. No. of of of of SamplesSamplesSamplesSamples
Exceeding Exceeding Exceeding Exceeding GuidelinesGuidelinesGuidelinesGuidelines
Maximum Maximum Maximum Maximum (mg/L)(mg/L)(mg/L)(mg/L)
Meets Meets Meets Meets GuidelineGuidelineGuidelineGuideline (Yes / No)(Yes / No)(Yes / No)(Yes / No)
Bairnsdale Biannually 4a 0 0.005 Yes
Bemm River Biannually 2 0 0.005 Yes
Buchan Biannually 2 0 0.005 Yes
Cann River Biannually 2 0 0.005 Yes
Dinner Plain Biannually 2 0 0.005 Yes
Eagle Point- Paynesville Biannually 2 0 0.005 Yes
Kalimna Biannually 2 0 0.005 Yes
Lindenow Biannually 2 0 0.005 Yes
Lindenow South Biannually 2 0 0.005 Yes
Mallacoota Biannually 2 0 0.005 Yes
Merrangbaur Biannually 2 0 0.005 Yes
Metung Biannually 2 0 0.005 Yes
Nicholson-Swan Reach Biannually 2 0 0.005 Yes
Nowa Nowa Biannually 4a 0 0.005 Yes
Omeo Biannually 2 0 0.005 Yes
Orbost Biannually 2 0 0.005 Yes
Sarsfield-Bruthen Biannually 2 0 0.005 Yes
Sunlakes-Toorloo Biannually 2 0 0.005 Yes
Swifts Creek Biannually 2 0 0.005 Yes
aWater Sampling locality has two entry point locations, each sampled biannually.
3.13.1 Comments on results
All water quality localities were compliant for cyanide for the 2013/2014 reporting period.

East Gippsland Water: Water Quality Annual Report 2013/2014
Page 24
3.14 Other SubstancesOther SubstancesOther SubstancesOther Substances---- Copper Copper Copper Copper
Copper may occur naturally in the environment or be introduced into water through contact with copper pipes and fittings. Samples are taken quarterly in each applicable water sampling locality. The health-based guideline value is ≤ 2 mg/L and the aesthetic guideline value is ≤ 1 milligram per litre (Australian Drinking Water Guidelines 2011).
Water Sampling LocalityWater Sampling LocalityWater Sampling LocalityWater Sampling Locality Sampling Sampling Sampling Sampling FrequencyFrequencyFrequencyFrequency
No. of No. of No. of No. of SamplesSamplesSamplesSamples
No. No. No. No. of of of of SamplesSamplesSamplesSamples
Exceeding Exceeding Exceeding Exceeding GuidelinesGuidelinesGuidelinesGuidelines
Maximum Maximum Maximum Maximum (mg/L)(mg/L)(mg/L)(mg/L)
Meets Meets Meets Meets GuidelineGuidelineGuidelineGuideline (Yes / No)(Yes / No)(Yes / No)(Yes / No)
Bairnsdale Quarterly 4 0 0.019 Yes
Bemm River Quarterly 4 0 0.014 Yes
Buchan Quarterly 4 0 0.002 Yes
Cann River Quarterly 4 0 0.001 Yes
Dinner Plain Quarterly 4 0 0.230 Yes
Eagle Point- Paynesville Quarterly 4 0 0.005 Yes
Kalimna Quarterly 4 0 0.012 Yes
Lindenow Quarterly 4 0 0.019 Yes
Lindenow South Quarterly 4 0 0.015 Yes
Mallacoota Quarterly 4 0 0.001 Yes
Merrangbaur Quarterly 4 0 0.008 Yes
Metung Quarterly 4 0 0.001 Yes
Nicholson-Swan Reach Quarterly 4 0 0.005 Yes
Nowa Nowa Quarterly 4 0 0.005 Yes
Omeo Quarterly 4 0 0.004 Yes
Orbost Quarterly 4 0 0.001 Yes
Sarsfield-Bruthen Quarterly 4 0 0.063 Yes
Sunlakes-Toorloo Quarterly 4 0 0.008 Yes
Swifts Creek Quarterly 4 0 0.012 Yes
3.14.1 Comments on results
All water quality localities were compliant for copper for the 2013/2014 reporting period.

East Gippsland Water: Water Quality Annual Report 2013/2014
Page 25
3.15 Other SubstancesOther SubstancesOther SubstancesOther Substances---- Lead Lead Lead Lead
Lead may occur naturally in water or be introduced through contact with lead pipes and joint fittings. Human exposure to high levels of lead may result in toxic effects. Samples are taken quarterly in each applicable water sampling locality. The health-based guideline value is ≤ 0.01 milligram per litre (Australian Drinking Water Guidelines 2011).
Water Sampling LocalityWater Sampling LocalityWater Sampling LocalityWater Sampling Locality Sampling Sampling Sampling Sampling FrequencyFrequencyFrequencyFrequency
No. of No. of No. of No. of SamplesSamplesSamplesSamples
No. No. No. No. of of of of SamplesSamplesSamplesSamples
Exceeding Exceeding Exceeding Exceeding GuidelinesGuidelinesGuidelinesGuidelines
Maximum Maximum Maximum Maximum (mg/L)(mg/L)(mg/L)(mg/L)
Meets Meets Meets Meets GuidelineGuidelineGuidelineGuideline (Yes / No)(Yes / No)(Yes / No)(Yes / No)
Bairnsdale Quarterly 4 0 0.001 Yes
Bemm River Quarterly 4 0 0.001 Yes
Buchan Quarterly 4 0 0.001 Yes
Cann River Quarterly 4 0 0.001 Yes
Dinner Plain Quarterly 4 0 0.001 Yes
Eagle Point- Paynesville Quarterly 4 0 0.001 Yes
Kalimna Quarterly 4 0 0.001 Yes
Lindenow Quarterly 4 0 0.001 Yes
Lindenow South Quarterly 4 0 0.001 Yes
Mallacoota Quarterly 4 0 0.001 Yes
Merrangbaur Quarterly 4 0 0.001 Yes
Metung Quarterly 4 0 0.001 Yes
Nicholson-Swan Reach Quarterly 4 0 0.001 Yes
Nowa Nowa Quarterly 4 0 0.001 Yes
Omeo Quarterly 4 0 0.001 Yes
Orbost Quarterly 4 0 0.001 Yes
Sarsfield-Bruthen Quarterly 4 0 0.001 Yes
Sunlakes-Toorloo Quarterly 4 0 0.001 Yes
Swifts Creek Quarterly 4 0 0.001 Yes
3.15.1 Comments on results
All water quality localities were compliant for lead for the 2013/2014 reporting period.
East Gippsland Water: Water Quality Annual Report 2013/2014
Page 26
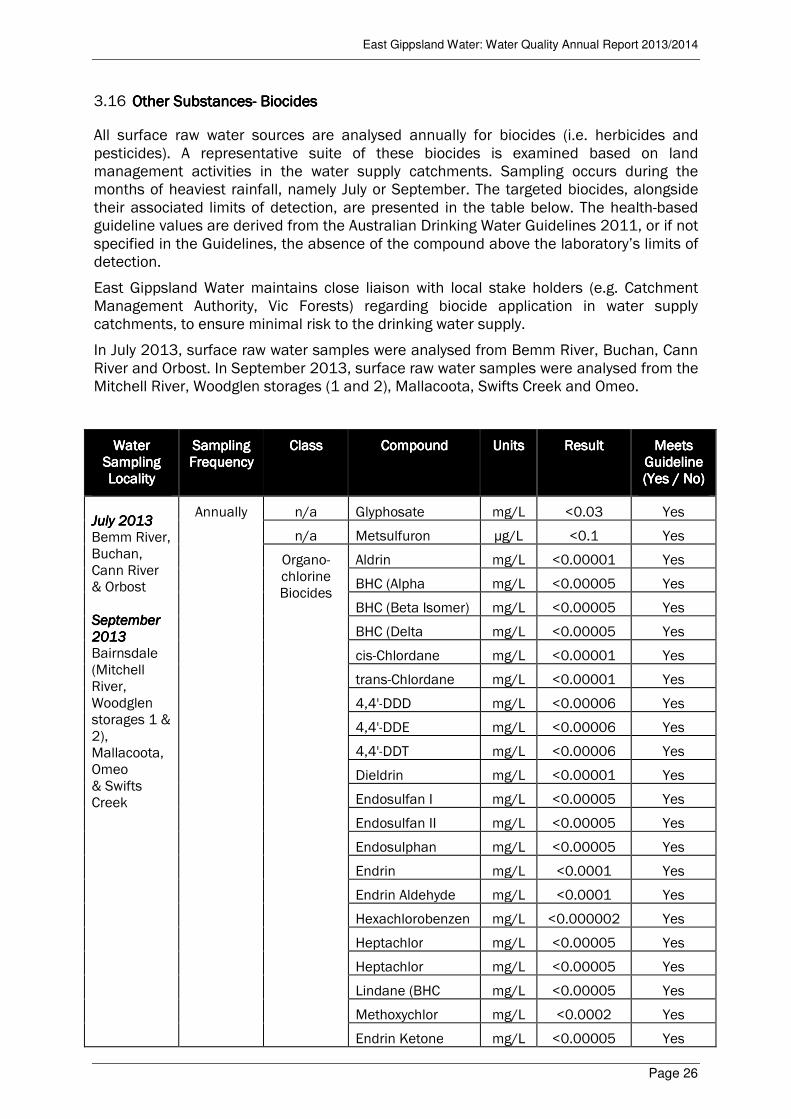
3.16 Other SubstancesOther SubstancesOther SubstancesOther Substances---- Biocides Biocides Biocides Biocides
All surface raw water sources are analysed annually for biocides (i.e. herbicides and pesticides). A representative suite of these biocides is examined based on land management activities in the water supply catchments. Sampling occurs during the months of heaviest rainfall, namely July or September. The targeted biocides, alongside their associated limits of detection, are presented in the table below. The health-based guideline values are derived from the Australian Drinking Water Guidelines 2011, or if not specified in the Guidelines, the absence of the compound above the laboratory’s limits of detection.
East Gippsland Water maintains close liaison with local stake holders (e.g. Catchment Management Authority, Vic Forests) regarding biocide application in water supply catchments, to ensure minimal risk to the drinking water supply.
In July 2013, surface raw water samples were analysed from Bemm River, Buchan, Cann River and Orbost. In September 2013, surface raw water samples were analysed from the Mitchell River, Woodglen storages (1 and 2), Mallacoota, Swifts Creek and Omeo.
Water Water Water Water Sampling Sampling Sampling Sampling LocalityLocalityLocalityLocality
Sampling Sampling Sampling Sampling FrequencyFrequencyFrequencyFrequency
ClassClassClassClass CompoundCompoundCompoundCompound UnitsUnitsUnitsUnits ResultResultResultResult Meets Meets Meets Meets GuidelineGuidelineGuidelineGuideline (Yes / No)(Yes / No)(Yes / No)(Yes / No)
July 2013July 2013July 2013July 2013 Bemm River, Buchan, Cann River & Orbost September September September September 2013201320132013 Bairnsdale (Mitchell River, Woodglen storages 1 & 2), Mallacoota, Omeo & Swifts Creek
Annually n/a Glyphosate mg/L <0.03 Yes
n/a Metsulfuron Methyl
µg/L <0.1 Yes
Organo-chlorine Biocides
Aldrin mg/L <0.00001 Yes
BHC (Alpha Isomer)
mg/L <0.00005 Yes
BHC (Beta Isomer) mg/L <0.00005 Yes
BHC (Delta Isomer)
mg/L <0.00005 Yes
cis-Chlordane mg/L <0.00001 Yes
trans-Chlordane mg/L <0.00001 Yes
4,4'-DDD mg/L <0.00006 Yes
4,4'-DDE mg/L <0.00006 Yes
4,4'-DDT mg/L <0.00006 Yes
Dieldrin mg/L <0.00001 Yes
Endosulfan I mg/L <0.00005 Yes
Endosulfan II mg/L <0.00005 Yes
Endosulphan Sulphate
mg/L <0.00005 Yes
Endrin mg/L <0.0001 Yes
Endrin Aldehyde mg/L <0.0001 Yes
Hexachlorobenzene
mg/L <0.000002 Yes
Heptachlor mg/L <0.00005 Yes
Heptachlor Epoxide
mg/L <0.00005 Yes
Lindane (BHC Gamma Isomer)
mg/L <0.00005 Yes
Methoxychlor mg/L <0.0002 Yes
Endrin Ketone mg/L <0.00005 Yes

East Gippsland Water: Water Quality Annual Report 2013/2014
Page 27
Water Water Water Water Sampling Sampling Sampling Sampling LocalityLocalityLocalityLocality
Sampling Sampling Sampling Sampling FrequencyFrequencyFrequencyFrequency
ClassClassClassClass CompoundCompoundCompoundCompound UnitsUnitsUnitsUnits ResultResultResultResult Meets Meets Meets Meets GuidelineGuidelineGuidelineGuideline (Yes / No)(Yes / No)(Yes / No)(Yes / No)
Organo-phosphorus
Biocides
Dichlorvos mg/L <0.001 Yes
Monocrotophos mg/L <0.001 Yes
Prophos mg/L <0.001 Yes
Tetraethyldithiopyrphos
mg/L <0.001 Yes
Phorate mg/L <0.001 Yes
Demeton-S mg/L <0.001 Yes
Diazinon mg/L <0.001 Yes
Methyl Parathion mg/L <0.001 Yes
Ronnel mg/L <0.001 Yes
Malathion mg/L <0.001 Yes
Fenthion mg/L <0.001 Yes
Chloropyrifos mg/L <0.001 Yes
Ethyl Parathion mg/L <0.001 Yes
Trichlorinate mg/L <0.001 Yes
Tetrachlovinphos mg/L <0.001 Yes
Tukuthion mg/L <0.001 Yes
Fensulfothion mg/L <0.001 Yes
EPN mg/L <0.001 Yes
Coumaphos mg/L <0.001 Yes
Triazines Ametryn mg/L <0.002 Yes
Atrazine mg/L <0.002 Yes
Prometon mg/L <0.002 Yes
Prometryn mg/L <0.002 Yes
Propazine mg/L <0.002 Yes
Simazine mg/L <0.002 Yes
Terbuthylazine mg/L <0.002 Yes
Simetryn mg/L <0.002 Yes
Terbutryn mg/L <0.002 Yes
Phenoxy acid
biocides
2,4,5-T µg/L <0.01 Yes
2,4,5-TP µg/L <0.01 Yes
2,4,6-T µg/L <0.1 Yes
2,4-D µg/L <0.01 Yes
2,4-DB µg/L <0.01 Yes
2,4-DP µg/L <0.01 Yes
2,6-D µg/L <0.1 Yes
4 Chlorophenoxy Acetic Acid
µg/L <0.01 Yes
Clopyralid µg/L <0.05 Yes

East Gippsland Water: Water Quality Annual Report 2013/2014
Page 28
Water Water Water Water Sampling Sampling Sampling Sampling LocalityLocalityLocalityLocality
Sampling Sampling Sampling Sampling FrequencyFrequencyFrequencyFrequency
ClassClassClassClass CompoundCompoundCompoundCompound UnitsUnitsUnitsUnits ResultResultResultResult Meets Meets Meets Meets GuidelineGuidelineGuidelineGuideline (Yes / No)(Yes / No)(Yes / No)(Yes / No)
Dicamba µg/L <0.01 Yes
Fluroxypyr µg/L <0.05 Yes
MCPA µg/L <0.01 Yes
MCPB µg/L <0.01 Yes
Mecoprop µg/L <0.01 Yes
Metsulfuron Methyl
µg/L <0.1 Yes
Picloram µg/L <0.05 Yes
Triclopyr µg/L <0.01 Yes
3.16.1 Comments on results
All the above results were below the health-based guideline value in the Australian Drinking Water Guidelines, or if not specified in the Guidelines, were below the lower limits of detection, and therefore were deemed to be compliant in 2013/2014.

East Gippsland Water: Water Quality Annual Report 2013/2014
Page 29
3.17 Other SubstancesOther SubstancesOther SubstancesOther Substances---- RadiologicalRadiologicalRadiologicalRadiological
Radiologically active compounds may impact public health. Radiological activity samples are taken from bore waters every two years and from surface waters every five years. While there are no specific guidelines for radiological activity, the Australian Drinking Water Guidelines (2011) advise that radionuclides should be identified and determined if gross alpha or beta activities exceed 0.5 Bq/L.
In 2013/2014, the 5-yearly surface water samples were taken in the relevant water sampling localities, alongside 2-yearly bore samples.
Water Sampling Water Sampling Water Sampling Water Sampling LocalityLocalityLocalityLocality
Sampling Sampling Sampling Sampling FrequencyFrequencyFrequencyFrequency
No. of Sites No. of Sites No. of Sites No. of Sites SampledSampledSampledSampled
Gross Alpha Gross Alpha Gross Alpha Gross Alpha Activity Max. Activity Max. Activity Max. Activity Max.
(Bq/L)(Bq/L)(Bq/L)(Bq/L)
Gross Beta Gross Beta Gross Beta Gross Beta Activity Max. Activity Max. Activity Max. Activity Max.
(Bq/L)(Bq/L)(Bq/L)(Bq/L)
Meets Meets Meets Meets GuidelineGuidelineGuidelineGuideline (Yes / No)(Yes / No)(Yes / No)(Yes / No)
Bairnsdale 5-yearly 1 0.06 0.11 Yes
Bemm River 5-yearly 1 0.06 0.11 Yes
Buchan 5-yearly 1 0.06 0.11 Yes
Cann River 5-yearly 1 0.06 0.11 Yes
Dinner Plain 2-yearly 1 0.06 0.11 Yes
Mallacootaa 2-/5-yearlyb 2 0.05 0.10 Yes
Omeo 5-yearly 2 0.08 0.17 Yes
Orbost 5-yearly 1 0.18 0.37 Yes
Swifts Creek 5-yearly 1 0.06 0.11 Yes
aBoth surface and bore water samples were taken for this water sampling locality in 2013/2014.
bBore samples are taken 2-yearly; surface water samples are taken 5-yearly.
3.17.1 Comments on results
All results obtained were below the guideline values in Australian Drinking Water Guidelines and were therefore deemed compliant for the 2013/2014 reporting period.

East Gippsland Water: Water Quality Annual Report 2013/2014
Page 30
3.18 Aesthetic CharacteristicsAesthetic CharacteristicsAesthetic CharacteristicsAesthetic Characteristics---- pH pH pH pH
pH measures how acidic (pH <7.0) or alkaline (pH >7.0) the water is. Extreme pH values may cause corrosion or scaling in certain circumstances. High pH may also reduce the effectiveness of chlorine disinfection. pH samples are taken weekly in each water sampling locality. The Australian Drinking Water Guidelines (2011) state that the pH of drinking water should lie between pH ≥ 6.5 and ≤ 8.5 (aesthetic guideline value, based on minimising corrosion and encrustation of plumbing fittings and pipes). However, as cement mortar-lined pipes and newly constructed concrete water storages may raise pH, values up to pH 9.2 may be tolerated, provided no deterioration in microbiological quality of the water supply is observed.
aAdditional samples may be recorded due to population size (both fixed and seasonal) and the number of sampling days per calendar year.
3.18.1 Comments on results
Based on the average values over the year, pH values for all localities are below 9.2). Higher pH values above 8.5 have been observed in Buchan, Nowa Nowa and Metung water sampling localities. This is largely due to the presence of cement-lined distribution pipes. However, these higher pH values have not impacted water quality, as evidenced by compliant microbiological (Table 3.1) and aesthetic quality (Section 5) during 2013/2014.
Water Sampling Water Sampling Water Sampling Water Sampling LocalityLocalityLocalityLocality
Minimum Minimum Minimum Minimum Sampling Sampling Sampling Sampling
FrequencyFrequencyFrequencyFrequencyaaaa
No. of No. of No. of No. of SamplesSamplesSamplesSamples
Minimum Minimum Minimum Minimum (mg/L)(mg/L)(mg/L)(mg/L)
Maximum Maximum Maximum Maximum (mg/L)(mg/L)(mg/L)(mg/L)
Average Average Average Average (mg/L)(mg/L)(mg/L)(mg/L)
Bairnsdale Weekly 71 7.2 7.8 7.4
Bemm River Weekly 53 7.8 7.8 7.4
Buchan Weekly 52 8.1 9.0 8.5
Cann River Weekly 53 7.8 8.8 8.3
Dinner Plain Weekly 53 6.7 7.1 6.8
Eagle Point- Paynesville Weekly 52 7.4 9.0 7.7
Kalimna Weekly 52 7.2 7.6 7.5
Lindenow Weekly 52 7.4 8.2 7.6
Lindenow South Weekly 52 7.6 8.0 7.8
Mallacoota Weekly 53 7.6 8.7 8.1
Merrangbaur Weekly 52 7.5 7.9 7.6
Metung Weekly 52 7.8 9.1 8.7
Nicholson-Swan Reach Weekly 52 7.3 8.7 7.8
Nowa Nowa Weekly 52 7.6 9.2 8.6
Omeo Weekly 53 7.7 9.0 8.2
Orbost Weekly 53 7.2 9.3 8.3
Sarsfield-Bruthen Weekly 53 7.1 8.0 7.4
Sunlakes-Toorloo Weekly 57 7.4 8.8 7.8
Swifts Creek Weekly 53 7.6 8.0 7.9

East Gippsland Water: Water Quality Annual Report 2013/2014
Page 31
3.19 Aesthetic Aesthetic Aesthetic Aesthetic CharacteristicsCharacteristicsCharacteristicsCharacteristics---- HardnessHardnessHardnessHardness
Hardness is caused by the presence of dissolved calcium compounds in water. Hard water may result in scaling issues. The aesthetic guideline value is ≤ 200 milligrams per litre as total hardness (as calcium carbonate; Australian Drinking Water Guidelines 2011).
Water Sampling Water Sampling Water Sampling Water Sampling LocalityLocalityLocalityLocality
Sampling Sampling Sampling Sampling FrequencyFrequencyFrequencyFrequency
No. of No. of No. of No. of SamplesSamplesSamplesSamples
Maximum Maximum Maximum Maximum (mg/L)(mg/L)(mg/L)(mg/L)
MeetsMeetsMeetsMeets GuidelineGuidelineGuidelineGuideline (%)(%)(%)(%)
Bairnsdale Quarterly 4 32 100%
Bemm River Quarterly 4 14 100%
Buchan Quarterly 4 39 100%
Cann River Quarterly 4 23 100%
Dinner Plain Quarterly 4 40 100%
Eagle Point- Paynesville
Quarterly n/aa n/aa n/aa
Kalimna Quarterly n/aa n/aa n/aa
Lindenow Quarterly n/aa n/aa n/aa
Lindenow South Quarterly n/aa n/aa n/aa
Mallacoota Quarterly 4 82 100%
Merrangbaur Quarterly n/aa n/aa n/aa
Metung Quarterly n/aa n/aa n/aa
Nicholson-Swan Reach Quarterly n/aa n/aa n/aa
Nowa Nowa Quarterly n/aa n/aa n/aa
Omeo Quarterly 4 15 100%
Orbost Quarterly 4 19 100%
Sarsfield-Bruthen Quarterly n/aa n/aa n/aa
Sunlakes-Toorloo Quarterly n/aa n/aa n/aa
Swifts Creek Quarterly 4 110 100%
aNot applicable; Bairnsdale samples represent the entry point for the Mitchell system; accordingly, hardness is not routinely sampled in the other Mitchell system sampling localities i.e. Eagle Point-Paynesville, Kalimna, Lindenow, Lindenow South, Merrangbaur, Metung, Nicholson-Swan Reach, Nowa Nowa, Sarsfield-Bruthen, Sunlakes Toorloo.
3.19.1 Comments on results
All water quality localities were compliant for hardness for the 2013/2014 reporting period.

East Gippsland Water: Water Quality Annual Report 2013/2014
Page 32
3.20 Aesthetic CharacteristicsAesthetic CharacteristicsAesthetic CharacteristicsAesthetic Characteristics---- Free chlorine Free chlorine Free chlorine Free chlorine
Chlorine is a disinfection agent that is added to drinking water to kill harmful microorganisms and ensure the water is safe for to drink. The Australian Drinking Water Guidelines (2011) state that chlorine concentrations in the drinking water supply must be ≤ 5 milligrams per litre for health purposes. However, in certain water sampling localities, this taste/odour threshold concentration may need to be exceeded, to provide adequate disinfection to the end of the distribution system.
Water Sampling LocalityWater Sampling LocalityWater Sampling LocalityWater Sampling Locality Minimum Minimum Minimum Minimum Sampling Sampling Sampling Sampling
FrequencyFrequencyFrequencyFrequencyaaaa
No. of No. of No. of No. of SamplesSamplesSamplesSamples
Minimum Minimum Minimum Minimum (mg/L)(mg/L)(mg/L)(mg/L)
Maximum Maximum Maximum Maximum (mg/L)(mg/L)(mg/L)(mg/L)
Average Average Average Average (mg/L)(mg/L)(mg/L)(mg/L)
Bairnsdale Weekly 71 0.31 1.10 0.76
Bemm River Weekly 53 0.28 1.10 0.62
Buchan Weekly 52 0.26 0.85 0.63
Cann River Weekly 53 0.10 2.20 0.65
Dinner Plain Weekly n/ab n/ab n/ab n/ab
Eagle Point- Paynesville Weekly 52 0.25 0.81 0.56
Kalimna Weekly 52 0.26 0.79 0.61
Lindenow Weekly 52 0.59 1.00 0.77
Lindenow South Weekly 52 0.27 0.83 0.62
Mallacoota Weekly 53 0.01 1.10 0.53
Merrangbaur Weekly 52 0.50 0.81 0.68
Metung Weekly 52 0.49 1.00 0.67
Nicholson-Swan Reach Weekly 52 0.56 0.99 0.77
Nowa Nowa Weekly 52 0.15 0.88 0.51
Omeo Weekly 53 0.08 0.85 0.50
Orbost Weekly 53 0.07 1.20 0.67
Sarsfield-Bruthen Weekly 53 0.18 0.95 0.60
Sunlakes-Toorloo Weekly 57 0.42 0.96 0.74
Swifts Creek Weekly 53 0.11 0.95 0.72
aAdditional samples may be recorded due to population size (both fixed and seasonal) and the number of sampling days per calendar year.
bDinner Plain is not sampled for free chlorine as ultra-violet disinfection is employed in lieu of chlorine.
3.20.1 Comments on results
Variations in chlorine levels can arise from a number of factors, including proximity to a disinfection plant, interaction with pipe material, increase/decrease in usage (and therefore flow rates and detention times), changes in water temperature, and the presence of trace organic matter in the water/distribution network. Average chlorine levels were occasional higher than the aesthetic limit of > 0.6 milligrams per litre in several water sampling localities to maintain adequate disinfection through to the end of

East Gippsland Water: Water Quality Annual Report 2013/2014
Page 33
these distribution systems. We strive to balance the requirement for adequate disinfection throughout our distribution system (health considerations), whilst supplying water that is acceptable to customers in terms of taste and odour (aesthetic considerations). This can be seen by our free chlorine results in all water sampling localities (above), as well as the low level of chlorine-related customer complaints received in 2013/2014 (refer Section 5).
Based on the average concentration over the year, all water sampling localities were below the health-related limit of ≤ 5 milligrams per litre.

East Gippsland Water: Water Quality Annual Report 2013/2014
Page 34
3.21 Aesthetic CharacteristicsAesthetic CharacteristicsAesthetic CharacteristicsAesthetic Characteristics---- Colour Colour Colour Colour
Colour occurs in water generally as a result of dissolved organic material. Although not directly related to health impacts, the presence of colour is considered to be an aesthetic issue. The aesthetic guideline value is ≤ 15 Hazen Units (HU; Australian Drinking Water Guidelines 2011 aesthetic value).
Water Sampling LocalityWater Sampling LocalityWater Sampling LocalityWater Sampling Locality Sampling Sampling Sampling Sampling FrequencyFrequencyFrequencyFrequency
No. of No. of No. of No. of SamplesSamplesSamplesSamples
Minimum Minimum Minimum Minimum (H(H(H(HU)U)U)U)
Maximum Maximum Maximum Maximum (H(H(H(HU)U)U)U)
Meets Meets Meets Meets Guideline (%)Guideline (%)Guideline (%)Guideline (%)
Bairnsdale Monthly 12 2 2 100%
Bemm River Monthly 12 2 4 100%
Buchan Monthly 12 2 2 100%
Cann River Monthly 12 2 2 100%
Dinner Plain Monthly 12 2 2 100%
Eagle Point- Paynesville Monthly 12 2 2 100%
Kalimna Monthly 12 2 2 100%
Lindenow Monthly 12 2 2 100%
Lindenow South Monthly 12 2 2 100%
Mallacoota Monthly 12 2 2 100%
Merrangbaur Monthly 12 2 2 100%
Metung Monthly 12 2 2 100%
Nicholson-Swan Reach Monthly 12 2 2 100%
Nowa Nowa Monthly 12 2 2 100%
Omeo Monthly 12 2 2 100%
Orbost Monthly 12 2 2 100%
Sarsfield-Bruthen Monthly 12 2 2 100%
Sunlakes-Toorloo Monthly 12 2 2 100%
Swifts Creek Monthly 12 2 2 100%
3.21.1 Comments on results
All water quality localities were compliant for colour for the 2013/2014 reporting period.

East Gippsland Water: Water Quality Annual Report 2013/2014
Page 35
3.22 Aesthetic CharacteristicsAesthetic CharacteristicsAesthetic CharacteristicsAesthetic Characteristics---- ManganeseManganeseManganeseManganese
Manganese may occur naturally in the environment, or may be introduced through industrial activity. Manganese may cause aesthetic issues (such as taste or staining of laundry and appliances) as well as health issues at high concentrations. The aesthetic guideline value is ≤ 0.1 milligrams per litre and ≤ 0.5 milligrams per litre (health-based guideline value; Australian Drinking Water Guidelines [2011]).
Water Sampling Water Sampling Water Sampling Water Sampling LocalityLocalityLocalityLocality
Sampling Sampling Sampling Sampling FrequencyFrequencyFrequencyFrequency
No. of No. of No. of No. of SamplesSamplesSamplesSamples
Maximum Maximum Maximum Maximum (mg/L)(mg/L)(mg/L)(mg/L)
Meets Meets Meets Meets Guideline (%)Guideline (%)Guideline (%)Guideline (%)
Bairnsdale Monthly 12 0.002 100%
Bemm River Monthly 12 0.003 100%
Buchan Monthly 12 0.001 100%
Cann River Monthly 12 0.002 100%
Dinner Plain Monthly 12 0.001 100%
Eagle Point- Paynesville
Monthly 12 0.001 100%
Kalimna Monthly 12 0.001 100%
Lindenow Monthly 12 0.001 100%
Lindenow South Monthly 12 0.001 100%
Mallacoota Monthly 12 0.005 100%
Merrangbaur Monthly 12 0.001 100%
Metung Monthly 12 0.001 100%
Nicholson-Swan Reach Monthly 12 0.001 100%
Nowa Nowa Monthly 12 0.001 100%
Omeo Monthly 12 0.001 100%
Orbost Monthly 12 0.003 100%
Sarsfield-Bruthen Monthly 12 0.001 100%
Sunlakes-Toorloo Monthly 12 0.001 100%
Swifts Creek Monthly 12 0.001 100%
3.22.1 Comments on results
All water quality localities were compliant for manganese for the 2013/2014 reporting period (both aesthetic and health values).

East Gippsland Water: Water Quality Annual Report 2013/2014
Page 36
3.23 Aesthetic CharacteristicsAesthetic CharacteristicsAesthetic CharacteristicsAesthetic Characteristics---- Iron Iron Iron Iron
Iron may occur naturally in the environment, or may be introduced through industrial activity, as well as through customer piping. High levels of iron in the water can impart taste issues and may stain laundry or fittings. There is no health-based guideline for iron in drinking water. The aesthetic guideline value is ≤ 0.3 milligrams per litre (Australian Drinking Water Guidelines 2011).
Water Sampling Water Sampling Water Sampling Water Sampling LocalityLocalityLocalityLocality
Sampling Sampling Sampling Sampling FrequencyFrequencyFrequencyFrequency
No. of No. of No. of No. of SamplesSamplesSamplesSamples
Maximum Maximum Maximum Maximum (mg/L)(mg/L)(mg/L)(mg/L)
Meets Guideline (%)Meets Guideline (%)Meets Guideline (%)Meets Guideline (%)
Bairnsdale Monthly 12 0.03 100%
Bemm River Monthly 12 0.12 100%
Buchan Monthly 12 0.01 100%
Cann River Monthly 12 0.05 100%
Dinner Plain Monthly 12 0.01 100%
Eagle Point- Paynesville
Monthly 12 0.01 100%
Kalimna Monthly 12 0.01 100%
Lindenow Monthly 12 0.02 100%
Lindenow South Monthly 12 0.03 100%
Mallacoota Monthly 12 0.07 100%
Merrangbaur Monthly 12 0.01 100%
Metung Monthly 12 0.01 100%
Nicholson-Swan Reach Monthly 12 0.01 100%
Nowa Nowa Monthly 12 0.01 100%
Omeo Monthly 12 0.02 100%
Orbost Monthly 12 0.09 100%
Sarsfield-Bruthen Monthly 12 0.02 100%
Sunlakes-Toorloo Monthly 12 0.01 100%
Swifts Creek Monthly 12 0.01 100%
3.23.1 Comments on results
All water quality localities were compliant for iron for the 2013/2014 reporting period.

East Gippsland Water: Water Quality Annual Report 2013/2014
Page 37
3.24 Aesthetic CharacteristicsAesthetic CharacteristicsAesthetic CharacteristicsAesthetic Characteristics---- Zinc Zinc Zinc Zinc
Zinc may occur naturally in the environment, or may be introduced through industrial activity, as well as through customer piping. High levels of zinc in the water can impart taste and appearance issues with drinking water. The aesthetic guideline value is ≤ 3 milligrams per litre (Australian Drinking Water Guidelines 2011).
Water Sampling LocalityWater Sampling LocalityWater Sampling LocalityWater Sampling Locality Sampling Sampling Sampling Sampling FrequencyFrequencyFrequencyFrequency
No. of No. of No. of No. of SamplesSamplesSamplesSamples
Maximum Maximum Maximum Maximum (mg/L)(mg/L)(mg/L)(mg/L)
Meets Guideline (%)Meets Guideline (%)Meets Guideline (%)Meets Guideline (%)
Bairnsdale Quarterly 4 0.002 100%
Bemm River Quarterly 4 0.018 100%
Buchan Quarterly 4 0.002 100%
Cann River Quarterly 4 0.004 100%
Dinner Plain Quarterly 4 0.013 100%
Eagle Point- Paynesville Quarterly 4 0.004 100%
Kalimna Quarterly 4 0.003 100%
Lindenow Quarterly 4 0.002 100%
Lindenow South Quarterly 4 0.006 100%
Mallacoota Quarterly 4 0.003 100%
Merrangbaur Quarterly 4 0.004 100%
Metung Quarterly 4 0.002 100%
Nicholson-Swan Reach Quarterly 4 0.002 100%
Nowa Nowa Quarterly 4 0.002 100%
Omeo Quarterly 4 0.006 100%
Orbost Quarterly 4 0.003 100%
Sarsfield-Bruthen Quarterly 4 0.017 100%
Sunlakes-Toorloo Quarterly 4 0.016 100%
Swifts Creek Quarterly 4 0.011 100%
3.24.1 Comments on results
All water quality localities were compliant for zinc for the 2013/2014 reporting period.

East Gippsland Water: Water Quality Annual Report 2013/2014
Page 38
3.25 Analysis of ResultsAnalysis of ResultsAnalysis of ResultsAnalysis of Results
Comparing the percentage compliance in all water sampling localities (refer to Figure 5) demonstrates our high standard of compliance over the past three years. All sampling localities were fully compliant with the parameters described in Schedule 2 of the Safe Drinking Water Regulations 2005 in 2013/2014 (refer to Figure 6).
Figure 5: Percentage of water sampling localities compliant with Schedule 2 parameters
Figure 6: Percentage of connections supplied with compliant drinking water in all localities

East Gippsland Water: Water Quality Annual Report 2013/2014
Page 39
4444 Emergency and Emergency and Emergency and Emergency and IIIIncident ncident ncident ncident MMMManagementanagementanagementanagement
4.1 Notification Events under Section 22 or Section 18 Notification Events under Section 22 or Section 18 Notification Events under Section 22 or Section 18 Notification Events under Section 22 or Section 18
Under the Safe Drinking Water Act 2003, the Department of Health must be notified of circumstances where drinking water supplied to the public does not comply, or is not likely to comply, with any relevant water quality standard, or where drinking water is supplied such that it may pose a risk to human health or cause widespread public complaint. In 2013/2014, no Section 22 notifications were made to the Department of Health.
A water supplier must notify the Department of Health under Section 18 of the Act when drinking water supplied to the public does not comply with any relevant water quality standard set out in Schedule 2 of the Safe Drinking Water Regulations 2005. In 2013/2014, no Section 18 notifications were made to the Department of Health.
4.2 Other Other Other Other
East Gippsland experienced severe bush fire threats in February/March 2014. A number of our assets were potentially under threat in our Mitchell (Woodglen water treatment plant) and Buchan (Buchan water treatment plant) water sampling localities, with extensive catchment damage occurring in our Orbost water sampling locality. Despite significant peaks in water demand during the fires (both from domestic and firefighting usage), we were able to maintain drinking water quality and supply, during this period. Sufficient raw water and/or treated water storage capacity at all water treatment facilities ensured that all affected towns had ample, high quality, treated water in the days that followed this event.
Following the extensive catchment damage from fire, preparations were made at Orbost to ensure that East Gippsland Water was prepared for potential raw water quality impacts over an extended period. This included close liaison with firefighting and catchment management authorities, examining the treatability and presence of fire retardants in impacted river water following first rains, and making preparations for emergency pre-treatment works, should the need arise. Ultimately, no significant impacts were observed in the raw water, and no customer impacts occurred with respect to the quality or supply of drinking water. Following these events, additional emergency generator capacity was acquired for critical water treatment facilities to ensure the continuity and quality of water supply for the future.

East Gippsland Water: Water Quality Annual Report 2013/2014
Page 40
5555 Complaints Relating to Water QualityComplaints Relating to Water QualityComplaints Relating to Water QualityComplaints Relating to Water Quality
Our Customer Charter outlines our commitments, responsibilities and standards of service to be provided to our customers.
This Charter also sets out the obligations to customers as outlined by the Essential Services Commission’s Customer Service Code for metropolitan retail and regional water businesses. This includes specific standards and conditions of service that apply to all water businesses in Victoria. Further information relating to East Gippsland Water’s Customer Charter can be found on our website www.egwater.vic.gov.au.
Customer complaints relating to Water Quality were again low in 2013/14, which is attributable to (1) the ongoing optimisation of chlorine addition to the treated water supply and (2) air scouring and other proactive maintenance activities.
Table 6.1 Summary of customer water quality complaints in 2013/2014
ComplaintComplaintComplaintComplaint Number of Number of Number of Number of complaintscomplaintscomplaintscomplaints
Number per 100 Number per 100 Number per 100 Number per 100 connectionsconnectionsconnectionsconnections****
Discoloured Water 4 0.018
Taste and Odour 4 0.018
Blue Water 0 0.000
Air in water 1 0.004
Other** 2 0.009
*Calculations based on 22,564 water supply connections.
**This category includes any calls related to alleged illness.
5.1 Discoloured water
Four discoloured water complaints were received in 2013/2014 that related to re-suspension of sediment in a pipe following a change in network operations.
5.2 TasteTasteTasteTaste and Oand Oand Oand Odour dour dour dour
Taste and odour complaints remained static in 2013/2014, with four complaints received, compared to four complaints in this category in 2012/2013. These complaints were largely related to variability in customer tolerance to the levels of chlorine in drinking water.
5.3 Air in the water
One complaint was received relating to air in the water, following completion of works relating to our proactive air-scouring programme.
East Gippsland Water: Water Quality Annual Report 2013/2014
Page 41
5.4 Other Other Other Other
The other water quality complaints in 2013/2014 related to the presence of fluoride in the water, and concerns regarding the scaling potential of the water supply.

East Gippsland Water: Water Quality Annual Report 2013/2014
Page 42
6666 Actions Actions Actions Actions aaaarising from rising from rising from rising from the the the the mmmmost ost ost ost RRRRecent ecent ecent ecent RRRRisk isk isk isk MMMManagement anagement anagement anagement PPPPlan lan lan lan AAAAuditudituditudit
Our Drinking Water Quality Risk Management System was audited in March-April 2014 by an external auditor. The Drinking Water Quality Risk Management Plan (RMP), which is the central component of East Gippsland Water’s Drinking Water Quality Risk Management System, outlines a preventive, systematic and comprehensive approach to drinking water quality assurance. The RMP identifies risks to drinking water quality at all steps in the water supply chain, from catchment to consumer, and ensures that appropriate control measures are in place to effectively manage those risks. The RMP also describes supporting plans and policies that are essential to the ongoing provision of safe, high quality drinking water to our consumers. The audit activity found that East Gippsland Water’s Drinking Water Quality Risk Management System satisfies the requirements of the Safe Drinking Water Act 2003 and associated Regulations.
There were no non-conformances identified during the audit. However some opportunities for improvement were noted during the audit. A summary of the actions identified during the 2014 audit, alongside their current status, is outlined in the table below.
Table 7.1 Summary of the opportunities for improvement identified during the 2014 audit
Opportunity for Opportunity for Opportunity for Opportunity for ImprovementImprovementImprovementImprovement StatusStatusStatusStatus
Consider the inclusion of more detailed commentary for justification of a change in the consequence rating in the water quality risk management plan.
On-going
Responsibilities of the Depot Team Leaders to be clearly stated in Table 1 of the Water Quality Risk Management Plan.
Addressed
Consider the need of an additional column in the routine calibration checksheet for final calibration verification check (pH, chlorine, fluoride). Review standard error for instrument calibration (pH, chlorine and fluoride) to determine appropriate trigger limits for recalibration.
Addressed
Develop a standardised jar testing results sheet and ensure testing is performed at an appropriate frequency for each water treatment plant.
Addressed
Develop a more detailed filter inspection checksheet to guide annual filter inspections at water treatment plants; include observation of backwash on the routine check sheet at water treatment plants at an appropriate frequency.
Addressed

East Gippsland Water: Water Quality Annual Report 2013/2014
Page 43
7777 Undertakings Undertakings Undertakings Undertakings uuuunder nder nder nder Section 30 of the ActSection 30 of the ActSection 30 of the ActSection 30 of the Act
Section 30 of the Safe Drinking Water Act 2003 allows for the Secretary of the Department of Health to accept a written undertaking from a water supplier that certain actions will be performed in the event that they are, or are likely to be, in contravention of the Safe Drinking Water Act 2003 or its associated regulations.
During the 2013/2014 period, we did not require any undertakings.
8888 Regulated Regulated Regulated Regulated WWWWaterateraterater
We have no declared Regulated Water supplies as defined in Section 6 (2) of the Safe Drinking Water Act 2003.
We have a number of customers who are supplied non-potable water by agreement. We remind those customers that their water is non-potable on their quarterly invoice.
9999 Further InformationFurther InformationFurther InformationFurther Information
This Water Quality Annual Report is prepared in accordance with Section 26 of the Safe Drinking Water Act 2003. This index facilitates identification of East Gippsland Water’s compliance with statutory disclosure requirements.
For further information regarding water quality information, please refer to East Gippsland Water’s website (www.egwater.vic.gov.au), or contact East Gippsland Water on 1300 720 700.

East Gippsland Water: Water Quality Annual Report 2013/2014
Page 44
10101010 Glossary of termsGlossary of termsGlossary of termsGlossary of terms
CWS Clear water storage
DWQMS Drinking Water Quality Management System
HU Hazen units
ISES Integrated standards enforcement system
kL Kilolitres (1,000 litres)
L/s Litres per second
mg/L Milligrams per litre
ML Megalitre (1,000,000 litres)
n/a Not applicable
NTU Nephelometric turbidity units
PAC Polyaluminium chlorohydrate
RMP Risk management plan
SOP Standard operating procedure
WTP Water treatment plant
m Millions