water pollution control measures and water quality development in the ruhr catchment 1972–1992
TRANSCRIPT

e:> Pergamon
0273-1223(95)00665-6
W<II. Sci Teclt. Vol. 32, No. ~-6, 1'1'0 209-216, 199~0
Copyrigbt C 199~ IAWQPrinted in Great Britaio. AD rigbll resenredo
0273-122319~ S9'SO + lHlO
WATER POLLUTION CONTROLMEASURES AND WATER QUALITYDEVELOPMENT IN THE RUHRCATCHMENT 1972-1992
K. R. ImhoffRuhrverband. Kronprinzenstr. 37. D-45128 Essen, Germany
ABSTRACT
Since five million people have 10 rely on Ruhr water as a SOlD'ce for potable water supply, quality andquantity aspeclS of the river are very Important for the region.
In the last 20 years, 2.1 It 109 OM have been spent for water quality CODb'Ol in the Ruhr basin. The mostImportantlypeS of plants and the progress in river water quality are described.
KEYWORDS
River basin management; river water quality; wastewater treatment.
INTRODUcnON
The Ruhr basin has a size of about 4500 km2 and a population of 2.2 million of which 95 percent areconnected to sewers. The main task of the river is to provide drinking water for its population and anotherthree million people in adjacent areas (Figure I). The Ruhrverband (Ruhr River Association) is a corporationof public law and responsible for water quantity and water quality management within the Ruhr catchment.
The different types of plants which are presently operated are shown in Figure 2. Five major reservoirs witha total capacity of 470 million m3 provide sufficient discharge to ensure a river flow of at least 15 m3/s.More than 100 wastewater treatment plants discharge daily about one million m3. Stormwater of thecombined sewer systems is retained in more than 350 tanks. After the storm the fitst flush is biologicallytreated. Only some 40 percent of the stormwater runoff has to be discharged without biological treatment.
209

210 K. R. IMHOFF
............
o Wate, Waf 5
are
78.0 I' to the Emscher20.01' to the Lippe1,6" to the Wupper0.4 I' to the Ems Basin
100.0 I'
Figure I. To supply cities and industries annually, 410 million m3 are exponed from lhe Rube Valley.
, reservOIrs
o wastewater treatment plants_ impounding lakes
o pumping stations
o repumplng statlons6 water power stations 20 JO
Figure 2. Plants of Ruhrverband.
Since river water and treated wastewater are abstracted at different locations the re-use factor for the lowerstretches of the Ruhr is about 25 percent at low flow conditions.
LEGAL ASPECTS
According to Gennan federal law, minimum requirements for the treatment of municipal wastewater havebeen enacted (Table I). A license for the discharee of wastewater can onlv be achieved if these standards are

Water pollution control measures and water quality development 211
met. In addition a pollution fee has been enacted. Table 2 shows I I parameters which are measured tocaIcul~te a pollution unit. n:e pric~ for a pollution unit is presently 60 DM and about 10 percent of theoperational cost has to be paId as dIscharge fee to the government. There is a strong incentive to lower theresidual pollution, especially phosphorus.
Table I. German minimum effluent requirements for municipal wastewater treatment
COD BOD NH4-N ~g71·plota)
mg/! mg/! mg/! mglt
< IOOOp.e. 150 40
1000 to 110 25< 5OOOp.e.
5000 to 90 20 10 18< 20000p.e.
ooסס2 to 90 20 10 18 2< 1000ooo p.e.
~ 1000ooo p.e. 75 15 10 18
Table 2. Pollution units according to the German law on effluent charges 1994
No. Parameter The following quantities areequivalent to each one pollution unit
1 COD 50 kg oxygen
2 phosphorus 3 kg
3 nitrogen 25 kg
4 AOX 2 kg halogen, calculated as organ.combined chlorine
55.15.25.35.45.55.6
6
metals and their compounds:mercurycadmiumchromiumnickelleadcopper
fish toxicity
20 g metal100 g metal500 g metal500 g metal500 g metallooog metal
3000 m3 of wastewater divided bythe factor of fish toxicity "Gp"
THE 20-YEAR CONSTRUCTION PROGRAMME
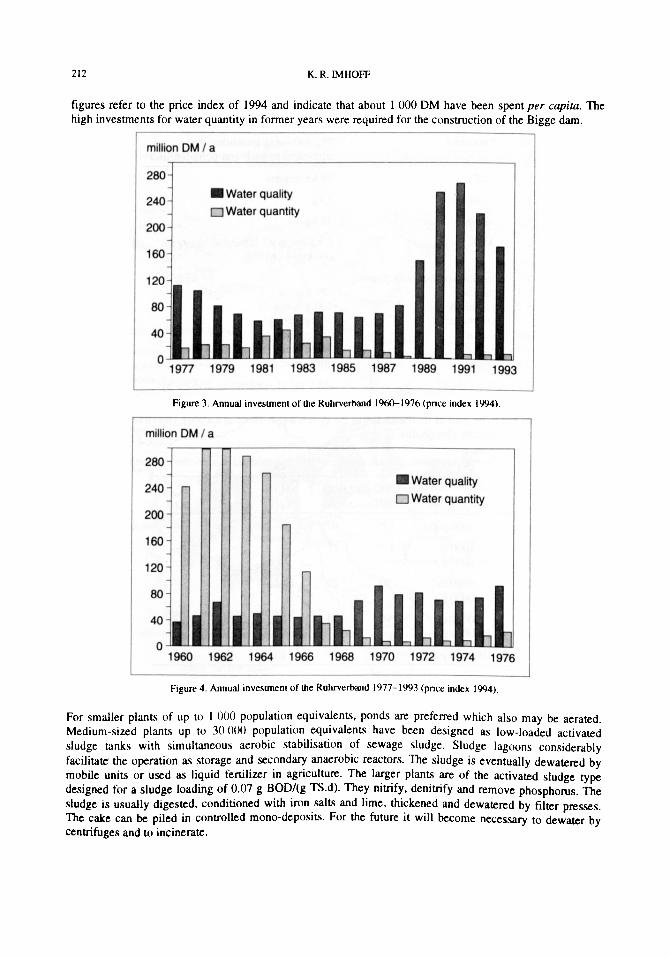
Members of the Ruhrverband General Assembly, who decide upon the budget, are from communities, waterworks and industry. The communities have an interest in development. This is only possible if theappropriate treatment of wastewater is ensured. Water works have an interest in a good condition of theriver, both in quantity and quality. The industry needs freedom for expansion and this is again dependent onthe treatment capacity of the Ruhrverband plants. Taking this into consideration the Ruhrverband associationhas agreed to considerable capital investments. which are shown in Figs 3 and 4. Between 1972 and 1992 atotal of 2.1 x 10⁹ DM was invested in wastewater treatment plants and storm water retention tanks. The
212 K.R. IMHOFF
figures refer to the price index of 1994 and indicate that about I 000 DM have been spent per capita. Thehigh investments for water quantity in former years were required for the construction of the Bigge dam.
million OMI a
280
240
200
160
120
• Water quality
o Water quantity
80
: h n n h 11 ntl nL....L.--h..-hL....L.--h...-..._.......-::h~hQ-.:lJh1977 1979 1981 1983 1985 1987 1989 1991 1993
Figure 3. Annual invesunenl of me Ruhrverband 19~1976 (price index 1994).
million OM/a
280
240
200
160
120
80
• Water quality
o Water quantity
40
o1960 1962 1964 1966 1968 1970 1972 1974 1976
Figure 4. Annual invesunenl of me Ruhrverband 1977-1993 (price index 1994).
For smaller plant~ of up to I 000 population equivalent~, ponds are preferred which also may be aerated.Medium-sized plant~ up to 30000 population equivalent~ have been designed as low-loaded activatedsludge tanks with simultaneous aerobic stabilisation of sewage sludge. Sludge lagoons considerablyfacilitate· the operation as storage and secondary anaerobic reactors. The sludge is eventually dewatered bymobile units or used as liquid fertilizer in agriculture. The larger plants are of the activated sludge typedesigned for a sludge loading of 0.07 g BOD/(g TS.d). They nitrify, denitrify and remove phosphorus. Thesludge is usually digested, conditioned with iron salts and lime, thickened and dewatered by filter presses.The cake can be piled in controlled mono-deposit~. For the future it will become necessary to dewater bycentrifuges and to incinerate.

Water pollution control measures and water quality development
WATER QUALITY IMPROVEMENT
213
Figure 5 shows a comparison of different effluent parameters of the Ruhrverband wastewater treatmentplants based on average conditions in 1972 and 1993 respectively. Between 1972 and 1992 the populationconnected to wastewater treatment plants increased from 75 to 93 percent. The electricity demand increasedfrom 20 to 60 million kWh and the BOD removal from 65 percent to 90 percent. In consequence aconsiderable improvement of the river quality can be observed in Essen (Table 3).
1972 1993
BODS (mg II) 53 9
COD (mg II) 110 41
NH4- N (mg II) 20 9,5
Ptotal (mg II) 14 0,9
Figure S. Average eftluent parameters of Ruhrverband wastewater treatment plants.
Table 3. Comparison of different parameters of the Ruhr River at Essen
Parameters 1972 1992
KMn04 - consumption. filtered (mgll) 25.0 13.0
NH4(mg!l) 2.7 1.0
total heavy metals (p.g/1) 250.0 110.0
Ni (p.g/t) 72.0 12.0
Cd (p.g/t) 1.0 0.2
instream aeration (hr/year) I 200.0 500.0
There has also been a remarkable reduction of heavy metals. especially nickel and cadmium. because theindustry was obliged to lower the discharge of heavy metals and toxic substances. In most cases the industrydischarges after pretreatment into the municipal sewerage system and a secondary treatment is given by theplants of Ruhrverband. Two major cellulose plants went bankrupt because of the German discharge fee forresidual pollution. This caused a loss of I 000 working places but was beneficial for the river quality.
The reduction of phosphates became a special programme. Because the travel time in the Ruhr River at lowflow conditions is about 20 days. phosphorus has become the main cause of eutrophication (Imhoff andAlbrecht, 1982). Fifty-two plants were equipped to add iron salts for phosphorus precipitation. In some casesbiological P-elirnination can also be observed. In total some 80 percent of phosphates have been eliminated.Figure 6 shows the development of phosphorus and chlorophyll load in the Ruhr River at Essen at low flow
conditions.

214 K. R. IMHOFF
P30 9 / s
Chlorophyll - a2,0 9 / s
1,5
1,0
0,5
o65 70 75 80 85 90
Figure 6. Development of phosphorus and chlorophyU loads in the Rube River, summer means 1965 throughout1992 and four years averages.
TASKS FOR TIlE FUTURE
Compared with the European standards for wastewater treatment in sensitive areas, there are still somedeficits in nitrogen removal. Also, from the point of view of the river water as a source of municipal watersupply, there are increased values of NH4-N in winter time. Therefure a construction programme of 250million OM/year for wastewater treatment and storm water retention will be continued for the next 15 years.
Figures 7, 8, 9 and 10 show longitudinal profiles of COD, BOD, total phosphorus and ammonia nitrogen forpresent conditions and a prognosis for the years 2000 and 2005. The data can be expected in 90 percent ofthe time. The bases of the prognosis are the mentioned capital investment and the self-purification dynamicsverified for 1993 conditions in the Ruhr River. There are seven sampling stations which are statisticallyevaluated and also the residual pollution of the wastewater treatment plant effluents is put into consideration.The 9O-percentile imperative values for water used for drinking water supply are also shown as a dotted line.After completion of the programme Ruhr water will be a very safe basis for public water supply.

Water pollution cOnlrol measures and water quality development 215
Since drinking water is gained by artificial groundwater recharge. a good level of safety is given in line withGennan drinking water standards.
100 120 140 160 180 200 216Ruhr-km
8060
.---- direction of flow
4020o
2
5
4
3
o+--t--+--+--t--t----t--+--t--t----t-----i
ll'l
ooCD
......ClE
_=1993 =2000 =2005
Figure 7. COD longitudinal profiles of the Rubr River at low flow.
20
15
Cl
E 10ool)
5
o+-~--+--l--+---t--+-+_--+-+-___i----j
..--- direction of flow
o 20 40 60 80 100 120 140 160 180 200216Ruhr-km
_=1993 _=2000 = 2005
Figure 8. BOD5 longitudinal profiles of the Ruhr River at low flow.
JWSI IZ·S/6·'

216 K.R.lMHOFF
100 120 140 160 180 200 216Ruhr - km
8060
+--- direction of flow
4020
0,05
O-l--~-+--+--f--f--+--t--+--f--+----l
o
0,25
0,3
::::: 0,2Ol
E 015(;j ,
§a.. 0,1
_=1993 = 2000 =2005
Figure 9. Total pbospborus longitudinal profiles of tbe Rube River at low flow.
1,5
OlEz,
..r~ 0,5
0+-4---+--I--+--t--+--+----.1f----I---l---J
+--- direction of flow_= 1993 = 2005
80 100 120 140 160 180 200 21 6Ruhr - km
=2000
20 40 60o
Figure 10. Ammonia nitrogen longitudinal profiles oftbe Rube River at low flow.
REFERENCE
1mboff, K. R. and Albrecbt, D. R. ()982). Nutrients and algal growth in an impounded river, consequences for its oxygen balancelIIld nutrient control strategy. Wat. Sci. Tech. 14(415), 185-197.