water monitoring strategy | us epa archive document · monitoring strategy for ... public water...
TRANSCRIPT


STATE OF SOUTH CAROLINA MONITORING STRATEGY FOR CALENDAR YEAR 2002
Technical Report No. 001-02
BU
REA
U O
F W
ATER
So
uth
Car
olin
a D
epar
tmen
t of H
ealth
and
Env
ironm
enta
l Con
trol
www.scdhec.net/water

STATE OF SOUTH CAROLINA MONITORING STRATEGY FOR CALENDAR YEAR 2002 Technical Report No. 001-02 January 2002 Bureau of Water Office of Environmental Quality Control South Carolina Department of Health and Environmental Control
-i-
TABLE OF CONTENTS LIST OF FIGURES......................................................................................................................................iii LIST OF TABLES .......................................................................................................................................iii I. MONITORING STRATEGY - SOUTH CAROLINA DEPARTMENT OF HEALTH AND
ENVIRONMENTAL CONTROL....................................................................................................1 II. OVERVIEW OF THE SOUTH CAROLINA WATER QUALITY MONITORING PROGRAM .3 III. AMBIENT SURFACE WATER QUALITY MONITORING NETWORK....................................9
A. Integrator Sites........................................................................................................9 B. Special Purpose Sites............................................................................................11 C. Watershed Water Quality Management (WWQM) Sites......................................11 D. Probability-Based Monitoring Sites......................................................................14 E. Sediment Sampling...............................................................................................18 F. Schedule for the Ambient Surface Water Quality Monitoring Program for
Calendar Year 2002 by Laboratory District.........................................................19 G. Biological Monitoring ..........................................................................................23 H. Shellfish Monitoring.............................................................................................25
IV. INTENSIVE SURVEYS AND SPECIAL WATER QUALITY STUDIES ..................................31
A. Point Source Wasteload Allocations.....................................................................31 B. Special Water Quality Studies ..............................................................................32 C. §314 Lake/Reservoir Water Quality Assessment..................................................32 D. Special Nonpoint Source Studies .........................................................................32
V. WASTEWATER DISCHARGE COMPLIANCE MONITORING...............................................34
A. Compliance Schedule Tracking............................................................................34 B. NPDES Self-Monitoring ......................................................................................34 C. Federal Compliance Evaluation Inspections - (CEI).............................................35 D. State Operation and Maintenance Inspections ......................................................37 E. Compliance Sampling Inspections........................................................................39 F. Compliance Biological Inspections ......................................................................41 G. Performance Audit Inspections.............................................................................41 H. Technical Assistance Evaluations.........................................................................42 I. Pretreatment Program Audit and/or Inspection.....................................................42
VI. QUALITY ASSURANCE/QUALITY CONTROL PROCEDURES ............................................44 VII. COMPLAINT INVESTIGATIONS AND FISH KILL PROGRAM .............................................46
A. Complaint Investigations ......................................................................................46 B. Fish Kill Program .................................................................................................48
VIII. PUBLIC WATER SYSTEMS MONITORING .............................................................................51
A. Microbiological ....................................................................................................51 B. Inorganic Chemicals (IOCs) .................................................................................52 C. Synthetic Organic Compounds (SOCs) ...............................................................54 D. Volatile Organic Compounds (VOCs ).................................................................54 E. Total Trihalomethanes (TTHMs) .........................................................................55

-ii-
F. Haloacetic Acids (HAAs).....................................................................................55 G. Radionuclides: ......................................................................................................55
IX. GROUNDWATER PROTECTION...............................................................................................57
A. Permit Issuance.....................................................................................................57 B. Enforcement .........................................................................................................58 C. Water Supply........................................................................................................58 D. 106 Groundwater Protection Program .................................................................59 E. Underground Injection Control Program..............................................................59 F. Capacity Use Permitting Program ........................................................................60 G. Underground Storage Tank (UST) Program.........................................................60 H. Geohydrologic sampling activities........................................................................61
X. LABORATORY SUPPORT ..........................................................................................................64
A. Laboratory Services ..............................................................................................64 B. Analytical Services Quality Assurance Program ..................................................64 C. Sample Containers and Preservation ....................................................................65 D. Laboratory Evaluation Program............................................................................68
XI. DATA HANDLING.......................................................................................................................70
A. Ambient Surface Water Quality Monitoring ........................................................70 B. Special Study Data ...............................................................................................70 C. Compliance Sampling ..........................................................................................70 D. NPDES Compliance and Self-Monitoring............................................................70 E. State Operation and Maintenance Inspections ......................................................70 F. Fish Kill................................................................................................................71 G. Biological Monitoring ..........................................................................................71 H. Whole Effluent Toxicity.......................................................................................71
XII. APPENDICES .....................................................................................................................................72 A. Ambient Surface Water Quality Monitoring Site Descriptions Listed by
Laboratory District B. Ambient Surface Water Quality Monitoring Sites Listed by Waterbody C. Ambient Surface Water Quality Monitoring Sites Listed by Regions Showing
Individual Parameter Coverage D. Parameters Sampled at Ambient Surface Water Quality Monitoring Sites E. Macroinvertebrate Monitoring Site Descriptions F. Fish Tissue Monitoring Site Descriptions G. Shellfish Station Descriptions Listed by Area H. List of Facilities Requiring Federal Compliance Sampling Inspections by EQC
District

-iii-
LIST OF FIGURES 1. SCDHEC Permanent Fixed Monitoring Sites.........................................................................................10 2. Watershed Water Quality Management Basins .......................................................................................11 3. SCDHEC Annual Watershed Water Quality Management Sites. ...........................................................13 4. SCDHEC 2002 Random Monitoring Sites. ............................................................................................15 5. Analytical Services Division Sample Chain-of-Custody and Data Flow ................................................66
LIST OF TABLES 1. Fixed-Station Shellfish Monitoring Program Physical and Bacteriological Parameter Coverage and
Sampling Frequency.......................................................................................................................30 2. Office of Environmental Quality Control EQC District Directory..........................................................47

-1-
I. MONITORING STRATEGY - SOUTH CAROLINA DEPARTMENT OF HEALTH AND ENVIRONMENTAL CONTROL
Purpose of This Strategy
The purpose of this strategy is to establish overall goals and objectives for those key
elements of the environmental quality monitoring program which are most needed to achieve the goals of the South Carolina Pollution Control Act (PCA), the Clean Water Act (CWA), implement applicable State and Federal regulations, and implement the EPA monitoring guidance. Water quality monitoring provides the data needed to regulate sources of water pollution, assess the quality of the State's waters and evaluate the environmental effectiveness of the South Carolina Department of Health and Environmental Control (SCDHEC) water quality programs.
Scope of This Strategy
"Environmental quality monitoring" is defined as the set of activities which provides
chemical, physical, geological, biological, and other environmental data required by environmental managers. For the purpose of this strategy, water quality monitoring is limited to those activities involved in the State implementation of the Pollution Control and Clean Water Acts in inland/coastal waters. "Regulatory monitoring" is the collection and analysis of data needed for establishing environmental quality-based permit requirements and for assessing and enforcing compliance with permits. Regulatory monitoring also provides data necessary for addressing environmental quality-based assessments of ambient water related to point source and nonpoint source influences. Regulatory monitoring for assessing and enforcing compliance with permits is included in this strategy.
Statement of Strategy
Major Objectives: This strategy establishes three major objectives for SCDHEC's environmental monitoring program:
1. Conduct Sound Environmental Quality Assessments:
Environmental quality assessments are defined as the analysis of environmental data
to determine the quality of the ambient environment. Assessments may use a number of different kinds of data, e.g., concentrations of pollutants in receiving waters, number of reported fish kills, and the amount of impact detected in natural biological communities. 2. Support the Regulatory Program:
Provide comprehensive, reliable data to SCDHEC and EPA for environmental quality
management, construction grant and permit decisions. Regulatory monitoring for establishing and enforcing environmental quality-based permit requirements is a continuing goal of this strategy. Attention should be given to identifying new problems as well as to controlling known problems.
-2-
3. Evaluate Control Programs:
SCDHEC will utilize its formal program management and reporting systems for guiding SCDHEC environmental quality monitoring activities and for evaluating SCDHEC program performance.
Program evaluation studies use environmental quality assessments to evaluate the
effects of pollution control programs on environmental conditions. Program evaluation studies will be performed as needed to evaluate the environmental results of major SCDHEC programs. To the extent feasible, data will be extracted from on-going SCDHEC regulatory monitoring studies.
Additional goals required for the accomplishment of the objectives outlined above
include:
Improving Data Quality: Quality assurance/quality control will continue to be a high priority. The goal is that all data used by SCDHEC for decision making will be of known and sufficient quality for the intended uses.
Data Management: The goal is that data systems will be made more useful so that SCDHEC managers will be able to use ambient data and assessments to determine the environmental impacts of decisions. This will be accomplished by cross-linking existing data systems and developing interactive data retrieval and analysis mechanisms usable by line managers and staff.

-3-
II. OVERVIEW OF THE SOUTH CAROLINA WATER QUALITY MONITORING PROGRAM
Under the Pollution Control and Clean Water Acts, SCDHEC has been delegated certain water quality monitoring duties. These include regulatory monitoring, water quality assessment and program evaluation as needed to fulfill the requirements of the aforementioned Acts. Within this framework specific responsibilities are as follows:
A. As first priority, the collection and analysis of data as needed to make water quality
management decisions:
1. Identification of waters not fully supporting designated uses and priority waterbodies, i.e., those waters most needing water quality-based controls or other actions to protect the designated use, and preliminary determination of the reason(s) for nonsupport when this occurs. Inclusion of this information in the biennial Section 305(b) Report to Congress. Focus is on toxics as well as conventional pollutants. Simple screening techniques may be appropriate for many situations.
2. Development of needed water quality-based controls for both conventional
and toxic pollutants. For toxics, use of both the pollutant-specific and the biomonitoring techniques, as appropriate.
3. As needed to supplement State and Regional regulatory monitoring, writing
effluent and ambient data collection requirements into permits for identifying waters in need of controls, developing controls, and assessing the effectiveness of these controls to ensure the use is maintained or restored.
B. Performance of any additional monitoring needed for the Section 305(b) Report to
Congress, including monitoring needed to determine the status of waters not fully supporting designated uses and the probable reason(s) for nonsupport.
C. Ensuring that needed environmental data are provided to EPA, including appropriate
assessment data; appropriate screening data; and all regulatory data, including data needed for approvals of water quality standards and wasteload allocations/total maximum daily loads.
D. Ensuring that appropriate quality assurance/quality control procedures have been
followed for all data used in State decision making and for all data reported to EPA, including data reported by dischargers.
To accomplish these responsibilities, several types of monitoring activities are carried
out by SCDHEC's Water Quality Monitoring Section, Aquatic Biology Section, Pollution Source Compliance Section, and Bureau of Environmental Services personnel. "Monitoring" is a simple term describing a multifaceted area composed of widely diverse activities. While there are different approaches and philosophies of water quality monitoring, it should always be remembered that monitoring is not an end in itself but is only a tool or mechanism to

-4-
achieve a particular set of goals and objectives.
The primary goal is the attainment and maintenance of fishable/ swimmable waters wherever possible as mandated by the Clean Water Act (CWA). The philosophy of water quality monitoring in South Carolina has been the recognition that monitoring is basically a service activity for the generation of accurate and timely data needed by program and administrative decision areas. Monitoring is a multifaceted discipline that requires a great deal of attention to each of those "facets" in order for the resulting data to be useful. Beyond this, however, is the necessity to use the monitoring area as a vehicle for a cohesive, inter-related approach to water pollution control via the diverse types of data that are a product of the monitoring system. It is through the monitoring program that sample acquisition, data management/reporting, program needs, committed tasks, and other such Departmental functions all meet. Thus, it is at this natural point of confluence that much opportunity is afforded for integration of sometimes apparently non-related tasks or programs into a step-wise, interrelated approach to the protection of water quality in the State.
South Carolina's monitoring activities can be separated into three broad categories
based on the types and intended uses of the data collected. In the following sections, each of these categories is defined, including a brief discussion of how the generated data are used.
1. Monitoring for Water Quality-Based Controls
The development of discharge controls based on receiving water quality is a very high priority. It involves the collection and analysis of effluent and ambient data to develop water quality-based National Pollutant Discharge Elimination System (NPDES) permit limits. This involves the calculation of Total Maximum Daily Loads (TMDL) for specific waterbodies and Wasteload Allocations (WLA) for point source discharges.
SCDHEC uses long-term ambient monitoring data and special study data, especially
intensive survey data, in developing WLAs and TMDLs. The kinds of data collected for this type of monitoring may include physical and chemical characterization of effluent and receiving waters, stream hydraulics, macroinvertebrate and fish community assessment of the receiving stream, periphyton/phytoplankton sampling, and static toxicity bioassays of effluents and receiving waters.
These data are used by the Water Quality Modeling Section in predictive
mathematical models to help determine waste treatment levels needed to maintain instream standards. The modelling results are then passed to engineers in the Water Facilities Permitting, and Industrial, Agricultural, and Stormwater Permitting Divisions to be used as the basis for setting final NPDES permit limits.
2. Monitoring for NPDES Permit Compliance and Enforcement
The NPDES permit is the principal regulatory tool for controlling the quantity of pollutants discharged to the State's waters and for obtaining data on point-source discharges. Data

-5-
supplied by the discharger in the form of routine Discharge Monitoring Reports (DMR) and data collected by SCDHEC personnel from Compliance Sampling Inspections (State CSI and Federal 3560), Federal Compliance Evaluation Inspections (CEI), State Operation and Maintenance Inspections (O&M), Performance Audit Inspections (PAI), Technical Assistance Evaluations, and Pretreatment Program Audit and Inspections are reviewed by the Pollution Source Compliance Section to determine the compliance status of a discharger.
In all instances of effluent noncompliance, enforcement actions are supported by all
of the above data supplied by the Pollution Source Compliance Section and all ambient monitoring, special studies, and biological monitoring data supplied by the Water Quality Monitoring and Aquatic Biology Sections. The majority of the routine inspections and physico-chemical ambient monitoring activities are conducted by the Bureau of Environmental Services personnel. Data secured and supplied by these monitoring activities are utilized in the majority of SCDHEC's Environmental Quality Control enforcement activities.
3. Water Quality Assessment
State administrators need to assess the quality of the aquatic environment so that they can make decisions concerning water program priorities and provide reports to the public on the state of the environment, important trends over time, and accomplishments. They also need to evaluate the effectiveness of control measures. Water quality assessments provide information necessary to meet these needs. Water quality assessments can be broken down into four main types; statewide probability-based surveys, routine long-term ambient monitoring, watershed water quality management, and special intensive surveys.
The statewide probability-based surveys form the basis of the biennial Report to
Congress describing the quality of the State of South Carolina waters, as required by Section 305(b) of the Clean Water Act. The data are assessed to determine the extent to which State waters meet the goals of the CWA and achieve the State designated use classifications and standards. A probability-based survey is a type of a monitoring design in which the population of interest is sampled in a fashion that allows statements to be made about the whole population based on a subsample, and produces an estimate of the accuracy of the assessment results. The advantage of the probability-based sampling design is that statistically valid statements about water quality can be made about large areas based on a relatively small subsample. Probability-based water quality data can be used to make inferences, with known confidence, about the condition of the water resources of the State.
Long-term ambient monitoring is accomplished through the Ambient Surface Water Quality Monitoring Network which consists of Integrator Sites, Special Purpose Sites, Sediment Stations, as well as Watershed Water Quality Management Stations and Biological Monitoring Stations. Data collected by this Network are used in the development of designated use classifications and water quality standards, which are in turn used to establish specific waterbody use classifications. Review of these ambient data help determine if existing water quality is adequate to protect existing and designated uses and if appropriate standards have been set. Used in such a manner, ambient data provide valuable feedback to the NPDES permit writing sections as an indication of the need for further discharge restrictions.

-6-
The data network forms the basis for the bulk of the §303(d) list of impaired waters and also supplies supporting data for the biennial §305(b) Report to Congress. In this manner, priority waterbodies (those not meeting designated use goals) may be identified for special study. Also, those waterbodies with water quality exceeding designated use classifications and standards may be identified and upgraded to new use classifications.
The SCDHEC Bureau of Water focuses its program activities using a Watershed
Water Quality Management Program, as described in the Program Description, 1995. Watershed water quality management recognizes the interdependence of water quality and all the activities that occur in the associated drainage basin including point source discharges, nonpoint source contributions, and land use characteristics. SCDHEC's Watershed Water Quality Management Program is dependent upon water quality data as the foundation for development of watershed management plans and implementation strategies on a rotating basis for each of the eight major basins in the State. These strategies serve to refocus water quality protection efforts including monitoring, assessment, problem identification and prioritization, wasteload allocation monitoring, planning, permitting, and other agency activities.
Assessment is accomplished, in part, through monitoring data collected at the
Ambient Surface Water Quality Monitoring Network Stations, Biological Monitoring Stations and Watershed Water Quality Management Stations. Each fiscal year, a significant portion of the Department's monitoring efforts are concentrated in a different basin grouping on a rotating basis. Watershed stations are located to provide more complete and representative coverage of sub-basins within the larger drainage basin and to identify waterbodies in need of additional control measures. Data from these stations, the Biological Monitoring Stations, and the Ambient Surface Water Quality Monitoring Network Stations, are then used to update the Watershed Water Quality Assessment for the particular watershed. In subsequent years these data will be used to measure the success of control efforts and to refine implementation strategies. Watershed stations are sampled every five years, following the order of rotation for the updating of the eight Watershed Water QualityAssessments.
Special Intensive Surveys are designed to address special concerns. They are used to
assess current conditions at sites not included in the Ambient Surface Water Quality Monitoring Network, substantiate enforcement decisions, follow up specific actions, respond to complaints or short-term problems, and collect data for use in the calculation of TMDLs and WLAs. They are often conducted in conjunction with compliance sampling to document ambient conditions and sources of environmental impact. They are often initiated to investigate apparent problems indicated by the Ambient Surface Water Quality Monitoring Network data and to determine the causes of nonsupport of designated uses. The data typically collected during such surveys can be physical and chemical water quality parameters, hydraulic stream characteristics, biological community sampling, effluent and compliance sampling, and toxicity testing.
Thus, water quality assessment is a broad term describing a great multitude of
monitoring and sampling activities. Water quality assessment data can be used to fulfill a variety of goals; assessment of current conditions, assessment of long-term trends,

-7-
determination of priority waterbodies, determination of waterbody designated use attainment or nonsupport, and identification of continuing or new problem areas.
By integrating all of these monitoring programs it is possible to identify the sources
of pollution and the reasons for nonattainment of designated uses, to address specific issues, determine the efficiency of pollution abatement programs, and allow administrative overview of program effectiveness.
At this point, some discussion and much emphasis must be directed toward the
quality assurance/quality control program. As has been stated previously numerous times, by numerous sources, water quality monitoring programs and resulting decisions are only as good as the quality (accurateness, precision) of the raw data. Suffice it to say here, that an active and effective quality assurance/control program is a major cornerstone of this State's monitoring program and is considered a primary contribution to the success of the program.
In designing studies, SCDHEC incorporates as many facets of these monitoring
activities as is necessary to allow a whole waterbody approach to managing water quality. This approach is very efficient, realizing a very complete picture of the water quality in a given waterbody with the minimum man-hours and duplication of effort. This is the result primarily of sound assessment design and effective organization and coordination of resources.
The last major consideration that has been given to developing a successful
monitoring program by South Carolina is the identification of the users of data or the sources of data requests. In South Carolina, this group is quite diverse ranging from individual citizens to public interest groups to various local/state/federal agencies. Data users are:
� Departmental program areas (e.g., domestic wastewater engineers)
� Water quality trend/ambient condition analysts
� Wasteload allocation analysts
� Public/private environmental groups
� Public at large
� Other local/state/federal agencies (regulatory & non-regulatory)
� Departmental administrators via program area outputs
While this large group utilizes the data for different reasons, the Department uses and
applies the data to the intermediate objectives and goals as previously discussed. This is done to ascertain whether progress is being made toward successful achievement of these goals and to make correct and appropriate decisions regarding maintenance and enhancement of desirable environmental quality in the State.
Implicit in the identification of users of the data, whether in-Department or
-8-
out-of-Department, is the capacity to communicate the data to interested parties efficiently and accurately. Technical reports or internal memoranda are produced for every special study and copies are available to any interested organization or persons. A list of technical reports is available upon request. Raw ambient monitoring data, and most special studies data with the exception of some biological data, are stored in the EPA STORET computer system. Ambient monitoring and special studies data are available in several formats through the Water Quality Monitoring Section.
Interpretations of the ambient monitoring data, including instream standards
compliance and long-term trend assessments, can be found in the Watershed Water Quality Assessment (WWQA) documents for each basin. These documents can be accessed by chapter via the Internet on SCDHEC’s Bureau of Water homepage, http://www.scdhec.net/water/. From the Bureau of Water homepage click on “Learn More About Watersheds”, or choose “Watersheds” from the Subject Index, and proceed to the geographic area of interest. Entire basin WWQA can be found under “Watershed Water Quality Management Strategies (WWQMS)” under the “Water Quality Reports” choice from the Subject Index.
Facility inspection data are stored in the EPA Permit Compliance System and can be
requested through the SCDHEC Freedom of Information Office.
Presently underway is the integration of certain program and service areas within the Department via a computer network such that communication between and among such areas will be greatly expedited and enhanced. Concomitant with this intra-Departmental improvement will be likewise enhancement of communication to interested parties outside the Department. Since the computer network will allow more data to be handled more efficiently at a quicker pace, less time and effort will have to be spent by employees in handling the data and more time and effort will be spent on extracting what the data means and communicating that message to users.
In the following sections, each aspect of the SCDHEC monitoring program is
presented in detail. Included are descriptions of station locations, sampling frequency, parameter coverage, and quality assurance quality control procedures.

-9-
III. AMBIENT SURFACE WATER QUALITY MONITORING NETWORK
The purpose of the Ambient Surface Water Quality Monitoring Network is to provide a system of monitoring sites that are sampled in a way that produces well defined data reflecting physical, chemical and biological conditions of the streams, reservoirs and estuaries in South Carolina. The Ambient Surface Water Quality Monitoring Network has recently undergone extensive review and modification. These changes were implemented beginning in January 2001 and are documented in the following sections.
All sampling procedures and analyses are performed in accordance with the State Quality Assurance Management Office (SQAMO) and all procedures follow the Environmental Investigations Standard Operating Procedures and Quality Assurance Manual (SCDHEC) and Procedures Manual for Stream and Wastewater Facility Flow Measurement (SCDHEC).
A. Integrator Sites
Integrator Sites represent the base network of 314 permanent, fixed-location, monitoring sites (Figure 1). Integrator Sites are sampled once per month, year round, over an extended period of time, in a uniform manner to provide solid baseline data. Integrator Sites target the most downstream access of each of the Natural Resource Conservation Service (NRCS) 11-digit watershed units (WSU) in the state, as well as the major waterbody types that occur within these WSUs. For example, where a WSU ends in a major reservoir, an Integrator Site is placed in the impounded area to represent reservoir conditions, and another Integrator Site is generally placed in the main stream feeding that part of the reservoir to represent conditions in the free-flowing portion of the WSU. Similarly, in a primarily riverine WSU ending in estuarine areas at the coast, Integrator Sites may be placed in both the free-flowing freshwater portion as well as the saltwater area to represent conditions in both habitats. The result is consistent data from all WSUs which can be used in tracking standards compliance and long-term trends.
By reviewing data and establishing trends in water quality, the Integrator Site network aids in identifying stream segments as effluent limited or water quality limited. Intensive water quality surveys, enforcement proceedings or other actions may be based on this trend data.
Sites are grouped according to the SCDHEC regional Laboratory District office responsible for their collection. The number of Integrator Sites per Laboratory District are:
Greenville 48 Florence 56 Aiken 56 Columbia 40 Charleston 61 Lancaster 47
In addition, 6 Integrator Sites are collected by the Santee Cooper Public Service Authority in a cooperative effort.

#
#
#$
# #
#
#
#
#
#
#
#
#
#
#
#
#
#
#
#
#
#
#
#
#
#
#
#
$
#
#
##
#
$$ ### ### $ $# $# # ### # $# #$$ #### ##Y ##$ ## ##Y #$# $# #$$#Y ##$ # # ## ###Y ## #### # #### ## # ### ### ##% ## ### ### ## ## ###% ### %
# ### $# ## # # # #% ## # ###### ### ## ## ## ###
#% $ ### # # ## ## #### ### ## #Y#Y ## ## $ ## # ## ##Y ### ## ### ### ## # ## ### ### ## $## # ## #
# #### $# ## # ### # ## ## #
### ## ### #
# ## ### # # # ## # ### #
# ## ### # ##### # $# $ #### $# $# ## # # $# #### #
# ## #
#Y
## # #
#
$#
#
#
####
#
###
#
# #
#
#
###
#
##
#
#
##
#
##
#
$
#
!
!
!$
! !
!
!
!
!
!
!
!
!
!
!
!
!
!
!
!
!
!
!
!
!
!
!
!
$
!
!
!!
!
$$ !!! !!! $ $! $! ! !!! ! $! !$$ !!!! !#Y !!$ !! !#Y !$! $! !$$#Y !!$ ! ! !! !!#Y !! !!!! ! !!!! !! ! !!! !!! !!% !! !!! !!! !! !! !!!% !!! %
! !!! $! !! ! ! ! !% !! ! !!!!!! !!! !! !! !! !!!
!% $ !!! ! ! !! !! !!!! !!! !! #Y#Y !! !! $ !! ! !! !#Y !!! !! !!! !!! !! ! !! !!! !!! !! $!! ! !! !
! !!!! $! !! ! !!! ! !! !! !
!!! !! !!! !
! !! !!! ! ! ! !! ! !!! !
! !! !!! ! !!!!! ! $! $ !!!! $! $
! !! ! ! $! !!!! !
! !! !
#Y
!! ! !
!
$!
!
!
!!!!
!
!!!
!
! !
!
!
!!!
!
!!
!
!
!!
!
!!
!
$
!
0 30 60 90 Miles
Figure 1. SCDHEC PermanentFixed Monitoring Sites
New Monitoring Strategy Sites# Integrator Sites$ Special Purpose Sites% Summer Only Sites#Y Sediment Only Sites
N
-10-

-11-
Integrator Sites and location descriptions are listed by Laboratory District in Appendix A, and by waterbody name in Appendix B. Parameter coverage, frequency of analysis, and STORET parameter codes are given in Appendices C and D.
B. Special Purpose Sites
Special Purpose Sites are also permanent, fixed-location sites, but represent locations of special interest to the Department that do no meet the location criteria of Integrator Sites (Figure 1). Examples of site selection criteria for establishment of Special Purpose Sites includes, but is not restricted to:
1. To track the progress of specific remediation activities.
2. To gather additional data in specific areas for the development of total
Maximum Daily Loads (TMDLs).
3. To supplement the data from Integrator Sites in very large WSUs.
4. To obtain data from major tributary streams whose confluence with the main waterbody is downstream of the last accessible point in the WSU.
The majority of Special Purpose Sites (28) are also sampled once per month, year round, over an extended period of time. However, because of the specific circumstances some are intended to evaluate, this is not universal. In addition to the year-round locations, there are 5 Summer-Only Sites sample monthly May through October to track specific reservoir eutrophication concerns. There are also 8 sites where only sediment samples are collected, once per year, to track locations where sediment contamination is a specific concern.
There are currently 28 year-round Special Purpose Sites distributed amongst the regional Laboratory Districts as follows:
Greenville 7 Florence 6 Aiken 0 Columbia 1 Charleston 6 Lancaster 8
Special Purpose Sites and descriptions are listed by region in Appendix A, and by water body name in Appendix B. Parameter coverage, sampling frequency, and STORET parameter codes are given in Appendices C and D.
C. Watershed Water Quality Management (WWQM) Sites
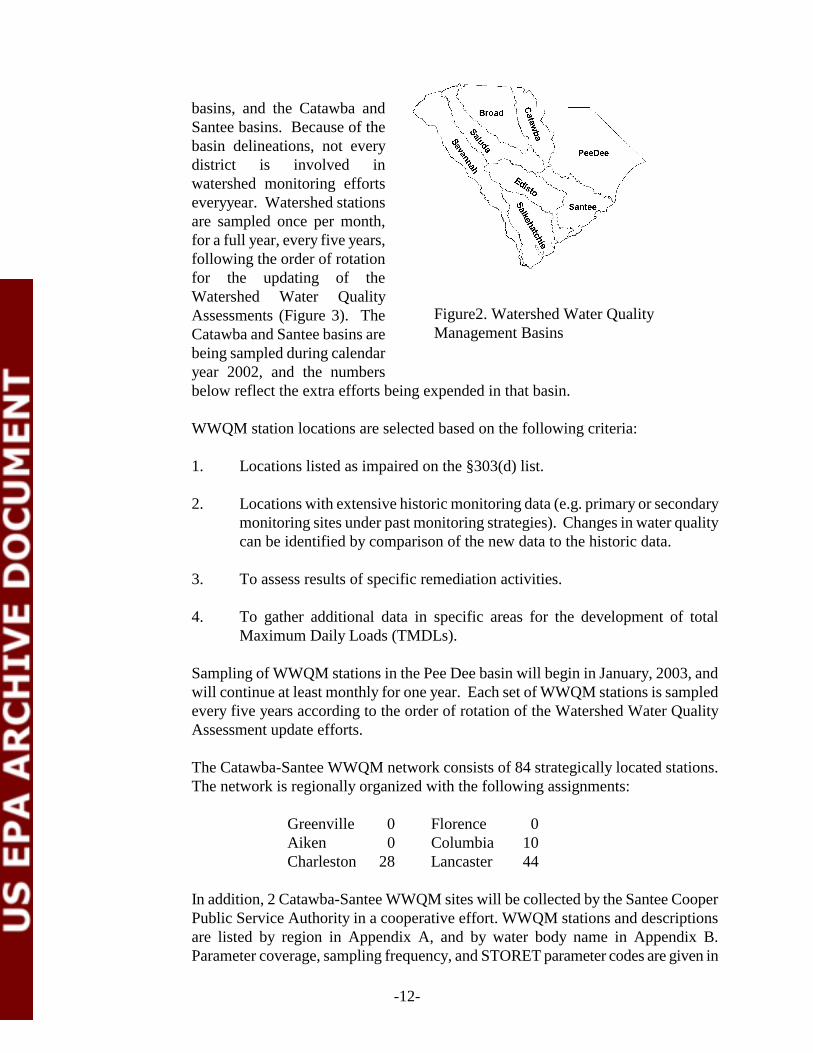
Each calendar year, additional monitoring efforts are concentrated in one or more the eight major basins in the State (Figure 2). For monitoring purposes, the Savannah and Salkehatchie basins are sampled in the same year, as are the Saluda and Edisto
-12-
basins, and the Catawba and Santee basins. Because of the basin delineations, not every district is involved in watershed monitoring efforts everyyear. Watershed stations are sampled once per month, for a full year, every five years, following the order of rotation for the updating of the Watershed Water Quality Assessments (Figure 3). The Catawba and Santee basins are being sampled during calendar year 2002, and the numbers below reflect the extra efforts being expended in that basin.
WWQM station locations are selected based on the following criteria:
1. Locations listed as impaired on the §303(d) list.
2. Locations with extensive historic monitoring data (e.g. primary or secondary
monitoring sites under past monitoring strategies). Changes in water quality can be identified by comparison of the new data to the historic data.
3. To assess results of specific remediation activities.
4. To gather additional data in specific areas for the development of total
Maximum Daily Loads (TMDLs).
Sampling of WWQM stations in the Pee Dee basin will begin in January, 2003, and will continue at least monthly for one year. Each set of WWQM stations is sampled every five years according to the order of rotation of the Watershed Water Quality Assessment update efforts.
The Catawba-Santee WWQM network consists of 84 strategically located stations. The network is regionally organized with the following assignments:
Greenville 0 Florence 0 Aiken 0 Columbia 10 Charleston 28 Lancaster 44
In addition, 2 Catawba-Santee WWQM sites will be collected by the Santee Cooper Public Service Authority in a cooperative effort. WWQM stations and descriptions are listed by region in Appendix A, and by water body name in Appendix B. Parameter coverage, sampling frequency, and STORET parameter codes are given in
Figure2. Watershed Water Quality Management Basins

#
#
### # ##$ #$ %# %# %$ # %## ## # %# % %# %%$ #$ # % %# # # %$ # # %# %$ # %## # %# ## %# # %## # %### ##$ %%##### %# # # %#$ #$ %$ # ### %##$# $ #$# %$# # $# ## %%# ## ## ### #### ### ##%### # #%## ## # %% #$# ## %## % %$# # ## # %$ #### ## ## ### ## ### # ###%%# ## %# # ##$ ## ##$ #$ #$# $## $$## #### % #% % # ## ### # ### ### #$ %$# ### $ $ # #%$ #$ $ #%$ # ## #%$ % ## $ #$# $ ##$ # ###$# # $ # ##$ #%# %$ ##$$ $ $# $ $ $$ $ ##$ #$ $$$$ $ # #$$$ ##$ $ ## %$$ $$$# $ $$# $ ## ## ### $ # ##$$## #$ ##$ #$ #$ ## ## #%# %$$# ##%#####
# %$# $ %## $# $$#$ % # ## #% ##$ #
## $# %#
# $ %# $%$ % %%
# % %## %%# % %%## %%% %# # %%%%% %$ %%# $## %%# ## $$# # $##### #
# ## ###
#
$$$
#
%
##
#$
!
!
!!! ! !!¥ !¥ g! g! g¥ ! g!! !! ! g! g g! gg¥ !¥ ! g g! ! ! g¥ ! ! g! g¥ ! g!! ! g! !! g! ! g!! ! g!!! !!¥ gg!!!!! g! ! ! g!¥ !¥ g¥ ! !!! g!!¥! ¥ !¥! g¥! ! ¥! !! gg! !! !! !!! !!!! !!! !!g!!! ! !g!! !! ! gg !¥! !! g!! g g¥! ! !! ! g¥ !!!! !! !! !!! !! !!! ! !!!gg! !! g! ! !!¥ !! !!¥ !¥ !¥! ¥!! ¥¥!! !!!! g !g g ! !! !!! ! !!! !!! !¥ g¥! !!! ¥ ¥ ! !g¥ !¥ ¥ !g¥ ! !! !g¥ g !! ¥ !¥! ¥ !!¥ ! !!!¥! ! ¥ ! !!¥ !g! g¥ !!¥¥ ¥¥! ¥ ¥ ¥¥ ¥ !!¥ !¥¥¥¥¥ ¥ ! !¥¥¥ !!¥ ¥ !! g¥¥ ¥¥¥! ¥ ¥¥! ¥ !! !! !!! ¥ ! !!¥¥!! !¥ !!¥ !¥ !¥ !! !! !g! g¥¥! !!g!!!! !
! g¥! ¥ g!! ¥! ¥¥! ¥ g ! !! !g !!¥ !!
! ¥! g!! ¥ g! ¥
g¥ g gg! g g!! gg! g gg!! ggg g! ! ggggg g¥ gg! ¥!
! gg! !! ¥¥! ! ¥!!!!! !
! !! !!!
!
¥¥¥
!
g
!!
!¥
0 30 60 90 Miles
Figure 3. SCDHEC Annual WatershedWater Quality Management Sites
Annual Watershed Boundaries
N
-13-

-14-
Appendices C and D. D. Probability-Based Monitoring Sites
A Probability-Based monitoring design is a type of a survey design in which the population of interest is sampled in a fashion that allows statements to be made about the whole population based on a subsample, and produces an estimate of the accuracy of the assessment results. The advantage of the probability-based sampling design is that statistically valid statements about water quality can be made about large areas based on a relatively small subsample. Probability-based water quality data can be used to make inferences, with known confidence, about the condition of the water resources of the State.
A statewide probability-based, or random sampling, component is part of the Ambient Surface Water Quality Monitoring Network. Separate monitoring schemes have been developed for stream, lake/reservoir, and estuarine resources as described below. Each year a new set of probability-based sites are selected for each waterbody type. Site selection is done in association with the U.S. Environmental Protection Agency, National Health and Environmental Effects Research Laboratory (NHEERL), Corvallis, Oregon. Although statements about resource conditions can theoretically be made based on data from a single year, the compilation of data from additional years will increase the confidence and accuracy of statements about water quality. An additional advantage of the probability-based approach is that it presents the opportunity for previously unsampled locations to be selected for data collection.
Streams
Approximately 30 random sites will be sampled in streams each year (Figure 4). Each site will be sampled monthly for one year and all will be targeted for an annual sediment sample and will also be prioritized for a macroinvertebrate community and habitat analysis. Streams of different sizes may be more or less sensitive to different types of environmental perturbations. Because of this, three stream sizes have been specifically targeted to ensure they are represented in the selected random sites.
1. First Order streams, or headwater streams, are targeted because these
represent streams with the least dilution capacity and therefore are most immediately impacted by adjacent land use activities and associated runoff. These streams may also serve as spawning areas for fish and refuge areas for young from larger aquatic predators.
2. Second Order streams, which are also streams with relatively small dilution
capacity and represent important habitat for reproduction and survival of aquatic life. They may also reflect the direct impacts of major land use activities.
3. Third Order and larger streams, which include the major rivers of the State.

#S
#S
#S
#S
#S
#S
#S
#S
#S
#S
#S#S
#S
#S
#S
#S
#S
#S
#S
#S
#S
#S#S
#S
#S
#S
#S
#S
#S
#S
$T
$T
$T
$T
$T
$T
$T
$T
$T
$T
$T
$T
$T
$T
$T
#
#
#
#
#
#
#
#
#
#
#
#
#
#
#
##
#
#
#
#
#
#
#
#
#
#
#
#
#
$T
$T
$T
$T
$T
$T
$T
$T
$T$T
$T
$T
$T
$T
$T
0 30 60 90 Miles
Figure 4. SCDHEC 2002 RandomMonitoring Sites
N2002 Random SitesStreamsLakesEstuary
#
#S
$
-15-
-16-
In general these streams have greater dilution capacity and are less affected by small scale land use perturbations and may be heavily utilized for contact recreation. These different sizes do not occur in equal proportions in the state, therefore an unequal weighting procedure is used in the site selection process to guarantee inclusion of all three sizes.
The 2002 Random Stream Sites are distributed by Laboratory District as follows:
Greenville 8 Florence 7 Aiken 5 Columbia 3 Charleston 4 Lancaster 3
Random Stream Sites and location descriptions are listed by Laboratory District in Appendix A, and by waterbody name in Appendix B. Parameter coverage, frequency of analysis, and STORET parameter codes are given in Appendices C and D.
Lakes/Reservoirs
Approximately 30 random sites will be sampled in lakes/reservoirs each year (Figure 4). Each site will be sampled monthly for one year and all will be targeted for an annual sediment sample. Eligible lakes/reservoirs are restricted to “significant lakes”, which refers to those freshwater lakes/reservoirs with at least 40 acres surface area that offer public access. The size of significant lakes/reservoirs varies immensely, therefore two size classes of lakes/reservoirs have been specifically targeted to ensure that the smaller lakes/reservoirs are represented in the selected random sites.
1. Major Lakes/Reservoirs greater than 850 acres surface area.
2. Minor Lakes/Reservoirs greater than 40 acres surface area, but less than or
equal to 850 acres.
These different sizes do not occur in equal proportions in the state, therefore an unequal weighting procedure is used in the site selection process to guarantee inclusion of both sizes.
The 2002 Random Lake/Reservoir Site network is regionally organized with the following assignments:
Greenville 14 Florence 0 Aiken 2 Columbia 3 Charleston 1 Lancaster 4
In addition, 6 Random Lake/Reservoir Sites will be collected by the Santee Cooper Public Service Authority in a cooperative effort. Random Lake/Reservoir Sites and location descriptions are listed by Laboratory District in Appendix A, and by
-17-
waterbody name in Appendix B. Parameter coverage, frequency of analysis, and STORET parameter codes are given in Appendices C and D.
Estuaries
The coastal estuarine probability-based monitoring scheme has been developed jointly by SCDHEC, Bureau of Water, and the South Carolina Department of Natural Resources (SCDNR), Marine Resources Research Institute (MRRI). This effort has been dubbed the South Carolina Estuarine and Coastal Assessment Program (SCECAP) and sampling of the probability-based coastal estuarine sites is a cooperative venture between SCDHEC and SCDNR-MRRI. To ensure inclusion of a variety of estuarine ecosystems and habitats, the coastal estuaries have been divided into two discrete categories (strata) based on a common GIS cover developed and utilized by both agencies.
1. Tidal Creeks, identified as less than 100 meters wide on the GIS cover, serve
as nursery areas for important marine species and are most immediately affected by upland land use activities and associated runoff.
2. Open Water areas, identified as greater than 100 meters wide on the GIS
cover, represent larger estuarine rivers and sounds.
Within these waterbody types there are two distinct types of monitoring sites based on sampling frequency, Core Sites and Supplemental Sites. Core Sites are sampled monthly for one year by SCDHEC for water column physical and chemical parameters (Figure 4). SCDNR-MRRI samples annually for sediment chemistry, sediment physical characteristics, sediment toxicity, benthic infaunal community composition, 24-48 hour hydrolab deployments, and fish trawls. One additional set of water column samples is collected by SCDHEC in conjunction with SCDNR-MRRI sampling.
The Supplemental Sites are sampled one time by SCDNR-MRRI for sediment chemistry, sediment physical characteristics, sediment toxicity, benthic infaunal community structure, 24-48 hour hydrolab deployments, and fish trawls. One set of water column samples is collected by SCDHEC in conjunction with the SCDNR-MRRI sampling.
Each year there will be approximately 15 Core Tidal Creek sites, 15 Core Open Water sites, 15 Supplemental Tidal Creek sites, and 15 Supplemental Open Water sites.
The total number of 2002 Random Estuary Sites are distributed between two Laboratory Districts with the following assignments:
Charleston 28 Florence 2
Core Tide Creek and Core Open Water Sites and location descriptions are listed by

-18-
Laboratory District in Appendix A, and by waterbody name in Appendix B. Parameter coverage, frequency of analysis, and STORET parameter codes are given in Appendices C and D.
E. Sediment Sampling
Many pollutants may be components of point source discharges, but may be discharged in a discontinuous manner, or at such low concentrations that water column sampling for them is impractical. Some pollutants are also common in nonpoint source runoff, reaching waterways only after a heavy rainfall, and therefore may be missed in the routine water column samples. Aquatic sediments represent a historical record of chronic conditions existing in the water column. Pollutants bind to particulate organic matter in the water column and settle to the bottom where they become part of the sediment "record". As a result of this process of sedimentation, contaminant concentrations originating from irregular and highly variable sources are recorded in the sediment. The sediment concentrations at a particular location do not vary as rapidly with time as do the water column concentrations. Thus, the sediment record may be read at a later time not directly related to the actual discharge. By their nature reservoirs act as settling basins for materials entering the reservoir watershed directly from point source discharges or indirectly via nonpoint source runoff from the land surface. Therefore, it is not unusual for reservoir sediment concentrations to be higher than sediment concentrations found in streams.
Sediment samples are collected once per year at all probability-based monitoring sites. All samples collected at random lake/reservoir and stream sites are analyzed by SCDHEC. Sediment samples at the random Core and Supplemental estuarine sites are collected by SCDNR-MRRI and analyzed by the National Oceanic and Atmospheric Administration (NOAA) National Ocean Service (NOS) laboratory located at Fort Johnson, South Carolina.
Sediment samples are also collected annually at other selected monitoring sites. These sites include 87 permanent, fixed-location sites with historic sediment data. In addition, each year sediment samples are collected at a selection of WWQM sites based on historic data or specific data needs.
In calendar year 2002 SCDHEC will analyze 164 sediment samples for routine parameters (percent moisture, percent volatile solids, nutrients, metals, pesticide and PCB scan, see Appendix D) and 38 samples for base neutral and acid extractable organic compounds and volatile organic compounds (see Appendix D). Sites where sediments are analyzed are identified in Appendix C and location descriptions are listed by region in Appendix A, and by water body name in Appendix B.

-19-
F. Schedule for the Ambient Surface Water Quality Monitoring Program for Calendar Year 2002 by Laboratory District
The following is the schedule for collection of non-monthly parameters for each District Laboratory. The schedule includes the number of each type of sample to be collected, and it also includes the month(s) for collection. All other parameters, with the exception of chlorophyll a, are collected every month. Please refer to Section A, B, C and D and Appendix C and Appendix D for details relevant to specific parameters for each station.
Lab: Greenville
Permanent Year-Round Surface Sites (Integrators and Special Purpose)-- 55 Total -Quarterly for metals and TOC -- January, April, July, and October -Annually for hardness (selected stations) -- July -Bi-Monthly for TKN, Ammonia, and Alkalinity
January, March, May, July, September, and November -- 31 Sites February, April, June, August, October, and December -- 24 Sites
Watershed Surface Sites -- 0 Total -Quarterly for metals and TOC -- January, April, July, and October -Annually for hardness (selected stations) -- July -Bi-Monthly for TKN, Ammonia, and Alkalinity
January, March, May, July, September, and November -- 0 Sites February, April, June, August, October, and December -- 0 Sites
Probability-Based Surface Sites -- 22 Total -Quarterly for metals and TOC -- January, April, July, and October -Annually for hardness (selected stations) -- July -Bi-Monthly for TKN, Ammonia, and Alkalinity
January, March, May, July, September, and November -- 9 Sites February, April, June, August, October, and December -- 13 Sites
Summer-Only Surface Sites -- 4 Total -Collected from May through October -Quarterly for metals and TOC -- July and October -Annually for hardness (selected stations) -- July -Bi-Monthly for TKN, Ammonia , andAlkalinity
May, July, and September -- 2 Site June, August, and October -- 2 Sites
Group 1 Sediment Sites -- 19 -Collected in April
Group 2 Sediment Sites -- 20 -Collected in May

-20-
Lab: Aiken
Permanent Year-Round Surface Sites (Integrators and Special Purpose) -- 56 Total -Quarterly for metals and TOC -- March, June, September and December -Annually for hardness (selected stations) -- December
-Bi-Monthly for TKN, Ammonia, and Alkalinity
January, March, May, July, September, and November -- 29 Sites February, April, June, August, October, and December -- 27 Sites
Watershed Surface Sites -- 0 Total -Quarterly for metals and TOC -- March, June, September, and December -Annually for hardness (selected stations) -- December -Bi-Monthly for TKN, Ammonia, and Alkalinity
January, March, May, July, September, and November -- 0 Sites February, April, June, August, October, and December -- 0 Sites
Probability-Based Surface Sites -- 7 Total -Quarterly for metals and TOC -- March, June, September, and December -Annually for hardness (selected stations) -- December -Bi-Monthly for TKN, Ammonia, andAlkalinity
January, March, May, July, September, and November -- 2 Sites February, April, June, August, October, and December -- 5 Sites
Group 1 Sediment Sites -- 7 -Collected in December
Group 2 Sediment Sites -- 7 -Collected in August
Lab: Charleston
Permanent Year-Round Surface Sites (Integrator and Special Purpose) -- 67 Total -Quarterly for metals and TOC -- January, April, July, and October -Annually for hardness (selected stations) -- January -Bi-Monthly for TKN, Ammonia, andAlkalinity
January, March, May, July, September, and November -- 30 Sites February, April, June, August, October, and December -- 37 Sites
Watershed Surface Sites -- 28 Total -Quarterly for metals and TOC -- January, April, July and October -Annually for hardness (selected stations) -- January -Bi-Monthly for TKN, Ammonia, and Alkalinity
January, March, May, July, September, and November -- 16 Sites

-21-
February, April, June, August, October, and December -- 12 Sites
Probability-Based Surface Sites -- 33 Total -Quarterly for metals and TOC -- January, April, July and October -Annually for hardness (selected stations) -- January -Bi-Monthly for TKN, Ammonia, andAlkalinity
January, March, May, July, September, and November -- 22 Sites February, April, June, August, October, and December -- 11 Sites
Group 1 Sediment Sites -- 16 - Collected in November
Group 2 Sediment Sites -- 16 - Collected in September
Lab: Florence
Permanent Year-Round Surface Sites (Integrators and Special Purpose) -- 62 Total -Quarterly for metals and TOC -- February, May, August, and November -Annually for hardness (selected stations) -- February -Bi-Monthly for TKN, Ammonia, and Alkalinity
January, March, May, July, September, and November -- 29 Sites February, April, June, August, October, and December -- 33 Sites
Watershed Surface Sites -- 0 Total -Quarterly for metals and TOC -- November, February, May and August -Annually for hardness (selected stations) -- February -Bi-Monthly for TKN, Ammonia, and Alkalinity
January, March, May, July, September, and November -- 0 Sites February, April, June, August, October, and December -- 0 Sites
Probability-Based Surface Sites -- 9 Total -Quarterly for metals and TOC -- November, February, May and August -Annually for hardness (selected stations) -- February -Bi-Monthly for TKN, Ammonia, and Alkalinity
January, March, May, July, September, and November -- 5 Sites February, April, June, August, October, and December -- 4 Sites
Group 1 Sediment Sites -- 10 -Collected in January
Group 2 Sediment Sites -- 10 -Collected in October
Lab: Columbia
Permanent Year-Round Surface Sites -- 41 Total

-22-
-Quarterly for metals and TOC -- February, May, August, and November -Annually for hardness (selected stations) -- February -Bi-Monthly for TKN, Ammonia, and Alkalinity
January, March, May, July, September, and November -- 13 Sites February, April, June, August, October, and December -- 28 Sites
Watershed Surface Sites -- 10 Total -Quarterly for metals and TOC -- February, May, August, and November -Annually for hardness (selected stations) -- February -Bi-Monthly for TKN, Ammonia, and Alkalinity
January, March, May, July, September, and November -- 6 Sites February, April, June, August, October, and December -- 4 Sites
Probability-Based Surface Sites -- 6 Total -Quarterly for metals and TOC -- February, May, August, and November -Annually for hardness (selected stations) -- February -Bi-Monthly for TKN, Ammonia, andAlkalinity
January, March, May, July, September, and November -- 4 Sites February, April, June, August, October, and December -- 2 Sites
Summer-Only Surface Sites -- 1 Total -Collected from May through October -Quarterly for metals and TOC -- May and August -Bi-Monthly for TKN, Ammonia, and Alkalinity
May, July, and September -- 1 Site Group 1 Sediment Sites -- 11 -Collected in February
Group 2 Sediment Sites -- 12 -Collected in June
Lab: Lancaster
Permanent Year-Round Surface Sites (Integrators and Special Purpose) -- 55 Total -Quarterly for metals and TOC -- March, June, September, and December -Annually for hardness (selected stations) -- March -Bi-Monthly for TKN, Ammonia, and Alkalinity
January, March, May, July, September, and November -- 34 Sites February, April, June, August, October, and December -- 21 Sites
Watershed Surface Sites -- 44 Total -Quarterly for metals and TOC -- March, June, September, and December -Annually for hardness (selected stations) -- March -Bi-Monthly for TKN, Ammonia, and Alkalinity
January, March, May, July, September, and November -- 14 Sites

-23-
February, April, June, August, October, and December -- 30 Sites
Probability-Based Surface Sites -- 7 Total -Quarterly for metals and TOC -- March, June, September, and December -Annually for hardness (selected stations) -- March -Bi-Monthly for TKN, Ammonia, and Alkalinity
January, March, May, July, September, and November -- 5 Sites February, April, June, August, October, and December -- 2 Sites
Group 1 Sediment Sites -- 16 -Collected in March
Group 2 Sediment Sites -- 17 -Collected in July
G. Biological Monitoring
The biological monitoring network provides information which will allow for the detection and evaluation of changes in the stability of aquatic communities. The various activities falling under the biological monitoring program are detailed below.
1. Macroinvertebrates - Qualitative samples of aquatic macroinvertebrates will
be collected from approximately 80 wadeable stream stations. Priority will be given to the probability-based stream sites, with the remaining sites located in the Catawba-Santee Basin in support of the Watershed Water Quality Management Strategy. Past macroinvertebrate monitoring sites are listed in Appendix E.
The data from these collections will be evaluated using taxa richness, EPT Index (Ephemeroptera, Plecoptera, and Trichoptera), Biotic Index, and other biometrics deemed necessary to determine the ecological health of the aquatic communities in accordance with Standard Operating and Quality Control Procedures for Macroinvertebrate Sampling (SCDHEC, 1998). Accordingly, these techniques, along with habitat assessment will be used to define the water quality relative to aquatic life uses.
2. Fish Tissue - The collection of fish for the purpose of tissue analysis is
necessary to detect the presence and levels of heavy metals, pesticides and toxic organic compounds in edible tissue which may concentrate through aquatic food chains and threaten the health of human consumers. Aquatic organisms may accumulate contaminants through gills and epithelial tissue directly from water and sediment (bioconcentration), a combination of bioconcentration and dietary sources (bioaccumulation), or a process by which the tissue concentrations increase as the contaminant passes up the food chain (biomagnification). Data collected is used to issue consumption advisories for the protection of public health when necessary.
A Statewide Survey for mercury contamination was initiated in 1993. This

-24-
sampling will be continued in CY 2002. Largemouth bass (Micropterus salmoides) and one other common game fish will be sampled at approximately 100 freshwater sites in CY 2002. Generally at least ten samples from each site will be analyzed for mercury and one to two samples from each site will be analyzed for other heavy metals, pesticides and PCBs. Monitoring sites locations are listed in Appendix F. All sample collection and handling will be in accordance with Standard Operating Procedures: Fish and Shellfish Collection for Tissue Analysis (SCDHEC, Draft Revision 0, December, 1994).
Through a cooperative effort, the South Carolina Department of Natural Resources, Marine Resources Research Institute, is furnishing 15 saltwater fish per month for tissue analysis. Red drum, spotted sea trout, and southern flounder are the target species. Emphasis will be placed on Upper and Lower Cape Romain, the Ashley River, Charleston Harbor, the Cooper River, the ACE basin, and the Wando River. Through a cooperative effort with other coastal Southeastern states, King mackerel and Spanish mackerel will be collected from selected tournaments and SCDNR routine sampling. The resulting data will be used to supplement the current advisories on mackerel.
The SCDHEC uses a risk-based approach to evaluate contaminant concentrations in fish tissue and to issue consumption advisories in affected waterbodies. This approach contrasts the average daily exposure dose to the reference dose (RfD). Using these relationships, fish tissue data are interpreted by determining the consumption rates that would not be likely to pose a health threat to adult males and nonpregnant adult females. Because an acceptable RfD for developmental neurotoxicity has not been developed and because scientific studies suggest that exposure before birth may have adverse effects the health of infants, pregnant women, infants, and children are advised to avoid consumption of fish from any waterbody where an advisory has been issued.
3. Phytoplankton - Phytoplankton are the microscopic plants that live free-
floating and suspended in bodies of water. Plankters have long been used as indicators of water quality and are more indicative of water quality in lentic systems rather than in the lotic environment.
Certain species of phytoplankton flourish in highly eutrophic waters while distinct types are very sensitive to organic and/or other chemical wastes. Some species are capable of producing noxious blooms in the form of highly turbid water, floating algal mats, or surface scums. Offensive odors and tastes may develop from these blooms, thereby spoiling a water resource for its various uses. Anoxic conditions which may kill fish and other aquatic life can also result from excessive algal blooms. Toxic conditions resulting in human illness and animal deaths can be created by a few phytoplankton species. Phytoplankton also strongly influence nonbiological aspects of water quality such as pH, dissolved oxygen, color, taste, and odor. These factors
-25-
make phytoplankton an integral part of overall water quality.
The algal biomass and species composition of plankters is therefore likely to be indicative of water quality in a selected waterbody.
Approximately 60 phytoplankton samples will be analyzed from selected sites during CY 2002 based on association with algal blooms and/or lack of historic data. These samples will be analyzed for species composition and relative phytoplankton abundance. From these data, determinations concerning community structure, taxa richness, and the presence or absence of indicator species can be made. An assessment of water quality is then made using these conclusions in conjunction with any additional physicochemical and biological data from the same location.
The primary objectives of the phytoplankton monitoring program are to assess current water quality in the lakes/reservoirs of interest and to provide a baseline of data to observe any potential changes. In addition, phytoplankton samples are submitted for analysis through inquiry or complaint by the public about algal-related problems.
4. Chlorophyll- Chlorophyll a is useful measure of the trophic status and algal
biomass in a waterbody. The rationale and objectives for monitoring for chlorophyll a mirrors those described above for phytoplankton. For CY 2002, chlorophyll a samples will be collected monthly, May through October, at 102 monitoring sites. These sites include all lake locations among the current WWQM basin sites, Integrator Sites, Special Purpose Sites, and Summer-Only Sites, as well as all Random Lake Sites and all Core Random Estuarine Sites. One additional chlorophyll a sample will be collected by SCDHEC at each Core Random Estuarine Sites, as well as one sample at each Supplemental Random Estuarine Site, in conjunction with SCDNR-MRRI sampling.
H. Shellfish Monitoring Fixed-Monitoring Network
South Carolina’s coastal area consist of 571,040 acres of surface water with an assigned classification designated for the harvest of molluscan shellfish. This coastal area is divided into 25 shellfish management areas with a total of 465 active monitoring stations. The purpose of this monitoring network is to provide data which accurately reflects the sanitary conditions of coastal shellfish and shellfish growing waters in South Carolina in order to ensure that the health of shellfish consumers is protected.
The shellfish monitoring program provides the database which is used in conducting a comprehensive evaluation of each shellfish growing area. Evaluation of growing areas, which meet National Shellfish Sanitation Program (NSSP) requirements for

-26-
Triennial Reviews, are conducted annually. Routine monitoring and subsequent laboratory analyses of water quality from strategically located sample sites are conducted monthly. Sampling is based on a “Systematic Random Sampling” methodology in which shellfish growing area surface waters are sampled in accordance with a pre-established schedule, thereby assuring that a statistically representative cross-section of meteorological, hydrographic, and/or pollution events will be included in the data set. Resulting laboratory analysis provides physical and bacteriological data which is used to classify shellfish growing waters. The monitoring network also serves to provide sanitary-related data from each shellfish area during the harvesting season to ensure that conditions which existed during the comprehensive evaluation still prevail; that the harvest classification is correct; and, ultimately that shellfish are safe to be consumed by the public once harvested. All shellfish waters receive one of the following harvest classifications.
Approved: Growing areas shall be classified "approved" when the sanitary survey
concludes that fecal material, pathogenic microorganisms, and poisonous or deleterious substances are not present in concentrations which would render shellfish unsafe for human consumption. "Approved" area classification shall be determined upon a sanitary survey which includes water samples collected from stations in the designated area adjacent to actual or potential sources of pollution. For waters sampled under adverse pollution conditions, the median fecal coliform Most Probable Number (MPN) or the geometric mean MPN shall not exceed fourteen per one hundred milliliters, and not more than ten percent of the samples shall exceed a fecal coliform MPN of forty-three per one hundred milliliters (per five tube decimal dilution). For waters sampled under a systematic random sampling plan, the geometric mean fecal coliform Most Probable Number (MPN) shall not exceed fourteen per one hundred milliliters, and the estimated ninetieth percentile shall not exceed an MPN of forty three (per five tube decimal dilution). Computation of the estimated ninetieth percentile shall be obtained using NSSP guidelines.
Conditionally Approved: Growing areas may be classified "conditionally approved" when they are
subject to temporary conditions of actual or potential pollution. When such events are predictable as in the malfunction of wastewater treatment facilities, non-point source pollution from rainfall runoff, discharge of a major river, potential discharges from dock or harbor facilities that may affect water quality, a management plan describing conditions under which harvesting will be allowed shall be adopted by the Department, prior to classifying an area as "conditionally approved." Where appropriate, the management plan for each "conditionally approved" area shall include performance standards for sources of controllable pollution, e.g., wastewater treatment and collection systems, evaluation of each source of pollution, and means of rapidly closing and subsequent reopening areas to shellfish harvesting. Memorandums of agreements shall be a part of these management plans where appropriate.
-27-
Shellfish shall not be directly marketed from a "conditionally approved" area until conditions for an "approved" classification have been met for a time that should insure the shellfish are safe for consumption. Shellstock from "conditionally approved" areas which have been subjected to temporary conditions of actual or potential pollution may be relayed to "approved" areas for purification or depurated through controlled purification operations only by special permit issued by the Department.
Restricted: Growing areas shall be classified "restricted" when sanitary survey data
show a limited degree of pollution or the presence of deleterious or poisonous substances to a degree which may cause the water quality to fluctuate unpredictably or at such a frequency that a "conditionally approved" area classification is not feasible. Shellfish may be harvested from areas classified as "restricted" only for the purposes of relaying or depuration and only by special permit issued by the Department and under Department supervision.
The suitability of Restricted Areas for harvesting of shellstock for Relay or Depuration purposes may be determined through the use of comparison studies of background tissue samples with post-process tissue samples, as well as other process verification techniques deemed appropriate by the Department.
For restricted areas to be utilized as a source of shellstock for depuration, or as source water for depuration, the fecal coliform geometric mean MPN of restricted waters sampled under adverse pollution conditions shall not exceed eighty-eight per one hundred milliliters and not more than ten percent of the samples shall exceed a MPN of two hundred and sixty per one hundred milliliters for a five tube decimal dilution test. For waters sampled under a systematic random sampling plan, the fecal coliform geometric mean MPN shall not exceed eighty-eight per one hundred milliliters and the estimated ninetieth percentile shall not exceed an MPN of two hundred and sixty (five tube decimal dilution). Computation of the estimated ninetieth percentile shall be obtained using the formula outlined in the NSSP manual.
Conditionally Restricted: Growing areas may be classified "conditionally restricted" when they
are subject to temporary conditions of actual or potential pollution. When such events are predictable, as in the malfunction of wastewater treatment facilities, non-point source pollution from rainfall runoff, discharge of a major river or potential discharges from dock or harbor facilities that may affect water quality, a management plan describing conditions under which harvesting will be allowed shall be prepared by the Department prior to classifying an area as "conditionally restricted." Where appropriate, the management plan for each "conditionally restricted" area shall include performance standards for sources of controllable pollution, e.g., wastewater treatment and collection systems and an evaluation of each source of pollution, and description of the means of rapidly closing and subsequent

-28-
reopening areas to shellfish harvesting. Memorandums of agreements shall be a part of these management plans where appropriate.
Shellfish may be harvested from areas classified as "conditionally restricted" only for the purposes of relaying or depuration and only by permit issued by the Department and under Department supervision.
For Conditionally Restricted areas to be utilized as a source of shellstock for depuration, the fecal coliform geometric mean MPN of Conditionally Restricted waters sampled under adverse pollution conditions shall not exceed eighty-eight per one hundred milliliters and not more than ten percent of the samples shall exceed a MPN of two hundred and sixty per one hundred milliliters for a five tube decimal dilution test. For waters sampled under a systematic random sampling plan, the fecal coliform geometric mean MPN shall not exceed eighty-eight per one hundred milliliters and the estimated ninetieth percentile shall not exceed an MPN of two hundred and sixty (five tube decimal dilution). Computation of the estimated ninetieth percentile shall be obtained using ISSP guidelines.
Prohibited: Growing areas shall be classified "prohibited" if there is no current
sanitary survey or if the sanitary survey or monitoring data show unsafe levels of fecal material, pathogenic microorganisms, or poisonous or deleterious substances in the growing area or indicate that such substances could potentially reach quantities which could render shellfish unfit or unsafe for human consumption.
Harvesting of shellfish from Prohibited areas for human consumption shall not be allowed by the Department. Shellfish may be depleted for non-food use from "prohibited" areas upon approval of the Department and under specified conditions.
Growing waters adjacent to sewage treatment plant outfalls and other waste discharges shall be classified as "prohibited.” A variety of assumptions and criteria will be considered in determining the area which could be potentially impacted.
Growing waters within marinas shall be classified as "prohibited". Classification of waters adjacent to marinas will be determined using a dilution analysis which incorporate various assumptions.
All sampling procedures and laboratory analyses are conducted in accordance with the National Shellfish Sanitation Program (NSSP) guidelines. Areas closed to the harvesting of shellfish are posted with signs indicting the potential for serious illness from consuming shellfish harvested within these areas and outlining penalties for harvest violations.
Sampling stations are established at locations representative of variable water quality

-29-
within shellfish areas. Many of these locations are positioned at classification boundaries to confirm established harvesting classifications. All stations are sampled monthly (Table 2).
Complete descriptions of station locations are included in Appendix G.

-30-
Table 1.
Fixed-Station Shellfish Monitoring Program Physical and Bacteriological Parameter Coverage
and Sampling Frequency _____________________________________________________________________________
Parameter Group Parameter Water Shellstock _____________________________________________________________________________
Physical Tide Stage * NA Water Temperature * NA Air Temperature * NA Wind Direction * NA Salinity * NA
------------------------------------------------------------------------------------------------------------ Bacteriological Fecal Coliform * **
Total Plate Count NA ** E. coli ** ** Sample Temperature * ** Sample Type NA ** Species NA **
_____________________________________________________________________________ *Sampled monthly. **Sampled as appropriate.

-31-
IV. INTENSIVE SURVEYS AND SPECIAL WATER QUALITY STUDIES
A. Point Source Wasteload Allocations
Intensive stream surveys are conducted for gathering field data for calibration or verification of water quality mathematical models and for the determination of the quality of the State's waters. It is the goal of the Department to calibrate models with measured field data when issuing point source wasteload allocations requiring advanced treatment. Emphasis and priority will be placed on gathering field data for issuance of wasteload allocations for 201 waste treatment facility projects.
In addition to intensive stream surveys, time of travel studies to determine stream velocities for water quality model reaches will be conducted. These will be scheduled as needed and as resources allow for streams where data is lacking and complete surveys are not possible or feasible.
Stream surveys are planned to coincide with the Watershed Water Quality Assessment monitoring activities to facilitate the update of the WWQA. This effort is made to allow permit issuance and/or reissuance for all permitted discharges within a watershed to occur the same year.
Intensive stream surveys will be performed generally during the warmer months of May through October. Winter months are less desirable for intensive water quality surveys that are to be used for model calibration. This is based on the following factors:
1. Biochemical reaction rates and biological populations are lowered by
the colder temperatures.
2. Generally, the flow in the streams is higher than normal and much less predictable.
3. Dissolved oxygen concentrations are higher due to higher saturation
levels and lower temperatures.
4. For modelling purposes, it is desirable to conduct field studies which result in data closely aligned to the conditions under which water quality predictions are made. For example, predictions are normally based on low stream flows (7Q10).
5. On those occasions where seasonal limits are at issue, studies may be
conducted during the winter months.
Study plans for all intensive surveys are submitted to the State Quality Assurance Management Office (SQAMO) for approval prior to sampling. All sampling and field analyses are performed according to Environmental Investigations Standard Operating Procedures and Quality Assurance Manual (SCDHEC) and Procedures

-32-
Manual for Stream and Wastewater Facility Flow Measurement (SCDHEC).
B. Special Water Quality Studies
Special water quality studies are conducted on an as needed basis to determine cause and effect relationships in water bodies where trend monitoring indicates a deterioration in environmental quality and to provide legally defensible data on damage in situations where compliance monitoring indicates violation of permits and/or water quality standards. Special water quality assessments are often requested for water bodies having high or potentially high public water use values.
Special studies provide immediate and in-depth investigations of specific environmental problems and involve practical research which leads to a better understanding of the water quality of the State of South Carolina. Each study is followed by a memorandum which analyzes the data obtained during the study.
An investigation of specific environmental problems usually originates as an official request from other sections of EQC, such as Industrial Wastewater, Enforcement, the Modelling Section, Environmental Services personnel, or Land and Waste Management. Studies may also be initiated in response to requests by private citizens or special interest groups. Once an official request to carry out a specific task has been received, Aquatic Biology Section or Water Quality Monitoring Section staff designs, receives approval, and implements the study. The results of such studies are reported primarily to the originator of the study request.
In conducting practical research, the Aquatic Biology Section or Water Quality Monitoring Section generally relies on its own staff, as well as the scientific staff of other sections of EQC. The Aquatic Biology Section or Water Quality Monitoring Section staff designs and implements, or coordinates if other groups are involved, such studies and reports all findings to all interested parties.
Study plans for any special studies are submitted to the State Quality Assurance Management Office (SQAMO) for approval prior to sampling. All sampling and field analyses are performed according to Environmental Investigations Standard Operating Procedures and Quality Assurance Manual (SCDHEC) and Procedures Manual for Stream and Wastewater Facility Flow Measurement (SCDHEC).
C. §314 Lake/Reservoir Water Quality Assessment
The data required to update the §305(b) lake/reservoir trophic state assessment pursuant to §314 of the Clean WAter Act is collected via the Ambient Surface Water Quality Monitoring Network.
D. Special Nonpoint Source Studies
Nonpoint source (NPS) monitoring includes both biological investigations and water quality assessments. Data collected is used for various purposes including:

-33-
identifying waters not fully meeting designated uses due to NPS pollution, addressing waters currently listed on the §303(d) List, assessing the effectiveness of NPS controls, and assistance in conducting enforcement investigations.
A large study in the New River Watershed to document NPS impacts due to tremendous commercial, industrial, and residential development currently underway, and proposed in the near future, in Beaufort and Jasper Counties has been completed. The data is currently being analyzed and a project summary will be made available by the end of the year.
A three year BMP effectiveness monitoring study in the Coneross Creek Watershed has concluded. Data is being analyzed, results summarized, and a final report will be in print by the end of the year. BMP effectiveness monitoring has concluded in the Four Mile Creek, Rocky Creek and Durbin Creek watersheds where §319 programs have been implemented. Final reports are also being generated for these projects, and expected in print by the end of the year as well. Two new BMP monitoring studies began this year in the Twelve Mile Creek Watershed in Pickens County, and Wilson/Ninety Six Creek Watersheds in Greenwood County. Macroinvertebrate, habitat and water quality assessments have been and will be conducted. The purpose of these §319 studies is to evaluate the effectiveness of best management practices (BMP’s) in agricultural, silvicultural and residential areas.
Water quality, macroinvertebrate and habitat assessments will be conducted in response to complaints from the public, and requests from EQC district personnel and Bureau of Water enforcement personnel. Results will aid in determining the need for enforcement action.
A focus on biologically impaired waterbodies on the §303(d) will begin this year. Each impaired station will be re-assessed for impairment, in conjunction with the macroinvertebrate trend monitoring for optimal investigative effectiveness.

-34-
V. WASTEWATER DISCHARGE COMPLIANCE MONMITORING
All wastewater dischargers to the surface waters of the State of South Carolina must obtain a National Pollutant Discharge Elimination System (NPDES) Permit. This applies to all public and privately owned wastewater treatment facilities. The NPDES permit sets limits for physical and chemical characteristics of the facility effluent to protect the water quality of the receiving waterbody. A number of publicly owned treatment works (POTWs) have requirements in their NPDES permits to implement an approved pretreatment program to regulate industrial discharges, as well.
The purpose of the facility monitoring program is to ensure that permitted effluent
limitations are met and properly reported to the State, to ensure proper operation and maintenance of wastewater treatment facilities, and to ensure that the public's concerns and complaints concerning wastewater dischargers are answered effectively. This monitoring function encompasses the review of NPDES permit compliance schedules, review of NPDES self-monitoring data, inspection and evaluation of wastewater treatment facilities, collection and analysis of samples at wastewater treatment facilities, and investigation of complaints concerning wastewater treatment facilities or stream quality throughout the State.
The information gathered by the facility monitoring program is used by the State and
EPA to determine permit compliance and to support enforcement actions. Inspection results are also useful in grant reviews and permitting functions. Facility monitoring is often included in water quality assessments, as well.
Certain inspections are used to improve permittee performance through improved
data quality and the provision of technical assistance. Of course, the facility monitoring program also serves to maintain a regulatory presence in the State.
The following sections detail the various means at our disposal to accomplish these
goals.
A. Compliance Schedule Tracking
Schedules of Compliance for permits and administrative orders are maintained in a data file designated as the Permit Compliance System or PCS. This program was originally developed by EPA to track permit compliance and the State has assumed responsibility for maintaining and updating the file's data base. The Enforcement Section receives a PCS Quick Look Report containing scheduled compliance dates on a monthly basis. These dates are compared against actual compliance status. Achieved compliance is noted and noncompliance situations are suspended for further action by the enforcement staff; also, any amendments to compliance dates are input into the system.
B. NPDES Self-Monitoring
All NPDES permittees are required to collect and analyze samples of their own effluent at regular intervals for specific permit parameters. Self-monitoring data is
-35-
transmitted to the Enforcement Section by the permittee in the form of a Discharge Monitoring Report (DMR). Enforcement Monitoring Records are utilized to track NPDES self-monitoring information. For NPDES self-monitoring this system is utilized to assure timely submission by dischargers of DMRs and recording of reported values by effluent parameter for each NPDES permit. DMR files are reviewed on a monthly basis to determine appropriate enforcement action required for failing to submit discharge monitoring reports and/or for significant effluent violations. In addition, permittees are required to report of non-compliance covering significant permit violations as they occur. These noncompliance reports, submitted in advance of DMRs, provide DHEC the opportunity to determine if there may be effluent problems requiring immediate investigations. After being logged, reviewed, and entered into the WPC Network and PCS by the Permit and Data Administration Section all DMR's are sent to the Enforcement Section for necessary action and then to the NPDES file for the particular facility to provide a readily available source of effluent data.
C. Federal Compliance Evaluation Inspections - (CEI)
The Compliance Evaluation Inspection (CEI) is a nonsampling inspection designed to verify permittee compliance with applicable permit self-monitoring requirements and compliance schedules. This inspection is based on record reviews and visual observations and evaluations of the treatment facilities, effluents, receiving waters, etc. The CEI is used for both chemical and biological self-monitoring programs.
CEIs are primarily performed on Publicly Owned Treatment Works (POTWs). Inspections of these municipal facilities are assigned the following priorities:
1. Major municipals 2. Minor municipals
3. Minor industrial
The Inspection
The inspection is comprised of an evaluation of the physical equipment, laboratory records, discharge monitoring reports, and the operational records of the facility. The results of the inspection are reported on the EPA Form 3560-3. A narrative report summarizing the findings in each of 9 major areas evaluated during the inspection is attached to the 3560-3 form. The 9 major areas evaluated are as follows:
a. Permit Verification - verification of name, address, discharge(s), receiving
waters, etc., contained in the permit.
b. Records and Reports - determination of compliance with record keeping and reporting requirements stipulated in the permit.

-36-
c. Facility Site Review - examination of areas on the permittee's premises where pollutants are generated, pumped, conveyed, treated, stored or disposed.
d. Flow Measurement - installation, calibration and accuracy of flow
measurement system is determined.
e. Compliance Schedules - where applicable.
f. Self-Monitoring Program - sampling frequency, type(s), parameters monitored, parameter limitations, sampling methodology are examined for compliance with permit.
g. Operation and Maintenance - a visual inspection of unit processes is
conducted.
h. Sludge Disposal - the permittee's sludge management and disposal methods are evaluated.
i. Stormwater - review of permittee’s stormwater pollution prevention plan
(SWP3).
Procedure
The accepted procedure for conducting the Compliance Evaluation Inspection is as follows:
a. The facility evaluator notifies the permittee prior to the CEI by telephone.
The permittee is instructed to have available all pertinent records for review.
b. The evaluator completely fills out the appropriate checklists for each major section evaluated during the inspection.
c. After completion and review of the inspection report, the completed form
3560-3, narrative report, and checklists are forwarded to the Pollution Source Compliance Section for review, WPC network and PCS entry, and distribution.
Follow-up
Follow-up evaluations will be made on deficiencies noted in initial Compliance Evaluation Inspections. The follow-up is as follows:
a. A letter emphasizing the deficiencies noted will be sent along with the initial
report to the owner. This letter will point out problems found during the inspection and request corrections or plans for corrections. This letter requires a response within fifteen (15) days. Responses are reviewed by Central Office and District staff.
-37-
b. Based on the review, the District may be requested to initiate a follow-up field inspection. The actual follow-up evaluation can be comprised of a routine state operation and maintenance inspection with the emphasis placed on the status of necessary corrective actions to problems noted in the Compliance Evaluation Inspection report.
c. If corrective action on the initially noted deficiencies has not been taken, the
District should then follow established Enforcement Procedures.
D. State Operation and Maintenance Inspections
These evaluations are designed to ensure that wastewater treatment facilities are being properly operated and maintained in accordance with State and Federal regulations.
The State Operation and Maintenance (O&M) Program involves two types of
inspections: routine and follow-up inspections. The State 0&M inspections are the periodic inspections performed at wastewater treatment facility in the State. Follow-up inspections are the inspections in which the evaluator returns to the facility to determine if the deficiencies noted in a previous inspection or follow-up letter have been corrected.
The State 0 & M inspections involve the actual visit to the treatment plant site
and visual inspection of the facility. The inspector determines if the facility and the equipment involved are properly operated and maintained. Certain limited physical and chemical tests are run on the effluent to help the evaluator determine the plant's efficiency and effectiveness of operation.
The following parameters are collected:
Effluent
Temperature pH Dissolved oxygen Chlorine residual
The inspection program is not a totally regulatory program. The inspection
results are discussed with the operator, when possible, to let him know what corrective measures, if any, are needed.
Procedure
The following is the procedure followed for completing a routine facility
evaluation:
1. Plan work schedule ahead of visits.

-38-
2. Review file (for previous evaluations, inspections, orders, enforcement action, etc.) and make notes of items which were unsatisfactory on previous visits and carry file or parts needed.
3. Review the permit completely.
4. Inform appropriate person (immediate supervisor) of your planned daily
visits.
5. Make every effort possible to contact owner or operator of the facility to be evaluated to inform him of inspection plans. The owner or operator is expected to accompany the evaluator during the evaluation.
6. If you are unable to contact owner or operator, obtain access and permission
to evaluate facility.
7. Make appropriate observations and field tests to determine which processes are satisfactory or unsatisfactory. The facility evaluator must make observations and tests as indicated on the evaluation forms. Effluent tests are mandatory.
8. If the facility has records of 0&M, check records and make comments.
9. Reports must be completely filled out and signed by person making
evaluation. Make appropriate remarks and recommendations. Deficiencies should be listed in remarks section of inspection form.
10. Record name of person you contacted. Have him sign inspection form when
possible.
11. Inform the owner or operator of findings and ask him to make any needed corrections.
12. Those facilities found to require a follow-up visit must be scheduled and
followed up at the specific time. Plan for follow-up should be stated on inspection form.
13. If samples are collected for laboratory analysis, coordination should be made
with laboratory and results should be included with evaluation report.
The inspector's reports are reviewed in the district before the copies are distributed. One copy of the inspection is sent to the facility owner, one copy is kept in the district office, and the original is sent to Central Office to be reviewed, logged and sent to the Central Files. Inspection results are entered into the WPC network and into PCS.
Suspense files on problem facilities should be maintained in the District

-39-
Office. The facility evaluators should also keep a list of facilities which need to be sampled for possible enforcement action. Those lists should be forwarded to the regional monitoring supervisor periodically to be scheduled for sampling.
Follow-up inspections are a result of inadequacies being found during a State
0&M inspection. If the follow-up inspections show that the inadequacies have not been corrected and the district staff has exhausted its resources in getting the facility in proper operational condition, then all necessary information concerning the facility can be addressed at a meeting at the District level. Necessary enforcement action should follow the established enforcement procedures until compliance is achieved.
E. Compliance Sampling Inspections
Compliance sampling inspections are performed to determine if wastewater treatment facilities are operating as permitted and designed, to collect data for comparison with self-monitoring data, and to support enforcement action.
Sampling of facilities are assigned the following priorities:
1. Federal Compliance Sampling Inspections. 2. Enforcement Section or EPA requests. 3. Engineering Division request. 4. District personnel request. 5. Routine sampling.
Federal Compliance Sampling Inspections
Federal Compliance Sampling Inspections are conducted on all major dischargers and specific minor dischargers on an annual basis. The Federal Compliance Sampling Inspection requires that an inspection of the facility be conducted by the EQC district facility evaluator. This inspection is to be made on one of the three (3) days required for effluent sampling. The information gathered during this inspection is reported on the EPA Form 3560-3. A list of the dischargers receiving Federal Compliance Sampling Inspections for each EQC district appears in Appendix H.
A detailed inspection of the facility's records, regular operation and maintenance, flow measurement devices, sampling procedures, laboratory, and other permit conditions for compliance verification is conducted by the district facility evaluator. Effluent sampling is included in the Federal Compliance Sampling Inspection. Procedures for sampling the effluent are the same as discussed below for routine State Compliance Sampling Inspections.
After the sampling and inspection has been completed, the laboratory results are mailed to the Analytical Services Division. The 3560-3 form, checklists, and narrative report are mailed to the Pollution Source Compliance Section. This information should be completed and mailed to Columbia within two weeks of completion of sampling.
-40-
Requested Sampling Inspections
Upon receiving a request for compliance sampling, a review of historical data and the NPDES permit regulations for the facility is conducted to determine if previous sampling data will be sufficient. If additional sampling is needed, a request, including all parameters desired is sent to the District Office responsible for sampling that facility. This is coordinated by personnel in the Central Office Pollution Source Compliance Section. A written request for the sampling is then made to the District monitoring supervisor. Sampling and reporting procedures are the same as for routine State Compliance Sampling Inspections (see below).
Routine State Compliance Sampling Inspections
Routine State Compliance Sampling Inspection schedules are established by the District monitoring supervisor. A monthly schedule which outlines the date and facility to be sampled, date streams will be sampled and date stream flows will be conducted, is submitted to the Pollution Source Compliance Section. It is a requirement that a monthly schedule of expected sampling activities be sent to the Section.
The NPDES permit should be reviewed to determine the composite sampling frequency. For those facilities whose composite sample frequency is once per month or less, a one day composite sample may be collected. Fecal coliform and field parameters should be collected on the day the composite sampler and flow meter are set up, as well as the following day when the composite sample is collected. An updated list of facilities requiring only one day of sampling will be provided to the district monitoring supervisor annually.
If the NPDES permit requires composite sampling for any parameter at a frequency of greater than once per month, then two days of composite sampling must be conducted. The flow recorder and automatic sampler is set up on the initial sampling day. Fecal coliform and field samples should be collected on the day the composite sampler is set up and on each of the two following days on which composite samples are collected.
In addition to the effluent total residual chlorine (TRC), the chlorine concentration prior to dechlorination should be measured if the effluent TRC is measured to be <0.1 mg/l. These results should be reported on DHEC form 2185, on the line following Sulfides. The monitoring personnel should write Cl2 in CC on the line below Sulfides, and 66666 as the STORET code.
Samples collected will be taken to the District laboratory for analyses. Samples are collected according to the NPDES permit requirements and SCDHEC's Environmental Investigations Standard Operating Procedures and Quality Assurance Manual.
Facilities with General Permits (SCGs) should only be sampled upon a special

-41-
request. When sampling these facilities, the specific type of discharge, as identified in the General Permit, must be written in the space labeled TYPE on DHEC form 2185. The correct pipe number, as identified in the General Permit, must also be written in the appropriate space on DHEC form 2185.
After completion of the sample analyses the laboratory data sheets are sent to the Analytical Services Division which forwards them to the Pollution Source Compliance Section to be verified, reviewed, and logged in.
The data is edited and a compliance monitoring report (CMR) is generated. The data is compared with the NPDES permit limits to determine if any permit violations occurred. A formal report is then compiled by Pollution Source Compliance Section personnel and sent to the responsible facility official. Copies are transmitted to the Central Office files, the District, and EPA (majors). A written response to the agency for any significant permit violation is usually requested.
Follow-up inspections are conducted on deficiencies noted in the CSI as outlined under the CEI section.
F. Compliance Biological Inspections
For the purpose of State compliance with the "106 Work Plan" agreement with the EPA, whole effluent toxicity (WET) testing conducted according to the facility's NPDES permit requirements constitutes a Compliance Biological Inspection (CBI). Discharges to be tested are selected based on self-monitoring data, requests by department personnel, and requests by other parties. Samples are usually taken at the time of Federal and State compliance sampling inspections by district monitoring personnel. CBI WET test results are used to determine if wastewater treatment facilities are in compliance with their NPDES permit WET limits, for comparison with self-monitoring data and to determine the need for permit modifications or enforcement action. Depending on permit requirements, either a 48-hour static acute or 7-day static renewal chronic toxicity test is conducted on 10% of all major facilities, annually.
G. Performance Audit Inspections
The Performance Audit Inspection (PAI) is used to evaluate a permittee's self-monitoring program. The purpose of the inspection is not only to determine the quality of self-monitoring but also to assess the reliability of the data reported by the permittee. A field evaluation is conducted which includes an evaluation of flow measurement, sampling, records, and operation and maintenance. Pollution Source Compliance Section personnel perform this part of the PAI. A laboratory evaluation is also conducted which includes a review of analytical methods and procedures, sample handling and preservation, quality assurance, and records. The EQC Laboratory Certification Section performs this part of the PAI.
The State routinely performs twelve (12) PAIs annually. Others may be performed as

-42-
necessary. EPA also conducts a number of PAIs in the State each year.
H. Technical Assistance Evaluations
The Technical Assistance Evaluation (TAE) focuses primarily on wastewater treatment facilities that are not in compliance with their permit requirements. The purpose of the evaluation can be to either evaluate causes of noncompliance in support of enforcement actions or to assist those facilities without self-diagnostic capability. The evaluation identifies major plant deficiencies in operation, design, and/or construction. Other aspects of the permit program such as the permittee's self-monitoring program can be included in the technical evaluation if deemed necessary. These evaluations are performed by the Pollution Source Compliance Section. Approximately ten (10) TAEs are performed annually.
I. Pretreatment program Audit and/or Inspection
The Pretreatment Program Audit and/or Inspection is conducted annually on those POTWs that are required by regulation to have an approved pretreatment program. The purpose of the audit and/or inspection is to determine whether the program is being adequately implemented by the POTW. The audit would include a review of the following items:
1. POTW treatment facility background information.
2. POTW pretreatment program background information.
3. Evaluation of POTW pretreatment program changes.
4. Legal authority evaluation.
5. Application of pretreatment standards.
6. Compliance Monitoring and Inspections by POTW personnel in self-
monitoring sampling.
7. Compliance Monitoring and Enforcement - industrial user file review.
8. Enforcement Actions by POTW.
9. Data management and public participation.
10. Program resources review.
The Pollution Source Compliance Section conducts Pretreatment Program Audits or Pretreatment Compliance Inspections on the majority of POTWs with a pretreatment program. Pretreatment follow-up inspections are also performed as appropriate.
-43-
The Pretreatment Program Audits are coordinated with POTW facilities whose permit expires in the forthcoming year. During the audit, the inspector observes the industrial user inspection procedures and tours the industrial facility’s production process to identify sources of wastewater. A report of the findings is forwarded to the POTW for corrective actions where appropriate.
-44-
VI. Quality Assurance/Quality Control Procedures
It is the policy of Environmental Quality Control (EQC) that necessary quality assurance (QA) activities be conducted within the State of South Carolina to demonstrate that all environmental data generated, processed, or used will be scientifically valid, defensible, and of known and acceptable precision and accuracy. It is also the policy of EQC that all reported data will include documented precision and accuracy and be complete, representative, and comparable. The quality of all data generated shall meet or exceed all EQC and EPA program requirements.
The Deputy Commissioner for Environmental Quality Control has the overall responsibility for the development, implementation, and continued operation of EQC's QA Program. To insure that EQC's QA policy is uniformly applied to the generating and processing of all environmental data, a State Quality Assurance Management Office (SQAMO) has been established.
This office is responsible for the Environmental Quality Control Assurance Program. Environmentally-related measurement activities conducted by or for EQC shall be done only with the approval of the State Quality Assurance Management Office (SQAMO) after assuring that adequate quality assurance guidelines and procedures have been incorporated. This includes study-planning, sample collection, preservation and analysis, data handling, and use of physical, chemical, biological, and other data related to the effects, sources, transport and control of pollution, as well as personnel review and training.
To accomplish these goals the Water Quality Monitoring Section and Pollution Source Compliance Section have developed and instituted SQAMO approved field study procedures and documentation, data review, and routine EPA operating overview. Some specifics of these Sections' QA/QC activities include:
1. Submission of all study plans to SQAMO for review and approval prior to
implementation.
2. Use of bound field logbooks by all monitoring and facility evaluation personnel. In these logbooks are recorded all of the routine daily meter calibration results, remarks and notes relating to all activities, and values for all field measured parameters as well as time, date, station location, and collector identification information associated with all sampling activities. This logbook format provides a legally admissible document for any court supervised compliance/enforcement proceedings.
3. Regular reviews and updates of SCDHEC's Environmental Investigations Standard
Operating Procedures and Quality Assurance Manual (SOP) and Procedures Manual for Stream and Wastewater Facility Flow Measurement. These documents describe in detail the field sampling procedures, meter calibration and maintenance procedures, sample chain-of-custody documentation, sample preservation, holding times and recommended sample containers specifications, data sheet examples, and data submission requirements.

-45-
4. At least twice yearly all field personnel are accompanied on sample collection activities by the appropriate program quality assurance officer for evaluation of adherence to standard operating procedures (SOP) for QA/QC. These evaluations each year are for water quality monitoring SOP review and for facility compliance sampling SOP review.
5. Approximately every other year the EPA conducts on-site routine overviews of
SCDHEC's QA/QC procedures.
6. Data checking and editing is performed on data by the quality assurance officer after data punching but before final submission to the EPA STORET system. The STORET system performs additional data checks, and any errors reported are rechecked by the QA officer.

-46-
VII. COMPLAINT INVESTIGATIONS AND FISH KILL PROGRAM A. Complaint Investigations Purpose
The primary purpose for the investigation of complaints is to determine whether or not a pollution or public health threat exists, and to require corrective action, where problems are found. Since customer service is a primary focus of the agency, complaint response receives a very high priority within the Agency.
Strategy
Since we have staff located in twelve District Offices around the state, the Department is able to provide prompt response, follow-up, and documentation of all complaints received either directly from the public or through other sources. Voluntary correction of identified problems is obtained in most cases, but necessary enforcement can be taken under the Pollution Control Act (or other applicable laws), where appropriate.
Complaint Investigation Policy
When possible, complaints should be directed to the EQC District Office having jurisdiction over the county in which the complaint is noted (see table 2). Complaints received in the Central Office will be referred to the applicable District Director for response. Although complaint investigation and proper documentation to the file are the responsibility of the District Director to whom complaints are referred, Central Office assistance is available and provided upon request. Although discretion and the need for the exercise of professional judgement are recognized as key components in the investigation and documentation of complaint investigations, the following guidelines are offered with respect to proper complaint documentation:
1. All complaints shall be entered into the complaint tracking portion of the
EFIS tracking system. This will provide accurate documentation of our complaint investigations.
2. A facility owner has not been legally notified of an unsatisfactory situation
unless he has been notified in writing. If, in the judgement of the District Director, the matter investigated may result in administrative or court action by this agency, the owner is to be properly notified with a copy to our files. In instances where a magistrate’s warrant to enter and inspect is issued, Department staff has no choice but to reduce the results of such inspection to writing, with a copy to the owner.
3. Many complaints, by their nature, necessitate a letter to the complainant
covering the results of the Department’s investigations and corrective measures taken. Copies of such letters shall be sent to the wastewater files

-47-
(or appropriate program files).
4. To ensure that copies of letters and other documentation can be properly filed, they should be sent to the attention of the Water Enforcement Division, Bureau of Water.
5. Staff needs to be aware that poor or incomplete documentation will
effectively prevent the Department from taking proper enforcement action. Table 2. Office of Environmental Quality Control EQC District Directory APPALACHIA I 2404 N. Main Street Phone: (864) 260-5569 (Anderson, Oconee Counties) Anderson, SC 29261 Fax: (864) 260-4855 APPALACHIA II (Greenville, Pickens Counties) 301 University Ridge, Phone: (864) 241-1090
Suite 5800 Fax: (864) 241-1092 Greenville, SC 29601
APPALACHIA III (Spartanburg, Cherokee, Union 975 N. Church Street Phone: (864) 596-3800 Counties) Spartanburg, SC 29305 Fax: (864) 596-2136 CATAWBA (Lancaster, Chester, York 2475 DHEC Road Phone: (803) 285-7461 Counties) Lancaster, SC 29714 Fax: (803) 285-5594
Mailing Address: PO Box 100, Fort Lawn, SC 29714 CENTRAL MIDLANDS Bldg. No. 5, PO Box 156 Phone: (803) 896-0620 (Richland, Lexington, Newberry, State Park, SC 29147 Fax: (803) 896-0617 Fairfield Counties) LOW COUNTRY 104 Parker Drive Phone: (843) 846-1030 (Beaufort, Jasper, Colleton, Burton, SC 29906 Fax: (843) 846-0604 Hampton Counties) LOWER SAVANNAH 206 Beaufort Street, NE Phone: (803) 641-7670 (Aiken, Orangeburg, Barnwell, Aiken SC 29801 Fax: (803) 641-7675 Bamberg, Allendale, Calhoun Counties) PEE DEE 145 E. Cheves Street Phone: (843) 661-4825 (Florence, Dillon, Marion, Florence, SC 29506 Fax: (843) 661-4858 Darlington, Chesterfield, Marlboro Counties)

-48-
TRIDENT 1362 McMillan Avenue, Phone: (843) 740-1590 (Charleston, Berkeley, Dorchester Suite 300 Fax: (843) 740-1595 Counties) Charleston, SC 29405 UPPER SAVANNAH 613 South Main Street Phone: (864) 223-0333 (Greenwood, Abbeville, Laurens Greenwood, SC 29646 Fax: (864) 223-6935 Saluda, Edgefield, McCormick Counties) WACCAMAW 1705 Oak Street Plaza, Phone: (843) 448-1902 (Horry, Georgetown, Williamsburg Suite #2 Fax: (843) 946-9390 Counties) Myrtle Beach, SC 29577 WATEREE 105 Magnolia Street Phone: (803) 778-6548 (Sumter, Kershaw, Lee, Sumter, SC 29151 Fax: (803) 773-6366 Clarendon Counties)
B. Fish Kill Program The Emergency Response Section, of the Bureau of Land and Waste
Management, was established to respond to and coordinate emergency activities during spills and fish kills for the Office of Environmental Quality Control. The Emergency Response Section has the responsibility for emergencies related to water, air, drinking water, solid waste, waste-water, etc.
Fish kill data is collected so that the department can more easily respond to acute water quality problems. Data collected is used to help establish such trends as mismanagement of pesticide/ herbicide application, pollution sources (both point and nonpoint) and natural phenomenons resulting in environmental stress. The fish kill data is available for use by other bureau's in assessing any environmentally sensitive areas, by interested citizens, and fellow agencies such as the South Carolina Department of Natural Resources.
Fish mortalities result from a variety of causes, some of natural origin and some man-induced. It is recognized that speed is all-important in the initial phases of an investigation. Therefore, a twenty-four hour, toll free, telephone number has been established for the report of fish kills. The number is 253-6488, or toll free, 1-888-481-0125. Between 8:30 a.m. and 5:00 p.m. this number is manned by personnel of the Emergency Response Section. After 5:00 p.m., the answering service intercepts all calls, and then contacts the person from the Emergency Response Section who is on call.
All fish kills should be reported initially to the Emergency Response Section via the 24-hour telephone number. The report should come to this number even if the district office is first notified of the kill. The Emergency Response Section will assist in coordinating and dispatching field investigators to the site of the fish kill.

-49-
Once a kill is reported, a team of specially trained individuals is dispatched to the site. Since there is always the possibility of legal liability associated with a kill, a carefully developed field procedure is available for immediate activation. This procedure is located in SCDHEC’s “Field Manual for the Investigation of Fish Kills” signed and dated 5/31/01. Procedures for the response to hazardous algae blooms (HABs) and Pfiesteria related events are also included.
When a kill report is received, maps of the area to be investigated are consulted to determine the best access points, and to locate known industrial, municipal, and other potential sources of pollution.
A fish kill response team has been established in each of the State's twelve DHEC districts. This has enhanced our response time and provided for better local co-ordination through district personnel. We have assembled a standard fish kill kit. Each of the twelve EQC district offices has and maintains one of these kits. Each kit consists of the following: ice chest, specimen containers, bacteriological, biological, and chemical samples containers and preservatives. In conjunction with the above, an updated procedure manual has been distributed to each District Office as well as the South Carolina Department of Natural Resources. Fish kill training seminars have been conducted to broaden the knowledge of the investigators and the scope of the investigations.
Whenever public waters are involved, DHEC investigators should contact an official of the S.C. Department of Natural Resources to co-ordinate fish kill investigations between the two departments. The fisheries' biologist should be contacted if possible. If he is not available, a member of the law enforcement division should be called. It should be noted that the Wildlife and Freshwater Fisheries Division is restricted to freshwater fish kills, and the Marine Resources Division restricts itself to the investigation of fish kills in saline waters. Marine Resources Division is located in Charleston, South Carolina.
Whenever a fish kill is suspected to involve fertilizers, herbicides, or pesticides, an official of the Clemson University Department of Fertilizer and Pesticide Control should be contacted. DHEC personnel and Clemson personnel should perform a coordinated investigation and split samples if needed. If local Clemson officials cannot be reached, the DHEC Emergency Response Section's Fish Kill Coordinator should be contacted.
The extent of investigation of a given fish kill lies in the extent of the kill, the numbers and kinds of fish involved, and the resources available for the investigation. Following a decision to investigate, the investigation should continue until a cause is determined, or until all known potential causes have been eliminated as being implicated in the kill.
Analytical Services Division laboratories analyze all of the samples collected on fish kill investigations except for biological samples. They are alerted and given an estimate of the number and kinds of samples, and date of arrival.

-50-
If the cause of a kill can be determined to be man induced, a report is submitted to the Division of Water Monitoring, Assessment, and Protection of the Department of Health and Environmental Control for enforcement action. If the cause of a kill cannot be deter- mined after investigation of all possible sources, then the Department of Health and Environmental Control will inform these possible sources that a kill has occurred and that the Department of Health and Environmental Control will ask them to investigate further and determine if a spill may have occurred accidentally which could have caused the kill.

-51-
VIII. PUBLIC WATER SYSTEMS MONITORING
The monitoring schedules and requirements are included in the National Interim Primary Drinking Water Regulations of the Safe Drinking Water Act as amended in 1986 for Phases I, II, IIB, and V. Also included in this Act are the Lead And Copper Rule, Total Coliform Rule, and the Surface Water Treatment Rule. The enclosed numbers are a summary of the required drinking water monitoring for the CY 2002. A description of the sampling compliance cycles and monitoring parameters is included to show where time and effort are focused. The waivers, scheduling, collection, shipment, and analyses are conducted by the South Carolina Department of Health and Environmental Control (Department) Bureau of Water staff, Analytical Services staff, and contracted private laboratories.
A. Microbiological Required and Repeat Monitoring: Distribution Monitoring
The microbiological monitoring program is based on the Total Coliform Rule, which requires all federally defined public water systems to develop a self-monitoring program for their system. To be classified as a federally defined public water system, the system must meet specific criteria. This criteria is as follows:
1. A Community water system services a minimum population of twenty-five
(25) year round residents, or has at least fifteen (15) service connections in use year round.
OR
2. A Non-Community Transient water system has at least 15 service
connections or serves an average of 25 or more people a day, though not the same people each day (i.e. restaurants, rest stops, campgrounds).
OR
3. A Non-Community Non-Transient water system regularly serves at least 25 of the same people over six months per year (i.e. schools, factories, offices).
A State water system is defined as any water system serves less than 15 service connections or regularly serves an average of less than 25 individuals daily. Department staff collects quarterly samples from the distribution system of this type of water system. Repeat samples are required for each total or fecal coliform positive routine sample. A set of four repeat samples must be collected for each routine total or fecal coliform positive sample.
The Department also collects, for mandated compliance monitoring, quarterly bacteriological samples from the non-community transient water systems. These samples are collected as part of the services included under the Drinking Water Fees. Repeat sample sets are collected for these systems, as required in the Total Coliform

-52-
Rule (TCR). The sets consist of four samples per total or fecal coliform positive initial sample.
The Department performs oversight quarterly bacteriological sampling for all community and non-community water systems. Repeat samples are collected in the same manner as required in the TCR. Migrant camps are monitored during the months they are in operation.
Town Surveys: Distribution Monitoring
All drinking water systems with service connections (taps) greater than or equal to
500 must have town surveys conducted each calendar year. A town survey is a monitoring plan that covers the water distribution system. The number of samples collected on a system can range from 10 to 25. The smaller systems may be represented by a smaller number of samples, where as a larger system with miles of lines may require 25 samples to completely represent the system. If a drinking water system has two or more independent water systems under the same system number, then 10 to 25 total coliform samples will be collected from each part of the system. The samples are analyzed for total coliform, and a heterotrophic plate count. The town surveys help determine if there is an area of the system that requires more flushing of the lines or possibly a chlorine boost. There are three-hundred and nine (309) water systems that must have town surveys conducted annually.
Non-Routine: Distribution Monitoring of Public Water Systems
Non-routine samples are special samples that may be collected due to complaints on a public water system. Department personnel will collect bacteriological samples from residences where complaints have been filed. Also if there have been line breakages, line repairs, or extensions, samples may be collected to determine water quality and disinfection residual. Special project samples are included in the non-routine (non-required) program area. Special project samples encompass samples collected in defining an area of contamination, potential contamination, and investigations. These samples may be from public water systems or private wells.
B. Inorganic Chemicals (IOCs) Required and Repeat Monitoring: Source Monitoring
A routine inorganic sample analysis includes the following compounds: mercury; antimony; barium; beryllium; cadmium; chromium; fluoride; nickel; selenium; arsenic, cyanide and thallium. Surface water systems must have one sample collected each year; groundwater systems must have one sample collected every three years. Any system exceeding a Maximum Contaminant Level (MCL) for any of these compounds must then complete four consecutive quarters of monitoring. These samples would fall into the "repeat" category. These samples verify the system's MCL violation. There are currently seven-hundred seventy (770) water systems which are being monitored for IOCs. There are a total of sixty-nine (69) surface

-53-
water sources and one thousand four hundred and fifty nine (1459) groundwater sources being monitored for IOCs.
Required Lead and Copper Monitoring: Source and Distribution Monitoring
Community and Non-Community Non-Transient water systems must monitor for lead and copper. Initial sampling is in the distribution. If the initial two rounds (2 consecutive 6 month sampling periods) of sampling are below the action levels for lead (0.015 ppm) and copper (1.3 ppm), the system may be placed on reduced monitoring. Reduced monitoring is conducted during the months of June, July, August, and September. The system is required to collect half the number of samples of the initial round. Five (5) samples per system is the minimum number of samples that may be collected for initial and reduced monitoring. If three consecutive rounds of reduced monitoring for the system are below the action levels for both lead and copper, the system may be placed on the ultra reduced monitoring schedule. The systems on ultra reduced must collect a reduced sampling round once every three years. Should a water system exceed the action level for lead, copper, or both, the water system must conduct an Optimal Corrosion Control Treatment (OCCT) study. OCCT requires source monitoring for all sources within the system. A water system may continue to monitor for lead and copper during the OCCT study. If during the OCCT study period, two consecutive rounds of lead and copper monitoring are below the action levels for both lead and copper, the system may be taken off OCCT and placed on the reduced monitoring schedule.
Required Nitrate and Repeat Monitoring: Source Monitoring
Currently there are one thousand three hundred and seventy four (1374) water systems that must be monitored for nitrate. There are a total of seventy-one (71) surface water sources and two thousand one hundred and forty six (2146) groundwater sources that must be monitored.
Each surface water system initially completed four consecutive quarters of nitrate monitoring. Any system exceeding half the MCL (>5) must complete an additional four consecutive quarters of monitoring. If after the initial four quarters the detection level is less than half the MCL, the system is reduced to one sample per year.
Ground water systems must also complete the initial four consecutive quarters of monitoring. As with the surface water systems, if half the MCL (>5) is exceeded, the system must complete the additional four quarters of monitoring. If the detected level is below half the MCL, then the system may be reduced to one sample per year.
Migrant camps are monitored at the opening of each season the camp is operational. Required Nitrite Monitoring: Source Monitoring
Initial nitrite sampling was completed by December 31, 1995. One nitrite sample per system is required to be collected within 1993 and 2001. As new water systems are

-54-
added to the water supply inventory, nitrite monitoring will be scheduled for each source.
Migrant camps are monitored at the source for nitrite at the opening of each season the camp is operational.
Non-Routine/Special Projects (Investigation): Source, Distribution Monitoring
These samples are collected due to citizen complaints regarding a public water system or potential health hazard. These samples are not for compliance determination, but to help detect and correct any problem areas noted by the water systems' customers. These samples are part of the Department's public service commitment to investigate any public water complaint, and address them accordingly. Special project samples would be included in this area on investigative sampling. Compliance issues may be raised from the samples and actions taken accordingly to ensure no future problems.
C. Synthetic Organic Compounds (SOCs)
SOCs consist of forty-three (43) regulated and unregulated compounds. All systems that require SOC monitoring must complete four consecutive quarters initially. If an MCL is exceeded or an SOC is detected, the system must continue with four additional consecutive quarters of monitoring until the sampling is reliably and consistently below the MCL. After the initial four quarters, if no MCL is exceeded, the system will begin reduced monitoring. Reduced monitoring is based on system population served. The State is currently in a three (3) year cycle which began on January 1, 2002 and will be completed by December 31, 2004. During this time systems that serve more than 3,300 individuals will be monitored once. Those systems/sources that serve less than 3,300 population will be granted waivers based on having had three (3) consecutive monitoring cycles without a detection. They will not be monitored during this current cycle. Repeats would cover any system requiring the additional four quarters of monitoring due to an MCL exceedance. Currently there are approximately six hundred (600) sources that will be monitored for SOCs during the three year cycle 2002-2004.
Special project samples may be collected for SOCs also. These samples may be from public water systems or private wells. The samples would be collected by Department staff.
D. Volatile Organic Compounds (VOCs)
VOCs consist of twenty-one (21) regulated contaminants. All system require and initial four (4) consecutive quarters of monitoring. If at the end of the four consecutive quarters of monitoring no contaminant had a reading of greater than 0.0005 mg/l then the source is placed on routine monitoring. Routine monitoring is annually for surface water sources and once during the three year cycle January 1, 2002 - December 31, 2004 for groundwater sources. If a detection of greater than

-55-
0.0005 mg/l were to occur the source would be placed on four consecutive quarters of monitoring to determine if the source were reliably and consistently below the maximum contaminant level (MCL). Currently seven hundred seventy (770) water systems and one thousand five hundred twenty eight (1528) sources are monitored for VOCs.
Non-Routine: Source or Distribution Monitoring
All non-routine VOCs would be collected on a complaint basis or as part of an investigation. These samples may be collected in coordination with landfills, gas stations, and petroleum storage tanks. The Drinking Water Monitoring Section, the EQC District offices, and other Bureaus within the Agency may require special projects involving VOC samples to be collected and analyzed.
E. Total Trihalomethanes (TTHMs): Distribution Monitoring
Community water systems utilizing surface water in whole or in part and serving a population of 10,000 or more and adding a disinfectant (oxidant) to the water in any part of the treatment process are monitored quarterly. Currently there are fifty-nine (59) water systems being monitored for TTHM.
F. Haloacetic Acids (HAAs): Distribution Monitoring
Community water systems utilizing surface water in whole or in part and serving a population of 10,000 or more and adding a disinfectant (oxidant) to the water in any part of the treatment process are monitored quarterly. Currently there are fifty-one (51) water systems being monitored for TTHM.
G. Radionuclides: Source Monitoring
Community water systems are required to monitor for radionuclides, which include gross alpha, radium-226, and radium-228. Radium-226 will be analyzed for based on the gross alpha level. Radium-228 will be monitored for all samples collected. Monitoring for radionuclides falls under the new Radionuclide rule which requires monitoring to be collected from the source rather than the distribution system. Baseline data is currently being gathered to determine whether grandfathering of results can be accomplished. This baseline data must be collected prior to December 3, 2003. There are currently five hundred fifty (550) systems and one thousand two hundred forty eight (1248) sources that require radiological monitoring.
H. Unregulated Contaminant Monitoring Rule (UCMR): Source Monitoring
Community water systems serving greater than ten thousand (10,000) population are required to perform UCMR monitoring during the period January 1, 2001 - December 31, 2003. During CY 2002 twenty one (21) systems and twenty eight (28) sources will be monitored on a quarterly basis.
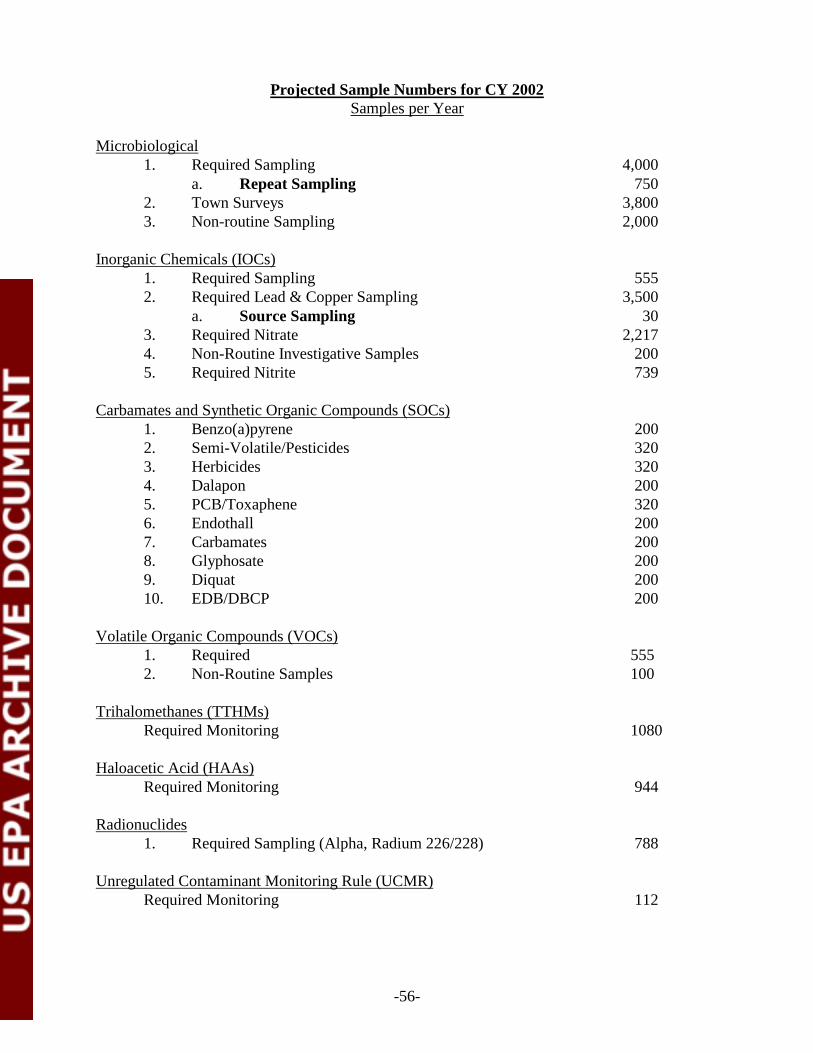
-56-
Projected Sample Numbers for CY 2002 Samples per Year Microbiological
1. Required Sampling 4,000 a. Repeat Sampling 750
2. Town Surveys 3,800 3. Non-routine Sampling 2,000
Inorganic Chemicals (IOCs)
1. Required Sampling 555 2. Required Lead & Copper Sampling 3,500
a. Source Sampling 30 3. Required Nitrate 2,217 4. Non-Routine Investigative Samples 200 5. Required Nitrite 739
Carbamates and Synthetic Organic Compounds (SOCs)
1. Benzo(a)pyrene 200 2. Semi-Volatile/Pesticides 320 3. Herbicides 320 4. Dalapon 200 5. PCB/Toxaphene 320 6. Endothall 200 7. Carbamates 200 8. Glyphosate 200 9. Diquat 200 10. EDB/DBCP 200
Volatile Organic Compounds (VOCs) 1. Required 555 2. Non-Routine Samples 100
Trihalomethanes (TTHMs)
Required Monitoring 1080 Haloacetic Acid (HAAs)
Required Monitoring 944 Radionuclides
1. Required Sampling (Alpha, Radium 226/228) 788 Unregulated Contaminant Monitoring Rule (UCMR)
Required Monitoring 112

-57-
IX. GROUNDWATER PROTECTION
The Groundwater Management Section of the Bureau of Water has the responsibility to plan, coordinate and direct major program areas in hydrogeology to implement South Carolina's Source Water Protection Program and to support other natural resource management programs. This responsibility includes drafting legislation and developing policy, guidelines and procedures relating to protection of groundwater resources. The Groundwater Management Section has an umbrella function to address matters such as cross program consistency. Issues that arise regarding groundwater monitoring may be addressed by the Groundwater Working Group composed of groundwater section managers from the two Bureaus in EQC: Bureau of Land and Waste Management and Bureau of Water.
The Groundwater Management Section implements the Source Water Protection, the Underground Injection Control (R.61-87) and the Capacity Use Permitting Programs. These programs may involve regulatory permitting, monitoring, and assessment.
On August 24,1999, a new program, Individual Residential Well and Irrigation Permitting (R.61-44), began implementation. The program continued its operation through 2000 and 2001 and is supported by fees required for each individual residential well and irrigation well. A Notice of Intent (NOI) and fee is submitted to the Central Office prior to the well’s installation. This prior notice allows the ten well inspectors in the district offices to schedule inspections. In 2000, NOIs were processed for 3,425 irrigation wells and 10,851 residential wells. During that year inspections were conducted for 237 irrigation wells and 1,642 residential wells.
Underground Storage Tank Management implements the Underground Storage Tank Control (R.61-92) and the State Underground Petroleum Environmental Response Bank (SUPERB) regulations.
A. Permit Issuance
The responsibility for issuing permits for land treatment, storage and disposal of wastes is assigned to the Bureau of Land and Waste Management and the Bureau of Water. Prior to issuance of a permit, the appropriate groundwater support unit for each Bureau may be called upon to provide technical review of plans and specifications and to conduct a site investigation relative to the potential effects on groundwater quality at the site. An assessment of the hydrogeological characteristics of the site may be made by test drilling and sampling. Recommendations are provided for issuance or denial of the permit and for special conditions of the permit including the need for establishing a groundwater monitoring program.
The objectives of the groundwater monitoring program are:
(a) To determine baseline conditions of groundwater quality.
(b) To establish and maintain a monitoring tracking system to ensure permit
compliance.

-58-
(c) To provide early detection of groundwater contamination, particularly in groundwater recharge areas and in areas of significant groundwater use.
(d) To identify existing and/or potential groundwater contamination sources and
to maintain surveillance of these sources with respect to impact on groundwater quality.
(e) To provide a statewide data base upon which policy and management
decisions can be made concerning the surface and subsurface disposal of wastes and the protection of groundwater resources.
B. Enforcement
When a groundwater contamination problem is discovered, through monitoring of a permitted or unpermitted site, the appropriate Bureau enforcement section can be called upon to pursue enforcement action. The purpose is to stop further pollution of ground water, to assess the severity and extent of the contamination and to restore any impacted aquifers. The responsibility for conducting the groundwater investigation may be placed on a facility, site or underground storage tank owner. Recommendations are made to the appropriate enforcement section(s) throughout all phases of the enforcement action until an acceptable solution to the problem is reached.
C. Water Supply
The Water Supply & Recreational Waters Permitting Section within the Water Facilities Permitting Division of the Bureau of Water has the responsibility of permitting the construction or modification of public water supply systems. The Groundwater Management Section provides hydrogeological advice to the water supply permit writers on matters dealing with well construction specifications and potential aquifer yield and contamination investigations. The results of a test well monitoring program are considered in the review of the specifications and the proposed well location.
The Private Well Program provides assistance to individual well owners through the well inspections and by addressing private well complaints concerning water quality in conjunction with District EQC Offices. From July 1, 2000 to June 30, 2001, a total of 6,101 groundwater samples from individual residential wells were analyzed for bacterial constituents and another 1,742 samples were analyzed for metals and minerals constituents. Problems related to water quality and quantity are also addressed by the Groundwater Management Section.
Many water supply problems for individual residential wells have been linked to improper well construction. Certification of well drillers through the Board of Environmental Certification in the Department of Labor, Licensing and Regulation was implemented to address this problem. In addition, amendments to the State Safe Drinking Water Act authorized regulation of the construction, maintenance, operation

-59-
and abandonment of wells by standards established by an Advisory Committee to the Board. The South Carolina Well Standards and Regulations (R.61-71) were enacted on June 2, 1985, and revisions to the regulation will become effective in March of 2002.
D. 106 Groundwater Protection Program
The Groundwater Management Section has the responsibility to develop and implement Comprehensive State Groundwater Protection Program (CSGWPP) in accordance with the Section 106 water quality management effort. The overall goal is to ensure that South Carolina develops and implements consistent ground water protection across all program areas state-wide. Monitoring of the state groundwater resources is an integral part of this program. Current projects under the 106 Groundwater Protection Program include:
a) Completion and submittal of the draft Core CSGWPP which is the
comparison of the groundwater protection strategy to the national CSGWPP guidance.
b) Implementation/coordination of State Sourcewater Protection Program and
related special projects.
c) Continued development and implementation of a statewide ambient groundwater quality monitoring network.
d) Continued development and maintenance of the annually updated inventory
of groundwater contamination sites.
e) Evaluation of aquifer vulnerability through isotopic (tritium and radiocarbon) monitoring of groundwater.
f) Provides ground water technical support to Clemson University concerning
the development and implementation of the State Pesticides Management Plan and related special studies.
g) Development and implementation of investigations to determine the sources
of contamination detected in monitoring of public supply wells.
E. Underground Injection Control Program
The Groundwater Management Section activities in the Underground Injection Control Program include:
a) Designation and description of underground sources of drinking water.
b) Development and maintenance of an inventory of injection wells.

-60-
c) Permitting for Class II, III, and VA injection wells.
d) Surveillance and investigation of injection facilities.
e) Development and maintenance of a data management system.
F. Capacity Use Permitting Program
The Groundwater Management Section activities in the Capacity Use Permitting Program include:
a) Declare and delineate capacity use areas.
b) Issue new and renew existing Groundwater Use Permits; modify permits.
c) Development and maintenance of data management systems.
d) Measure water levels in monitoring wells in the Low Country and
Waccamaw.
e) Review and modify legislation as necessary.
f) Develop and implement groundwater packages to monitor effects of new permits.
g) Coordinate with Georgia to determine effects of withdrawals and saltwater
intrusion in Low Country.
G. Underground Storage Tank (UST) Program
The Underground Storage Tank Program collects and maintains underground storage tank system and related environmental data through a variety of activities which include:
a) Issuing of underground storage tank system permits to install and operate.
b) Maintaining a database of active and closed underground storage tank
systems, the number and cleanup status of underground storage tank releases, financial assurance mechanisms submitted by tank owners and operators for corrective action and third party liability, and payments made from the SUPERB Account and the SUPERB Financial Responsibility Fund.
c) Providing technical assistance at underground storage tank installations,
system upgrades, and abandonments; and performance of a state wide compliance inspection program.
d) Determining the risk posed by an underground storage leak and overseeing all

-61-
activities related to assessment, risk evaluation and remediation of tank releases.
e) Implementing a site rehabilitation contractor certification program.
f) Administering two state assurance funds (SUPERB Financial Responsibility
Fund and the SUPERB Account) for underground storage tank owners and operators.
H. Geohydrologic sampling activities
The Groundwater Quality Section of the Division of Water Monitoring, Assessment and Protection within the Bureau of Water has the responsibility to evaluate and provide regulatory oversight of groundwater protection and aquifer restoration programs at permitted wastewater treatment facilities through the S.C. Water Pollution Control Act and the S.C. Water Classification and Standards (R.61-68, 61-69).
In addition, the Groundwater Quality Section provides oversight of groundwater monitoring, assessment and remediation at facilities which do not have associated environmental permits issued by the Department (i.e., petroleum or chemical releases from above-ground storage tanks, releases from unregulated underground storage tanks, releases from spills or leaks). Such activities are performed under authority of Section 44-55-40 of the State Safe Drinking Water Act and Section 48-1 of the Pollution Control Act.
The Groundwater Quality Section within the Water Monitoring, Assessment, and Protection Division provides: 1. Hydrogeologic review of plans and specifications of proposed wastewater
treatment impoundments, with regards to groundwater quality protection criteria and standards.
2. Review and evaluation of proposed wastewater facility groundwater
monitoring programs for approval or denial such as quantity and location of monitoring wells, construction specifications, analytical parameters and sampling frequency, and sample collection protocol.
3. Site specific evaluation and review of proposed land treatment and disposal
systems for residuals and wastewater generated from wastewater treatment facilities.
4. Evaluation of routine monitoring data for groundwater quality compliance
and enforcement including early detection of potential groundwater degradation. This analytical data is commonly submitted by facilities as a permit requirement. The routine monitoring is continuously evaluated for optimum effectiveness in meeting program objectives and is modified
-62-
accordingly.
5. Hydrogeologic review of reports, assessment plans and remediation plans relating to releases of contaminants to ensure that established water quality standards are maintained and/or returned to water quality standards, ensure that contaminant sources are adequately removed and evaluate remediation program effectiveness at permitted wastewater facilities and unpermitted facilities.
6. Issuance of monitoring well approvals to permitted wastewater facilities and
unpermitted facilities in relation to environmental due diligence investigations.
7. Hydrogeologic review and evaluation of proposed groundwater "mixing
zone" requests from permitted wastewater facilities or unpermitted facilities with regard to the hydrogeologic conditions and groundwater/ surface water quality regulations and standards. Determine approval or denial of the mixing zone request and appropriate compliance monitoring requirements.
8. Assistance to District personnel in groundwater quality assessments, corrective action and related groundwater activities in order to maintain high quality standards for protection and restoration of aquifer quality.
9. Coordination with other Agency programs to identify, reduce or eliminate
nonpoint sources of groundwater contamination for the purpose of protecting human health and prevent/mitigate the impact to wetlands, drinking water supplies, and surface waters of this State; to levels above Regulatory or acceptable standards.
10. Recommendations to the Bureau of Water Enforcement Section when
permitted wastewater facilities and unpermitted facilities do not perform appropriate actions as requested by the Section.
The responsibility for groundwater sample collection and analysis is usually placed on the owner of the proposed or existing facility. Occasionally, the Groundwater Quality Section staff will collect samples of groundwater, surface water, effluent, and soil/sludge. The occasions where this sampling is considered necessary include (but are not limited to) verification of facility reported analytical results, offsite ambient groundwater quality determination, special evaluations at on-site locations and determination of groundwater quality at public and private wells located near a known source of contamination. Water quality, sludge and soil samples may be collected from existing monitor wells, public and private wells, DHEC test borings and wells, groundwater discharge points and facility wastewater impoundments.

-63-
Projected number of samples for calendar year 2002 are as follows:
1. Public wells ..........................................5 2. Effluent.................................................5 3. Surface water........................................5 4. Private wells .......................................20 5. Monitoring wells ................................20 6. Soil/Sludge ...........................................5
It is projected that each of the above samples will be evaluated for both volatile and semi-volatile organics and inorganic constituents with regard to drinking water criteria/standards and toxicity testing as appropriate.

�
-64-
X. LABORATORY SUPPORT A. Laboratory Services
The Analytical Services Division provides laboratory services to the Bureaus of Water and Land and Waste Management. The analytical services offered include bacteriological, chemical, and physical analyses. The types of samples analyzed include water, wastewater, leachate, soil, sediment, chemical wastes, fish, and shellfish.
The organizational structure encompasses five sections and six regional laboratories. The Central Laboratory Sections include Sample Characterization/ Automated Analysis/ Data Management, Metals Analysis, GC/MS - HPLC Analysis, GC Analysis, and Environmental Microbiology. The seven regional laboratories are located in Aiken, Beaufort, North Charleston, Florence, Greenville, Lancaster, and Myrtle Beach.
The Regional Laboratories, except for Beaufort and Myrtle Beach, initiate all stream and wastewater analysis and the Central Laboratories provide support analyses, i.e., metal, nutrient, toxic extraction procedures, and organic analyses. The Beaufort and Myrtle Beach Regional Laboratories analyze microbiological samples only. The Central Laboratory also acts as the Regional Laboratory for the Central Midlands District, performing the same functions as the other Regional Laboratories. Drinking Water Chemical Analysis is essentially a Central Laboratory program with support from the Regional Laboratories. All regional laboratories except Myrtle Beach perform microbiological analyses for the Drinking Water Program.
The Division Director and the Quality Assurance Officer coordinate the internal quality assurance program.
B. Analytical Services Quality Assurance Program
A quality assurance program is essential to produce valid data and to provide a means to systematically demonstrate its validity. The quality assurance program encompasses every aspect of the laboratory analysis from container preparation through the actual data release from the Analytical Services Division Laboratory to the Environmental Quality Control (EQC) Programs.
The Analytical Services Division has developed two quality control manuals which detail the day-to-day operation of the quality assurance program: (1) Procedures and Quality Control Manual for Chemistry Laboratories--Analytical Services Division; and (2) Laboratory Procedures Manual for Environmental Microbiology-- Analytical Services Division. The elements of quality control addressed in the manuals include

�
-65-
organization and sample chain of custody; personnel training; quality control of laboratory services, equipment, reagents, solvents, and glassware; methodology; and analytical performance control.
The overall laboratory quality assurance program which includes the previously discussed elements requires a minimum of 25% of allocated resources. The frequency for analysis of replicates and spike recovery samples is noted in the manuals and is in compliance with U.S. EPA guidelines. Performance samples are also analyzed as noted in the manuals. The Environmental Microbiology Laboratories perform replicate analyses, positive test controls, media control tests, equipment control tests, etc., as required by EPA Laboratory Certification and Evaluation guidelines. In addition, the Analytical Services Division and the seven regional laboratories participate in annual Water Supply and Water Pollution Performance Proficiency Testing Programs. All district personnel who collect samples that require field testing participate in either the yearly Water Supply or Water Pollution Proficiency Testing Program, whichever is appropriate.
The laboratory analyses are conducted according to the List of Approved Test Procedures in the Federal Register, Volume 49, No. 209, October 26, 1984, and in the Federal Register, Volume 59, No. 20, January 31, 1994. The Analytical Services Division quality control manuals include a section on methodology designed to reduce variations in applied techniques among the seven laboratories where methods permit analyst interpretation, and thus provide a more uniform approach which will increase the reproducibility of results reported from the laboratory system.
The proper containers must be selected for sampling as well as the proper preservation and an adequate volume collected. The reader should refer to the manual entitled Environmental Quality Control Environmental Investigations Standard Operating Procedures and Quality Assurance Manual 2001 Edition (SCDHEC) for details.
A detailed discussion of sample chain of custody and the management of data flow is included in the manuals. The reader should refer to the flow chart, Figure 5, entitled "Sample Chain of Custody and Data Flow."
C. Sample Containers and Preservation
Control of the quality of laboratory analyses begins with the sample collection. The validity of analytical results obtained depends upon a representative sample of the source from which it was collected. The concentration of each constituent in a sample at the time of collection must be maintained until all analyses have been completed. Constituent concentrations may be altered after collection through contamination of the container, reactions between sample components and the

Figure 5. Analytical Services Division Sample Chain-of-Custody and Data Flow.
66
Sample Collection Site (Sample with Field Sheet)
Regional Laboratory Sample Custodian
Regional Laboratory Analysis
Central Laboratory Sample Analysis & Data Management Section
Metals Analysis Section GC Section
OC/MS-HPLC Section SA & DM Section
Microbiology Section
Central Laboratory Sample Analysis & Data Management Section
Analytical Services Division Office
Bureau of Land and Waste Management
RCRA Program Criminal Investigation
Bureau of Water
Private Drinking Water
Public Drinking Water
Stream Monitoring
DWT Phase I, II, V
Special Studies
Biological Monitoring
Shellfish Sanitation
Facilities Monitoring

�
-67-
container walls, and through naturally occurring reactions within the sample itself. This section contains the methodology employed by the Laboratories to control those factors which can affect sample validity. The actual sample collection procedures are not included in this manual; the reader may wish to refer to the manual entitled Environmental Quality Control Environmental Investigations Standard Operating Procedures and Quality Assurance Manual 2001 Edition (SCDHEC).
Glass, polyethylene, and polypropylene bottles are used as sample containers. The sample container is cleaned and labeled for the parameter for which it is used. The containers used for the various parameters have been chosen for their chemical resistance to the chemical parameter of interest and the required preservatives. Random substitution of containers may not be made.
Special cleaning procedures are employed for the various containers. Each parameter or parameter group involves different interfering compounds and contaminants which must be removed from the container walls. Containers required for Parameters analyzed by the Organic and Inorganic Chemistry Laboratories are maintained by those laboratories. Clean containers for organic and inorganic parameters are shipped to the Regional Laboratories by the Sample Management Section in Columbia. Containers required for parameters analyzed by the Regional Laboratories are maintained by those laboratories and cleaned according to special procedures.
Water samples either are preserved at the site immediately after collection or are preserved after bringing them back to the office or the lab in accordance with requirements established by the United States Environmental Protection Agency.
The district offices are responsible for requesting the preservatives in order to maintain an ample quantity. Each dispenser is labeled in bold letters to assist the collector to choose the proper preservative for the container; i.e., METALS, MERCURY, NUTRIENTS, TOC, etc. Because the concentration levels cannot be maintained at the level collected indefinitely, maximum holding times have been set for each parameter. Analyses must be completed during the time limits set for valid results. Required containers, preservatives, and holding times for each parameter and procedures used for preserving cyanide, phenol, and sulfide samples at the collection site are listed in the Procedures and Quality Control Manual for Chemistry Laboratories - Analytical Services Division, and Environmental Quality Control Environmental Investigations Standard Operating Procedures and Quality Assurance Manual 2001 Edition. The regional or central laboratory chemists are responsible for providing containers, preservation materials, and preservation technique instructions to sample collectors for samples for cyanide, phenol, sulfide, and drinking water organic compounds.

�
-68-
D. Laboratory Evaluation Program
The SC Environmental Laboratory Certification Program is authorized by Regulation 61-81 entitled “State Environmental Laboratory Certification Regulation” which became effective on January 1, 1981. The Regulation applies to all laboratories which generate data for compliance with state environmental regulations or that is performing any other analyses related to environmental quality evaluations required by the Department or which will be officially submitted to the Department. Two of the main components of the certification program are: 1) an on-site evaluation of the candidate laboratory is performed in regard to facilities, equipment, personnel, methodology, records keeping, and quality assurance/quality control practices, and 2) the successful analysis of unknown performance evaluation samples. A detailed report of the on-site evaluation revealing the deficiencies cited is written and returned to the laboratory. The report states that all deficiencies must be corrected within a specified time frame not to exceed 90 days. If certification is not obtained, the Department will not accept data from that laboratory. Performance evaluation samples must be successfully analyzed prior to obtaining certification and at least annually thereafter for all parameters where it is technically feasible for the laboratory to demonstrate performance. Two consecutive performance evaluation failures for any certified parameter(s) will result in decertification of the affected laboratory for the parameter(s) in question. A certification certificate, which documents the program area(s), methodology and parameter(s) for which certification has been granted, is provided to each laboratory, but remains the property of the Department.
On-site evaluations of in-state certified laboratories are conducted at least every three years and are scheduled approximately three months prior to the date of expiration documented on the laboratory’s certification certificate. On-site evaluations are usually announced in advance, but may be conducted unannounced for sufficient cause. The Certification Program currently offers certification for laboratories performing analyses of drinking water, wastewater and solid and/or hazardous wastes and for the priority air pollutants. The staff members of the Office of Environmental Laboratory Certification also provide technical assistance to the laboratory community, assist other Departmental personnel with performance audit investigations of wastewater facilities, provide technical reviews of plans for new laboratory design and/or construction and perform data quality assessments for selected program areas upon request.
For new in-state laboratories, the average amount of time that expires from the Office’s receipt of an application for certification until the Laboratory’s receipt of its certification certificate is approximately four (4) months. For an out-of-state laboratory holding certification(s) from other state program(s) adjudged to be substantially equivalent to the SC Program, the certification process can be

�
-69-
completed in as little as two weeks. For out-of-state applications received from states that have no preexisting history with the SC Program, the certification process can take much longer to complete.
�
-70-
XI. DATA HANDLING
Data for samples that are analyzed in the District Laboratories are reported on the appropriate data sheets and released by the sample custodian. These data sheets are sent to the Analytical Services Division in Columbia where they, along with data sheets generated in the Central Laboratory, are sent to the appropriate program areas. All stream and facility data is distributed by Compliance Assurance Division to the appropriate program areas.
A. Ambient Surface Water Quality Monitoring - Routine ambient stream and sediment
samples are collected by District personnel. The data is sent to the Water Quality Monitoring Section from the Analytical Services Division via Compliance Assurance Division. The data are reviewed by the Water Quality Monitoring Section and are sent to the Information Services Section for key-punching. The keypunched data are edited and will be stored in the new EPA's STORET distributed water quality database. Data sheets are kept on file in the Water Quality Monitoring Section.
B. Special Study Data - Generally special studies are initiated in the Central Office
through requests from other Divisions or Districts. Samples are usually collected with the cooperation of the District within which the study area lies. Samples and data are handled as for ambient monitoring.
C. Compliance Sampling - Compliance sampling data are sent to the Pollution Source
Compliance Section Manager from the Analytical Services Division. After review by the Pollution Source Compliance Section, the data is sent to Permit and Data Administration Section for key-punching. Keypunched data is edited and a compliance monitoring report (CMR) is generated. A determination of compliance is made by the Pollution Source Compliance Section. Copies of the report are sent to the permittee, District, Central files, and EPA (majors). Inspections are tracked by EPA's computerized Permit Compliance System (PCS) and the Bureau's WPC Network system.
D. NPDES Compliance and Self-Monitoring - NPDES compliance reports and
self-monitoring data are monitored for accuracy and a determination of compliance made by the Enforcement Section. If the facility shows is not in compliance, a Notice of Violation is sent to the owner.
E. State Operation and Maintenance Inspections - Routine State 0 & M inspections are
completed by the Facility Evaluator and reviewed in the district. Copies of the report are distributed to the facility owner, the facility operator, and the district files, with the original being sent to the Pollution Source Compliance Section. The original is later placed in the Central files. Information from the inspection is updated in the computerized Central File. Inspections are tracked by the EPA's computerized PCS.

�
-71-
F. Fish Kill - Samples are sent to the Analytical Services Division for analysis. The data is sent to the investigator and added to an electronic database (EFIS, Environmental Facility Information System). EFIS is SCDHEC’s official fish kill investigation report. A copy of the fish kill investigation report and data is sent to the owner (if the kill occurred in a private pond), the person who reported the kill, the District Director of the area where the kill occurred, South Carolina Department of Natural Resources if they helped with investigation or expressed interest in the kill, the Enforcement Section of DHEC, and DHEC's central files as appropriate. A record is kept on file by the Emergency Response Section.
G. Biological Monitoring - After samples are collected, data sheets are kept on file in the
Aquatic Biology Section until sample analysis is completed. Upon completion of analysis, any physical or chemical data are placed in STORET. Macroinvertebrate taxonomic and habitat assessment data are entered into a computerized in-house database. Data sheets describing biological data are kept on file in theAquatic Biology Section.
H. Whole Effluent Toxicity - Toxicity test data and results collected by the Department
are maintained in paper files and in SAS data bases for the purpose of generating control charts, analyzing test variability, etc. CBI WET tests results are maintained in the Bureau of Water Tracking System and permittees are notified or results via inspection reports. Reports on individual facilities and summaries of toxicity data by basin, county district, etc., can be generated by the BOW Tracking System.