2015-2016 oklahoma water quality monitoring strategy of water quality monitoring in oklahoma:...
TRANSCRIPT
Status of Water Quality Monitoring in Oklahoma: Water Monitoring Strategy Document
2015 - 2016
Acknowledgements
This report was compiled and written by staff of the Oklahoma Water Resources Board with input and assistance from several agencies including the Oklahoma Conservation Commission; Oklahoma Department of Environmental Quality; Oklahoma Department of Agriculture, Food & Forestry; Grand River Dam Authority; United States Geological Survey; Oklahoma Corporation Commission; and Office of the Secretary of Environment. In addition to providing a synopsis of current statewide water monitoring, the report serves as a comprehensive and concise tool that can be utilized to assist with coordination of future monitoring activities.
Status of Water Quality Monitoring in Oklahoma: Surface Water Monitoring Strategy Document 1
TABLE OF CONTENTS TABLE OF CONTENTS ............................................................................................................................................................................... 1 LIST OF TABLES .......................................................................................................................................................................................... 2 LIST OF FIGURES ........................................................................................................................................................................................ 2 EXECUTIVE SUMMARY AND RECOMMENDATIONS........................................................................................................................ 3 RECOMMENDATIONS FOR IMPROVING WATER MONITORING IN OKLAHOMA .......................................................... 3 RESOURCE NEEDS FOR OKLAHOMA SURFACE WATER MONITORING ........................................................................... 4 INTRODUCTION .......................................................................................................................................................................................... 5 OKLAHOMA WATER QUALITY MONITORING PROGRAMS .......................................................................................................... 7 WATER QUALITY MONITORING AGENCIES .............................................................................................................................. 7
OKLAHOMA WATER RESOURCES BOARD ......................................................................................................................... 7 OKLAHOMA CONSERVATION COMMISSION ..................................................................................................................... 7 OKLAHOMA DEPARTMENT OF ENVIRONMENTAL QUALITY ..................................................................................... 8 OKLAHOMA DEPARTMENT OF AGRICULTURE, FOOD & FORESTRY ....................................................................... 8 OKLAHOMA CORPORATION COMMISSION ....................................................................................................................... 8 GRAND RIVER DAM AUTHORITY ......................................................................................................................................... 8 UNITED STATES GEOLOGICAL SURVEY .............................................................................................................................. 8 UNITED STATES ARMY CORPS OF ENGINEERS ................................................................................................................ 8
GENERAL WATER QUALITY MONITORING BACKGROUND INFORMATION .................................................................. 8 OKLAHOMA MONITORING OBJECTIVES .................................................................................................................................... 9
STATE WATER MONITORING INITIATIVES AND PROGRAMS ................................................................................................. 10 OKLAHOMA CONSERVATION COMMISSION .......................................................................................................................... 10
ROTATING BASIN MONITORING PROGRAM .................................................................................................................. 13 SPECIAL PROJECTS MONITORING ..................................................................................................................................... 19
ONGOING PROJECTS ....................................................................................................................................................... 20 CONSERVATION RESERVE ENHANCEMENT PROG (CREP): ILLINOIS RIVER & SPAVINAW CREEK .... 20 ELK CITY LAKE REGIONAL CONSERVATION PARTNERSHIP PROGRAM (RCPP) ...................................... 20 NEW SPIRO LAKE WATERSHED PROJECT .............................................................................................................. 21
VOLUNTEER MONITORING: STATEWIDE BLUE THUMB PROGRAM ..................................................................... 22 WETLANDS PROGRAM .......................................................................................................................................................... 23
OKLAHOMA WATER RESOURCES BOARD .............................................................................................................................. 25 BENEFICIAL USE MONITORING PROGRAM (BUMP) ................................................................................................... 25 STREAMS AND LAKES PROBABILISTIC MONITORING PROGRAM ......................................................................... 30 BIOCRITERIA DEVELOPMENT: BIOLOGICAL MONITORING .................................................................................... 31 HARMFUL ALGAE BLOOM (HAB) MONITORING .......................................................................................................... 32 WATER WELL MASS MEASUREMENT PROGRAM ........................................................................................................ 33 OWRB AND UNITED STATES GEOLOGICAL SURVEY (USGS) COOPERATIVE PROGRAM ................................ 35
OKLAHOMA DEPARTMENT OF ENVIRONMENTAL QUALITY .......................................................................................... 38 TOTAL MAXIMUM DAILY LOADING (TMDL) STUDIES ............................................................................................... 38 MERCURY IN FISH PROGRAM ............................................................................................................................................. 39
OKLAHOMA DEPARTMENT OF AGRICULTURE, FOOD AND FORESTRY ...................................................................... 45 LICENSED MANAGED FEEDING OPERATIONS MONITORING WELL PROGRAM ................................................ 45
OKLAHOMA CORPORATION COMMISSION ............................................................................................................................ 49 TYPES OF ENVIRONMENTAL WATER QUALITY MONITORING: .............................................................................. 49
GRAND RIVER DAM AUTHORITY .............................................................................................................................................. 50
Status of Water Quality Monitoring in Oklahoma: Surface Water Monitoring Strategy Document 2
WATER QUALITY MONITORING PROGRAM .................................................................................................................. 50 CURRENT ACTIVITIES ........................................................................................................................................................... 50 USE SUPPORT ASSESSMENT PROTOCOLS ...................................................................................................................... 53 QUALITY ASSURANCE/QUALITY CONTROL PROCEDURES ...................................................................................... 53
APPENDIX A – OKLAHOMA ENVIRONMENTAL AGENCY STATUTORY AUTHORITIES .................................................... 54
LIST OF TABLES
TABLE 1. PROJECTED STATEWIDE ROTATING BASIN PROGRAM SITE LIST (COLORS INDICATE BASIN GROUPS) FOR THE FOURTH CYCLE BEGINNING SPRING 2016. ................................................................................................................. 14 TABLE 2. GROUNDWATER MONITORING SAMPLE VARIABLES. ............................................................................................ 28 TABLE 3. STREAM AND LAKE MONITORING SAMPLE VARIABLES. ...................................................................................... 29 TABLE 4. WATERBODIES SAMPLED AS PART OF THE MERCURY IN FISH PROGRAM .................................................... 43 TABLE 5. MONITORING WELL SAMPLING RESULTS, 2000 TO 2015 .................................................................................... 48
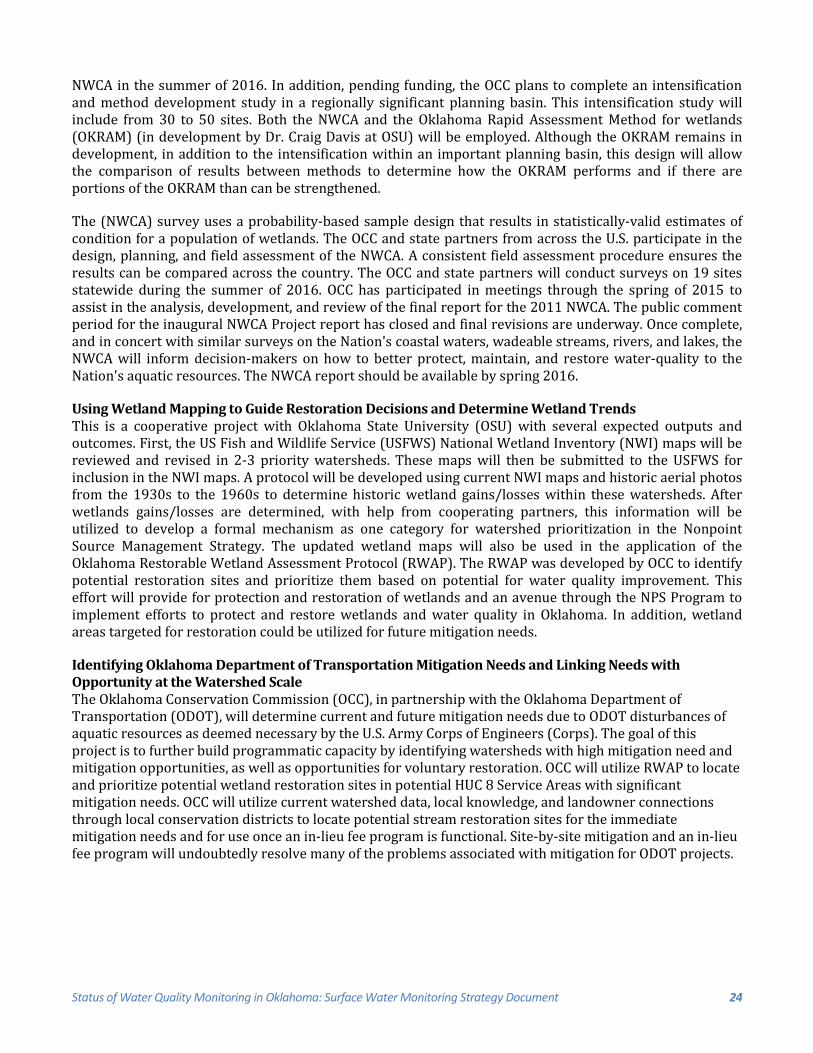
LIST OF FIGURES FIGURE 1. ANALYSIS OF IMPLEMENTATION MONITORING DATA SHOWING SIGNIFICANT REDUCTION IN E. COLI (OCC BEATY CREEK WATERSHED IMPLEMENTATION PROJECT). ........................................................................................ 10 FIGURE 2. MEASURING WATER QUALITY PARAMETERS. ........................................................................................................ 11 FIGURE 3. COLLECTING FISH BY SEINE. .......................................................................................................................................... 12 FIGURE 4. ROTATING BASIN PROGRAM BASIN SCHEDULE AND HISTORICAL DISTRIBUTION OF SITES SAMPLED. .................................................................................................................................................................................................. 13 FIGURE 5. FIELD SPECIALIST ACCESSING AUTOSAMPLER. ..................................................................................................... 19 FIGURE 6. BT VOLUNTEERS COLLECTING FISH. .......................................................................................................................... 22 FIGURE 7. ACTIVE BLUE THUMB MONITORING SITES. ............................................................................................................. 23 FIGURE 8. STREAM SAMPLING FROM A BRIDGE. ........................................................................................................................ 25 FIGURE 9. BUMP PERMANENT STREAM MONITORING SITES. ............................................................................................... 25 FIGURE 10. BUMP SITES FOR ALL SAMPLE LAKES AS OF 2008/2009. ................................................................................ 26 FIGURE 11. MAJOR BEDROCK AND ALLUVIUM AND TERRACE AQUIFERS IN OKLAHOMA .......................................... 27 FIGURE 12. GMAP IMPLEMENTATION SCHEDULE. ..................................................................................................................... 28 FIGURE 13. OWRB STAFF COLLECTING STREAM BIOTA. ......................................................................................................... 30 FIGURE 14. OWRB STAFF SEINING STREAM AND COLLECTING HABITAT DATA. ........................................................... 30 FIGURE 15. OWRB LAKES PROBABILISTIC SAMPLING PROGRAM........................................................................................ 31 FIGURE 16. ALGAL SAMPLE FROM TAYLOR-MARLOW LAKE. ................................................................................................. 32 FIGURE 17. HISTORICAL WELL NETWORK FOR THE MASS MEASUREMENT PROGRAM .............................................. 33 FIGURE 18. MASS MEASUREMENT NETWORK IN 2015 ............................................................................................................ 34 FIGURE 19. USGS COOPERATOR GAGES. ......................................................................................................................................... 37 FIGURE 20. LMFO MONITORING SITE LOCATIONS FOR 2014-2015. ................................................................................... 45
Status of Water Quality Monitoring in Oklahoma: Surface Water Monitoring Strategy Document 3
Executive Summary and Recommendations
According to Oklahoma Statutes, Title 27A Section 1-1-202 Paragraph E, it is the responsibility of the Oklahoma Water Resources Board to submit a biennial report to the Oklahoma Legislature discussing the status of water quality monitoring in Oklahoma.
It is also a requirement by the United States Environmental Protection Agency (EPA) that Oklahoma submit a document for their approval that outlines the state’s water monitoring strategy. The Clean Water Act (CWA) specifies that "the Administrator shall not make any grant under this section (106) to any State which has not provided or is not carrying out as a part of its program- the establishment and operation of appropriate devices, methods, systems, and procedures necessary to monitor, and to compile and analyze data on (including classification according to trophic condition), the quality of navigable waters and to the extent practicable ground waters including biological monitoring; and provision for annually updating such data...".
This document, the culmination of these two charges, outlines current monitoring activities conducted by the State of Oklahoma and recommends modifications or improvements to water quality monitoring initiatives.
Included within this report are summaries of the various activities undertaken by the state to monitor water quality, compile information, establish data quality objectives, analyze environmental data, and store data. Numerous state agencies have monitoring programs that exist for a variety of purposes. Much of this monitoring is related to federal programs or federal requirements. These programs are discussed in detail in the various sections of this document.
Recommendations for Improving Water Monitoring in Oklahoma
Improvements to statewide monitoring efforts should be pursued to ensure that the best available data is collected to assist decision makers in managing, protecting, and improving Oklahoma’s water resources. Some recommendations to enhance the state’s monitoring efforts are presented below:
• Additional monitoring should be implemented on Oklahoma’s rivers and streams.
• Biological monitoring on lakes should be expanded to allow use support determinations to be made at a relatively inexpensive financial cost.
• Further work should be pursued in the development of Use Support Assessment Protocols (USAP). New protocols need to be developed for all beneficial uses and current protocols need to be refined.
• Diurnal dissolved oxygen monitoring should be conducted on a widespread basis. This has been a recommendation in previous Strategy Documents, but has never been implemented systematically.
• Metals and organics sampling occurs on a very limited basis. Much more extensive ambient sampling for these types of compounds would be very beneficial to Oklahoma. The Oklahoma Conservation Commission (OCC) evaluates results of bioassessment studies to select streams for metals and organics monitoring in order to avoid spending limited resources on streams that have no biota problems. Toxics monitoring related to fish consumption by humans is an area that could be greatly expanded in the future. The Oklahoma Department of Environmental Quality (ODEQ) currently conducts a fish tissue toxics monitoring program on a limited scale on lakes, with monitoring on streams occurring very sporadically. Additional monitoring of this nature is critical if the Fish Consumption Beneficial Use is to be assessed in a holistic manner.
Status of Water Quality Monitoring in Oklahoma: Surface Water Monitoring Strategy Document 4
• More work needs to be focused on lake monitoring. Oklahoma lakes are utilized extensively as water supply sources and as recreational outlets both for Oklahomans and out-of-state visitors. Compared to streams monitoring, very few resources are focused on monitoring lakes. It is also necessary that Nutrient Limited Watershed (NLW) impairment studies be conducted on identified lakes to assess if nutrient impairments are present.
• The OWRB/U.S. Geological Survey (USGS) Cooperative Program for stream flow monitoring should continue to be a priority for Oklahoma. It is not necessary to have exact measurements of flow for all monitoring activities, but it is necessary to know if stream flow is at seasonal base flow to make numerous beneficial use support determinations. More exact measurements for flow are necessary for such activities as calculating a Total Maximum Daily Load (TMDL) and other technical studies. An assessment of the Cooperative Program has helped to identify the number and location of stream gages needed to support the Oklahoma Comprehensive Water Plan. With funding issues arising each year, there is a very real possibility that the Cooperative Program between the OWRB and the USGS will no longer meet the data needs for the state of Oklahoma. A long-term funding solution for the program should be pursued.
• Monitoring activities in Oklahoma should continue to be closely coordinated with implementation of the Oklahoma Comprehensive Water Plan (OCWP), which is vital to mapping the state’s water future.
• Partnerships between state and federal agencies should be further enhanced and initiated to help meet the needs of all parties. This will allow for the most efficient and effective utilization of available resources. Relationships between state environmental agencies should be enhanced to maximize benefit to the state.
Resource Needs for Oklahoma Surface Water Monitoring
Although significant resources are currently utilized for water quality monitoring activities in the state, a sizable funding gap continues to exist for increasing these efforts to a level that will meet both EPA requirements and various state data needs. This funding gap was significantly decreased through the additional funding for monitoring activities approved by the Oklahoma Legislature in 2012. The Oklahoma Conservation Commission was appropriated an additional $500,000 to support non-point source monitoring activities and the Oklahoma Water Resources Board was appropriated an additional $1.3 million dollars for the Beneficial Use Monitoring Program (BUMP). A continued commitment to dedicating additional resources is important for further enhancements to water quality monitoring activities across the state.
Status of Water Quality Monitoring in Oklahoma: Surface Water Monitoring Strategy Document 5
Introduction
Numerous agencies are engaged in water quality monitoring in Oklahoma for a variety of purposes. Monitoring is often conducted as part of a federal project, where the type and duration of the monitoring are very strictly outlined as a condition of the grant award. Before any meaningful discussion of monitoring in Oklahoma can begin, it is essential to outline the various types of monitoring that occur, and the benefits offered by each type.
The monitoring objective often determines the type of monitoring that occurs for each project. For example, if water quality monitoring is required as part of a federal grant, the monitoring will most likely be initiated to document water quality concerns or impairments to a specific waterbody or watershed and for a specific water quality parameter or parameters. In the case of remedial activities, the monitoring program will be designed to document the success or failure of the remediation. For general ambient water quality monitoring, a large suite of parameters will be monitored to assess use support for numerous beneficial uses.
Therefore, a critical aspect of most water quality-monitoring programs is that they are designed around the idea of answering a specific question. For example, monitoring to document the effectiveness of Best Management Practices (BMPs) for improving water quality in the Washita River is fundamentally different than a monitoring program designed to look at long-term water quality trends in the Illinois River Basin. These examples demonstrate differences based on several factors, such as density of the monitoring sites in an area (scale of the project), parameters monitored for, time frame of the monitoring (several years versus monitoring of at least 10 years or longer), etc.
During the past few decades, heightened interest in the State’s 303(d) list and development of Total Maximum Daily Loads (TMDLs) has served to highlight the monitoring efforts of various state environmental agencies. In general, development and refinement of the 303(d) list and Integrated Water Quality Assessment Report has resulted in a greater understanding by all concerned parties that improvements in monitoring initiatives are necessary.
An examination of the state’s monitoring process identified a small number of data and data assessment problems. Several key points can be made when discussing the state’s water quality monitoring programs:
• Monitoring has historically been conducted by various environmental agencies with the express purpose of meeting federal program requirements and Oklahoma statutory mandates for each agency. This has resulted in a fragmented monitoring program for the state as a whole. Although a coordinated holistic monitoring program for Oklahoma does not currently exist, the ODEQ, OWRB and OCC are working together to ensure that water quality monitoring in Oklahoma is conducted in as efficient and effective a manner as possible.
• Monitoring of water resources in Oklahoma has historically been inadequate to assess the water quality status of many state water supply sources. In recent years, mitigation efforts have increased through additional monitoring by state environmental agencies; however, there is a continued need for increased monitoring in new and emerging areas to ensure that the public is adequately protected
• Due to lack of historical baseline information on many state waters and lack of consistent protocols for assessing use support, the job of protecting and preserving state water resources has been made much more difficult. Baseline information is absolutely essential for the identification of “abnormal” water quality conditions. Numerous environmental agencies, such as the OCC, ODEQ, and OWRB, have collected environmental data and worked extensively to identify baseline conditions across Oklahoma. With the development of Use Support Assessment Protocols (USAP), codified into the
Status of Water Quality Monitoring in Oklahoma: Surface Water Monitoring Strategy Document 6
OWRB rules, consistent protocols now exist. Protocols continue to be refined and developed for all beneficial uses.
• Compared to resources allocated to other aspects of water quality management, such as lake and stream restoration, permitting, and permit compliance, or regulation, relatively few resources have been allocated to monitoring programs. Additional resources for monitoring are critical to ensure sound scientific and resource management decisions.
In general, water quality monitoring efforts by state environmental agencies have greatly improved during the last decade. With funding of the Beneficial Use Monitoring Program (BUMP) at the state level and the increased funding to federal programs such as §106 and §319, a major step has been taken to address some of the monitoring deficiencies discussed previously. However, with recent federal budget cuts, monitoring initiatives continue to fall short of meeting all of Oklahoma’s data needs. With the requirement to develop TMDLs for waters listed on the 303(d), both the state and EPA should continue to find ways to increase support for monitoring activities. It is vital that a greater understanding of water quality conditions be fostered and that resources be dedicated to areas where adverse water quality impacts are greatest or where the quality of the most outstanding water resources is threatened.
Several tools have been developed to facilitate monitoring in Oklahoma. The state environmental database is maintained by the ODEQ to assist in managing data. Another important tool is the EPA Storage and Retrieval (STORET) database. STORET is a national database that is used to house environmental data collected using federal dollars.
The following is a brief discussion of the major statewide monitoring initiatives currently conducted by state agencies concerning surface water quality/quantity monitoring and groundwater quality/quantity monitoring. This discussion focuses directly on state agencies with additional discussion of federal agency monitoring programs as they intersect with the state programs. The discussion focuses only on programs that are far-reaching or conducted on a statewide scale. Recommendations are made concerning ways to improve Oklahoma’s holistic monitoring initiative.
Status of Water Quality Monitoring in Oklahoma: Surface Water Monitoring Strategy Document 7
Oklahoma Water Quality Monitoring Programs
Oklahoma has numerous agencies that are actively involved in the water quality monitoring arena. The various agencies with their associated statutory responsibilities are outlined in Appendix A. The following is a brief description of agency monitoring efforts.
Water Quality Monitoring Agencies
OKLAHOMA WATER RESOURCES BOARD The Oklahoma Water Resources Board (OWRB) conducts monitoring on surface waters to assess beneficial use support attainment through the Beneficial Use Monitoring Program (BUMP). In 2013, a groundwater monitoring component, which includes a network of approximately 750 wells, was added to BUMP. In addition, the OWRB conducts monitoring on numerous lakes and rivers across the state to diagnose water quality problems and make recommendations for actions or activities that can be implemented to improve water quality, document attainment of pollutant reduction goals, and develop criteria for Oklahoma’s Water Quality Standards (OWQS), which includes bathymetric mapping studies. Monitoring of wetlands and performance of Use Attainment Analyses (UAAs) are also conducted on a limited or as needed basis. The OWRB and USGS work together through a cooperative program to conduct flow monitoring and water quality monitoring on many sites across the state. The OWRB has conducted numerous groundwater basin studies in cooperation with the USGS looking at the quality of Oklahoma’s groundwater resources and assessing the vulnerability of groundwater basins to pollution. Additionally, the OWRB also conducts hydrological investigations and groundwater basin studies to assess water quantity needs and water resources available to be put to a beneficial use. OKLAHOMA CONSERVATION COMMISSION The Oklahoma Conservation Commission (OCC) monitors rivers and streams across Oklahoma to assess the impacts of nonpoint source (NPS) pollution of state waters in support of the §319(h) Nonpoint Source Program. The OCC performs monitoring to educate citizens about water quality and determine the following:
• Impact of NPS pollution on a waterbody. • Identification of NPS pollution sources. • Success of efforts to reduce NPS impacts through education, best management practices (BMPs), or
other remediation efforts.
To accomplish these goals, the OCC collects baseline water quality, habitat, and biological monitoring data statewide primarily through a rotating basin sampling program. OCC also collects information on land use and other activities in any watershed that might be a source of NPS pollution. This data is collected for inclusion in numerous state water quality lists and reports and specifically for the Nonpoint Source Assessment Report. The OCC also performs project-specific monitoring to document success of implemented BMPs in improving water quality. The OCC assists the Department of Environmental Quality (ODEQ) in their wellhead protection program and conducts an education and volunteer monitoring program, Blue Thumb.
The OCC has not implemented a widespread ambient wetland monitoring program. Monitoring occurs through special project studies and often in cooperation with academic partners. OCC is currently working with various partnering agencies and universities to develop an Oklahoma specific rapid assessment method for wetlands (OKRAM). Once fully developed and vetted, the OKRAM is intended as a tool to assist in guiding restoration and mitigation efforts. This will undoubtedly include the application of the OKRAM in wetlands across Oklahoma to determine reference wetlands and/or condition, but not in an ambient monitoring program to assess individual wetlands.
Status of Water Quality Monitoring in Oklahoma: Surface Water Monitoring Strategy Document 8
OKLAHOMA DEPARTMENT OF ENVIRONMENTAL QUALITY The Oklahoma Department of Environmental Quality (ODEQ) conducts certain surface water quality monitoring activities to determine the presence of selected toxic substances in fish tissue through its Toxics and Reservoirs Program. Biotic integrity/aquatic habitat trends monitoring is conducted through the ODEQ’s Fish Community Biotrend Monitoring Program. Segment-specific pollutant loading characteristics and capacities monitoring is conducted through TMDL studies. On a site or segment specific basis, selected surface water quality monitoring may also be conducted as an adjunct to complaint investigations. Many ODEQ surface water and groundwater quality monitoring activities are a function of the agency’s regulatory programs in Point Source Discharge (OPDES) Permitting, Public Water Supply, Solid Waste Management, Hazardous Waste Permitting and Corrective Action, Underground Injection Control, Radiation Management, Brownfields Redevelopment, and Superfund.
OKLAHOMA DEPARTMENT OF AGRICULTURE, FOOD & FORESTRY The Oklahoma Department of Agriculture Food and Forestry (ODAFF) conducts a monitoring program of wastewater retention structures at Large Swine Feeding Operations by annually sampling monitoring wells installed in the vicinities of the structures to detect potential leaks that may contaminate groundwater sources.
OKLAHOMA CORPORATION COMMISSION Monitoring conducted by the Corporation Commission focuses on identification of areas adversely impacted by oil and gas activities.
GRAND RIVER DAM AUTHORITY The Grand River Dam Authority (GRDA) was created in 1935 as a conservation and reclamation district for the waters of the Grand River and its tributaries. Recently, GRDA Board Policy was amended to reflect that the aims, purposes, and objectives of the Board to protect water quality associated with lakes and streams are under its jurisdiction.
UNITED STATES GEOLOGICAL SURVEY The United States Geological Survey (USGS) conducts a monitoring program on many rivers and streams across Oklahoma, looking at stream flow and water quality conditions. The USGS coordinates with the state of Oklahoma through the Cooperative Program managed by the OWRB.
UNITED STATES ARMY CORPS OF ENGINEERS The United States Army Corps of Engineers (USACE) conducts monitoring programs on the reservoirs that it oversees through intensive water quality studies on a small number of lakes each year. The USACE and the OWRB actively share data.
General Water Quality Monitoring Background Information
In general, entities currently involved in conducting state-wide water quality monitoring programs with a primary focus of assessing beneficial use support include the OWRB, ODEQ, OCC, USGS, and USACE. Numerous other state agencies are involved to a lesser degree in water quality monitoring in Oklahoma, predominantly on a project specific basis. This report does not contain information on all water quality monitoring efforts occurring in Oklahoma, but offers a brief summary of the major statewide efforts currently being conducted.
Historically, few state or federal resources have been devoted to conducting routine water quality monitoring. In the last few years, with increased federal funding in connection with the §319 nonpoint source program and the §106 program and with state funding of the BUMP, Oklahoma has begun to make progress in terms of understanding current water quality conditions. This has resulted in more effective identification and prioritization of areas where resources should be focused.
Status of Water Quality Monitoring in Oklahoma: Surface Water Monitoring Strategy Document 9
Through the promulgation into rule of Use Support Assessment Protocols (USAP) developed through input from the various environmental entities in Oklahoma, a standardized protocol for identifying beneficial use threats or impairments has been developed. This effort is a major step forward in state monitoring initiatives. The USAP will continue to undergo modification and refinement over time. The rule needs flexibility to address more complex water quality problems, use support areas not included in USAP, and changing state/federal priorities.
Though federal funding for monitoring activities not associated with specific localized project areas has increased, monitoring is still often geared towards statutory authorities and requirements. This sometimes results in a lack of coordination between the various localized water quality monitoring projects. More effective coordination of efforts is still a goal of the various agencies involved in water quality monitoring. A comprehensive holistic program for monitoring Oklahoma’s waters is not currently in place and is vitally needed to manage the state’s water resources. There are several water quality monitoring programs that could be initiated or enhanced. For example, while the OCC aggressively conducts biological monitoring on small and mid-size streams, biological monitoring on lakes and larger streams should be expanded or implemented.
Collection of fish tissue samples for analysis of toxics is an area of water quality monitoring that could be greatly enhanced with increased funding. In general, while monitoring programs sufficient for establishing a base level currently exist, more extensive monitoring is required to allow Oklahoma to meet its goals for protecting and preserving its water resources and assessing all assigned beneficial uses in the Oklahoma Water Quality Standards (OWQS). Federal funding alone does not currently meet the water quality monitoring needs of Oklahoma. It is envisioned that a joint state and federal initiative is required to accomplish these goals.
Oklahoma Monitoring Objectives
Numerous reasons for performing water quality monitoring activities are listed below. The list highlights the primary objectives of ambient and regulatory monitoring programs conducted by most state environmental agencies:
• Determination of beneficial use support status. • Determination of water quality trends. • Identification of pollutant sources. • Regulatory compliance monitoring. • Effectiveness of Best Management Practices (BMPs).
All monitoring programs differ in data quality objectives. For the OWRB Beneficial Use Monitoring Program (BUMP), the three primary objectives are 1) beneficial use support assessment, 2) water quality trend status, and 3) refinement/development of the Oklahoma Water Quality Standards (OWQS) and USAP language. The OCC rotational stream monitoring network is primarily focused on use support determination, source identification, and effectiveness of BMP implementation. The ODEQ conducts monitoring with the objective of source identification, collecting needed data for a TMDL, trend monitoring, and public health issues (e.g., Lakes Toxics Monitoring). Monitoring conducted by the Corporation Commission focuses on beneficial use support and identification of areas adversely impacted by oil and gas activities.
Data is collected by several agencies for compliance monitoring, but monitoring conducted for that purpose is not discussed in this document, which focuses on surface water and groundwater ambient monitoring activities that do not directly relate to permitting and compliance monitoring.
Status of Water Quality Monitoring in Oklahoma: Surface Water Monitoring Strategy Document 10
State Water Monitoring Initiatives and Programs
Oklahoma Conservation Commission
While the Oklahoma Conservation Commission (OCC) conducts several distinct types of monitoring activities, it is important to note that monitoring efforts are primarily focused on determining the extent, nature, and probable source(s) of nonpoint source (NPS) pollution. The principle goal of the OCC monitoring program is direct and vital support of the agency’s mission:
To conserve and improve the water resources of the State of Oklahoma through assessment, planning, education, & implementation.
The Oklahoma Conservation Commission conducts several types of monitoring:
1. Ambient Monitoring: routine efforts to collect information about the physical, chemical, and biological characteristics of streams to determine status and trends. Ambient monitoring is the backbone of any statewide monitoring program and occurs at either fixed or randomly selected sites. Ambient monitoring is crucial for determining what problems, if any, exist and where they occur. With nearly 250 sites statewide, the OCC’s Rotating Basin Monitoring Program constitutes a significant component of the state’s ambient monitoring efforts for streams.
2. Diagnostic Monitoring: in systems where ambient monitoring has identified potential NPS problems, more robust monitoring is initiated to confirm/refute the suspected problem(s), more accurately document causes and effects, and identify sources. Diagnostic monitoring usually involves an intensification of monitoring effort (i.e., more sites, more parameters) but may also include activities such as land use assessments, watershed modeling, and a more complex bioassessment.
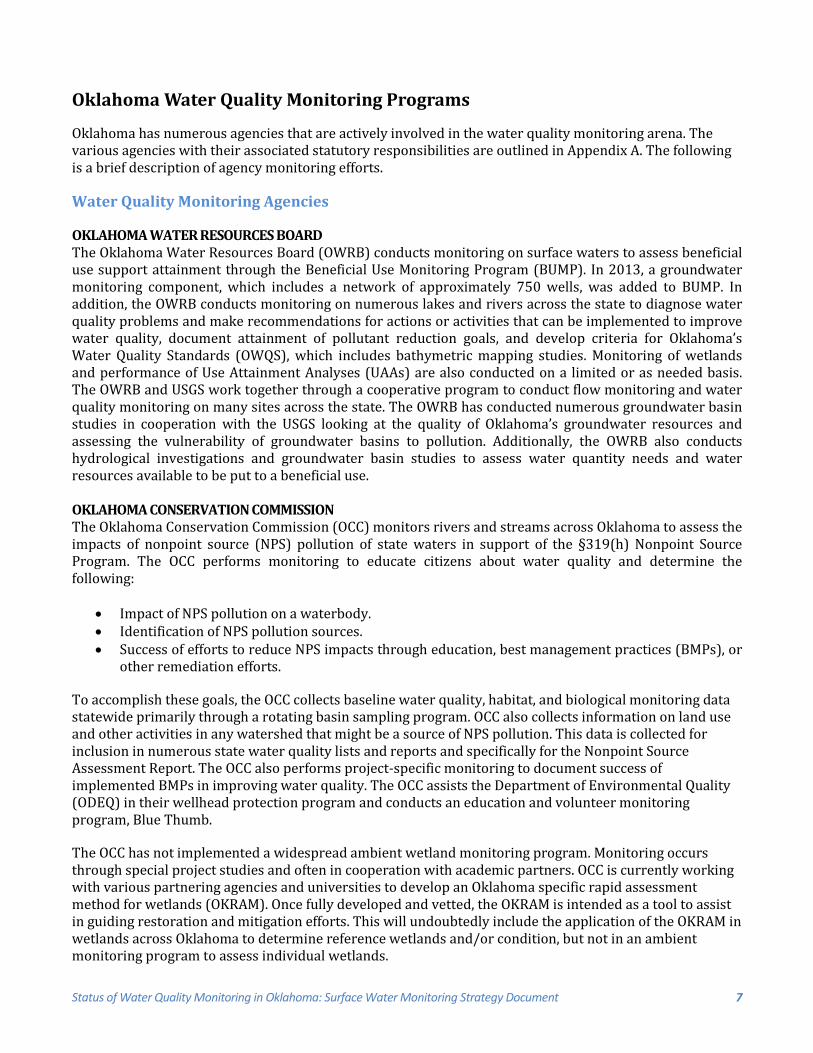
3. Implementation Monitoring: performed to determine the effects of best management practices (BMPs) on water quality. As the technical lead for Oklahoma’s NPS Program, OCC programs cost share with landowners in project watersheds to deploy various BMPs to improve and protect water quality throughout the state. It is necessary to know whether these practices are successful so that changes can potentially be made to achieve the desired effect. Implementation monitoring usually involves sampling streams during defined periods before and after management practices are installed in the upstream watershed (see Figure 1 as an example).
Figure 1. Analysis of implementation monitoring data showing significant reduction in E. coli (OCC Beaty Creek Watershed Implementation Project)
Status of Water Quality Monitoring in Oklahoma: Surface Water Monitoring Strategy Document 11
4. Reference Condition Monitoring: waterbodies differ naturally in their physical, chemical, and biological conditions. Such variation is due to landscape level changes in native plant communities, geology, soils, slope, climate, and other factors. Likewise, the resident communities of aquatic organisms vary by region for similar reasons. To determine whether a stream is polluted or whether its aquatic community is healthy, it is necessary to know the natural conditions of stream water quality and their biological communities such as fish and benthic macro invertebrates. Reference condition monitoring allows state and federal agencies to make such determinations. Reference condition data is essential to conduct bioassessment and establish biological criteria in support of water quality standards.
5. Other: specialized types of monitoring are conducted by the OCC, although rather infrequently and generally at the request of other agencies. Examples include monitoring to protect endangered species and TMDL monitoring. Monitoring to protect endangered or threatened species is conducted in response to a specific threat to a species of concern. Such monitoring is triggered by and conducted in cooperation with other agencies such as the Oklahoma Department of Wildlife Conservation and the U.S. Fish and Wildlife Service. Monitoring in support of the TMDL process is crucial to the development of models used to set effective endpoints to pollutants that will improve and protect waterbodies. The TMDL process is used to divide up the total amount of allowable pollutant loads among all activities in the watershed that generate the specific pollutant. To accomplish this, monitoring must be conducted to determine how much of the pollutant is currently being generated by point and nonpoint sources. Data from TMDL monitoring are then used in modeling efforts to determine load reductions necessary to support water quality standards.
During the 2015 Oklahoma legislative session, for the fourth consecutive year, the OCC was appropriated up to $500,000 in state funding to support the agency's monitoring initiatives. This money was greatly needed, especially as federal budget cuts continue, and will allow the OCC to more effectively meet Oklahoma’s monitoring needs related to nonpoint source pollution. Since the 2015 appropriation, a rescission was made and it is unclear of the impacts of the declining state budget on 2016 funding.
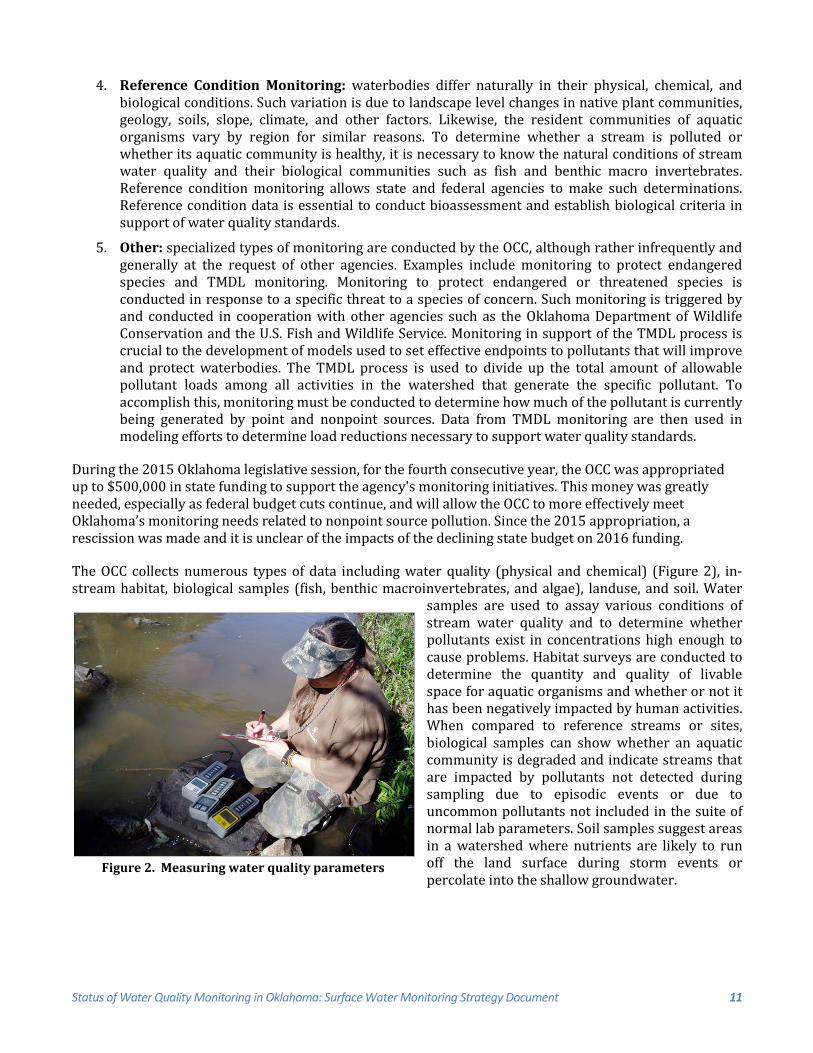
The OCC collects numerous types of data including water quality (physical and chemical) (Figure 2), in-stream habitat, biological samples (fish, benthic macroinvertebrates, and algae), landuse, and soil. Water
samples are used to assay various conditions of stream water quality and to determine whether pollutants exist in concentrations high enough to cause problems. Habitat surveys are conducted to determine the quantity and quality of livable space for aquatic organisms and whether or not it has been negatively impacted by human activities. When compared to reference streams or sites, biological samples can show whether an aquatic community is degraded and indicate streams that are impacted by pollutants not detected during sampling due to episodic events or due to uncommon pollutants not included in the suite of normal lab parameters. Soil samples suggest areas in a watershed where nutrients are likely to run off the land surface during storm events or percolate into the shallow groundwater.
Figure 2. Measuring water quality parameters
Status of Water Quality Monitoring in Oklahoma: Surface Water Monitoring Strategy Document 12
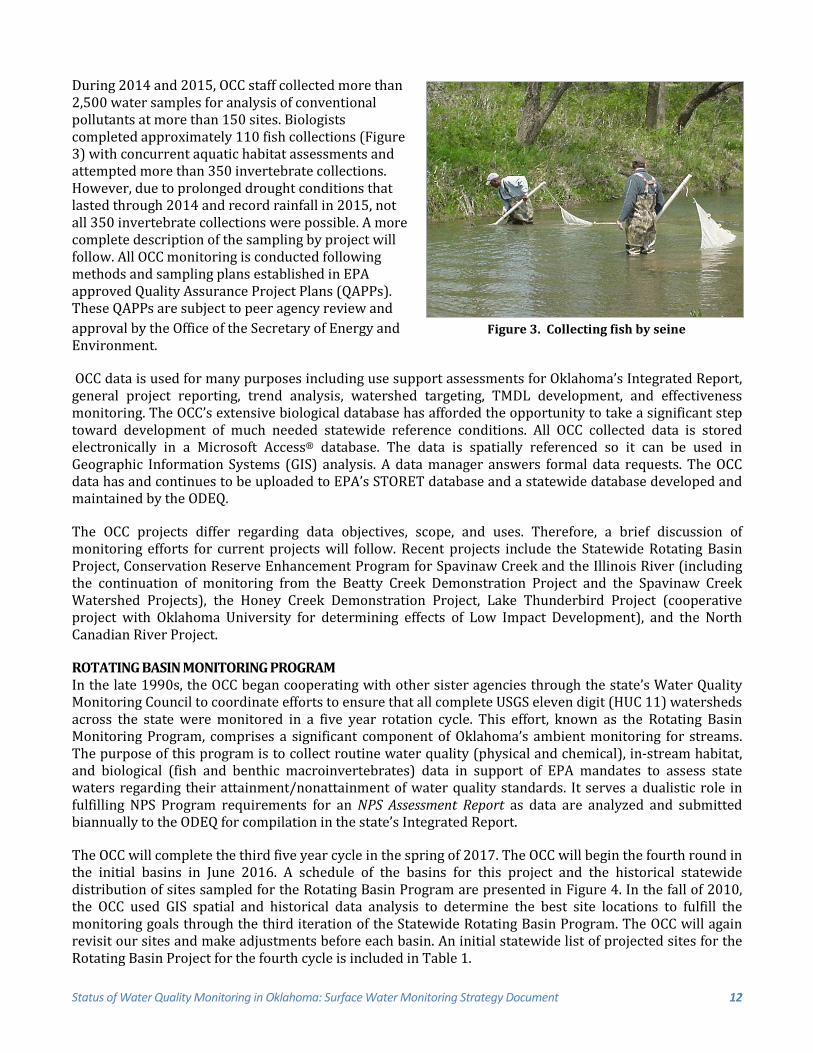
During 2014 and 2015, OCC staff collected more than 2,500 water samples for analysis of conventional pollutants at more than 150 sites. Biologists completed approximately 110 fish collections (Figure 3) with concurrent aquatic habitat assessments and attempted more than 350 invertebrate collections. However, due to prolonged drought conditions that lasted through 2014 and record rainfall in 2015, not all 350 invertebrate collections were possible. A more complete description of the sampling by project will follow. All OCC monitoring is conducted following methods and sampling plans established in EPA approved Quality Assurance Project Plans (QAPPs). These QAPPs are subject to peer agency review and approval by the Office of the Secretary of Energy and Environment.
OCC data is used for many purposes including use support assessments for Oklahoma’s Integrated Report, general project reporting, trend analysis, watershed targeting, TMDL development, and effectiveness monitoring. The OCC’s extensive biological database has afforded the opportunity to take a significant step toward development of much needed statewide reference conditions. All OCC collected data is stored electronically in a Microsoft Access® database. The data is spatially referenced so it can be used in Geographic Information Systems (GIS) analysis. A data manager answers formal data requests. The OCC data has and continues to be uploaded to EPA’s STORET database and a statewide database developed and maintained by the ODEQ.
The OCC projects differ regarding data objectives, scope, and uses. Therefore, a brief discussion of monitoring efforts for current projects will follow. Recent projects include the Statewide Rotating Basin Project, Conservation Reserve Enhancement Program for Spavinaw Creek and the Illinois River (including the continuation of monitoring from the Beatty Creek Demonstration Project and the Spavinaw Creek Watershed Projects), the Honey Creek Demonstration Project, Lake Thunderbird Project (cooperative project with Oklahoma University for determining effects of Low Impact Development), and the North Canadian River Project.
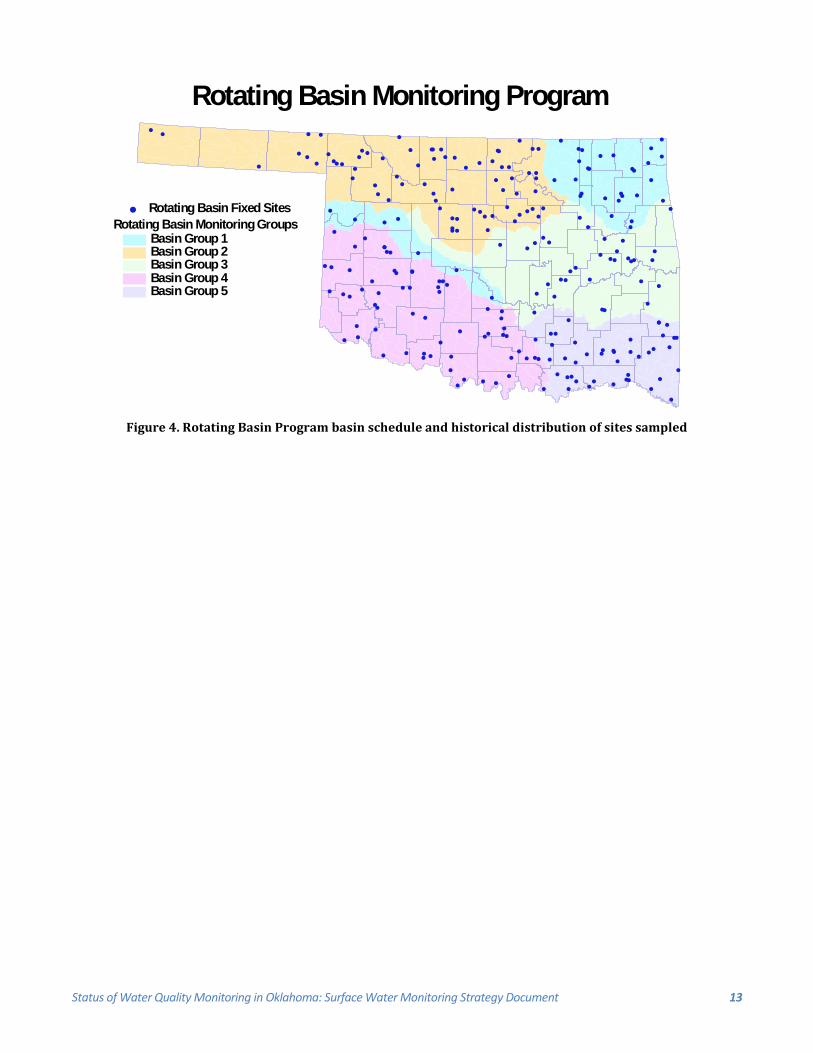
ROTATING BASIN MONITORING PROGRAM In the late 1990s, the OCC began cooperating with other sister agencies through the state’s Water Quality Monitoring Council to coordinate efforts to ensure that all complete USGS eleven digit (HUC 11) watersheds across the state were monitored in a five year rotation cycle. This effort, known as the Rotating Basin Monitoring Program, comprises a significant component of Oklahoma’s ambient monitoring for streams. The purpose of this program is to collect routine water quality (physical and chemical), in-stream habitat, and biological (fish and benthic macroinvertebrates) data in support of EPA mandates to assess state waters regarding their attainment/nonattainment of water quality standards. It serves a dualistic role in fulfilling NPS Program requirements for an NPS Assessment Report as data are analyzed and submitted biannually to the ODEQ for compilation in the state’s Integrated Report.
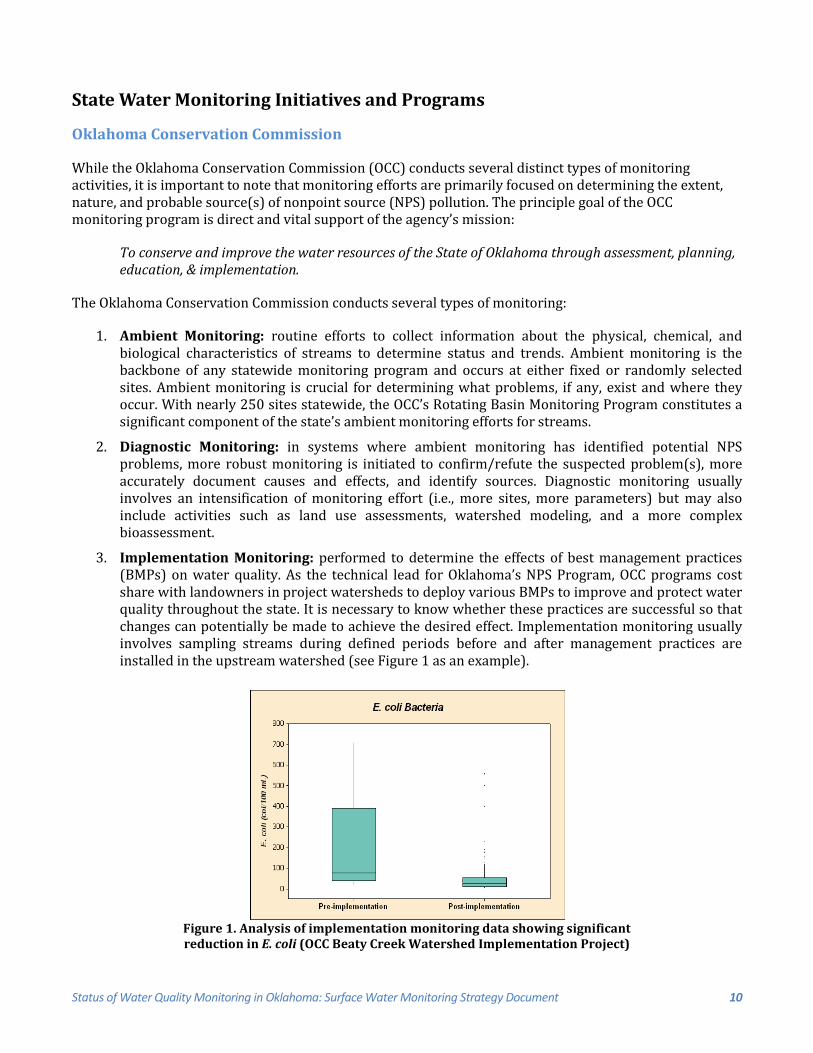
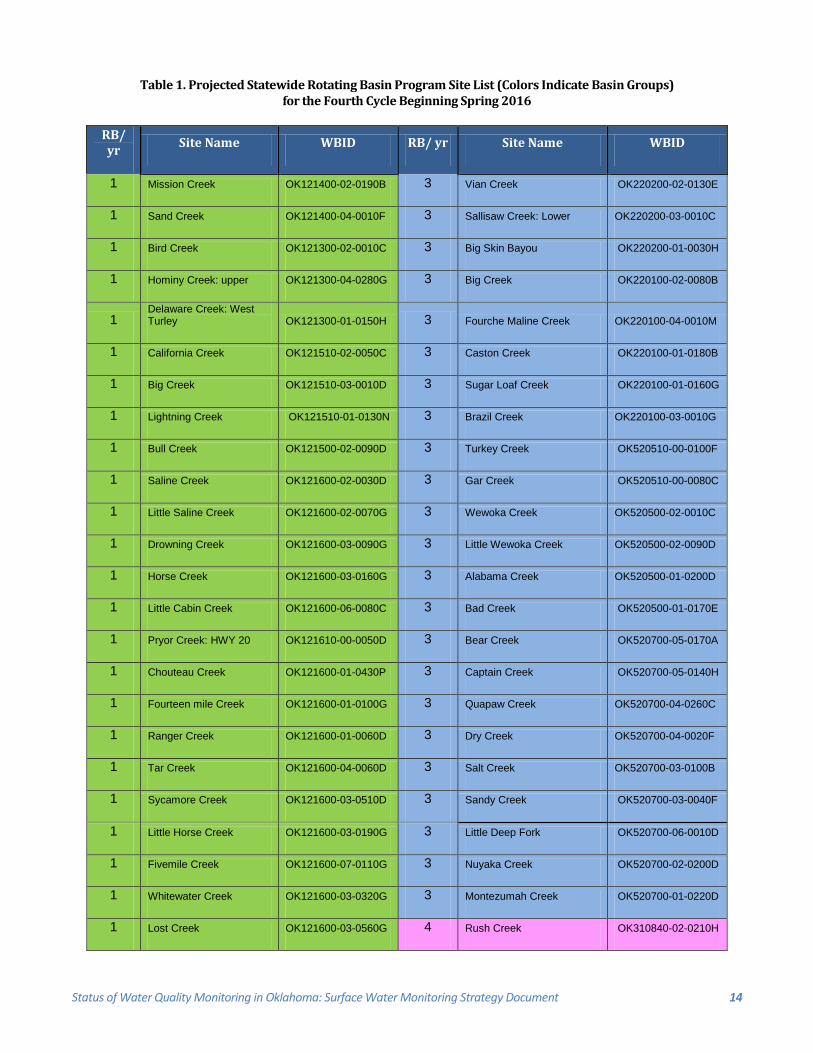
The OCC will complete the third five year cycle in the spring of 2017. The OCC will begin the fourth round in the initial basins in June 2016. A schedule of the basins for this project and the historical statewide distribution of sites sampled for the Rotating Basin Program are presented in Figure 4. In the fall of 2010, the OCC used GIS spatial and historical data analysis to determine the best site locations to fulfill the monitoring goals through the third iteration of the Statewide Rotating Basin Program. The OCC will again revisit our sites and make adjustments before each basin. An initial statewide list of projected sites for the Rotating Basin Project for the fourth cycle is included in Table 1.
Figure 3. Collecting fish by seine
Status of Water Quality Monitoring in Oklahoma: Surface Water Monitoring Strategy Document 13
Figure 4. Rotating Basin Program basin schedule and historical distribution of sites sampled
#
#
#
#
##
##
#
#
#
#
# #
##
##
#
##
#
##
#
##
#
#
##
#
#
#
#
#
##
## #
#
#
#
##
## #
####
#
##
#
#
#
#
###
# #
# ###
###
#
#
###
#
##
##
###
#
#
##
#
#
##
#
####
##
#
# #
#
##
#
###
#
##
#
#
#
#
#
#
#
#
#
##
##
##
##
#
#
#
##
##
#
##
##
#
##
#
#
#
#
##
#
#
#
#
# #
#
#
#
#
#
#
#
#
#
#
#
#
#
#
#
#
#
#
#
#
#
#
#
#
#
#
#
##
##
#
#
#
#
#
#
#
#
#
#
##
# #
#
#
#
#
#
#
#
##
#
#
##
# #
#
#
##
##
#
##
#
#
#
#
#
#
#
#
#
#
#
#
#
#
##
#
#
#
Rotating Basin Monitoring Program
Rotating Basin Monitoring GroupsBasin Group 1Basin Group 2Basin Group 3Basin Group 4Basin Group 5
# Rotating Basin Fixed Sites
Status of Water Quality Monitoring in Oklahoma: Surface Water Monitoring Strategy Document 14
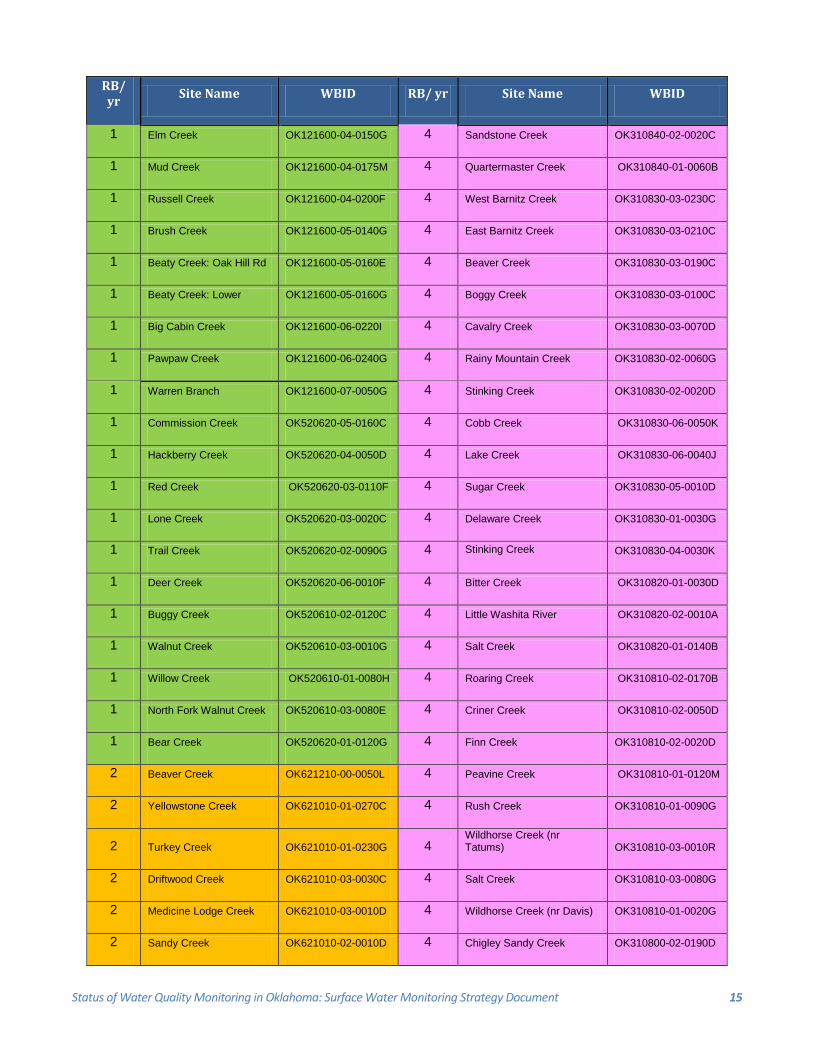
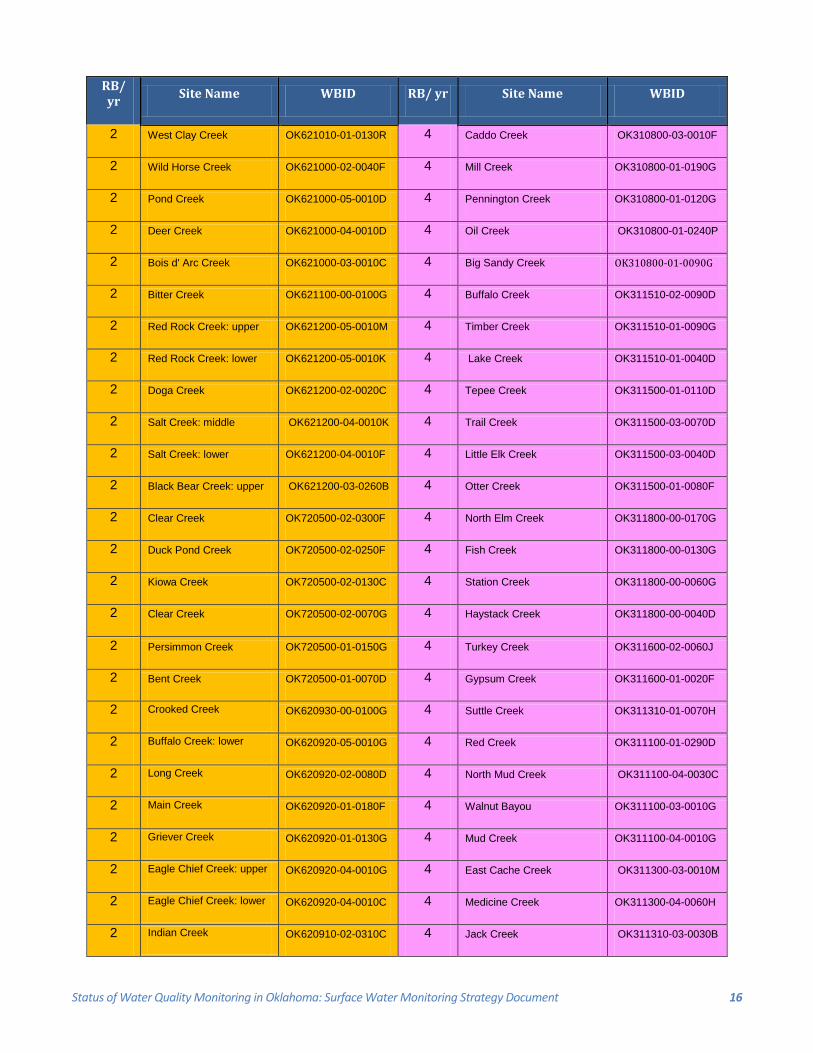
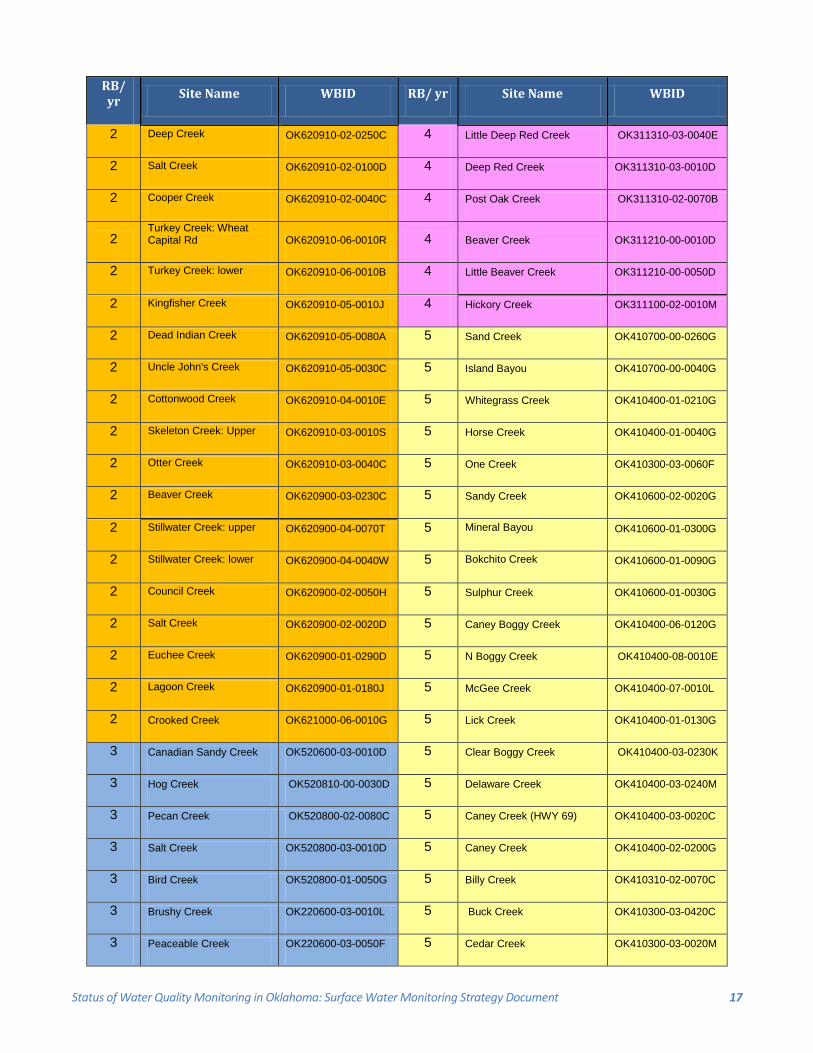
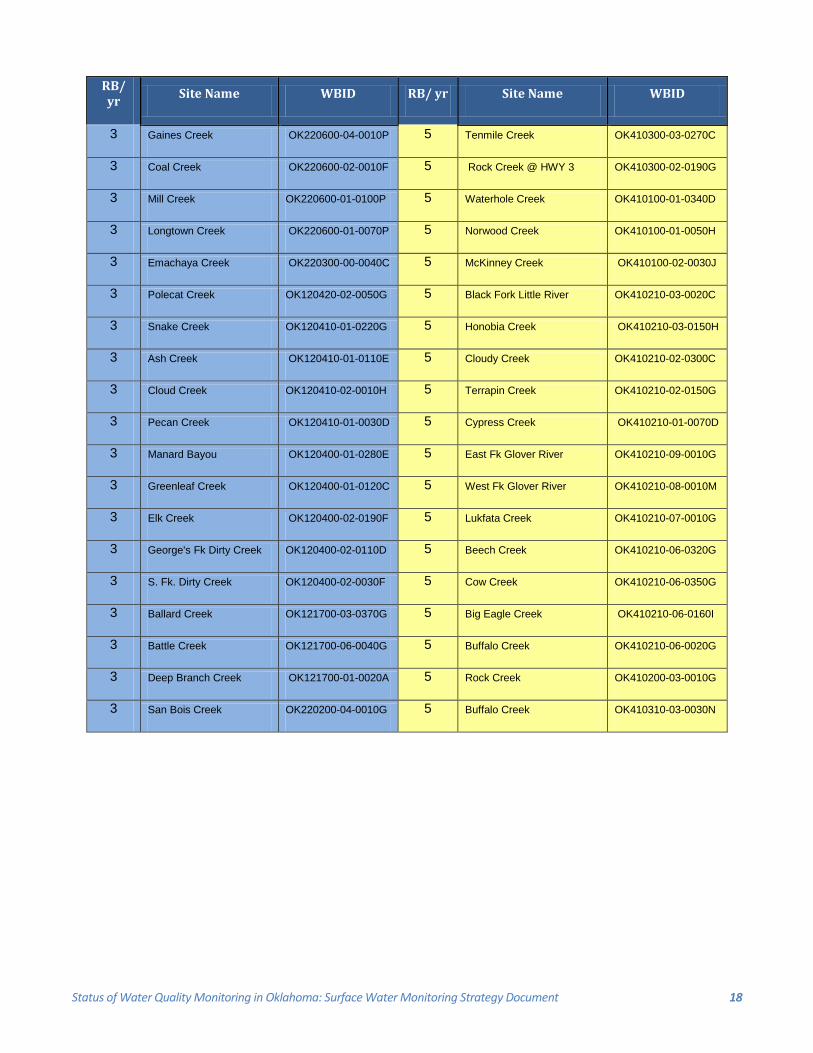
Table 1. Projected Statewide Rotating Basin Program Site List (Colors Indicate Basin Groups) for the Fourth Cycle Beginning Spring 2016
RB/ yr Site Name WBID RB/ yr Site Name WBID
1 Mission Creek OK121400-02-0190B 3 Vian Creek OK220200-02-0130E
1 Sand Creek OK121400-04-0010F 3 Sallisaw Creek: Lower OK220200-03-0010C
1 Bird Creek OK121300-02-0010C 3 Big Skin Bayou OK220200-01-0030H
1 Hominy Creek: upper OK121300-04-0280G 3 Big Creek OK220100-02-0080B
1 Delaware Creek: West Turley OK121300-01-0150H 3 Fourche Maline Creek OK220100-04-0010M
1 California Creek OK121510-02-0050C 3 Caston Creek OK220100-01-0180B
1 Big Creek OK121510-03-0010D 3 Sugar Loaf Creek OK220100-01-0160G
1 Lightning Creek OK121510-01-0130N 3 Brazil Creek OK220100-03-0010G
1 Bull Creek OK121500-02-0090D 3 Turkey Creek OK520510-00-0100F
1 Saline Creek OK121600-02-0030D 3 Gar Creek OK520510-00-0080C
1 Little Saline Creek OK121600-02-0070G 3 Wewoka Creek OK520500-02-0010C
1 Drowning Creek OK121600-03-0090G 3 Little Wewoka Creek OK520500-02-0090D
1 Horse Creek OK121600-03-0160G 3 Alabama Creek OK520500-01-0200D
1 Little Cabin Creek OK121600-06-0080C 3 Bad Creek OK520500-01-0170E
1 Pryor Creek: HWY 20 OK121610-00-0050D 3 Bear Creek OK520700-05-0170A
1 Chouteau Creek OK121600-01-0430P 3 Captain Creek OK520700-05-0140H
1 Fourteen mile Creek OK121600-01-0100G 3 Quapaw Creek OK520700-04-0260C
1 Ranger Creek OK121600-01-0060D 3 Dry Creek OK520700-04-0020F
1 Tar Creek OK121600-04-0060D 3 Salt Creek OK520700-03-0100B
1 Sycamore Creek OK121600-03-0510D 3 Sandy Creek OK520700-03-0040F
1 Little Horse Creek OK121600-03-0190G 3 Little Deep Fork OK520700-06-0010D
1 Fivemile Creek OK121600-07-0110G 3 Nuyaka Creek OK520700-02-0200D
1 Whitewater Creek OK121600-03-0320G 3 Montezumah Creek OK520700-01-0220D
1 Lost Creek OK121600-03-0560G 4 Rush Creek OK310840-02-0210H
Status of Water Quality Monitoring in Oklahoma: Surface Water Monitoring Strategy Document 15
RB/ yr Site Name WBID RB/ yr Site Name WBID
1 Elm Creek OK121600-04-0150G 4 Sandstone Creek OK310840-02-0020C
1 Mud Creek OK121600-04-0175M 4 Quartermaster Creek OK310840-01-0060B
1 Russell Creek OK121600-04-0200F 4 West Barnitz Creek OK310830-03-0230C
1 Brush Creek OK121600-05-0140G 4 East Barnitz Creek OK310830-03-0210C
1 Beaty Creek: Oak Hill Rd OK121600-05-0160E 4 Beaver Creek OK310830-03-0190C
1 Beaty Creek: Lower OK121600-05-0160G 4 Boggy Creek OK310830-03-0100C
1 Big Cabin Creek OK121600-06-0220I 4 Cavalry Creek OK310830-03-0070D
1 Pawpaw Creek OK121600-06-0240G 4 Rainy Mountain Creek OK310830-02-0060G
1 Warren Branch OK121600-07-0050G 4 Stinking Creek OK310830-02-0020D
1 Commission Creek OK520620-05-0160C 4 Cobb Creek OK310830-06-0050K
1 Hackberry Creek OK520620-04-0050D 4 Lake Creek OK310830-06-0040J
1 Red Creek OK520620-03-0110F 4 Sugar Creek OK310830-05-0010D
1 Lone Creek OK520620-03-0020C 4 Delaware Creek OK310830-01-0030G
1 Trail Creek OK520620-02-0090G 4 Stinking Creek OK310830-04-0030K
1 Deer Creek OK520620-06-0010F 4 Bitter Creek OK310820-01-0030D
1 Buggy Creek OK520610-02-0120C 4 Little Washita River OK310820-02-0010A
1 Walnut Creek OK520610-03-0010G 4 Salt Creek OK310820-01-0140B
1 Willow Creek OK520610-01-0080H 4 Roaring Creek OK310810-02-0170B
1 North Fork Walnut Creek OK520610-03-0080E 4 Criner Creek OK310810-02-0050D
1 Bear Creek OK520620-01-0120G 4 Finn Creek OK310810-02-0020D
2 Beaver Creek OK621210-00-0050L 4 Peavine Creek OK310810-01-0120M
2 Yellowstone Creek OK621010-01-0270C 4 Rush Creek OK310810-01-0090G
2 Turkey Creek OK621010-01-0230G 4 Wildhorse Creek (nr Tatums) OK310810-03-0010R
2 Driftwood Creek OK621010-03-0030C 4 Salt Creek OK310810-03-0080G
2 Medicine Lodge Creek OK621010-03-0010D 4 Wildhorse Creek (nr Davis) OK310810-01-0020G
2 Sandy Creek OK621010-02-0010D 4 Chigley Sandy Creek OK310800-02-0190D
Status of Water Quality Monitoring in Oklahoma: Surface Water Monitoring Strategy Document 16
RB/ yr Site Name WBID RB/ yr Site Name WBID
2 West Clay Creek OK621010-01-0130R 4 Caddo Creek OK310800-03-0010F
2 Wild Horse Creek OK621000-02-0040F 4 Mill Creek OK310800-01-0190G
2 Pond Creek OK621000-05-0010D 4 Pennington Creek OK310800-01-0120G
2 Deer Creek OK621000-04-0010D 4 Oil Creek OK310800-01-0240P
2 Bois d' Arc Creek OK621000-03-0010C 4 Big Sandy Creek OK310800-01-0090G
2 Bitter Creek OK621100-00-0100G 4 Buffalo Creek OK311510-02-0090D
2 Red Rock Creek: upper OK621200-05-0010M 4 Timber Creek OK311510-01-0090G
2 Red Rock Creek: lower OK621200-05-0010K 4 Lake Creek OK311510-01-0040D
2 Doga Creek OK621200-02-0020C 4 Tepee Creek OK311500-01-0110D
2 Salt Creek: middle OK621200-04-0010K 4 Trail Creek OK311500-03-0070D
2 Salt Creek: lower OK621200-04-0010F 4 Little Elk Creek OK311500-03-0040D
2 Black Bear Creek: upper OK621200-03-0260B 4 Otter Creek OK311500-01-0080F
2 Clear Creek OK720500-02-0300F 4 North Elm Creek OK311800-00-0170G
2 Duck Pond Creek OK720500-02-0250F 4 Fish Creek OK311800-00-0130G
2 Kiowa Creek OK720500-02-0130C 4 Station Creek OK311800-00-0060G
2 Clear Creek OK720500-02-0070G 4 Haystack Creek OK311800-00-0040D
2 Persimmon Creek OK720500-01-0150G 4 Turkey Creek OK311600-02-0060J
2 Bent Creek OK720500-01-0070D 4 Gypsum Creek OK311600-01-0020F
2 Crooked Creek OK620930-00-0100G 4 Suttle Creek OK311310-01-0070H
2 Buffalo Creek: lower OK620920-05-0010G 4 Red Creek OK311100-01-0290D
2 Long Creek OK620920-02-0080D 4 North Mud Creek OK311100-04-0030C
2 Main Creek OK620920-01-0180F 4 Walnut Bayou OK311100-03-0010G
2 Griever Creek OK620920-01-0130G 4 Mud Creek OK311100-04-0010G
2 Eagle Chief Creek: upper OK620920-04-0010G 4 East Cache Creek OK311300-03-0010M
2 Eagle Chief Creek: lower OK620920-04-0010C 4 Medicine Creek OK311300-04-0060H
2 Indian Creek OK620910-02-0310C 4 Jack Creek OK311310-03-0030B
Status of Water Quality Monitoring in Oklahoma: Surface Water Monitoring Strategy Document 17
RB/ yr Site Name WBID RB/ yr Site Name WBID
2 Deep Creek OK620910-02-0250C 4 Little Deep Red Creek OK311310-03-0040E
2 Salt Creek OK620910-02-0100D 4 Deep Red Creek OK311310-03-0010D
2 Cooper Creek OK620910-02-0040C 4 Post Oak Creek OK311310-02-0070B
2 Turkey Creek: Wheat Capital Rd OK620910-06-0010R 4 Beaver Creek OK311210-00-0010D
2 Turkey Creek: lower OK620910-06-0010B 4 Little Beaver Creek OK311210-00-0050D
2 Kingfisher Creek OK620910-05-0010J 4 Hickory Creek OK311100-02-0010M
2 Dead Indian Creek OK620910-05-0080A 5 Sand Creek OK410700-00-0260G
2 Uncle John's Creek OK620910-05-0030C 5 Island Bayou OK410700-00-0040G
2 Cottonwood Creek OK620910-04-0010E 5 Whitegrass Creek OK410400-01-0210G
2 Skeleton Creek: Upper OK620910-03-0010S 5 Horse Creek OK410400-01-0040G
2 Otter Creek OK620910-03-0040C 5 One Creek OK410300-03-0060F
2 Beaver Creek OK620900-03-0230C 5 Sandy Creek OK410600-02-0020G
2 Stillwater Creek: upper OK620900-04-0070T 5 Mineral Bayou OK410600-01-0300G
2 Stillwater Creek: lower OK620900-04-0040W 5 Bokchito Creek OK410600-01-0090G
2 Council Creek OK620900-02-0050H 5 Sulphur Creek OK410600-01-0030G
2 Salt Creek OK620900-02-0020D 5 Caney Boggy Creek OK410400-06-0120G
2 Euchee Creek OK620900-01-0290D 5 N Boggy Creek OK410400-08-0010E
2 Lagoon Creek OK620900-01-0180J 5 McGee Creek OK410400-07-0010L
2 Crooked Creek OK621000-06-0010G 5 Lick Creek OK410400-01-0130G
3 Canadian Sandy Creek OK520600-03-0010D 5 Clear Boggy Creek OK410400-03-0230K
3 Hog Creek OK520810-00-0030D 5 Delaware Creek OK410400-03-0240M
3 Pecan Creek OK520800-02-0080C 5 Caney Creek (HWY 69) OK410400-03-0020C
3 Salt Creek OK520800-03-0010D 5 Caney Creek OK410400-02-0200G
3 Bird Creek OK520800-01-0050G 5 Billy Creek OK410310-02-0070C
3 Brushy Creek OK220600-03-0010L 5 Buck Creek OK410300-03-0420C
3 Peaceable Creek OK220600-03-0050F 5 Cedar Creek OK410300-03-0020M
Status of Water Quality Monitoring in Oklahoma: Surface Water Monitoring Strategy Document 18
RB/ yr Site Name WBID RB/ yr Site Name WBID
3 Gaines Creek OK220600-04-0010P 5 Tenmile Creek OK410300-03-0270C
3 Coal Creek OK220600-02-0010F 5 Rock Creek @ HWY 3 OK410300-02-0190G
3 Mill Creek OK220600-01-0100P 5 Waterhole Creek OK410100-01-0340D
3 Longtown Creek OK220600-01-0070P 5 Norwood Creek OK410100-01-0050H
3 Emachaya Creek OK220300-00-0040C 5 McKinney Creek OK410100-02-0030J
3 Polecat Creek OK120420-02-0050G 5 Black Fork Little River OK410210-03-0020C
3 Snake Creek OK120410-01-0220G 5 Honobia Creek OK410210-03-0150H
3 Ash Creek OK120410-01-0110E 5 Cloudy Creek OK410210-02-0300C
3 Cloud Creek OK120410-02-0010H 5 Terrapin Creek OK410210-02-0150G
3 Pecan Creek OK120410-01-0030D 5 Cypress Creek OK410210-01-0070D
3 Manard Bayou OK120400-01-0280E 5 East Fk Glover River OK410210-09-0010G
3 Greenleaf Creek OK120400-01-0120C 5 West Fk Glover River OK410210-08-0010M
3 Elk Creek OK120400-02-0190F 5 Lukfata Creek OK410210-07-0010G
3 George's Fk Dirty Creek OK120400-02-0110D 5 Beech Creek OK410210-06-0320G
3 S. Fk. Dirty Creek OK120400-02-0030F 5 Cow Creek OK410210-06-0350G
3 Ballard Creek OK121700-03-0370G 5 Big Eagle Creek OK410210-06-0160I
3 Battle Creek OK121700-06-0040G 5 Buffalo Creek OK410210-06-0020G
3 Deep Branch Creek OK121700-01-0020A 5 Rock Creek OK410200-03-0010G
3 San Bois Creek OK220200-04-0010G 5 Buffalo Creek OK410310-03-0030N
Status of Water Quality Monitoring in Oklahoma: Surface Water Monitoring Strategy Document 19
To determine the support status of each site and the cause(s) of impairment, water quality sampling, biological monitoring, habitat assessments, and land use assessment are conducted. Water quality data is collected at 20 even intervals over a two-year period. Typical water quality parameters include dissolved oxygen, water temperature, pH, turbidity, conductivity, total alkalinity, total hardness, instantaneous discharge, nitrite, nitrate, total Kjeldahl nitrogen, orthophosphate, total phosphorous, chloride, sulfate, total dissolved solids, and total suspended solids. Samples are also collected for Escherichia coli but only during the recreation season from May through September. Ammonia is now analyzed three times between May and September. Biological samples include fish and in-stream habitat, which is collected once for each rotation cycle, and benthic macroinvertebrates collected during the summer and winter index periods for each of the two years water quality samples are collected.
In 2008, the OCC decided to initiate a probabilistic sampling design, or sampling of sites that have been randomly selected to represent a population of sites with known statistical confidence, through the Rotating Basin Program. To accomplish this, EPA staff from the Corvallis Lab randomly generated a 150 site panel of possible sites for each basin in the rotational scheme. Access permissions were obtained according to the order of sites listed until a total of fifty sites were achieved (EPA scientists have determined a minimum of fifty sites is necessary to achieve statistical confidence). Each site had one collection for all parameters listed for the rotating basin project during the summer index period. The final basins in the state were completed in the summer of 2012. Resulting data have been and are still being used to make statements with statistical confidence regarding the status of all streams (no greater than Strahler order of 6) from the basin sampled. The basins were sampled according to the same schedule as those referenced in Figure 1. Following the analysis of the probabilistic monitoring data, it was determined that the results remained generally in agreement with the results of the fixed sites monitoring data. Since the probabilistic monitoring results corroborated the results of the rotating basin fixed sites monitoring, probabilistic monitoring has been temporarily suspended. Probabilistic design offers a variety of analysis possibilities and can be used to answer an array of questions fixed site monitoring does not allow. Consideration was given to the analysis of risk assessment. However, the analysis of risk assessment did not offer any insight in the management of non-point source pollution. Given the potential for added utility, probabilistic monitoring may be reinitiated to look at landscape scale changes in the future. The design will likely remain the same and each 5 year cycle will cover the entire state as explained in the previous paragraph.
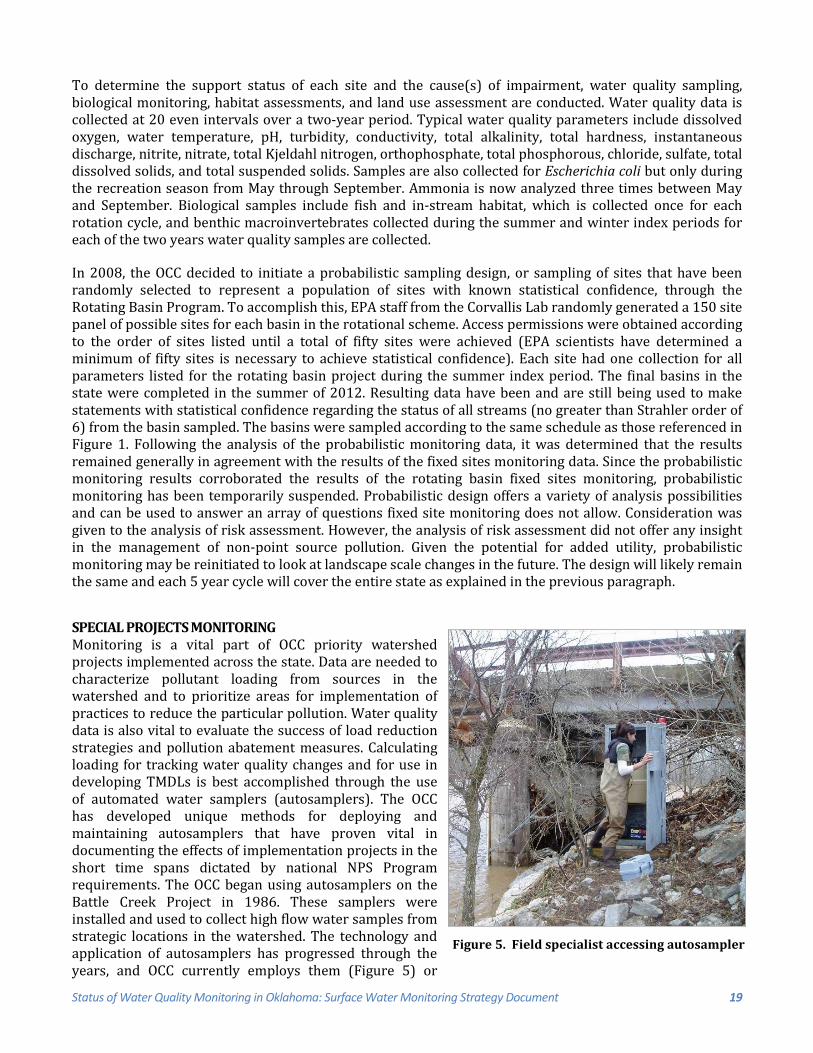
SPECIAL PROJECTS MONITORING Monitoring is a vital part of OCC priority watershed projects implemented across the state. Data are needed to characterize pollutant loading from sources in the watershed and to prioritize areas for implementation of practices to reduce the particular pollution. Water quality data is also vital to evaluate the success of load reduction strategies and pollution abatement measures. Calculating loading for tracking water quality changes and for use in developing TMDLs is best accomplished through the use of automated water samplers (autosamplers). The OCC has developed unique methods for deploying and maintaining autosamplers that have proven vital in documenting the effects of implementation projects in the short time spans dictated by national NPS Program requirements. The OCC began using autosamplers on the Battle Creek Project in 1986. These samplers were installed and used to collect high flow water samples from strategic locations in the watershed. The technology and application of autosamplers has progressed through the years, and OCC currently employs them (Figure 5) or
Figure 5. Field specialist accessing autosampler
Status of Water Quality Monitoring in Oklahoma: Surface Water Monitoring Strategy Document 20
assists partners to employ autosamplers on special projects to collect continuous, flow-weighted, composite samples. This type of monitoring allows for a continuous assessment of both a true average concentration of constituents in the stream water and continuous discharge data, both of which improve the calculation of accurate loading estimates. The accuracy of these estimates is necessary to account for changes in the water quality of a target watershed where conservation-based land use changes were brought about by technical and cost share assistance. The OCC has recently completed several special projects. Most of these special projects were watershed implementation projects and involved the use of cost share incentives for land use changes in priority watersheds. Recently completed projects include: Spavinaw Creek Watershed Implementation Project; Honey Creek Watershed Implementation Project; North Canadian River Watershed Implementation Project; and Lake Thunderbird Watershed Implementation Project.
Ongoing Projects EPA 319 funds for use in watershed implementation projects have been cut. OCC has been strengthening partnerships so that 319 water quality monitoring funds can be used to assist partners with watershed implementation targeting and with tracking the outcome of those conservation efforts within watersheds. Water quality data collected according to approved methods and at strategically located sites within watersheds are crucial to showing the effects of the implementation of conservation practices. Although OCC has demonstrated the benefits of the employment of autosamplers, this sampling strategy is expensive in both equipment and employee time, and also requires the deployment and operation of the autosampler through a necessary calibration phase prior to the implementation of conservation practices. The effective and efficient execution of this strategy requires the dedication of an employee to these project areas, thereby limiting the location of these projects. OCC has demonstrated effectiveness of detecting and tracking water quality changes in response to the implementation of conservation practices through the techniques employed in the rotating basin ambient monitoring. OCC is currently employing both monitoring strategies depending on the data quality objectives of specific projects. Below are examples and discussion of both types of current projects.
Conservation Reserve Enhancement Program (CREP): Illinois River and Spavinaw Creek The CREP is a cooperative program between the OCC and the USDA Farm Service Agency (FSA). The OCC is the state agency lead for this project, providing state cost share matching funds and technical assistance. In addition, the OCC is monitoring to document changes in water quality following the enrollment of riparian easements. The FSA assists with the enrollment of landowners, verification of eligibility, easement payment and follow-up to ensure compliance with program guidelines. Although the project remains ongoing, in an effort to maximize available funds and maintain coverage and consistency in monitoring, continuous, flow weighted sampling was discontinued for the Conservation Reserve Enhancement Program (CREP) in the Illinois River and Spavinaw Creek Watersheds. Changes in WQ will be monitored through the R.B. project, mentioned earlier, when the OCC returns to the lower Arkansas River basin. This will be accomplished by strategic location of sites to target the CREP watersheds.
Elk City Lake Regional Conservation Partnership Program (RCPP) The Elk City Lake watershed is a USDA PL-566 lake constructed in 1970 primarily for flood control but is now operated by the City of Elk City for recreation. Elk City Lake is listed in Oklahoma’s Integrated Report as being impaired by turbidity. In addition, reports surfaced earlier this year of a significant fish kill and bluegreen algae blooms have become a problem. Some of these latest water quality problems are likely exacerbated by low water levels affected by the recent drought in Oklahoma. However, declining water levels make it even more important to implement actions to reduce water quality degradation. In late 2006, the City of Elk City, which owns and operates the lake, approached the Oklahoma Conservation Commission Water Quality Division (OCC) about implementing a watershed project to address the sources of the lake’s impairments. At that point in time, the OCC developed a Watershed Plan to address water quality concerns
Status of Water Quality Monitoring in Oklahoma: Surface Water Monitoring Strategy Document 21
in the watershed. Land use in the watershed is primarily range, pasture, and cropland with little to no riparian buffer along much of the stream courses and direct access by livestock. The lake has also sometimes had problems with bacteria impairments although recent data does not indicate a current problem. Because there are no municipal discharges or feedlot operations in the watershed, it is most probable that the potential sources of sediment and nutrients contributing to the lake’s impairment are resulting from these land uses.
The Regional Conservation Partnership Program (RCPP) promotes coordination between the USDA Natural Resources Conservation Service (NRCS) and its partners to deliver conservation assistance to producers and landowners. NRCS provides assistance to producers through partnership agreements and through program contracts or easement agreements. RCPP combines the authorities of four former conservation programs – the Agricultural Water Enhancement Program, the Chesapeake Bay Watershed Program, the Cooperative Conservation Partnership Initiative and the Great Lakes Basin Program. Assistance is delivered in accordance with the rules of EQIP, CSP, ACEP and HFRP; and in certain areas the Watershed Operations and Flood Prevention Program.
OCC submitted a proposal and was selected to enter into this partnership agreement. One requirement of this agreement is to conduct an assessment of the project’s effects. In order to assess the effects, OCC has added an upstream site on West Elk Creek to evaluate the stream for water quality improvement. Water quality monitoring at this stream site typically occurs on a monthly basis and will be conducted at fixed intervals throughout the program period. Typical water quality parameters include dissolved oxygen, water temperature, pH, turbidity, conductivity, total alkalinity, total hardness, instantaneous discharge, nitrite, nitrate, total Kjeldahl nitrogen, orthophosphate, total phosphorous, chloride, sulfate, total dissolved solids, and total suspended solids. Samples are also collected for Escherichia coli but only during the recreation season from May through September. Ammonia is now analyzed three times between May and September.
New Spiro Lake Watershed Project The water quality of New Spiro Lake has deteriorated over the past several decades. The lake frequently supports extensive summer algal blooms. The results of water quality sampling by the Oklahoma Water Resources Board have led to the lake being placed on the State of Oklahoma list of impaired water bodies. The lake has excessive chlorophyll-a and too little dissolved oxygen which impairs its beneficial uses as a public water supply and as warm water aquatic habitat (ODEQ 2014).
The Oklahoma Conservation Commission has recently prepared a draft Watershed Based Plan for Holi-Tuska Creek and New Spiro Lake, and the Natural Resources Conservation Service has identified the Holi-Tuska Creek watershed as one of its National Water Quality Initiative sites in Oklahoma. The NWQI initiative makes additional matching funds available to land owners in the watershed to implement conservation practices that will improve water quality. This monitoring project will support and inform these water quality improvement efforts.
The monitoring program is intended to (1) develop a data baseline for water quality in the watershed and thereby provide a basis on which to track future water quality improvement; and (2) assist in the refinement of the Watershed Based Plan for the watershed and the Source Water Protection Plan for the lake. Monitoring Holi-Tuska Creek will provide data that may be used to calibrate future watershed models. Quantitative estimates of the loads of nutrients and sediment entering New Spiro Lake may be used for future lake water quality modeling and lake restoration plan development. The length of this project as proposed is insufficient to develop trend analyses, and, as of yet, no water quality improvement activities have occurred in the watershed or lake. The Town of Spiro would like to secure funding to continue the monitoring program in perpetuity.
Status of Water Quality Monitoring in Oklahoma: Surface Water Monitoring Strategy Document 22
The OCC is assisting the City of Spiro with the deployment, maintenance and troubleshooting of an autosampler on Holi-Tuska Creek. The monitoring is be completed by a consultant hired by the City of Spiro. The sampling will consist of approximately 24 samples per year, once per month during base flow conditions plus a minimum of 12 targeted runoff events per year in accordance with OCC standard operating procedures (SOPs) Grab samples will be analyzed for nitrate-nitrogen, ammonia-nitrogen, total nitrogen, ortho-phosphorus, total phosphorus, chlorophyll-a, total organic carbon, total suspended solids, alkalinity, chloride, sulfate, and total dissolved solids.
The autosampler will be utilized to collect continuous, flow weighted storm event samples for water chemistry analysis in accordance with OCC SOPs (OCC 2015c). Samples will be analyzed for nitrate-nitrogen, ammonia-nitrogen, total nitrogen, ortho-phosphorus, total phosphorus, chlorophyll-a, total organic carbon, and total suspended solids. In the event of autosampler failure, grab samples will be taken and analyzed for these parameters. A grab sample will be collected when possible during high flow events and analyzed for ammonia-nitrogen, alkalinity, chloride, sulfate, and total dissolved solids.
Field parameters will be measured at Holi-Tuska Creek concurrent with all water sample collections and will include temperature, dissolved oxygen, pH, conductivity, turbidity, and instantaneous discharge. Two grab samples per month will be taken and analyzed for E. coli during the summer recreational season, from May 1 through September 30.
VOLUNTEER MONITORING: STATEWIDE BLUE THUMB PROGRAM Blue Thumb (BT) is the water pollution education program of the Oklahoma Conservation Commission’s Water Quality Division. Volunteer monitoring is a fundamental component of the BT Program. Volunteers complete a rigorous training (generally 16+ hours spread out over 2-3 days) to become certified volunteers. During this training, they learn the essentials of sampling methodology, use of volunteer kits for sample analysis, and related safety and
procedural lessons. The training also provides background on NPS pollution, aquatic ecology, and BMPs.
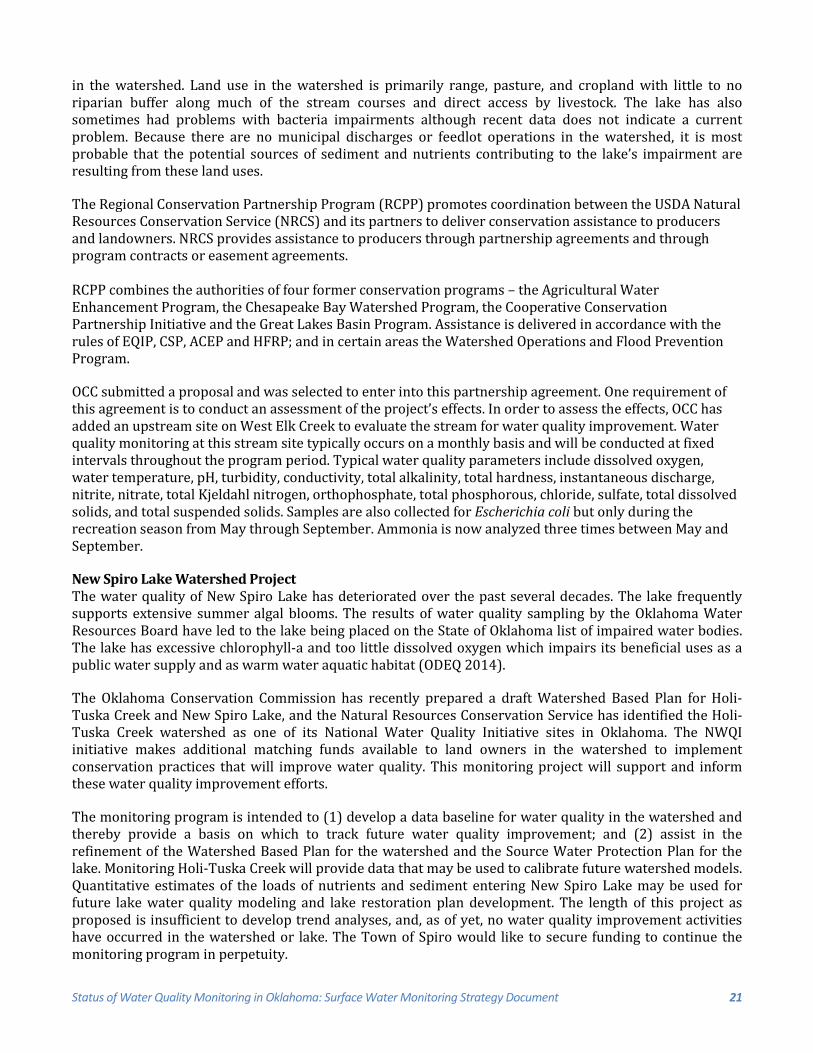
BT volunteers collect water quality data at least monthly at their designated sites. Typical parameters include temperature, dissolved oxygen, chloride, nitrate, ammonia, pH, orthophosphorus, estimated discharge, and in some cases, alkalinity, sulfate, fecal bacteria and pesticides. Benthic macroinvertebrate sampling is completed bi-annually, and fish collections (Figure 6) are completed once every three to five years by BT staff with volunteer assistance.
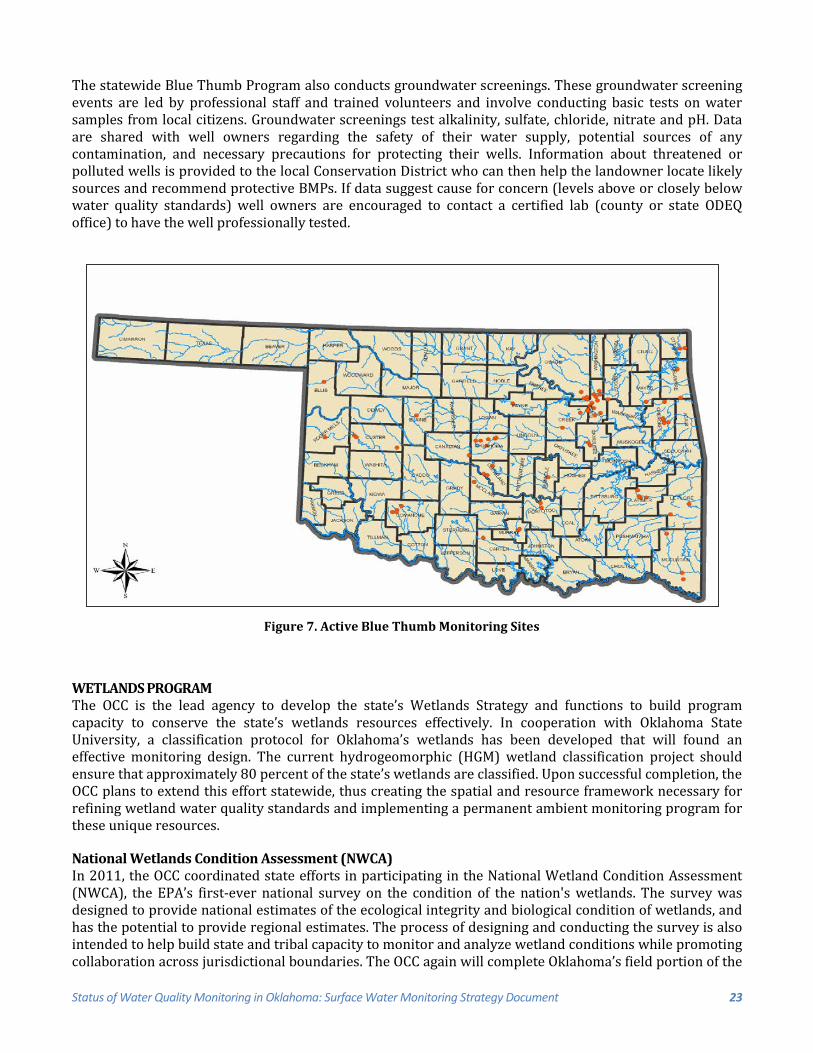
Data are compiled and analyzed annually by BT staff and given to the volunteers. The volunteers use this information, along with the knowledge they gain from monitoring, to interpret data about their creek monitoring site. This data interpretation and other water quality information are used by the volunteers to educate landowners, businesses, school children, and other groups about water quality related issues. One of the benefits of the Blue Thumb volunteer monitoring is the procurement of data on streams where OCC staff do not routinely monitor. There are currently active programs in Blaine, Caddo, Canadian, Cherokee, Cleveland, Comanche, Creek, Custer, Delaware, Ellis, Haskell Latimer, LeFlore, Mayes, McClain, McCurtain, Murray, Oklahoma, Okmulgee, Ottawa, Payne, Pontotoc, Roger Mills, Rogers, Osage, Tulsa, and Seminole Counties (Figure 7).
Figure 6. BT volunteers collecting fish
Status of Water Quality Monitoring in Oklahoma: Surface Water Monitoring Strategy Document 23
The statewide Blue Thumb Program also conducts groundwater screenings. These groundwater screening events are led by professional staff and trained volunteers and involve conducting basic tests on water samples from local citizens. Groundwater screenings test alkalinity, sulfate, chloride, nitrate and pH. Data are shared with well owners regarding the safety of their water supply, potential sources of any contamination, and necessary precautions for protecting their wells. Information about threatened or polluted wells is provided to the local Conservation District who can then help the landowner locate likely sources and recommend protective BMPs. If data suggest cause for concern (levels above or closely below water quality standards) well owners are encouraged to contact a certified lab (county or state ODEQ office) to have the well professionally tested.
WETLANDS PROGRAM The OCC is the lead agency to develop the state’s Wetlands Strategy and functions to build program capacity to conserve the state’s wetlands resources effectively. In cooperation with Oklahoma State University, a classification protocol for Oklahoma’s wetlands has been developed that will found an effective monitoring design. The current hydrogeomorphic (HGM) wetland classification project should ensure that approximately 80 percent of the state’s wetlands are classified. Upon successful completion, the OCC plans to extend this effort statewide, thus creating the spatial and resource framework necessary for refining wetland water quality standards and implementing a permanent ambient monitoring program for these unique resources.
National Wetlands Condition Assessment (NWCA) In 2011, the OCC coordinated state efforts in participating in the National Wetland Condition Assessment (NWCA), the EPA’s first-ever national survey on the condition of the nation's wetlands. The survey was designed to provide national estimates of the ecological integrity and biological condition of wetlands, and has the potential to provide regional estimates. The process of designing and conducting the survey is also intended to help build state and tribal capacity to monitor and analyze wetland conditions while promoting collaboration across jurisdictional boundaries. The OCC again will complete Oklahoma’s field portion of the
Figure 7. Active Blue Thumb Monitoring Sites
Status of Water Quality Monitoring in Oklahoma: Surface Water Monitoring Strategy Document 24
NWCA in the summer of 2016. In addition, pending funding, the OCC plans to complete an intensification and method development study in a regionally significant planning basin. This intensification study will include from 30 to 50 sites. Both the NWCA and the Oklahoma Rapid Assessment Method for wetlands (OKRAM) (in development by Dr. Craig Davis at OSU) will be employed. Although the OKRAM remains in development, in addition to the intensification within an important planning basin, this design will allow the comparison of results between methods to determine how the OKRAM performs and if there are portions of the OKRAM than can be strengthened.
The (NWCA) survey uses a probability-based sample design that results in statistically-valid estimates of condition for a population of wetlands. The OCC and state partners from across the U.S. participate in the design, planning, and field assessment of the NWCA. A consistent field assessment procedure ensures the results can be compared across the country. The OCC and state partners will conduct surveys on 19 sites statewide during the summer of 2016. OCC has participated in meetings through the spring of 2015 to assist in the analysis, development, and review of the final report for the 2011 NWCA. The public comment period for the inaugural NWCA Project report has closed and final revisions are underway. Once complete, and in concert with similar surveys on the Nation's coastal waters, wadeable streams, rivers, and lakes, the NWCA will inform decision-makers on how to better protect, maintain, and restore water-quality to the Nation's aquatic resources. The NWCA report should be available by spring 2016.
Using Wetland Mapping to Guide Restoration Decisions and Determine Wetland Trends This is a cooperative project with Oklahoma State University (OSU) with several expected outputs and outcomes. First, the US Fish and Wildlife Service (USFWS) National Wetland Inventory (NWI) maps will be reviewed and revised in 2-3 priority watersheds. These maps will then be submitted to the USFWS for inclusion in the NWI maps. A protocol will be developed using current NWI maps and historic aerial photos from the 1930s to the 1960s to determine historic wetland gains/losses within these watersheds. After wetlands gains/losses are determined, with help from cooperating partners, this information will be utilized to develop a formal mechanism as one category for watershed prioritization in the Nonpoint Source Management Strategy. The updated wetland maps will also be used in the application of the Oklahoma Restorable Wetland Assessment Protocol (RWAP). The RWAP was developed by OCC to identify potential restoration sites and prioritize them based on potential for water quality improvement. This effort will provide for protection and restoration of wetlands and an avenue through the NPS Program to implement efforts to protect and restore wetlands and water quality in Oklahoma. In addition, wetland areas targeted for restoration could be utilized for future mitigation needs.
Identifying Oklahoma Department of Transportation Mitigation Needs and Linking Needs with Opportunity at the Watershed Scale The Oklahoma Conservation Commission (OCC), in partnership with the Oklahoma Department of Transportation (ODOT), will determine current and future mitigation needs due to ODOT disturbances of aquatic resources as deemed necessary by the U.S. Army Corps of Engineers (Corps). The goal of this project is to further build programmatic capacity by identifying watersheds with high mitigation need and mitigation opportunities, as well as opportunities for voluntary restoration. OCC will utilize RWAP to locate and prioritize potential wetland restoration sites in potential HUC 8 Service Areas with significant mitigation needs. OCC will utilize current watershed data, local knowledge, and landowner connections through local conservation districts to locate potential stream restoration sites for the immediate mitigation needs and for use once an in-lieu fee program is functional. Site-by-site mitigation and an in-lieu fee program will undoubtedly resolve many of the problems associated with mitigation for ODOT projects.
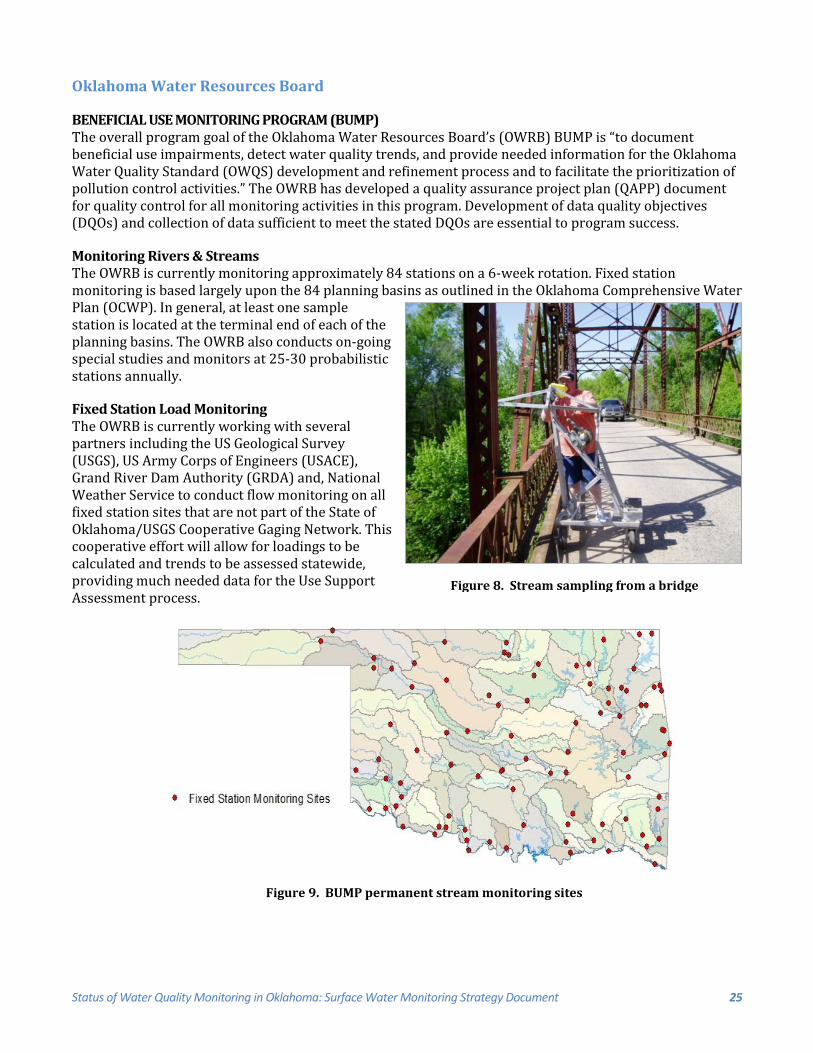
Status of Water Quality Monitoring in Oklahoma: Surface Water Monitoring Strategy Document 25
Oklahoma Water Resources Board
BENEFICIAL USE MONITORING PROGRAM (BUMP) The overall program goal of the Oklahoma Water Resources Board’s (OWRB) BUMP is “to document beneficial use impairments, detect water quality trends, and provide needed information for the Oklahoma Water Quality Standard (OWQS) development and refinement process and to facilitate the prioritization of pollution control activities.” The OWRB has developed a quality assurance project plan (QAPP) document for quality control for all monitoring activities in this program. Development of data quality objectives (DQOs) and collection of data sufficient to meet the stated DQOs are essential to program success.
Monitoring Rivers & Streams The OWRB is currently monitoring approximately 84 stations on a 6-week rotation. Fixed station monitoring is based largely upon the 84 planning basins as outlined in the Oklahoma Comprehensive Water Plan (OCWP). In general, at least one sample station is located at the terminal end of each of the planning basins. The OWRB also conducts on-going special studies and monitors at 25-30 probabilistic stations annually.
Fixed Station Load Monitoring The OWRB is currently working with several partners including the US Geological Survey (USGS), US Army Corps of Engineers (USACE), Grand River Dam Authority (GRDA) and, National Weather Service to conduct flow monitoring on all fixed station sites that are not part of the State of Oklahoma/USGS Cooperative Gaging Network. This cooperative effort will allow for loadings to be calculated and trends to be assessed statewide, providing much needed data for the Use Support Assessment process.
Figure 8. Stream sampling from a bridge
Figure 9. BUMP permanent stream monitoring sites
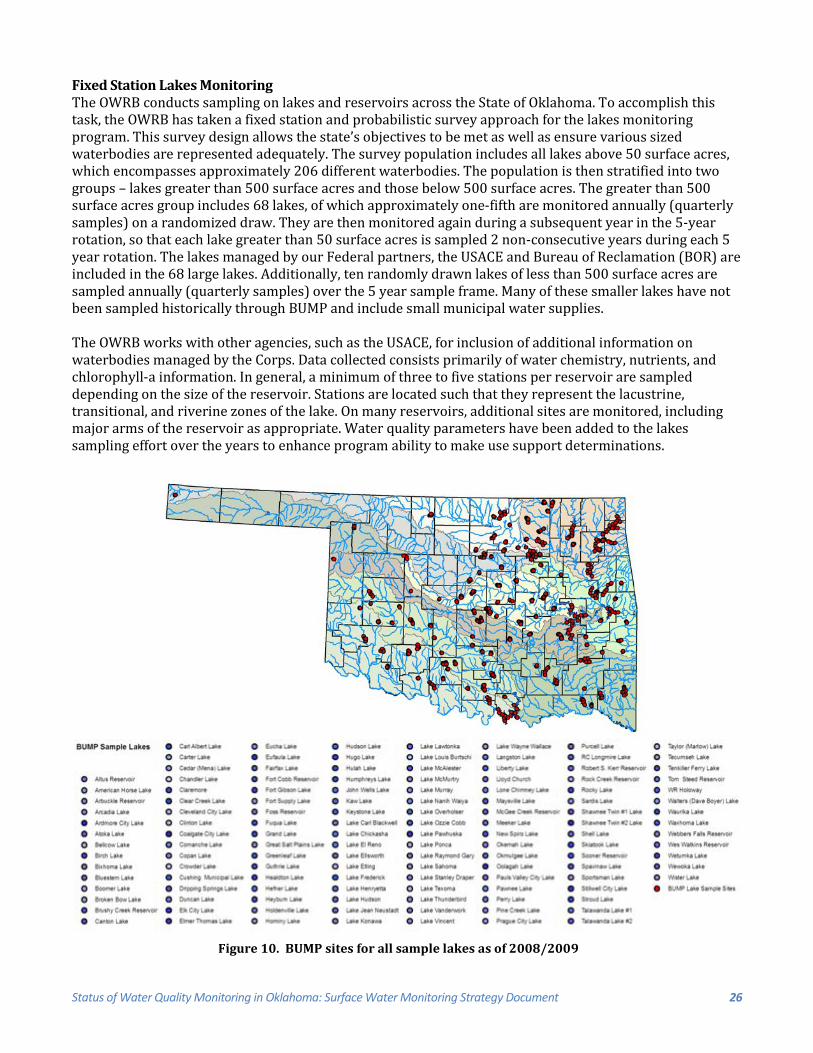
Status of Water Quality Monitoring in Oklahoma: Surface Water Monitoring Strategy Document 26
Fixed Station Lakes Monitoring The OWRB conducts sampling on lakes and reservoirs across the State of Oklahoma. To accomplish this task, the OWRB has taken a fixed station and probabilistic survey approach for the lakes monitoring program. This survey design allows the state’s objectives to be met as well as ensure various sized waterbodies are represented adequately. The survey population includes all lakes above 50 surface acres, which encompasses approximately 206 different waterbodies. The population is then stratified into two groups – lakes greater than 500 surface acres and those below 500 surface acres. The greater than 500 surface acres group includes 68 lakes, of which approximately one-fifth are monitored annually (quarterly samples) on a randomized draw. They are then monitored again during a subsequent year in the 5-year rotation, so that each lake greater than 50 surface acres is sampled 2 non-consecutive years during each 5 year rotation. The lakes managed by our Federal partners, the USACE and Bureau of Reclamation (BOR) are included in the 68 large lakes. Additionally, ten randomly drawn lakes of less than 500 surface acres are sampled annually (quarterly samples) over the 5 year sample frame. Many of these smaller lakes have not been sampled historically through BUMP and include small municipal water supplies. The OWRB works with other agencies, such as the USACE, for inclusion of additional information on waterbodies managed by the Corps. Data collected consists primarily of water chemistry, nutrients, and chlorophyll-a information. In general, a minimum of three to five stations per reservoir are sampled depending on the size of the reservoir. Stations are located such that they represent the lacustrine, transitional, and riverine zones of the lake. On many reservoirs, additional sites are monitored, including major arms of the reservoir as appropriate. Water quality parameters have been added to the lakes sampling effort over the years to enhance program ability to make use support determinations.
Figure 10. BUMP sites for all sample lakes as of 2008/2009
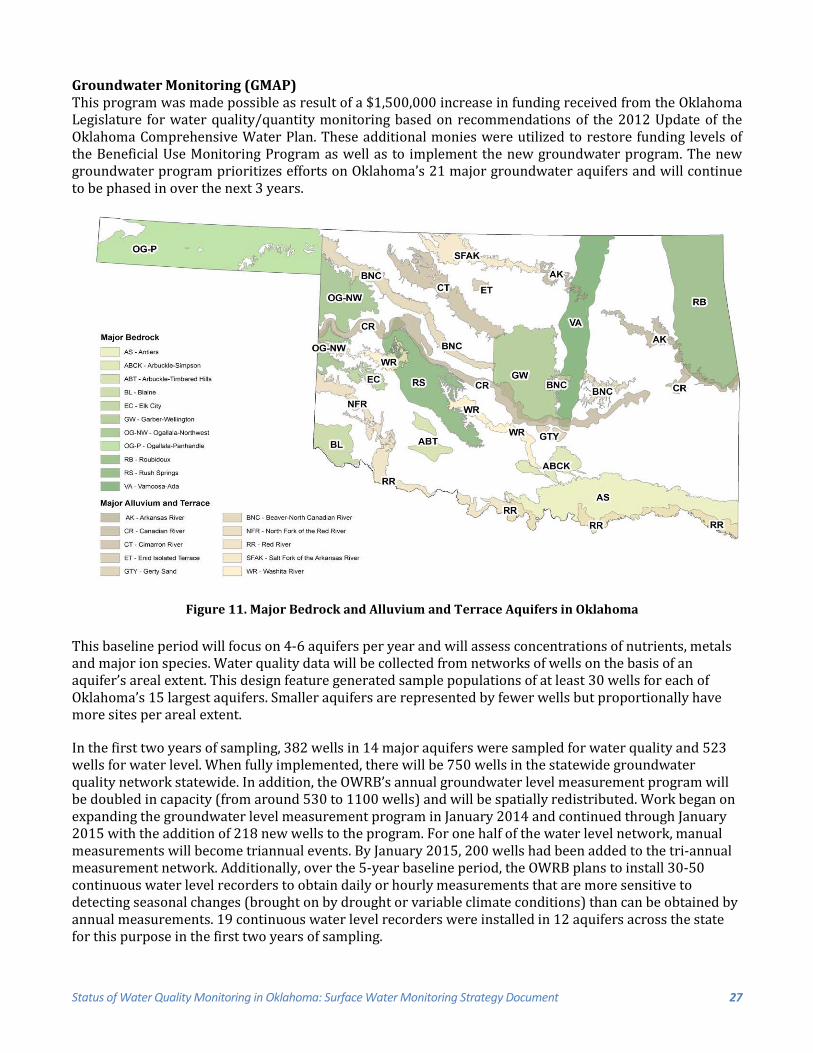
Status of Water Quality Monitoring in Oklahoma: Surface Water Monitoring Strategy Document 27
Groundwater Monitoring (GMAP) This program was made possible as result of a $1,500,000 increase in funding received from the Oklahoma Legislature for water quality/quantity monitoring based on recommendations of the 2012 Update of the Oklahoma Comprehensive Water Plan. These additional monies were utilized to restore funding levels of the Beneficial Use Monitoring Program as well as to implement the new groundwater program. The new groundwater program prioritizes efforts on Oklahoma’s 21 major groundwater aquifers and will continue to be phased in over the next 3 years.
This baseline period will focus on 4-6 aquifers per year and will assess concentrations of nutrients, metals and major ion species. Water quality data will be collected from networks of wells on the basis of an aquifer’s areal extent. This design feature generated sample populations of at least 30 wells for each of Oklahoma’s 15 largest aquifers. Smaller aquifers are represented by fewer wells but proportionally have more sites per areal extent.
In the first two years of sampling, 382 wells in 14 major aquifers were sampled for water quality and 523 wells for water level. When fully implemented, there will be 750 wells in the statewide groundwater quality network statewide. In addition, the OWRB’s annual groundwater level measurement program will be doubled in capacity (from around 530 to 1100 wells) and will be spatially redistributed. Work began on expanding the groundwater level measurement program in January 2014 and continued through January 2015 with the addition of 218 new wells to the program. For one half of the water level network, manual measurements will become triannual events. By January 2015, 200 wells had been added to the tri-annual measurement network. Additionally, over the 5-year baseline period, the OWRB plans to install 30-50 continuous water level recorders to obtain daily or hourly measurements that are more sensitive to detecting seasonal changes (brought on by drought or variable climate conditions) than can be obtained by annual measurements. 19 continuous water level recorders were installed in 12 aquifers across the state for this purpose in the first two years of sampling.
Figure 11. Major Bedrock and Alluvium and Terrace Aquifers in Oklahoma
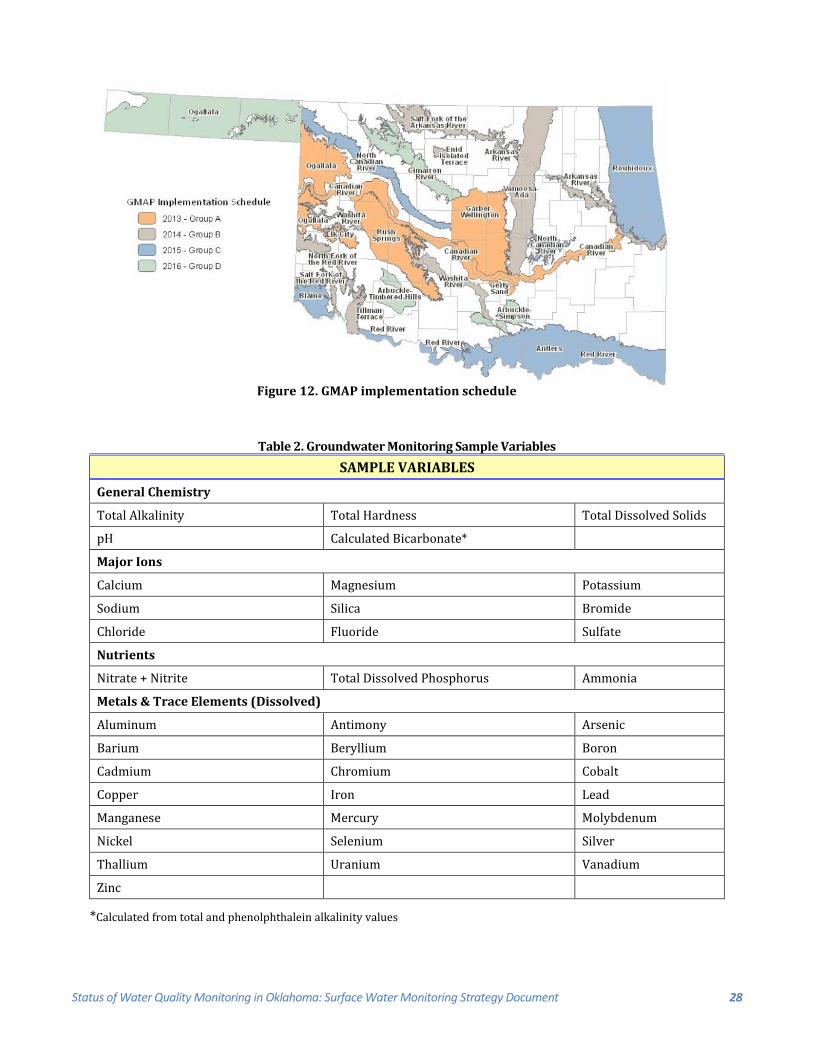
Status of Water Quality Monitoring in Oklahoma: Surface Water Monitoring Strategy Document 28
Table 2. Groundwater Monitoring Sample Variables SAMPLE VARIABLES
General Chemistry
Total Alkalinity Total Hardness Total Dissolved Solids
pH Calculated Bicarbonate*
Major Ions
Calcium Magnesium Potassium
Sodium Silica Bromide
Chloride Fluoride Sulfate
Nutrients
Nitrate + Nitrite Total Dissolved Phosphorus Ammonia
Metals & Trace Elements (Dissolved)
Aluminum Antimony Arsenic
Barium Beryllium Boron
Cadmium Chromium Cobalt
Copper Iron Lead
Manganese Mercury Molybdenum
Nickel Selenium Silver
Thallium Uranium Vanadium
Zinc
*Calculated from total and phenolphthalein alkalinity values
Figure 12. GMAP implementation schedule
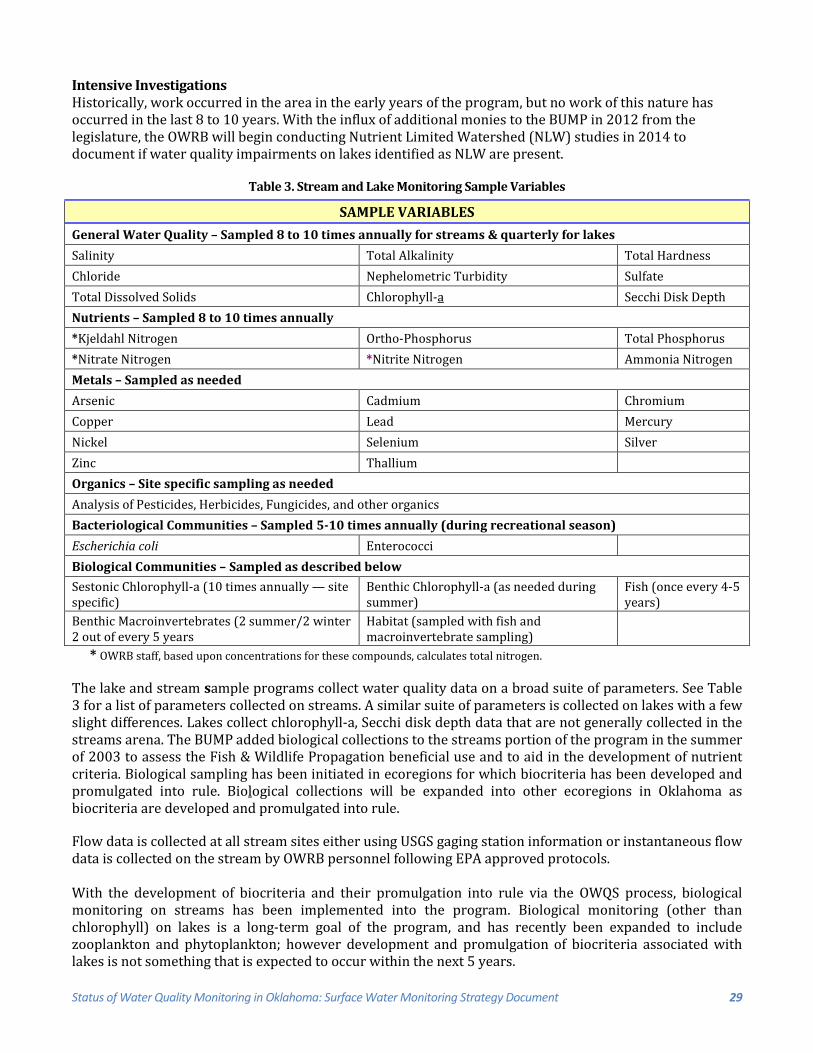
Status of Water Quality Monitoring in Oklahoma: Surface Water Monitoring Strategy Document 29
Intensive Investigations Historically, work occurred in the area in the early years of the program, but no work of this nature has occurred in the last 8 to 10 years. With the influx of additional monies to the BUMP in 2012 from the legislature, the OWRB will begin conducting Nutrient Limited Watershed (NLW) studies in 2014 to document if water quality impairments on lakes identified as NLW are present.
Table 3. Stream and Lake Monitoring Sample Variables
* OWRB staff, based upon concentrations for these compounds, calculates total nitrogen.
The lake and stream sample programs collect water quality data on a broad suite of parameters. See Table 3 for a list of parameters collected on streams. A similar suite of parameters is collected on lakes with a few slight differences. Lakes collect chlorophyll-a, Secchi disk depth data that are not generally collected in the streams arena. The BUMP added biological collections to the streams portion of the program in the summer of 2003 to assess the Fish & Wildlife Propagation beneficial use and to aid in the development of nutrient criteria. Biological sampling has been initiated in ecoregions for which biocriteria has been developed and promulgated into rule. Biological collections will be expanded into other ecoregions in Oklahoma as biocriteria are developed and promulgated into rule.
Flow data is collected at all stream sites either using USGS gaging station information or instantaneous flow data is collected on the stream by OWRB personnel following EPA approved protocols. With the development of biocriteria and their promulgation into rule via the OWQS process, biological monitoring on streams has been implemented into the program. Biological monitoring (other than chlorophyll) on lakes is a long-term goal of the program, and has recently been expanded to include zooplankton and phytoplankton; however development and promulgation of biocriteria associated with lakes is not something that is expected to occur within the next 5 years.
SAMPLE VARIABLES
General Water Quality – Sampled 8 to 10 times annually for streams & quarterly for lakes
Salinity Total Alkalinity Total Hardness Chloride Nephelometric Turbidity Sulfate Total Dissolved Solids Chlorophyll-a Secchi Disk Depth Nutrients – Sampled 8 to 10 times annually *Kjeldahl Nitrogen Ortho-Phosphorus Total Phosphorus *Nitrate Nitrogen *Nitrite Nitrogen Ammonia Nitrogen Metals – Sampled as needed Arsenic Cadmium Chromium Copper Lead Mercury Nickel Selenium Silver Zinc Thallium Organics – Site specific sampling as needed Analysis of Pesticides, Herbicides, Fungicides, and other organics Bacteriological Communities – Sampled 5-10 times annually (during recreational season) Escherichia coli Enterococci Biological Communities – Sampled as described below Sestonic Chlorophyll-a (10 times annually — site specific)
Benthic Chlorophyll-a (as needed during summer)
Fish (once every 4-5 years)
Benthic Macroinvertebrates (2 summer/2 winter 2 out of every 5 years
Habitat (sampled with fish and macroinvertebrate sampling)
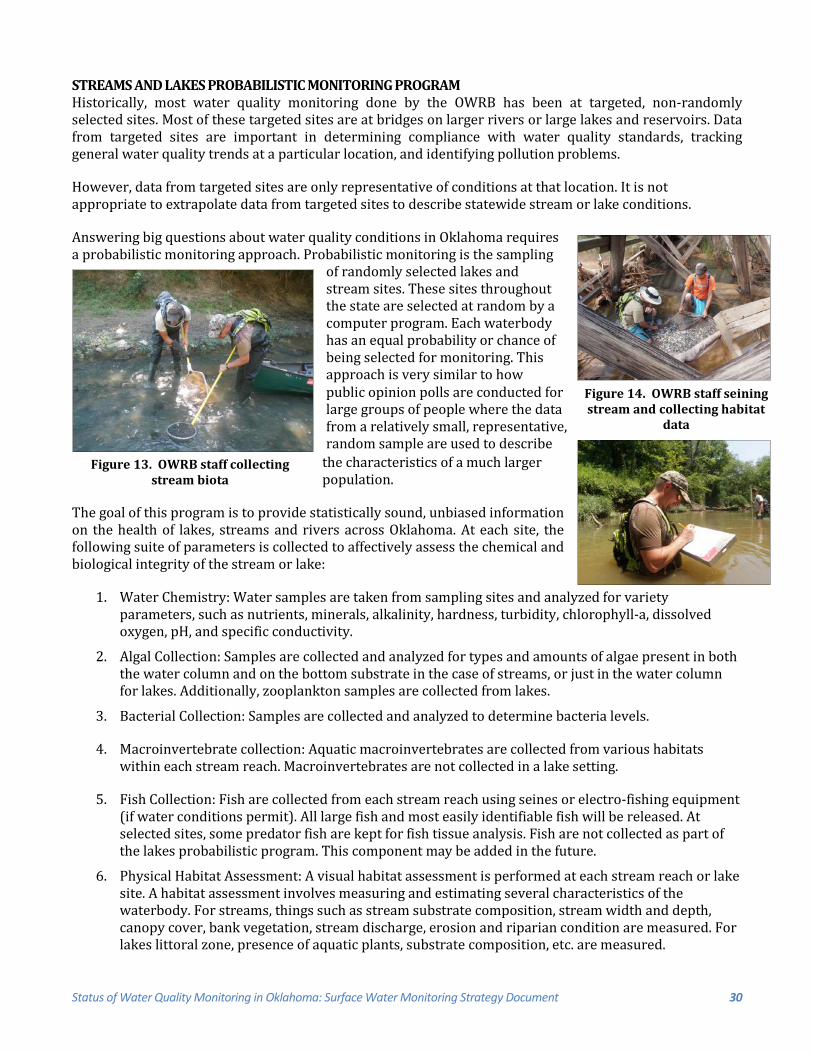
Status of Water Quality Monitoring in Oklahoma: Surface Water Monitoring Strategy Document 30
STREAMS AND LAKES PROBABILISTIC MONITORING PROGRAM Historically, most water quality monitoring done by the OWRB has been at targeted, non-randomly selected sites. Most of these targeted sites are at bridges on larger rivers or large lakes and reservoirs. Data from targeted sites are important in determining compliance with water quality standards, tracking general water quality trends at a particular location, and identifying pollution problems.
However, data from targeted sites are only representative of conditions at that location. It is not appropriate to extrapolate data from targeted sites to describe statewide stream or lake conditions.
Answering big questions about water quality conditions in Oklahoma requires a probabilistic monitoring approach. Probabilistic monitoring is the sampling
of randomly selected lakes and stream sites. These sites throughout the state are selected at random by a computer program. Each waterbody has an equal probability or chance of being selected for monitoring. This approach is very similar to how public opinion polls are conducted for large groups of people where the data from a relatively small, representative, random sample are used to describe
the characteristics of a much larger population.
The goal of this program is to provide statistically sound, unbiased information on the health of lakes, streams and rivers across Oklahoma. At each site, the following suite of parameters is collected to affectively assess the chemical and biological integrity of the stream or lake:
1. Water Chemistry: Water samples are taken from sampling sites and analyzed for variety parameters, such as nutrients, minerals, alkalinity, hardness, turbidity, chlorophyll-a, dissolved oxygen, pH, and specific conductivity.
2. Algal Collection: Samples are collected and analyzed for types and amounts of algae present in both the water column and on the bottom substrate in the case of streams, or just in the water column for lakes. Additionally, zooplankton samples are collected from lakes.
3. Bacterial Collection: Samples are collected and analyzed to determine bacteria levels.
4. Macroinvertebrate collection: Aquatic macroinvertebrates are collected from various habitats within each stream reach. Macroinvertebrates are not collected in a lake setting.
5. Fish Collection: Fish are collected from each stream reach using seines or electro-fishing equipment (if water conditions permit). All large fish and most easily identifiable fish will be released. At selected sites, some predator fish are kept for fish tissue analysis. Fish are not collected as part of the lakes probabilistic program. This component may be added in the future.
6. Physical Habitat Assessment: A visual habitat assessment is performed at each stream reach or lake site. A habitat assessment involves measuring and estimating several characteristics of the waterbody. For streams, things such as stream substrate composition, stream width and depth, canopy cover, bank vegetation, stream discharge, erosion and riparian condition are measured. For lakes littoral zone, presence of aquatic plants, substrate composition, etc. are measured.
Figure 14. OWRB staff seining stream and collecting habitat
data
Figure 13. OWRB staff collecting stream biota
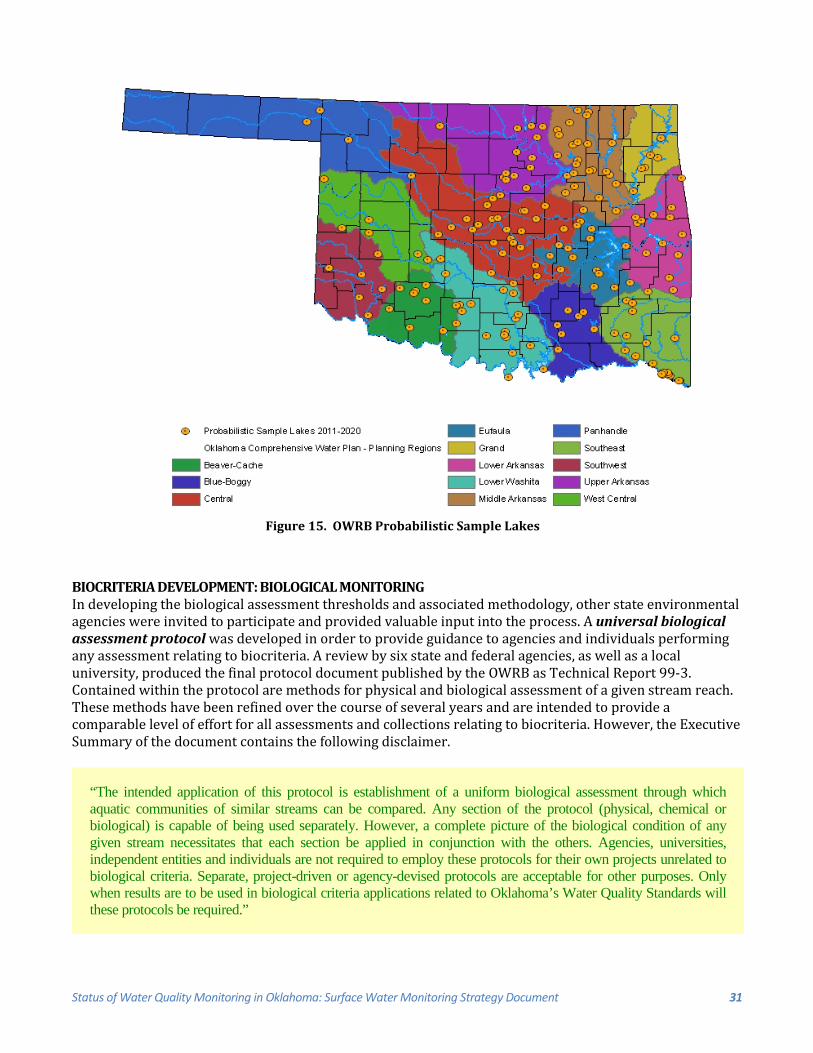
Status of Water Quality Monitoring in Oklahoma: Surface Water Monitoring Strategy Document 31
BIOCRITERIA DEVELOPMENT: BIOLOGICAL MONITORING In developing the biological assessment thresholds and associated methodology, other state environmental agencies were invited to participate and provided valuable input into the process. A universal biological assessment protocol was developed in order to provide guidance to agencies and individuals performing any assessment relating to biocriteria. A review by six state and federal agencies, as well as a local university, produced the final protocol document published by the OWRB as Technical Report 99-3. Contained within the protocol are methods for physical and biological assessment of a given stream reach. These methods have been refined over the course of several years and are intended to provide a comparable level of effort for all assessments and collections relating to biocriteria. However, the Executive Summary of the document contains the following disclaimer.
“The intended application of this protocol is establishment of a uniform biological assessment through which aquatic communities of similar streams can be compared. Any section of the protocol (physical, chemical or biological) is capable of being used separately. However, a complete picture of the biological condition of any given stream necessitates that each section be applied in conjunction with the others. Agencies, universities, independent entities and individuals are not required to employ these protocols for their own projects unrelated to biological criteria. Separate, project-driven or agency-devised protocols are acceptable for other purposes. Only when results are to be used in biological criteria applications related to Oklahoma’s Water Quality Standards will these protocols be required.”
Figure 15. OWRB Probabilistic Sample Lakes
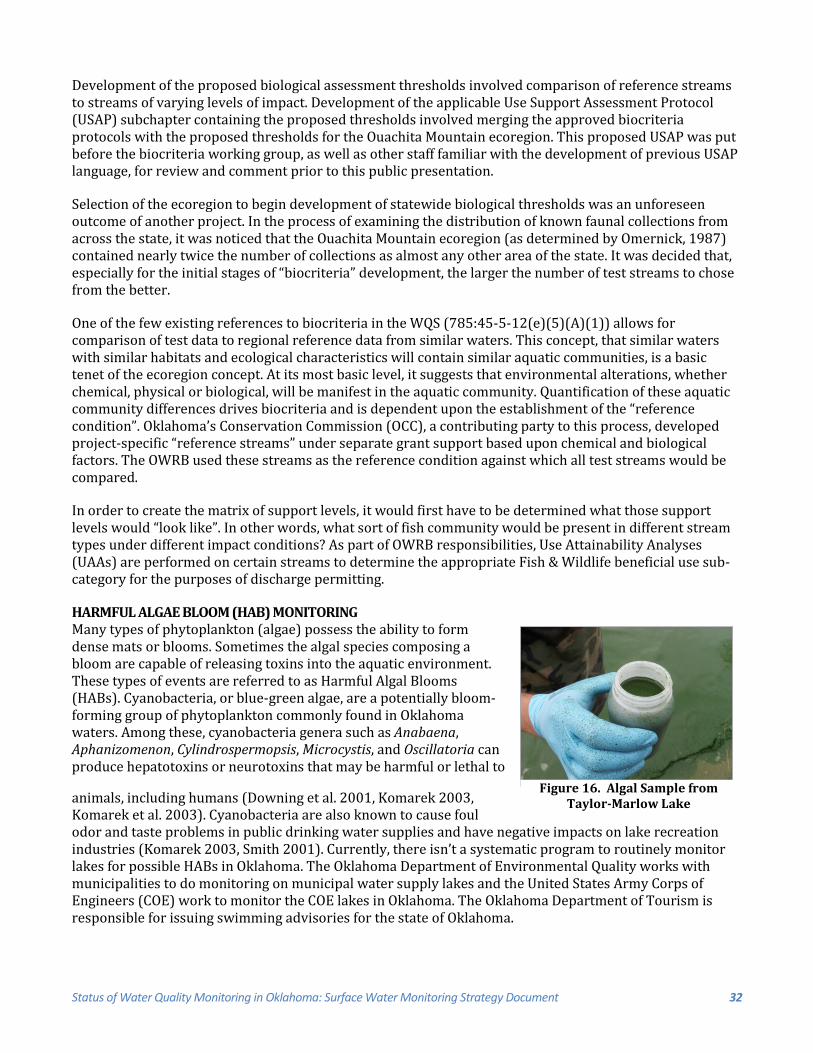
Status of Water Quality Monitoring in Oklahoma: Surface Water Monitoring Strategy Document 32
Development of the proposed biological assessment thresholds involved comparison of reference streams to streams of varying levels of impact. Development of the applicable Use Support Assessment Protocol (USAP) subchapter containing the proposed thresholds involved merging the approved biocriteria protocols with the proposed thresholds for the Ouachita Mountain ecoregion. This proposed USAP was put before the biocriteria working group, as well as other staff familiar with the development of previous USAP language, for review and comment prior to this public presentation.
Selection of the ecoregion to begin development of statewide biological thresholds was an unforeseen outcome of another project. In the process of examining the distribution of known faunal collections from across the state, it was noticed that the Ouachita Mountain ecoregion (as determined by Omernick, 1987) contained nearly twice the number of collections as almost any other area of the state. It was decided that, especially for the initial stages of “biocriteria” development, the larger the number of test streams to chose from the better.
One of the few existing references to biocriteria in the WQS (785:45-5-12(e)(5)(A)(1)) allows for comparison of test data to regional reference data from similar waters. This concept, that similar waters with similar habitats and ecological characteristics will contain similar aquatic communities, is a basic tenet of the ecoregion concept. At its most basic level, it suggests that environmental alterations, whether chemical, physical or biological, will be manifest in the aquatic community. Quantification of these aquatic community differences drives biocriteria and is dependent upon the establishment of the “reference condition”. Oklahoma’s Conservation Commission (OCC), a contributing party to this process, developed project-specific “reference streams” under separate grant support based upon chemical and biological factors. The OWRB used these streams as the reference condition against which all test streams would be compared.
In order to create the matrix of support levels, it would first have to be determined what those support levels would “look like”. In other words, what sort of fish community would be present in different stream types under different impact conditions? As part of OWRB responsibilities, Use Attainability Analyses (UAAs) are performed on certain streams to determine the appropriate Fish & Wildlife beneficial use sub-category for the purposes of discharge permitting.
HARMFUL ALGAE BLOOM (HAB) MONITORING Many types of phytoplankton (algae) possess the ability to form dense mats or blooms. Sometimes the algal species composing a bloom are capable of releasing toxins into the aquatic environment. These types of events are referred to as Harmful Algal Blooms (HABs). Cyanobacteria, or blue-green algae, are a potentially bloom-forming group of phytoplankton commonly found in Oklahoma waters. Among these, cyanobacteria genera such as Anabaena, Aphanizomenon, Cylindrospermopsis, Microcystis, and Oscillatoria can produce hepatotoxins or neurotoxins that may be harmful or lethal to
animals, including humans (Downing et al. 2001, Komarek 2003, Komarek et al. 2003). Cyanobacteria are also known to cause foul odor and taste problems in public drinking water supplies and have negative impacts on lake recreation industries (Komarek 2003, Smith 2001). Currently, there isn’t a systematic program to routinely monitor lakes for possible HABs in Oklahoma. The Oklahoma Department of Environmental Quality works with municipalities to do monitoring on municipal water supply lakes and the United States Army Corps of Engineers (COE) work to monitor the COE lakes in Oklahoma. The Oklahoma Department of Tourism is responsible for issuing swimming advisories for the state of Oklahoma.
Figure 16. Algal Sample from Taylor-Marlow Lake
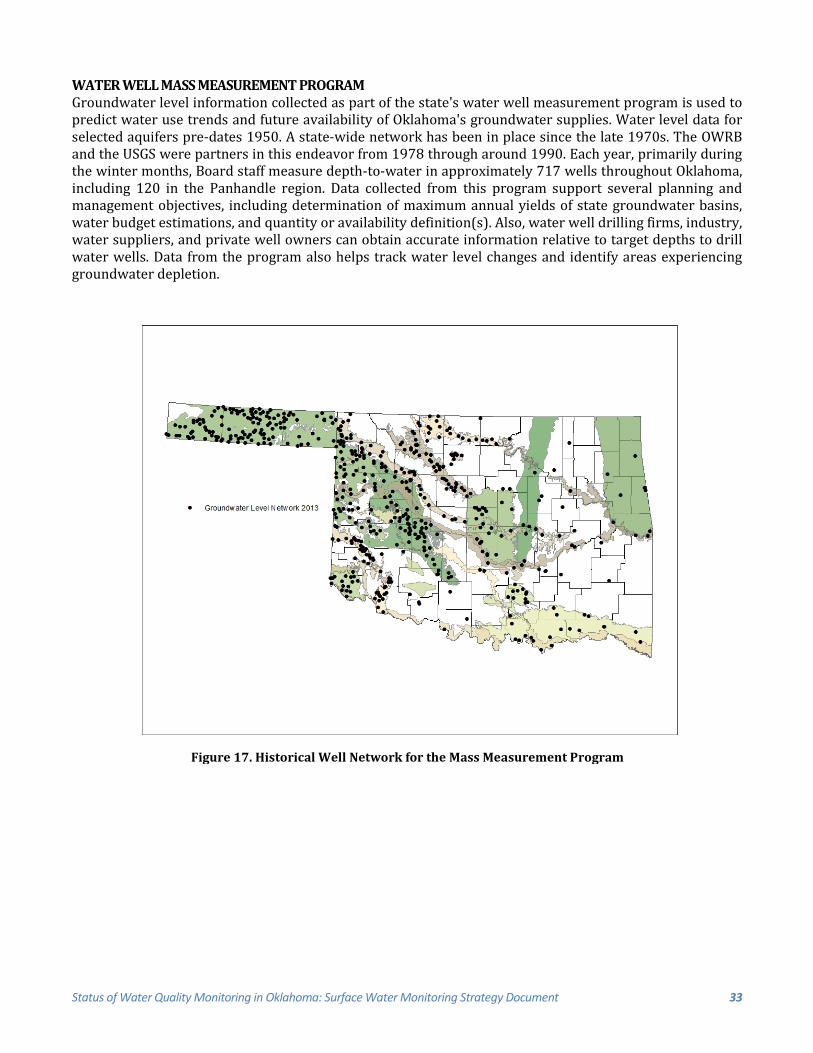
Status of Water Quality Monitoring in Oklahoma: Surface Water Monitoring Strategy Document 33
WATER WELL MASS MEASUREMENT PROGRAM Groundwater level information collected as part of the state's water well measurement program is used to predict water use trends and future availability of Oklahoma's groundwater supplies. Water level data for selected aquifers pre-dates 1950. A state-wide network has been in place since the late 1970s. The OWRB and the USGS were partners in this endeavor from 1978 through around 1990. Each year, primarily during the winter months, Board staff measure depth-to-water in approximately 717 wells throughout Oklahoma, including 120 in the Panhandle region. Data collected from this program support several planning and management objectives, including determination of maximum annual yields of state groundwater basins, water budget estimations, and quantity or availability definition(s). Also, water well drilling firms, industry, water suppliers, and private well owners can obtain accurate information relative to target depths to drill water wells. Data from the program also helps track water level changes and identify areas experiencing groundwater depletion.
Figure 17. Historical Well Network for the Mass Measurement Program
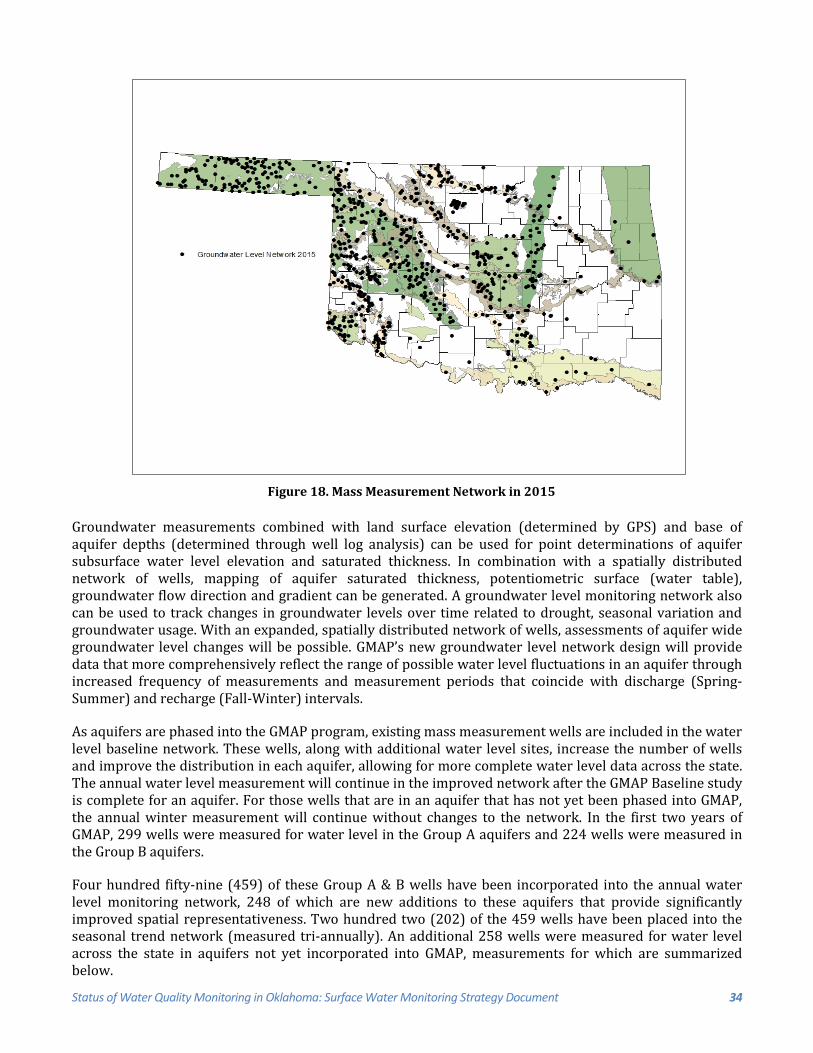
Status of Water Quality Monitoring in Oklahoma: Surface Water Monitoring Strategy Document 34
Groundwater measurements combined with land surface elevation (determined by GPS) and base of aquifer depths (determined through well log analysis) can be used for point determinations of aquifer subsurface water level elevation and saturated thickness. In combination with a spatially distributed network of wells, mapping of aquifer saturated thickness, potentiometric surface (water table), groundwater flow direction and gradient can be generated. A groundwater level monitoring network also can be used to track changes in groundwater levels over time related to drought, seasonal variation and groundwater usage. With an expanded, spatially distributed network of wells, assessments of aquifer wide groundwater level changes will be possible. GMAP’s new groundwater level network design will provide data that more comprehensively reflect the range of possible water level fluctuations in an aquifer through increased frequency of measurements and measurement periods that coincide with discharge (Spring-Summer) and recharge (Fall-Winter) intervals.
As aquifers are phased into the GMAP program, existing mass measurement wells are included in the water level baseline network. These wells, along with additional water level sites, increase the number of wells and improve the distribution in each aquifer, allowing for more complete water level data across the state. The annual water level measurement will continue in the improved network after the GMAP Baseline study is complete for an aquifer. For those wells that are in an aquifer that has not yet been phased into GMAP, the annual winter measurement will continue without changes to the network. In the first two years of GMAP, 299 wells were measured for water level in the Group A aquifers and 224 wells were measured in the Group B aquifers.
Four hundred fifty-nine (459) of these Group A & B wells have been incorporated into the annual water level monitoring network, 248 of which are new additions to these aquifers that provide significantly improved spatial representativeness. Two hundred two (202) of the 459 wells have been placed into the seasonal trend network (measured tri-annually). An additional 258 wells were measured for water level across the state in aquifers not yet incorporated into GMAP, measurements for which are summarized below.
Figure 18. Mass Measurement Network in 2015
Status of Water Quality Monitoring in Oklahoma: Surface Water Monitoring Strategy Document 35
OWRB AND UNITED STATES GEOLOGICAL SURVEY (USGS) COOPERATIVE PROGRAM
Purpose of the Cooperative Program 1The USGS operates and maintains an extensive stream monitoring network for multiple purposes. The stream flow monitoring network is used for forecasting flood events, for determining base flow, for calculating pollutant loadings (based upon flow data), and the USGS also conducts routine water quality monitoring at numerous stations across the state. The USGS has a very extensive historical record on many streams across the state. The existence of this historical record is very useful in the management of Oklahoma’s water resources and the continuation of the network in its present form should be preserved if possible.
The USGS stream flow monitoring program provides hydrologic information needed to help define, use, and manage the state's water resources. The program provides a continuous, well-documented, well-archived, unbiased, and broad-based source of reliable and consistent water data. Because of the nationally consistent, prescribed standards by which the data are collected and processed, the data from individual stations are commonly used for purposes beyond the original purpose for an individual station. Those possible uses include, but are not limited to:
• Characterizing current water-quality conditions
• Providing data for forecasting and managing floods
• Monitoring compliance with minimum flow requirements
• Setting permit requirements for discharge of treated wastewater
• Delineating and managing flood plains
• Magnitude and frequency of floods and droughts
• Operating and designing multipurpose reservoirs
• Designing, operating, and maintaining navigation and recreational facilities
• Allocating water for municipal, industrial, and irrigation uses
• Administering compacts or resolving conflicts on interstate rivers
• Undertaking scientific studies of long-term changes in the hydrologic-cycle
Data for one or more of these purposes are needed at some point in time on virtually every stream in the country, and a data-collection system must be in place to provide the required information. The general objective of the stream flow monitoring program is to provide information on stream-flow characteristics at any point on any stream. Stream-flow data are needed for immediate decision making and future planning and planning and project design. Data, such as that needed to issue and update flood or drought forecasts are referred to as "data for current needs". Other data, such as needed for the design of a future bridge or reservoir, are referred to as "data for future or long-term needs". Some data, of course, fit into both classifications; a station that supplies data for flood forecasting also can provide data to define long-term trends, clearly fits both classifications.
1 Much of the language for this section was taken from several USGS publications, including “Cooperative Water Program – A Partnership in the Nation's Water-Resources Program” by Bruce E. Taggart and “Description of the Cooperative Water Program”. The content has been synthesized down and modified to address Oklahoma specific issues.
Status of Water Quality Monitoring in Oklahoma: Surface Water Monitoring Strategy Document 36
In addition to the extensive USGS flow monitoring network, the OCC, OWRB and DEQ conduct routine flow monitoring on all water quality monitoring sites or sites monitored for TMDL purposes they sample that are not monitored for flow by the USGS. This ensures that flow data is available for all monitoring conducted by the listed agencies to determine beneficial use support has the required flow information to assess support status. Please refer to the appropriate agencies QAPP or SOP documents for a detailed discussion of how flow is determined.
Description of the Program As the primary Federal science agency for water-resource information, the USGS monitors the quantity and quality of water in the Nation's rivers and aquifers, assesses the sources and fate of contaminants in aquatic systems, develops tools to improve the application of hydrologic information, and ensures that its information and tools are available to all potential users. This broad, diverse mission cannot be accomplished effectively without the contributions of the Cooperative Water (Coop) Program. For more than 100 years, the Coop Program has been a highly successful cost-sharing partnership between the USGS and water-resource agencies at the state, local, and tribal levels.
Most work in the Coop Program is directed toward potential and emerging long-term problems, such as water supply, waste disposal, and ground-water quality, effects of agricultural chemicals, floods, droughts, and environmental protection. Standardized methods are used so that study results are transferable to similar problems in other areas and contribute to issues that have interstate, regional, or international significance. Data collected by USGS and the results of its studies are accepted by parties on both sides of disputes and furnish the basis required for interstate and international compacts, Federal law and court decrees, congressionally mandated studies, regional and national water-resources assessments, and planning activities.
The jointly planned and funded Coop Program provides assurance that the information needed to meet national and local needs will be produced and shared. Because rivers and aquifers cross jurisdictional lines, studies and data collected in one county or one state have great value in adjacent counties or states.
Program priorities are developed in response to mutual federal, regional, state, and local requirements. Thus, the USGS and cooperating agencies work together in a continuing process that leads to adjustments in the program each year. These cooperators include state, county, municipal and tribal agencies. Through the pooling of support, the OWRB and USGS are able to conduct studies that lead to an improved understanding of Oklahoma’s water resources to the mutual benefit of all levels of government--at substantial financial savings to any one agency.
Within the Coop Program funds are used to support data-collection activities and interpretive studies. To maximize the usefulness of hydrologic data and the results of interpretive studies, the USGS compiles and analyzes information resulting from these activities into regional and national synthesis products using modest amounts of funding from other USGS programs.
Data-Collection Activities All water quality and quantity management decisions depend heavily on the state/USGS Cooperative Program for flow and water quality data. The stream-flow gaging-station network for Oklahoma is critical for the growth and development of the state’s water resources. Data recorded and analyzed from this network of stream-flow gages provides the information needed to help define, use and manage the state’s water resources. This program provides a continuous, well-documented, well-archived, unbiased, and broad-based source of reliable and consistent water data.
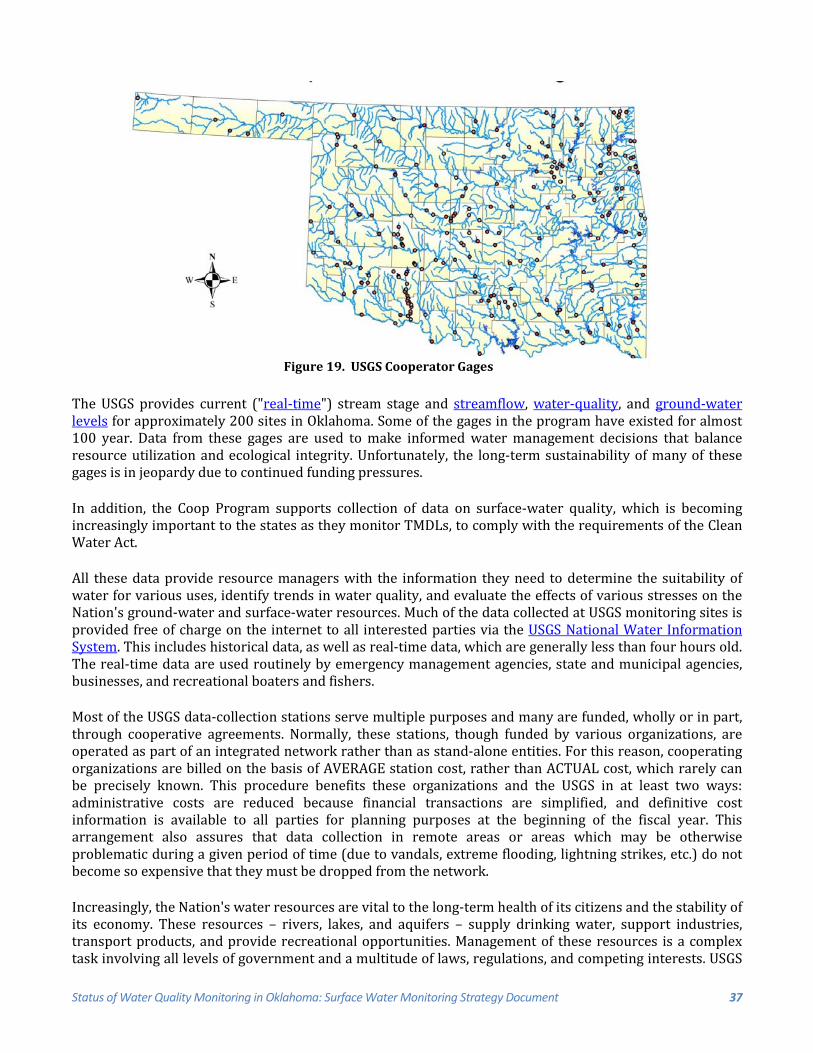
Status of Water Quality Monitoring in Oklahoma: Surface Water Monitoring Strategy Document 37
The USGS provides current ("real-time") stream stage and streamflow, water-quality, and ground-water levels for approximately 200 sites in Oklahoma. Some of the gages in the program have existed for almost 100 year. Data from these gages are used to make informed water management decisions that balance resource utilization and ecological integrity. Unfortunately, the long-term sustainability of many of these gages is in jeopardy due to continued funding pressures.
In addition, the Coop Program supports collection of data on surface-water quality, which is becoming increasingly important to the states as they monitor TMDLs, to comply with the requirements of the Clean Water Act.
All these data provide resource managers with the information they need to determine the suitability of water for various uses, identify trends in water quality, and evaluate the effects of various stresses on the Nation's ground-water and surface-water resources. Much of the data collected at USGS monitoring sites is provided free of charge on the internet to all interested parties via the USGS National Water Information System. This includes historical data, as well as real-time data, which are generally less than four hours old. The real-time data are used routinely by emergency management agencies, state and municipal agencies, businesses, and recreational boaters and fishers.
Most of the USGS data-collection stations serve multiple purposes and many are funded, wholly or in part, through cooperative agreements. Normally, these stations, though funded by various organizations, are operated as part of an integrated network rather than as stand-alone entities. For this reason, cooperating organizations are billed on the basis of AVERAGE station cost, rather than ACTUAL cost, which rarely can be precisely known. This procedure benefits these organizations and the USGS in at least two ways: administrative costs are reduced because financial transactions are simplified, and definitive cost information is available to all parties for planning purposes at the beginning of the fiscal year. This arrangement also assures that data collection in remote areas or areas which may be otherwise problematic during a given period of time (due to vandals, extreme flooding, lightning strikes, etc.) do not become so expensive that they must be dropped from the network.
Increasingly, the Nation's water resources are vital to the long-term health of its citizens and the stability of its economy. These resources – rivers, lakes, and aquifers – supply drinking water, support industries, transport products, and provide recreational opportunities. Management of these resources is a complex task involving all levels of government and a multitude of laws, regulations, and competing interests. USGS
Figure 19. USGS Cooperator Gages
Status of Water Quality Monitoring in Oklahoma: Surface Water Monitoring Strategy Document 38
employees use nationally consistent procedures and quality-assurance protocols in conducting cooperative projects. These standards ensure that all data from the Cooperative Water Program are directly comparable from one region to another and available from USGS databases for use by citizens, public officials, industry, and scientists nationwide. The state of Oklahoma also conducts stream gaging as well and the OWRB uses procedures and protocols consistent with the USGS. Agencies, or "Cooperators," that participate in the Coop Program are primarily state, tribal, county, and municipal agencies with water-resources management and policy responsibilities.
The network is funded through the financial support of multiple partners, e.g., cities, water conservancy districts, master conservancy, river commissions, local, state and federal agencies, and tribes. This inter-related funding arrangement between agencies makes any partner’s shortfall crippling to the network. Funding for long-term stream-flow data-collection gages is critical to the future of Oklahoma, emphasizing the critical nature of communicating and coordinating the Coop Program among all data users.
While the costs to collect manage and report the data continue to rise - federal dollars continue to shrink. Several cooperators have stepped up and contributed monies to the program to help maintain a core network of gages in Oklahoma through funding gages of specific interest to them. Even so, funding for this program as a whole falls short of that necessary to the support the program.
Oklahoma Department of Environmental Quality
TOTAL MAXIMUM DAILY LOADING (TMDL) STUDIES Section 303(d) of the CWA requires that waters of the state that are not currently achieving the beneficial use classification contained in the OWQS, after implementation of prescribed technology-based controls has been shown to be inadequate, be listed on the state’s “303(d) list.” As a result of this listing the CWA also requires that a TMDL be established for each pollutant category (cause) for each listed water. A TMDL, simply stated, is the maximum amount of a specific pollutant that a waterbody can assimilate and still meet numeric and narrative water quality criteria. Development of a TMDL consists generally of five activities:
1. Selection of pollutant(s) or stressor(s) to be considered. This is generally derived from the listed cause(s) on the 303(d) list.
2. Establishing water quality targets; typically water quality targets are tied to water quality standards which apply to the study stream.
3. Analysis and estimation of the pollutants from all sources both point and non-point.
4. Estimation of the waterbody’s assimilative capacity.
5. Establishing the allowable loads for point, non-point sources and margin of safety.
In order to complete a TMDL for a listed water, reliable water quality data are necessary to establish both the current and allowable pollutant loading. This usually requires that water quality monitoring be conducted because reliable historical water quality data in the state are very limited.
Objectives • To obtain reliable water quality information on each waterbody selected for study via the priority-
ranked 303(d) list.
• To develop a TMDL that will ensure the quality of listed waters will be protective of its designated beneficial use(s).
Status of Water Quality Monitoring in Oklahoma: Surface Water Monitoring Strategy Document 39
Program Description An initial site inspection is performed before initiation of data collection activities to address environmental and logistical problems likely to be encountered at the site. The problem to be addressed can be clearly identified at this stage, and relevant parameters determined. The prime objective of the initial site inspection is to collect as much information as possible about the site and the surrounding area that might impact the site. Any information that will help in better understanding the system being studied is considered. Other state agencies are notified, if necessary, depending on the nature of the individual project. Stream and lake data gathered through the OWRB’s BUMP program, where available, is a valuable resource. In addition, local councils of government (COG), such as INCOG in the Tulsa area and ACOG in the Oklahoma City area, sometimes participate in TMDL monitoring and analysis activities.
Monitoring Requirements Time of travel studies are conducted at the site to determine flow rates and velocities. Routine sampling is conducted at each monitoring location to determine a base flow condition. Routine sampling for most parameters is generally performed on a monthly basis. More intensive, short –term studies for dissolved oxygen problems may also be performed. Sampling in such cases is performed two to four times in a 24-hour period, the total sampling period lasting 24 hours. The parametric coverage includes the constituents causing the impairment of the waterbody’s beneficial use(s) and grab samples for flow, dissolved oxygen, temperature, pH and specific conductivity. Composite samples are generally collected for the 24-hour period from any storm drains or tributaries known or seen to be discharging. Other parameters, including inorganics, organics and/or heavy metals, may require special sampling consideration. Habitat modification may also require assessment. Wet weather sampling is conducted after storm events, as necessary, to quantify the non-point source contribution to the waterbody’s impairment. Parametric coverage is generally the same as for base flow monitoring.
Monitoring Locations Site-specific sampling plans are developed jointly by the field personnel and the engineer responsible for modeling. Sample sites, by necessity, are selected considering accessibility to the sites, significance of data, and anything else gleaned from the initial site inspection that may be relevant to the outcome of the study. Sampling plans are developed which include the proposed sites and the analyses to be conducted for each site.
Data Evaluation The monitoring data collected is evaluated to determine the waterbody’s assimilative capacity and the pollution load from all sources, both point and non-point.
Actions Taken or Prescribed The allowable TMDL is established by summing point source loadings and non-point source loadings, allowing for a margin of safety, which will allow the waterbody to meet applicable water quality criteria.
Time Lines TMDL studies are an ongoing process dictated by the priority-ranked 303(d) list. Duration of monitoring is project-specific and is generally determined by project logistics.
MERCURY IN FISH PROGRAM Mercury is a potent neurotoxin that accumulates in the muscle tissue of fish. Over time common exposure sources of mercury such as thermometers, thermostats, and light switches have been removed from general circulation. Today, 99 percent of American’s exposure to mercury comes through the consumption of commercial and locally-caught fish.
In 2005 ODEQ lowered the level at which advisories are issued due to mercury levels in fish. This was done in response to changes in risk assessment values made by EPA. With the lowering of the advisory level it was determined that data was not sufficient to evaluate the safety of eating fish from Oklahoma’s lakes.
Status of Water Quality Monitoring in Oklahoma: Surface Water Monitoring Strategy Document 40
In 2008, a screening level assessment of predator fish mercury concentrations in Oklahoma lakes was initiated with the cooperation of the Oklahoma Department of Wildlife Conservation (ODWC). The screening level assessment was followed in 2009 by intensive sampling at lakes that had fish with higher levels of mercury in the initial assessment. As a result, consumption advisories were issued at 16 lakes in 2010.
Additional lakes have been sampled since 2010 with an emphasis on smaller lakes having a high potential for fish to have elevated mercury levels. Samples have also been collected of additional fish species from lakes having moderate mercury levels in the initial screening study.
ODEQ issued consumption advisories for an additional 17 lakes in 2013 and 8 lakes in 2016. DEQ has also begun another round of screening level samples from reservoirs that were evaluated in 2008-10. The results of these samples will be evaluated to determine if mercury levels have changed since the initial collections and if advisories need to be adjusted.
Objectives To protect public health by evaluating levels of mercury in fish from Oklahoma reservoirs and, when necessary, issue fish consumption advisories to the public in cooperation with other state agencies.
Program Description Mercury screening is conducted on samples of largemouth or spotted bass. If mercury levels exceed advisory thresholds, the lake is re-sampled for all available game fish species. Data is evaluated and compared to risk –based thresholds designed to protect public health.
If mercury levels in a lake exceed advisory thresholds, a consumption advisory is issued to inform the public which species and what lengths of fish are unsafe to eat in unlimited amounts. Since eating uncontaminated fish provides many health benefits, the public is also informed which species are safe to consume. The public is encouraged to make smart, informed decisions about the fish they choose to eat and feed their families.
Monitoring Requirements Sample Collection Since the intent of the program is to measure toxics in fish flesh, any legal method of obtaining uncontaminated samples is acceptable. This includes gill nets, seines, trot line, electrofishing, rod and reel, and angler surveys. The ODEQ has a working agreement with the ODWC to collect fish in conjunction with their fish survey activities. ODWC generally uses electrofishing collection methods.
The ODEQ supplements these collections, when necessary, with fish collected by electrofishing, gill net or seine.
Five to 8 individual fish of each species are collected. Fish must be of a size typically consumed by fishermen (this will vary by species). There is no requirement that the fish be similar in size.
Monitoring Locations Table 4 lists the lakes routinely sampled on a rotating basis and the number of monitoring sites for each listed lake.
Status of Water Quality Monitoring in Oklahoma: Surface Water Monitoring Strategy Document 41
Data Evaluation Sample Analysis Fish tissue samples are analyzed for mercury using analytical methods detailed in the SEL Quality Assurance Plan.
Screening Levels and Modeling Mercury levels in fish are generally correlated with length, i.e. the longer the fish the higher the mercury level. ODEQ uses a 14 inch Largemouth Bass (LMB) or Spotted Bass (SP) as the standard screening specimen. Because it is not possible to collect only 14 inch fish, ODEQ uses a model developed by the US Geological Survey to predict mercury values for a 14 inch LMB or SB based on the length and mercury value fish collected.
Screening levels are used to determine potential problems and if other samples and species need to be analyzed. Screening levels are set at 0.375 which is 75% of the lowest level for which consumption advisory would be issued. If the average modeled value for a 14 inch LMB exceeds the screening value for a given lake, all available game fish species will be sampled and evaluated for that lake.
If, during routine sampling, screening values are exceeded, samples are recollected as soon as practicable with emphasis on collecting the species and categories of fish that showed contamination.
Data is sorted by lake and species. Plots with trend lines are generated that compare length vs. concentration for each species in each lake. The points at which the trend line crosses an advisory threshold are noted. If the noted length of fish is within a typical consumable range, an advisory will be considered.
Actions Taken or Prescribed Consumption Advisories Consumption advisories may be issued for a particular species or a general category of fish, e.g.: predator species. Consumption advisories may also be issued within size ranges, e.g.: largemouth bass greater than 14” in length.
Consumption advisories are only issued after sufficient data indicates contaminant levels are above DEQ advisory thresholds. Selective sampling techniques are used to determine if only certain species or categories of fish are affected. Consumption advisories are only issued with the cooperation of the ODWC and lake managers. In addition, other interested parties are notified and consulted before consumption advisories are issued. These may include other state and federal agencies, tribes, and municipalities.
Consumption advisories are rescinded only after sufficient data indicates contaminant levels that are below DEQ standards. Lakes will be evaluated with screening level samples every 5 to 7 years to determine if changes in mercury concentrations have occurred in LMB or SB. If the modeled value for 14 inch fish has changed by more than 20% over that time period, all available game-fish species will be collected and advisories will be reevaluated based on the results of the most recent testing.
Status of Water Quality Monitoring in Oklahoma: Surface Water Monitoring Strategy Document 42
Program Results Currently there are 45 active consumption advisories in the State of Oklahoma:
• Catfish at Bitter Creek in Jackson County due to DDT and Toxaphene • Several species in the Spring and Neosho Rivers and Grand Lake due to elevated levels of lead.
Advisories due to mercury are in effect at:
• Arbuckle Lake • Atoka Lake • Boomer Lake • Broken Bow Reservoir • Canton Lake • Carlton Lake • Cedar Lake • Clayton Lake • Coalgate City Lake • Cushing Lake • Draper Lake • Dripping Springs Lake • Elmer Thomas Lake • Ft. Supply Reservoir • Hugo Reservoir • Kaw Reservoir • Lake Carl Albert • Lake Carl Blackwell • Lake Eufaula • Lake Heyburn
• Lake Nanih Waiya • Lake Ozzie Cobb • Lake Talawanda #2 • Lake Wayne Wallace • Lloyd Church Lake • McAlester City Lake • McGee Creek Reservoir • Meeker Lake • Pine Creek Reservoir • Prague Lake • Quanah Parker Lake • Rush Lake • Sardis Lake • Schooler Lake • Skiatook Lake • Sportsman Lake • Stroud Lake • Wetumka Lake • Wewoka Lake • Wister Lake
The DEQ has also issued a statewide advisory for mercury in Oklahoma lakes that have not been sampled.
Time Lines Reservoirs are routinely screened for mercury every 5 to 7 years. Streams are sampled on a case-by-case basis at locations where contamination is known or suspected to exist. If sample results indicate elevated levels of contaminants, sampling frequency is usually increased to annual unless it is determined that contaminant sources are unlikely to change for an extended time.
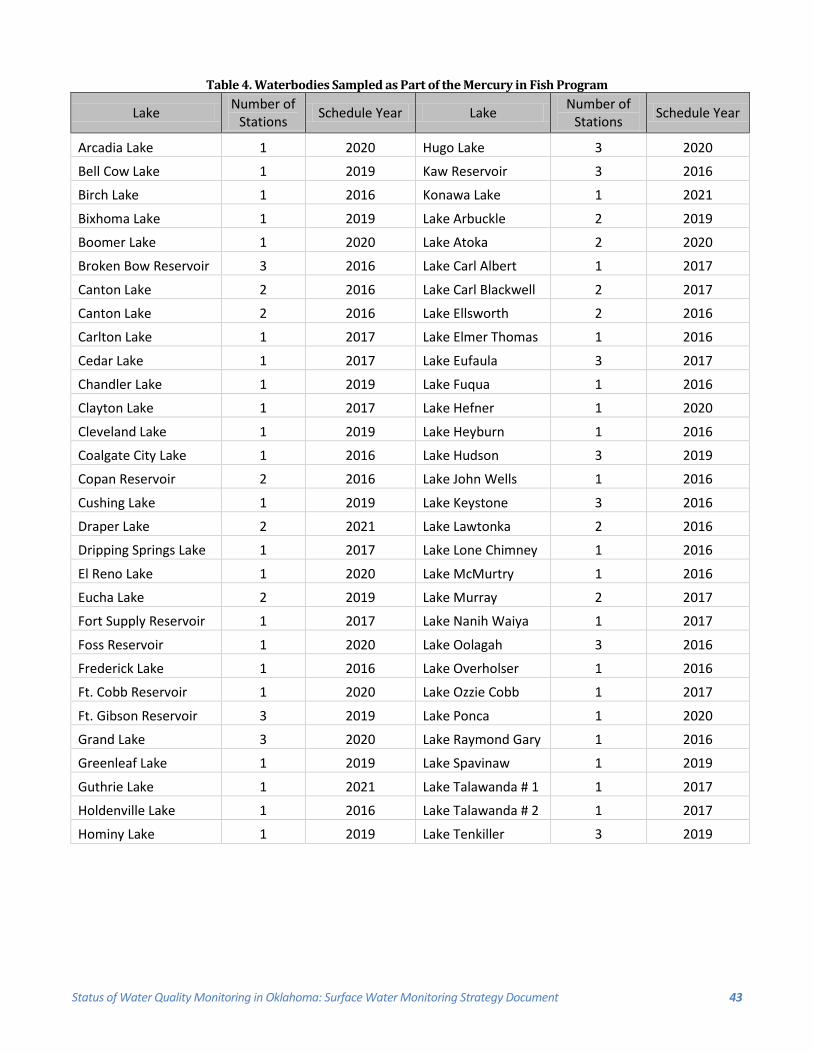
Status of Water Quality Monitoring in Oklahoma: Surface Water Monitoring Strategy Document 43
Table 4. Waterbodies Sampled as Part of the Mercury in Fish Program
Lake Number of Stations Schedule Year Lake Number of
Stations Schedule Year
Arcadia Lake 1 2020 Hugo Lake 3 2020
Bell Cow Lake 1 2019 Kaw Reservoir 3 2016
Birch Lake 1 2016 Konawa Lake 1 2021
Bixhoma Lake 1 2019 Lake Arbuckle 2 2019
Boomer Lake 1 2020 Lake Atoka 2 2020
Broken Bow Reservoir 3 2016 Lake Carl Albert 1 2017
Canton Lake 2 2016 Lake Carl Blackwell 2 2017
Canton Lake 2 2016 Lake Ellsworth 2 2016
Carlton Lake 1 2017 Lake Elmer Thomas 1 2016
Cedar Lake 1 2017 Lake Eufaula 3 2017
Chandler Lake 1 2019 Lake Fuqua 1 2016
Clayton Lake 1 2017 Lake Hefner 1 2020
Cleveland Lake 1 2019 Lake Heyburn 1 2016
Coalgate City Lake 1 2016 Lake Hudson 3 2019
Copan Reservoir 2 2016 Lake John Wells 1 2016
Cushing Lake 1 2019 Lake Keystone 3 2016
Draper Lake 2 2021 Lake Lawtonka 2 2016
Dripping Springs Lake 1 2017 Lake Lone Chimney 1 2016
El Reno Lake 1 2020 Lake McMurtry 1 2016
Eucha Lake 2 2019 Lake Murray 2 2017
Fort Supply Reservoir 1 2017 Lake Nanih Waiya 1 2017
Foss Reservoir 1 2020 Lake Oolagah 3 2016
Frederick Lake 1 2016 Lake Overholser 1 2016
Ft. Cobb Reservoir 1 2020 Lake Ozzie Cobb 1 2017
Ft. Gibson Reservoir 3 2019 Lake Ponca 1 2020
Grand Lake 3 2020 Lake Raymond Gary 1 2016
Greenleaf Lake 1 2019 Lake Spavinaw 1 2019
Guthrie Lake 1 2021 Lake Talawanda # 1 1 2017
Holdenville Lake 1 2016 Lake Talawanda # 2 1 2017
Hominy Lake 1 2019 Lake Tenkiller 3 2019
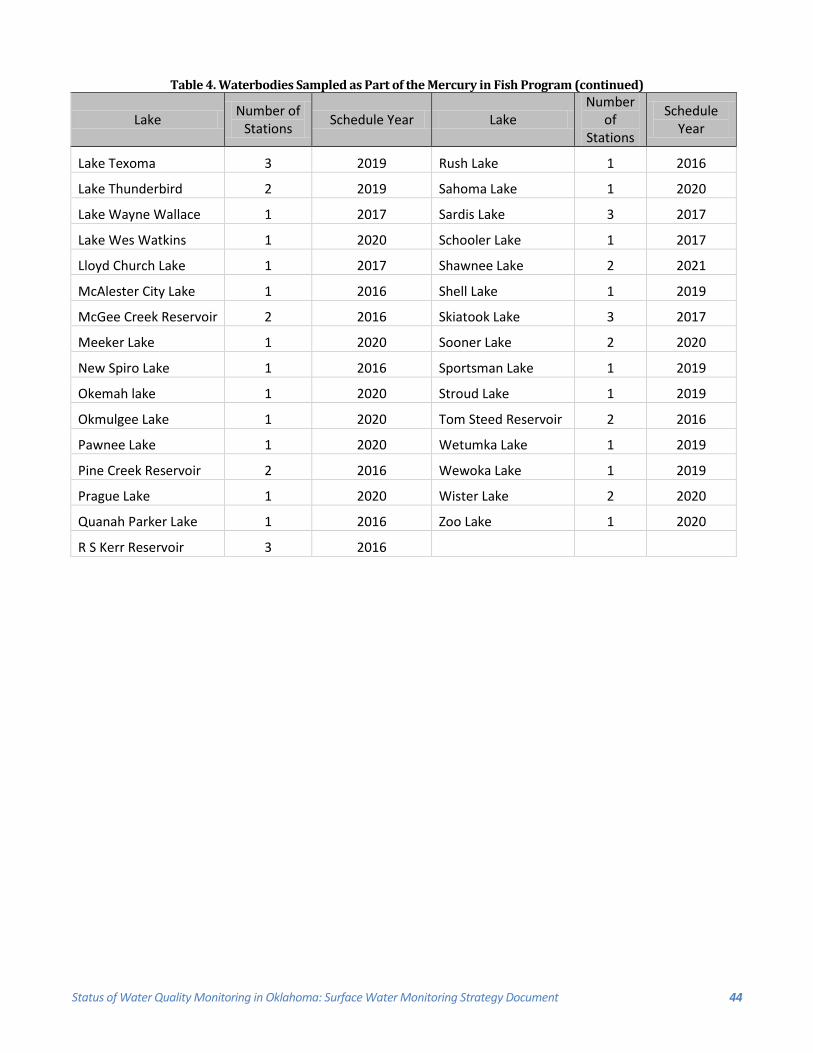
Status of Water Quality Monitoring in Oklahoma: Surface Water Monitoring Strategy Document 44
Table 4. Waterbodies Sampled as Part of the Mercury in Fish Program (continued)
Lake Number of Stations Schedule Year Lake
Number of
Stations
Schedule Year
Lake Texoma 3 2019 Rush Lake 1 2016
Lake Thunderbird 2 2019 Sahoma Lake 1 2020
Lake Wayne Wallace 1 2017 Sardis Lake 3 2017
Lake Wes Watkins 1 2020 Schooler Lake 1 2017
Lloyd Church Lake 1 2017 Shawnee Lake 2 2021
McAlester City Lake 1 2016 Shell Lake 1 2019
McGee Creek Reservoir 2 2016 Skiatook Lake 3 2017
Meeker Lake 1 2020 Sooner Lake 2 2020
New Spiro Lake 1 2016 Sportsman Lake 1 2019
Okemah lake 1 2020 Stroud Lake 1 2019
Okmulgee Lake 1 2020 Tom Steed Reservoir 2 2016
Pawnee Lake 1 2020 Wetumka Lake 1 2019
Pine Creek Reservoir 2 2016 Wewoka Lake 1 2019
Prague Lake 1 2020 Wister Lake 2 2020
Quanah Parker Lake 1 2016 Zoo Lake 1 2020
R S Kerr Reservoir 3 2016
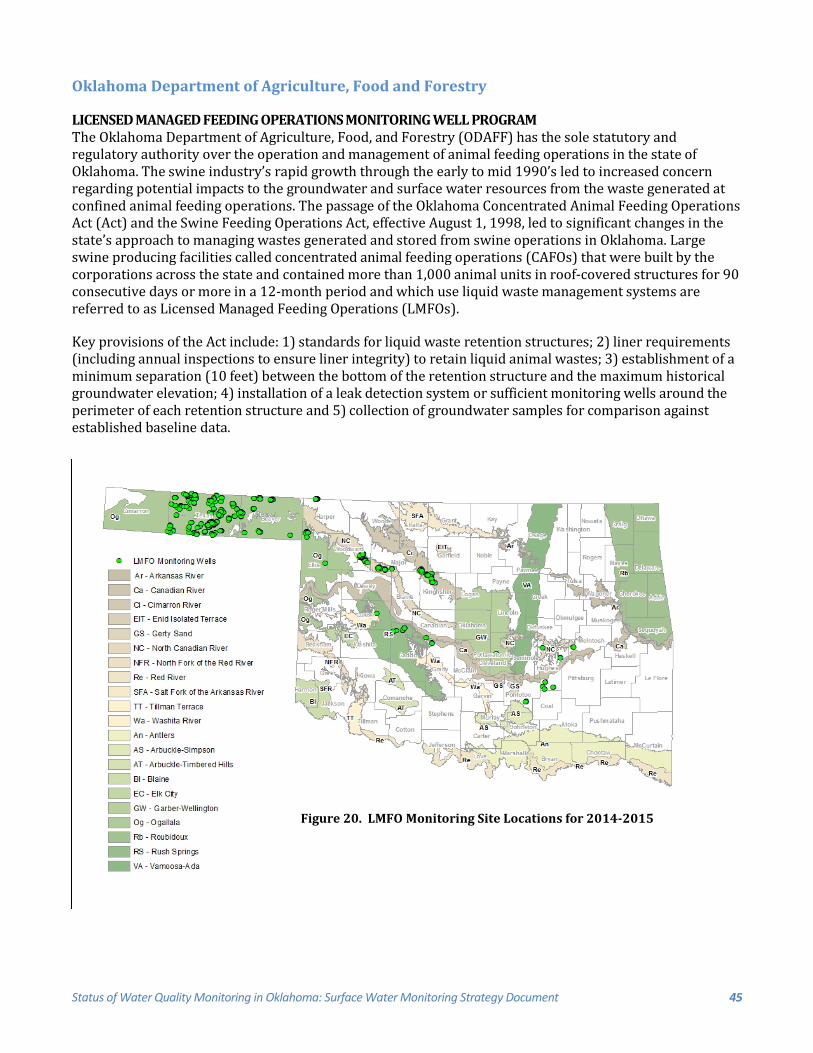
Status of Water Quality Monitoring in Oklahoma: Surface Water Monitoring Strategy Document 45
Oklahoma Department of Agriculture, Food and Forestry
LICENSED MANAGED FEEDING OPERATIONS MONITORING WELL PROGRAM The Oklahoma Department of Agriculture, Food, and Forestry (ODAFF) has the sole statutory and regulatory authority over the operation and management of animal feeding operations in the state of Oklahoma. The swine industry’s rapid growth through the early to mid 1990’s led to increased concern regarding potential impacts to the groundwater and surface water resources from the waste generated at confined animal feeding operations. The passage of the Oklahoma Concentrated Animal Feeding Operations Act (Act) and the Swine Feeding Operations Act, effective August 1, 1998, led to significant changes in the state’s approach to managing wastes generated and stored from swine operations in Oklahoma. Large swine producing facilities called concentrated animal feeding operations (CAFOs) that were built by the corporations across the state and contained more than 1,000 animal units in roof-covered structures for 90 consecutive days or more in a 12-month period and which use liquid waste management systems are referred to as Licensed Managed Feeding Operations (LMFOs).
Key provisions of the Act include: 1) standards for liquid waste retention structures; 2) liner requirements (including annual inspections to ensure liner integrity) to retain liquid animal wastes; 3) establishment of a minimum separation (10 feet) between the bottom of the retention structure and the maximum historical groundwater elevation; 4) installation of a leak detection system or sufficient monitoring wells around the perimeter of each retention structure and 5) collection of groundwater samples for comparison against established baseline data.
Figure 20. LMFO Monitoring Site Locations for 2014-2015
Status of Water Quality Monitoring in Oklahoma: Surface Water Monitoring Strategy Document 46
Numerous LMFOs in Oklahoma overlie groundwater regions that have the very highest risk or vulnerability to land practices, based on soil type, depth to water and permeability, which could impact the quality of the groundwater. To prevent contamination of groundwater from possible leaking LMFO lagoons, the Oklahoma CAFO Act and ODAFF rules have strict lagoon and liner construction criteria in place. Even with proper lagoon construction, leakage from the lagoon to the groundwater might occur and the Act allows for limited leakage from clay lined lagoons. The Oklahoma CAFO Act required all swine LMFOs licensed by ODAFF on or after August 1, 1998 to install a leak detection system or monitoring wells around the perimeter of each animal wastewater lagoon prior to using the lagoon and sampling of the monitoring wells at LMFOs at least annually.
The Act further states “samples of water shall be collected by the State Department of Agriculture and tested at least annually by a qualified environmental laboratory certified by the Department of Environmental Quality”. Test results prior to operation of the facility would establish the baseline character of the groundwater for the facility. If no tests were conducted prior to the facilities operation, then the test results from the first year of sampling are considered to be the applicable baseline data (for older concentrated feeding operations). LMFO companies had a one-year grace period to install an ODAFF approved groundwater-monitoring system at their facilities.
The main goal of the monitoring program is to ascertain if groundwater at or near the LMFOs has degraded as a result of the operation of the facility and storage of the liquid animal wastes. The baseline data, which can be test results from monitoring wells prior to the commencement of operation of the facility or the test results from the first year of sampling, serve as a reference point to potential change in groundwater quality over time. Since 1999, sampling and analysis of the LMFO monitoring wells has taken place during each fiscal year to determine if contamination by animal wastes could be detected.
Currently, the OWRB is the ODAFF contractor for this project. Uniform sampling procedures, documented in the QAPP, are used to insure sample representativeness. A minimum of three well volumes are pumped/bailed from each monitoring well to purge stagnant water from the water column. Periodic collection of water quality parameters of pH, specific conductance, temperature and dissolved oxygen during bailing and at the conclusion of pumping/bailing insure that a stable sample of the aquifer water is represented and collected for analysis.
The data collected during each year’s monitoring:
• Determines water characteristics from each water sample which will serve as indicators of stable ambient water prior to sample collection. The precision at which the parameters can be determined and reported out are linked to the method of water extraction from the well.
• Determines nitrate and ammonia nitrogen, total phosphorus, specific conductivity and pH and fecal coliform bacteria content. The ODAFF Laboratory Services Division, Inorganic Section performs the analysis. They are certified to perform general water quality by the ODEQ through its laboratory certification program.
• Evaluates over time if the nitrates in the groundwater are increasing above 10 mg/L, which is the Safe Drinking Water Act contaminate level.
Each year, a Final Report is written by the ODAFF and OWRB that includes a comprehensive summary of all laboratory and field data results, an analysis of sampling protocols, ArcView GIS shape files that incorporate location and attribute information for monitoring wells, an accounting of the total expenditures and a general overview with suggestions for possible additional remediation, corrective actions or future steps to be taken by ODAFF. Table 5 summarizes the LMFO monitoring well sample results from 2000 to the most recent data collected in 2015.
Status of Water Quality Monitoring in Oklahoma: Surface Water Monitoring Strategy Document 47
Concerning Dry Wells and Frequency of Evaluation: Beginning in FY07, HB 3015 that was enacted into law on July 1, 2006, stipulated that the frequency of sampling/evaluating wells may be reduced to once every three years if they were found to be dry for at least three (3) consecutive years. As a consequence of HB 3015, the total number of monitoring wells investigated and total number of reported dry wells is variable over time. The total number of wells that were dry for at least three consecutive years through July 1, 2006 were 493 leaving only 59 (493 + 59 = 552) to evaluate in 2007. After July 1, 2007, 40 of the 59 wells met the three consecutive year dry status criteria leaving only 19 to evaluate in 2008. The 2009 monitoring period showed an even further drop to 11 wells. For the FY10 sample period, the initial 493 dry monitoring wells referenced above that were dropped from the program as of July 1, 2006 were reassessed to evaluate if any of these wells have in fact recharged to meet the intent of the statue. Only two out of 493 historically dry monitoring wells had sufficient amount(s) of recharge or column water to sample during the FY10 sample period. The number of dry wells assessed in FY11 was 56 wells; FY12 had 34 dry wells, FY13 had 36 wells, FY14 had 512 and FY15 had 512 wells.
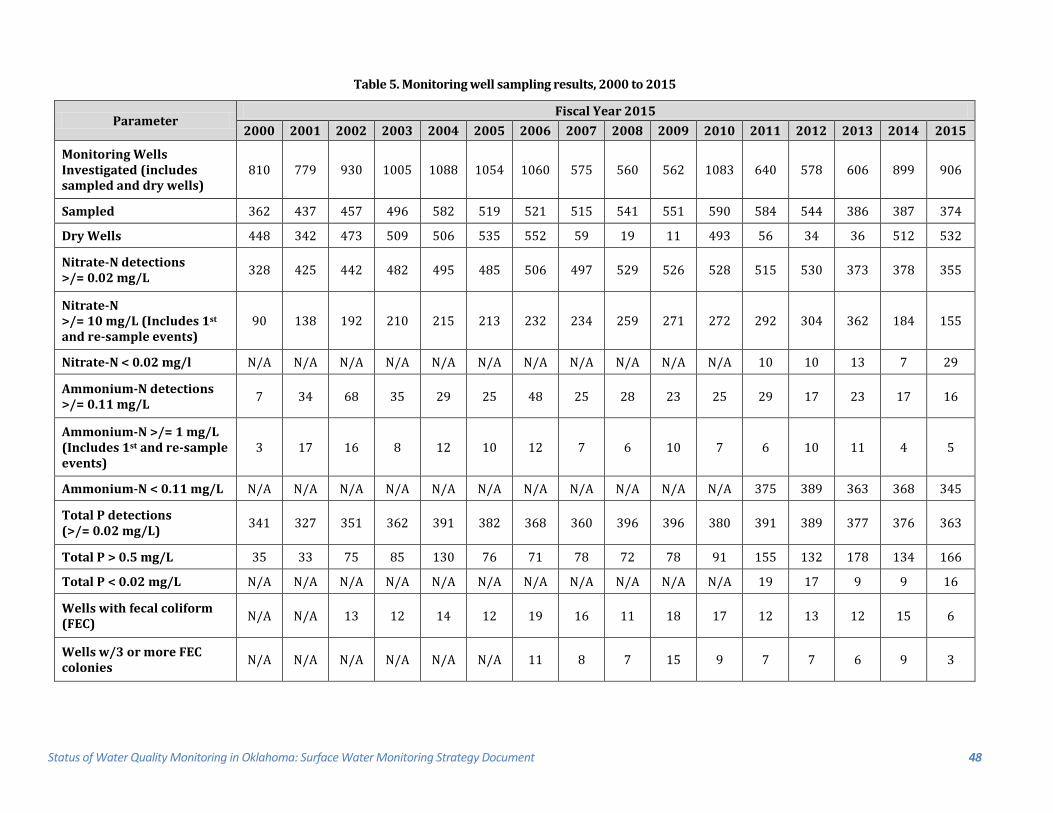
Status of Water Quality Monitoring in Oklahoma: Surface Water Monitoring Strategy Document 48
Table 5. Monitoring well sampling results, 2000 to 2015
Parameter Fiscal Year 2015
2000 2001 2002 2003 2004 2005 2006 2007 2008 2009 2010 2011 2012 2013 2014 2015
Monitoring Wells Investigated (includes sampled and dry wells)
810 779 930 1005 1088 1054 1060 575 560 562 1083 640 578 606 899 906
Sampled 362 437 457 496 582 519 521 515 541 551 590 584 544 386 387 374
Dry Wells 448 342 473 509 506 535 552 59 19 11 493 56 34 36 512 532
Nitrate-N detections >/= 0.02 mg/L 328 425 442 482 495 485 506 497 529 526 528 515 530 373 378 355
Nitrate-N >/= 10 mg/L (Includes 1st and re-sample events)
90 138 192 210 215 213 232 234 259 271 272 292 304 362 184 155
Nitrate-N < 0.02 mg/l N/A N/A N/A N/A N/A N/A N/A N/A N/A N/A N/A 10 10 13 7 29
Ammonium-N detections >/= 0.11 mg/L 7 34 68 35 29 25 48 25 28 23 25 29 17 23 17 16
Ammonium-N >/= 1 mg/L (Includes 1st and re-sample events)
3 17 16 8 12 10 12 7 6 10 7 6 10 11 4 5
Ammonium-N < 0.11 mg/L N/A N/A N/A N/A N/A N/A N/A N/A N/A N/A N/A 375 389 363 368 345
Total P detections (>/= 0.02 mg/L) 341 327 351 362 391 382 368 360 396 396 380 391 389 377 376 363
Total P > 0.5 mg/L 35 33 75 85 130 76 71 78 72 78 91 155 132 178 134 166
Total P < 0.02 mg/L N/A N/A N/A N/A N/A N/A N/A N/A N/A N/A N/A 19 17 9 9 16
Wells with fecal coliform (FEC) N/A N/A 13 12 14 12 19 16 11 18 17 12 13 12 15 6
Wells w/3 or more FEC colonies N/A N/A N/A N/A N/A N/A 11 8 7 15 9 7 7 6 9 3
Status of Water Quality Monitoring in Oklahoma: Surface Water Monitoring Strategy Document 49
Oklahoma Corporation Commission
TYPES OF ENVIRONMENTAL WATER QUALITY MONITORING: The Corporation Commission (Corp. Comm.) does three types of surface water environmental monitoring:
1. Stream, pond, and spring sampling at Brownfields sites, where there could be residual pollution because of the prior property use;
2. Stream, pond, and spring water sampling near obvious spills, purging wells, and other ongoing or catastrophic pollution sources, to determine their impacts;
3. Stream, pond, and spring sampling around pits and producing locations, where there have been allegations of pollution, to determine the extent and possible sources;
The Oil and Gas Division performed 7,581 surface water sampling events of record since 1996.
Corp Comm. continues to perform and work with partners on general stream water quality and standards sampling. Currently, the majority of Corp Comm.’s surface water sampling has been in relation to nearby pollution cases, due to budgetary constraints. However, Corp Comm. performed 135 surface water sampling events in 2014-2015. All surface water sampling results are considered in making recommendations and providing support for water quality decisions for the Integrated Report, including the 303(d) impaired stream listings.
The Corporation Commission (Corp. Comm.) also does ground water monitoring, in two Divisions:
1. The Oil and Gas Conservation Division Has 2,765 ground water samples across the state taken since 1987 from private and public water wells, springs, seeps, groundwater monitoring borings and wells, from producing and injection wells, and (rarely) sumps and other odd places:
a. There are 2,184 water samples from public and private water wells, agricultural (irrigation and animal drinking water) wells, springs, and seeps. These are most often taken in response to a pollution complaint or because of a spring/well’s proximity to spill sites or old oilfields with known pollution problems.
b. In addition to the above, at exploration, production, and pipeline sites where there has been a significant spill or a leak, 450 water samples were taken from borings, trenches, and (mostly) groundwater monitoring wells installed across the site to determine the extent of any groundwater pollution plume, and to monitor the effectiveness of the cleanup. There is also some ongoing groundwater monitoring around pits and other potential sources.
c. We have also taken 109 water samples from produced water in oil and gas and injection wells, and from a few cathodic wells. Produced water samples are taken to “fingerprint” the most likely sources of a nearby spill by looking at characteristic compound ratios, to determine the source(s) and spill liability.
2. The Petroleum Storage Tank Division requires monitoring:
a. Around all newly installed underground storage tanks, including interstitial, vapor, and/or groundwater monitoring. If petroleum turns up in these monitoring points, there has been a tank or line leak, which lets many problems be discovered before significant amounts have impacted groundwater.
b. When there has been a spill or a leak at a gasoline or diesel station. Groundwater monitoring wells are installed across the site to determine the extent of any groundwater pollution plume and to monitor the effectiveness of the cleanup.
Status of Water Quality Monitoring in Oklahoma: Surface Water Monitoring Strategy Document 50
Grand River Dam Authority
In 2004, the Grand River Dam Authority (GRDA) created the department of Ecosystems and Lake Management to act at stewards of the natural resources and waters of the Grand River. Upon Completion of the Water Quality Research Lab at the Ecosystems and Education Center in 2010, water quality monitoring has been a priority for GRDA. Partnerships forged with Oklahoma State University and the University of Oklahoma has led to graduate research on nutrient limitation of algae, internal phosphorus loading, heavy metals contamination, and storm water runoff. Partnerships with state agencies have led to improved oxygen conditions in the tailraces of GRDA hydroelectric facilities. Further research and cooperation is expected to aid GRDA in future management decisions to fulfill its mission as a conservation and reclamation district for the waters of the Grand River.
WATER QUALITY MONITORING PROGRAM The water quality monitoring program was established in 2011 to monitor water conditions in Grand Lake O’ the Cherokees, data generated by this program will provide future researchers with a comprehensive water quality database and can be used in future policy and lake management decisions.
Sampling of GRDA lakes occurs twice a month during the summer season (May-September) and once a month during the winter season (October-May). Water is collected from 15 locations on Grand Lake, six locations on Lake Hudson, and three locations on W.R. Holloway. Samples are tested for nitrogen and phosphorus species, bacteria, blue green algae, and various other physical and chemical parameters. The most recent data are displayed publicly on the GRDA website (www.grda.com/water-quality-map/) on the water quality map page.
Bacteria Management Plan Currently we are continuing to collaborate with all of the other state agencies, University of Oklahoma, Oklahoma State University, and several Native American tribes towards the continued development and fine-tuning of GRDA’s Bacteria Management Plan for Designated Swimming Areas in the Grand River Watershed. This plan provides additional guidelines for body contact in the designated swimming areas and parks in cases where bacteria sources can be ascertained to further protect and assess risk to health and public safety.
CURRENT ACTIVITIES Oklahoma State University (OSU) & GRDA OSU and GRDA are partnering in 2016 and 2017 to evaluate nutrient limitation in Grand Lake by constructing in lake microcosms along the river reservoir gradient. Building off previous research completed by OSU and GRDA which examined nutrient limitation in the laboratory, this work will evaluate how both algae and zooplankton communities change as a result to additions of nitrogen, phosphorus, and iron in the field.
OSU and GRDA are also partnering in the summer of 2016 and 2017 to investigate metals contamination. Researchers plan on investigating whether or not populations of snails in Grand Lake exhibit mechanisms of tolerance to elevated metals contamination as a result of chronic toxicity. Describing the presence or absence of tolerant populations may provide insight into historic and future hazards posed by trace metal contamination in Grand Lake.
OSU and GRDA have been partnering since 2015 on a graduate student project to assess the zooplankton communities on Grand Lake.
OSU and GRDA have been partnering since 2015 to estimate the non-market value for Grand Lake and to estimate the Lake Amenity Value to Residential Homes.
Status of Water Quality Monitoring in Oklahoma: Surface Water Monitoring Strategy Document 51
OSU and GRDA have been partnering since 2015 to assess the bacterial communities associated with phytoplankton blooms. This is an undergraduate project.
University of Oklahoma (OU) & GRDA Ongoing 5-year project: A Watershed Approach to Ecosystems Conservation, Management and Restoration: Support for Grand Lake o' the Cherokees Watershed Planning. GRDA has identified three objectives in the watershed approach to conservation and restoration:
• Provide watershed conservation and restoration research projects throughout the Grand Lake Watershed
• Provide higher education opportunities by providing support for graduate students, paid seasonal internships within GRDA’s Office of Ecosystems Management, and on-site classes and training programs offered through university extension services
• Facilitate cooperation and partnerships between stakeholders and resource professionals from Grand Lake’s multi-jurisdictional watershed by providing for increased synergism and partnering across state lines.
Within this project are nine goals that are working simultaneously, but in concert with one another.
• Multidisciplinary/multi-entity team building: A multidisciplinary team of environmental scientists and engineers, ecologists, resource managers and watershed stakeholders will be established to evaluate pertinent environmental quality issues in the Grand Lake watershed.
• Data compilation: Existing data will be gathered to comprehensively address Grand Lake watershed issues and direct future investments in data collection. These data may include water quality data, hydrologic data, geospatial data and any other relevant data. A data compilation report will be provided to the multidisciplinary/multi-entity team for comment and concurrence before final publication as a "State of the Watershed Report", able to be updated on a regular basis.
• Hydrologic Modeling: Previous models using a Hydraulic Engineering Center-River Analysis System (HEC-RAS) examination focusing on the effects of manipulation of water levels at Pensacola Dam in the month of August on river flooding near Miami, OK have identified several areas of future work, including i) repeating the modeling efforts using more advanced software as it becomes available, ii) use of updated bathymetry data sets, iii) use of a two-dimensional or three-dimensional (including unsteady flow) model, iv) use of updated stage vs. storage curves Grand Lake, and v) specific investigation of the nine bridges in the Miami area on water surface elevations. The previous comprehensive HEC-RAS model will serve as a base model for further modeling efforts. Similar efforts may be completed for additional river reaches. It may be modified and expanded to examine river dynamics upstream of Miami, incorporating lands included in GRDA's CSERRA. Evaluation of the likely effects of large-scale riparian and marsh wetland restoration efforts may be completed.
• Watershed and Reservoir Water Quality: An initial subtask is formulation of a logical classification scheme in order to better organize land use within the watershed. A comprehensive water quality/water quantity sampling and analysis effort will be developed to critically evaluate pollutant mass loading and support overall project goals. Although current sampling endeavors focus on the reservoir itself or specific stream reaches, no comprehensive watershed-scale effort has been completed. Based on the results of data compilation efforts (Task 2) and in coordination with modeling efforts (Tasks 3 and 5), critical areas for further investigation will be identified. This will include deployment of buoys, gages, etc...
Status of Water Quality Monitoring in Oklahoma: Surface Water Monitoring Strategy Document 52
• Watershed Spatial and Biogeochemical Modeling: It is anticipated that targeted areas, developed in conjunction with the data compilation task and GAP analyses, will be identified for further study. A goal of this task is to utilize an unmanned aerial system (UAS; i.e., a drone) to collect necessary aerial imagery in these targeted areas in support of watershed conservation, management and restoration studies in the Grand Lake watershed.
• Chemical Biomarker Identification: In context of the main focus of GRDA’s water quality monitoring and state standards for body contact in designated swimming areas in the Grand River watershed, fecal contamination, evaluated by Fecal Indicator Bacteria, is considered as a major issue. Our organic geochemistry group provides a chemical approach for examining fecal sterol fingerprints to determine the major source(s) of fecal contamination in the watershed. The results obtained regarding the source(s) can be compared with those obtained by molecular approaches (DNA), which will be carried out by GRDA.
• Map and Data Portal: Visualization of data collected from Grand Lake will be beneficial to everyone including researchers, policy makers, recreational fisherman, and general public. The data collected at Grand Lake comes from various sources including field sampling, in-situ sensors, satellite remote sensing data, image captures from location cameras, and information obtained from lake users. With the implementation of various models the captured raw data are further processed and output data are sent to the visualization system. The components of the proposed portal consists of a backend database system, a frontend graphical user interface system that supports a wide-variety of devices, and a middleware that communicates between what the user sees and the database system. The proposed visualization system will consists of a map interface, reporting tables, and charts. The map interface that we will consider will be Google maps.
• Support for GRDA Relicensing: It is anticipated that GRDA will identify and task OU to complete work related to supporting the re-licensure efforts as needs become known. This task will occur in the latter years (Years 3-5) of the proposed project.
• Public Communications Workshops: The ultimate goal of the proposed project is to provide support for GRDA to collaboratively meet watershed conservation, management and restoration objectives. A critical factor in meeting these objectives is to effectively communicate complex environmental information to a diverse set of watershed stakeholders. Therefore, a series of public communication workshops will be supported throughout the watershed, bringing together experts in watershed science, water quality, limnology, environmental science and engineering, climate change, environmental policy and economics.
• Lake Modeling Using Satellite Imagery
GRDA is partnering with Dr. Bob Nairn as he uses our lab in his capstone class. In this class, OU senior environmental science and engineering capstone class students have been working on designs for a mine water passive treatment system to address the Southeast Commerce discharge.
OU is partnering with OU graduate student Jessica Beyer on her project: Testing for cryptic diversity within Grand Lake rotifers.
Graduate student Project with Bob Lynch’s student Evan Robinson. Likely using existing data that has been accumulated by Native American tribes in the watershed to do some sort of assessment of health risk.
Arkansas Tech University ATU and GRDA are partnering on a project to assess the composition of phytoplankton communities across a spatial and time gradient. This is an undergraduate research project.
Status of Water Quality Monitoring in Oklahoma: Surface Water Monitoring Strategy Document 53
Oklahoma Water Resources Board & GRDA OWRB and GRDA continue to work together to monitor the effectiveness of different dissolved oxygen mitigation strategies in the tail races of the Pensacola Dam (Grand Lake) and Markham Ferry Dam (Lake Hudson).
ODEQ, OWRB, & Parsons GRDA is partnering with ODEQ, OWRB, & Parsons to develop a new TMDL. This requires data compilation and quality assurance. SWAT & EFDC modeling, watershed loading/water quality Modeling, will define our water quality target, provide information for management strategies and implementation (and modeling of them), and a cost benefit analysis.
RCPP GRDA is partnering with the Oklahoma Conservation Commission, Kansas Parks and Wildlife and many others to implement BMPs through local stakeholders in an effort to stabilize stream banks and reduce sedimentation and nutrients.
USE SUPPORT ASSESSMENT PROTOCOLS The Oklahoma Water Resources Board (OWRB) in conjunction with the various state environmental agencies has worked to develop use support assessment protocols (USAP) to ensure that agencies are making use support determinations based on comparable decision criteria. The most recently approved USAP language is included below. The USAP as it currently exists represents a significant step forward in the states monitoring initiatives and continued development and refinement of the protocols will result in the collection of quality data by all monitoring parties and will hopefully also serve as a template for the state’s tribal programs to build upon.
The rule went through the public participation requirements associated with Oklahoma’s OWQS setting process. The rule outlines how use support determinations are to be made and is utilized by all parties making use support determinations. Chapter 15 of the rule is the USAP2. Where the USAP is silent on a use support determination, then Oklahoma’s Continuing Planning Process3 (CPP) Document addresses the issue.
QUALITY ASSURANCE/QUALITY CONTROL PROCEDURES All data collected by the OWRB, OCC and ODEQ for beneficial use assessment purposes is covered by an EPA approved Quality Assurance Project Plan (QAPP). For detailed information on agency quality assurance and quality control procedures, please contact the appropriate agency for a copy of their QAPP documents and/or their Standard Operating Procedures (SOP) documents.
2 To view the USAP language please select the hyperlink - http://www.owrb.ok.gov/util/rules/pdf_rul/current/Ch46.pdf 3 To view the 2012 CPP language please select the hyperlink - http://www.deq.state.ok.us/wqdnew/305b_303d/Final%20CPP.pdf
Status of Water Quality Monitoring in Oklahoma: Surface Water Monitoring Strategy Document 54
Appendix A – Oklahoma Environmental Agency Statutory Authorities
Oklahoma Statutes Citationized Title 27A. Environment and Natural Resources Chapter 1 - Oklahoma Environmental Quality Act Article III - Jurisdiction of Environmental Agencies Section 1-3-101 - Responsibilities and Jurisdiction of State Environmental Agencies § 1-3-101. Responsibilities and Jurisdiction of State Environmental Agencies
A. The provisions of this section specify the jurisdictional areas of responsibility for each state environmental agency and state agencies with limited environmental responsibility. The jurisdictional areas of environmental responsibility specified in this section shall be in addition to those otherwise provided by law and assigned to the specific state environmental agency; provided that any rule, interagency agreement or executive order enacted or entered into prior to the effective date of this section which conflicts with the assignment of jurisdictional environmental responsibilities specified by this section is hereby superseded. The provisions of this subsection shall not nullify any financial obligation arising from services rendered pursuant to any interagency agreement or executive order entered into prior to July 1, 1993, nor nullify any obligations or agreements with private persons or parties entered into with any state environmental agency before July 1, 1993.
B. Department of Environmental Quality. The Department of Environmental Quality shall have the following jurisdictional areas of environmental responsibility:
1. All point source discharges of pollutants and storm water to waters of the state which originate from municipal, industrial, commercial, mining, transportation and utilities, construction, trade, real estate and finance, services, public administration, manufacturing and other sources, facilities and activities, except as provided in subsections D and E of this section;
2. All nonpoint source discharges and pollution except as provided in subsections D, E and F of this section;
3. Technical lead agency for point source, nonpoint source and storm water pollution control programs funded under Section 106 of the federal Clean Water Act, for areas within the Department’s jurisdiction as provided in this subsection;
4. Surface water and groundwater quality and protection and water quality certifications;
5. Waterworks and wastewater works operator certification;
6. Public and private water supplies;
7. Underground injection control pursuant to the federal Safe Drinking Water Act and 40 CFR Parts 144 through 148, except for Class II injection wells, Class V injection wells utilized in the remediation of groundwater associated with underground or aboveground storage tanks regulated by the Corporation Commission, and those wells used for the recovery, injection or disposal of mineral brines as defined in the Oklahoma Brine Development Act regulated by the Commission;
8. Air quality under the federal Clean Air Act and applicable state law, except for indoor air quality and asbestos as regulated for worker safety by the federal Occupational Safety and Health Act and by Chapter 11 of Title 40 of the Oklahoma Statutes;
9. Hazardous waste and solid waste, including industrial, commercial and municipal waste;
Status of Water Quality Monitoring in Oklahoma: Surface Water Monitoring Strategy Document 55
10. Superfund responsibilities of the state under the Comprehensive Environmental Response, Compensation and Liability Act of 1980 and amendments thereto, except the planning requirements of Title III of the Superfund Amendment and Reauthorization Act of 1986;
11. Radioactive waste and all regulatory activities for the use of atomic energy and sources of radiation except for the use of sources of radiation by diagnostic x-ray facilities;
12. Water, waste, and wastewater treatment systems including, but not limited to, septic tanks or other public or private waste disposal systems;
13. Emergency response as specified by law;
14. Environmental laboratory services and laboratory certification;
15. Hazardous substances other than branding, package and labeling requirements;
16. Freshwater wellhead protection;
17. Groundwater protection for activities subject to the jurisdictional areas of environmental responsibility of the Department;
18. Utilization and enforcement of Oklahoma Water Quality Standards and implementation documents;
19. Environmental regulation of any entity or activity, and the prevention, control and abatement of any pollution, not subject to the specific statutory authority of another state environmental agency;
20. Development and maintenance of a computerized information system relating to water quality pursuant to Section 1-4-107 of this title; and
21. Development and promulgation of a Water Quality Standards Implementation Plan pursuant to Section 1-1-202 of this title for its jurisdictional area of environmental responsibility.
C. Oklahoma Water Resources Board. The Oklahoma Water Resources Board shall have the following jurisdictional areas of environmental responsibility:
1. Water quantity including, but not limited to, water rights, surface water and underground water, planning, and interstate stream compacts;
2. Weather modification;
3. Dam safety;
4. Flood plain management;
5. State water/wastewater loans and grants revolving fund and other related financial aid programs;
6. Administration of the federal State Revolving Fund Program including, but not limited to, making application for and receiving capitalization grant awards, wastewater prioritization for funding, technical project reviews, environmental review process, and financial review and administration;
7. Water well drillers/pump installers licensing;
Status of Water Quality Monitoring in Oklahoma: Surface Water Monitoring Strategy Document 56
8. Technical lead agency for clean lakes eligible for funding under Section 314 of the federal Clean Water Act or other applicable sections of the federal Clean Water Act or other subsequent state and federal clean lakes programs; administration of a state program for assessing, monitoring, studying and restoring Oklahoma lakes with administration to include, but not be limited to, receipt and expenditure of funds from federal, state and private sources for clean lakes and implementation of a volunteer monitoring program to assess and monitor state water resources, provided such funds from federal Clean Water Act sources are administered and disbursed by the Office of the Secretary of Environment;
9. Statewide water quality standards and their accompanying use support assessment protocols, anti-degradation policy and implementation, and policies generally affecting Oklahoma Water Quality Standards application and implementation including but not limited to mixing zones, low flows and variances or any modification or change thereof pursuant to Section 1085.30 of Title 82 of the Oklahoma Statutes;
10. Groundwater protection for activities subject to the jurisdictional areas of environmental responsibility of the Board;
11. Development and promulgation of a Water Quality Standards Implementation Plan pursuant to Section 1-1-202 of this title for its jurisdictional area of environmental responsibility;
12. Development of classifications and identification of permitted uses of groundwater, in recognized water rights, and associated groundwater recharge areas;
13. Establishment and implementation of a statewide beneficial use monitoring program for waters of the state in coordination with the other state environmental agencies;
14. Coordination with other state environmental agencies and other public entities of water resource investigations conducted by the federal United States Geological Survey for water quality and quantity monitoring in the state; and
15. Development and submission of a report concerning the status of water quality monitoring in this state pursuant to Section 1-1-202 of this title.
D. Oklahoma Department of Agriculture, Food, and Forestry. 1. The Oklahoma Department of Agriculture, Food, and Forestry shall have the following jurisdictional areas of environmental responsibility except as provided in paragraph 2 of this subsection:
a. point source discharges and nonpoint source runoff from agricultural crop production, agricultural services, livestock production, silviculture, feed yards, livestock markets and animal waste,
b. pesticide control,
c. forestry and nurseries,
d. fertilizer,
e. facilities which store grain, feed, seed, fertilizer and agricultural chemicals,
f. dairy waste and wastewater associated with milk production facilities,
g. groundwater protection for activities subject to the jurisdictional areas of environmental responsibility of the Department,
h. utilization and enforcement of Oklahoma Water Quality Standards and implementation documents,
Status of Water Quality Monitoring in Oklahoma: Surface Water Monitoring Strategy Document 57
i. development and promulgation of a Water Quality Standards Implementation Plan pursuant to Section 1-1-202 of this title for its jurisdictional areas of environmental responsibility, and
j. storm water discharges for activities subject to the jurisdictional areas of environmental responsibility of the Department.
2. In addition to the jurisdictional areas of environmental responsibility specified in subsection B of this section, the Department of Environmental Quality shall have environmental jurisdiction over:
a. (1) commercial manufacturers of fertilizers, grain and feed products, and chemicals, and over manufacturing of food and kindred products, tobacco, paper, lumber, wood, textile mill and other agricultural products,
(2) slaughterhouses, but not including feedlots at these facilities, and
(3) aquaculture and fish hatcheries,
including, but not limited to, discharges of pollutants and storm water to waters of the state, surface impoundments and land application of wastes and sludge, and other pollution originating at these facilities, and
b. facilities which store grain, feed, seed, fertilizer, and agricultural chemicals that are required by federal NPDES regulations to obtain a permit for storm water discharges shall only be subject to the jurisdiction of the Department of Environmental Quality with respect to such storm water discharges.
E. Corporation Commission. 1. The Corporation Commission is hereby vested with exclusive jurisdiction, power and authority, and it shall be its duty to promulgate and enforce rules, and issue and enforce orders governing and regulating:
a. the conservation of oil and gas,
b. field operations for geologic and geophysical exploration for oil, gas and brine, including seismic survey wells, stratigraphic test wells and core test wells,
c. the exploration, drilling, development, producing or processing for oil and gas on the lease site,
d. the exploration, drilling, development, production and operation of wells used in connection with the recovery, injection or disposal of mineral brines,
e. reclaiming facilities only for the processing of salt water, crude oil, natural gas condensate and tank bottoms or basic sediment from crude oil tanks, pipelines, pits and equipment associated with the exploration, drilling, development, producing or transportation of oil or gas,
f. underground injection control pursuant to the federal Safe Drinking Water Act and 40 CFR Parts 144 through 148, of Class II injection wells, Class V injection wells utilized in the remediation of groundwater associated with underground or aboveground storage tanks regulated by the Commission, and those wells used for the recovery, injection or disposal of mineral brines as defined in the Oklahoma Brine Development Act. Any substance that the United States Environmental Protection Agency allows to be injected into a Class II well may continue to be so injected,
g. tank farms for storage of crude oil and petroleum products which are located outside the boundaries of refineries, petrochemical manufacturing plants, natural gas liquid extraction plants, or other facilities which are subject to the jurisdiction of the Department of Environmental Quality with regard to point source discharges,
Status of Water Quality Monitoring in Oklahoma: Surface Water Monitoring Strategy Document 58
h. the construction and operation of pipelines and associated rights-of-way, equipment, facilities or buildings used in the transportation of oil, gas, petroleum, petroleum products, anhydrous ammonia or mineral brine, or in the treatment of oil, gas or mineral brine during the course of transportation but not including line pipes in any:
(1) natural gas liquids extraction plant,
(2) refinery,
(3) reclaiming facility other than for those specified within subparagraph e of this subsection,
(4) mineral brine processing plant, and
(5) petrochemical manufacturing plant,
i. the handling, transportation, storage and disposition of saltwater, mineral brines, waste oil and other deleterious substances produced from or obtained or used in connection with the drilling, development, producing and operating of oil and gas wells, at:
(1) any facility or activity specifically listed in paragraphs 1 and 2 of this subsection as being subject to the jurisdiction of the Commission, and
(2) other oil and gas extraction facilities and activities,
j. spills of deleterious substances associated with facilities and activities specified in paragraph 1 of this subsection or associated with other oil and gas extraction facilities and activities,
k. subsurface storage of oil, natural gas and liquefied petroleum gas in geologic strata,
l. groundwater protection for activities subject to the jurisdictional areas of environmental responsibility of the Commission,
m. utilization and enforcement of Oklahoma Water Quality Standards and implementation documents, and
n. development and promulgation of a Water Quality Standards Implementation Plan pursuant to Section 1-1-202 of this title for its jurisdictional areas of environmental responsibility.
2. The exclusive jurisdiction, power and authority of the Commission shall also extend to the construction, operation, maintenance, site remediation, closure and abandonment of the facilities and activities described in paragraph 1 of this subsection.
3. When a deleterious substance from a Commission-regulated facility or activity enters a point source discharge of pollutants or storm water from a facility or activity regulated by the Department of Environmental Quality, the Department shall have sole jurisdiction over the point source discharge of the commingled pollutants and storm water from the two facilities or activities insofar as Department-regulated facilities and activities are concerned.
4. For purposes of the federal Clean Water Act, any facility or activity which is subject to the jurisdiction of the Commission pursuant to paragraph 1 of this subsection and any other oil and gas extraction facility or activity which requires a permit for the discharge of a pollutant or storm water to waters of the United States shall be subject to the direct jurisdiction of the federal Environmental Protection Agency and shall not be required to be permitted by the Department of Environmental Quality or the Commission for such discharge.
Status of Water Quality Monitoring in Oklahoma: Surface Water Monitoring Strategy Document 59
5. The Commission shall have jurisdiction over:
a. underground storage tanks that contain antifreeze, motor oil, motor fuel, gasoline, kerosene, diesel, or aviation fuel and that are not located at refineries or at the upstream or intermediate shipment points of pipeline operations, including, but not limited to, tanks from which these materials are dispensed into vehicles, or tanks used in wholesale or bulk distribution activities, as well as leaks from pumps, hoses, dispensers, and other ancillary equipment associated with the tanks, whether above the ground or below; provided, that any point source discharge of a pollutant to waters of the United States during site remediation or the off-site disposal of contaminated soil, media, or debris shall be regulated by the Department of Environmental Quality,
b. aboveground storage tanks that contain antifreeze, motor oil, motor fuel, gasoline, kerosene, diesel, or aviation fuel and that are not located at refineries or at the upstream or intermediate shipment points of pipeline operations, including, but not limited to, tanks from which these materials are dispensed into vehicles, or tanks used in wholesale or bulk distribution activities, as well as leaks from pumps, hoses, dispensers, and other ancillary equipment associated with the tanks, whether above the ground or below; provided, that any point source discharge of a pollutant to waters of the United States during site remediation or the off-site disposal of contaminated soil, media, or debris shall be regulated by the Department of Environmental Quality, and
c. the Petroleum Storage Tank Release Environmental Cleanup Indemnity Fund, the Oklahoma Petroleum Storage Tank Release Indemnity Program, and the Oklahoma Leaking Underground Storage Tank Trust Fund.
6. The Department of Environmental Quality shall have sole jurisdiction to regulate the transportation, discharge or release of deleterious substances or solid or hazardous waste or other pollutants from rolling stock and rail facilities.
7. The Department of Environmental Quality shall have sole environmental jurisdiction for point and nonpoint source discharges of pollutants and storm water to waters of the state from:
a. refineries, petrochemical manufacturing plants and natural gas liquid extraction plants,
b. manufacturing of equipment and products related to oil and gas,
c. bulk terminals, aboveground and underground storage tanks not subject to the jurisdiction of the Commission pursuant to this subsection, and
d. other facilities, activities and sources not subject to the jurisdiction of the Commission or the Oklahoma Department of Agriculture, Food, and Forestry as specified by this section.
8. The Department of Environmental Quality shall have sole environmental jurisdiction to regulate air emissions from all facilities and sources subject to operating permit requirements under Title V of the federal Clean Air Act as amended.
F. Oklahoma Conservation Commission. The Oklahoma Conservation Commission shall have the following jurisdictional areas of environmental responsibility:
1. Soil conservation, erosion control and nonpoint source management except as otherwise provided by law;
2. Monitoring, evaluation and assessment of waters to determine the condition of streams and rivers being impacted by nonpoint source pollution. In carrying out this area of responsibility, the Oklahoma Conservation Commission shall serve as the technical lead agency for nonpoint source categories as defined in Section 319 of the federal Clean Water Act or other subsequent federal or state nonpoint source programs, except for activities related to industrial and municipal storm water or as otherwise provided by state law;
3. Wetlands strategy;
Status of Water Quality Monitoring in Oklahoma: Surface Water Monitoring Strategy Document 60
4. Abandoned mine reclamation;
5. Cost-share program for land use activities;
6. Assessment and conservation plan development and implementation in watersheds of clean lakes, as specified by law;
7. Complaint data management;
8. Coordination of environmental and natural resources education;
9. Federal upstream flood control program;
10. Groundwater protection for activities subject to the jurisdictional areas of environmental responsibility of the Commission;
11. Development and promulgation of a Water Quality Standards Implementation Plan pursuant to Section 1-1-202 of this title for its jurisdictional areas of environmental responsibility; and
12. Utilization of Oklahoma Water Quality Standards and Implementation documents.
G. Department of Mines. The Department of Mines shall have the following jurisdictional areas of environmental responsibility:
1. Mining regulation;
2. Mining reclamation of active mines;
3. Groundwater protection for activities subject to the jurisdictional areas of environmental responsibility of the Commission; and
4. Development and promulgation of a Water Quality Standards Implementation Plan pursuant to Section 1-1-202 of this title for its jurisdictional areas of responsibility.
H. Department of Wildlife Conservation. The Department of Wildlife Conservation shall have the following jurisdictional areas of environmental responsibilities:
1. Investigating wildlife kills;
2. Wildlife protection and seeking wildlife damage claims; and
3. Development and promulgation of a Water Quality Standards Implementation Plan pursuant to Section 1-1-202 of this title for its jurisdictional areas of environmental responsibility.
I. Department of Public Safety. The Department of Public Safety shall have the following jurisdictional areas of environmental responsibilities:
1. Hazardous waste, substances and material transportation inspections as authorized by the Hazardous Materials Transportation Act; and
2. Inspection and audit activities of hazardous waste and materials carriers and handlers as authorized by the Hazardous Materials Transportation Act.
Status of Water Quality Monitoring in Oklahoma: Surface Water Monitoring Strategy Document 61
J. Department of Labor. The Department of Labor shall have the following jurisdictional areas of environmental responsibility:
1. Regulation of asbestos in the workplace pursuant to Chapter 11 of Title 40 of the Oklahoma Statutes;
2. Asbestos monitoring in public and private buildings; and
3. Indoor air quality as regulated under the authority of the Oklahoma Occupational Health and Safety Standards Act, except for those indoor air quality issues specifically authorized to be regulated by another agency.
Such programs shall be a function of the Department’s occupational safety and health jurisdiction.
K. Oklahoma Department of Emergency Management. The Oklahoma Department of Emergency Management shall have the following jurisdictional areas of environmental responsibilities:
1. Coordination of all emergency resources and activities relating to threats to citizens’ lives and property pursuant to the Oklahoma Emergency Resources Management Act of 1967;
2. Administer and enforce the planning requirements of Title III of the Superfund Amendments and Reauthorization Act of 1986 and develop such other emergency operations plans that will enable the state to prepare for, respond to, recover from and mitigate potential environmental emergencies and disasters pursuant to the Oklahoma Hazardous Materials Planning and Notification Act;
3. Administer and conduct periodic exercises of emergency operations plans provided for in this subsection pursuant to the Oklahoma Emergency Resources Management Act of 1967;
4. Administer and facilitate hazardous materials training for state and local emergency planners and first responders pursuant to the Oklahoma Emergency Resources Management Act of 1967; and
5. Maintain a computerized emergency information system allowing state and local access to information regarding hazardous materials’ location, quantity and potential threat.
Historical Data
Added by Laws 1992, HB 2227, c. 398, § 6, emerg. eff. July 1, 1993; Amended by Laws 1993, HB 1002, c. 145, § 11, emerg. eff. July 1, 1993; Renumbered from 27A O.S. § 6 by Laws 1993, HB 1002, c. 145, § 359, emerg. eff. July 1, 1993; Amended by Laws 1993, SB 361, c. 324, § 6, emerg. eff. July 1, 1993; Amended by Laws 1994, HB 1916, c. 140, § 24, eff. September 1, 1994; Amended by Laws 1997, SB 365, c. 217, § 1, emerg. eff. July 1, 1997 (superseded document available); Amended by Laws 1999, SB 549, c. 413. § 4, eff. November 1, 1999 (superseded document available); Amended by Laws 2000, SB 1223, c. 364, § 1, emerg. eff. June 6, 2000 (superseded document available); Amended by Laws 2002, HB 2302, c. 397, § 1, eff. November 1, 2002 (superseded document available); Amended by Laws 2004, SB 1204, c. 100, § 2, emerg. eff. July 1, 2004; Amended by Laws 2004, HB 2616, c. 430, § 11, emerg. eff. June 4, 2004 (superseded document available).