water footprint - international environmental technology centre
TRANSCRIPT
Consultative Meeting on Water & Wastewater Management, 19 April, 2010 @UNEP/IETC, ILEC, Shiga, JAPAN
Water Footprint
Yoshihiro MIZUTANIDirector, Global Environment Centre FoundationOSAKA, JAPAN

Consultative Meeting on Water & Wastewater Management, 19 April, 2010 @UNEP/IETC, ILEC, Shiga, JAPAN
IETC-GEC Collaboration in water & wastewater area• Support for UNPE Iraqi marshlands project• Environmental Sound Technology database (NETT21)
Water pollution controlWater pollution continuous monitoring
• Water Footprint
Collaboration between UNEP/IETC & GEC

Consultative Meeting on Water & Wastewater Management, 19 April, 2010 @UNEP/IETC, ILEC, Shiga, JAPAN
CONTENTS
1. What is “Water Footprint”?
2. International interest in “Water Footprint”
3. Example of “Water Footprint”
4. Issues to be discussed
5. Move Forward

Consultative Meeting on Water & Wastewater Management, 19 April, 2010 @UNEP/IETC, ILEC, Shiga, JAPAN
1. What is “Water Footprint”?

Consultative Meeting on Water & Wastewater Management, 19 April, 2010 @UNEP/IETC, ILEC, Shiga, JAPAN
What is “Water Footprint”?
The water footprint is an indicator of freshwater use that looks at both direct and indirect water use of a consumer or producer.
The Concept of “water footprint” was introduced by Hoekstra in 2002.
The water footprint is a geographically explicit indicator, not only showing volumes of water use and pollution, but also the locations.
(Source: Water Footprint Manual, Nov. 2009)
Consultative Meeting on Water & Wastewater Management, 19 April, 2010 @UNEP/IETC, ILEC, Shiga, JAPAN
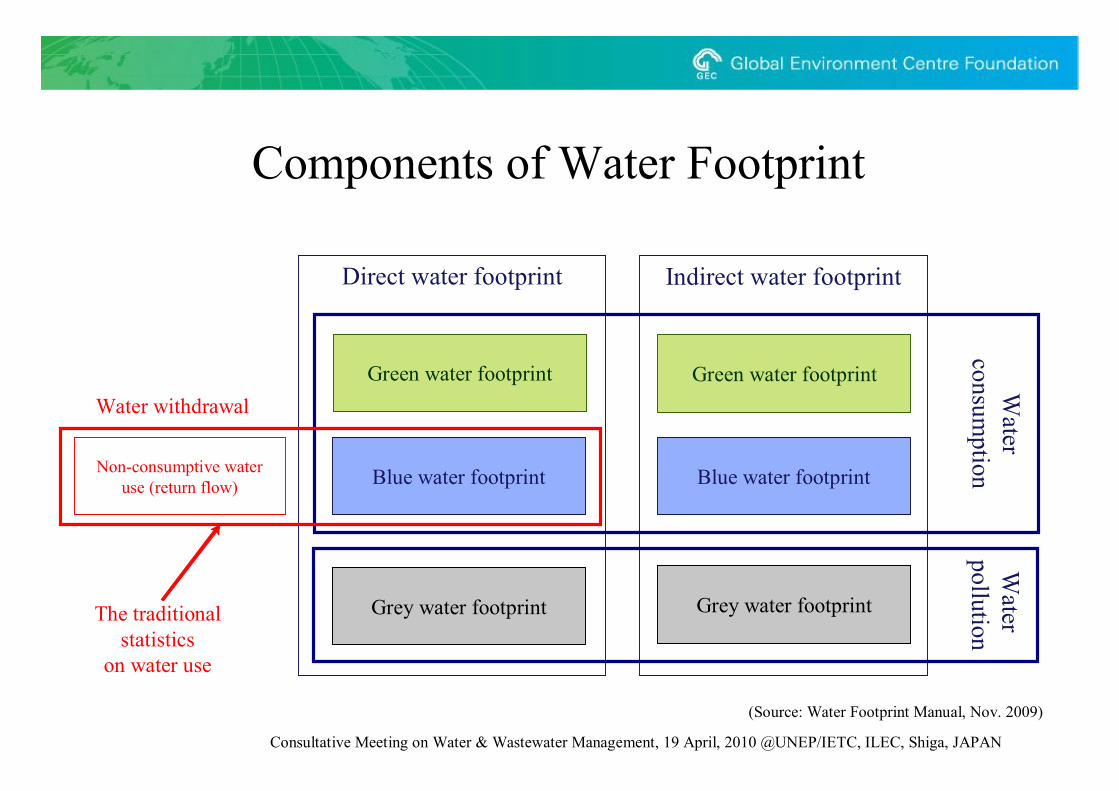
Components of Water Footprint
Direct water footprint Indirect water footprint
Green water footprint Green water footprint
Blue water footprint Blue water footprint
Grey water footprint Grey water footprint
Water
consumption
Water
pollution
Non-consumptive wateruse (return flow)
Water withdrawal
The traditionalstatistics
on water use
(Source: Water Footprint Manual, Nov. 2009)

Consultative Meeting on Water & Wastewater Management, 19 April, 2010 @UNEP/IETC, ILEC, Shiga, JAPAN
Meaning of each Water Footprint
Blue Water FootprintVolume of surface and groundwater consumed as a result of the production of a good or service. Consumption refers to the volume of freshwater used and then evaporated or incorporated into a product. It also includes water abstracted from surface or groundwater in a catchment and returned to another catchment or the sea. It is amount of water abstracted from ground- or surface water that does not return to the catchment from which it was withdrawn.
Green Water FootprintVolume of rainwater consumed during the production process. This is particularly relevant for agricultural and forestry products (products based on crops or wood), where it refers to the total rainwater evapotranspiration (from fields and plantations) plus the water incorporated into the harvested crop or wood.
Grey Water FootprintThe grey water footprint of a product is an indicator of freshwater pollution that can be associated with the production of a product over its full supply chain. It is defined as the volume of freshwater that is required to assimilate the load of pollutants based on existing ambient water quality standards. It is calculated as the volume of water that is required to dilute pollutants to such an extent that the quality of the water remains above agreed water quality standards.
(Source: Water Footprint Manual, Nov. 2009)
Consultative Meeting on Water & Wastewater Management, 19 April, 2010 @UNEP/IETC, ILEC, Shiga, JAPAN
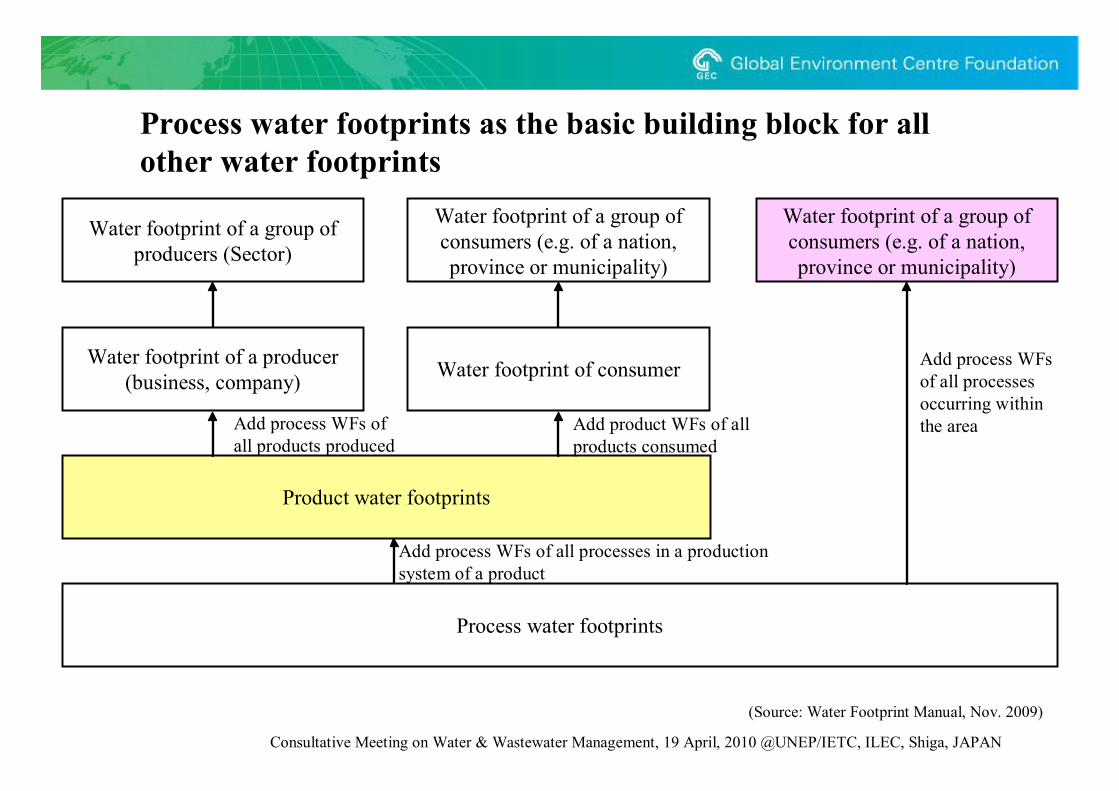
Water footprint of a group of producers (Sector)
Water footprint of a producer (business, company)
Water footprint of a group of consumers (e.g. of a nation, province or municipality)
Water footprint of consumer
Product water footprints
Process water footprints
Water footprint of a group of consumers (e.g. of a nation, province or municipality)
(Source: Water Footprint Manual, Nov. 2009)
Process water footprints as the basic building block for all other water footprints
Add process WFs of all processes in a production system of a product
Add process WFs of all products produced
Add product WFs of all products consumed
Add process WFs of all processes occurring within the area

Consultative Meeting on Water & Wastewater Management, 19 April, 2010 @UNEP/IETC, ILEC, Shiga, JAPAN
2. International interest in “Water Footprint”

Consultative Meeting on Water & Wastewater Management, 19 April, 2010 @UNEP/IETC, ILEC, Shiga, JAPAN
Toward International Standardization of “Water Footprint”
March 2009 New Work Item Proposal (NWIP) for WF was proposed by Switzerlandat ISO/TC207/SC5
June 2009 Working Group (ISO/TC207/SC5/WG8) was newly established for international standardization of WF
November 2009 1st WG8 meeting was held at Stockholm
July 2010 TC207 to be held in Mexico
Oct-Nov 2010 WG8 to be held

Consultative Meeting on Water & Wastewater Management, 19 April, 2010 @UNEP/IETC, ILEC, Shiga, JAPAN
Component 1: Refinement, promotion of methodologies and tools for application of water accounting / footprinting related concepts / tools (lead by UNEP SCP)Component 2: Applying water accounting/ footprinting related concepts & management tools in selected industry sectors (lead by UNEP SCP)Component 3: Using water accounting/ footprint and related concepts in financial sector (lead by UNEP FI) Component 4: Applying water accounting/ footprinting and related concepts in selected geographical locations (lead by UNEP IETC)
UNEP’s Activity on “Water Footprint”Water Footprint, Neutrality & Efficiency (WaFNE)Time frame: 3 years (2009/10 – 2012/13)Cost of project: 5,5 million US$Partners:UNEP: IETC, DTIE SCP Branch (Paris), UNEP Finance Initiative (Geneva)UN Global Compact – CEO Water MandateBusiness & Industry: participant companies, organizationsRelevant UN institutions, expert institutes & networks incl. UN-Waters, Pacific Institute, Water Footprint Network and UNEP/ SETAC Life Cycle Initiative
(Source: UNEP/IETC)

Consultative Meeting on Water & Wastewater Management, 19 April, 2010 @UNEP/IETC, ILEC, Shiga, JAPAN
• 2 pilot locations at national, regional or city level or some other defined area (watershed, catchment area) that is experiencing water scarcity and is highly water-stressed
• Activities:– Dialogue– Capacity building– Assessment and demonstration
• WF accounting• WF impact assessment• Reduction of the negative impacts of WFs• Offsetting the residual impacts of WFs
– Awareness raising and replication
Applying water footprinting and related concepts in selected geographical locations
UNEP/IETC’s Activity Under WaFNE
(Source: UNEP/IETC)

Consultative Meeting on Water & Wastewater Management, 19 April, 2010 @UNEP/IETC, ILEC, Shiga, JAPAN
3. Example of “Water Footprint”

Consultative Meeting on Water & Wastewater Management, 19 April, 2010 @UNEP/IETC, ILEC, Shiga, JAPAN
WF of a sugar-containing carbonated beverage ~ Example of WF~
(Source: A pilot in corporate water footprint accounting and impact assessment, A.E. Ercin, et al., Nov. 2009)
H2O
Sugar
Syrup
CO2
PETResin
Water treatment
Carbonator
Syrup Preparation
Proportioner
Closing
Cap(PE)
Labeling
GlueFilm (PP)
CartonPaper
Filler
BottleMaking Final Product
Overhead•Water consumption by employees•Water consumption or pollution as a result of water use in toilets, etc
Production system of the 0.5 L PET-bottleSugar-containing carbonated beverage
Production system of the 0.5 L PET-bottleSugar-containing carbonated beverage
CaffeinePhosphoric acidVanilla extractLemon oilOrange oil
Packing
Consultative Meeting on Water & Wastewater Management, 19 April, 2010 @UNEP/IETC, ILEC, Shiga, JAPAN
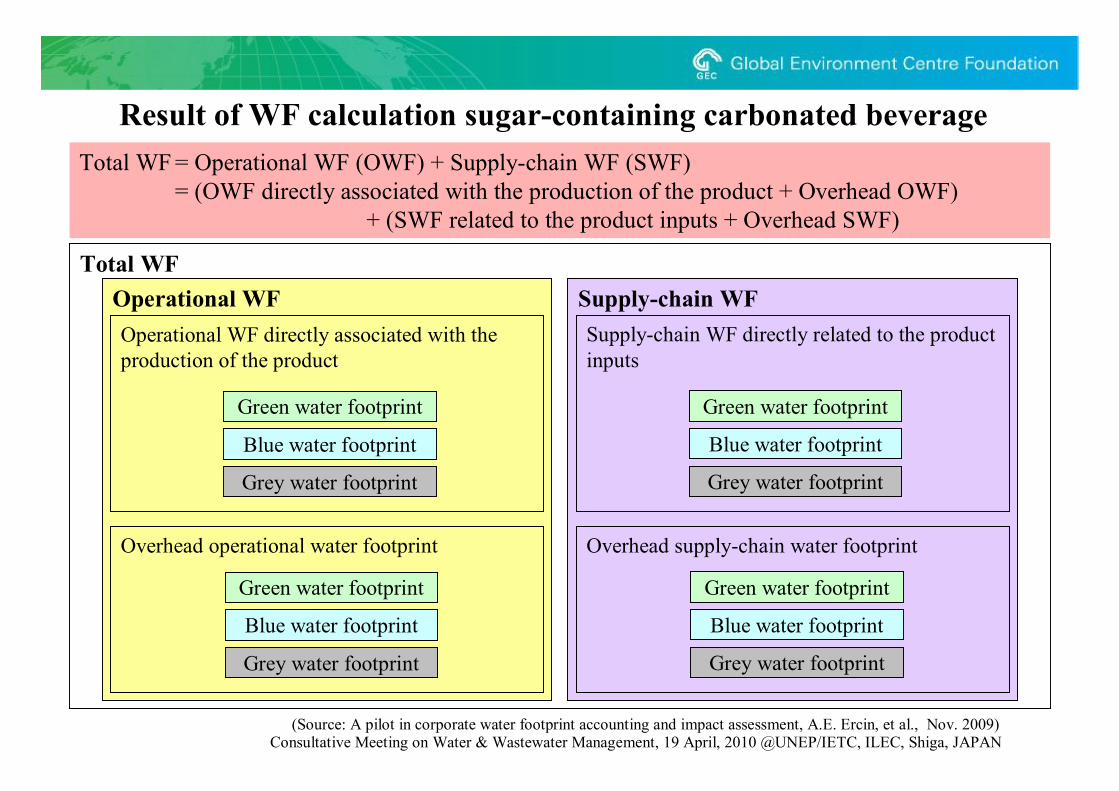
Supply-chain WFOperational WF
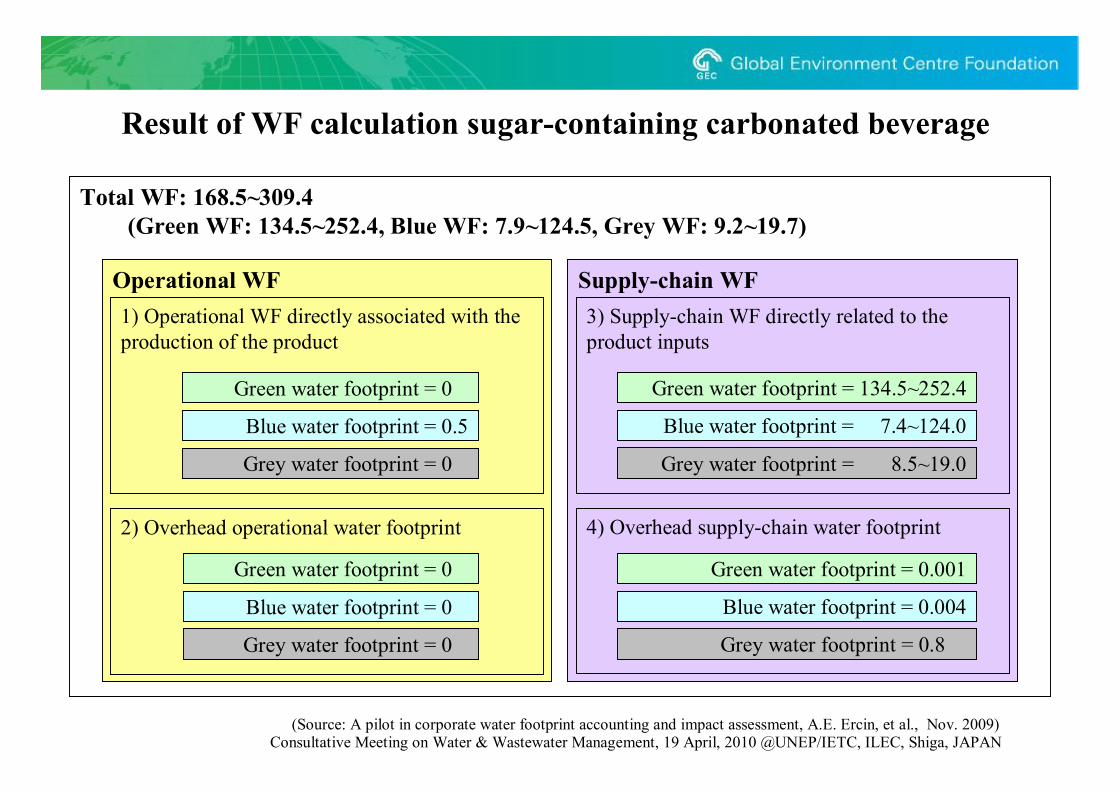
Result of WF calculation sugar-containing carbonated beverage Total WF = Operational WF (OWF) + Supply-chain WF (SWF)
= (OWF directly associated with the production of the product + Overhead OWF)+ (SWF related to the product inputs + Overhead SWF)
Green water footprint
Blue water footprint
Grey water footprint
Operational WF directly associated with the production of the product
Green water footprint
Blue water footprint
Grey water footprint
Overhead operational water footprint
Green water footprint
Blue water footprint
Grey water footprint
Supply-chain WF directly related to the product inputs
Green water footprint
Blue water footprint
Grey water footprint
Overhead supply-chain water footprint
Total WF
(Source: A pilot in corporate water footprint accounting and impact assessment, A.E. Ercin, et al., Nov. 2009)
Consultative Meeting on Water & Wastewater Management, 19 April, 2010 @UNEP/IETC, ILEC, Shiga, JAPAN
Supply-chain WFOperational WF
Result of WF calculation sugar-containing carbonated beverage
Green water footprint = 0
Blue water footprint = 0.5
Grey water footprint = 0
1) Operational WF directly associated with the production of the product
Green water footprint = 0
Blue water footprint = 0
Grey water footprint = 0
2) Overhead operational water footprint
Green water footprint = 134.5~252.4
Blue water footprint = 7.4~124.0
Grey water footprint = 8.5~19.0
3) Supply-chain WF directly related to the product inputs
Green water footprint = 0.001
Blue water footprint = 0.004
Grey water footprint = 0.8
4) Overhead supply-chain water footprint
Total WF: 168.5~309.4(Green WF: 134.5~252.4, Blue WF: 7.9~124.5, Grey WF: 9.2~19.7)
(Source: A pilot in corporate water footprint accounting and impact assessment, A.E. Ercin, et al., Nov. 2009)

Consultative Meeting on Water & Wastewater Management, 19 April, 2010 @UNEP/IETC, ILEC, Shiga, JAPAN
WF of a sugar-containing carbonated beverage ~ Example of WF~
Green Blue Grey Total
Direct water used for a 0.5 litre PET(as ingredient)
0 0.5 0 0.5
Net water used in production step 0 0 0 0
Bottle making 0 0 0 0
Bottle cleaning 0 0 0 0
Ingredients mixing 0 0 0 0
Packing 0 0 0 0
Sub-total 0 0.5 0 0.5
1) The operational WF directly associated with the production of the product
2) Overhead operational WFGreen Blue Grey Total
Domestic water consumption 0 0 0 0
Sub-total 0 0 0 0
(Source: A pilot in corporate water footprint accounting and impact assessment, A.E. Ercin, et al., Nov. 2009)

Consultative Meeting on Water & Wastewater Management, 19 April, 2010 @UNEP/IETC, ILEC, Shiga, JAPAN
WF of a sugar-containing carbonated beverage ~ Example of WF~
Green Blue Grey Total
Sugar 0-117.9 7.0-123.5 2.4-12.0 26.0-167.0
CO2 0 0.33 0 0.33
Phosphoric acid or citric acid 0 0 0 0
Caffeine 52.8 0 0 52.8
Vanilla extract 79.8 0 0 79.8
Lemon oil 0.01 0 0 0.01
Orange oil 0.9 0 0 0.9
Sub-total 133.4-251.3 7.2-123.8 2.4-12.9 159.8-300.8
3) Supply-chain WF directly related to the product inputsi) Ingredients of the product
(Source: A pilot in corporate water footprint accounting and impact assessment, A.E. Ercin, et al., Nov. 2009)

Consultative Meeting on Water & Wastewater Management, 19 April, 2010 @UNEP/IETC, ILEC, Shiga, JAPAN
WF of a sugar-containing carbonated beverage ~ Example of WF~
Green Blue Grey Total
Bottle -PET 0 0.2 4.4 4.5825
Closure- HDPE 0 0.03 0.68 0.7
Label – PP 0 0.003 0.068 0.07
Label glue (not included) 0 0 0 0
Packing material 0 0 0 0
Tray glue (not included) 0 0 0 0
Tray carton – paperboard 1 0 0.5 1.5
Tray shrink film – PE 0 0.02 0.36 0.38
Pallet stretch wrap – PE 0 0.003 0.054 0.057
Pallet label (2x) – coated paper 0.001 0 0.0004 0.0015
Pallet- painted wood 0.033 0 0.007 0.04
Sub-total 1.1 0.2 6.1 7.4
3) Supply-chain WF directly related to the product inputsii) Other components related to the product
(Source: A pilot in corporate water footprint accounting and impact assessment, A.E. Ercin, et al., Nov. 2009)

Consultative Meeting on Water & Wastewater Management, 19 April, 2010 @UNEP/IETC, ILEC, Shiga, JAPAN
WF of a sugar-containing carbonated beverage ~ Example of WF~
Beet Sugar Green Blue Grey Total
Iran 5.7 82.8 10.0 98.5
Russia 24.6 34.1 4.5 63.3
USA 14.7 30.1 6.4 51.2
Italy 18.6 20.8 7.1 46.5
Spain 10.0 23.1 9.7 42.8
France 11.7 9.5 6.2 27.4
Netherland 13.6 7.0 5.4 26.0
Ref) WF of the sugar input for a 0.5 litre PET bottle sugar containing carbonated beverage (1)
(Source: A pilot in corporate water footprint accounting and impact assessment, A.E. Ercin, et al., Nov. 2009)
Sugar Cane Green Blue Grey Total
Cuba 95.2 65.7 6.2 167.0
Pakistan 9.0 123.5 8.0 140.4
Brazil 35.3 26.6 2.4 64.3
India 26.2 47.9 4.6 78.6
Peru 0.0 41.3 2.6 43.9
USA 29.3 24.4 3.2 56.8
Consultative Meeting on Water & Wastewater Management, 19 April, 2010 @UNEP/IETC, ILEC, Shiga, JAPAN
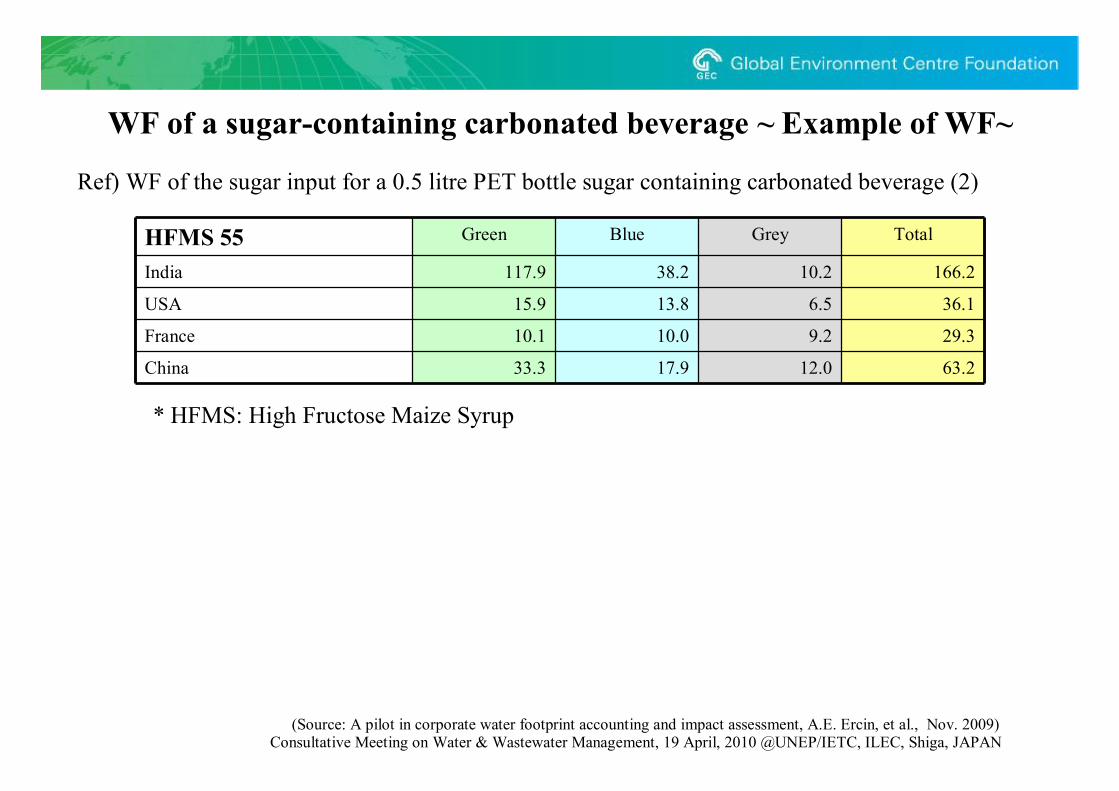
WF of a sugar-containing carbonated beverage ~ Example of WF~
HFMS 55 Green Blue Grey Total
India 117.9 38.2 10.2 166.2
USA 15.9 13.8 6.5 36.1
France 10.1 10.0 9.2 29.3
China 33.3 17.9 12.0 63.2
Ref) WF of the sugar input for a 0.5 litre PET bottle sugar containing carbonated beverage (2)
(Source: A pilot in corporate water footprint accounting and impact assessment, A.E. Ercin, et al., Nov. 2009)
* HFMS: High Fructose Maize Syrup

Consultative Meeting on Water & Wastewater Management, 19 April, 2010 @UNEP/IETC, ILEC, Shiga, JAPAN
WF of a sugar-containing carbonated beverage ~ Example of WF~
Green Blue Grey Total
Construction
Concrete 0 0 0.005 0.005
Steel 0 0.004 0.05 0.054
Paper 0.0012 0 0.0004 0.0016
Energy
Natural Gas 0 0 0.024 0.024
Electricity 0 0 0.13 0.13
Transportation
Vehicles 0 0.001 0.009 0.01
Fuel 0 0 0.5 0.5
Sub-total 0.001 0.004 0.8 0.8
4) Overhead supply-chain water footprint
(Source: A pilot in corporate water footprint accounting and impact assessment, A.E. Ercin, et al., Nov. 2009)
Consultative Meeting on Water & Wastewater Management, 19 April, 2010 @UNEP/IETC, ILEC, Shiga, JAPAN
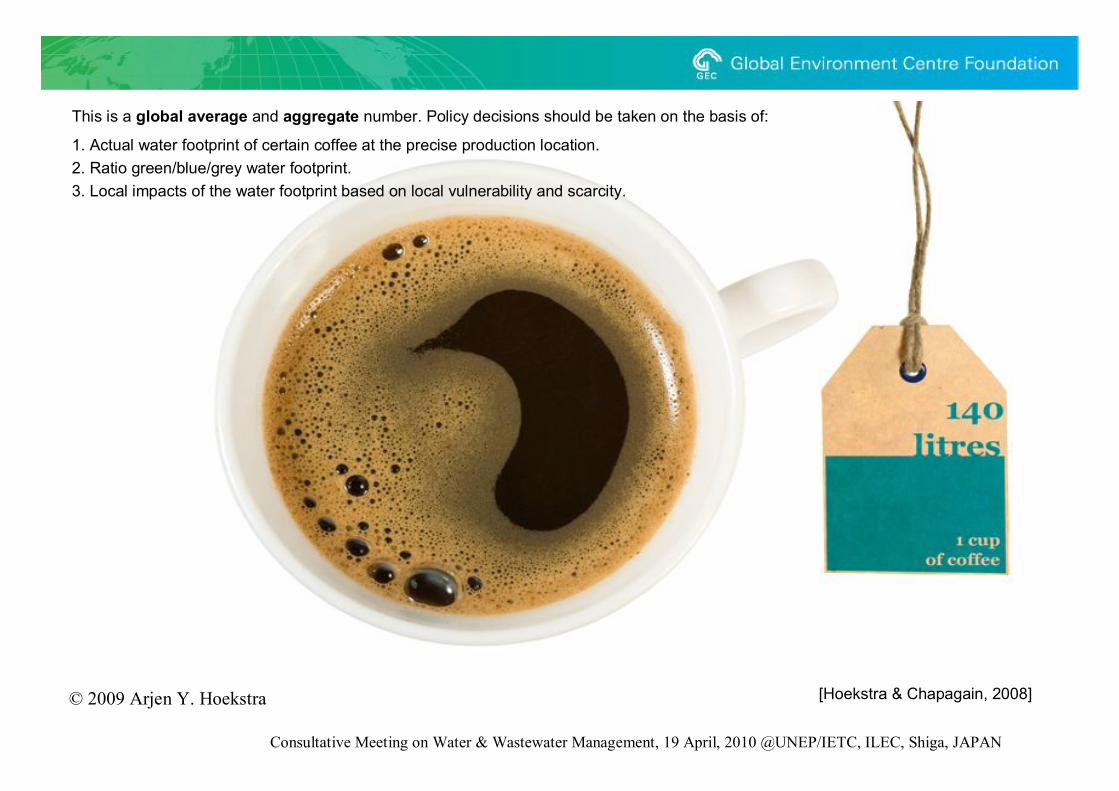
[Hoekstra & Chapagain, 2008]
This is a global average and aggregate number. Policy decisions should be taken on the basis of:
1. Actual water footprint of certain coffee at the precise production location.2. Ratio green/blue/grey water footprint.3. Local impacts of the water footprint based on local vulnerability and scarcity.
© 2009 Arjen Y. Hoekstra

Consultative Meeting on Water & Wastewater Management, 19 April, 2010 @UNEP/IETC, ILEC, Shiga, JAPAN
[Hoekstra & Chapagain, 2008]© 2009 Arjen Y. Hoekstra
Consultative Meeting on Water & Wastewater Management, 19 April, 2010 @UNEP/IETC, ILEC, Shiga, JAPAN
4. Issues to be discussed

Consultative Meeting on Water & Wastewater Management, 19 April, 2010 @UNEP/IETC, ILEC, Shiga, JAPAN
Issues to be discussed1. Total WF is defined as “Green WF + Blue WF + Grey WF”, but ?
• Both Green WF and Blue WF show amount of water consumption.• On the other hand, Grey WF indicates freshwater pollution.• Is it possible to add three of WF? What do you think?• WF can be used as “three dimensional indicator”, but not simple. How can each consumer choose a
good/service?2. What is WF used for?
• Process or product level A company/factory can check how much water can be saved compared to the previous year by
WF. A company/factory can show its eco-friendly attitude to a consumer by WF. However, we have to think about how WF assess water recovery/water saving practice.
• National or regional level WF of sugar cane in Peru is lower than that in Cuba. Can you say that Peru should produce more
sugar cane, or Cuba should produce other crops? A value of WF depends on local condition such as weather, consumption pattern, level of
agricultural technology, etc.3. Relation among Carbon Footprint, Ecological Footprint and Water Footprint
• If waste water treatment plant is installed in order to reduce grey water footprint, carbon footprint can increase. Is it OK?
• It is important to take a balance among above 3 footprints comprehensively. But how?

Consultative Meeting on Water & Wastewater Management, 19 April, 2010 @UNEP/IETC, ILEC, Shiga, JAPAN
5. Move Forward
Consultative Meeting on Water & Wastewater Management, 19 April, 2010 @UNEP/IETC, ILEC, Shiga, JAPAN
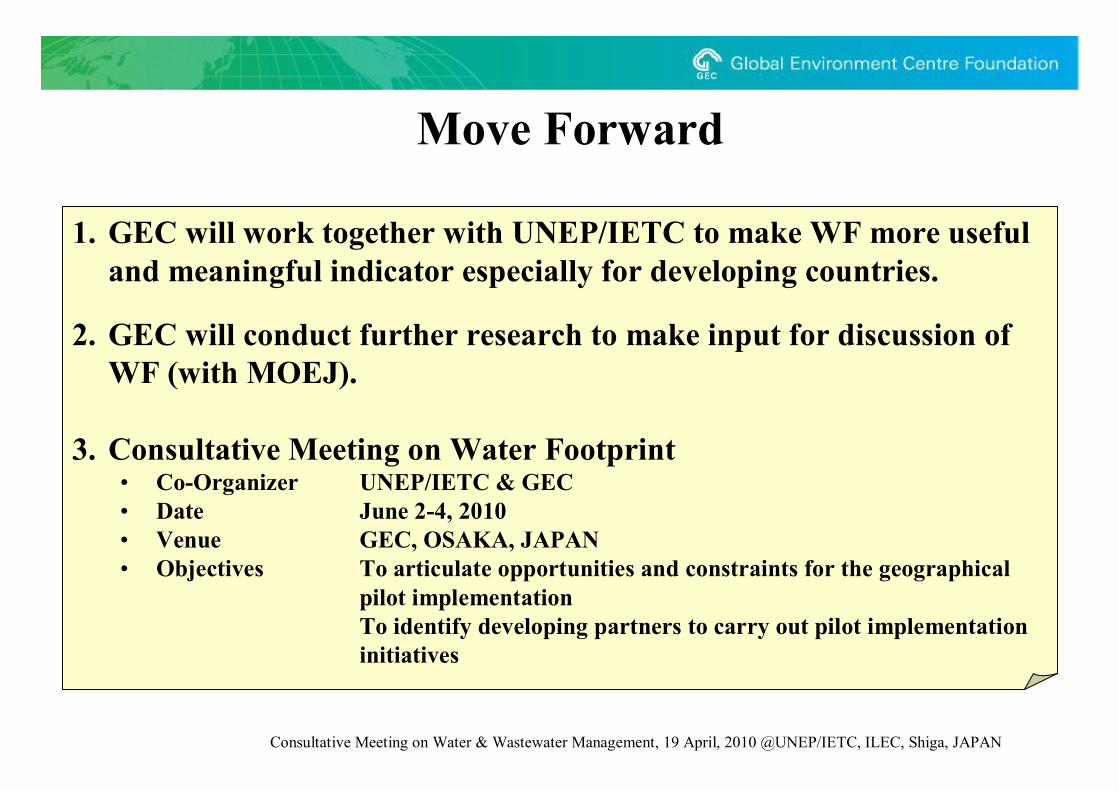
Move Forward
1. GEC will work together with UNEP/IETC to make WF more useful and meaningful indicator especially for developing countries.
2. GEC will conduct further research to make input for discussion of WF (with MOEJ).
3. Consultative Meeting on Water Footprint• Co-Organizer UNEP/IETC & GEC• Date June 2-4, 2010• Venue GEC, OSAKA, JAPAN• Objectives To articulate opportunities and constraints for the geographical
pilot implementationTo identify developing partners to carry out pilot implementation initiatives

Consultative Meeting on Water & Wastewater Management, 19 April, 2010 @UNEP/IETC, ILEC, Shiga, JAPAN
Global Environment Centre FoundationURL: http://gec.jp