water flow through geotextiles used to support a …
TRANSCRIPT

WATER FLOW THROUGH GEOTEXTILES USED TO SUPPORT
THE ROOT ZONE OF TURFGRASS ON SPORTS FIELDS
A Thesis
by
KEISHA MARIE ROSE-HARVEY
Submitted to the Office of Graduate Studies of Texas A&M University
in partial fulfillment of the requirements for the degree of
MASTER OF SCIENCE
August 2009
Major Subject: Water Management and Hydrological Science
WATER FLOW THROUGH GEOTEXTILES USED TO SUPPORT
THE ROOT ZONE OF TURFGRASS ON SPORTS FIELDS
A Thesis
by
KEISHA MARIE ROSE-HARVEY
Submitted to the Office of Graduate Studies of Texas A&M University
in partial fulfillment of the requirements for the degree of
MASTER OF SCIENCE
Approved by:
Chair of Committee, Kevin McInnes Committee Members, Anthony Cahill Richard White Intercollegiate Faculty Chair, Ronald Kaiser
August 2009
Major Subject: Water Management and Hydrological Science

iii
ABSTRACT
Water Flow Through Geotextiles Used to Support the Root Zone of Turfgrass on Sports
Fields. (August 2009)
Keisha Marie Rose-Harvey, B.Sc., University of the West Indies
Chair of Advisory Committee: Dr. Kevin McInnes
A sports field construction method that uses a geotextile to support the root zone
atop a synthetic drainage structure is an alternative to the common design that uses
gravel drainage material to support the root zone. A study was conducted to address the
concern that fine particles in the root zone may migrate under the influence of
percolating water, clog geotextile pores, and restrict the amount of water drained from a
sports field. In test columns, six root zone mixtures with different particle size
distributions were combined with ten geotextiles with different opening sizes to produce
60 replicated treatments. Water flow through the root zone mixture-geotextile
combinations in the test columns was evaluated over a six-month period. Change in
permeability was assessed by monitoring the temporal distribution of drainage from a
25-mm pulse of water applied to 300-mm deep root zone mixture in the test column.
Particles in drainage water were analyzed for size distribution. The study revealed that
drainage rates were affected more by drainage trough the root zone mixture than through
the geotextile. The amount and particle size distribution of particles in drainage water
were influenced more by root zone mixture than by geotextile. It appeared that in the

iv
establishment phase of a sports field that fine particles in the root zone may present more
of a problem to clogging of the root zone pores than clogging of the geotextile pores.

v
DEDICATION
This thesis is dedicated to the all knowing, ever present God. He is the one with
whom all knowledge and wisdom begins.

vi
ACKNOWLEDGEMENTS
I would like to express gratitude to my committee chair, Dr Kevin McInnes, for
his patience and guidance throughout this research program. I am also thankful to my
committee members, Dr. Richard White and Dr. Anthony Cahill, for their contributions
to the successful completion of my studies.
Thanks to everyone at Texas A&M University that helped to make my
experience a great journey and stepping stone to my future. Finally, but by no means
least I must say thanks to my husband who offered so much encouragement along the
way.

vii
NOMENCLATURE
AOS Apparent Opening Size
ASTM American Society of Testing and Materials
PA Polyamine
PE Polyethylene
PET Polyester
PP Polypropylene
PVC Polyvinylchloride
USGA United States Golf Association

viii
TABLE OF CONTENTS
Page
ABSTRACT .............................................................................................................. iii
DEDICATION ......................................................................................................... v
ACKNOWLEDGEMENTS ..................................................................................... vi
NOMENCLATURE ................................................................................................. vii
TABLE OF CONTENTS ......................................................................................... viii
LIST OF FIGURES .................................................................................................. x
LIST OF TABLES ................................................................................................... xii
CHAPTER
I INTRODUCTION ................................................................................ 1
Field Designs ……………………………………………………. 2 Geotextiles ………………………………………………………. 4 Geotextile Clogging ……………………………………………... 9 Research Objectives ……………………………………………... 13 II MATERIALS AND METHODS ........................................................ 15
Experimental Design …………………………………………….. 15 Characterization of Materials ……………………………………. 15 Root Zone Mixtures ……………………………………………… 17 Column Preparation …………………………………………….... 22 Irrigation and Data Collection …………………………………... 24 Statistical Analyses ……………………………………………… 26 III RESULTS AND DISCUSSION .......................................................... 28
General Temporal Changes in Drainage ………………………… 28 Statistical Analyses of Drainage ….……………………………... 33 Soil Particles in Drainage Water ………………………………… 42

ix
CHAPTER Page
IV CONCLUSIONS .................................................................................. 47
REFERENCES…………………………………………………………………….. 48
APPENDIX A ……………………………………………………………………... 51
APPENDIX B ..…………………………………………………………………...... 54
APPENDIX C …………………………………………………………………........ 57
APPENDIX D ……………………………………………………………………… 60
APPENDIX E ……………………………………………………………………… 63
APPENDIX F ……………………………………………………………………… 66
VITA ……………………………………………………………………………….. 68

x
LIST OF FIGURES
FIGURE Page
1 Schematic of USGA putting green design ................................................ 2 2 Schematic of Airfield Systems sports field design .................................... 4 3 Woven geotextile ....................................................................................... 5 4 Nonwoven needle punched geotextile ....................................................... 6 5 Spunbond geotextile ... ............................................................................... 7 6 Particle size distributions of root zone mixtures used in the experiment .. 17
7 Cross sectional schematic of an assembled test column …………………. 22
8 Typical cumulative drainage curves from the first measurement time ..…. 28
9 Water retention curves for root zones used in the study ………………….. 30
10 Average fraction drained over an hour for each geotextile in data collection time T1 …………………………………………………………. 31 11 Average fraction drained over an hour for each root zone mixture in data collection time T1 ………………………………………………….. 32 12 Relationship at T1 between fraction of water drained after 15-min and the manufacturers reported water flow rate of geotextiles ……………. 37 13 Relationship at T5 between fraction of water drained after 15-min and the manufacturers reported water flow rate of geotextiles ……………. 39 14 Fraction of water drained (%), over 1-h, from test columns containing root zone mixture M4 for all data collection periods and replicates .………. 41 15 Size distributions of particles in the drainage waters averaged across all geotextiles ……………………………………………………………….. 43 16 Size distributions of particles in drainage waters of root zone mixture M2 for each geotextile mixtures …………………........................................ 44

xi
FIGURE Page
17 Size distributions of particles in drainage waters averaged across all root zone mixtures .................................................................................... 46

xii
LIST OF TABLES
TABLE Page 1 Properties of the geotextiles used in the study ........................................... 16 2 Bulk densities of root zone mixtures ......................................................... 19 3 Saturated hydraulic conductivity and coefficient of particle size uniformity of root zones mixtures ............................................................ 29 4 Repeated measures analysis of variance on water drained from test columns from T1 to T5 for the first 15-min after 25 mm water application ……………………………………………………………….. 33 5 Repeated measures analysis of variance on water drained from test columns from T1 to T5 for the first 1-h after 25 mm water application ……………………………………………………………….. 34 6 Repeated measures analysis of variance on water drained from test columns from T2 to T5 for the first 24-h after 25 mm water application ………………………………………………………………... 34 7 Repeated measures analysis of variance on water drained from test columns from T1 to T5 for the first 15-min after 25 mm water application, replacing Geotextile with Geotextile Type …………………. 35 8 Repeated measures analysis of variance on water drained from test columns from T2 to T5 for the first 24-h after 25 mm water application, replacing Geotextile with Geotextile Type ………………….. 36 9 Repeated measures analysis of variance on water drained from test columns from T1 to T5 for the first 1-h after 25 mm water application, replacing Geotextile with Geotextile Type ………………….. 36 10 Pearson’s correlation coefficients between the fractions of water drained after 15-min and the manufacturers reported water flow rates for the geotextiles ………………………………………………………….. 38 11 Analysis of variance on the mass of particles in drainage water ………….. 42

xiii
TABLE Page 12 Analysis of variance on the d90 size of particles in drainage water ........... 45

1
CHAPTER I
INTRODUCTION
Sporting activities such as baseball, football, golf and soccer that are played on
turfgrass have become an integral part of American life. The large social and economic
investments into these activities necessitate durable, safe, and healthy field surfaces
(Brown and Duble, 1975; Puhalla et al., 1999).
High-quality, turfgrass-based fields should be resistant to compaction and drain
quickly after rainfall and irrigation events (Brown and Duble, 1975; Puhalla et al., 1999;
Taylor et al., 1997). Rapid drainage promotes healthy turfgrass growth, as plant roots
rely on adequate aeration and do not tolerate saturated conditions for extended periods of
time. Rapid drainage also ensures that play can be resumed soon after heavy rain or
irrigation. While rapid drainage is a necessity, it is also important that fields are capable
of storing adequate water for plant growth.
Sports field designers have experimented with various mixtures of soils, sands,
and organic materials to meet the requirements for drainage, compaction resistance,
aeration, and water-holding capacity. Because sand-based mixtures possess many of
these characteristics, they have become the most popular choice for sports fields (Puhalla
et al., 1999).
____________ This thesis follows the style of Crop Science.

2
Field Designs
The United States Golf Association (USGA) design for putting greens is a
popular sand-based design for other sports fields. Fields that are constructed according
to the USGA recommendations (USGA, 1993) have a sand-based root zone mixture
placed atop gravel drainage material, typically 30 cm over 10 cm, respectively (Figure
1).
Fig.1. Schematic of USGA putting green design.
Root Zone
Stabilized Base
Drain Pipe
Gravel

3
The gravel drainage layer is essential for the rapid lateral movement of water to
drainage pipes. When the root zone water is under tension the gravel layer slows
gravitational water loss due to an appreciably lower unsaturated hydraulic conductivity
in the gravel, than the sand, with increasing tension. The amount of water held in the
root zone is a function of the depth and particle size distribution of the gravel in the
drainage layer, as well as the particle size distribution of the root zone (Taylor et al.,
1993; Taylor et al., 1997). Water holding capacity of a given root zone is generally
greater in the presence of a coarse gravel layer than a fine gravel layer because the
unsaturated hydraulic conductivity of the coarse gravel drops faster with tension than it
does with fine gravel.
The gravel drainage layer may be replaced with other suitable materials or
structures. One such alternative (Airfield design, Airfield Systems, Edmund, OK)
utilizes a 25-mm thick plastic grid with large void spaces, and a geotextile to support the
root zone mixture atop the grid (Figure 2). The geotextile is chosen according to
considerations of both retention of the root zone mixture and permeability to water
(Giroud, 2005). The geotextile must retain the bulk of the root zone particles so as to
prevent the large drainage pores in the plastic grid from filling, while allowing migrating
fine particles to flow through so as not to clog the geotextile and restrict drainage from
the root zone (Luettich et al., 1992; Mlynarek et al., 1991; Sarsby, 2007). There are a
wide variety of commercially available geotextiles suitable to use in the Airfield design,
although none have been specifically manufactured for such use and few have been
tested in the design.

4
Fig.2. Schematic of Airfield Systems sports field design.
Geotextiles
Geotextiles are most often manufactured from synthetic materials. These
materials include filaments of the polymers polypropylene (PP), polyethylene (PE),
polyester (PET), polyamide (PA), and polyvinylchloride (PVC) (John, 1987; Koerner,
1998; Sarsby, 2007). These filaments are then woven, tangled, or bonded to form a
textile.
Woven geotextiles are produced mechanically by weaving monofilaments or
multifilaments (Figure 3). Nonwoven geotextiles have filaments that are chemically,
mechanically, or thermally bound. Filaments in chemically bonded nonwoven
Stabilized Base
Drain Pipe
PVC Liner
Plastic Grid
Geotextile
Root Zone

5
Fig.3. Woven geotextile (scale shown at the bottom is 1.6 mm between tick marks).
geotextiles are usually bound during the filament extrusion process by applying binding
agents such as acrylic resin (John, 1987; Koerner et al., 1993). Mechanically produced
nonwoven geotextiles have filaments that are entangled with barbed needles (needle
punched) or water jets (hydro-entangled). To make the needle punched fabrics,
reciprocating needle barbs are used to interlock and entangle a fibrous web of filaments.
Some needle punched geotextiles are further processed so that filaments on one or both

6
sides of the textile are thermally or chemically bonded. The end product of the needle
punch process is a felt-like textile (John, 1987; Koerner, 1998) (Figure 4). Nonwoven
Fig.4. Nonwoven needle punched geotextile (scale shown at the bottom is 1.6 mm between tick marks).
geotextiles that are thermally bonded are produced using a heated roller to partially melt
some filaments and bind to others where they touch (John, 1987). Nonwoven geotextiles
that are produced from monofilaments that are spun on to a table and then thermally or

7
chemically bonded are commonly referred to as spunbond geotextiles (Figure 5). Some
of the physical properties that are affected by the choice of manufacturing process
include strength, mass per unit area and thickness. Needle punched geotextiles are
Fig.5. Spunbond geotextile (scale shown at the bottom is 1.6 mm between tick marks).
usually thicker and have higher mass per unit area than spunbond geotextiles. Spunbond
geotextiles generally have higher strength than needle punched geotextiles (Koerner,

8
1998). The manufacturing process used also affects the size distribution of pores (voids)
in a geotextile. In general, the pores within a woven geotextile are more regularly
spaced than in a nonwoven type. In needle punched fabrics, the thickness of the material
influences its pore size distribution, but this not usually the case for spunbond materials
(Bhatia and Smith, 1995).
When choosing a geotextile for hydraulic applications such as in sports fields, it
is important to have information about its pore size distribution, as well as the particle
size distribution of the root zone mixture that it will support. Pore size distributions of
geotextiles have been evaluated by several methods. These methods include mercury
intrusion (Prapaharan et al., 1989), bubble pressure (Bhatia and Smith, 1995),
hydrodynamic sieving (Fayoux, 1977), and dry sieving (Gerry and Raymond, 1983).
The pore size distribution obtained is somewhat dependent on the method used and there
is considerable disagreement on which method produces the most accurate measure
(Bhatia and Smith, 1995). It is, however, common for pore size distribution to be
described by a particle retention criterion such as apparent opening size (AOS) that is
determined through dry sieving. The AOS refers to the diameter or width of a pore
(opening) where 95 % of the pores in the geotextile are smaller, often symbolized as O95.
To determine AOS, a geotextile specimen is placed in a frame, sized glass beads are
placed on the geotextile surface, and the geotextile and frame are shaken such that the
motion gives the beads the opportunity to pass through the test specimen. The procedure
is repeated on the same geotextile specimen with various size glass beads until the
diameter where 5% or less of the beads pass through the geotextile and may be

9
determined from a plot of percent passing vs. bead diameter (ASTM, 2004a). The
information obtained from this method essentially gives an estimate of the size of the
largest particle that can pass through the geotextile (Sarsby, 2007). In some cases, the
characteristic opening size is specified by an O50 or O90 value, referred to as an
equivalent opening size (EOS) (Sarsby, 2007). There are other important physical
properties that are determined for geotextiles, which may be important considerations for
hydraulic applications. This includes the determination of the water flow rates within
individual geotextiles (ASTM, 2004b).
Geotextile Clogging
The installation of a sport field that incorporates a geotextile and an engineered
synthetic drainage structure has its advantages and appeal. Because of the cost and time
required to construct a sports field, there has been concern about both the short and long-
term performance of such fields. Once a field has been put in place, the hope is that it
functions as intended, requires low maintenance (Brown and Duble, 1975), and has a
relatively long lifetime of usage. Of particular concern is whether the pores in the
installed geotextile will become clogged and restrict drainage of water from irrigation
and precipitation. Reduced drainage rate can lead to the partial or total failure of a field
through effects such as longer delays before play resumption, increased turfgrass
disease, and higher maintenance cost.
Clogging of geotextiles may be caused by combinations of chemical, biological
and physical processes. Flow of water within geotextiles can be altered if minerals or

10
chemicals precipitate or bacteria grow on or within the body of geotextiles (Koerner et
al., 1988; Rollin and Lombard, 1988). Such phenomena have been extensively studied
(de Mendonca and Ehrlich, 2006; de Mendonca et al., 2003; Palmeira et al., 2008). The
focus of the research described in this thesis was on physical clogging caused by
particles migrating to the geotextile from the root zone mixture.
Rollin and Lombard (1988) suggest that there are three physical mechanisms
through which particles can restrict water flowing through a geotextile: blocking,
blinding, and clogging. Blocking occurs when particles that have migrated to the media-
geotextile interface lodge themselves over pores in the geotextile. Blinding occurs when
particles that are larger than the geotextile pores trap finer particles, forming a layer that
has reduced permeability atop the geotextile (also called a cake layer) (Rollin and
Lombard, 1988). Rollin and Lombard (1988) subsequently differentiated these two
mechanisms from clogging where particles lodge within the pores of the geotextile body.
Some authors refer to all three mechanisms as clogging (e.g., Giroud, 2005), as will be
done in this thesis.
Tests to Assess Clogging
Clogging that occurs in an installed geotextile can cause it to lose an appreciable
fraction of its permeability, potentially leading to an expensive problem to correct. This
risk necessitates the evaluation of geotextiles to determine suitability for specific
applications under expected hydraulic conditions (Rollin and Lombard, 1988). Over the
past few decades several studies have been geared towards the design of tests that could

11
facilitate the evaluation of a geotextile’s potential to clog. These have taken the form of
laboratory and field investigations.
The Gradient Ratio (GR) test was developed by the United States Army Corp of
Engineers (USACE) to determine the compatibility of particular soil-geotextile
combinations (Koerner, 1998). In the GR test, soil is packed on top of a geotextile
sample that has been placed inside a vertical column. Water is allowed to flow through
the geotextile and soil samples for 24-h during which hydraulic head is measured at
several locations in the column (Rollin and Lombard, 1988). Hydraulic gradients are
calculated from the hydraulic heads. The GR value for the system is determined as the
ratio of the hydraulic gradient of the combined lower 25 mm of soil and geotextile and
the hydraulic gradient of the adjacent 50 mm of soil. The USACE has recommended
that GR be no more than 3. Values equal to or less than this are used to indicate a
compatible combination, one not likely to clog (Koerner, 1998). One of the main
advantages to the test is the relatively short time over which results can be obtained.
There are however several identifiable disadvantages such as, preferential flow along
the test column’s walls (Rollin and Lombard, 1988), piping of soil along the walls of the
test column, the occurrence of air pockets both in the soil and geotextile, and concerns
about the reliability of the GR value for long-term applications (Koerner, 1998).
Long-term filtration tests have been also used to evaluate the compatibility of
soil-geotextile combinations. The procedures used for these tests are similar to that used
for the GR test. The time over which the soil-geotextile system is evaluated is much

12
longer than 24-h, in some cases 1000-h (Koerner, 1998). Inflow of water is usually kept
at constant head and the permeability of the soil-geotextile system and the mass of the
particles that pass through the geotextile are noted. The test usually commences with a
loss of fine particles through the geotextile’s pores, which allows initial outflow rates to
be high (Rollin and Lombard, 1988). Over time, the test soil forms of a “soil cake” at
the soil-geotextile interface. This cake prevents the further loss of soil particles and
stabilizes outflow. Maximum clogging is thought to have occurred when the flow
becomes constant.
Other laboratory tests that can be used to assess the clogging potential of
geotextiles include the fine fraction filtration F3 test (Sansone and Koerner, 1992). As
indicated by its name, the entire particle size distribution of a soil is not used in this test,
but rather specific particle size ranges. These particles are usually made into slurry and
added to a test column that contains a geotextile specimen. The F3 test is deficient in
indicating geotextile behavior with an in situ soil. It is likely that an in situ soil would
prevent the immediate contact between most fine particles found within its body and the
geotextile. Sansone and Koerner (1992) identified this inherent problem and implied
that this test might not be suitable for situations where the geotextile is in intimate
contact with the soil placed above it.
While several short and long-term laboratory tests exist to evaluate clogging in
geotextiles, a very limited number of studies have attempted these evaluations in designs
and with materials used in sports fields. In a 12 year study, Callahan et al (2001)

13
assessed the performance of several geotextiles (woven and nonwoven) used as
separators between a single root zone mixture and a gravel sub-layer. The root zone
mixture used was chosen to meet USGA recommendations of 1973. Although
considerable particle migration through the root zone occurred, no significant levels of
geotextile clogging were observed (Callahan et al., 2001). It appears that more research
is warranted to evaluate geotextiles of various AOS and construction in combination
with root zone mixtures of different particle size distribution. This research would give
insight into the suitability of using geotextiles of a given AOS with root zone mixtures of
given particle-size distributions.
Research Objectives
The purpose of the study was to combine geotextiles of different construction
type and different pore-size distribution with root zone mixtures of varying particle-size
distributions, to assess the potential for clogging from fine particles (d<150 μm - very
fine sand, silt, and clay) that have been observed to migrate from root zone mixtures
under irrigation and rainfall events. The research was focused on the temporal changes
in drainage in the first six months of the establishment of a sports field. The specific
objectives were to:
• Evaluate the temporal changes in whole-system drainage rates from test columns
that contain a particular combination of one of 6 different root zone mixtures and
one of 10 geotextiles placed over a 25-mm deep plastic drainage grid.

14
• Assess whether any temporal changes in the fraction of water drained from these
test columns were due to clogging of geotextiles.

15
CHAPTER II
MATERIALS AND METHODS
Experimental Design
The study was conducted at Texas A&M University, College Station. Six root
zone mixtures, supported by a 25-mm deep porous grid, were combined with each of 10
different geotextiles (60 treatments) and replicated three times in test columns (180
columns). The root zone mixtures had systematic differences in particle size
distribution. The test columns were used to assess whether fines migrating with water
draining from the root zone mixtures during the establishment of a sports field would
clog the geotextiles. The study was carried out over a six month period from June to
December, 2008.
Characterization of Materials
Two woven, three spunbond, and five needle punched geotextiles were used in
the study. The manufacturer’s specifications for these geotextiles are shown in Table 1.
The six root zone mixtures were made from different ratios of three parent
materials, a sand meeting USGA recommendations PM1 (US Silica Company, Kosse,
Texas), a sand with fines (particles <150 µm) in excess of USGA recommendations PM2
(Living Earth, Houston, TX), and a sandy clay loam PM3 from a pasture near College
Station, TX. The particle size distributions of the sand portions of PM1 and PM2 were
determined by sieve analysis (Gee, 2002). The sieves used were: 2.0 mm (No.10), 1.0

16
mm (No. 18), 500 µm (No.35), 250 µm (No. 60), 150 µm (No. 100), and 106 µm (No.
140). The silt and clay fractions were washed through a 53 µm (No. 270) sieve and the
particle size distributions were analyzed with a laser particle size analyzer (Model
LS230, Beckman Coulter Inc., Fullerton, CA) calibrated with Coulter Latron™ 300 LS
control. The particle size distribution of PM3 was determined using the hydrometer
method (Gee, 2002).
Table 1. Properties of the geotextiles used in the study.
Distributor Geotextile Type†
Material‡
AOS
(mm) §
Thickness
(mm) ¶
Weight (g/m2)
Water Flow
Rate (mm/s) #
GSE Lining GSENW16 N PP 0.150 3.94 540 34
GSE Lining GSENW10 N PP 0.150 2.54 335 58
Propex NW401 N PP 0.212 NA 182 95
Propex NW1001 N PP 0.150 NA 346 58
Propex NW351 N PP 0.300 NA 169 102
Propex WM104F W PP 0.212 NA 215 12
TenCate FW404 W PP 0.425 0.89 298 48
Fiberweb 3301L S PP 0.3 NA 102 65
Fiberweb 3341G S PP 0.24 NA 115 58
Freudenberg Lutradur S P 0.198 0.59 130 157
† N- Nonwoven needle punched; W-Woven; S- Spunbond ‡ PP-Polypropylene; P-Polyester §AOS determined by ASTM D 4491-99a (2004a) ¶ NA- Not Available #Water Flow Rate determined by ASTM D 4751- 04 (2004b)

17
Root Zone Mixtures
Test Mixtures
Four mass-based root zone mixtures were made from PM1, PM2, and PM3.
Root zone mixture M1 was a 1:1 mixture of PM1:PM2, root zone mixture M2 was 9:1
mass-based mixture of PM1:PM3, root zone mixture M3 was a 9:1 mixture of PM2:PM3
and root zone mixture M4 was a 9:9:2 mixture of PM1:PM2:PM3. The different
mixtures were blended for 30-min in a cement mixer. Samples of the all the root zone
Fig.6. Particle size distributions of root zone mixtures used in the experiment.

18
mixtures were collected at the time of blending. The particle size distribution of the
sand portions were subsequently determined in the laboratory through dry sieving and
the silt and clay portions were determined with a laser particle size analyzer (Figure 6).
Determination of Bulk Densities to Pack Mixtures
One kg each of oven dried samples of PM1, PM2, and M1 were made to a
gravimetric water content of w=0.05 kg/kg. Two PVC cylinders of height 11 cm and
inner diameter of 7.6 cm were stacked - the bottom cylinder being pre-weighed. A 0.7
kg subsample of a root zone mixture was placed inside the cylinders. A drop-hammer
device with a flat, disk-shaped foot the diameter of the inside of the cylinders was used
to compact the samples according to USGA recommendations (USGA, 1993). A spatula
was used to separate the bottom and top cylinders, flush with the top surface of the
bottom cylinder. The mass of the wet sample in the cylinder was determined by
weighing the cylinder with sample and then subtracting the mass of the cylinder. The
total (wet) bulk density of the sample ρt was determined as:
where Mt is total mass of material and Vt is total volume of material. The dry bulk
density ρb was determined from the wet bulk density and the gravimetric water content
as:
1
19
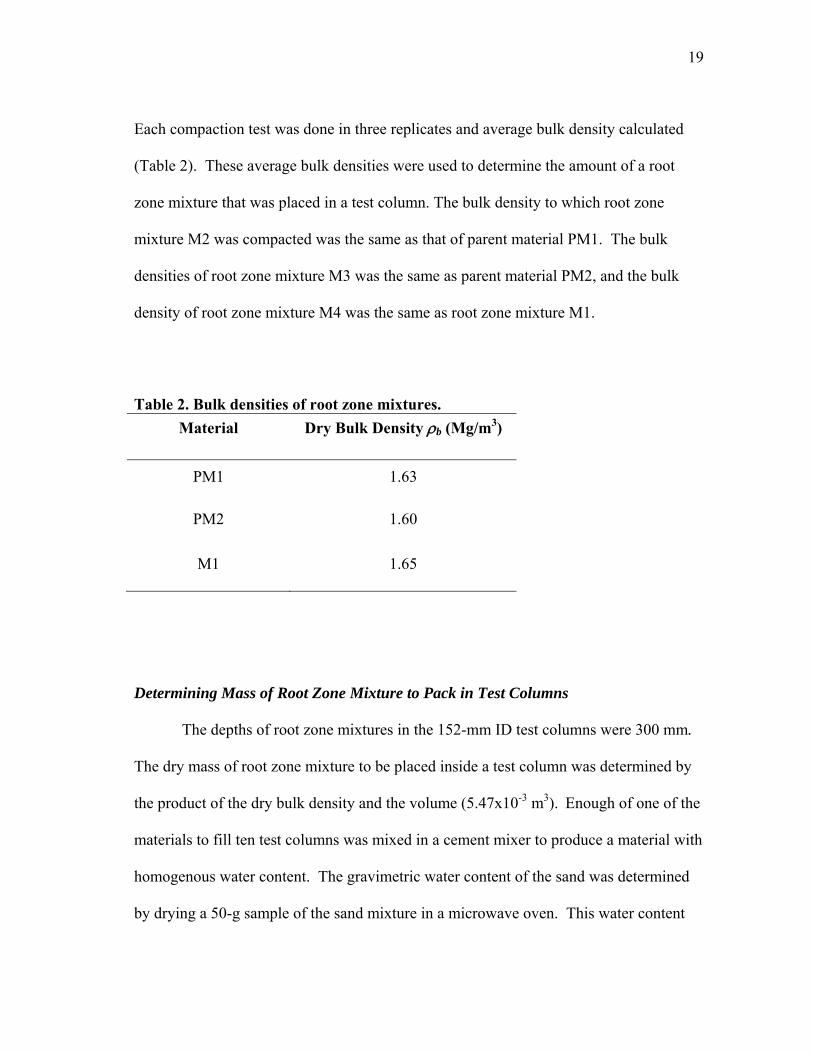
Each compaction test was done in three replicates and average bulk density calculated
(Table 2). These average bulk densities were used to determine the amount of a root
zone mixture that was placed in a test column. The bulk density to which root zone
mixture M2 was compacted was the same as that of parent material PM1. The bulk
densities of root zone mixture M3 was the same as parent material PM2, and the bulk
density of root zone mixture M4 was the same as root zone mixture M1.
Table 2. Bulk densities of root zone mixtures. Material Dry Bulk Density ρb (Mg/m3)
PM1 1.63
PM2 1.60
M1 1.65
Determining Mass of Root Zone Mixture to Pack in Test Columns
The depths of root zone mixtures in the 152-mm ID test columns were 300 mm.
The dry mass of root zone mixture to be placed inside a test column was determined by
the product of the dry bulk density and the volume (5.47x10⁻³ m3). Enough of one of the
materials to fill ten test columns was mixed in a cement mixer to produce a material with
homogenous water content. The gravimetric water content of the sand was determined
by drying a 50-g sample of the sand mixture in a microwave oven. This water content

20
was then used to calculate the amount of material to place in each column using the
relationship:
· 1
where Mw is the wet mass of material and Md is the dry mass of material to be added to
produce a desired dry bulk density.
This procedure was conducted because the containers of bulk parent material had
various amounts of water in them. When a root zone mixture was to be made from the
combination of several parent materials, the water contents of the individual parent
materials were determined separately. They were then mixed in the appropriate ratio
based on their individual water contents.
Determining the Saturated Hydraulic Conductivity
Seven hundred grams of root zone mixture was adjusted to a water content of
0.05 kg/kg and then compacted in a PVC permeameter with a 77 mm inner diameter and
110 mm height. The compaction was done with a drop-hammer device according to
USGA recommendations (USGA, 1993). The permeameter was subsequently placed on
top of a support screen in a funnel and water was applied to the root zone. The applied
water was maintained at constant depth above the root zone surface. The water that
drained through the root zone mixture was collected in a beaker and the time for a fixed
volume, typically 50 mL, to be collected was noted. This measured volume per time
was taken at 3 successive times after a steady flow rate was established. The saturated
hydraulic conductivity was determined as:

21
· · ·
where Ks is the saturated hydraulic conductivity, Vw is the volume of water collected over
time t, L is the depth of the root zone mixture in the permeameter and h is the depth of
water above the root zone mixture.
Determining Water Holding Capacity
Root zone mixture was compacted into six PVC cylinders of 77 mm inner
diameter and height 50 mm using a drop-hammer (USGA, 1993). The cylinders
containing the root zone was stacked on each other. An empty cylinder was placed on
top and then the 7 cylinders were then taped at the joints to make a single column. The
drop-hammer compactor was then placed into the top of the column and dropped to
create good contact between individual layers.
The resultant column was placed atop a piece of mesh and held vertical by a
clamp and stand. The root zone was then wetted from the top with three 600 mL
aliquots of water. Water was allowed to disappear from the top of the column before
each successive aliquot was added. The column was then covered with plastic to prevent
evaporation and allowed to stand for 24-h. This resultant soil column was then
segmented into six 50 mm layers and the root zone material in the top cylinder was
discarded. Each individual 50-mm layer of root zone material was weighed wet, dried at
105 °C and again weighed to determine the water content of each layer.

22
Column Preparation
Test columns were made from 150-mm diameter PVC sewer pipe that had been
cut to 350 mm lengths and fitted with flat-bottom PVC end caps (Figure 7). A 19-mm
Fig.7. Cross sectional schematic of an assembled test column.
drainage hole was drilled into the base of the PVC end cap. AirDrain® grids (Airfield
Systems, Edmond, OK) were cut to fit inside the PVC end cap. A circular piece of a
geotextile at least 40 mm larger diameter than the PVC pipe was placed over the open
Root zone mixture
PVC end cap
Geotextile
Outflow tube Drainage grid
Manometer- Tensiometer Porous Stone
PVC column
Hole

23
end of the cap and the PVC pipe was driven downward into the cap until it touched the
25-mm deep AirDrain® grid. In doing such, the geotextile was pulled tight atop the
AirDrain® grid and upward into the space between the pipe and cap, insuring that water
and fines leaving the column would pass through the geotextile. With the thicker
geotextiles, the inside diameter of the cap was enlarged using a lathe so that the
geotextile fit in the space between the cap and pipe. The small gap between the body of
the PVC pipe and the top of the end cap was sealed with caulking.
A manometer-tensiometer was constructed using a porous stone (aquarium
airstone) connected to clear plastic tubing. The porous stone had an air entry water
potential of about -70 mm water. A 6.4-mm hole was drilled into the side of the PVC
cap and cylinder, just above the top side of the geotextile. The porous stone was placed
on the top center of the geotextile and the connected plastic tubing was pushed through
the hole in the side of the PVC cap. Outside the column, the tubing was bent into a U-
shape so that it extended 30 mm below the height of the geotextile (the level of the
bottom of the cap) and about 200 mm above. The height of the geotextile (reference
point) was marked on the tube for subsequent observations of water pressure or tension
at the sand-geotextile interface. If a geotextile were to become clogged and limit flow
there would be a buildup in hydraulic pressure at the interface of the geotextile and the
root zone mixture as water passed through the test column. As a result, the water level
in the manometer would be observed to be above the height of the surface of the
geotextile. A hole was drilled through the side of the cap, into the area that contained
the drainage grid, to allow for ease of drainage and to facilitate the escape of air.

24
A predetermined mass of each root zone mixture (based on the compaction tests)
was packed into a test column, in three lifts to a total depth of 300 mm. The top of the
first and second lifts were scarified to reduce layering effects. After packing, the
columns were transported to the laboratory and placed on benches constructed with
spaces underneath to facilitate collection of drainage water and data acquisition.
Irrigation and Data Collection
Synthetic rainwater was manufactured according to the composition reported by
(Laegdsmand et al., 1999) and used throughout the duration of the experiment for all
regular irrigation and data collection. At the beginning of the experiment, the columns
were irrigated with 76.2 mm (3 inch) depth of water to facilitate saturation and initiate
drainage. Aliquots equaling a 6.4-mm depth of synthetic rainwater were applied by hand
every 15-min. In the first two weeks, the columns were irrigated with 19 mm (3/4 inch)
of water every other day to simulate heavy watering during the establishment of a
turfgrass cover. After two weeks the amount of water applied was reduced to half this
amount. This amount of water was also applied over a two week period until the amount
was once again halved. This resultant amount (4.8 mm, 3/16 inch) of irrigation was
maintained throughout the rest of the study. Evaporative losses were less than 2 mm of
water per day.
Drainage data collection began in July, 2008 and successive measurements were
taken in August, September, October and December of that same year. These were 27
days (T1), 54 days (T2), 88 days (T3), 116 days (T4) and 171 days (T5) from the

25
initiation of the experiment, respectively. The day preceding collection of flow data, the
columns were irrigated with 25 mm of water, delivered in equal aliquots at 15-min
intervals. After irrigation, the columns were covered with plastic bags to prevent
evaporation while they drained overnight. Immediately before data collection
commenced, the tensiometer-manometers were primed with 5 mL of water delivered
with a syringe. To collect drainage data from a particular column, 25 mm of synthetic
rain water was added to the top of the column instantaneously. Waters draining from
test columns were collected in plastic cups. Over a period of 1-h, the cumulative mass
of water that drained from the column was recorded on an electronic balance (Model
SP2001Ohaus Scout Pro, Ohaus, Pine Brook, NJ) connected to a computer through a
USB hub. Balance readings were recorded every five seconds over the hour-long
measurement period. Six columns were tested at a given time. During the tests the
water levels in the manometer-tensiometers were noted. Subsequent to the 1-h
measurements, the columns were allowed to drain for 24-h and the collected drainage
water was weighed. Evaporative water loss during a 1-h measurement was considered
negligible. The 24-h measurements were taken beginning in August and subsequently in
September, October and December, 2008. All the 24-h measurements were
subsequently corrected for evaporation.
Collection of Drainage Water and Analyses
As the plastic containers in which the drainage water was collected filled, the
suspended particles in the drainage water were flocculated with sodium chloride, and the

26
supernatant was siphoned off. Particles from subsequent drainage water were similarly
treated and added to previously flocculated material.
At 5 months into the study, the accumulated particles were dialyzed in a
membrane having a pore size range of 12 to14 kDa and a diameter of 29 mm
(Spectra/Por ® 4, Spectrum labs, Rancho Dominguez, California). The dialysis tubing
containing the particles was placed in a container of distilled water and the water was
periodically changed until the electrical conductivity was near that of the distilled water.
To prepare the samples for particle size analysis, the dialyzed particles were dispersed
with 10 mL of sodium meta-phosphate (50g/L) and mixed with a magnetic stirrer. A
pipette was used to place a subsample into the laser particle size analyzer. The
remaining particles were dried at 70 °C to remove excess water. The particles left after
this initial drying were dried at 105 °C and weighed.
Statistical Analyses
Repeated Measures Analysis of Variance was used to assess the 15-min, 1-h and
24-h drainage data obtained over the course of the study. This was done to assess what
effects the factors: Geotextile (individual geotextiles), Mixture (root zone mixture),
Replicate, and Time (time from initiation of study) had on drainage. The interactions:
Geotextile*Mixture, Mixture*Replicate and Geotextile*Replicate were also assessed. In
addition, repeated measures analysis of variance was used to assess the influence of
Geotextile Type (woven, needle punched, and spunbond) on drainage. The effect of

27
factors was considered to be significant when P ≤ 0.05. Posthoc tests were carried out
using Fisher’s Protected Least Significance test (P ≤ 0.05) to compare individual means.
Analysis of Variance was carried out on the mass of the fines and the d90 size of
particles which drained from the columns. This was done to assess the effect that the
factors: Geotextile and Mixture had on the amount and size of fines passing the
geotextiles. The statistical tests were performed using SPSS version 14.0 or 15.0 (SPSS
Inc, Chicago, Illinois).

28
CHAPTER III
RESULTS AND DISCUSSION
General Temporal Changes in Drainage
Fig.8. Typical cumulative drainage curves from the first measurement time.
The cumulative drainage from a particular treatment over the hour long
measurement period produced a curve showing a decline in drainage rate with time
(Figure 8). Two points were taken from each curve, the fraction of water drained after

29
15 and 60-min. These two points were used as a measure of the effect of a treatment and
used in statistical analyses.
The shapes of the cumulative drainage curves were determined by the hydraulic
and physical properties of the root zone mixtures. PM1 was the coarsest root zone
mixture as indicated by its particle size distribution (Figure 6). Its relatively large pores
transmitted water readily under saturated conditions (Table 3). However, this mixture
Table 3. Saturated hydraulic conductivity and coefficient of particle size uniformity of root zones mixtures.
Root zone mixture Saturated Hydraulic
Conductivity μm/s (in/h)
Coefficient of Uniformity†
PM1 330 (47) 2.55 PM2 38 (5.4) 3.17 M1 53 (7.5) 3.48 M2 58 (8.3) 4.35 M3 28 (4.0) 3.87 M4 10 (1.42) 5.96
† CU is a descriptor of the shape of a particle size distribution curve, calculated as d60/d10, where d60 is the diameter where 60% of particles are smaller and d10 is the size where 10 % of particles are smaller.
desaturated more quickly than the finer textured mixtures when subjected to increasing
water tension (Figure 9). It took over 30 mm water to saturate the drained PM1 profile
shown in Fig. 9 so the 25 mm of water applied to test this treatment never fully saturated
the profile and the drainage rate was always less than the saturated conductivity of 1.2
m/h. In comparison, PM2 was a finer textured root zone mixture. It took only a mm or
two of water to saturate the PM2 profile so the 25 mm of water produced an extended

30
drainage rate near its saturated conductivity, as indicated by the straight portion of the
PM2 curve between 2 and 8 minutes (Fig 8.). The constant slope of this portion of the
PM2 curve was equivalent to a drainage rate of 37μm/s. This agreed with the saturated
conductivity value in Table 3.
Fig.9. Water retention curves for root zones used in the study.

31
When drainage curves from a given data collection time were averaged across all
treatments which contained the same geotextile, the effect of geotextile on drainage
appeared minimal (Figure 10). On the contrary, the effect of root zone was considerable
as evidenced when the drainage curves were averaged across all treatments that
contained the same root zone mixture.
Fig.10. Average fraction drained over an hour for each geotextile in data collection time T1.

32
Fig.11. Average fraction drained over an hour for each root zone mixture in data collection time T1.

33
Statistical Analyses of Drainage
Repeated Measures Analysis of Variance was carried out on the fraction of the
25 mm of water drained in 15-min, 60-min and 24-h after application. Values were
analyzed for the effect of Mixture, Geotextile, Replicate and their respective two-way
interaction terms. Root zone mixture was the main influence on drainage regardless of
the time that had passed since the application of water, as indicated by the partial eta
squared values (Tables 4-6). Geotextile influence was not significant at 15-min (Table
4) or at 24-h (Table 6). However, geotextile influence was significant at 1-h after water
application (Table 5).
Table 4. Repeated measures analysis of variance on water drained from test columns from T1 to T5 for the first 15-min after 25 mm water application. Source Sum of
Squares Degrees
of Freedom
Mean Square
F Significance†
Partial Eta
Squared Intercept 3251000 1 3251000 24570 .000 .996
Mixture 106000 5 21200 160.2 .000 .899
Geotextile 2120 9 253.5 1.780 .083 .151
Replicate 2733 2 1367 10.33 .000 .187
Mixture X Geotextile 8902 45 197.8 1.495 .054 .428
Mixture X Replicate 299900 10 299900 226.6 .000 .962
Geotextile X Replicate 2202 18 122.3 .925 .552 .156
Error 11910 90 132.3
†Values < 0.05 are significant at P=0.05.

34
Table 5. Repeated measures analysis of variance on water drained from test columns from T1 to T5 for the first 1-h after 25 mm water application. Source Sum of
Squares Degrees
of Freedom
Mean Square
F Significance†
Partial Eta
Squared Intercept 5950000 1 5949000 51360 .000 .998
Mixture 37570 5 7514 64.88 .000 .783
Geotextile 2942 9 326.9 2.822 .006 .220
Replicate 4810 2 2405 20.76 .000 .316
Mixture X Geotextile 6693 45 148.7 1.284 .157 .391
Mixture X Replicate 149500 10 14950 129.1 .000 .935
Geotextile X Replicate 2587 18 143.7 1.241 .247 .199
Error 10420 90 115.8
†Values < 0.05 are significant at P=0.05.
Table 6. Repeated measures analysis of variance on water drained from test columns from T2 to T5 for the first 24-h after 25 mm water application. Source Sum of
Squares Degrees
of Freedom
Mean Square
F Significance†
Partial Eta
Squared Intercept 6036000 1 6036000 393400 .000 1.000
Mixture 978.9 5 195.8 12.76 .000 .441
Geotextile 166.2 9 18.46 1.203 .305 .118
Replicate 224.8 2 112.4 7.325 .001 .153
Mixture X Geotextile 576.4 45 12.81 .835 .743 .317
Mixture X Replicate 589.2 10 58.92 3.840 .000 .322
Geotextile X Replicate 540.3 18 30.02 1.956 .022 .303
Error 1243 81 15.35
†Values < 0.05 are significant at P=0.05.

35
When individual geotextile names were replaced by their Type (i.e. woven,
needle punched, and spunbond) and Repeated Measures Analysis of Variance carried out
on the drainage data, the analysis revealed that Geotextile Type was not a significant
influence on drainage at 15-min (Table 7) and 24-h (Table 8) after water application.
However, Geotextile Type did significantly influence drainage at 1-h (Table 9).
Table 7. Repeated measures analysis of variance on water drained from test columns from T1 to T5 for the first 15-min after 25 mm water application, replacing Geotextile with Geotextile Type. Source Sum of
Squares Degrees
of Freedom
Mean Square
F Significance†
Partial Eta
Squared Intercept 2856000 1 2856000 18830 .000 .992 Mixture 88500 5 17690 116.7 .000 .800 Replicate 2679 9 1339 8.831 .000 .108 Geotextile Type 414.5 2 207.2 1.366 .258 .018 Mixture X Geotextile Type
1632 10 163.2 1.076 .384 .069
Mixture X Replicate 299900 10 29990 197.7 .000 .931 Geotextile Type X Replicate
944.9 4 236.2 1.558 .189 .041
Error 22140 146 151.7
†Values < 0.05 are significant at P=0.05.

36
Table 8. Repeated measures analysis of variance on water drained from test columns from T2 to T5 for the first 24-h after 25 mm water application, replacing Geotextile with Geotextile Type. Source Sum of
Squares Degrees
of Freedom
Mean Square
F Significance†
Partial Eta
Squared Intercept 5385000 1 5385000 324000 .000 1.000
Mixture 900.9 5 180.2 10.84 .000 .283
Replicate 105.8 2 52.89 3.180 .045 .044
Geotextile Type 32.96 2 16.48 .991 .374 .014
Mixture X Geotextile Type
131.2 10 13.12 .789 .639 .054
Mixture X Replicate 630.3 10 63.03 3.791 .000 .217
Geotextile Type X Replicate
169.7 4 42.42 2.551 .042 .069
Error 2278 137 16.63
†Values < 0.05 are significant at P=0.05.
Table 9. Repeated measures analysis of variance on water drained from test columns from T1 to T5 for the first 1-h after 25 mm water application, replacing Geotextile with Geotextile Type. Source Sum of
Squares Degrees
of Freedom
Mean Square
F Significance†
Partial Eta
Squared Intercept 5253000 1 5253000 39760 .000 .996 Mixture 30700 5 6147 46.53 .000 .614 Replicate 4181 2 2090 15.83 .000 .178 Geotextile Type 1849 2 924.2 6.997 .001 .087 Mixture X Geotextile Type
1274 10 127.4 .965 .477 .062
Mixture X Replicate 149500 10 14950 113.2 .000 .886 Geotextile Type X Replicate
236.5 4 59.12 .448 .774 .012
Error 19300 146 132.1
†Values < 0.05 are significant at P=0.05.

37
Figure 12: Relationship at T1 between fraction of water drained after 15-min and the manufacturers reported water flow rate of geotextiles. Each point represents the fraction drained for one of the ten geotextiles averaged over a given root zone mixture.
The manufacturers’ reported flow rate for a geotextile had little influence on
drainage from the test columns. At T1, there was no significant correlation (P=0.05 or
P=0.1) between the amount of water that drained through a geotextile after 15-min and
the reported water flow rate of that geotextile (Figure 12 and Table 10). By the end of

38
the study, there was significant correlation (P=0.1) for PM1 and PM2 (Figure 13 and
Table 10).
Table 10. Pearson’s correlation coefficients between the fractions of water drained after 15-min and the manufacturers reported water flow rates for the geotextiles.
Rootzone Mixture
Pearson Correlation Coefficients, r †
T1 T2 T3 T4 T5
PM1 0.216 0.420 0.348 0.513 0.611
PM2 0.413 -0.186 -0.226 0.043 0.625
M1 -0.141 -0.022 0.032 0.162 0.389
M2 0.106 -0.099 -0.314 -0.345 -0.260
M3 -0.339 -0.136 -0.009 0.129 0.445
M4 -0.131 -0.260 -0.283 -0.346 -0.349
† For r ≥ 0.549 and r ≥ 0.632, the probability is .10 and .05 respectively for ten pairs of unrelated observations.

39
Fig.13. Relationship at T5 between fraction of water drained after 15-min and the manufacturers reported water flow rate of geotextiles. Each point represents the fraction drained for one of the ten geotextiles averaged over a given root zone mixture.
There was a significant decline in average drainage observed over the course of
the study. This was particularly apparent in 15-min and 1-h drainage fractions, as
revealed by repeated measures analysis of variance which was undertaken to assess if
these drainage fractions at T1, T2, T3, T4 and T5 were significantly different. Fisher’s
Least Significant Difference comparisons revealed that 15-min and 1-h drainage
fractions at T3, T4 and T5 were all significantly lower than at T1 and T2.

40
There were several columns that showed more appreciable decreases in the
fraction of water drained than others. This was observed for root zone mixtures in
particular replicates. All Replicate 1 columns that contained root zone M4 and all
Replicate 2 columns that contained root zone M3 showed a reduction in drainage that
was appreciably more than their counterpart replicates. With root zone mixture M4, the
drainage fraction from Replicate 1 after an hour was less than 1/3rd of Replicates 2 and
3 (Figure 14). Standing water was observed on the surface of several of these columns 1
hour after water application. Observations of the manometer-tensiometers with their
sensors placed between the root zone mixture and the geotextile showed that there were
no appreciable or sustained positive pressures during drainage of these underperforming
columns. Although geotextile somewhat influenced drainage (Table 5 and Table 8), the
tensiometer- manometer observations suggest that the geotextiles were not the main
factor limiting drainage, but that deterioration in the permeability of the root zone
mixture was the cause. Further study is warranted to determine what led to the observed

41
Fig.14. Fraction of water drained (%), over 1-h, from test columns containing root zone mixture M4 for all data collection periods and replicates. The error bars represent the 95% confidence interval. N=10.
decreases in drainage. This could be done by measuring the whole system saturated
hydraulic conductivities, removing given increments of root zone mixture and repeating
the saturated hydraulic conductivity measurements on the remaining root zone. The root
zone mixture that would be removed from each layer could be assessed for fines. At the
completion of this thesis research, no conclusions could be drawn because it would have
required data obtained through premature destructive sampling of the columns.

42
Soil Particles in Drainage Water
Most of the particulate matter lost from the columns in the drainage water were
within the silt to clay range (50 µm <d < 2 µm). On average, 50 % of the particles were
less than 11 µm diameter. Most columns lost less than 2% of their fines (particles with d
< 150 µm) through 5 months, after which most drainage water was relatively free of
particles. The test columns that contained M2 lost 4-6 % of their fines. It was observed
that the amount of particulate material lost from a particular root zone was similar
regardless of the geotextile. This suggests that the root zone mixture, not geotextile, had
the main influence on the amount and size of fines lost. The statistical analysis carried
out on the mass of particles in the drainage water further supported this finding (Table
11).
Table 11. Analysis of variance on the mass of particles in drainage water.
Source Sum of Squares
Degrees of
Freedom
Mean Square F Significance†
Model 58220 60 970.3 7.490 .000
Mixture 45570 5 9114 70.35 .000
Geotextile 42.77 9 4.752 0.037 1.000
Mixture x Geotextile 230.7 45 5.127 0.40 1.000
Error 15550 120 129.6
Total 73760 180
† Values < 0.05 are significant at P=0.05.

43
The data obtained from the analysis showed that each root zone mixture was
releasing distinctly different size ranges of particles (Figure 15). However, there was no
evidence that the geotextiles were acting as sieves. If this were the case, it would be
Fig.15. Size distributions of particles in the drainage waters averaged across all geotextiles. N=10.
expected that the maximum size of particles that passed through a given geotextile
would be close to its AOS. This was not the case. For example, the geotextile FW404

44
has the greatest AOS (0.425 mm), but the distribution and maximum size of particles
that passed through this geotextile from root zone mixture M2 was similar to that from
all other geotextiles, and almost all particles were less than 3 µm diameter (Figure 16).
These data suggested that the range and maximum size of particles passing though the
geotextiles from the columns were being more greatly influenced by the root zone
Fig.16. Size distributions of particles in drainage waters of root zone mixture M2 for each geotextile.

45
mixture, than the geotextile. The statistical analysis on the carried out the d90 sizes of
the particles in the drainage water provides further proof of this (Table 12). When the
Table 12. Analysis of variance on the d90 size of particles in drainage water.
Source Sum of Squares df Mean
Square F Significance†
Model 177800 15 11850 20.66 .000
Mixture 42850 5 8569 14.93 .000
Geotextile 4085 9 453.9 0.791 .625
Error 94680 165 573.8
Total 272500 180
† Values < 0.05 are significant at P=0.05.
size distribution of particles that were lost from the columns was averaged across all root
zone mixtures for a given geotextile, similar curves were produced (Figure 17). If
geotextile were the main factor influencing the size of particles passing out of the root
zone mixtures with the drainage water it would have been expected that the curves
produced would show greater difference and that the maximum size of particles passing
through a geotextile would have been more in line with its AOS.

46
Fig.17. Size distributions of particles in drainage waters averaged across all root zone mixtures. N=6.

47
CHAPTER IV
CONCLUSIONS
The physical properties of the root zone mixture had a more significant influence
on drainage rates than the physical properties of the geotextiles. The amount and size
distribution of particles lost from the test columns were influenced by the properties of
the root zone mixtures, but not by the properties of the geotextiles. Some declines in the
drainage fraction were observed with time, but it appeared that these were mostly a
result of reduction in permeability of the root zone mixtures.
In conclusion, when establishing a sports field constructed using root zone
mixtures meeting USGA recommendations over geotextiles with AOS between 0.150
and 0.425 mm, minimal reduction in the drainage fraction due to clogging of the
geotextile would be expected.
48
REFERENCES
ASTM D4751-04. 2004a. Standard test method for determining Apparent Opening Size of a geotextile, American Society of Testing and Materials, West Conshohocken, Pennsylvania.
ASTM D4491-99a. 2004b. Standard test methods for water permeability of geotextiles by permittivity, American Society of Testing and Materials, West Conshohocken, Pennsylvania. Bhatia, S.K., and J.L. Smith. 1995. Application of the bubble point method to the
characterization of the pore-size distribution of geotextiles. Geotechnical Testing Journal 18:94-105.
Brown, K.W., and R.L. Duble. 1975. Physical characteristics of soil mixtures used for
golf green construction. Agronomy Journal 67:647-652. Callahan, L.M., R.S. Freeland, J.M. Parham, A.M. Saxton, R.D. Von Bermuth, D.P.
Shepard, and J.M. Garrison. 2001. Geotextiles as an intermediate layer in USGA and USGA-type greens. Bulletin 699. University of Tennessee, Knoxville.
de Mendonca, M.B., and M. Ehrlich. 2006. Column test studies of ochre biofilm
formation in geotextile filters. Journal of Geotechnical and Geoenvironmental Engineering 132:1284-1292.
de Mendonca, M.B., M. Ehrlich, and M.C. Cammarota. 2003. Conditioning factors of
iron ochre biofilm formation on geotextile filters. Canadian Geotechnical Journal 40:1225-1234.
Fayoux, D. 1977. Filtration hydrodynamique de sols par de textiles, p. 329-332. First
International Conference on Geotextiles, Paris. Gee, G.W., and D. Or. 2002. Particle-size analysis. p. 255-293. In J.H. Dane and G.C
Topp (eds.) Methods of soil analysis. Part 4. Physical Methods. Soil Science Society of America, Madison, WI.
Gerry, B.S., and G.P. Raymond. 1983. Equivalent opening size of geotextiles.
Geotechnical Testing Journal 6:53-63. Giroud, J.P. 2005. Quantification of geosynthetic behavior. Geosynthetics International
12:2-27.

49
John, N.W.M. 1987. Geotextiles. Blackie and Son Ltd.,Glasgow, London. Koerner, R. 1998. Designing with geosynthetics, 4th ed. Prentice Hall, Inc., Upper
Saddle River, NJ. Koerner, R.M., A.E. Lord, and Y.H. Halse. 1988. Long-term durability and aging of
geotextiles. Geotextiles and Geomembranes 7:147-158. Koerner, R.M., Y. Hsuan, and A.E. Lord. 1993. Remaining technical barriers to
obtaining general acceptance of geosynthetics. Geotextiles and Geomembranes 12:1-52.
Laegdsmand, M., K.G. Villholth, M. Ullum, and K.H. Jensen. 1999. Processes of colloid
mobilization and transport in macroporous soil monoliths. Geoderma 93:33-59. Luettich, S.M., J.P. Giroud, and R.C. Bachus. 1992. Geotextile filter design guide.
Geotextiles and Geomembranes 11:355-370. Mlynarek, J., J.B. Lewandowski, A.L. Rollin, and G. Bolduc. 1991. Soil geotextile
system interaction. Geotextiles and Geomembranes 10:161-176. Palmeira, E.M., A.F.N. Remigio, M.L.G. Ramos, and R.S. Bernardes. 2008. A study on
biological clogging of nonwoven geotextiles under leachate flow. Geotextiles and Geomembranes 26:205-219.
Prapaharan, S., R.D. Holtz, and J.D. Luna. 1989. Pore size distribution of nonwoven
geotextiles. Geotech Test J. 12:261-268. Puhalla, J., J. Krans, and M. Goatley. 1999. Sports fields: a manual for design
construction and maintenance. Rollin, A.L., and G. Lombard. 1988. Mechanisms affecting long-term filtration behavior
of geotextiles. Geotextiles and Geomembranes 7:119-145. Sansone, L.J., and R.M. Koerner. 1992. Fine fraction filtration test to assess geotextile
filter performance. Geotextiles and Geomembranes 11:371-393. Sarsby, R.W (ed.). 2007. Geosynthetics in civil engineering. Woodhead Publishing
Limited, Cambridge, England. Taylor, D.H., S.D. Nelson, and C.F. Williams. 1993. Sub-root zone layering effects on
water-retention in sports turf soil profiles. Agronomy Journal 85:626-630.

50
Taylor, D.H., C.F. Williams, and S.D. Nelson. 1997. Water retention in root-zone soil mixtures of layered profiles used for sports turf. Hortscience 32:82-85.
USGA. 1993. USGA recommendations for putting green construction, p. 1-3 USGA
Green Sect Record, Vol. 32.

51
APPENDIX A
TWENTY FOUR HOUR DRAINAGE DATA

52
Table A-1. Average fraction (%) of drainage from test columns 24-h after application of 25 mm water 54 days after initiation.
Geotextile Root Zone PM1 PM2 M1 M2 M3 M4
WM104F 97.73 98.27 97.99 100.70 97.82 98.49
FW404 94.56 98.62 96.61 100.46 98.98 97.13
GSENW16 94.10 98.57 99.05 99.70 98.76 98.33
GSENW10 97.20 97.25 96.83 97.84 98.16 97.41
NW401 96.93 98.27 97.69 99.16 98.10 98.03
NW1001 96.82 97.32 97.20 99.10 97.51 97.14
NW351 96.52 96.94 96.87 98.54 98.11 97.41
Lutradur 97.32 98.96 96.58 99.42 98.45 97.60
3341G 95.42 97.70 97.05 98.98 97.72 96.35
3301L 96.11 97.55 96.68 99.24 96.97 97.74 Table A-2. Average fraction (%) of drainage from test columns 24-h after
application of 25 mm water 88 days after study initiation. Geotextile Root Zone PM1 PM2 M1 M2 M3 M4
WM104F 94.94 97.98 97.53 98.63 97.20 98.97
FW404 93.17 97.30 97.07 100.65 97.12 97.22
GSENW16 92.00 97.19 98.30 98.19 98.08 97.80
GSENW10 94.36 96.99 96.96 96.67 96.98 97.42
NW401 94.47 96.31 96.13 97.86 96.04 96.23
NW1001 95.83 96.93 96.78 97.94 96.69 95.10
NW351 93.08 97.21 96.57 98.58 96.12 96.37
Lutradur 96.18 96.91 95.74 96.84 96.82 96.29
3341G 94.44 96.50 96.36 98.75 95.89 96.08
3301L 95.88 96.99 94.92 98.35 96.39 96.97

53
Table A-3. Average fraction (%) of drainage from test columns 24-h after application of 25 mm water 116 days after study initiation.
Geotextile Root Zone PM1 PM2 M1 M2 M3 M4
WM104F 94.18 97.78 98.05 98.57 97.00 98.25
FW404 94.37 97.38 93.18 98.91 98.86 97.34
GSENW16 92.74 96.76 97.76 98.48 97.40 97.91
GSENW10 95.30 97.83 97.37 97.40 97.89 98.28
NW401 95.26 97.87 97.03 98.82 97.51 97.01
NW1001 96.20 97.16 96.84 98.88 97.06 96.97
NW351 94.53 96.12 96.69 98.38 96.66 95.91
Lutradur 95.95 96.17 94.69 98.77 96.54 95.56
3341G 93.42 96.56 95.34 96.75 96.52 95.63
3301L 93.00 93.95 94.02 95.55 94.55 94.34 Table A-4. Average fraction (%) of drainage from test columns 24-h after
application of 25 mm water 171 days after study initiation. Geotextile Root Zone PM1 PM2 M1 M2 M3 M4
WM104F 92.38 86.08 94.97 98.95 97.74 96.11
FW404 94.54 97.61 90.75 100.02 93.48 97.79
GSENW16 91.80 73.80 97.52 98.33 98.54 97.16
GSENW10 93.65 92.36 97.42 98.85 98.42 95.84
NW401 95.85 98.20 98.38 99.95 98.25 97.80
NW1001 95.24 97.34 96.93 99.07 97.30 93.34
NW351 93.19 97.12 97.30 98.81 98.00 91.58
Lutradur 95.17 96.77 95.73 99.36 96.30 95.51
3341G 94.71 84.69 95.93 97.99 96.99 94.50
3301L 95.73 96.07 97.39 95.97 97.97 95.48

54
APPENDIX B
AVERAGE FRACTION OF WATER DRAINED AS A PERCENTAGE OF WATER
APPLIED FOR ALL ROOT ZONE MIXTURES OVER EACH GEOTEXTILE

55
Table B-1. Average fraction (%) of drainage from test columns 1-h after application of 25 mm water.
Geotextile Root Zone
Days from Initiation of Study
27 54 88 116 171WM104F PM1 79.76 83.69 81.43 83.86 84.46 PM2 95.05 96.58 96.65 95.59 83.19 M1 89.49 89.76 88.80 88.66 83.65 M2 83.10 84.46 80.09 79.75 77.31 M3 87.26 81.31 79.82 75.81 67.21 M4 88.17 89.01 84.28 81.91 74.43FW404 PM1 77.82 83.65 83.43 84.12 87.00 PM2 93.16 95.43 94.39 93.79 92.87 M1 88.46 91.16 91.36 91.00 82.93 M2 83.27 86.77 82.83 81.29 79.77 M3 88.33 87.26 78.67 76.95 64.26 M4 84.96 76.42 70.47 63.69 54.62GSENW16 PM1 77.28 79.39 79.03 79.54 79.91 PM2 91.57 95.16 93.62 93.41 70.11 M1 86.77 88.68 88.28 86.80 84.13 M2 81.15 84.01 79.28 79.12 76.15 M3 87.24 83.72 79.62 78.10 73.22 M4 86.05 77.78 64.32 59.09 51.83GSENW10 PM1 67.91 78.15 77.03 78.61 81.44 PM2 92.20 93.94 93.75 93.86 86.65 M1 73.04 77.39 79.70 78.55 76.85 M2 79.35 82.89 78.69 79.16 79.65 M3 83.23 82.14 74.99 73.77 69.85 M4 80.12 75.69 65.45 62.13 52.85NW401 PM1 72.33 82.55 80.90 83.39 86.00 PM2 90.92 93.83 92.23 93.15 92.46 M1 85.23 87.58 87.21 87.36 87.67 M2 82.63 82.83 79.72 79.40 77.01 M3 83.13 76.17 72.72 72.68 69.30 M4 82.62 79.94 71.76 65.52 56.41

56
Table B-1 Continued Geotextile Root
Zone Days from Initiation of Study
27 54 88 116 171NW1001 PM1 78.93 82.21 82.90 84.18 82.82 PM2 93.28 93.87 93.78 94.13 93.52 M1 86.41 86.93 86.78 86.77 84.41 M2 81.10 83.98 79.29 78.83 76.47 M3 83.82 75.74 69.89 67.74 65.53 M4 84.23 77.00 64.60 59.65 44.25NW351 PM1 73.86 82.43 79.36 85.26 85.28 PM2 93.13 94.38 94.71 94.02 93.93 M1 83.35 87.19 87.29 87.77 84.93 M2 86.43 89.75 86.72 86.33 84.55 M3 85.27 82.54 79.02 76.79 73.29 M4 85.54 77.41 64.89 60.19 48.48Lutradur PM1 82.61 84.82 86.24 86.95 88.35 PM2 93.64 95.05 93.25 92.90 93.18 M1 83.75 87.62 87.78 87.28 86.36 M2 83.23 83.65 78.82 78.18 75.60 M3 85.77 86.05 80.47 78.13 73.34 M4 86.65 78.62 67.28 61.60 53.463341G PM1 78.52 82.14 83.64 82.72 83.07 PM2 90.79 94.00 92.17 93.00 80.18 M1 86.02 88.89 88.59 89.38 87.23 M2 85.87 85.64 82.90 82.82 78.99 M3 84.50 81.67 77.61 75.77 78.99 M4 87.47 79.38 68.11 64.91 61.003301L PM1 77.38 82.10 84.51 85.28 87.47 PM2 93.12 94.38 93.80 93.31 91.84 M1 78.33 81.97 80.49 80.44 77.77 M2 79.22 79.41 77.29 76.79 73.46 M3 79.23 78.82 74.56 72.70 66.31 M4 83.72 80.77 73.85 70.58 60.02

57
APPENDIX C
CUMULATIVE DRAINAGE AS A PERCENTAGE OF WATER APPLIED FOR M3
AND M4 OVER ALL GEOTEXTILES

58
Table C-1. Fraction (%) of drainage 1-h after application of 25 mm water to test columns containing M3.
Geotextile Replicate Days from Initiation of Study 27 54 88 116 171WM104F 1 91.39 91.74 90.98 91.28 88.95
2 75.01 55.09 52.85 40.14 14.433 95.38 97.11 95.62 96.01 98.23
FW404 1 92.60 94.74 93.79 92.47 88.202 77.75 68.17 46.38 40.74 6.263 94.63 98.86 95.84 97.65 98.32
GSENW16 1 95.06 96.62 95.97 96.07 94.792 69.76 56.86 45.12 42.34 27.493 96.90 97.67 97.78 95.88 97.37
GSENW10 1 92.60 93.14 92.88 92.54 92.192 63.61 54.86 36.30 30.58 19.473 93.47 98.43 95.79 98.19 97.89
NW401 1 89.41 91.48 89.41 90.05 89.732 67.99 38.93 33.38 29.87 19.963 92.01 98.10 95.36 98.12 98.21
NW1001 1 90.14 91.54 90.23 91.52 89.902 66.76 37.10 21.88 13.29 8.333 94.55 98.58 97.56 98.41 98.36
NW351 1 92.86 94.33 93.33 93.77 93.162 67.78 54.71 46.42 38.63 27.453 95.18 98.58 97.30 97.97 99.25
Lutradur 1 88.05 88.22 84.98 84.57 84.292 75.03 71.02 59.50 51.49 37.773 94.22 98.90 96.94 98.34 97.95
3341G 1 91.13 91.72 93.27 93.18 91.202 71.19 55.55 43.90 36.43 31.333 91.19 97.74 95.65 97.69 97.74
3301L 1 86.97 90.90 89.97 90.74 90.142 57.71 48.53 38.00 29.44 10.383 93.03 97.05 95.71 97.91 98.41

59
Table C-2. Fraction (%) of drainage 1-h after application of 25 mm water to test columns containing M4.
Geotextile Replicate Days from Initiation of Study 27 54 88 116 171WM104F 1 84.70 83.15 71.56 63.42 50.95
2 87.18 93.20 94.33 93.20 88.513 92.63 90.68 86.95 89.10 83.84
FW404 1 75.96 61.52 42.66 23.82 7.922 94.37 85.54 88.67 86.90 80.083 84.55 82.20 80.08 80.34 75.85
GSENW16 1 83.06 59.99 23.48 14.48 6.452 85.95 87.28 87.53 85.78 88.263 89.14 86.07 81.96 77.00 60.77
GSENW10 1 68.97 52.29 23.59 12.58 5.522 90.55 94.76 94.48 94.50 89.643 80.83 80.02 78.27 79.31 63.38
NW401 1 83.73 68.90 45.08 29.56 13.752 80.24 86.67 90.55 89.34 88.033 83.89 84.25 79.65 77.65 67.46
NW1001 1 84.12 57.51 23.35 13.21 1.752 81.91 87.85 89.30 90.08 84.943 86.66 85.63 81.16 75.66 46.07
NW351 1 84.96 52.59 16.36 7.88 0.862 84.11 91.09 92.88 93.89 88.763 87.54 88.54 85.42 78.79 55.83
Lutradur 1 83.80 58.24 26.69 15.17 4.422 91.05 92.49 93.18 92.47 91.003 85.11 85.11 81.96 77.17 64.96
3341G 1 83.04 56.07 19.22 10.06 4.962 92.58 89.88 95.77 94.22 92.733 86.79 92.19 89.33 90.44 85.31
3301L 1 71.78 62.50 45.92 36.58 16.702 91.82 94.07 93.38 93.81 89.213 87.57 85.74 82.24 81.36 74.15

60
APPENDIX D
DATA FOR PARTICLE SIZES IN DRAINAGE WATERS

61
Table D-1. Size characteristics of particles in drainage water. Geotextile Root Zone d15 (µm) d50 (µm) d90 (µm)
WM104F PM1 0.136 0.675 12.06
PM2 0.713 10.16 61.32 M1 0.213 5.381 27.29 M2 0.0856 0.203 0.692 M3 0.222 5.165 23.67 M4 0.199 5.537 29.11
FW404 PM1 0.149 1.41 15.39 PM2 0.43 7.67 34.51 M1 0.22 5.448 24.34 M2 0.0846 0.186 0.577 M3 0.237 5.574 26.16 M4 0.224 7.063 48.23
GSENW16 PM1 0.149 1.274 16.13 PM2 0.433 8.289 46.26 M1 0.238 6.106 30.6 M2 0.0866 0.192 0.629 M3 0.256 6.142 25.95 M4 0.279 8.532 59.67
GSENW10 PM1 0.152 2.164 17.73 PM2 0.685 8.812 59.07 M1 0.245 6.329 31.83 M2 0.0862 0.195 0.545 M3 0.298 7.288 34.09 M4 0.214 6.109 25.91
NW401 PM1 0.143 0.598 15.57 PM2 0.549 8.301 37.17 M1 0.232 5.94 26.91 M2 0.0867 0.199 0.606 M3 0.244 5.911 24.51 M4 0.213 5.832 24.35
NW1001 PM1 0.152 0.905 20.07 PM2 0.456 7.49 31.21 M1 0.22 5.781 25.9 M2 0.0853 0.192 0.592 M3 0.283 6.563 24.49 M4 0.245 7.254 36.87
NW351 PM1 0.144 0.715 11.88 PM2 0.527 8.002 46.37 M1 0.182 4.946 22.67 M2 0.0847 0.186 0.542 M3 0.272 6.798 27.63 M4 0.273 7.45 30.05

62
Table D-1 Continued Geotextile Root Zone d15 (µm) d50 (µm) d90 (µm)
Lutradur PM1 0.137 0.64 12.97
PM2 0.877 9.3 37.67 M1 0.273 7.236 29.63 M2 0.088 0.205 0.601 M3 0.25 5.909 21.96 M4 0.258 7.456 36
3341G PM1 0.127 0.495 9.781 PM2 0.704 9.528 51.05 M1 0.237 6.505 31.38 M2 0.0848 0.187 0.556 M3 0.281 6.655 31.71 M4 0.263 7.4 35.85
3301L PM1 0.142 0.584 14.27 PM2 0.364 7.441 28.34 M1 0.244 6.209 27.98 M2 0.0849 0.185 0.513 M3 0.243 6.682 30.06 M4 0.277 6.237 25.35

63
APPENDIX E
FINES DATA

64
Table E-1. Fines (d< 150 µm) in drainage water.
Geotextile Root zone Average mass of fines in drainage
water(g)
Average mass of fines in drainage
water / Total mass of fines in column
(%) WM104F PM1 3.90 1.29 PM2 0.31 0.01 M1 0.64 0.05 M2 46.29 5.40 M3 0.57 0.02 M4 0.69 0.04 FW404 PM1 3.49 1.16 PM2 0.38 0.02 M1 0.60 0.05 M2 45.00 5.25 M3 0.60 0.02 M4 0.56 0.032 GSENW16 PM1 2.90 0.96 PM2 0.26 0.01 M1 0.61 0.05 M2 45.61 5.32 M3 0.52 0.02 M4 0.63 0.03 GSENW10 PM1 2.93 0.98 PM2 3.57 0.17 M1 0.69 0.06 M2 46.97 5.48 M3 0.50 0.02 M4 0.60 0.03 NW401 PM1 3.85 1.28 PM2 0.29 0.01 M1 0.47 0.04 M2 41.51 4.84 M3 0.53 0.02 M4 0.58 0.03 NW1001 PM1 3.55 1.18 PM2 0.27 0.01 M1 0.68 0.06 M2 40.64 4.74 M3 0.50 0.02 M4 0.48 0.03

65
Table E-1 Continued
Geotextile Root zone Average mass of fines in drainage
water(g)
Average mass of fines in drainage
water / Total mass of fines in column
(%) NW351 PM1 4.2 1.40 PM2 0.24 0.01 M1 1.00 0.08 M2 42.40 4.95 M3 0.49 0.02 M4 0.59 0.03 Lutradur PM1 4.07 1.35 PM2 0.29 0.01 M1 0.62 0.05 M2 47.79 5.58 M3 0.58 0.02 M4 0.52 0.03 3341G PM1 4.17 1.38 PM2 0.29 0.01 M1 0.65 0.05 M2 42.57 4.97 M3 0.66 0.02 M4 0.66 0.04 3301L PM1 3.83 1.27 PM2 0.31 0.01 M1 0.79 0.06 M2 39.13 4.57 M3 0.64 0.02 M4 0.60 0.03

66
APPENDIX F
GEOTEXTILE MARKETERS’ CONTACT INFORMATION

67
Geotextile Contact Information
GSENW16, GSENW10 GSE Lining Technology Inc. 19103 Gundle Road Houston, TX 77073
FW404 TenCate Nicolan 1288 Old Cleveland Road Cornelia, Georgia, 30531
WM104F, NW401, NW1001, NW351 Propex Marketing Fulfillment Center 8822 Production Lane, Suite 104, Ooltewah, Tennessee, 37663-4510
Lutradur Freudenberg 10035 Brookriver Drive Houston, Texas 77040
3301L, 3341G Fiberweb 840 S.E. Main Street Simpsonville SC 29681

68
VITA
Keisha Marie Rose-Harvey received a Bachelor of Science in geology from the
University of the West Indies, Mona, Jamaica in 2002. In January 2007 she entered the
Soil Science program at Texas A&M University. Later that year she transferred into the
Water Management and Hydrological Science program where she completed a Master of
Science degree in August 2009. Her interests include the formation and implementation
of water law and policy.
Mrs. Rose-Harvey may be reached at 370 Olsen Blvd., 2474 TAMU, College
Station, TX 77843-2474. Her email is [email protected].