waste management investor day
TRANSCRIPT
WASTE MANAGEMENT INVESTOR DAY
May 30, 2019

Certain statements provided in this presentation are “forward-looking statements” within the meaning of Section 27A of the Securities Act of 1933 and Section 21E of the Securities Exchange Act of 1934. Forward-looking statements are often identified by the words, “will,” “may,” “should,” “continue,” “anticipate,” “believe,” “expect,” “plan,” “forecast,” “project,” “estimate,” “intend” and words of similar nature, and such statements generally contain projections about accounting and finances; strategy, plans and objectives for the future and outcomes from such strategic plans and objectives; projections, estimates, or assumptions relating to our performance; results of investments in new technologies; implementation of innovation and efficiency projects; predictions or assumptions about future trends or conditions in our industry; or our opinions, views or beliefs about the effects of current or future events, circumstances or performance. Such forward-looking statements also include statements about Advanced Disposal, Inc. (“ADS”) and the proposed acquisition, including but not limited to all statements about the timing and approvals of the proposed acquisition; ability to consummate and finance the acquisition; integration of the acquisition; future operations; future capital allocation; future business and financial performance of Waste Management, Inc. and its subsidiaries (“Waste Management”) and ADS and the ability to achieve future financial guidance; future leverage ratio; and all outcomes of the proposed acquisition, including synergies, cost savings, and impact on earnings, cash flow and margin, return on capital, strength of the balance sheet and credit ratings.
You should view these statements with caution. These statements are not a guaranty of future performance, circumstances or events. They are based on information known to us as of the date the statements are made. Our business is subject to risks and uncertainties, many of which we do not control, that alone or taken together could have a material adverse effect on us and could cause actual results to be materially different from those set forth in such forward-looking statement. Some of these risks and uncertainties are described in greater detail in Waste Management’s Annual Report on Form 10-K for the year ended December 31, 2018, and its Quarterly Report on Form 10-Q for the quarter ended March 31, 2019, each as filed with the Securities and Exchange Commission. We assume no obligation to update any forward-looking statement, including financial estimates, whether as a result of future events, circumstances or developments or otherwise.
INVESTOR DAY2
CAUTIONARY STATEMENT NON-GAAP FINANCIAL MEASURES
This presentation contains non-GAAP financial measures under Regulation G of the Securities Exchange Act of 1934, as amended. The Company believes that these non-GAAP financial measures are useful to investors to assess the performance, results of operations and cash available for the Company’s capital allocation program. These non-GAAP measures are meant to supplement, not replace, comparable GAAP measures, and such non-GAAP measures may be different from similarly titled measures used by other companies. A reconciliation of these non-GAAP financial measures to their most directly comparable financial measures calculated and presented in accordance with generally accepted accounting principles can be found in the Appendix at the end of this presentation and under the Investor Relations tab on our website: www.wm.com.
INVESTOR DAY3
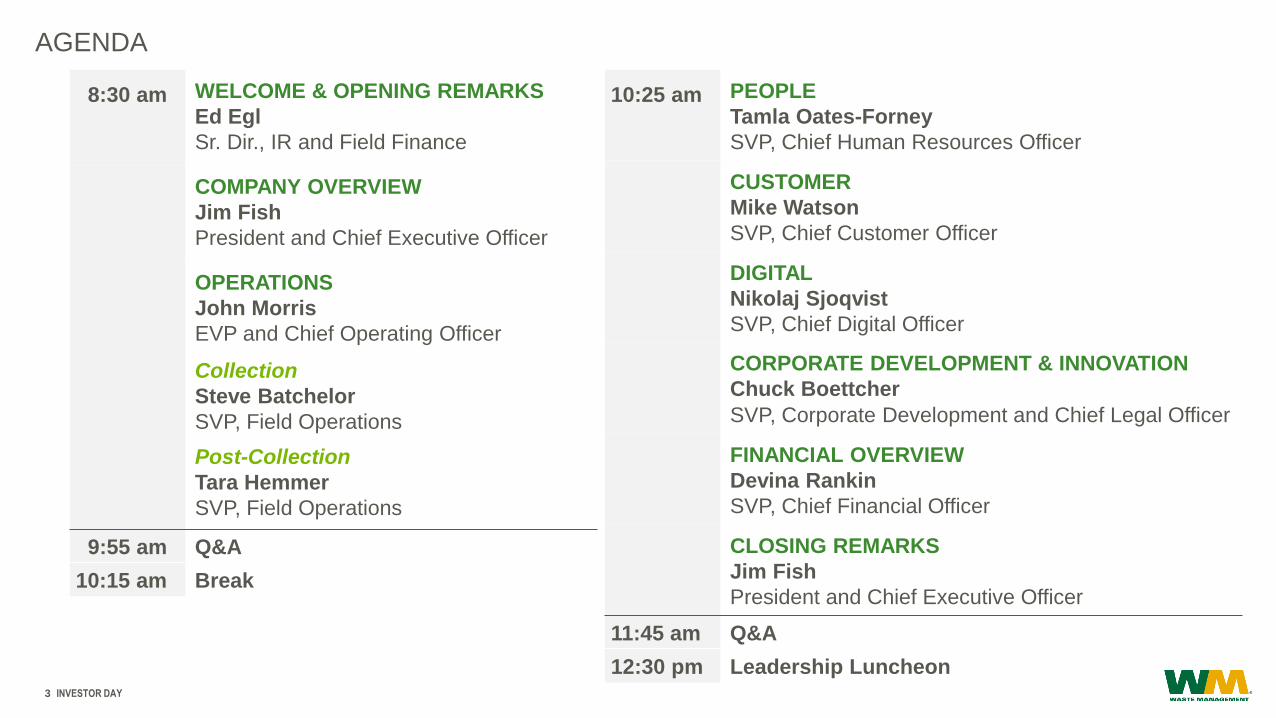
AGENDA
8:30 am WELCOME & OPENING REMARKS
Ed Egl
Sr. Dir., IR and Field Finance
COMPANY OVERVIEW
Jim Fish
President and Chief Executive Officer
OPERATIONS
John Morris
EVP and Chief Operating Officer
Collection
Steve Batchelor
SVP, Field Operations
Post-Collection
Tara Hemmer
SVP, Field Operations
9:55 am Q&A
10:15 am Break
10:25 am PEOPLE
Tamla Oates-Forney
SVP, Chief Human Resources Officer
CUSTOMER
Mike Watson
SVP, Chief Customer Officer
DIGITAL
Nikolaj Sjoqvist
SVP, Chief Digital Officer
CORPORATE DEVELOPMENT & INNOVATION
Chuck Boettcher
SVP, Corporate Development and Chief Legal Officer
FINANCIAL OVERVIEW
Devina Rankin
SVP, Chief Financial Officer
CLOSING REMARKS
Jim Fish
President and Chief Executive Officer
11:45 am Q&A
12:30 pm Leadership Luncheon

Jim Fish
President and Chief Executive Officer
COMPANY OVERVIEW

INVESTOR DAY5
Passionate,
Experienced
Management
Team Leading a
Culture of
“People First”
and Innovation
Driving Growth in
the Core by
Providing a
Differentiated
Service Offering
through an
Integrated Use of
Technology and
Advanced Data
Analytics
Stable, Robust
Cash Flow
Combined with
Disciplined
Deployment and
Commitment to
Returning Cash
to Shareholders;
Organic Growth
Complemented
by Strategic M&A
Leveraging the
Industry-leading
Asset Network
that Cannot be
Replicated
Resulting in an
Advantaged
Position
Positioning Our
Premier Brand to
be Recognized
as a World-class
Leader in
Sustainability
KEY MESSAGES

The Leader in Environmental Services and Solutions
INVESTOR DAY61. As of 12/31/18. Waste Management, Inc. is a holding company and all operations are conducted by subsidiaries. 2. As of 5/20/19. 3. See the appendix at the end of this presentation for
reconciliation of this non-GAAP financial measure. 4. Operating EBITDA is defined as income from operations before depreciation and amortization.
WASTE MANAGEMENT AT A GLANCE
1971 $46B HOUSTON, TX ~43,700 OVER 20M
FOUNDED MARKET-CAP2 HEADQUARTERS EMPLOYEES CUSTOMERS
COMPANY STATISTICS1
2018 FINANCIAL STATS1
Sales $14.9B
Adj. Operating EBITDA3,4 $4.2B
Adjusted EPS3 $4.20
Cash Flow from Ops $3.6B
2018 REVENUE MIX REVENUE BY COLLECTION
54%
10%
20%
7%
9%Collection
Transfer
Landfill
Recycling
Other
41%
29%
26%
4%
Commercial
Industrial
Residential
Other
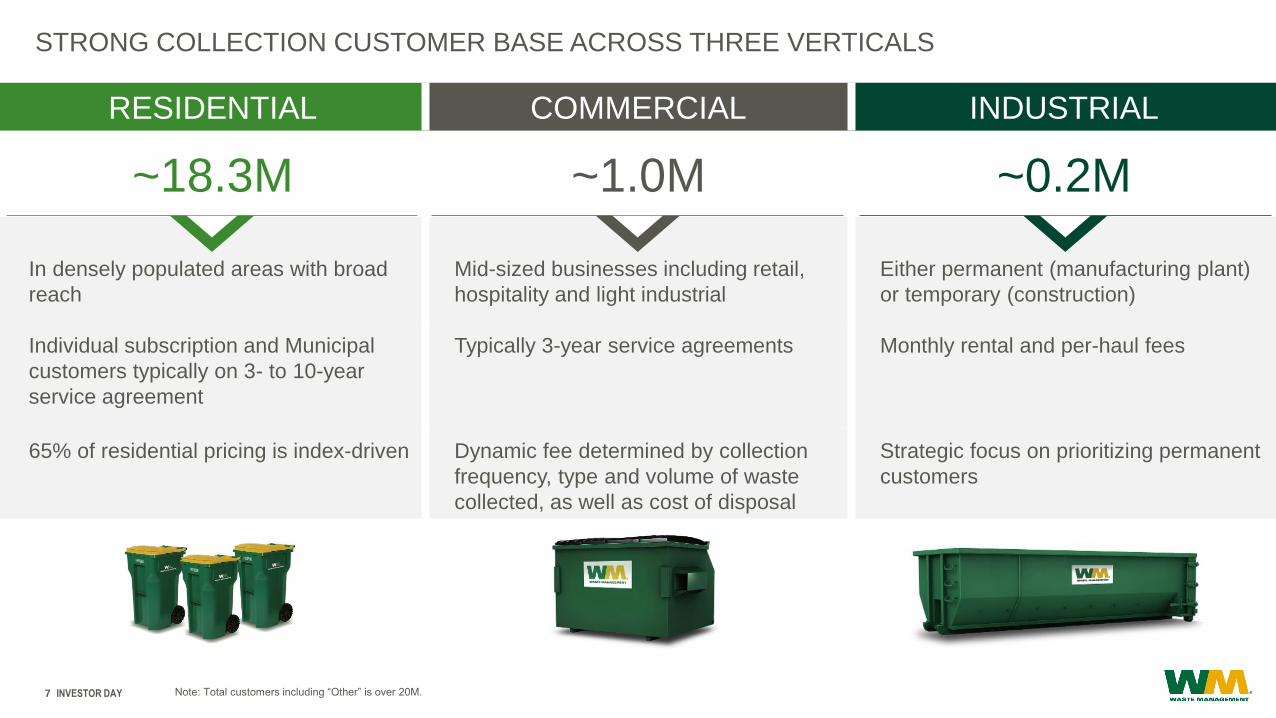
RESIDENTIAL COMMERCIAL INDUSTRIAL
~18.3M ~1.0M ~0.2M
In densely populated areas with broad
reach
Mid-sized businesses including retail,
hospitality and light industrial
Either permanent (manufacturing plant)
or temporary (construction)
Individual subscription and Municipal
customers typically on 3- to 10-year
service agreement
Typically 3-year service agreements Monthly rental and per-haul fees
65% of residential pricing is index-driven Dynamic fee determined by collection
frequency, type and volume of waste
collected, as well as cost of disposal
Strategic focus on prioritizing permanent
customers
INVESTOR DAY7
STRONG COLLECTION CUSTOMER BASE ACROSS THREE VERTICALS
Note: Total customers including “Other” is over 20M.

100% of Team New to Role
within Last 3 Years
Onboard Units in 100% of
Vehicles
Increasing CNG Vehicles to
60% by Year End 2019
Best Positioned in
16 of Top 20
Divested Non-core Assets
(Wheelabrator, Oil & Gas
Production) and
Strengthened Balance Sheet
Increased
470 bps to 5.6%
Improved
300 bps to 28.3%
Grew
1,020 bps to 49.4%
Expanded
310 bps to 13.9%
INVESTOR DAY8
OVER THE PAST FOUR YEARS, WE HAVE EXECUTED ON KEY STRATEGIC INITIATIVES
Built Diverse
Management Team
for High Performance
Invested in Technology
Across All Our Assets
Reduced Our
Carbon Footprint
While Reducing Costs
Increased Presence
in Top MSAs
STRATEGIC
INITIATIVES
Organic
Revenue Growth
Adj. Operating
EBITDA Margin1
Expansion of
FCF Conversion1,2
ROIC1
INDUSTRY-LEADING
METRICS
OUTCOMES /
EXAMPLES
PERFORMANCE
1. See the appendix at the end of this presentation for reconciliation of this non-GAAP financial measure. 2. FCF as % of Adj. EBITDA.
De-risked
Our Company

WE ARE NURTURING A PURPOSE-DRIVEN CULTURE: IT STARTS WITH US
NEW TO WM WITHIN
THE LAST 3 YRS
Jim Fish President and
Chief Executive Officer
Joined: 2001
Current Role: 2016
John MorrisEVP and
Chief Operating Officer
Joined: 2004
Current Role: 2019
Devina Rankin SVP,
Chief Financial Officer
Joined: 2002
Current Role: 2017
Chuck Boettcher SVP, Corp. Dev. and
Chief Legal Officer
Joined: 2016
Current Role: 2019
Tamla Oates-Forney SVP,
Chief Human Resources Officer
Joined: 2018
Current Role: 2018
Nikolaj Sjoqvist SVP, Chief Digital Officer
Joined: 2012
Current Role: 2017
Mike WatsonSVP, Chief Customer Officer
Joined: 1992
Current Role: 2018
Steve Batchelor SVP, Field Operations
Joined: 1997
Current Role: 2019
Tara Hemmer SVP, Field Operations
Joined: 1999
Current Role: 2019
NEW TO POSITION
WITHIN THE LAST 3 YRS
NEWLY CREATED
POSITION
INVESTOR DAY9

INVESTOR DAY10
STRENGTHS
Strong and Diverse
Leadership Team
Asset Management and
Logistics Expertise
Culture of Continuous
Improvement and Innovation
Environmental Solutions and
Regulatory Expertise
ADVANTAGED POSITION
OUR BUSINESS MODEL IS OUR KEY ENABLER TO MARKET OUTPERFORMANCE

More Purposeful Investment in Brand and Markets Should Result in Increased Brand Equity
INVESTOR DAY11
PREMIER BRAND: TREMENDOUS VALUE AND GROWING
1. Based on third party analysis of publicly available information.
Brand Equity Is Proven to Drive Value Across an Organization
$2B, or ~5% of
Market-CapEstimated Value of Brand1
$6B - $8B Potential Brand Value
STRONGER ADVOCACY7% increase in positive mentions for every 10% improvement
INCREASED SALES8% increase in purchase probability for every 10% improvement
EMPLOYER OF CHOICE57% of the general public would work for a company with a favorable
public image
MORE ASSURANCE63% of the general public gives the benefit of the doubt to companies
with an excellent reputation
WM Continues to Strengthen its
Brand Reputation; More Room to Go

BEST POSITIONED ASSET NETWORK
LANDFILLSTRANSFER
STATIONS
MATERIALS RECOVERY
FACILITY (MRF)FLEET
247 locations
130 renewable energy plants
314 stations
strategically positioned
103 total facilities
44 single stream
14,500 routed trucks
60% CNG-fueled1
WM LOCATIONS ACROSS NORTH AMERICA
INVESTOR DAY12 1. By year end 2019.

INVESTOR DAY13
ACQUISITION OF ADVANCED DISPOSAL SERVICES (ADS) WILL ADD 3 MILLION
NEW CUSTOMERS

INVESTOR DAY14
2019 Estimates1 Austin
MSA
U.S.
Average
Population Growth 2.4% <1.0%
CPI 2.3% 1.8%
Housing Start Growth 1.7% 0.7%
Labor Force Growth 2.3% 3-4%
Unemployment Rate 2.7% 3.7%
Stronghold Positioning
• Over past five years, acquired 11 assets and over
past two years, acquired two hauling companies,
further strengthening our position
• Post-collection assets are well-placed to capitalize
on future growth
1. Source: IHS MARKIT
AUSTIN CONTINUES TO EXPERIENCE
STRONG POPULATION GROWTH

INVESTOR DAY15
2019 Estimates1 Miami
MSA
U.S.
Average
Population Growth 1.1% <1.0%
CPI 2.3% 1.8%
Housing Start Growth 7.2% 0.7%
Labor Force Growth 1.7% 3-4%
Unemployment Rate 3.6% 3.7%
Stronghold Positioning
• Taking advantage of strong housing growth
• Looking for tuck-in acquisition opportunities
• Continuing to expand and develop our post-
collection network (e.g., C&D transfer station in
downtown Miami)
1. Source: IHS MARKIT
MIAMI REMAINS A TOP 10 MSA BASED ON
POPULATION OVER PAST 10 YEARS
INVESTOR DAY16
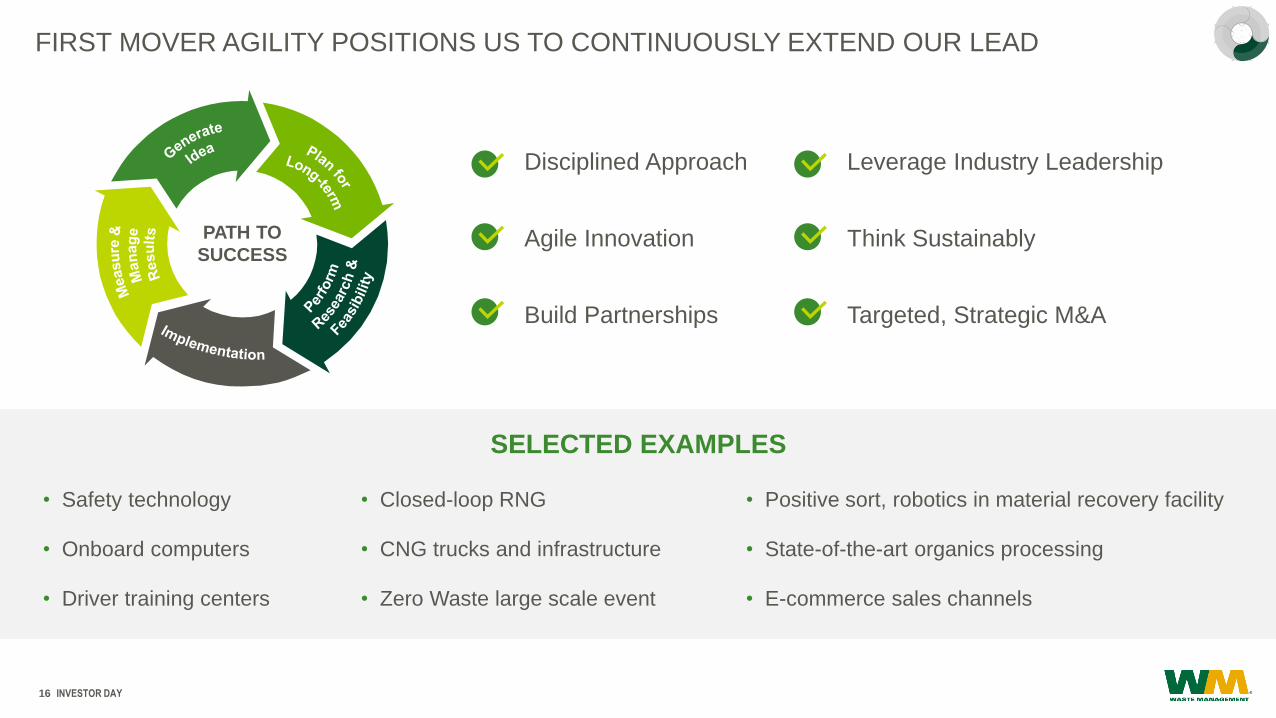
FIRST MOVER AGILITY POSITIONS US TO CONTINUOUSLY EXTEND OUR LEAD
SELECTED EXAMPLES
PATH TO
SUCCESS
Disciplined Approach
Agile Innovation
Build Partnerships
Leverage Industry Leadership
Think Sustainably
Targeted, Strategic M&A
• Safety technology
• Onboard computers
• Driver training centers
• Positive sort, robotics in material recovery facility
• State-of-the-art organics processing
• E-commerce sales channels
• Closed-loop RNG
• CNG trucks and infrastructure
• Zero Waste large scale event

INVESTOR DAY17
LEADING IN SUSTAINABILITY
Source: Waste Management 2018 Sustainability Report.
60% Routed collection trucks that are natural-gas vehicles
15.3M Tons Recycled in 2017, a 91% increase since 2007
460,000 Homes that could be powered each year by equivalent production from our landfill gas-to-energy projects
90,000 TonsMaterials recycled by auto manufacturers withWaste Management Sustainability Services
1,795 TonsConsumer electronics, paint and hazardous materials collected from consumer homes in the At Your Door Special Collection Service
117 MillionEquivalent trees saved per year from Waste Management’s recycling volume

Partnerships to Educate
and Execute
Sustainable
Efforts
4,000+Community Events
Hosted or Attended
~4.5 MillionEquivalent Megawatt-Hours
Saved per Year
$110 Million2018 Investment in Recycling
Processing Infrastructure
>4 MillionTons of Organic Materials
Estimated for 2019
INVESTOR DAY18
BUILDING UPON OUR SUSTAINABILITY LEADERSHIP
Reducing Our
Carbon Footprint
and Working with
Others
Investing
in Recycling
Innovation
Increasing Organics
Managed; Doubled
Over the Last
Three Years

INVESTOR DAY19
WASTE MANAGEMENT STRATEGY FOR SUSTAINABLE FUTURE GROWTH
Enable a People-first, Technology-led Focus, that Leverages and Sustains the Strongest Asset
Network in the Business to Drive Best-in-class Customer Experiences and Growth
PEOPLE CUSTOMERS COMMUNITY ENVIRONMENT SHAREHOLDERS
Make WM an
employer of choice
by being a great
place to work and
build a career
Drive exceptional
reputation which
underpins ongoing
relationship building
and positively
influences
regulations, policies
and thought
leadership
Lead in
sustainability by
preserving and
protecting the
environment
Deliver strong and
predictable long-
term financial
performance that
rewards investors
Delight our
customers through
a differentiated
experience that
fuels sustainable
competitive
advantage

John Morris
EVP & COO
OPERATIONSTara Hemmer
SVP, Field Operations
Steve Batchelor
SVP, Field Operations

INVESTOR DAY21
Executing Our
Business Model by
Deeply
Understanding Our
Customers’ Needs,
Continuously
Improving Our
Operating
Platforms, and
Focusing on Our
Greatest Asset –
Our People
Integrating the Use
of Technology to
Enhance Safety,
Service, Savings
and Sustainability
Redefining the
Recycling Business
Model; Building
Capabilities for the
Future
Leveraging Our
Highly
Sophisticated
Geographic
Network of Assets
and Logistics
Management
Capabilities
Optimizing Post-
collection Assets to
Expand Margins
and Drive
Competitive
Advantage
KEY MESSAGES

INVESTOR DAY22
RUNNING OUR BUSINESS Waste Management
North America Market Areas
• 2018 revenue range:
$650M to $1.4B
• Distributed organization
• Structure directly aligns field and
corporate leadership to facilitate
communication and execution
• Strong connection between
Corporate and our Areas with
shared accountability for
execution
• 17 Areas
• U.S.: 15
• Canada: 2
INVESTOR DAY23
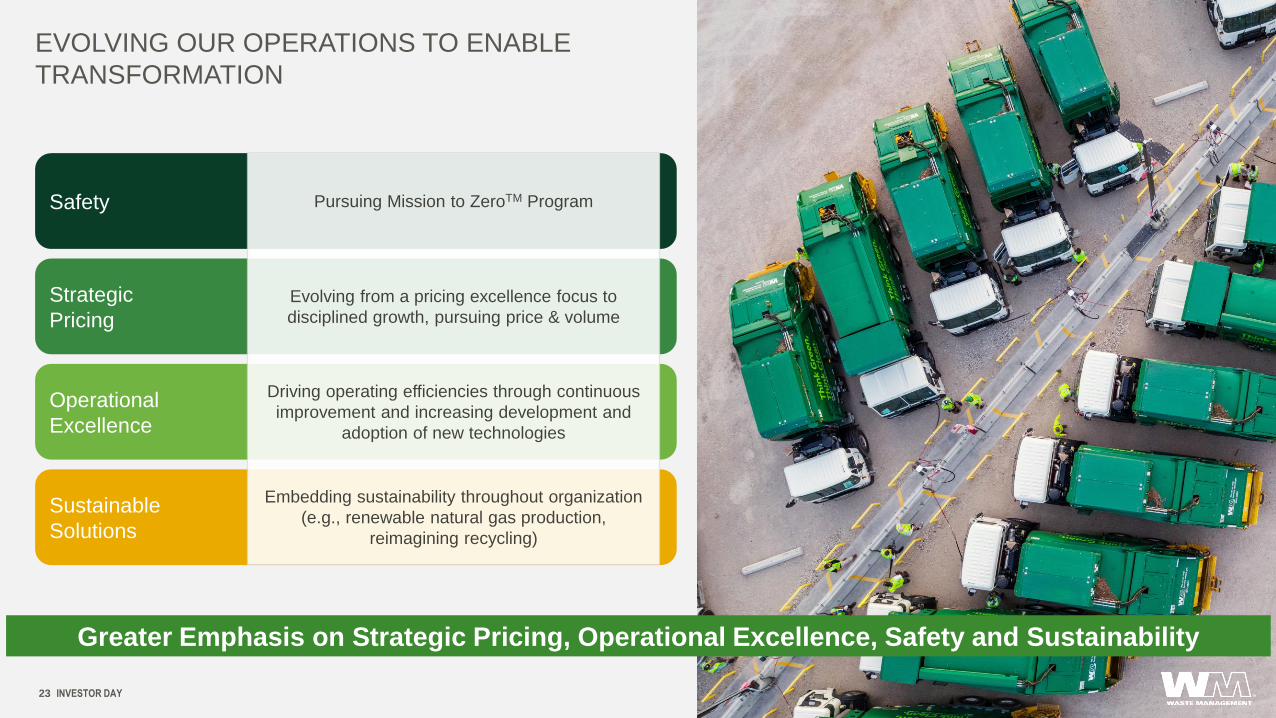
EVOLVING OUR OPERATIONS TO ENABLE
TRANSFORMATION
Greater Emphasis on Strategic Pricing, Operational Excellence, Safety and Sustainability
Safety
Operational
Excellence
Sustainable
Solutions
Strategic
Pricing
Driving operating efficiencies through continuous
improvement and increasing development and
adoption of new technologies
Evolving from a pricing excellence focus to
disciplined growth, pursuing price & volume
Pursuing Mission to ZeroTM Program
Embedding sustainability throughout organization
(e.g., renewable natural gas production,
reimagining recycling)
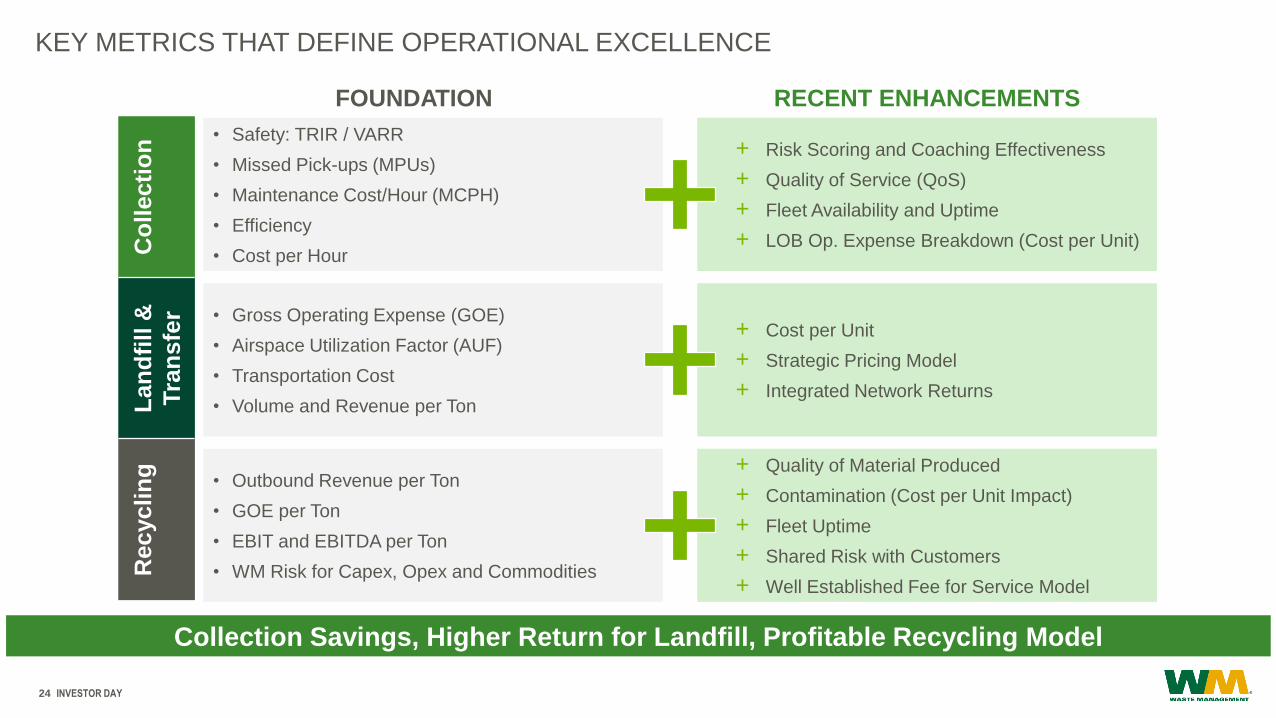
+ Risk Scoring and Coaching Effectiveness
+ Quality of Service (QoS)
+ Fleet Availability and Uptime
+ LOB Op. Expense Breakdown (Cost per Unit)
+ Cost per Unit
+ Strategic Pricing Model
+ Integrated Network Returns
+ Quality of Material Produced
+ Contamination (Cost per Unit Impact)
+ Fleet Uptime
+ Shared Risk with Customers
+ Well Established Fee for Service Model
INVESTOR DAY24
KEY METRICS THAT DEFINE OPERATIONAL EXCELLENCE
Collection Savings, Higher Return for Landfill, Profitable Recycling Model
FOUNDATION
• Safety: TRIR / VARR
• Missed Pick-ups (MPUs)
• Maintenance Cost/Hour (MCPH)
• Efficiency
• Cost per Hour
• Gross Operating Expense (GOE)
• Airspace Utilization Factor (AUF)
• Transportation Cost
• Volume and Revenue per Ton
• Outbound Revenue per Ton
• GOE per Ton
• EBIT and EBITDA per Ton
• WM Risk for Capex, Opex and Commodities
RECENT ENHANCEMENTS
Co
llecti
on
Lan
dfi
ll &
Tra
nsfe
r
Recyclin
g

INVESTOR DAY25
VERTICALLY INTEGRATED ASSET BASE FUELS CORE BUSINESS
54%
10%
20%
7%9%
2018 REVENUE MIX
Collection Transfer
Landfill Recycling
Other
COLLECTION TRANSFER LANDFILL RECYCLING
Picking up waste
and recyclables
from where they
were generated and
transporting to:
• Transfer station
• Landfill
• Material recovery
facility (MRF)
• Other outlets
(e.g., composting)
Consolidating waste
and material
streams to be
transported to
disposal sites
Network, consisting
of 300+ transfer
stations, allows us
to leverage our
landfill and recycling
assets
Representing the
largest landfill
network with ~250
locations in the U.S.
and Canada
Well-positioned
network represents
critical North
American
infrastructure and
provides significant
barrier for new
entrants
Processing
materials for their
next best and
highest use through:
• Materials
processing
• Recycling
commodities
• Recycling
brokerage
services
• Advanced
Diversion
(organics)

INVESTOR DAY26
BROAD SERVICE PORTFOLIO TO MEET CUSTOMER NEEDS
54%
Collection Transfer
Landfill Recycling
Other
BY COLLECTIONCOMMERCIAL RESIDENTIAL INDUSTRIAL
Front-end loader:
forks on front of
truck fit into
sleeves of a
container
Typical
customers:
restaurants,
hotels and retail
stores
Containers range
in size from 2 to
8 cubic yards
Largely
automated side-
loader fleet: side
arm grabs small
bin
Trucks are used
primarily to
empty smaller
containers at
private homes
Bins are 64- or
96-gallon toter
Roll-off flatbed
truck: container
rolls off the
chassis
One employee
per truck, in
general
Typical
customers:
manufacturing
facilities and
construction sites
Containers range
from 10 to 40
cubic yards
2018 REVENUE MIX
41%
29%
26%
4%
Commercial
Industrial
Residential
Other
INVESTOR DAY27
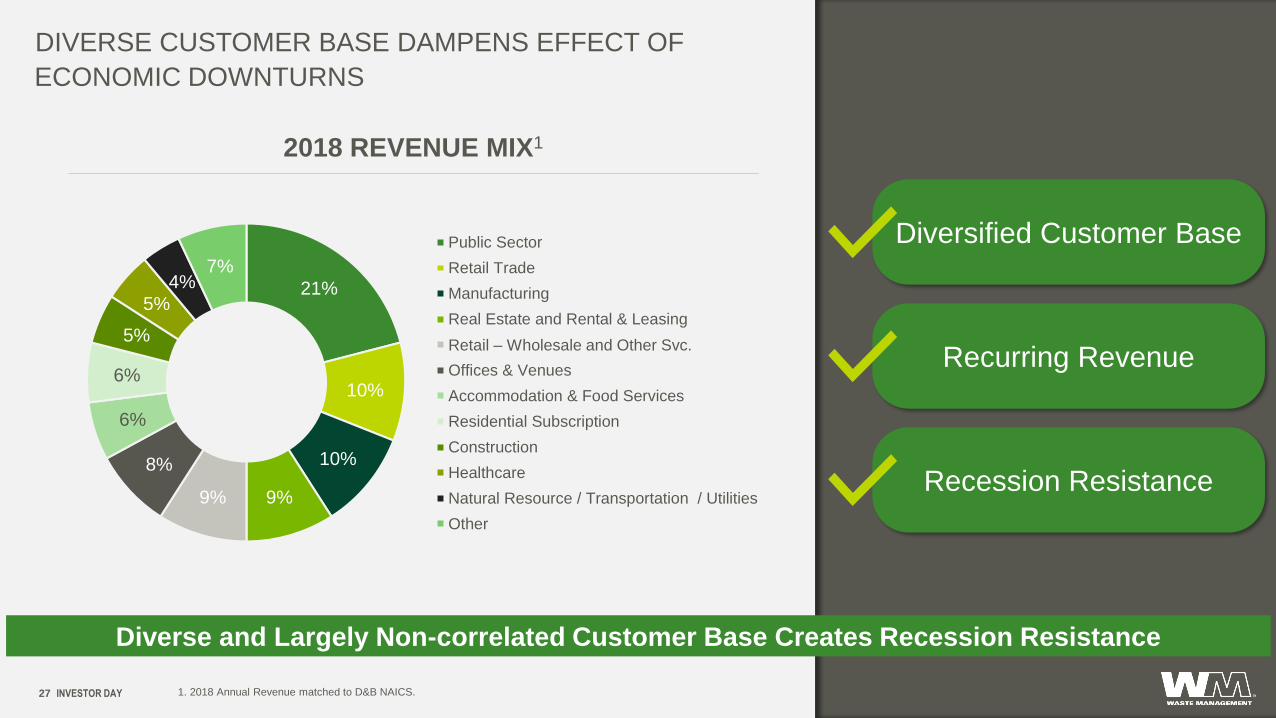
DIVERSE CUSTOMER BASE DAMPENS EFFECT OF
Diverse and Largely Non-correlated Customer Base Creates Recession Resistance
21%
10%
10%
9%9%
8%
6%
6%
5%
5%4%
7%
Public Sector
Retail Trade
Manufacturing
Real Estate and Rental & Leasing
Retail – Wholesale and Other Svc.
Offices & Venues
Accommodation & Food Services
Residential Subscription
Construction
Healthcare
Natural Resource / Transportation / Utilities
Other
1. 2018 Annual Revenue matched to D&B NAICS.
2018 REVENUE MIX1
Diversified Customer Base
Recurring Revenue
Recession Resistance
ECONOMIC DOWNTURNS
INVESTOR DAY28
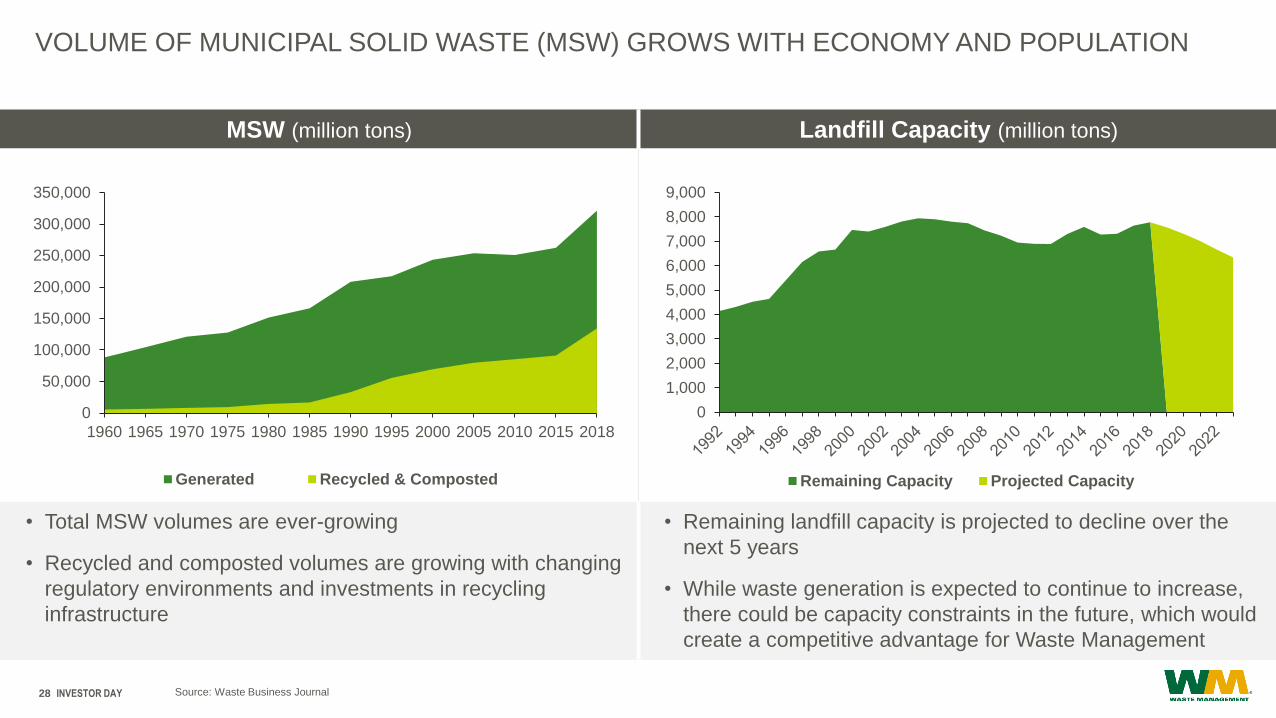
VOLUME OF MUNICIPAL SOLID WASTE (MSW) GROWS WITH ECONOMY AND POPULATION
MSW (million tons) Landfill Capacity (million tons)
• Total MSW volumes are ever-growing
• Recycled and composted volumes are growing with changing
regulatory environments and investments in recycling
infrastructure
• Remaining landfill capacity is projected to decline over the
next 5 years
• While waste generation is expected to continue to increase,
there could be capacity constraints in the future, which would
create a competitive advantage for Waste Management
0
50,000
100,000
150,000
200,000
250,000
300,000
350,000
1960 1965 1970 1975 1980 1985 1990 1995 2000 2005 2010 2015 2018
Generated Recycled & Composted
0
1,000
2,000
3,000
4,000
5,000
6,000
7,000
8,000
9,000
Remaining Capacity Projected Capacity
Source: Waste Business Journal

INVESTOR DAY29
UNIQUELY POSITIONED TO CAPITALIZE ON EVOLVING TRENDS
SOCIAL
TRENDS
BEHAVIORIAL
SHIFT
MACRO
FACTORS
• Volumes >2% expected in 2019
• GDP and housing starts expected to moderate, but
remain positive
• Millennials beginning household formation
• Increasing focus on recycling / sustainability
• Employees and customers seeking purpose-driven
brands
• ESG focus for public companies
• Millennials driving sustainability and purpose driven
brands
• Increased packaging driven by online purchases
• Public need for education on process
WE ARE UNIQUELY POSITIONED
to capture fair share of volume
increases generated by macro trends
• Broad geographic footprint
covering high growth and emerging
growth markets
• Unparalleled sustainability efforts
through investments in near zero
emissions fleet, recycling plants of
the future and renewable energy
plants
• Vast capabilities to meet customer
needs through traditional services
(collection, recycling and disposal),
other sustainability services, and
best-in-class talent

COLLECTION

INVESTOR DAY31
COLLECTIONS NETWORK: WE DO COMPLEX
Strength of Logistics Management Capability
19,000Collections
Drivers
200,000Tons of
Material Moved
Daily
450M+Miles Driven
Annually
14,500Avg. Daily
Routes
5.5MCustomers
Served Daily3,300Technicians

INVESTOR DAY32
CONTINUOUSLY IMPROVING OUR COLLECTION NETWORK
Building on Strengths of Our Network to Improve Customer Service and Operational Efficiency
PEOPLE
• Increasing driver and technician retention
• Investing in WM-managed driver training schools
FLEET
• Upgrading fleet to automated loading
• Increasing use of natural gas vehicles
• Predicting time to failure to better maintain fleet
ANALYTICS
• Gathering data in real-time through onboard systems to
improve the customer experience
• Optimizing routes to improve cost to serve
Integrating greater use
of technology to improve Safety,
Service, Savings
and Sustainability

INVESTOR DAY33
CORE TO WM’S OPERATIONAL
EXCELLENCE ARE THREE “SS”
Safety, Service and Savings

• Safety is a core value of our culture
• Proven safety framework and process incorporating
grassroots initiatives
• Accelerated use of technology to ensure safety of our
people and communities we serve
INVESTOR DAY34
SAFETY: A CORE PRIORITY
• Onboard Cameras
• Truck Automation
• Driver and Tech Training Centers (FL, AZ)
• On the Job Training / Mentoring Programs
• Technician Apprentice Program
• Daily Driver Huddles
• WM-produced Safety Videos
Continuous Improvement on
Our Mission to Zero
56% Improvement in Safe Behavior (since 2013)
$33M Savings from Reduced Auto Claims (since 2013)

• “We do it right the first time”
• Sophisticated logistics execution
• Driver-identified customer needs, community partnerships
• Enhancements to continue the technology evolution
INVESTOR DAY35
SERVICE: CONTINUOUSLY IMPROVING
• Tracking Quality of Service (QoS)
• Planned route sequencing and centralized
dispatch supported by real-time communication
through onboard technology
• Uptime improvement on our routes
• Reporting capabilities for on-time pick-up
• Estimated “Time of Arrival” tool
Service
Excellence
99.3% On-Time Service;
We Are Focused on the 0.7% (QOS)
COMPETITIVE ADVANTAGE
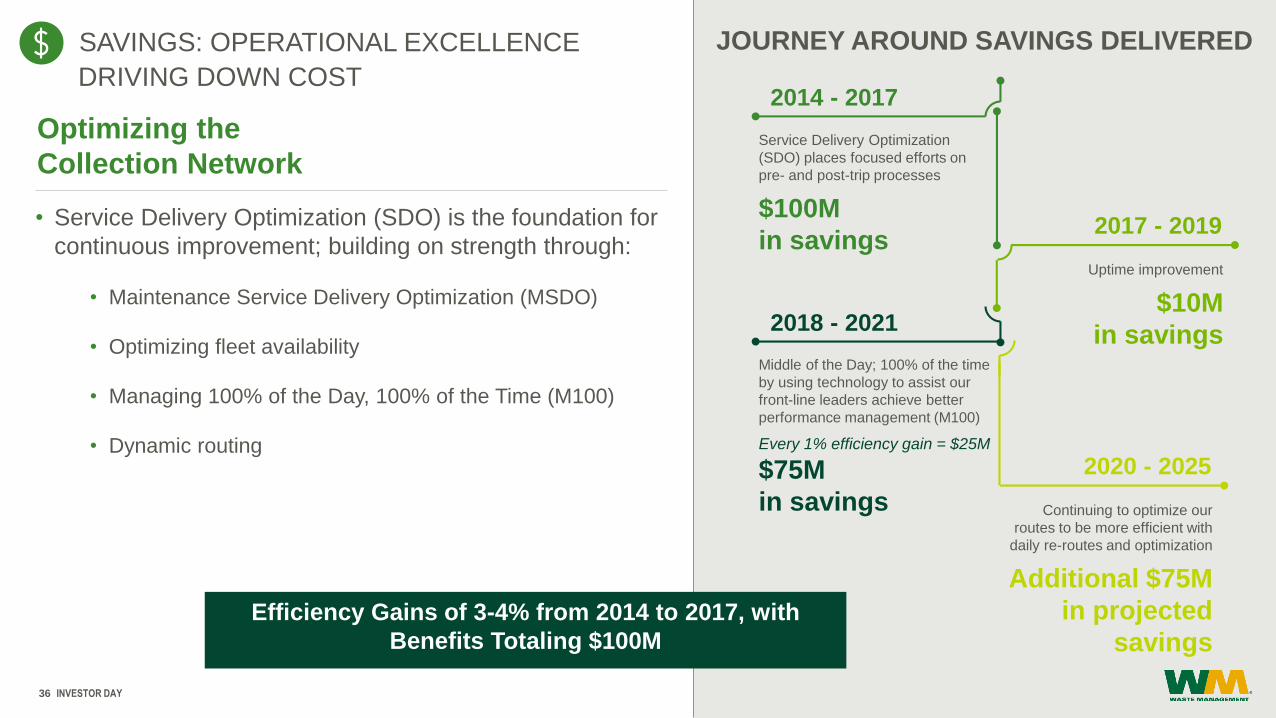
• Service Delivery Optimization (SDO) is the foundation for
continuous improvement; building on strength through:
• Maintenance Service Delivery Optimization (MSDO)
• Optimizing fleet availability
• Managing 100% of the Day, 100% of the Time (M100)
• Dynamic routing
INVESTOR DAY36
SAVINGS: OPERATIONAL EXCELLENCE
Optimizing the
Collection Network
JOURNEY AROUND SAVINGS DELIVERED
2014 - 2017
Service Delivery Optimization
(SDO) places focused efforts on
pre- and post-trip processes
$100M
in savings2017 - 2019
Uptime improvement
$10M
in savings2018 - 2021
Middle of the Day; 100% of the time
by using technology to assist our
front-line leaders achieve better
performance management (M100)
Every 1% efficiency gain = $25M
$75M
in savings
2020 - 2025
Continuing to optimize our
routes to be more efficient with
daily re-routes and optimization
Additional $75M
in projected
savingsEfficiency Gains of 3-4% from 2014 to 2017, with
Benefits Totaling $100M
DRIVING DOWN COST
INVESTOR DAY37
…AND OUR FOURTH “S”
Sustainability

INVESTOR DAY38
SUSTAINABILITY: LEADING THE CHARGE IN
GOALS
• Offset 4x the GHG emissions generated
through operations by 2038
• Emit fewer emissions by transitioning to
alternative fuel vehicles in 90% of fleet
• Purchase more than 90% Near Zero Vehicles
(NZVs) for fleet
• Use renewable fuel in over 90% of vehicles
• Reduce emissions associated with our fleet
45% by 2038, against a 2010 baseline
• Conversion of our fleet to natural gas delivers real benefits
• GHG emissions significantly reduced while creating fuel
and maintenance savings
• By year-end 2019, 60% of our routed vehicles will be
natural gas; on the path to exceed 80% by year-end 2023
Annual Fuel Savings per Truck of 8,000 Gallons
8.9 Million Fewer Total Miles Driven per Year
16% Reduction in GHG Emissions
ENVIRONMENTAL RESPONSIBILITY
POST-COLLECTION

INVESTOR DAY40
POST-COLLECTIONS: A COMPETITIVE ADVANTAGE
Complex & Sustainable Network with an Eye on the Future
247Landfills
4,946Post
Collection
Employees
5.2MTotal Tons
Processed at
Our MRFs
314
Transfer
Stations
15.2MTotal Tons
Recycled /
Composted103
Recycling
Facilities
Will Add
picture
130LFGTE & RNG
Plants in Operation
or Under
Construction
INVESTOR DAY41
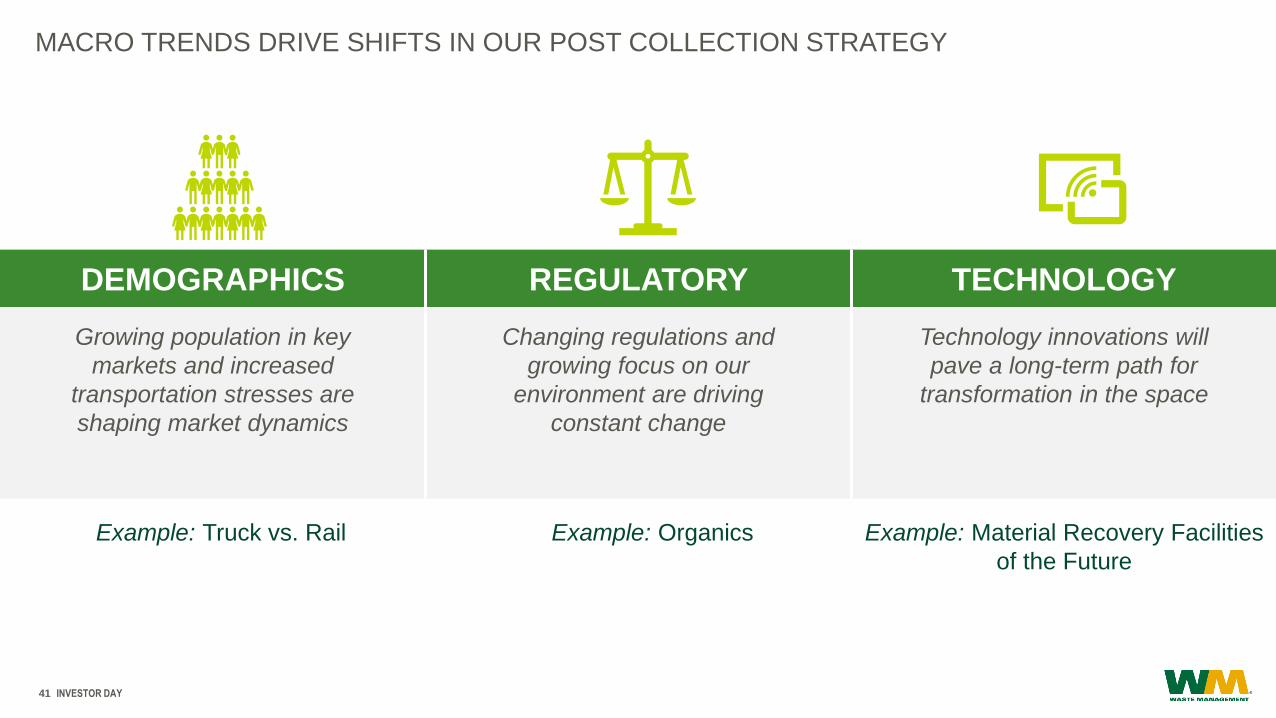
MACRO TRENDS DRIVE SHIFTS IN OUR POST COLLECTION STRATEGY
DEMOGRAPHICS REGULATORY TECHNOLOGY
Growing population in key
markets and increased
transportation stresses are
shaping market dynamics
Changing regulations and
growing focus on our
environment are driving
constant change
Technology innovations will
pave a long-term path for
transformation in the space
Example: Truck vs. Rail Example: Material Recovery Facilities
of the Future
Example: Organics

INVESTOR DAY42
SIGNIFICANT COMPETITIVE ADVANTAGES POSITION US WELL FOR THE FUTURE
Hard-to-Replicate InfrastructureIndustry-leading post-collection network or industry-leading transfer station, landfill, and recycling
network
Development and Expansion Track RecordMore landfills are closing than opening – expansions and transfer station network are key in mid-term
Sustainability as a DifferentiatorLeader in the recycling and renewable energy spaces with technological evolutions in recycling
processing and landfill gas-to-energy plants
Deep Domain ExpertiseVast internal technical capabilities and deep understanding of regulatory environment
Community PartnershipsDeep relationships with the communities we serve to achieve mutual goals

INVESTOR DAY43
OPTIMIZING MANAGEMENT OF MATERIALS THROUGH AN EVOLVING ASSET NETWORK
TRANSFER STATION &
LANDFILL
• Local and long-haul transfer
• Landfills engineered to
highest environmental
protection standards
TRADITIONAL
RECYCLING
• Material recovery
facilities (MRF)
• Processing
improvement
• Waste reduction
ADVANCED
RECYCLING
• Organics processing
• Biosolids
• E-Waste
TECHNOLOGIES OF THE
FUTURE
• Conversion technologies
• Materials to new products
1 2 3

INVESTOR DAY44
LINKING GEOGRAPHY AND TRANSPORTATION IS A STRATEGIC ADVANTAGE
Well-placed assets in key markets
fortify our sustainable competitive
advantage
• Identifying different transportation
combinations to reduce cost (e.g.,
examining the ability to rail from new
origins to new destinations)
• Diversifying transportation portfolio
to address macro pressures (e.g.,
trucking labor constraints, higher
costs)
• Accessing our network to widen our
view of disposal options
Fairless Landfill (PA)
New York City
High Acres Landfill (NY)
Atlantic Waste
Disposal (VA)
Amelia Landfill (VA)
CASE STUDY
NYC & Long Island: 26,000 Tons per Day Wasteshed
Moving waste
greater distances at
a lower cost
1
Rail
Truck

INVESTOR DAY45
CONNECTED LANDFILL: UTILIZING TECHNOLOGY AND DATA SCIENCE
Building connected landfills to achieve
a higher level of environmental
performance while reducing costs
• Utilizing data analytics and science to
maximize lifetime value of airspace
• Improving quality of life and safety for
employees
• Deploying proactive environmental
monitoring and risk solutions
• Building community relations through
operational excellence and best-in-
class compliance
Harnessing the Power of Connected Equipment Scales, heavy equipment, landfill sensors, pumps and energy generators
1
Four
Pilots
Underway

INVESTOR DAY46
HISTORY• Our plants generate the equivalent to ~4.5M
mWh/year of energy to power 460,000 homes or
replacing ~2.5M tons of coal
• 55% of gas collected is used for beneficial use
projects with established runway to improve yield
FUTURE• Build renewable natural gas (RNG) plants to convert
landfill gas into pipeline quality, which can be used to
fuel our trucks
• Provide competitive benefits as municipalities
push for environmentally-friendly options
• Quick payback and high returns
Extracting Additional Value from
Our Existing Assets
HARNESSING ENERGY FROM OUR LANDFILLS
TO ADVANCE SUSTAINABILITY GOALS
1
INVESTOR DAY47
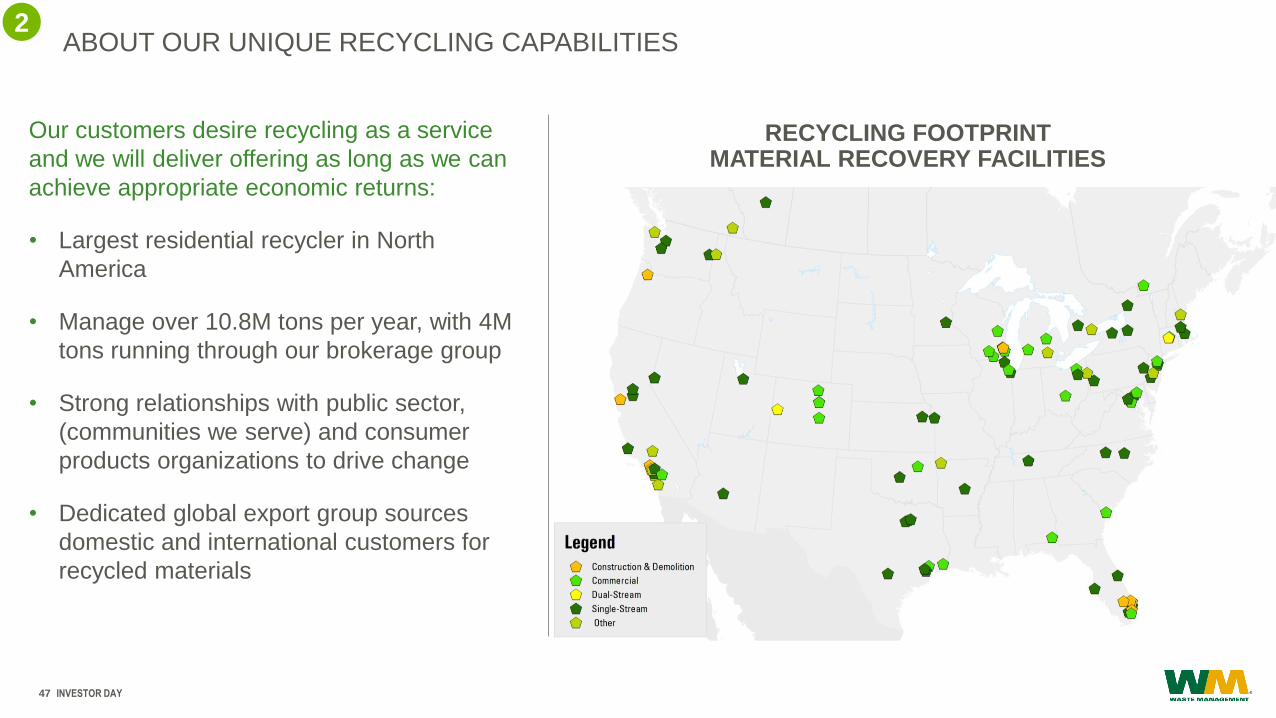
ABOUT OUR UNIQUE RECYCLING CAPABILITIES
RECYCLING FOOTPRINTMATERIAL RECOVERY FACILITIES
Our customers desire recycling as a service
and we will deliver offering as long as we can
achieve appropriate economic returns:
• Largest residential recycler in North
America
• Manage over 10.8M tons per year, with 4M
tons running through our brokerage group
• Strong relationships with public sector,
(communities we serve) and consumer
products organizations to drive change
• Dedicated global export group sources
domestic and international customers for
recycled materials
2

INVESTOR DAY48
REIMAGINING RECYCLING
As Largest Residential Recycler, We are Uniquely Positioned to Transform the Future of Recycling
2
Changing the
Business
Model
Partnering with Our
Customers,
Communities and
Stakeholders
Using Technology
to Reimagine the
Material Recovery
Facility (MRF)
• Creating a shared model where customers
pay based on price as well as processing
costs (i.e., fee-for-service model)
• Proactively consulting with customers on the
recycling cost/benefit analysis; we will
provide recycling if customers pay for the
service
• Deepening capabilities to purify our material
streams
• Improving recycling streams through
customer education programs like “Recycle
Often, Recycle Right” (www.rorr.com)
• Creating demand for recycled content (e.g.,
collaborating with The Recycling
Partnership)
• Strengthening our internal brokerage
services model to deepen relationships with
end users for our products
• Differentiate our recycling service offerings
• Drive the lowest processing cost in the
industry
• Positively sort materials based on end
markets

INVESTOR DAY49
DIFFERENTIATING RECYCLING THROUGH USE OF
TECHNOLOGY
Economically Viable and Sustainable Recycling Platform
The MRF of the FutureSignificant Potential
2
MRF OF THE FUTURE Optical Sorters + Advanced Screening Technology + Robotics
• Arranges proven technologies in a unique and thoughtful
progression, maximizing outbound quality and
minimizing operating expenses
• Chicago MRF of the Future to open late 2019
• Design will lay the framework for future investments and
further expand our competitive advantage
• Over the next 3-5 years, projects are targeted in 8-10
markets, accounting for ~30% of total recycling volumes
40% Lower Labor Costs
Source and Select Additional
Value-Added Materials
Improved Materials Purity Enables Increased Marketability

INVESTOR DAY50
ADVANCING RECYCLING: ORGANICS SOLUTIONS FOR OUR CUSTOMERS
RECOVERY COMPLEX & TRANSFER STATION | OAKLAND, CA
With mandated 100% landfill diversion of green waste and food waste in Alameda
County, the Oakland MRF will divert 60,000 tons for composting, resulting in an
estimated 37,000 tons of soil amendment a year
2
Building for the future
where our customers
demand the service
• Up to 30% of the waste
stream is food
• Cities and states with
zero waste goals are
looking to tap into this
stream
• Expanding our organics
processing footprint in
key markets (CA, NY,
NJ and Boston)
INVESTOR DAY51
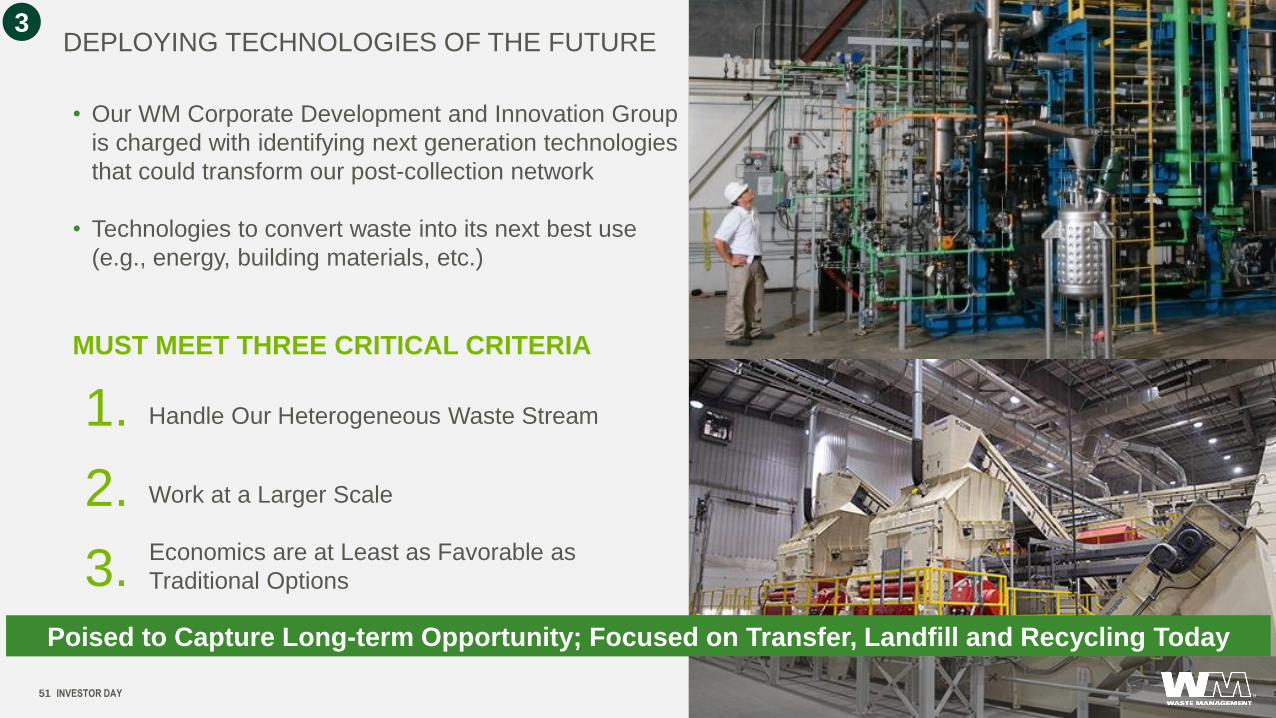
DEPLOYING TECHNOLOGIES OF THE FUTURE
• Our WM Corporate Development and Innovation Group
is charged with identifying next generation technologies
that could transform our post-collection network
• Technologies to convert waste into its next best use
(e.g., energy, building materials, etc.)
MUST MEET THREE CRITICAL CRITERIA
3
Poised to Capture Long-term Opportunity; Focused on Transfer, Landfill and Recycling Today
1.
2.
3.
Handle Our Heterogeneous Waste Stream
Work at a Larger Scale
Economics are at Least as Favorable as
Traditional Options

Focused on Above Topics
Q&A SESSION

BREAK
Tamla Oates-Forney
SVP, Chief Human Resources Officer
PEOPLE

INVESTOR DAY55
Journey to
“People First” to
Make Us an
Employer of
Choice and a
Great Place to
Work and Build a
Career
Enabling WM to
build a Culture of
Inclusion and
Innovation
Harnessing
Tenured
Workforce to
Share Domain
Expertise for
Talent
Sustainability
Transforming
Human
Resources to
Drive
Organizational
Effectiveness
Thinking
Differently to
Attract, Hire, and
Retain Top Talent
KEY MESSAGES

INVESTOR DAY56
EVOLVING OUR HUMAN RESOURCES TO ENABLE
TRANSFORMATION
World-class, Highly-skilled and Solutions-focused Team Responsive to Needs of All Stakeholders
Alignment of Roles
Solutions Approach
Breadth of Expertise
Focusing on proactively providing solutions
instead of reactively taking orders
Developing full-service HR
subject matter expertise
Eliminating duplicative responsibilities and creating
clear ownership and accountability that align to
skillsets and internal business partners

INVESTOR DAY57
HUMAN RESOURCES | STRATEGIC PILLARS
Emphasis on a “People First” Strategy Positions Us as an Employer of Choice
Human Resources
Transformation
Commitments
and Values
Contemporary
Employment
Programs
Integrated
Talent
Management
Employee
Experience
1 2 43 5

INVESTOR DAY58
CHANGING THE MODEL FOR HUMAN RESOURCES TRANSFORMATION JOURNEY
Enabling Better Alignment of Skills and Service Offerings
1
HR Centers of Excellence HR Strategic Business Partners
• Subject matter experts
• Develop and drive HR enterprise standards
• Primary point-of-contact for functional and field leadership
• Execute HR strategy in support of business and functional objectives
Org. & Talent
Development
Learning & Skills
Development
Culture &
Engagement
Systems &
Processes
Total Rewards
(C&B)Labor Relations
Corporate
Functions
Field
Operations
Partnering to Ensure Governance, Implementation and Success of the Overall WM Human Resources Strategy

INVESTOR DAY59
EMBEDDING COMMITMENTS AND VALUES IN THE WAY WE WORK
Do the Right Thing. The Right Way.
2
Our Commitments
Our People FirstThe proud, caring and resilient members of the
WM family are the foundation for our success. We
commit to taking care of each other, our customers,
our communities and the environment.
Success with IntegrityOur success is based not only on the results we
achieve but how we achieve them. We commit to
being accountable, honest, trustworthy, ethical and
compliant in all we do.
Our Values
Inclusion & DiversityWe embrace and cultivate respect, trust, open
communications and diversity of thought and people.
CustomersWe place our customers at the center of what we do and
aspire to delight them every day.
SafetyWe have zero tolerance for unsafe actions and conditions
and make safety a core value without compromise.
EnvironmentWe are responsible stewards of the environment and
champions for sustainability.

INVESTOR DAY60
CHANGING WORKFORCE INCREASING THE IMPORTANCE OF HIRING AND RETENTION 3
GENERATION PROFILE TURNOVER RATES TURNOVER BY TENURE
1%
17%
28%
38%38% 37%35%
43%
34%
26%
2% 1% 0.4%
2010 2015 2019
Gen Z Gen Y Gen X
Baby Boomers Traditionalists
19.9%20.7% 20.9% 20.6%
21.0%22.0% 22.9% 22.2%
25.5% 25.2% 25.0% 24.3%
2015 2016 2017 2018
All Driver Tech
51.2%
23.5%
11.9% 13.4%
<12 Months 1-3 Years 3-7 Years >7 Years
Workforce Comprises Five Generations;
Focus On Retention and Knowledge Transfer
to New Generations
Addressing Turnover with Drivers
and Technicians is Priority
New Hire Retention
is Critical
Creating a Competitive Advantage through Programs and Partnerships
INVESTOR DAY61
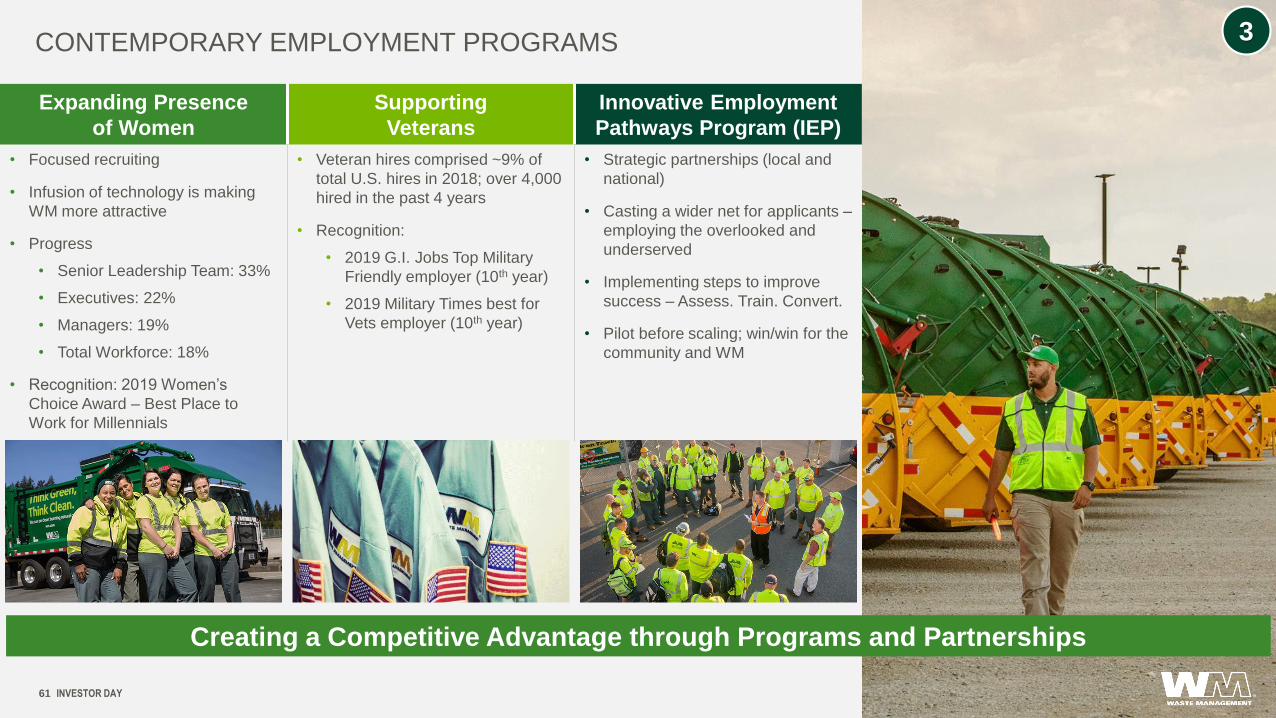
CONTEMPORARY EMPLOYMENT PROGRAMS 3
Expanding Presence
of Women
Supporting
Veterans
Innovative Employment
Pathways Program (IEP)
• Focused recruiting
• Infusion of technology is making
WM more attractive
• Progress
• Senior Leadership Team: 33%
• Executives: 22%
• Managers: 19%
• Total Workforce: 18%
• Recognition: 2019 Women’s
Choice Award – Best Place to
Work for Millennials
• Veteran hires comprised ~9% of
total U.S. hires in 2018; over 4,000
hired in the past 4 years
• Recognition:
• 2019 G.I. Jobs Top Military
Friendly employer (10th year)
• 2019 Military Times best for
Vets employer (10th year)
• Strategic partnerships (local and
national)
• Casting a wider net for applicants –
employing the overlooked and
underserved
• Implementing steps to improve
success – Assess. Train. Convert.
• Pilot before scaling; win/win for the
community and WM

Managing Talent to Ensure the Right People are in the Right Roles at the Right Time
INVESTOR DAY62
INTEGRATED TALENT MANAGEMENT 4
• Strong talent pipeline
– Make work more attractive
– More deliberate with knowledge transfer and building
intergenerational teams
• Infuse data and technology
– Strategic workforce planning
– Remote equipment operation, automated trucks
• More intentional about competency development
– Lattice vs. ladder
– Build transferrable competencies
• Consistency in approach
– Assess, develop, promote

• Work environment
– Facility upgrades
– Tools and resource investments
• Inclusion and diversity
– Multigenerational workforce
– Gender and ethnicity progress
• Better hiring tools
– Mobile application
– Applicant concierge services
• Talent
– Training and career development
– Stay interviews
INVESTOR DAY63
IMPROVING EMPLOYEE EXPERIENCE
Improving the Employee Experience Improves Our Service to Customers and Reduces Costs
5
MEASURES OF SUCCESS
Employee Retention
Leadership Diversity
External Recognition

Mike Watson
SVP, Chief Customer Officer
CUSTOMER
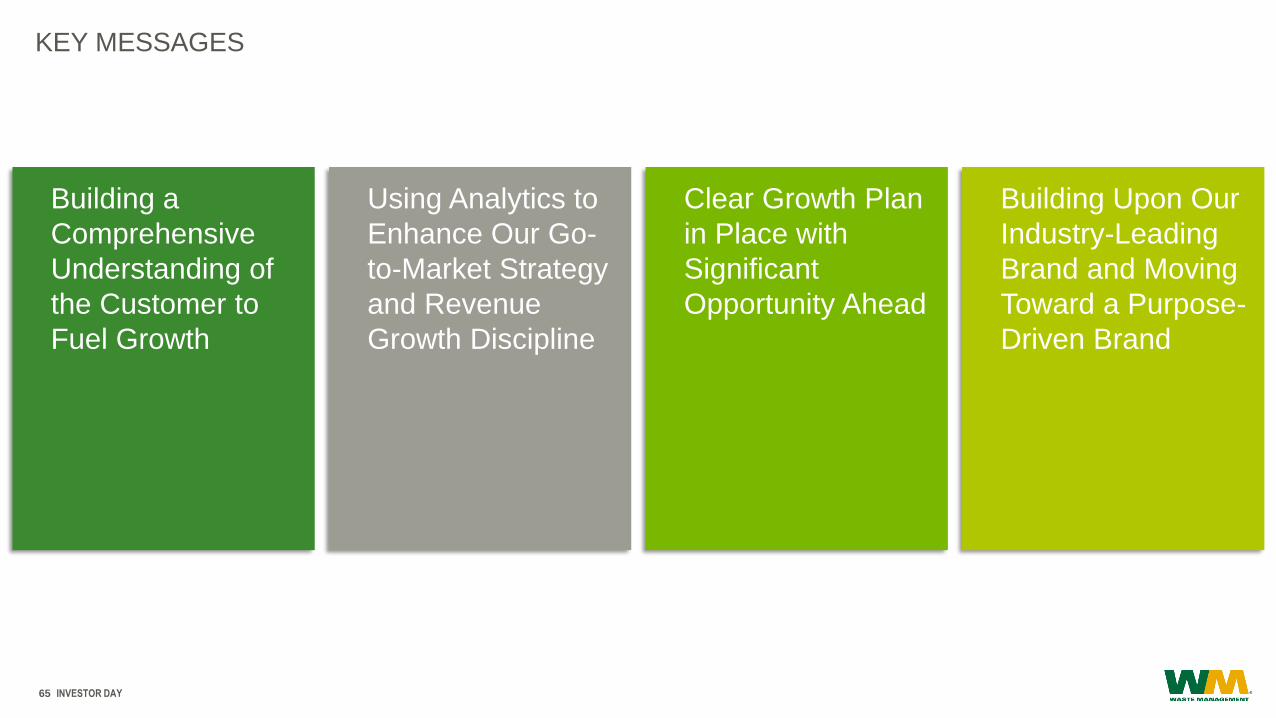
Using Analytics to
Enhance Our Go-
to-Market Strategy
and Revenue
Growth Discipline
Building a
Comprehensive
Understanding of
the Customer to
Fuel Growth
65
KEY MESSAGES
Building Upon Our
Industry-Leading
Brand and Moving
Toward a Purpose-
Driven Brand
Clear Growth Plan
in Place with
Significant
Opportunity Ahead
INVESTOR DAY
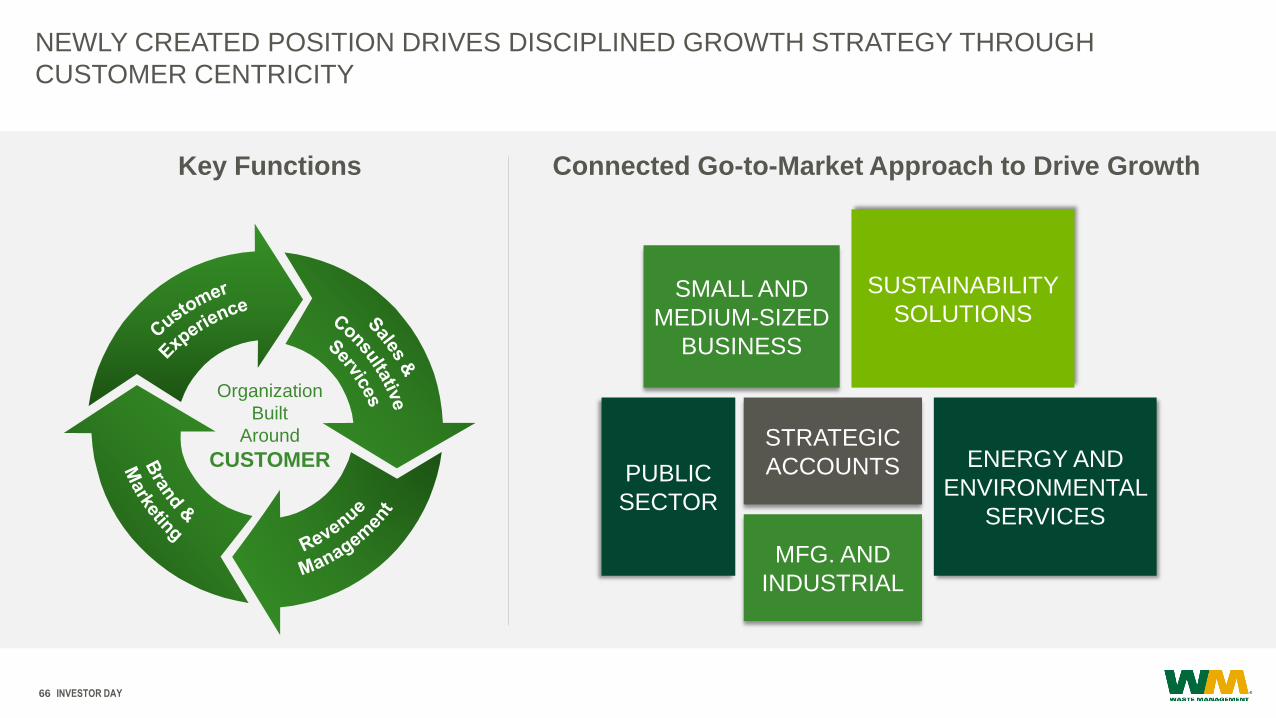
NEWLY CREATED POSITION DRIVES DISCIPLINED GROWTH STRATEGY THROUGH
CUSTOMER CENTRICITY
66 INVESTOR DAY
SMALL AND
MEDIUM-SIZED
BUSINESS
STRATEGIC
ACCOUNTS ENERGY AND
ENVIRONMENTAL
SERVICES
SUSTAINABILITY
SOLUTIONS
PUBLIC
SECTOR
MFG. AND
INDUSTRIAL
Connected Go-to-Market Approach to Drive GrowthKey Functions
Organization
Built
Around
CUSTOMER
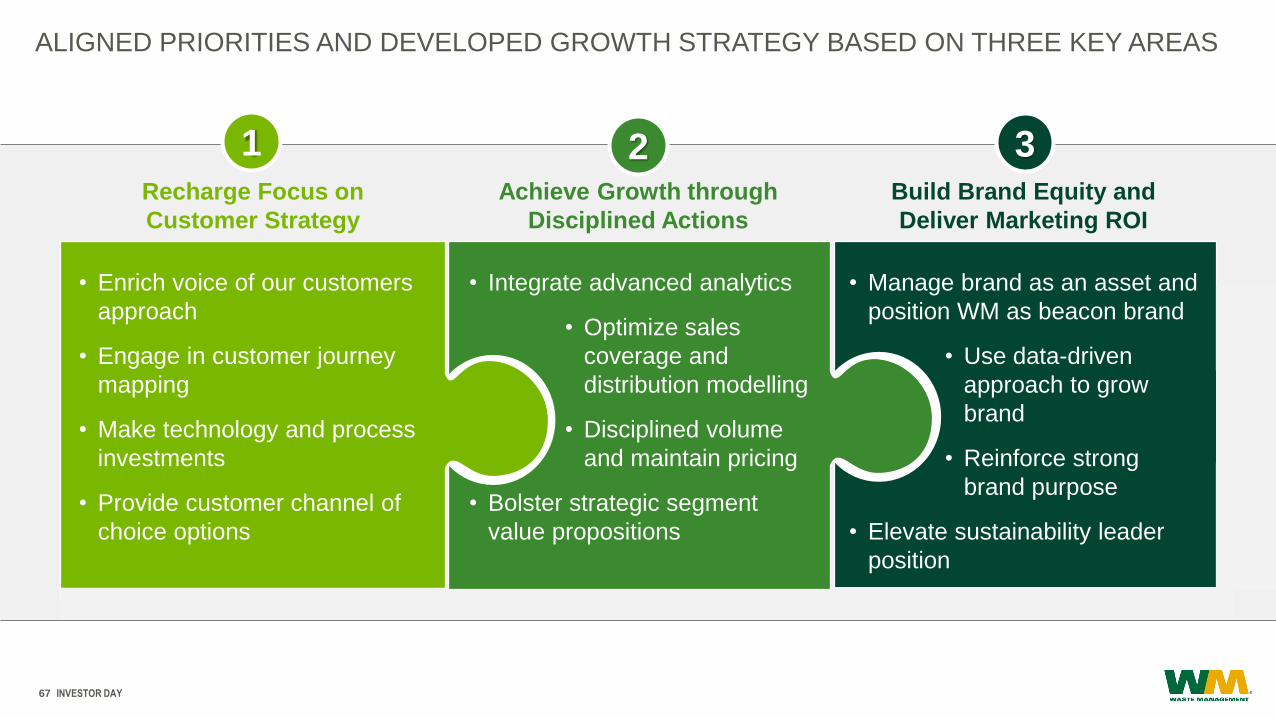
ALIGNED PRIORITIES AND DEVELOPED GROWTH STRATEGY BASED ON THREE KEY AREAS
• Enrich voice of our customers
approach
• Engage in customer journey
mapping
• Make technology and process
investments
• Provide customer channel of
choice options
• Integrate advanced analytics
• Optimize sales
coverage and
distribution modelling
• Disciplined volume
and maintain pricing
• Bolster strategic segment
value propositions
• Manage brand as an asset and
position WM as beacon brand
• Use data-driven
approach to grow
brand
• Reinforce strong
brand purpose
• Elevate sustainability leader
position
INVESTOR DAY67
Recharge Focus on
Customer Strategy
Achieve Growth through
Disciplined Actions
Build Brand Equity and
Deliver Marketing ROI
1 2 3

VoC and Customer Lifetime Value Analytics Define Our Customer Experience Strategy
INVESTOR DAY68
TAKING A MORE SOPHISTICATED APPROACH TO THE VOICE OF OUR CUSTOMERS 1
Customer
Lifetime
Value
Invest
Acquire
Develop
Retain
Increase Customer
Lifetime Value
• Targeted marketing
• Channel effectiveness
• Customer-facing technology
• Pricing optimization
• Customer experience triggers
• Retention prioritization
Customer Strategy Evolution
Macro-level
approach to
customer experience
Journey-based
customer lifetime
value analytics
69
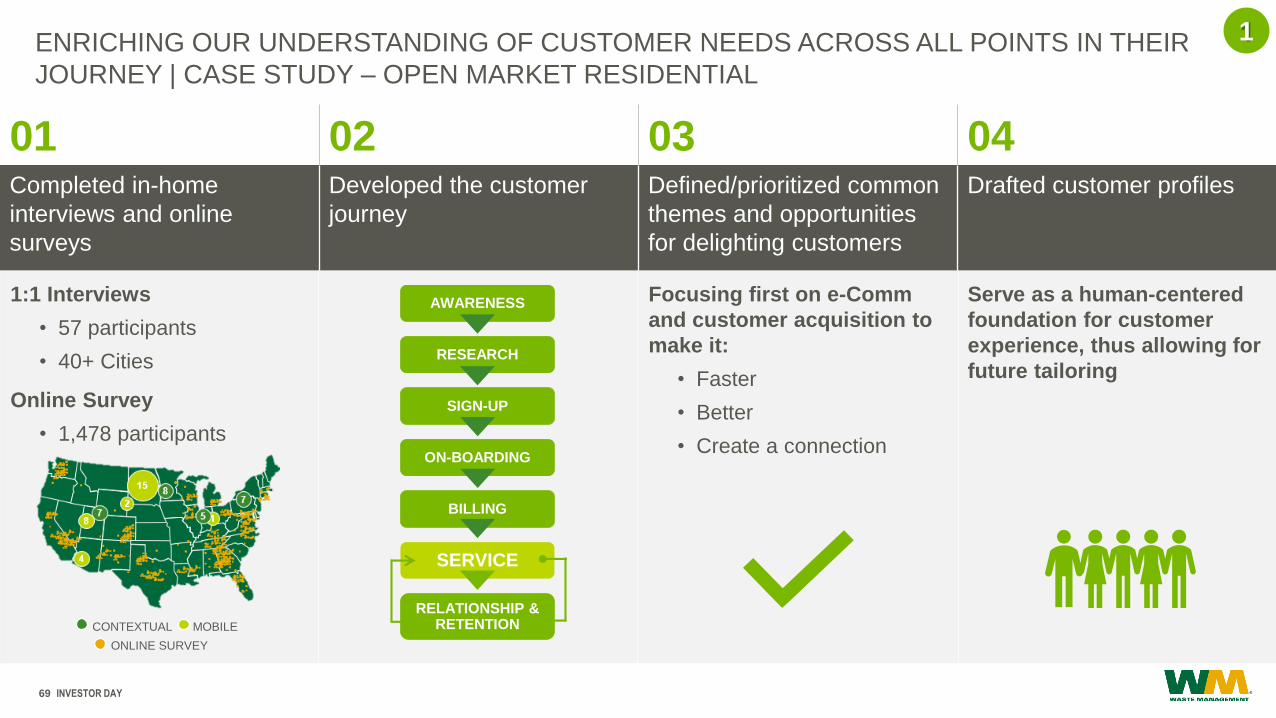
ENRICHING OUR UNDERSTANDING OF CUSTOMER NEEDS ACROSS ALL POINTS IN THEIR
JOURNEY | CASE STUDY – OPEN MARKET RESIDENTIAL
INVESTOR DAY
1
01 02 03 04Completed in-home
interviews and online
surveys
Developed the customer
journey
Defined/prioritized common
themes and opportunities
for delighting customers
Drafted customer profiles
AWARENESS
RESEARCH
SIGN-UP
ON-BOARDING
BILLING
SERVICE
RELATIONSHIP & RETENTIONCONTEXTUAL MOBILE
ONLINE SURVEY
1:1 Interviews
• 57 participants
• 40+ Cities
Online Survey
• 1,478 participants
Serve as a human-centered
foundation for customer
experience, thus allowing for
future tailoring
Focusing first on e-Comm
and customer acquisition to
make it:
• Faster
• Better
• Create a connection

OPPORTUNITY
Currently, 340 trucks outfitted with
cameras and trained drivers
Additional revenue per truck per month
of $400 to $800
Seeking to equip 5,000 trucks with
technology and training
Total projected incremental revenue
capture: $100M - $115M by 2022
Onboard Cameras Identify Customer Experience and Revenue Growth Opportunities
INVESTOR DAY70
RAISING THE BAR ON CUSTOMER SERVICE WHILE GENERATING ADDITIONAL REVENUE
Customer Experience Case Study: Smart Trucks
CHALLENGE • Inconsistent revenue capture / missed revenue and cost savings
opportunity to address container overages
• Reliance on manual / time-consuming processes:
• Driver must exit truck to take picture of over-filled/damaged container
• Inefficient method to manage picture processing and match with customer
• Customer frustration with low image quality and inconclusive service
verification
TECHNOLOGY-
ENABLED
SOLUTION
• Installed cameras on trucks connected to GPS; now able to:
• Efficiently and effectively capture images/service verification
• Assess container conditions (e.g., damage, service needs, etc.)
• Consistently detect opportunities to capture additional revenue
• Automatically and accurately links customer records to image
OUTCOMES • Enhanced customer experience by addressing container condition
• Improved customer retention through proactive service adjustments
• Increased revenue through increases in service/capturing overages
• Cost savings as drivers focus on efficiently servicing customers
• Improved safety of driver avoiding unnecessary exits of the truck
1

71
ACHIEVE GROWTH THROUGH DISCIPLINED ACTIONS 2
INVESTOR DAY
Disciplined Volume Growth in All
LOBs while Maintaining Pricing
Using Advanced Analytics to
Target and Drive Improvements
Optimize Sales Coverage with
Advanced Workforce Planning
Analytics
• Data driven approach enables market planning
• Economic indicators and internal performance
measured across 384 Business Units
• Predictive defection modelling influencing PI
models and prioritizing retention activity
• Customer Lifetime Value (CLV) approach to
relationship management
• Optimize sales model to maximize ROI and
customer coverage
• Sales Service Delivery Optimization (SSDO)
drives continuous improvement through KPIs
and standard procedures
RESULTS
• Q1 Core Price:1 +74 bps YoY to 5.8%
• Volume: +45 bps YoY; +36 bps vs. GDP
• Positive 1.7% Net Customers
• Defection of 8.1%; Equals 70 bps better YoY; Lowest
defection in 3 years
• Flat sales expense YoY with +11% FTE sales
productivity
1. Core price consists of price increases net of rollbacks and fees, excluding the Company’s fuel surcharge. It is a performance metric used by management to evaluate the effectiveness of our pricing
strategies; it is not derived from our financial statements and may not be comparable to measures presented by other companies. Core price is based on certain historical assumptions, which may differ
from actual results, to allow for comparability between reporting periods and to reveal trends in results over time.

Our Customers Are Seeking a Partner to Help Them Meet Their Environmental, Regulatory, Financial and Sustainability Goals
INVESTOR DAY72
EXPANDING VALUE PROPOSITIONS FOR STRATEGIC SEGMENTS
2018 Revenue of $252M; 3-Year CAGR of 25%
1. Since 2003.
2
ONSITE PROGRAMS
✓ Deploying personnel and equipment on customers’ sites bring us closer to our customers
and the waste they generate
REMOTE SERVICES
✓ Enterprise-wide offering provides WM access to all waste streams in exchange for a
streamlined solution to the customer’s waste disposal needs
INDUSTRIAL WASTE PROCESSING
✓ Dewatering wet waste streams reduces volume and cost for customers while expanding
WMs disposal market
CONSULTING SERVICES
✓ Partnership platform combines in-depth assessments and advisory services to drive
customer solutions while providing WM valuable insights to design future service
offerings
43%
27%
24%
6%
Process Improvement
Recycle/Reuse
Strategic Sourcing
Optimized Logistics
CUSTOMER IMPACT
Total Customer Savings in 2018: $12M
Cost Savings by Solutions Type
$211M+Total Customer Savings To-Date1
SUSTAINABILITY SERVICES OVERVIEW

Comprehensive Offerings to Service Differentiated Needs of the Manufacturing and Industrial Customer Base;
Enabling Preferred Access to Large Volume Waste Streams
INVESTOR DAY73
BOLSTERING UNIQUELY POSITIONED VALUE PROPOSITIONS FOR STRATEGIC SEGMENTS
Building Long-term Customer Relationships Positions Us to Capture Greater Market Share
2
ELECTRIC UTILITY SEGMENT,
A $50B ADDRESSABLE MARKET1
WM is the only provider whose portfolio of services
covers all potential options for Coal Combustion
Residuals (CCR), including
✓ Beneficial reuse of marketable materials
✓ Construction and operation of customer-owned
disposal facilities
✓ Excavation, loading and transportation for disposal
at WM post-collection facilities
Since 2010, we have managed 33M tons of CCR for
our electric utility customers, including
1. Yoder, S.; Andracsek, R.; (2015, December 2). The Real Cost of the CCR Rule. Retrieved from www.power-eng.com.
Beneficial reuse of
6M tons of material
Management and/or disposal of
18M tons of CCR at customer sites
Specialized disposal of
9M tons of CCR at our facility

According to Third-party Research, Brand Equity is Directly Correlated to Market Value
WE ARE THE LEADER IN THE INDUSTRY WITH OPPORTUNITY TO ENHANCE BRAND VALUE,
BUILD BRAND EQUITY AND DELIVER MARKETING ROI
How We Grow
Brand Equity
✓ Establish strong brand purpose
✓ Be recognized as a leader in
sustainability
✓ Connect our brand with ESG
principles
✓ Make sophisticated marketing
investments
✓ Align brand purpose with
strategic business planning
✓ Be an employer of choice
3
74 INVESTOR DAY
TODAY
FUTURE-STATE
State FarmSubaru
REI
UPS Southwest
John Deere
WM
WM
Waste Category
AspirationService
Higher Ground
Baseline Need
Source: Based on Third-party and Company estimates.

• WM Phoenix Open is the
largest ZERO WASTE event in the world
• $100M+ Earned Media
INVESTOR DAY75
3

Nikolaj Sjoqvist
SVP, Chief Digital Officer
DIGITAL

INVESTOR DAY77
KEY MESSAGES
WM Undergoing
Digital
Transformation
3 Big Levers Will
Drive Impact
This is Just the
Beginning
Accelerate
Organic Growth
and Reduce Cost
Changing “What”
We Focus On
and “How” We
Do It
New Day, New Way

INVESTOR DAY78
DIGITAL AT WASTE MANAGEMENT DEFINED
The WM Strategy is Enabled by Digital in Collaboration with the Business
INVESTOR DAY79
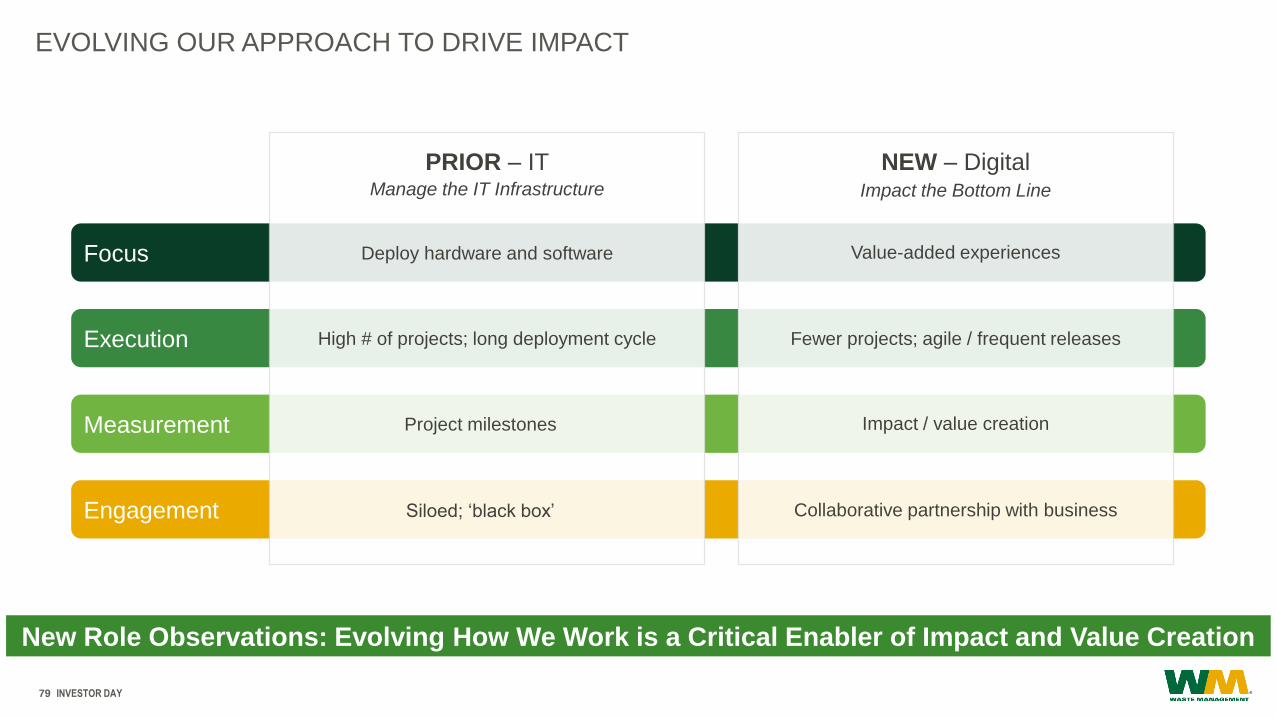
EVOLVING OUR APPROACH TO DRIVE IMPACT
New Role Observations: Evolving How We Work is a Critical Enabler of Impact and Value Creation
Focus
Measurement
Engagement
Execution
PRIOR – IT Manage the IT Infrastructure
Deploy hardware and software
High # of projects; long deployment cycle
Project milestones
Siloed; ‘black box’
NEW – Digital Impact the Bottom Line
Impact / value creation
Fewer projects; agile / frequent releases
Value-added experiences
Collaborative partnership with business

Risk Mitigation and
Business Enablement
Strengthening our technology
foundation to enable innovation
Operational
Improvements
Leveraging technology to
accelerate operational
excellence and reduce cost
Customer
Experience
Leveraging technology to
delight our customers and
drive growth
1 2 3
INVESTOR DAY80
DRIVING VALUE THROUGH 3 ‘BIG LEVERS’ & ENABLING TECHNOLOGIES
Artificial Intelligence Image Recognition Machine Learning IoT Natural Language Processing Chat Bots
Robotic Process Automation Cloud Mobile Remote-Controlled Vehicles Advanced Threat Detection
Predictive Analytics Geolocation Analytics Optimization Modeling Advanced Authentication
Edge Computing Voice Assistance Blockchain Augmented Reality 5G
Employee Enablement is Core to Transformation and Common to All Levers
INVESTOR DAY81
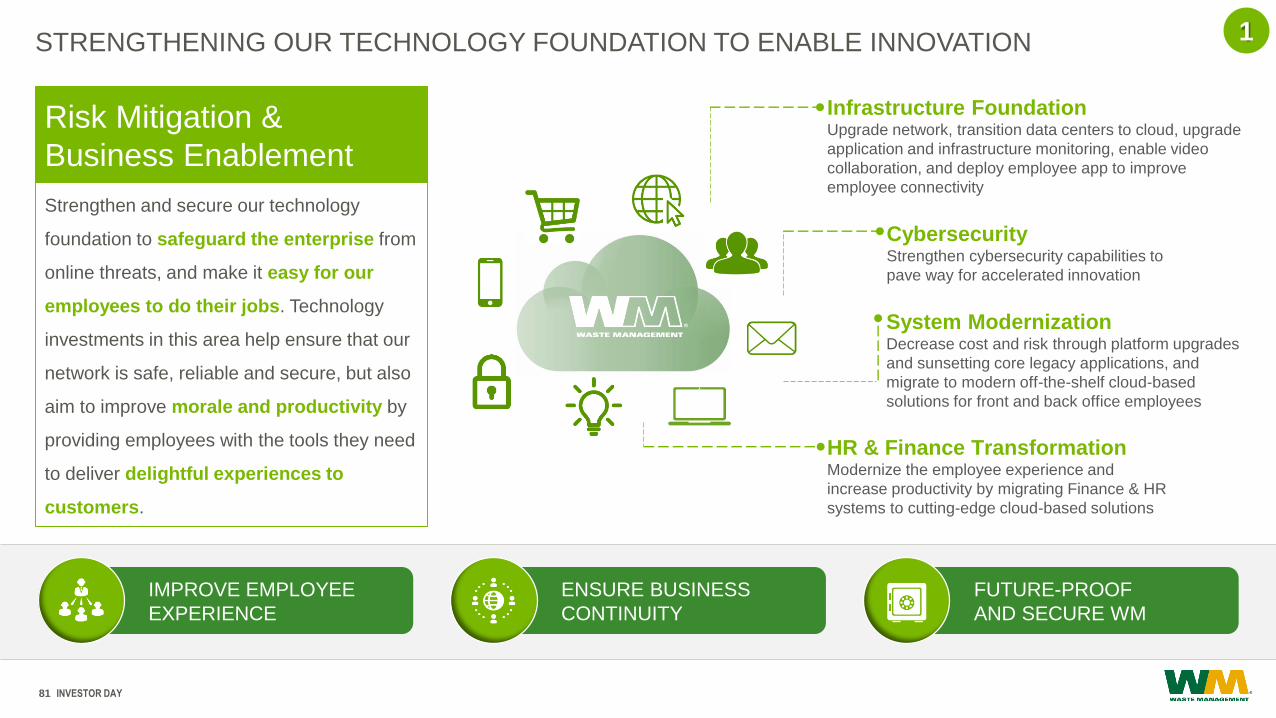
STRENGTHENING OUR TECHNOLOGY FOUNDATION TO ENABLE INNOVATION 1
IMPROVE EMPLOYEE
EXPERIENCE
ENSURE BUSINESS
CONTINUITY
FUTURE-PROOF
AND SECURE WM
Risk Mitigation &
Business Enablement
Strengthen and secure our technology
foundation to safeguard the enterprise from
online threats, and make it easy for our
employees to do their jobs. Technology
investments in this area help ensure that our
network is safe, reliable and secure, but also
aim to improve morale and productivity by
providing employees with the tools they need
to deliver delightful experiences to
customers.
Infrastructure FoundationUpgrade network, transition data centers to cloud, upgrade
application and infrastructure monitoring, enable video
collaboration, and deploy employee app to improve
employee connectivity
CybersecurityStrengthen cybersecurity capabilities to
pave way for accelerated innovation
System ModernizationDecrease cost and risk through platform upgrades
and sunsetting core legacy applications, and
migrate to modern off-the-shelf cloud-based
solutions for front and back office employees
HR & Finance TransformationModernize the employee experience and
increase productivity by migrating Finance & HR
systems to cutting-edge cloud-based solutions

INVESTOR DAY82
ACCELERATING OPERATIONAL EXCELLENCE THROUGH TARGETED INVESTMENTS 2
Operational
Improvements
Make operations more effective and efficient
by implementing digital tools that accelerate
operational excellence and enable our
employees to deliver on commitments to
customers. Drive cost reduction and margin
expansion through improvements in
efficiency, capital allocation and
maintenance. Strengthen differentiation in
the industry and enable organic growth.
MAXIMIZE
ASSET UTILIZATION
REDUCE
COSTS
ENABLE DIFFERENTIATED
SERVICE & GROWTH
M100Increase collection labor efficiency
by managing 100% of the day
[Every 1% efficiency = $25M]
Smart TruckLeverage real-time video technology on
collection fleet to right-size customer
service, reduce contamination, and
create platform for further differentiation
Future FleetMaximize return on fleet assets by optimizing
the mix, maintenance and asset uptime
Post-Collection AutomationImprove post collections ops through
real-time monitoring, automation and
decision models

INVESTOR DAY83
DELIGHTING CUSTOMERS IN THEIR CHANNEL OF CHOICE TO INCREASE DIFFERENTIATION 3
Customer
Experience
Delight customers across their life cycles
through industry leading digitally-powered
experiences that set us apart from the pack,
and provide our employees with the tools
to exceed customer expectations. Targeted
outcomes include accelerated volume
growth (organic customer acquisition and
retention), improved pricing and reduced
cost-to-serve.
FUEL
ORGANIC GROWTH
INCREASE CUSTOMER
LIFETIME VALUE
REDUCE
COST-TO-SERVE
E-CommerceIncrease acquisition with fast, easy, differentiated online
buying experience for core collection lines of business
[$9-10B total addressable market for Collection]
Sales & Service Agent ExperienceTransform the customer-facing employee experience
through a seamlessly integrated and intuitive experience
that fuels customer acquisition and retention
Digital Self-ServiceImprove customer stickiness and cost-to-serve through
capabilities tailored to the varied needs of our customer
segments, ranging from simple ETA and pick-up requests
to complex spend analytics
[Opportunity to reduce 12M calls at $8/call]

INVESTOR DAY84
DIGITAL STRATEGY IN ACTION: E-COMMERCE FOR COLLECTION CUSTOMERS
WHAT WE DID
• Spent time with customers in their homes to deeply understand needs
• Designed new experience through agile 2 week sprints with customers
• Launched in 3 months
GROWING: Expanded new e-Commerce to other Collection lines of
business in Q1’19
• Digitized the buying experience, incorporating lessons learned from OMR
• Early results are promising, consistent with OMR
• Paving the way to meet customers in their channel of choice, and
continuing to improve the buying experience (still plenty of headroom)
OUTCOME
• Reduced time-to-buy by 50% by simplifying experience
• Saw 70% adoption of new monthly bill pay, fueling 96% autopay rate
• Realized 40% overnight revenue increase with steady ongoing growth
PILOT: Deployed new e-Commerce experience to Open Market Residential (OMR) mid-2018

INVESTOR DAY85
FUNDAMENTALLY CHANGING HOW WE MEASURE SUCCESS
e-Commerce Dashboard Operational Improvements Dashboard
METRICS-BASED AND IMPACT-ORIENTED
Leveraging data & analytics to quickly identify opportunities
for improved customer experience and growth
TRANSPARENCY LIKE NEVER BEFORE
Holding ourselves accountable through data-driven
metrics that track our collective progress
Chuck Boettcher
SVP, Corporate Development and Chief Legal Officer
CORPORATE DEVELOPMENT
AND INNOVATION
INVESTOR DAY87
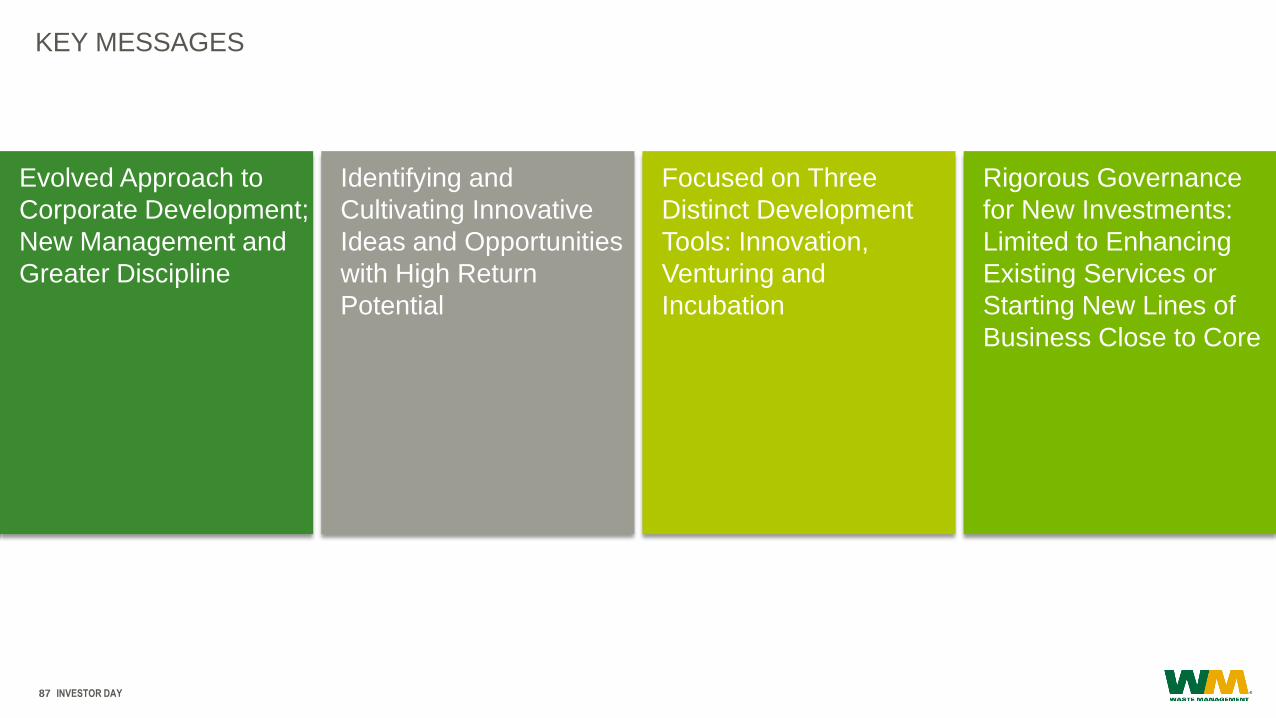
KEY MESSAGES
Evolved Approach to
Corporate Development;
New Management and
Greater Discipline
Focused on Three
Distinct Development
Tools: Innovation,
Venturing and
Incubation
Identifying and
Cultivating Innovative
Ideas and Opportunities
with High Return
Potential
Rigorous Governance
for New Investments:
Limited to Enhancing
Existing Services or
Starting New Lines of
Business Close to Core

INVESTOR DAY88
NEW CORPORATE DEVELOPMENT AND INNOVATION STRUCTURE
New Corp Dev and Innovation Group Targets Incremental Growth with Lower Risk Profile
Investment Scope
Investment Process
Focus
Investment Goal
PRIOR Structure
Bias toward larger investments in early-stage companies
Lacking clear connection to core business
and exit strategy
Diversified/scattered portfolio approach
Research and investment
NEW Structure
Rigorous ideation, market scoping, and governance
structure with close SLT oversight
Connection to core business
and clear investment objectives
Invest in Venture Funds and make smaller, targeted
direct investments in proven growth companies or ideas
Research, innovation, development and licensing

KEY METRICS
INVESTOR DAY89
CORP DEV & INNOVATION GROUP OVERVIEW
6 WM Employees
15%+ IRR Threshold
Committed to Three Externally-
managed Venture Funds~$15M
SCOPE
LEARN
UNDERSTAND
EXECUTE
CORPORATE
DEVELOPMENT
INCUBATION(“Start-up”)
Three Distinct Development Tools
~12 Direct Investments

INVESTOR DAY90
INNOVATION (“CREATING”)
Stay at the Forefront of Emerging Technology and Innovative Processes
• Creating an Innovation Lab / Maker Space (close to
the core – innovating around tools and core
processes)
• Developing ecosystem partnerships to
co-collaborate and quickly innovate; selected
examples include:
• Remote operation of landfill vehicles
• Autonomous vehicles
• Long-term focus is on organically developing
• Protecting inventions and potentially licensing to
third-parties as additional revenue stream
CASE STUDY: DADS LANDFILL (CAT PARTNERSHIP)
Use Remote Operation Technology to Improve Operations
and Employee Satisfaction/Availability
Our Goals
• Deploy remote operations of heavy equipment at landfills
• Improve safety and efficiency
• Enhance the available labor pool of employee operators
beyond traditional sources; improve job satisfaction
Outcome
✓ While still early, initial results demonstrate increased
efficiency and safety, as well as lower costs

INVESTOR DAY91
Early Insight to Emerging Technology and Innovative Processes Globally
EXTERNAL INSIGHT~$15M in Capital Commitment in
Externally Managed Funds
• Scout globally for potential disruptive technologies,
innovative processes and immediately deployable
customer solutions
INTERNAL INSIGHT
• Internally review 100+ companies per year with disruptive
technologies or innovative processes in the waste and
recycling industry
INTERNAL & EXTERNAL INSIGHT
• Early identification of potential breakthrough technologies
and processes
• Global ecosystem; comprises entrepreneurs and early-
stage companies
• Relationships inform our view on emerging technologies
and innovative processes and relevant market applications
OVERVIEW OF INVESTMENT FUNDS
VENTURING (“SCOUTING”)
KEY STATS Enertech Emerarld Zouk
Fund Size
(by commitments)$118.5M €71M €218.6M
# of Investments 10 8 6
Focus Areas
Early to
midstage
cleantech,
oil and gas
innovation,
utility and
water
efficiency
companies
Early to
expansion
stage
emerging
energy,
water and
industrial
technology
and process
innovation
companies
Permitted
renewable
energy and
efficiency
projects in
Europe

INVESTOR DAY92
INCUBATION (“START-UP”)
Vertical Start-ups
• Universe of opportunity to enter new and closely
adjacent lines of business to better serve existing
customers with enhanced offerings
• Rigorous internal process created over the last 18
months; stage/phase gate process managed by
Corporate Development and Innovation Group with
involvement of WM business owners and internal
expertise, as applicable, and oversight by Senior
Leadership Team
• Currently focusing on markets that provide
solutions to customer problems and have potential
to grow quickly as scaled; e.g., wastewater, biosolid
management, and plastics and packaging solutions
• Execute quickly and fail fast
• Transition into core business quickly or exit
IDEA DEVELOPMENT MARKET SCOPING START-UP ID EXECUTION
Ideation Filters Market Analysis Detailed
Economic & Risk
Evaluation
Detailed Co. or
Team
Assessments &
Selection (as
applicable)
Implementation
Worthy of VP
Sponsorship
Feasibility
Assessment
Economic/Risk
Assessment
Final Project
Approval
Strategic
Alignment
SLT NOTIFICATION SLT APPROVAL SLT APPROVAL
GATE 1 GATE 2 GATE 3 GATE 4 GATE 5
IDEA TO EXECUTION PROCESS – “PHASES & GATES”

Devina Rankin
SVP, Chief Financial Officer
FINANCIAL OVERVIEW
INVESTOR DAY94
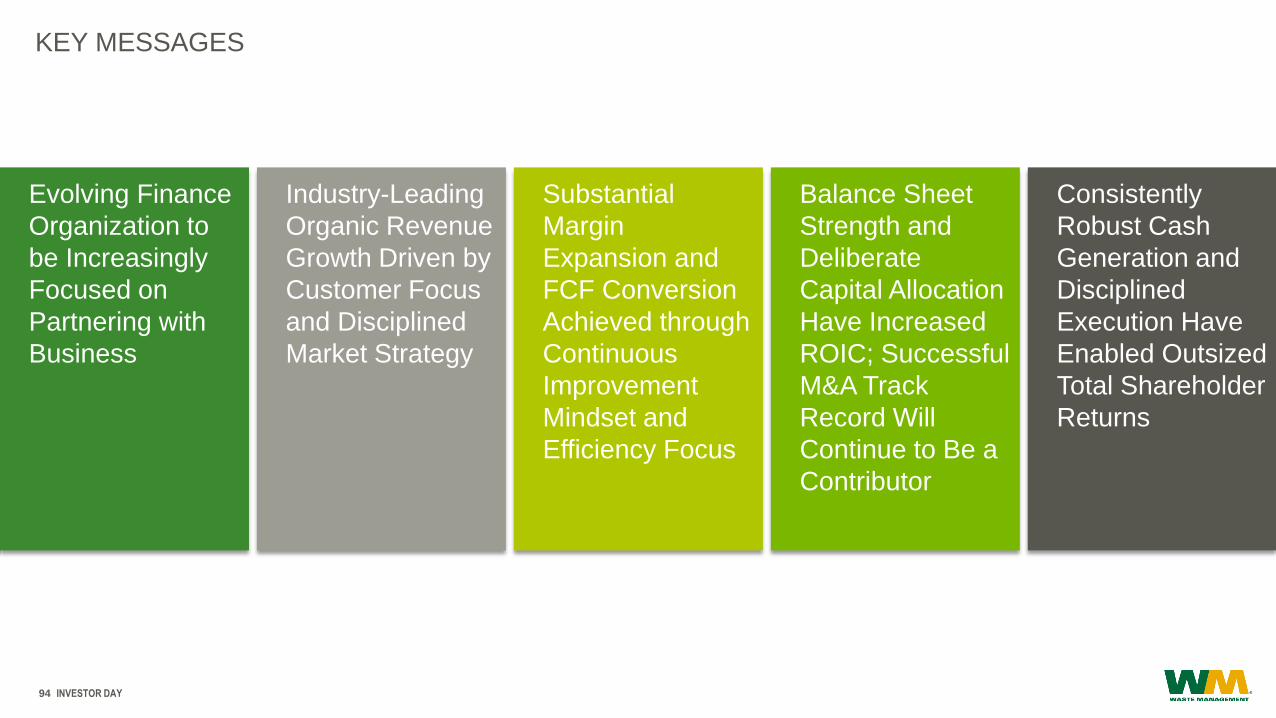
KEY MESSAGES
Evolving Finance
Organization to
be Increasingly
Focused on
Partnering with
Business
Substantial
Margin
Expansion and
FCF Conversion
Achieved through
Continuous
Improvement
Mindset and
Efficiency Focus
Consistently
Robust Cash
Generation and
Disciplined
Execution Have
Enabled Outsized
Total Shareholder
Returns
Industry-Leading
Organic Revenue
Growth Driven by
Customer Focus
and Disciplined
Market Strategy
Balance Sheet
Strength and
Deliberate
Capital Allocation
Have Increased
ROIC; Successful
M&A Track
Record Will
Continue to Be a
Contributor

Increasingly Effective Team Focused on Enhancing Value Creation
INVESTOR DAY95
EVOLVING WM FINANCE TO BE INCREASINGLY FOCUSED ON PARTNERING WITH BUSINESS
PEOPLE
Enhancing and Leveraging WM’s Finance Talent to Move Beyond
Traditional Compliance Focuses
• Ensuring our people are at the center of all we do, empowering
them to engage beyond standard role definitions
• Moving beyond data and reporting toward insight
• Recognizing the value of approaching traditional back-office
functions with a commitment to customer service
• Engaging beyond the function to better understand the business
and the macro-environment to ensure our focuses establish
more purposeful connection to WM strategic priorities and
shareholder objectives
• Appropriately challenging standard practices to deliver more;
knowing when excellence should be the goal
Positioning WM Finance and other corporate support functions to
amplify our best-in-class asset network and customer base

INVESTOR DAY96
CUSTOMER FOCUS AND DISCIPLINED MARKET STRATEGY HAVE PRODUCED INDUSTRY-
LEADING ORGANIC REVENUE GROWTH
1.4%
2.7%
3.2%
2016 2017 2018
Collection & Disposal Volume
2.4%
2.0%
2.3%
2016 2017 2018
Collection & Disposal Yield
• Continuing to focus on customer
offering; differentiated service,
technology to communicate with us
through their channel of choice, and
improving the quality of our service
• Customer focus has produced a
meaningful reduction in churn, from
a high of close to 12% in 2014 to
about 8% today
• Leveraging data and analytics to
appropriately price new and existing
customers based on cost
• Proactively working with customers
to right-size their service levels and
address their needs
$13.6
$14.5
$14.9
2016 2017 2018
The 2017 to 2018 Revenue Comparisons are negatively
impacted by the adoption of the revenue recognition
standard, ASU 2014-09.
4.7% CAGR
TOTAL REVENUE ($B)
INVESTOR DAY97
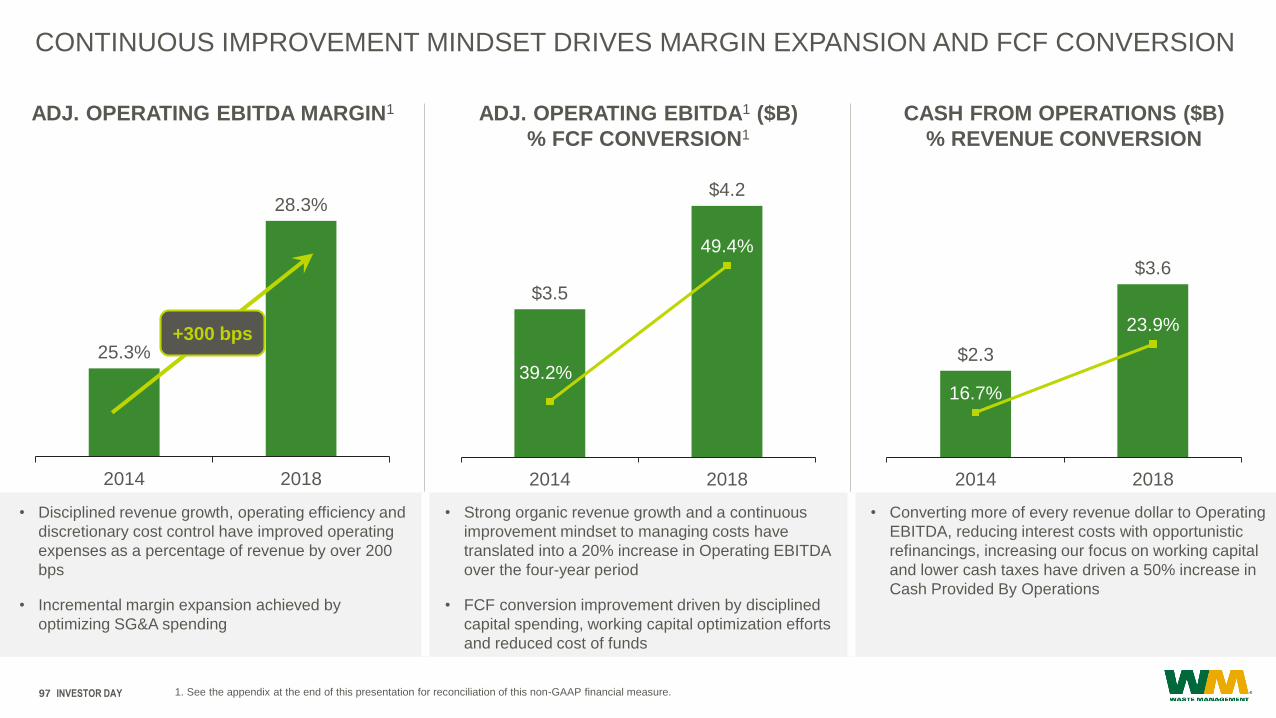
CONTINUOUS IMPROVEMENT MINDSET DRIVES MARGIN EXPANSION AND FCF CONVERSION
1. See the appendix at the end of this presentation for reconciliation of this non-GAAP financial measure.
• Disciplined revenue growth, operating efficiency and
discretionary cost control have improved operating
expenses as a percentage of revenue by over 200
bps
• Incremental margin expansion achieved by
optimizing SG&A spending
• Strong organic revenue growth and a continuous
improvement mindset to managing costs have
translated into a 20% increase in Operating EBITDA
over the four-year period
• FCF conversion improvement driven by disciplined
capital spending, working capital optimization efforts
and reduced cost of funds
• Converting more of every revenue dollar to Operating
EBITDA, reducing interest costs with opportunistic
refinancings, increasing our focus on working capital
and lower cash taxes have driven a 50% increase in
Cash Provided By Operations
$3.5
$4.2
39.2%
49.4%
2014 2018
$2.3
$3.6
16.7%
23.9%
2014 2018
25.3%
28.3%
2014 2018
ADJ. OPERATING EBITDA MARGIN1 ADJ. OPERATING EBITDA1 ($B)
% FCF CONVERSION1
CASH FROM OPERATIONS ($B)
% REVENUE CONVERSION
+300 bps
Discipline Demonstrated in Operating Expense and Capital Management Also Applied to SG&A
INVESTOR DAY98
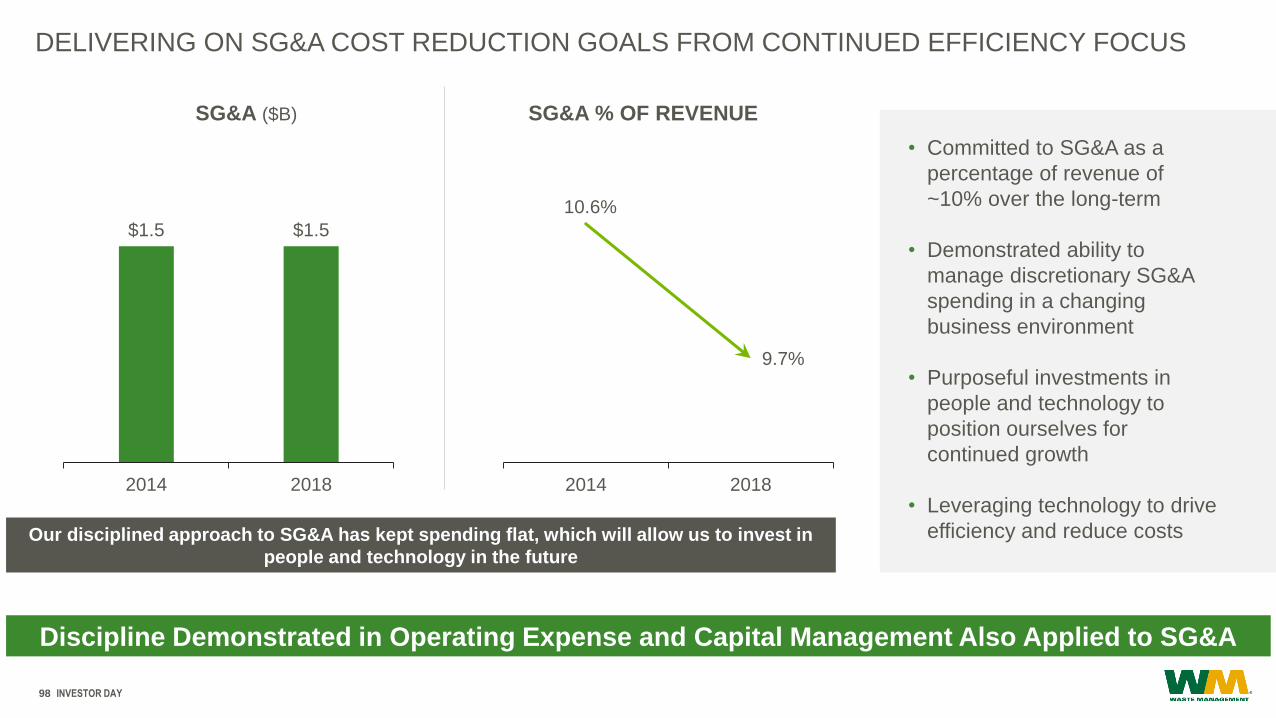
DELIVERING ON SG&A COST REDUCTION GOALS FROM CONTINUED EFFICIENCY FOCUS
SG&A ($B) SG&A % OF REVENUE
Our disciplined approach to SG&A has kept spending flat, which will allow us to invest in
people and technology in the future
$1.5 $1.5
2014 2018
10.6%
9.7%
2014 2018
• Committed to SG&A as a
percentage of revenue of
~10% over the long-term
• Demonstrated ability to
manage discretionary SG&A
spending in a changing
business environment
• Purposeful investments in
people and technology to
position ourselves for
continued growth
• Leveraging technology to drive
efficiency and reduce costs
• Committed to maintaining investment grade
credit rating
– Deep access to capital markets
– Competitive advantage, particularly with
municipal and large M&I customers
– Strategic flexibility
• ~$2.75B revolver borrowing capacity
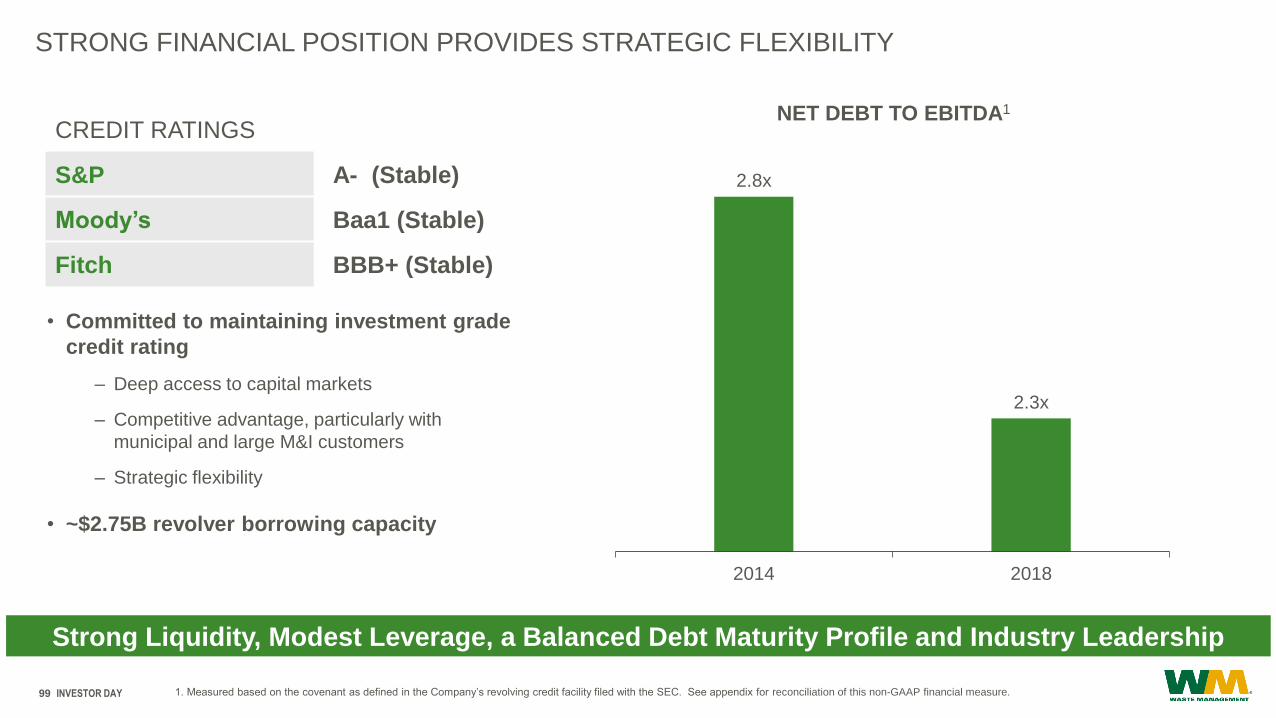
Strong Liquidity, Modest Leverage, a Balanced Debt Maturity Profile and Industry Leadership
INVESTOR DAY99
STRONG FINANCIAL POSITION PROVIDES STRATEGIC FLEXIBILITY
1. Measured based on the covenant as defined in the Company’s revolving credit facility filed with the SEC. See appendix for reconciliation of this non-GAAP financial measure.
CREDIT RATINGS
S&P A- (Stable)
Moody’s Baa1 (Stable)
Fitch BBB+ (Stable)
2.8x
2.3x
2014 2018
NET DEBT TO EBITDA1
Robust Cash Generation Translates into Consistent Capital Allocation
INVESTOR DAY100
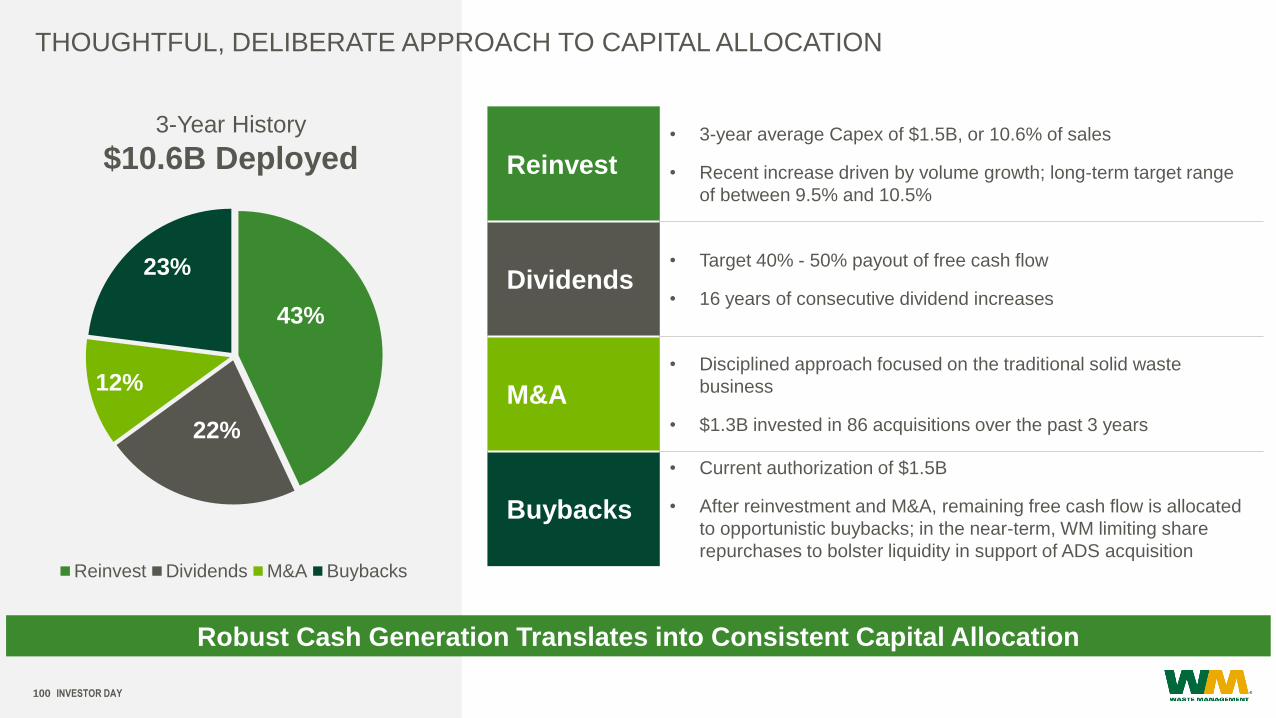
THOUGHTFUL, DELIBERATE APPROACH TO CAPITAL ALLOCATION
Reinvest
• 3-year average Capex of $1.5B, or 10.6% of sales
• Recent increase driven by volume growth; long-term target range
of between 9.5% and 10.5%
Dividends• Target 40% - 50% payout of free cash flow
• 16 years of consecutive dividend increases
M&A
• Disciplined approach focused on the traditional solid waste
business
• $1.3B invested in 86 acquisitions over the past 3 years
Buybacks
• Current authorization of $1.5B
• After reinvestment and M&A, remaining free cash flow is allocated
to opportunistic buybacks; in the near-term, WM limiting share
repurchases to bolster liquidity in support of ADS acquisition
43%
22%
12%
23%
Reinvest Dividends M&A Buybacks
3-Year History
$10.6B Deployed

BoD Approved Increase in Quarterly Dividend for 16th Consecutive Year, Up 10.2% in 2019
INVESTOR DAY101
LONG-STANDING COMMITMENT TO SHAREHOLDER RETURNS, PRIORITIZING DIVIDEND
GROWTH
$0.01
$0.75 $0.80 $0.88
$0.96 $1.08
$1.16 $1.26
$1.36 $1.42 $1.46 $1.50 $1.54
$1.64 $1.70
$1.86
$2.05
1%
41%32% 33% 33% 36%
47% 50% 53%
79%
52% 55%48% 43% 42% 38%
2003 2004 2005 2006 2007 2008 2009 2010 2011 2012 2013 2014 2015 2016 2017 2018 2019
Dividend per Share Payout Ratio
DIVIDEND PER SHARE, PAYOUT RATIO1 HISTORY
1. Payout ratio consists of full-year dividends paid divided by full-year free cash flow; 2014 payout ratio excludes proceeds from sale of Wheelabrator Technologies Inc. 2. Projected, based upon current
dividend rate. All future dividends must be declared by the Board of Directors.
2

✓ Extension of Asset Network in Key
Markets
✓ Cultural Fit – Safety and Customer
Focused
✓ High Return Lines of Business
✓ Quality Revenue Stream
STRATEGIC CRITERIA
✓ Positive Operating EBITDA in First
Full Year
✓ Premium to WACC of 200 – 500 bps
Adjusted for Risk Profile
FINANCIAL CRITERIA
✓ Post-Synergy Multiple Below WM’s
Trading Value
✓ Operating and Cost Synergies
Create Incremental Value
INVESTOR DAY102
M&A CRITERIA
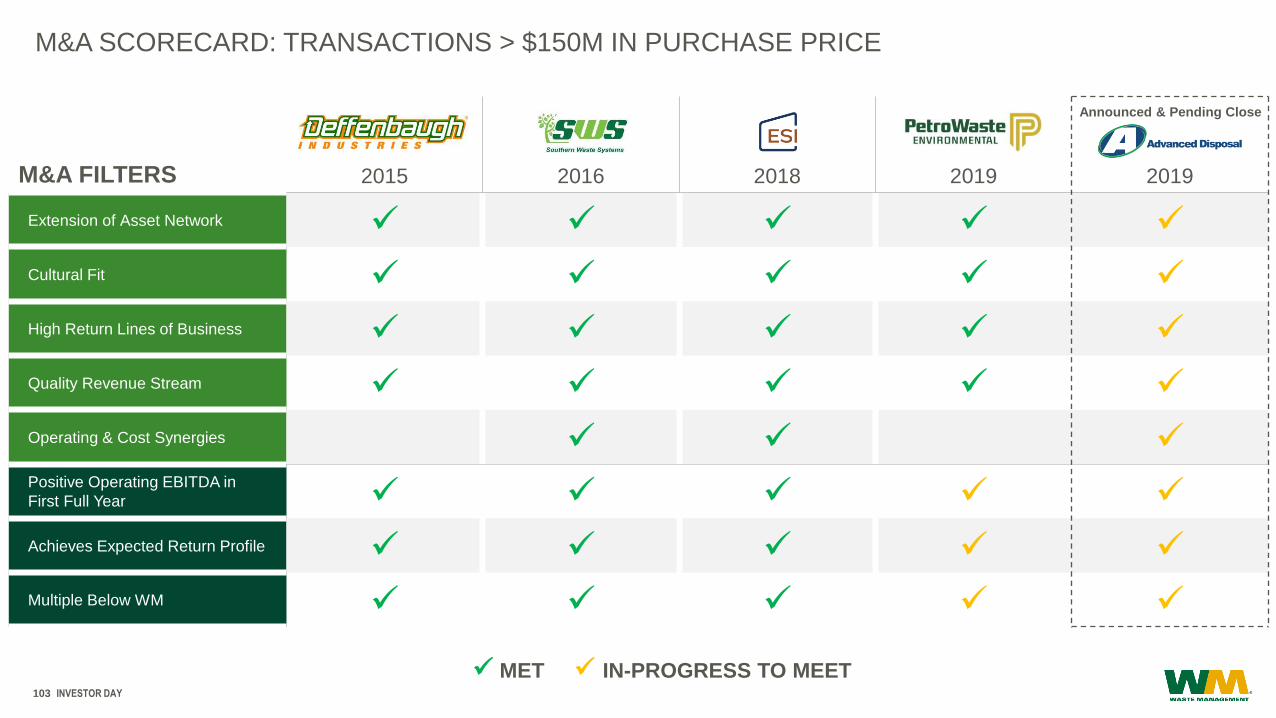
INVESTOR DAY103
M&A SCORECARD: TRANSACTIONS > $150M IN PURCHASE PRICE
M&A FILTERS 2015 2016 2018 2019 2019
Extension of Asset Network ✓ ✓ ✓ ✓ ✓
Cultural Fit ✓ ✓ ✓ ✓ ✓
High Return Lines of Business ✓ ✓ ✓ ✓ ✓
Quality Revenue Stream ✓ ✓ ✓ ✓ ✓
Operating & Cost Synergies ✓ ✓ ✓
Positive Operating EBITDA in
First Full Year ✓ ✓ ✓ ✓ ✓
Achieves Expected Return Profile ✓ ✓ ✓ ✓ ✓
Multiple Below WM ✓ ✓ ✓ ✓ ✓
✓ MET ✓ IN-PROGRESS TO MEET
Announced & Pending Close

EMPLOYEES ~6,000
MUNICIPALITIES >800
CUSTOMERS >3M
FY18 REVENUE $1.6B
FY18 ADJ. EBITDA $427M2
Shared Commitments to Safety, Customer Service and Operating Excellence
INVESTOR DAY104
ADVANCED DISPOSAL SERVICES ACQUISITION EXTENDS OUR INDUSTRY LEADERSHIP1
Transaction Announced April 15, 2019
KEY FACTS
HIGHLY STRATEGIC
• Complementary assets and customer base
• Compelling financial benefits that align with our long-term
financial goals, including delivering strong ROIC and growth in
EPS, margins and cash flows
35%
26%
39% Midwest
East
South
BALANCED GEOGRAPHIC AND REVENUE MIX
FINANCIALLY COMPELLING
• Expected to be immediately accretive to earnings and cash flow
• Identified more than $100M in potential annual cost and capital
expenditure synergies
• Net Debt to EBITDA projected to remain below 3.0x, at 2.9x;
long-term commitment to 2.0 – 3.0x target
1. The source of all information in this presentation concerning ADS is ADS’s public filings with the SEC and other publicly available information published by ADS. Waste Management played
no part in preparing, and cannot assure you as to the accuracy of, any statements concerning ADS. 2. See the appendix at the end of this presentation for reconciliation of this non-GAAP
financial measure. Please note that ADS’s measure “Adjusted EBITDA” is defined and calculated differently than “Operating EBITDA” reported by Waste Management.

INVESTOR DAY105
ADVANCED DISPOSAL TRANSACTION UPDATE
Financing
Process
• Announced successful pricing of $4B aggregate public offering of senior notes on May 14, 2019
• Completed cash tender offer for $257M of high-coupon senior notes
• Successful completion of these financing activities combined with WM’s strong liquidity position the company to close
Integration
Planning• Established a Waste Management integration team to ensure that the time prior to closing is efficiently spent
preparing for transaction close and a streamlined integration process
Regulatory
Update
• Initial HSR filing on May 9, 2019
• Working closely with the DOJ
• Have received significant inbound interest in any potential assets to be divested
• Confident in ability to achieve attractive valuation on any divestitures given level of interest and quality of assets
Next Steps /
Timing
• Advanced Disposal’s definitive proxy filed on May 23, 2019
• Anticipate Advanced Disposal’s shareholder vote on June 28, 2019
• Continue to expect the transaction to close by Q1 2020
• Subject to the satisfaction of customary closing conditions, including regulatory approvals and approval by a majority
of the holders of Advanced Disposal’s outstanding common shares

INVESTOR DAY106
SUCCESSFUL EXECUTION OF WM’S LARGEST BOND DEAL EVER
5 YEAR 7 YEAR 10 YEAR 20 YEAR 30 YEAR
Size ($M) $750 $750 $1,000 $500 $1,000
Treasury Yield 2.20% 2.30% 2.42% 2.86% 2.86%
Credit Spread (bps) T + 75 T + 90 T + 105 T + 115 T + 130
Bond Coupon 2.95% 3.20% 3.45% 4.00% 4.15%
✓ May 14: WM opportunistically priced $4B in Senior Notes across five tranches to fund the ADS acquisition, as well as for general
corporate purposes
✓ Successfully de-risked the acquisition financing and captured Treasury rates that were near the lows of 2019
Executed at a weighted average coupon of 3.55%
Improved weighted average coupon of Senior Notes by 38 bps from 4.32% to 3.94%1
Extended weighted average maturity by 2.2 years from 9.4 years to 11.6 years1
✓ Bond deal was very well received by the market
4.7x oversubscribed with an orderbook of ~$19B
Bonds allocated across ~300 Investors
Priced 12.5-20 bps tighter from Initial Price Talk (“IPT”)
Orderbook dominated by high-quality, buy-and-hold asset managers, insurance companies and pension funds
✓ Concurrent with the new issue, an “any-and-all” tender offer for higher-coupon 2026-2039 notes was executed in order to realize
interest expense savings
1. Pro forma weighted average coupon and maturity are inclusive of the $4B Senior Notes issuance and the “any-and-all” tender offer.
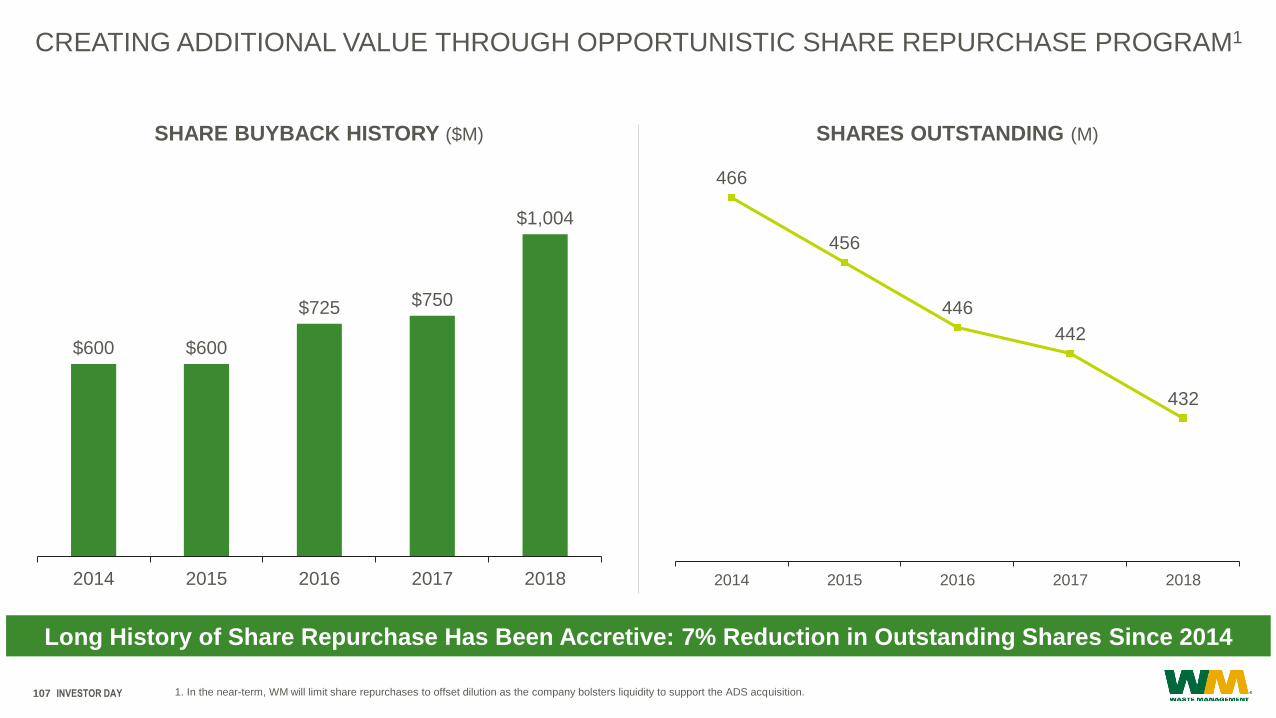
Long History of Share Repurchase Has Been Accretive: 7% Reduction in Outstanding Shares Since 2014
INVESTOR DAY107
CREATING ADDITIONAL VALUE THROUGH OPPORTUNISTIC SHARE REPURCHASE PROGRAM1
$600 $600
$725 $750
$1,004
2014 2015 2016 2017 2018
SHARE BUYBACK HISTORY ($M) SHARES OUTSTANDING (M)
466
456
446
442
432
2014 2015 2016 2017 2018
1. In the near-term, WM will limit share repurchases to offset dilution as the company bolsters liquidity to support the ADS acquisition.

INVESTOR DAY108
ACHIEVING INDUSTRY-LEADING RETURNS
Returns Driven by Earnings Quality and Disciplined Investment
1. Source: Third-party data as of April 25, 2019. 2. In the case of WM, see the appendix at the end of this presentation for the reconciliation of this non-GAAP financial measure to the most comparable
GAAP measure. 3. Calculated in the same manner as for WM, using as-reported results for Waste Connections & Republic Services. 4. Calculated in the same manner as for WM, using as-reported results
for 3M, Honeywell, Illinois Tool Works, United Technologies, Emerson Electric, Ingersoll-Rand, Dover, & Roper Technologies.
RETURN ON INVESTED CAPITAL1,2 RETURN ON ASSETS1
10.8 %
13.9 %
6.2 %
7.3 %
13.5 %
16.2 %
0%
2%
4%
6%
8%
10%
12%
14%
16%
18%
2016 2018
WM Peers 2 Diversified Industrial Index 3
11.7 %12.3 %
7.4 % 7.5 %
11.2 %
12.3 %
0%
2%
4%
6%
8%
10%
12%
14%
16%
18%
2016 2018
WM Peers 2 Diversified Industrial Index 33 4 3 4
• Disciplined allocation of
capital to execute on
organic growth is a key
contributor to strong return
profile
• Focused on high-quality
acquisitions and
investments to leverage
our best-in-class asset
network and expand
returns
• Continuously improving
our return profile and
driving toward world class

INVESTOR DAY109
Our Deliberate Focus on Increasing Returns has Generated Impressive Shareholder Returns
GENERATING THE HIGHEST TOTAL SHAREHOLDER RETURN IN BOTH THE SHORT-TERM AND
LONG-TERM
34.8%
30.0%
24.0%
11.2%10.1%
WM Peers 2 DiversifiedIndustrials Index 3
S&P DJIA2
3
178.7%171.4%
84.1%
57.0%61.7%
WM Peers 2 DiversifiedIndustrials Index 3
S&P DJIA2
3
1-YEAR TSR1 5-YEAR TSR1
1. FactSet market data as of April 25, 2019. 2. Includes Waste Connections & Republic Services. 3. Includes 3M, Honeywell, Illinois Tool Works, United Technologies, Emerson Electric, Ingersoll-Rand,
Dover, & Roper Technologies.

INVESTOR DAY110
REAFFIRMING 2019 FINANCIAL OUTLOOK
1. Guidance as of May 30, 2019 excluding impacts from Advanced Disposal acquisition. 2. See the appendix at the end of this presentation for reconciliation of this non-GAAP financial measure. 3. Projected
2019 operating EBITDA and EPS are anticipated to exclude the effects of events that are not currently determinable, but may be significant, such as asset impairments and one-time items, charges, gains or
losses from divestitures or litigation, or other items. Due to the uncertainty of the likelihood, amount and timing of such items, the Company is unable to provide a quantitative reconciliation of adjusted
projected operating EBITDA or EPS to the comparable GAAP measures.
FY18 RESULTS 2019 GUIDANCE1
ADJ. OPERATING EBITDA2 $4.216B $4.40B to $4.45B3
ADJ. EPS2 $4.20 $4.28 to $4.383
FREE CASH FLOW2 $2.084B $2.025B to $2.075B
DIVIDEND PER SHARE $1.86 $2.05
Impacts to Guidance Related to Advanced Disposal Acquisition
• Suspension of share repurchase ~($0.06) impact to EPS
• Incremental interest expense from transaction-related financing activities ~($0.03)
• SG&A integration and advisory costs impact are to be determined
• Immaterial impact to FCF due to timing of interest payments
Assumptions
• Core price >4.0%
• Revenue growth from yield on
collection and disposal business >2.0%
• Revenue growth from volume ~2.0%
• Annual tax rate of 24.0%

Culture + Leadership + Strategy + Skills + Capital = Ability to Achieve Our Long-term Targets
INVESTOR DAY111
EXPECTED LONG-TERM ANNUAL GROWTH TARGETS THROUGH 2021
2019 – 2021 LONG-TERM GROWTH TARGETSExcluding Future Acquisitions
Collection and Disposal Revenue Growth 4% – 6%
Adj. Operating EBITDA1 5% – 7%
Free Cash Flow1 5% – 7%
ASSUMPTIONS
• Revenue growth from yield of ~2%+ and volume of ~2%+
• Tuck-in acquisitions of ~$100M – $200M annually; however,
excludes any incremental large scale M&A
• Cost inflation around 3% – 4%, annually
OPPORTUNITY TO BEND
OPERATING EBITDA CURVE
2018 2019 2020 2021
Base Case (5%-7%) With Upside (7%-9%)
200-400
bps
Opportunities for upside
• Leveraging technology to accelerate growth and
reduce costs
• Acquisitions above run rate
1. See the appendix at the end of this presentation for information about our calculation of these non-GAAP measures. Due to the uncertainty of the likelihood, amount and timing of future items that may impact
these measures, the Company is unable to provide a quantitative reconciliation of long-term projected adjusted operating EBITDA growth or long-term projected free cash flow growth to the comparable GAAP
measures.

Jim Fish
President and Chief Executive Officer
CLOSING REMARKS

INVESTOR DAY113
PROVEN BUSINESS MODEL WILL ENABLE STEP-CHANGE STRATEGY EXECUTION
PROFITABLE GROWTH
• Customer focus
• Technology enabled solutions
• Market focus
• Asset network
• Sustained leadership
OPERATIONAL DISCIPLINE
• Use of technology to enable
greater efficiency
• Continuous improvement
• Focus on talent/people
FINANCIAL PROFILE
• Recurring revenue and stable
cash flow
• Leveraging scale
• Margin focus
• Maintain strong credit profile
• Recession resilient
CAPITAL ALLOCATION
• Industry leading ROIC
• Greater discipline in the use of
capital
• Focus on maintaining strategic
flexibility
• Shareholder-friendly returns

Q&A SESSION

APPENDIX

INVESTOR DAY116
RECONCILIATION OF NON-GAAP MEASURES
($M) 2018 2016 2014
Income from operations (as reported) $2,789 $2,296 $2,299
Adjustments
(Income)/expense from divestitures, asset
impairments and unusual items, net$(55) $108 $(162)
Restructuring $2 $2 $81
Legal Reserve - - $31
Multiemployer pension withdrawal costs $3 - $3
Adjusted income from operations1 $2,739 $2,406 $2,252
1. Refer to the tables to the press release filed with our Form 8-K filed on February 14, 2019 for additional information. 2. The reconciliation includes two scenarios that illustrate our projected
free cash flow range for 2019. The amounts used in the reconciliation are subject to many variables, some of which are not under our control and, therefore, are not necessarily indicative of
actual results.
ADJUSTED INCOME FROM OPERATIONS EARNINGS PER SHARE
2018
As Reported $4.45
Primarily tax related adjustments and gains from divestitures $(0.25)
As Adjusted $4.20
2019 PROJECTED FREE CASH FLOW RECONCILIATION2
Scenario 1 Scenario 2
Net cash provided by operating activities $3,625 $3,725
Capital expenditures (1,650) (1,750)
Proceeds from divestitures of businesses
and other assets (net of cash divested) 50 100
Free cash flow $2,025 $2,075
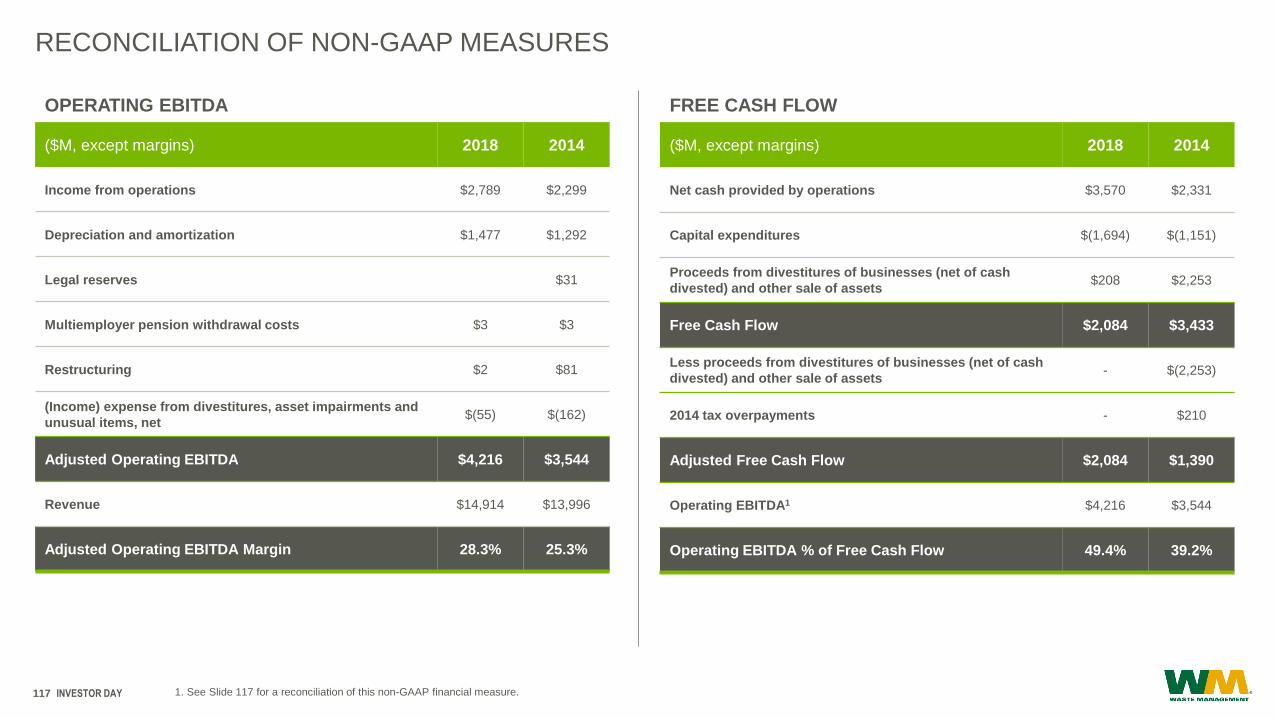
INVESTOR DAY117
RECONCILIATION OF NON-GAAP MEASURES
($M, except margins) 2018 2014
Income from operations $2,789 $2,299
Depreciation and amortization $1,477 $1,292
Legal reserves $31
Multiemployer pension withdrawal costs $3 $3
Restructuring $2 $81
(Income) expense from divestitures, asset impairments and
unusual items, net$(55) $(162)
Adjusted Operating EBITDA $4,216 $3,544
Revenue $14,914 $13,996
Adjusted Operating EBITDA Margin 28.3% 25.3%
OPERATING EBITDA FREE CASH FLOW
($M, except margins) 2018 2014
Net cash provided by operations $3,570 $2,331
Capital expenditures $(1,694) $(1,151)
Proceeds from divestitures of businesses (net of cash
divested) and other sale of assets$208 $2,253
Free Cash Flow $2,084 $3,433
Less proceeds from divestitures of businesses (net of cash
divested) and other sale of assets- $(2,253)
2014 tax overpayments - $210
Adjusted Free Cash Flow $2,084 $1,390
Operating EBITDA1 $4,216 $3,544
Operating EBITDA % of Free Cash Flow 49.4% 39.2%
1. See Slide 117 for a reconciliation of this non-GAAP financial measure.

INVESTOR DAY118
RECONCILIATION OF NON-GAAP MEASURES
1. The Numerator and Denominator used for this calculation are based on defined terms for this covenant within the Company's revolving credit facility. 2. See Slide 117 for a reconciliation of
this non-GAAP financial measure. 3. See Slide 116 for a reconciliation of this non-GAAP financial measure. 4. Average of previous two years.
($M) 2018 2014
Balance sheet debt $10.026 $9,435
Adjustments for accounting for fair value hedges and
discounts$52 $(31)
Guarantees of indebtedness of others $4 $8
Numerator1 $10,082 $9,413
Operating EBITDA2 $4,216 $3,544
Less: Restructuring cost - $82
Less: Net income attributable to noncontrolling interests - $40
Other $92 $(9)
Denominator - EBITDA1 $4,308 $3,413
Net Debt / EBITDA1 2.3x 2.8x
NET DEBT / EBITDA
($M, except margins) 2018 2016 2014
Adjusted income from operations3 $2,739 $2,406 $2,252
Less: Provision for income tax $(521) $(850) $(531)
NOPAT $2,218 $1,556 $1,721
Total debt $9,759 $9,120 $9,957
Stockholders’ equity $6,147 $5,321 $6,018
Total Invested Capital4 $15,906 $14,441 $15,975
Return on Invested Capital 13.9% 10.8% 10.8%
RETURN ON INVESTED CAPITAL
($M, except margins) 2018 2016
Income from operations $2,735 $2,412
Total Assets4 $22,240 $20,613
Return on Assets 12.3% 11.7%
RETURN ON ASSETS

INVESTOR DAY119
RECONCILIATION OF NON-GAAP MEASURES
($M, except margins) 2018
Net income $9.4
Depreciation and amortization $270.5
Interest expense $95.9
Accretion on landfill retirement obligations $17.0
Income tax benefit $4.6
Other $0.5
EBITDA $397.9
Stock based compensation $11.2
Landfill remediation expenses and related impacts $23.8
Loss on debt extinguishments and modifications $0.9
Greentree expenses, net of estimated insurance recoveries -
Loss (gain) on disposal of assets and asset impairments $(2.5)
Other $(4.2)
Adjusted EBITDA $427.1
Revenue $1,558.2
Adjusted EBITDA Margin 27.4%
ADVANCED DISPOSAL ADJUSTED EBITDA

PRESENTER BIOGRAPHIES

Jim Fish is president and chief executive officer for Waste Management. He is also a
member of the Board of Directors.
Prior to becoming CFO in 2012 and his promotion to president in July 2016, he held
several key positions with the Company, including senior vice president for the
Company’s Eastern Group, area vice president for Pennsylvania and West Virginia,
market area general manager for Massachusetts and Rhode Island, vice president of
price management and director of financial planning and analysis. He joined Waste
Management in 2001.
Before joining Waste Management, Fish held finance and revenue management
positions at Westex, a Yellow-Roadway subsidiary; Trans World Airlines; and America
West Airlines. He began his professional career at KPMG Peat Marwick.
Fish earned a Bachelor of Science in accounting from Arizona State University and
an MBA in finance from the University of Chicago.
INVESTOR DAY121
JIM FISH | PRESIDENT & CHIEF EXECUTIVE OFFICER
As executive vice president and chief operating officer (COO) for Waste
Management, John Morris has responsibility for all field operations which includes
oversight of collections, disposal, recycling, and landfills. He is a member of the
Company’s senior leadership team and reports to Jim Fish, president and chief
executive officer.
Morris has held several positions in his 20-plus years with the company including
market area general manager of NYC, area vice president of Greater Mid-Atlantic
Area, chief strategy officer, and most recently senior vice president, field operations.
John is a graduate of Rutgers University.
INVESTOR DAY122
JOHN MORRIS | EVP & CHIEF OPERATING OFFICER

As the senior vice president and chief financial officer for Waste Management,
Devina is responsible for all finance functions for the Company. She also has
executive responsibility for the internal audit, investor relations, supply chain
functions and business development. She is a member of the Company’s senior
leadership team and reports to Waste Management president and chief executive
officer, Jim Fish.
Rankin joined the company in 2002 and has held several corporate finance positions
of increasing responsibility including assistant treasurer and treasurer.
Prior to joining Waste Management, Rankin was a member of the assurance
practices of Ernst & Young and Arthur Andersen.
Rankin has a Bachelor of Business Administration and Master of Science in
Accounting from Texas A&M University and is a certified public accountant licensed in
Texas.
INVESTOR DAY123
DEVINA RANKIN | SVP, CHIEF FINANCIAL OPERATOR

As senior vice president and chief human resources officer, Tamla has primary
responsibility for the Company’s human resources strategy including HR operations,
employee relations, labor relations, HR information systems, compensation, benefits,
culture, learning, talent acquisition, leadership and talent development. She is a
member of the Company’s senior leadership team and reports to Jim Fish, president
and chief executive officer.
Prior to joining Waste Management, she served in numerous positions during her 20
year career at General Electric including Human Resources Director for GE Africa,
Chief Diversity Officer for GE Appliances and Lighting, and most recently, Vice
President of Human Resources for GE Energy Connections.
Forney is a graduate of the University of North Carolina at Chapel Hill where she
earned her Bachelor of Science in Business Administration.
INVESTOR DAY124
TAMLA OATES-FORNEY | SVP, CHIEF HUMAN RESOURCES OFFICER

As senior vice president and chief customer officer (CCO) for Waste Management,
Mike Watson leads the customer experience, sales, marketing, revenue
management, and sustainability services organizations of the company. Responsible
for the Company’s profitable growth strategy across all sales channels, Watson
ensures the delivery of exceptional experiences across the customer’s journey. He is
a member of the Company’s senior leadership team and reports to Waste
Management president and chief executive officer, Jim Fish.
Prior to his role as CCO, Watson served as area vice president of the Illinois-Missouri
Valley market area encompassing six states across the Midwest. Watson joined the
company in 1992 and progressed through various leadership roles across North
America including corporate and field-based positions.
Watson received an undergraduate degree in Economics from Indiana University and
an MBA from The University of Chicago – Booth School of Business.
125
MIKE WATSON | SVP, CHIEF CUSTOMER OFFICER
INVESTOR DAY

As senior vice president and chief digital officer for Waste Management, Nikolaj is
responsible for all digital and technology functions for the Company. This includes
eCommerce and online self-service (wm.com), information technology, and advanced
analytics and data management. He is a member of the Company’s senior leadership
team and reports to Waste Management president and chief executive officer, Jim
Fish.
Sjoqvist joined the company in 2012 and was previously vice president of revenue
management with responsibility for pricing, disciplined growth planning, marketing
and advanced revenue analytics. Prior to joining Waste Management, Sjoqvist was a
consultant with McKinsey & Company’s marketing & sales practice, and he
previously held a number of finance, pricing and technology positions with Hewlett-
Packard and Compaq Computer in Europe and North America.
Sjoqvist earned a Bachelors in Business Studies from Oxford Brookes University in
the UK, and an MBA from Kellogg School of Management at Northwestern University.
INVESTOR DAY126
NIKOLAJ SJOQVIST | SVP, CHIEF DIGITAL OFFICER

As senior vice president, corporate development and chief legal officer of Waste
Management, Chuck is responsible for all legal, corporate secretary, ethics and
compliance, government affairs, security and real estate functions and, as of 2019,
corporate development and innovation, as well as oilfield services. He is a member of
the Company’s senior leadership team and reports to Jim Fish, president and chief
executive officer.
Immediately prior to joining Waste Management, he was executive vice president, chief
financial officer and general counsel of Dallas-based Oilfield Water Logistics, a produced
water gathering, transportation and disposal company backed by private equity sponsor
Natural Gas Partners.
Prior to that, Boettcher served for eight years as senior vice president, general counsel,
chief compliance officer and corporate secretary of Houston-based Eagle Rock Energy
Partners and, before that, was a Partner in the Dallas office of Thompson & Knight.
Boettcher received a Bachelor of Science in Business Administration from the University
of South Dakota and a Juris Doctor from Texas Tech University School of Law.
INVESTOR DAY127
CHUCK BOETTCHER | SVP, CORPORATE DEVELOPMENT AND CHIEF LEGAL OFFICER

As senior vice president, field operations for Waste Management, Tara has
responsibility for all operations in the southern part of North America, including
oversight of collection, disposal, recycling and landfills. She is a member of the
Company’s senior leadership team, led by Jim Fish, president and chief executive
officer.
Hemmer joined the company in 1999 and progressed through various leadership
roles across North America including vice president of disposal operations, area vice
president for the Greater Mid-Atlantic Area, and most recently senior vice president
operations, safety and environmental compliance. She serves on the board of the
Environmental Education and Research Foundation.
Hemmer graduated from Cornell University with a Bachelor of Science in Civil and
Environmental Engineering.
INVESTOR DAY128
TARA HEMMER | SVP, OPERATIONS

As senior vice president, field operations for Waste Management, Steve has
responsibility for all operations in the northern part of North America, including
oversight of collection, disposal, recycling and landfills. He is a member of the
Company’s senior leadership team, led by Jim Fish, president and chief executive
officer.
He started at the company in 1997 and has held multiple field and corporate
leadership roles including area vice president of Minnesota-Iowa Area, Illinois-
Missouri Valley Area and most recently the vice president of collection and fleet
operations. Before joining Waste Management Batchelor held leadership roles at
Browning Ferris Industries, Inc.
Batchelor has a Bachelor of Science degree in business management from the
University of Phoenix.
INVESTOR DAY129
STEVE BATCHELOR | SVP, OPERATIONS