washington state department of ecology toxics cleanup … · washington state department of ecology...
TRANSCRIPT
Washington State
Department of Ecology Toxics Cleanup Program
June 2005
Publication No. 05-09-092
printed on recycled paper

The Department of Ecology is an Equal Opportunity agency and does not discriminate on the basis of race, creed, color, disability, age, religion, national origin, sex, marital status, disabled veteran's status, Vietnam Era veteran's status or sexual orientation. If you have special accommodation needs or need this document in an alternative format, please call Kathryn DeJesus at (360) 407-7242 (Voice) or 1-800-833 6388 or 711 (TTY). Cover image: Dredging of Blair Waterway sediment in Commencement Bay, Tacoma, Washington, using a clamshell dredge with Mt. Rainier in background.
HHHooowww TTTooo GGGeeettt MMMooorrreee IIInnnfffooorrrmmmaaatttiiiooonnn
OOOnnn SSSeeedddiiimmmeeennnttt CCCllleeeaaannnuuuppp IIIssssssuuueeesss
•
•
•
• •
• •
The purpose of this report is to summarize current knowledge of the many known and suspected sediment cleanup sites located in Washington State. A copy of the report can be found at the following Department of Ecology web address: http://www.ecy.wa.gov/biblio/0509092.html If you have questions about the report or would like additional copies, please contact Kathryn DeJesus at [email protected] or 360-407-7242 or Tom Gries at [email protected] or 360-407-7536. Readers interested in more information about sediment quality and sediment management issues in Washington can explore Ecology’s parent web site: http://www.ecy.wa.gov/programs/tcp/smu/sediment.html
Highlights of the information found at this web address include the following.
Regulations for managing contaminated sediments in Washington, the Sediment Management Standards (Chapter 173-204 WAC): http://www.ecy.wa.gov/biblio/wac173204.html Regulations can also be ordered by contacting the agency’s publication department at [email protected] or (360) 407-7472. The Sediment Management Unit’s bibliography of technical reports related to sediments: http://www.ecy.wa.gov/programs/tcp/smu/sed_pubs.html
Other web sites related to managing sediments in Washington State include:
http://www.nws.usace.army.mil/PublicMenu/Menu.cfm?sitename=dmmo&pagename=home http://www.dnr.wa.gov/htdocs/aqr/ http://yosemite.epa.gov/r10/ecocomm.nsf/bd5af81c438305ea88256b58006146ea/f25bad58f59599058825679a005c6983!OpenDocument http://yosemite.epa.gov/r10/cleanup.nsf/webpage/Superfund+(CERCLA) http://www.psat.wa.gov/Publications/workplan_03/wp03_final/13_sed.htm

Sediment Cleanup Status Report
Washington State Department of Ecology
Toxics Cleanup Program
June 2005 Publication No. 05-09-092
printed on recycled paper

Table of Contents
Page Introduction ..........................................................................................................1
Sediment Management Standards...................................................................... 1 Sediment Cleanup Sites ..................................................................................... 1 Past Reports ....................................................................................................... 2 Defining the “Universe” of Sediment Cleanup Sites......................................... 4
Cleanup Progress .................................................................................................. 5 About Sediment Site Listing.............................................................................. 5 Many Marine Sediment Sites in the Cleanup Process ....................................... 5 Fewer Freshwater Sites, but Cleanup is Occurring............................................ 6 How Does Cleanup Get Done? ............................................................................. 8 How Much Sediment is Contaminated? ............................................................... 10 Cleanup Challenges .............................................................................................. 12 How Much Does Cleanup Cost?........................................................................... 14 Cleanup Cost Ranges ......................................................................................... 14 Estimating Cost of Remaining Cleanup............................................................. 14 State Managed Aquatic Land................................................................................ 16 Sources of Contamination..................................................................................... 18 Water Body Focus................................................................................................. 19 Bellingham Bay ................................................................................................. 20 Columbia River.................................................................................................. 22 Commencement Bay.......................................................................................... 24 Duwamish River – Lower Waterway ................................................................ 26 Elliot Bay and Harbor Island ............................................................................. 28 Everett and Port Gardner ................................................................................... 30 Fidalgo Bay........................................................................................................ 32 Kitsap Peninsula, including Sinclair Inlet.......................................................... 34 Lake Union......................................................................................................... 36 Lake Washington ............................................................................................... 38 Other Water bodies ............................................................................................ 40 Impaired Water bodies.......................................................................................... 41 Sediment/Water Relationships and 303(d) ........................................................ 41
i

List of Figures and Tables
Page Figures
Figure 1. Comparison to Past Reports .................................................................................3
Figure 2. Washington State Sediment Cleanup Sites...........................................................4
Figure 3. Status of 115 Marine Sediment Cleanup Sites .....................................................5
Figure 4. Stage of Cleanup for 75 Active Marine Sediment Sites.......................................6
Figure 5. Status of 27 Freshwater Sediment Cleanup Sites .................................................6
Figure 6. Stage of Cleanup for 19 Active Freshwater Sediment Sites.................................7
Figure 7. Percent State Managed/Owned Aquatic Lands at Sediment Cleanup Sites .......16
Figure 8. Sources of Contamination at Sediment Cleanup Sites in Washington State......18
Figure 9. Vicinity Map of Bellingham Bay .......................................................................20
Figure 10. Vicinity Map of Lower Columbia River ..........................................................22
Figure 11. Vicinity Map of Commencement Bay..............................................................24
Figure 12. Vicinity Map of Duwamish River – Lower Waterway ....................................26
Figure 13. Vicinity Map of Elliot Bay ...............................................................................28
Figure 14. Vicinity Map of Everett and Port Gardner .......................................................30
Figure 15. Vicinity Map of Fidalgo Bay............................................................................32
Figure 16. Vicinity Map of Kitsap Peninsula and Sinclair Inlet........................................34
Figure 17. Vicinity Map of Lake Union ............................................................................36
Figure 18. Vicinity Map of Lake Washington...................................................................38
Figure 19. Bellingham Bay................................................................................................41
Figure 20. Between Fidalgo Bay to Bellingham Bay ........................................................41
Figure 21. Eastern Kitsap County......................................................................................42
Figure 22. Dyes and Sinclair Inlets (Eastern Kitsap County)...........................................42
Figure 23. Commencement Bay (Tacoma)........................................................................42
Figure 24. Duwamish River (Seattle) ................................................................................42
Figure 25. Elliot Bay..........................................................................................................43
Figure 26. Everett Harbor ..................................................................................................43
ii

Figure 27. Duwamish River (Seattle) ................................................................................43
Figure 28. Fidalgo Bay (Anacortes)...................................................................................43
Figure 29. Lake Union (Seattle).........................................................................................44
Figure 30. Gray’s Harbor...................................................................................................44
Figure 31. Lake Washington and Lake Issaquah (Seattle and Bellevue) ..........................44
Figure 32. Strait of Juan de Fuca .......................................................................................45
Figure 33. Budd Inlet (Olympia) .......................................................................................45
Figure 34. Asarco (Ruston)................................................................................................45
Figure 35. South Puget Sound ...........................................................................................46 Tables Table 1. Cleanup Authorities and Status of Marine Sediment Sites....................................8
Table 2. Cleanup Authorities and Status of Freshwater Sediment Sites..............................8
Table 3. Estimated Acreage for Puget Sound Sediment Sites ...........................................10
Table 4. Puget Sound Sediment Cleanup Site Area in Perspective ...................................11
Table 5. Estimated Cleanup Cost Ranges for Sediment Sites with Cost Information.......15
Table 6. Estimated Cleanup Cost for All Completed and Unfinished Sediment Sites ......15
Table 7. Estimated Sediment Cleanup Costs on State Owned/Managed Aquatic Land....17
Table 8. Sediment Cleanup Sites .......................................................................................19
Table 9. Bellingham Bay Sediment Cleanup Site Information..........................................21
Table 10. Columbia River Sediment Cleanup Site Information ........................................23
Table 11. Commencement Bay Sediment Cleanup Site Information ................................25
Table 12. Duwamish River – Lower Waterway Sediment Cleanup Site Information.......27
Table 13. Elliot Bay and Harbor Island Sediment Cleanup Site Information ...................29
Table 14. Everett/Port Gardner Sediment Cleanup Site Information ................................31
Table 15. Fidalgo Bay Sediment Cleanup Site Information ..............................................33
Table 16. Kitsap Peninsula and Sinclair Inlet Sediment Cleanup Site Information ..........35
Table 17. Lake Union and Ship Canal Sediment Cleanup Site Information .....................37
Table 18. Lake Washington Sediment Cleanup Site Information .....................................39
Table 19.Other Water bodies with Sediment Cleanup Sites..............................................40
iii

Introduction The Department of Ecology (Ecology) is Washington State’s environmental management agency. As such, Ecology’s mission is to protect, preserve and enhance Washington’s natural environment and promote the wise management of our air, land and water. This requires cleaning up and restoring contaminated sites, including aquatic sediment sites.
Sediment consists of “particles of dirt that are discharged or washed into and travel through water systems to precipitate out onto sea floors and lake and river beds. Many contaminants adhere to these solid particles on their journey so that sediments, by nature, concentrate contamination in the areas where they collect. It is that muck that squishes up between your toes when you run out into a lake to go swimming…”
This report summarizes information about the location, nature and status of contaminated sediment sites. The contamination found in many types of sediment results from the release of harmful contaminants into the aquatic environment from industrial sources, municipal discharges, other commercial activities as well as accidental releases. As the lead state agency for environmental cleanup activities, Ecology plays a crucial role in restoring regional sediment quality. The Toxics Cleanup Program is charged with getting contaminants out of the environment and keeping them out under the authority of the Model Toxics Control Act (MTCA) and Sediment Management Standards (SMS). The latter prescribes source control, assessment and cleanup procedures specific to the sediment media.
Sediment Management Standards In 1991, Ecology adopted the Sediment Management Standards, Chapter 173-204 WAC. Today Washington remains the only state with adopted standards for sediment quality. The SMS rule addresses three major areas:
Standards for assessing the nature and extent of sediment contamination • • •
Procedures for cleanup of historical sediment contamination Procedures for preventing future sediment contamination from discharges
The purpose of the Sediment Management Standards rule is to reduce and ultimately eliminate adverse effects on biological resources and significant health threats to humans from surface sediment contamination. It establishes standards for assessing ecological impacts from contaminated sediment and provides regulatory triggers for controlling sources and cleaning up contaminated sediment.
Sediment Cleanup Sites This report summarizes information about all known or suspected sediment cleanup sites in Washington State. It provides an overall sense of sediment cleanup issues and is intended to inform regulatory decisions. It is not a site list. Prior to adoption of the Sediment Management Standards remedial investigations of sediment contamination in urban bays of Puget Sound region did occur, but there was no consistent
1

statewide approach for doing so. Then in 1996 under the SMS rule, Ecology published the first Contaminated Sediment Site List. This was accomplished by comparing data collected in an extensive sediment quality database (SEDQUAL) to standards in the rule. The resulting list identified and ranked 49 contaminated sediment sites in Puget Sound. The map below shows the number of sites by urban embayment.
Sediment Sites on Ecology’s 1996 Contaminated Sediment Site List
Since then the agency has collected new information that identifies additional sediment cleanup sites and areas of concern. The information in the report was compiled from regional sediment cleanup site managers and specialists during spring of 2005 and reflects current knowledge of 142 sediment cleanup sites. As more information becomes available, many of the values associated with individual sites, as well as summary statistics, will change.
Past Reports Ecology, together with other state and federal agencies, continues to evaluate sediment quality statewide and identify an increasing number of new sites. The number of freshwater sites identified is increasing faster than marine sites. This trend reflects the agency’s historical emphasis on the marine environment and increasing attention to freshwater. The total number of sites identified in this report (142) represents a slight increase from the previous two report years (134 in 2001 and 133 in 2003) and a substantial increase from the 112 sites identified in 2000. On average, the total number of sites has increased more than 5% per year. The number of sediment cleanup sites listed in this report, either in some stage of investigation or already remediated, is dominated by ones located in marine systems, primarily Puget Sound. As in previous years, these still comprise about 80% of all sites listed. About one-half of all sites identified in 2005 are in the initial or remedial investigation stages versus two-thirds in 2000. One-third of all sites are now in the feasibility, design, cleanup and monitoring stages
2

versus only 9% in 2000. The overall fraction of sites classified as “not started,” in the process of being investigated or not needing further action has remained relatively constant [Figure 1].
Number of Sites
Initial In
vestigat'n
Feasibility Study
Cleanup/ Monitor 2005
2001
0
20
40
60
80
100
120
Progress at Marine Sediment Cleanup Sites
2005200320012000
Figure 1: Comparison to Past Reports The total area of 2900 - 3300 acres estimated for the 142 sediment sites in the 2005 report is about the same as the three previous area estimates (2800 – 3400 acres). This is still about 20% of the area studied but less than 1% of the Puget Sound as a whole. The accuracy of overall cost estimates in this report has improved due to fewer sites lacking cost information and more sites being in later stages of cleanup. Cost information for sites in the early stages of cleanup, however, continues to be based on rough estimates. The number of sediment sites with cleanup cost estimates has increased to 90, as compared with 38 sites in 2000, 62 sites in 2001 and 76 sites in 2003, as shown later in Tables 5 and 6. Table 6 shows the low estimate for total cleanup cost has increased from 2000-2001, but is similar to the 2003 estimate. The high estimate for total cost is substantially lower than 2003 and even lower than the earlier estimates because this report uses median values instead of mean values for sites lacking costs. This method precludes a few larger sites from otherwise skewing the distribution of cost information. For state-owned or managed aquatic lands, the 2005 cost estimate for remaining cleanups is greater than it was in 2000-2001, but lower than reported in 2003.
3
Sources of contaminants cited for all of the sites identified are similar for reports in all four years, with industrial sources remaining the largest single category.
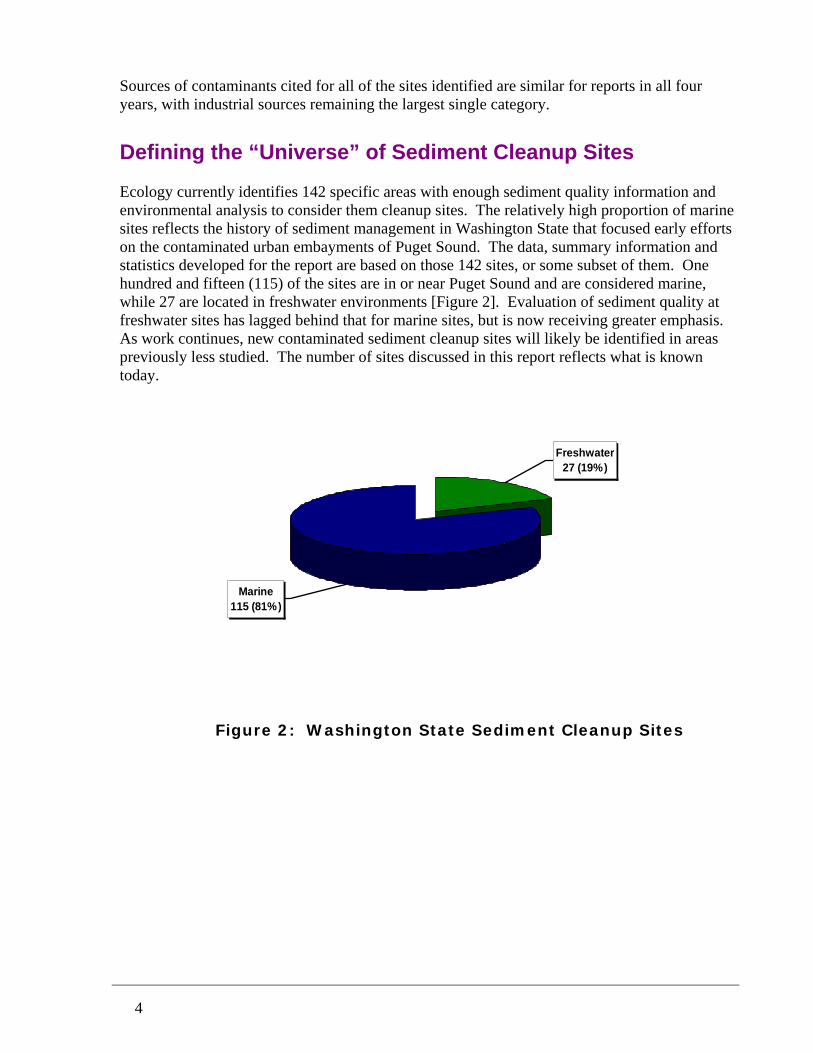
Defining the “Universe” of Sediment Cleanup Sites Ecology currently identifies 142 specific areas with enough sediment quality information and environmental analysis to consider them cleanup sites. The relatively high proportion of marine sites reflects the history of sediment management in Washington State that focused early efforts on the contaminated urban embayments of Puget Sound. The data, summary information and statistics developed for the report are based on those 142 sites, or some subset of them. One hundred and fifteen (115) of the sites are in or near Puget Sound and are considered marine, while 27 are located in freshwater environments [Figure 2]. Evaluation of sediment quality at freshwater sites has lagged behind that for marine sites, but is now receiving greater emphasis. As work continues, new contaminated sediment cleanup sites will likely be identified in areas previously less studied. The number of sites discussed in this report reflects what is known today.
Freshwater 27 (19%)
Marine115 (81%)
Figure 2: Washington State Sediment Cleanup Sites
4

Cleanup Progress
About Sediment Site Listing In this report, the term “sediment sites” includes areas either known or suspected to be contaminated. In 1996 Ecology identified and ranked 49 sites in the Contaminated Sediment Site List under the Sediment Management Standards formal listing process. Other areas of concern that were not identified through the formal listing and ranking process at that time, but have subsequently been determined to have compromised sediment quality, are also considered sites. Additional sediment sites presented in this report are associated with upland sites on the State’s Hazardous Sites List, the State’s Confirmed and Suspected Contaminated Sites Report (all sites reported to Ecology except leaking underground storage tank sites), or the federal National Priorities List (“Superfund” sites). Ecology also tracks some sites where remedial actions have been completed as well as ones that have been investigated further and determined not to require cleanup or are in a long term monitoring phase. The purpose of including these completed sites is to provide a snapshot of all evaluated sediment cleanup sites in Washington State.
Many Marine Sediment Sites in the Cleanup Process Almost one-half of the 115 marine sediment sites identified (51 sites) are undergoing active clean up [Figure 3]. This includes all sites with ongoing initial investigations, remedial investigations, feasibility studies and remedial design. Nearly two-thirds (75 sites) of marine sediment sites are in the process of being cleaned up, including those in some monitoring stage [Figure 4]. One-fifth of the sites (23) have been determined to need no further action (NFA sites), while site cleanup investigations have yet to start at 17 sites. The figures below also indicate that 52 marine sediment cleanup sites (45%) are in the early stages of the cleanup process, e.g., not started, initial investigation or remedial investigation.
In Pro cess 44%
N o Further Action
20%
C leanup & M onitoring
21%
N ot Started 15%
Figure 3: Status of 115 Marine Sediment Cleanup Sites
5

Initial
Investigation31%
Cleanup & Monitoring
33%
Design5%
FeasibilityStudy21%
Remedial Investigation
21%
Figure 4: Stage of Cleanup for 75 Active Marine Sediment Sites
Fewer Freshwater Sites, but Cleanup is Progressing As noted earlier, there are fewer freshwater sediment cleanup sites (27 sites) than marine, with more likely to be identified in the future [Figure 5]. About sixty percent of them (17 sites) are in the active cleanup process. When freshwater sediment sites in some monitoring stage are included, then the total (19 sites) in cleanup phase is more than two-thirds [Figure 6]. Investigations have not yet begun on five freshwater sites, while three sites have been determined to not need further action. There are 16 sites (59%) that are in early stages of the cleanup process, e.g., not started or with ongoing initial or remedial investigations. While progress on evaluating and cleaning up these sites is complicated by the lack of numeric freshwater standards similar to those adopted in 1991 for marine sediments, more guidance is becoming available. Freshwater sediment quality and associated risk are currently evaluated on a case-by-case basis using existing freshwater criteria and bioassays under the authority of the SMS rule.
Cleanup & Monitoring
11%
NFA11%
Not Started19%
In Process59%
Figure 5: Status of 27 Freshwater Sediment cleanup Sites
6

RI31%Feasibility
Study21%
Design11%
Cleanup & Monitoring
16%
InitialInvestigation
31%
Figure 6: Stage of Cleanup for 19 Active Freshwater Sediment Sites
7

How Does Cleanup Get Done? Various authorities are used to accomplish cleanup of contaminated sediment sites. Which authority is applied depends on the site, sources of contaminants and sometimes even the liable parties. Cleanup of sediment sites is primarily conducted using either federal Comprehensive Environmental Response Compensation Liability Act (CERCLA) authority under the U.S. Environmental Protection Agency (EPA) “Superfund” program or using state cleanup laws and rules discussed in the Introduction section of this report. Those state cleanup authorities are, again, the Model Toxics Control Act cleanup regulation, Chapter 173-340 WAC, and the Sediment Management Standards, Chapter 173-204 WAC. Table 1 shows the cleanup authorities applied at marine sediment sites and the corresponding phase of cleanup at those sites. Table 2 shows similar information for freshwater sediment sites.
CleanupAuthority
Numberof Sites
NotStarted
InitialInvestigat'n
Remed.Investigat'n
FeasibilityStudy
Remed.Design
Cleanup/Monitor NFA
Clean Water Act/Ch. 90.48 RCW 8 2 1 3
MTCA/SMS 34 3 9 7 6 1 4 4Not Assigned 32 12 7 1 3 9Other (NRDA, RCRA) 7 1 2 2 2Superfund 24 2 3 11 8Superfund/MTCA 10 5 3 2Totals 115 17 18 17 11 4 25 23
2
Table 1. Cleanup Authorities and Status of Marine Sediment Sites.
CleanupAuthority
Numberof Sites
NotStarted
InitialInvestigat'n
Remed.Investigat'n
FeasibilityStudy
Remed.Design
Cleanup/Monitor NFA
Clean Water Act/Ch. 90.48 RCWMTCA/SMS 14 4 4 2 2 1 1Not Assigned 10 4 2 2 2Other (NRDA, RCRA) 1 1Superfund 1 1Superfund/MTCA 1 1Totals 27 4 6 6 3 2 3 3
Table 2. Cleanup Authorities and Status of Freshwater Sediment Sites Of the 41 sediment sites being cleanup using federal authority alone (Clean Water Act, NRDA, RCRA and Superfund), 31 sites (>75%) are in later stages of cleanup (FS, Design, Cleanup & Monitoring and NFA). Of the 48 sites being cleaned up using state authority alone (MTCA/SMS), about one-half (21) are in late stages of cleanup. Of the 11 sites where both federal and state authorities are being used - (Superfund/MTCA), six are in late stages of cleanup. Finally, of the 42 sites that are either voluntary or where the most applicable cleanup authority has not been assigned, most sites (24, 57%) are in the early stages of cleanup. Cleanup of these generally smaller sites may be conducted using some combination of state authorities. Substantial sediment cleanup is also accomplished incidental to or in conjunction with maintenance dredging for navigation purposes and new construction dredging for development purposes. This is done using sediment quality evaluation guidelines and best management
8

practices of the Dredged Material Management Program (DMMP), which derives its authority from the Clean Water Act as well as other federal and state laws and rules. The most current estimate of the area of contaminated sediment “cleaned up” under the DMMP over the past 17 years is 150-305 acres. This represents 18%-36% of the most current cumulative estimate of 850 acres that is associated with sites where cleaned has been completed with cleanup program oversight, e.g., EPA’s Superfund and Ecology’s cleanup programs and those in a late stage of cleanup.
9

How Much Sediment Is Contaminated? While the total area of sediment contamination is an important metric for determining aquatic health, it is as important to understand the relative severity of contamination. The estimated area of the cleanup sites presented here is for the most highly contaminated sediment in Puget Sound. Other areas of Puget Sound have levels of contamination, impacts and risk that do not currently warrant active cleanup. The Sediment Management Standards rule provides numeric marine chemical and biological standards above which ecological effects begin to appear, the Sediment Quality Standards (SQS). The rule additionally sets forth Cleanup Screening Levels (CSL) for regulatory purposes which are higher than the SQS and trigger cleanup action. There are many documents that estimate the area of Puget Sound sediments that is contaminated. These include previous Sediment Cleanup Status Reports (Ecology 2000, 2001, and 2003), the State of the Sound (Puget Sound Water Quality Action Team 2004), numerous Marine Sediment Monitoring Program reports (Ecology 1990-2000) and the Programmatic Environmental Impact Statement for the Puget Sound Confined Disposal Site Study (Corps, 1999). Their estimates all differ to some degree from each other depending on the study purpose and parameters measured. This report estimates the currently known area of contaminated sediment in Puget Sound according to the SMS rule. The area of contamination outside of Puget Sound is not as detailed and is not presented here. Information on the area of cleanup sites is available for 81 (70%) of the 115 marine sites listed in this report. The total reported area for these sites is 2510 acres. This value is a rough estimate because specific boundaries for many sites have not been defined. The average size of sites with area reported is 24.6 acres, with the median value considerably smaller at 12.8 acres. If the average and median acreage is applied to the 34 sites lacking area information, then the estimated area associated with all Puget Sound sediment sites is in the range of 2940 - 3340 acres as shown in Table 3.
No. of Sites EstimatedAcres
Marine Sediment Siteswith Acreage Data 81 2510
Marine Sediment Siteslacking Acreage Data(Using Mean 24.6 Acres)
34 835
Marine Sediment Siteslacking Acreage Data(Using Median 12.8 Acres )
34 435
Total Area of Marine Sediment Cleanup Sites 115 2940 - 3340
Table 3. Estimated Acreage for Puget Sound Sediment Sites Sediment quality has been sampled and evaluated for the most severely impacted areas of Puget Sound, the urban and industrialized embayments which compose less than one percent of the entire area. Table 4 compares the most current estimates for impacted area above the SQS as well as that for all marine cleanup sites in acreage to the whole Sound. The total area of Puget
10

Sound, including the Straight of Juan de Fuca, Straight of Georgia and Hood Canal, is 1.8 million acres. Between 35% and 40% of this area of sediment that has been surveyed exceeds the SQS. It is this value of about 5750 acres that is most frequently cited as the total area of contaminated marine sediment. Table 4 also shows that of the 15,240 acres of sediment surveyed about two-thirds of sediment stations reveal no or little contamination. This should not, however, be interpreted to mean that a third of Puget Sound is contaminated because most sediment investigations focus on the urban bays and other areas of suspected contamination.
Puget Sound Areas Acres As Percent ofPuget Sound
Puget Sound(includes Straight of Juan de Fuca, Straight of and Hood Canal)
1,798,240 100
Marine Sediment Survey Area 15,240 0.85
Estimated Area Exceeding Sediment Quality Standards 5,750 0.32
Estimated Area ofSediment Cleanup Sites 2940 - 3340 0.16 - 0.19
Table 4. Puget Sound Sediment Cleanup Site Area in Perspective. The estimated area of marine sediment cleanup sites, 2940 – 3340 acres, is somewhat more than one-half of the area exceeding the SQS. Because the SQS is a lower impact level than the one that triggers cleanup, the area exceeding the SQS does not indicate active cleanup. These lower impact “sites” are considered areas of concern and may be monitored by the State to determine whether they will improve over time. Depending on site specific conditions, this is often possible with reductions in contamination from source control, sedimentation of cleaner material on top of the contaminated layer (natural capping), biodegradation, or other forms of natural recovery
11

Cleanup Challenges While initial investigations have begun on many cleanup sites, there are often obstacles that prevent sites from progressing more quickly in the cleanup process. Additionally, barriers sometimes exist which prevent some new sites from starting the cleanup process. The major impediments to cleanup are listed and discussed briefly in no particular order below. • Disposal Capacity and Cost
Disposal capacity and cost of disposal often play a major role in decisions made for sites in the later phases of cleanup, namely the feasibility phase, which identifies potential cleanup and disposal alternatives for contaminated material. The Programmatic Environmental Impact Statement for the Puget Sound Confined Disposal Site Study (MUDS, 1999) identified 30 sites where cleanup could be expedited by the construction of a regional facility for disposal of contaminated sediment. Subsequent MUDS siting studies coupled with private sector investments, however, concluded that there is no need to construct a new multi-user disposal facility for contaminated sediments because adequate landfill disposal capacity already exists. While disposal costs at eastern Oregon and Washington solid waste landfills have become competitive with other management alternatives, they remain substantial at an estimated $50-$100 per cubic yard.
• Sources Not Yet Controlled Concerns about recontamination from ongoing, uncontrolled sources of contaminants delay cleanup of some sites. It is not reasonable to conduct costly cleanup activities where sediments will become recontaminated by ongoing sources. An early step in the cleanup process is to, therefore, identify and control upland sources of contamination prior to cleanup itself which is especially important at large, complex sites involving numerous parties. This requires coordination with water quality permit managers and cleanup of upland properties, including contaminated groundwater, all prior to cleanup.
• Reluctant Liable Party For work to progress smoothly, it is important that a liable party be willing to work toward common cleanup goals. When the liable party is unwilling to work cooperatively with Ecology and other liable parties, cleanup may become temporarily stalled at the initial investigation stage until appropriate actions, such as formal dispute resolution, are effective. Additional staff and legal resources are often required if a liable party is non-responsive or otherwise uncooperative.
• Resources Demand for sediment expertise at an increasing number of sediment sites challenges Ecology to balance resources carefully. The agency strives to direct resources toward the highest priority contaminated sites first, which may forestall action at lower priority sites. Progress may also appear slow on some sites, but sediment cleanups are often more complex than generally understood. In addition to cleanup and source control activities, sediment specialists expend substantial effort coordinating with other agency and external staff on a myriad of important related issues. These often involve water quality, dredging, land management permits, endangered species laws other natural resource and human health issues, as well as tribal fishing rights. Many of these activities support pollution prevention and are prerequisite to effective, long-term cleanups.
12

• State-Owned Aquatic Land Management Policy
When the state is involved, either as a landowner or land manager of a sediment site, or as the owner/manager of a potential disposal area, concerns about long-term liability of a selected remedy must be carefully considered. These concerns include the need to ensure that designated aquatic lands are capable of maintaining and providing the full range of benefits, including public use and access, and that parties responsible for contamination of state lands assume long-term liability. Increased interagency coordination and identification of common goals has helped accelerate sediment cleanups involving state-owned aquatic land. Recently, the development of collaborative management policies has reduced this impediment, resulting in more efficient and timely cleanup actions. Ecology and Washington’s Department of Natural Resources (DNR) are committed to working together to ensure that sediment cleanups involving state-owned aquatic lands (SOAL) continue.
• Regulatory Uncertainties
Some liable parties resist expediting cleanup because of concerns that non-cleanup laws, such as recent salmon listings under the Endangered Species Act or TMDL provisions of the Clean Water Act, may result in additional cleanup requirements. Ecology does coordinate with other natural resource agencies, however, to prevent this from happening and avoid duplication between agencies whenever possible. Some sites are also slowed by the need to develop cleanup levels on a case-by-case basis. This has been especially true for freshwater sites, but recent development of regional freshwater sediment quality guidelines should help overcome this obstacle.
• Potential Superfund Listing Ecology site managers identified a small number of sites where investigations or actions were deferred until it was determined if the site would be listed as a federal Superfund site. This was most recently true for the Lower Duwamish Waterway and the East Waterway of Harbor Island. Although decisions on these sites have now been made, this may again occur elsewhere.
• Area-wide contamination Sites under investigation for contamination or cleanup may be a small subset of a bay wide or even larger regional problem. Many areas of Washington State are contaminated from historical smelter emissions, historical use of lead arsenate pesticides, and past combustion of leaded gasoline. Elevated levels of arsenic and lead have been measured in soil, for instance, from one Tacoma smelter plume that is estimated to extend over three counties and numerous watersheds. Such contamination may be washed into water systems where it precipitates out in the form of sediment. Persistent bioaccumulative compounds are also of wide scale concern, especially for human health. Examples of this are the lower level ubiquitous TBT and PCB contaminated areas in Lake Union. Given such area-wide considerations, major cleanup actions on a site-by-site basis are sometimes postponed until a coordinated system-wide strategy is developed.
13

How Much Does Cleanup Cost?
Cleanup Cost Ranges Cleaning up contaminated sediment is an expensive, but important endeavor that is basic to restoring the health of the Sound and other areas that support complex ecosystems. This section discusses the cost of sediment cleanup. Cost information was available for a total of 90 sites. The information provided for most sites was limited to or screened to include only the cost of construction and post-cleanup remedial action monitoring. Because this was not always possible, however, estimated costs for some sites may include the cost of prior investigations and remedial design. For sites where more than one cost value was reported, judgment was used to determine the most likely cost or range of costs. The cost information summarized here should be considered estimates. The accuracy of cost estimates for individual sites varies greatly depending on the stage of cleanup at the individual sites. For sites that are in the early stages of the cleanup process, the estimated cost range varies widely due to uncertain site boundaries and undetermined remedies. In these cases, estimates are based on the estimated acreage and volume of contaminated sediments at the sites. Sites in the later stages of cleanup use feasibility study or actual design data to determine costs and are more accurate. Costs also vary depending upon the potential remedy or combination of remedies as well as the disposal options selected for the site. Remedies may include, but are not limited to, natural or enhanced natural recovery (with monitoring), capping, dredging, in situ bioremediation and active treatment. Disposal options vary from near shore placement and confined aquatic disposal to disposal at regulated landfills. Each option can significantly modify final cost estimates. Estimating Cost of Remaining Cleanup Many of the cost categories described are quite large, e.g., $0.5-$5 million, due to high uncertainty. Table 5 shows the values assigned to sediment sites throughout the state (mostly sites in the Puget Sound region). Of the 90 sites having cost information, 56 (>60%) are estimated to $5 million or less. There are relatively few sites with construction and monitoring costs in the high end categories, skewing the distribution of cost data. For this reason, estimates for sites with no cost information are based on median values and not average values. The total cost for these 90 sites estimated using cost ranges is between $400 million and $1.2 billion. The grand total for all sites, with or lacking cost data is likely to be in the $475 million to $1.1 billion range.
14

Cost Range($1,000,000)
Numberof Sites
Total Est. Cost Range
($1,000,000)<0.5 15 <8<1 9 <9
0.5 - 5 20 10-1001-5 12 12-601-25 1 1-255-10 17 85-1705-25 1 5-2510-30 8 80-24010-50 4 40-20010-100 1 10-10050-100 2 143
Not Identified/Unknown 52 ---
Total 142 413 - 1080 Table 5. Estimated Cleanup Cost Ranges for Sediment Sites with Cost Information. Values reported include estimates for sites that have already been completed, sites that are still be investigated and sites that have not begun investigations.
Finally, total estimated costs are listed for completed and unfinished sites that lack cost data. Previous reports have assigned average values, which tends to overestimate cost. Estimates provided in this report for completed sites are based on the median value for those sites only ($0.5 - $2.0 million), while the estimates for unfinished sites are based on the median value for all sites ($1.0-$5.0 million). Table 6 below shows the estimated costs for completing work on all unfinished sediment cleanup sites is likely between $276 million and $855 billion. This is a rather broad range that will be narrowed as more sites progress to the latter phases of cleanup.
Status and Cost Information No. of sitesLow CostEstimate
($1,000,000)
High CostEstimate
($1,000,000)Completed Sites With Costs 36 189 195Completed Sites Lacking Costs 18 9 36Total for Finished Sites 54 198 231Unfinished Sites With Costs 54 242 685Unfinished Sites Lacking Costs 34 34 170Total for Unfinished Sitess 88 276 855Grand Total 142 474 1086
Table 6. Estimated Cleanup Costs for All Completed and Unfinished
(In Progress and Not Started) Sediment Sites.
15

State Managed Aquatic Land One important aspect of sediment cleanup is that all the aquatic bedlands (submerged lands that are not exposed at low tide or low water) are owned by the State of Washington and approximately 30% of the tidelands also have a public interest through their ownership by either the state or port districts. Additionally, urban bays have legislatively designated “harbor areas” that are managed by the State to support water-dependent commerce and navigation. DNR is the designated state agency responsible for management of state-owned aquatic lands. For many sites that include state-owned aquatic land, addressing liability concerns and determining appropriate policy choices for land held in the public trust have proven difficult. Cost estimates listed here are for cleanup on aquatic lands owned or managed by the State, not the state share of cleanup costs. Below is the breakdown of all 142 sediment cleanup sites by the estimated or known percent of state-owned aquatic lands for each site [Figure 7].
23 Sites
12 Sites11 Sites2 Sites
30 Sites
59 Sites
0
10
20
30
40
50
60
Unknown 0% <10% 10%-50% 51%-99% 100%
Percent SOAL
Num
ber o
f Site
s
Figure 7: Percent State Managed/Owned Aquatic Lands at Sediment Cleanup Sites. Total cost to clean up those aquatic lands owned or managed by the State is estimated to be approximately $350 to $730 million. Of the 142 sites identified in this report, 54 sites have either been completed or are reported as needing no further action. The estimated costs associated with these sediment cleanup sites is approximately $200 to $230 million. If the latter values are subtracted from the total estimated costs, then the cost associated with cleanup of the remaining aquatic lands owned or managed by the State is approximately $150 to $500 million. Table 7 shows the estimated range of sediment cleanup costs associated with state-owned aquatic land using currently available information. The assumptions used to calculate total values are shown in the table. Note that the first column, entitled “Site Information,” is provided to indicate in which categories information was or was not available.
16

Site Information No.Sites
Low Estimate of State Cost ($1,000,000)
High Estimate of State Cost ($1,000,000)
All Completed Sitesw/ and w/o Costsw/ and w/o % SOAL
54 198 231
Sites w/ 0% SOAL 29 59 153
Sites w/ Costs and w/ % SOAL 59 242 494
Sites w/ Costs and w/o % SOAL(assumes 50% SOAL) 31 85 132
Sites w/o Costs and w/ % SOAL(assumes $1.0M - $5.0M for median all sites) 26 8 41
Sites w/o Costs and w/o % SOAL(use assumptions above) 26 13 65
Totals 142 348 732
Table 7. Estimated Sediment Cleanup Costs on State Owned/Managed Aquatic Lands
17

Sources of Contamination Most of the sediment contamination identified in Washington State has resulted from historical activities that have ceased or been improved. Many of the practices that have been improved to reduce environmental contamination, however, still exist in some form today and must be carefully monitored. The “Industrial” source category is most commonly cited by site managers as the primary or secondary source of contamination. This category is very general and describes a wide range of manufacturing activities. Three more specific categories of industrial activities and sources are displayed separately: “Wood/timber/ paper” (including wood treatment), “Mining/Industrial” and “Petroleum/Industrial" (refining, transport and storage). When combined, these sources comprise nearly one-half of all source citations. “Stormwater” is the only category that is cited more often as a secondary source than as a primary source of contamination. The relative contribution of source to sediment contamination by major category is shown below [Figure 8]. Industrial and municipal discharges are now regulated to prevent the release of significant quantities of contaminants that historically caused the cleanup sites discussed in this report. Water quality discharge permits issued by Ecology today include requirements to prevent future sediment contamination. In addition, Ecology’s Water Quality and Toxics Cleanup programs are currently developing a strategy to better identify and address sediment contamination by stormwater. Methods and procedures for assessing potential sources of sediment contamination are provided in the source control section of the Sediment Management Standards (WAC 173-204-400 through 420).
Mining/Industrial2%
Other9%
Unknown 8%
Wood/Timber/Paper 11%
Navy 5%
Spills 4%
Shipyards/Marinas 10%
Stormwater10%
Petroleum/Industrial5%
Industrial29%
Combined Sewer
Overflow 7%
Figure 8: Sources of Contamination at Sediment Cleanup Sites in
Washington State.
18
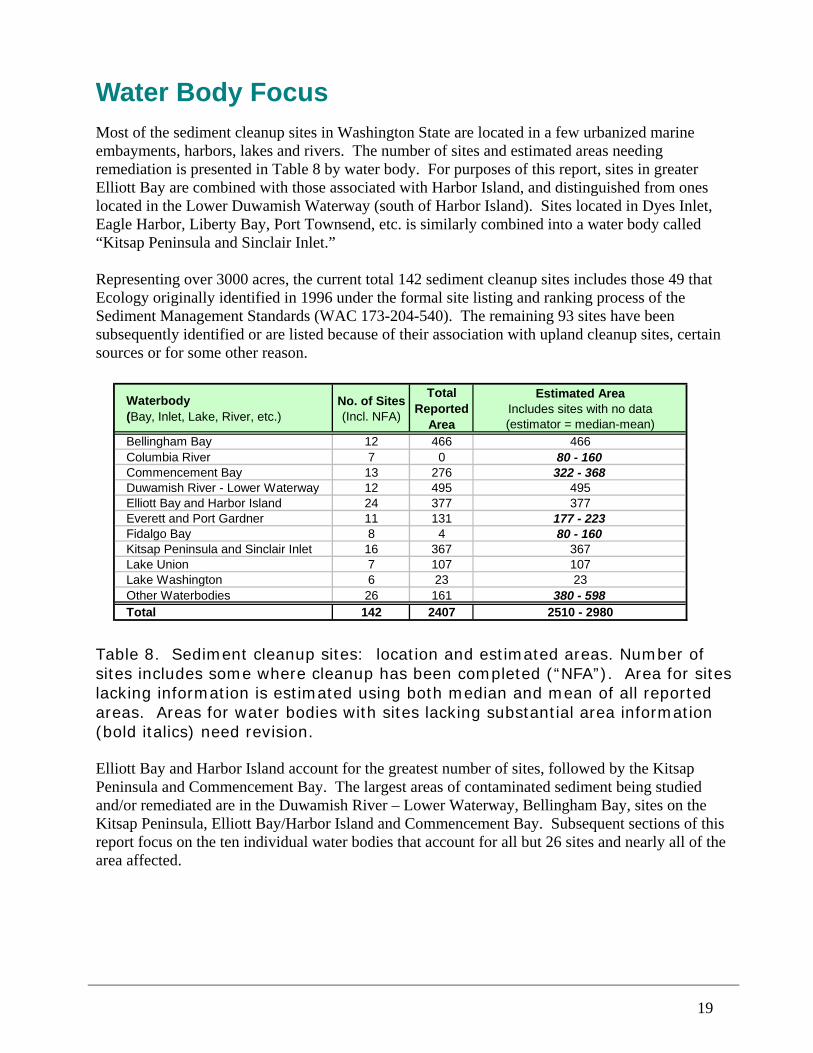
Water Body Focus Most of the sediment cleanup sites in Washington State are located in a few urbanized marine embayments, harbors, lakes and rivers. The number of sites and estimated areas needing remediation is presented in Table 8 by water body. For purposes of this report, sites in greater Elliott Bay are combined with those associated with Harbor Island, and distinguished from ones located in the Lower Duwamish Waterway (south of Harbor Island). Sites located in Dyes Inlet, Eagle Harbor, Liberty Bay, Port Townsend, etc. is similarly combined into a water body called “Kitsap Peninsula and Sinclair Inlet.” Representing over 3000 acres, the current total 142 sediment cleanup sites includes those 49 that Ecology originally identified in 1996 under the formal site listing and ranking process of the Sediment Management Standards (WAC 173-204-540). The remaining 93 sites have been subsequently identified or are listed because of their association with upland cleanup sites, certain sources or for some other reason.
Waterbody (Bay, Inlet, Lake, River, etc.)
No. of Sites (Incl. NFA)
TotalReported
Area
Estimated AreaIncludes sites with no data(estimator = median-mean)
Bellingham Bay 12 466 466Columbia River 7 0 80 - 160Commencement Bay 13 276 322 - 368Duwamish River - Lower Waterway 12 495 495Elliott Bay and Harbor Island 24 377 377Everett and Port Gardner 11 131 177 - 223Fidalgo Bay 8 4 80 - 160Kitsap Peninsula and Sinclair Inlet 16 367 367Lake Union 7 107 107Lake Washington 6 23 23Other Waterbodies 26 161 380 - 598Total 142 2407 2510 - 2980
Table 8. Sediment cleanup sites: location and estimated areas. Number of sites includes some where cleanup has been completed (“NFA”). Area for sites lacking information is estimated using both median and mean of all reported areas. Areas for water bodies with sites lacking substantial area information (bold italics) need revision. Elliott Bay and Harbor Island account for the greatest number of sites, followed by the Kitsap Peninsula and Commencement Bay. The largest areas of contaminated sediment being studied and/or remediated are in the Duwamish River – Lower Waterway, Bellingham Bay, sites on the Kitsap Peninsula, Elliott Bay/Harbor Island and Commencement Bay. Subsequent sections of this report focus on the ten individual water bodies that account for all but 26 sites and nearly all of the area affected.
19

Bellingham Bay
Figure 9: Vicinity Map of Bellingham Bay showing sediment quality sampling locations. Lummi Island is to the west and Samish Bay is to the south. In 1996 Bellingham Bay was chosen for a pilot project to effect a bay-wide cleanup of contaminated sediments involving agencies from all levels of government, tribes and business. Since then much has been accomplished. An Environmental Impact Statement (EIS) for the Bellingham Bay Comprehensive Strategy was completed in July 1999 and a supplemental EIS was issued in March 2000. Discussions of site-wide issues with the Port and City Bellingham, land owners, potentially liable parties, tribes, natural resource agencies and the public have facilitated several cleanups. The Department has strongly encouraged the public to participate and consider future use of the waterfront throughout the cleanup process. Twelve sediment cleanup sites are listed for Bellingham Bay in Table 9, based on data collected at the sampling locations shown above [Figure 9]. The size of sites ranges from <1 – 210 acres. Most are located on state-owned aquatic lands and are in advanced phases of investigation, e.g., Remedial Investigation/Feasibility Study (RI/FS) status. The total cost of sediment cleanups is estimated to be in the $60-$180 million range, but this may decrease with completion of the Whatcom Waterway RI/FS. Four of the 12 sites listed in this report were also on Ecology’s 1996 Contaminated Sediment Site list. Results of biological testing effectively refuted the listing of the Georgia Pacific Outfall site, but it continues to be monitored. The GP Log Pond site, considered part of the Whatcom Waterway
20

site, is being tracked separately because contaminated sediments have been capped in place as an interim action/partial cleanup to be monitored. Table 9. Bellingham Bay Sediment Cleanup Site Information
Site Name Causes of Contamination
Area(acres)
State Owned Land(%)
Site Cleanup Status
Low Cost Estimate
($1,000,000)
High Cost Estimate
($1,000,000)
Factors impeding progress
Cornwall Avenue Landfill Historic municipal landfill 10 100 FS 1 25 Overlaps
2nd Site
Georgia Pacific Log Pond Wood/timber/paper 6 100 CleanupMonitoring 0.8 0.8 ---
Georgia Pacific Outfall Industrial 5 100 Monitoring --- --- ---Harris Avenue Shipyard Shipyard, Industrial 3.9 100 FS 38 38 SPI&J Waterway(incl. Olivine Hilton Ave. sediments)
Industrial 15 20 RI 0.50 1 ---
Intalco Industrial 182 100 II --- --- PLP
Little Squalicum Creek Industrial, Stormwater 25 0 Work Plan --- --- ---
Marine Services Northwest Shipyard, Industrial 1 0 FS 0.25 1 ---
R.G. Haley Wood/timber/paper 7 25 II 5 10 Overlaps 2nd Site
Squalicum Shipyard Shipyard --- --- II --- 1 ---Weldcraft Steel/Gate 2 Boatyard Shipyard, Industrial 0.8 0 FS --- 1 ---
Whatcom Waterway Industrial 210 80 RI/FS 16 100* SP
Totals Various 466 80-85 62 178 Various
Bold Italics = site on Ecology's 1996 site list"---" = no data available or not applicable
* = Likely maximum cost. Greater cost if maximum removal and upkland disposal/treament
21

Columbia River
Figure 10: Vicinity Map of Lower Columbia River showing sediment locations in Washington State Investigations of sediment contamination in the Columbia River system generally began much later and involve fewer resources than similar investigations in the Puget Sound region. Based on the sediment quality data collected from the locations shown above [Figure 10] and in sections of the Upper Columbia River, Ecology has identified the seven known or suspected cleanup sites listed in Table 10. With the exception of the Port of Vancouver copper ore spill site, all of the Columbia River sites are in the initial stages of investigation and cleanup. Consequently, not much is known about sediment cleanup site area, ownership or costs for this area. As investigations progress, it is likely that some sites will need “no further action” while other new sites will be identified. In the Upper Columbia River (not shown), the Lake Roosevelt cleanup site contains sediments contaminated with metals from historical mining activities in Canada and the United States. Significant investigation of sediment contamination and consequential biological effects is underway will continue over the next several years. EPA may use their CERCLA authority to list Lake Roosevelt as a Superfund sediment site. Progress evaluating risk and developing a comprehensive remedy for this site is complicated by international issues.
22

Table 10. Columbia River Sediment Cleanup Site Information
Site Name Causes of Contamination
Area(acres)
State Owned Land(%)
Site Cleanup Status
Low Cost Estimate
($1,000,000)
High Cost Estimate
($1,000,000)
Factors impeding progress
Alcoa Aluminum PCBs, Vancouver Industrial --- 100 RI --- --- ---Columbia River Industrial --- --- Not Started --- --- FTE, LPGibbons Creek Wood/timber/paper --- 0 Not Started --- --- FTE, LP
Lake Roosevelt Mining/IndustrialWood/timber/paper --- --- RI --- --- P/G, PLP
$Port of Ridgefield Industrial --- --- II --- --- ---Port of Vancouver, Copper Ore Industrial --- --- Monitoring --- --- ---Weyerhauser LongviewLog Barking Wood/timber/paper --- --- II --- --- ---
TotalsIndustrial,
Wood/timber/paperMining
--- --- --- --- --- Various
Bold Italics = site on Ecology's 1996 site list"---" = no data available or not applicable
23

Commencement Bay
Figure 11: Vicinity map of Commencement Bay and the City of Tacoma showing sediment quality sampling locations. In the early 1980’s, EPA placed the Commencement Bay nearshore tideflats and waterways on the CERCLA/Superfund National Priority List. This area was, therefore, among the first in Washington State where contaminated sediment was evaluated in detail and remediation took place. The characterization of impacts and assessment of risks due to exposures to Commencement Bay sediments was fundamental to the development of sediment management programs in the state. Based on data collected at the locations shown above [Figure 11], there are 13 sediment cleanup sites listed in Table 11. Sediment quality at these sites reflects the long industrial history of Tacoma, including the former Asarco smelter, maritime commerce and stormwater discharges. The sites cover at least 275 acres and perhaps as much as 370 acres, more than one-third of which is likely owned and managed by the State. Over one-half of the Commencement Bay site cleanups, including all the major ones, have been or are being conducted under EPA’s CERCLA authority. Nearly all sites are in late stages of cleanup, e.g., feasibility studies, remedial design, cleanup or monitoring. Total cost of cleanup is likely to exceed $225 million. The main remaining challenge is to ensure that sources have been controlled and that industrial and municipal discharges do not cause recontamination.
24

Table 11. Commencement Bay Sediment Cleanup Site Information
Site Name Causes ofContamination
Area(acres)
State OwnedLand(%)
Site CleanupStatus
Low CostEstimate
($1,000,000)
High CostEstimate
($1,000,000)
Factorsimpedingprogress
CB1 - Asarco Mining/Industrial, Spills, Stormwater 35 100 Design 16 16 SC, $
CB2 - Thea Foss Industrial,Stormwater 71 90 Cleanup &
Monitoring 73 73 ---
CB3 - Hylebos Industrial,Stormwater 80 0 Cleanup &
Monitoring 70 70 ---
CB3 - Hylebos wood debris Wood/timber/paper --- 0 Cleanup &Monitoring --- --- ---
CB4 - Middle Waterway Industrial,Stormwater 11 90 Cleanup &
Monitoring 14 14 ---
Dickman Mill Wood/timber/paper --- --- RI --- --- ---
Occidental Chemical Industrial 3 0 FS 10.5 15 ---
Oline Autofluff Industrial --- 0 NFA 0.25 1 ---
Olympic View Resource Area Industrial 3 100 Monitoring 3 3 ---Pier 23, US Army Reserve Industrial, Shipyard 1.5 25 Design 1 5 ---Silver Cloud Inn, Ruston Leaking UST --- --- NFA 0.2 0.2 ---Sitcum Waterway Industrial 55 --- NFA 24 24 ---
St. Paul Waterway Industrial 17 --- Cleanup &Monitoring 5 5 ---
Totals Various 276 >35 --- 217 226 Source control
Bold Italics = site on Ecology's 1996 site list"---" = no data available or not applicable
25

Duwamish River – Lower Waterway
Figure 12: Vicinity Map of the Duwamish River – Lower Waterway showing sediment quality sampling locations. Lake Washington is to the east. The largest number of known or suspected sediment cleanup sites in Washington State is located in Elliott Bay and its main tributary, the Duwamish River. This report combines all of Elliott Bay with portions of the Duwamish River associated with Harbor Island into one water body, and treats the Duwamish River south of Harbor Island as a separate water body called the Lower Duwamish Waterway. Sediment sites in the Lower Duwamish are considered to be marine because of the deep wedge of saltwater that extends upriver to just past the turning basin, which is overlain by a much thinner layer of buoyant freshwater. Many decades of industrial and commercial activities along this waterway, together with discharges from urban stormwater and sewage treatment facilities, have contaminated sediments with a variety of chemicals, most commonly polychlorinated biphenyls or PCBs. Until recently, remediation of contaminated sediments in this water body, including the ‘incidental’ cleanup resulting from various navigation dredging projects, has been limited. In 2001, several public and private parties signed an Administrative Order on Consent (AOC) leading to extensive investigations of the Lower Duwamish Waterway. The site is considered both a CERCLA/Superfund and a state (MTCA/SMS) site. EPA oversees remedial investigations and actions, while Ecology has the lead role in source control activities. This
26

approach, coupled with participation of many other parties in the RI/FS process, should facilitate a comprehensive and technically-sound cleanup. Based on sediment quality data collected at the sampling locations shown above [Figure 12] and elsewhere, there are twelve sites for the Lower Duwamish River listed in Table 12. All of them, including the six identified by Ecology in its 1996 Contaminated Sediment Site List site list, lie within the working boundaries of the 495 acre Lower Duwamish Waterway Superfund/MTCA site, as defined by EPA and Ecology. Virtually all of the contaminated aquatic lands within this site are privately owned or managed under a Port Management Agreement with the state. Two of the individual sites listed are in the stage of cleanup and post-action monitoring, while two “early action areas” (or “partial cleanups” under the SMS) are in the Feasibility Study stage. The Boeing Plant 2 sediment site is also in the FS stage of cleanup but the cleanup is being conducted as a RCRA Corrective Action. The seven remaining sites are in the Remedial Investigation or RI stage of the cleanup process. Investigations of these sites are progressing well, but potential impediments include a) the complexity of sites, b) the estimated cost for cleanup of $30-$130 million, and c) the need for considerable human and dollar resources from liable parties and oversight agencies.
Table 12. Duwamish River - Lower Waterway Sediment Cleanup Site Information
Site Name Causes of Contamination
Area(acres)
State Owned Land(%)
Site Cleanup Status
Low Cost Estimate
($1,000,000)
High Cost Estimate
($1,000,000)
Factors impeding progress
Lower Duwamish WaterwaySuperfund Site
LDW - Boeing Plant 2 Industrial, Spills 23 0 FS 10 50 ComplexityPLP
LDW - South Harbor Island (DR29) Industrial, CSO 28 0 RI 5 10 ---
LDW - Main Channel (DR30) Industrial,Stormwater 115.5 0 RI 10 50 ---
LDW - Duwamish/Diagonal CSO (DR31) CSO, Stormwater 6.9 0 Cleanup &Monitoring 3 5 $
LDW - Brandon St. CSO (DR32) CSO 1.5 0 RI 0.5 5 ---
LDW - Slip 3, MP&E (DR34) Industrial,Shipyard 7.3 0 RI 0.5 5 ---
LDW - Duwamish Shipyard (DR36) Shipyard 2.1 0 RI 0.5 5 --- LDW - Terminal 117 Industrial --- 0 FS --- --- --- LDW - Slip 4 Stormwater, CSO --- 0 FS --- --- --- LDW - Norfolk CSO CSO 2 5 Monitoring 2.4 2.4 --- LDW - Rhone-Poulenc Industrial --- --- RI --- --- --- LDW - Seattle City Light Industrial --- --- RI --- --- ---
Totals Various 495* 0-5% --- 32 132 Complexity FTE, $
Bold Italics = site on Ecology's 1996 site list"---" = no data available or not applicable* = Area of overall Lower Duwamish Waterway site, of which an unkown fraction will be remediated
27

Elliott Bay and Harbor Island
Figure 13: Vicinity map for Elliott Bay, including the Seattle waterfront, and Harbor Island showing sediment quality sampling locations. As mentioned previously, sediment cleanup sites in Elliott Bay and near Harbor Island are summarized separately from the Duwamish River - Lower Waterway, with the south end of Harbor Island being the boundary between the water bodies. Contamination here is the result of various industrial activities and maritime commerce that, in part, has made Seattle the state's largest city. Municipal discharges of treated wastewater, stormwater and combined sewer overflows have also contributed to the contamination. Based on the data collected from the sediment quality sampling locations shown above [Figure 13], there are 24 sediment cleanup sites listed in Table 13 for Elliott Bay and Harbor Island. Most of these sites tend to surround Harbor Island, with a few more isolated sites located along the eastern shore of Elliott Bay on the Seattle downtown waterfront. The majority of contaminated sediment sites is either in the late stages of the cleanup process, completed or need no further action. This is in part due to the EPA’s earlier listing of Harbor Island as a Superfund site. Together these 24 sites encompass approximately 375 acres, approximately one-half on state-owned and managed aquatic lands. Final costs of sediment cleanup actions in this water body are estimated to exceed $200 million. Continuing sources of contamination, including the recent use of Pier 66 as a point of embarkation for large cruise ships, will likely lead to additional monitoring of previous cleanups in the future.
28

Table 13. Elliott Bay and Harbor Island Sediment Cleanup Site Information
Site Name Causes of Contamination
Area(acres)
State Owned Land(%)
Site Cleanup Status
Low Cost Estimate
($1,000,000)
High Cost Estimate
($1,000,000)
Factors impeding progress
EB1 - Harbor Island West Waterway StormwaterShipping 11.9 0 Monitoring 0 0 ---
EB10 - Todd/LockheedPetroleum/Industrial
Refueling SpillsShipyard
18.1 100 Design 5 10 ---
EB11 - Harbor Island West Waterway Shipyard wastes 6.6 0 NFA 0 0 ---
EB12 - Harbor Island West Waterway
StormwaterShipping 27.5 0 NFA 0 0 ---
EB13 - Harbor Island West Waterway Stormwater, CSO 6.1 0 NFA 0.5 5 ---
EB17 - East Waterway Unknown 18.9 45 RI 7 7 PLP
EB18 - Piers 48-52 Industrial, CSO, Stormwater 15.5 85 II 5 10 ---
EB2 - Harbor Island West Waterway Shipyard wastes 9.1 0 NFA 0 0 ---
EB23 - Seacrest Park Unknown 14.3 100 NFA 5 10 ---
EB25 - Central Seattle Waterfront Industrial, CSO, Spills 35.7 --- Not Started 10 50 FTE
EB26 - Denny Way CSO CSO 2.4 --- Monitoring 0.5 5 ---EB27 - Piers 46-48 CSO 1.6 0-5 Not Started 0.5 5 FTE
EB28 - Colman Dock, Pier 58 Industrial, CSOStormwater, Spills 12.8 35 II 5 10 ---
EB3 - Todd/Lockheed Shipyard 77.0 100 Design 5 25 ---EB5 - Todd/Lockheed Shipyard 19.7 80 Design 20 25 ---EB6 - Pacific Sound Resources (Old Wyckoff)
Wood/timber/paperIndustrial 11.4 100 Cleanup &
Monitoring 16 16 ---
EB7 - East Waterway CSOPetroleum/Industrial 12.0 0 RI 5 10 Design
EB8 - Harbor Island (partial T18) Industrial, CSOShipping 37.9 0 RI 5 25 PLP
EB9 - East Waterway Unknown 2.6 0 RI 0.5 5 PLP
Pier 53-55 Seattle IndustrialStormwater 8 --- NFA --- --- ---
Pier 65 ResuspensionStormwater 10 --- NFA 0.5 5 ---
Point Wells Chevron Petroleum/Industrial 16.8 60 II 0.5 5 PLPUnocal Edmonds Petroleum/Industrial 1.0 100 Design 0 1 ---Unocal Seattle Marketing Terminal Petroleum/Industrial --- --- NFA --- --- ---Totals Various 377 47 --- 90 218 FTE, PLP
Bold Italics = site on Ecology's 1996 site list"---" = no data available or not applicable
29

Everett and Port Gardner
Figure 14: Vicinity map of Everett and Port Gardner showing sediment quality sampling locations. There are eleven sediment cleanup sites located near the City of Everett that are listed in Table 14, based on sediment quality data collected from the locations shown above [Figure 14]. These sites cover at least 130 acres of intertidal and subtidal sediments, but involve little state-owned aquatic lands. With the exception of the Powder Mill Creek site, the sites have either not been started or determined to need no further action. Most of the completed sites were associated with the former Weyerhaeuser Everett facility. Sale of that facility helped expedite cleanup of associated sites.
30
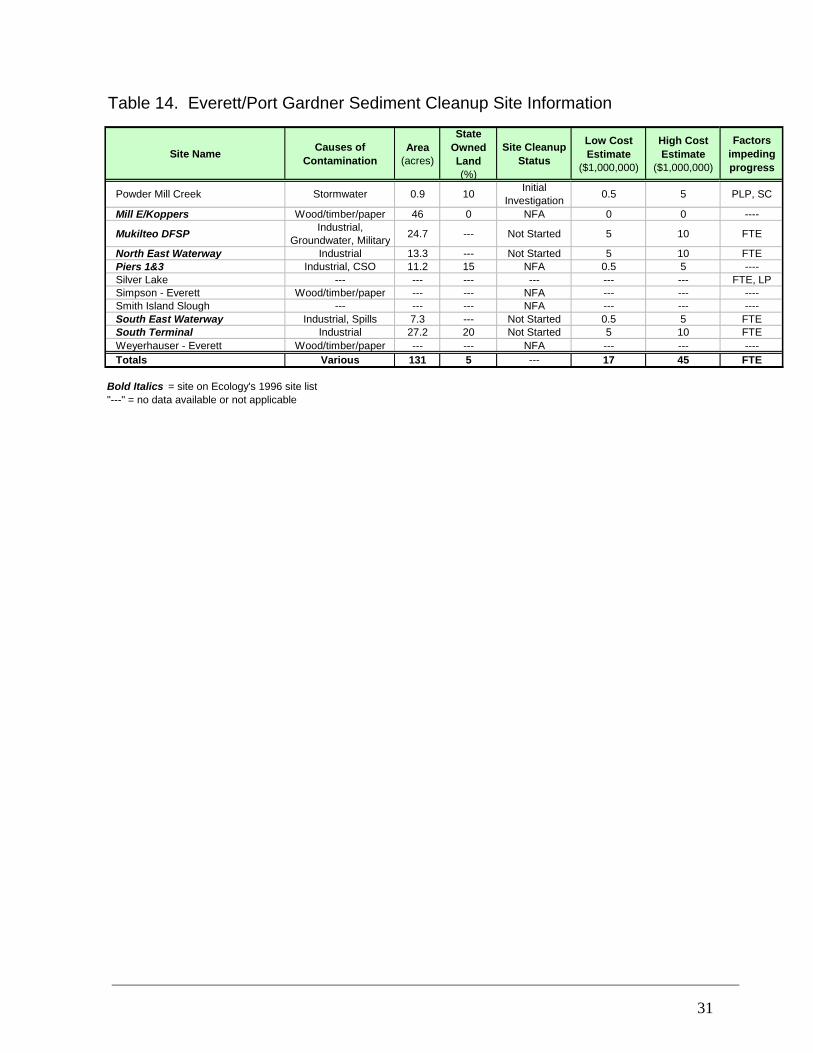
Table 14. Everett/Port Gardner Sediment Cleanup Site Information
Site Name Causes of Contamination
Area(acres)
State Owned Land(%)
Site Cleanup Status
Low Cost Estimate
($1,000,000)
High Cost Estimate
($1,000,000)
Factors impeding progress
Powder Mill Creek Stormwater 0.9 10 InitialInvestigation 0.5 5 PLP, SC
Mill E/Koppers Wood/timber/paper 46 0 NFA 0 0 ----
Mukilteo DFSP Industrial, Groundwater, Military 24.7 --- Not Started 5 10 FTE
North East Waterway Industrial 13.3 --- Not Started 5 10 FTEPiers 1&3 Industrial, CSO 11.2 15 NFA 0.5 5 ----Silver Lake --- --- --- --- --- --- FTE, LPSimpson - Everett Wood/timber/paper --- --- NFA --- --- ----Smith Island Slough --- --- --- NFA --- --- ----South East Waterway Industrial, Spills 7.3 --- Not Started 0.5 5 FTESouth Terminal Industrial 27.2 20 Not Started 5 10 FTEWeyerhauser - Everett Wood/timber/paper --- --- NFA --- --- ----Totals Various 131 5 --- 17 45 FTE
Bold Italics = site on Ecology's 1996 site list"---" = no data available or not applicable
31

Fidalgo Bay
Figure 15: Vicinity map of Fidalgo Bay showing the city of Anacortes and sediment quality sampling locations. Based on sediment quality data collected from the locations shown above [Figure 15], eight sediment sites are identified in Fidalgo Bay near the City of Anacortes and listed in Table 15. Most of the sites are in the early stages of cleanup. Much of the information about area, land ownership and cost of cleanup has not been determined. Although two refineries are located in Fidalgo Bay, the sites listed here do not appear to be associated with refinery operations. Instead, these sites are associated with maritime and historical industrial activities near Anacortes.
32

Table 15. Fidalgo Bay Sediment Cleanup Site Information
Site Name Causes of Contamination
Area(acres)
State Owned Land(%)
Site Cleanup Status
Low Cost Estimate
($1,000,000)
High Cost Estimate
($1,000,000)
Factors impeding progress
Custom Plywood Wood/timber/paper 3.7 0% II 1 5 PLP
Dakota Creek Shipyard Shipyard/marinaIndustrial --- 0% II --- --- ---
Fidalgo Marina Shipyard/marinaIndustrial --- --- Not Started --- --- FTE
MJB Properties Industrial --- --- II 1 5 PLPScott Paper Co. Wood/timber/paper --- --- RI/FS --- --- PLPShannon Point Seafoods Industrial --- --- NFA --- --- ---V Street Industrial --- --- Not Started --- --- PLPWymann's Marina Shipyard/marina --- --- Not Started --- --- FTETotals Various 3.7 --- 1 5 FTE,
Bold Italics = site on Ecology's 1996 site list"---" = no data available or not applicable
PLP
33

Kitsap Peninsula, including Sinclair Inlet
Figure 16: Vicinity map for the Kitsap Peninsula and Sinclair Inlet showing sediment quality sampling locations. Sediment contamination of this region is primarily due to naval operations, timber industry, and municipal and stormwater discharges. All water bodies on the Kitsap Peninsula are considered together for purposes of this report. This includes Dyes Inlet, Eagle Harbor, Liberty Bay, Ostrich Bay, Port Gamble, Port Townsend and Sinclair Inlet. All of the larger sites, such as Eagle Harbor, Sinclair Inlet and U.S. Navy Jackson Park, are being investigated and remediated under EPA’s CERCLA authority, with Ecology providing assistance. These and most other sites in the Kitsap water body are in the late stages of the cleanup process. The sites here total approximately 370 acres, with about 60% being on state-owned and managed aquatic lands. Based on the data from sampling locations shown above [Figure 16] and elsewhere, there are 16 cleanup sites listed in Table 16 for this area of the Puget Sound. Total costs may exceed $30 million. Factors that may be impeding progress on sites that the earlier stages of cleanup include continued sources of contamination and uncooperative liable parties.
34

Table 16. Kitsap Peninsula and Sinclair Inlet Sediment Cleanup Site Information
Site Name Causes of Contamination
Area(acres)
State Owned Land(%)
Site Cleanup Status
Low Cost Estimate
($1,000,000)
High Cost Estimate
($1,000,000)
Factors impeding progress
Bremerton Evergreen Park Industrial 2.3 --- II --- --- FTE, LPChevron Poulsbo Petroleum/Industrial --- --- NFA --- --- ---Eagle Harbor - East OU 1 Wood/timber/paper 33.7 100 Monitoring 1.9 2 ---Eagle Harbor - East OU 2 Wood/timber/paper 33.7 100 Monitoring 1.9 2 ---Eagle Harbor - West OU Wood/timber/paper 7.0 100 Monitoring 4 5 ---Port Gamble(Pope and Talbot) Wood/timber/paper 17 --- II --- --- PLP
Port Ludlow Industrial --- --- II --- --- FTE, LP
USACE Manchester Annex Navy operationsLandfill 4.9 100 Monitoring 0.25 1 ---
USN Jackson Park Navy operations 169 80 FS 1 2 PLP, SC,munitions
USN Keyport - Liberty1 Navy operations 23.8 --- NFA 0.05 0.1 ---USN Keyport - Liberty2 Navy operations 12.0 --- NFA 0.05 0.1 ---USN Keyport - Tide Flats Navy operations 0.2 0 Monitoring 0.25 0.25 ---USN Port Hadlock Navy operations 9.2 --- NFA 0.5 5 ---
USN PSNS - Sinclair East Navy operations 22.5 0 Cleanup &Monitoring 7 7 ---
USN PSNS - Sinclair West Navy operations 22.5 5 Cleanup &Monitoring 7 7 ---
USN Subase Bangor Navy operations 9.2 --- Monitoring 0.05 0.1 ---
Totals Navy operationsWood/timber/paper 367 60 24 31 SC, PLP
FTE
Bold Italics = site on Ecology's 1996 site list"---" = no data available or not applicable
35

Lake Union
Figure 17: Vicinity Map of Lake Union and the nearby ship canal showing sediment quality sampling locations. Lake Union and the Ship Canal are located in the heart of Seattle. Seven sediment sites here comprise over 100 acres of mostly state-owned aquatic lands that have been contaminated as a result of maritime and various other industrial activities. One notable exception is the Gas Works Park sediment site that is contaminated with petroleum hydrocarbons and PAHs. Other near shore sites may involve contaminated fill material that pre-dates the WW II era. The seven contaminated sediment sites identified in Table 17 are based on the sediment quality sampling locations shown above [Figure 17]. These are considered freshwater sediment sites despite the fact that some marine water enters the basin through the locks at the Ship canal. The Lake Union sites are in an early stage of cleanup. Cleanup of the entire basin is estimated to cost 12-45 million dollars. One of the significant issues that somewhat hinders site-by-site cleanup is the ubiquitous nature of lower but still toxic levels of bioaccumulative contaminants of concern in the lake, namely tributyl tin (TBT) and PCBs. Ecology site managers identified source control as a primary impediment to progress in Lake Union.
36

Table 17. Lake Union and Ship Canal Sediment Cleanup Site Information
Site Name Causes of Contamination
Area(acres)
State Owned Land(%)
Site Cleanup Status
Low Cost Estimate
($1,000,000)
High Cost Estimate
($1,000,000)
Factors impeding progress
Gas Works Park Petroleum, Industrial 51.7 90 FS 10 30Source Control,
FTE
Lake Union Drydock Stormwater, Refueling 11.5 20 II 0.5 5Source Control,
FTE
NOAA Dockside Facility Shipyard 11.5 --- II 0.5 5Source Control,
FTENorthlake Shipyard Shipyard 32.1 80 II 0.5 5 FTE
Seattle Commons/Lake Union Air Industrial,Stormwater --- --- Not Started --- --- FTE
South Lake Union Wharf Wood/timber/paper, industrial 0.23 100 Cleanup &
Monitoring --- --- ---
Unimar Northlake Petroleum, Industrial 0.34 100 RI --- --- Overlaps 2nd site
Totals Various 107 70 II 12 45Source Control,
FTE
Bold Italics = site on Ecology's 1996 site list"---" = no data available or not applicable
37

Lake Washington
Figure 18: Vicinity Map for Lake Washington showing sediment quality sampling locations. The City of Seattle, Lake Union and most of the Lower Duwamish River are all to the west, while Lake Sammamish is immediately east. Most of the sediment quality data for Lake Washington have been collected from around a few distinct sites near the south end, with little known about sediments in the rest of the lake [Figure 18]. Because much of the lake does not have the influences that cause sediment contamination, however, it is not likely to have sediment causing adverse impacts or risks to human health. Contaminants from historical wood treatment and other industry are the predominant concern in the southern part of the lake. Based on the available data, there are six sites listed for Lake Washington in Table 18. These sites represent approximately 23 acres, of which roughly one-half may be owned by the State. Two of the sites are in early stages of cleanup. Costs are estimated to be in the range of $6-$19 million, primarily associated with cleanup of Port Quendall.
38

Table 18. Lake Washington Sediment Cleanup Site Information
Site Name Causes of Contamination
Area(acres)
State Owned Land(%)
Site Cleanup Status
Low Cost Estimate
($1,000,000)
High Cost Estimate
($1,000,000)
Factors impeding progress
Barbee Mill Wood/timber/paper 2.6 50-75% Monitoring 0.5 2.5 ---Baxter Wood/timber/paper 1.0 50-75% NFA 0.1 1 ---Lakepoint Industrial 1.1 0% Not Started 0.5 5 PLPNOAA Sandpoint Military, Stormwater --- --- Monitoring --- --- ---Port Quendall Wood/timber/paper 13.5 35% Design 5 10 $South Lake WA/Renton Industrial/Outfalls 5.0 90% RI --- --- PLPTotals Various 23 50% 6 19
Bold Italics = site on Ecology's 1996 site list "---" = no data available or not applicable
39
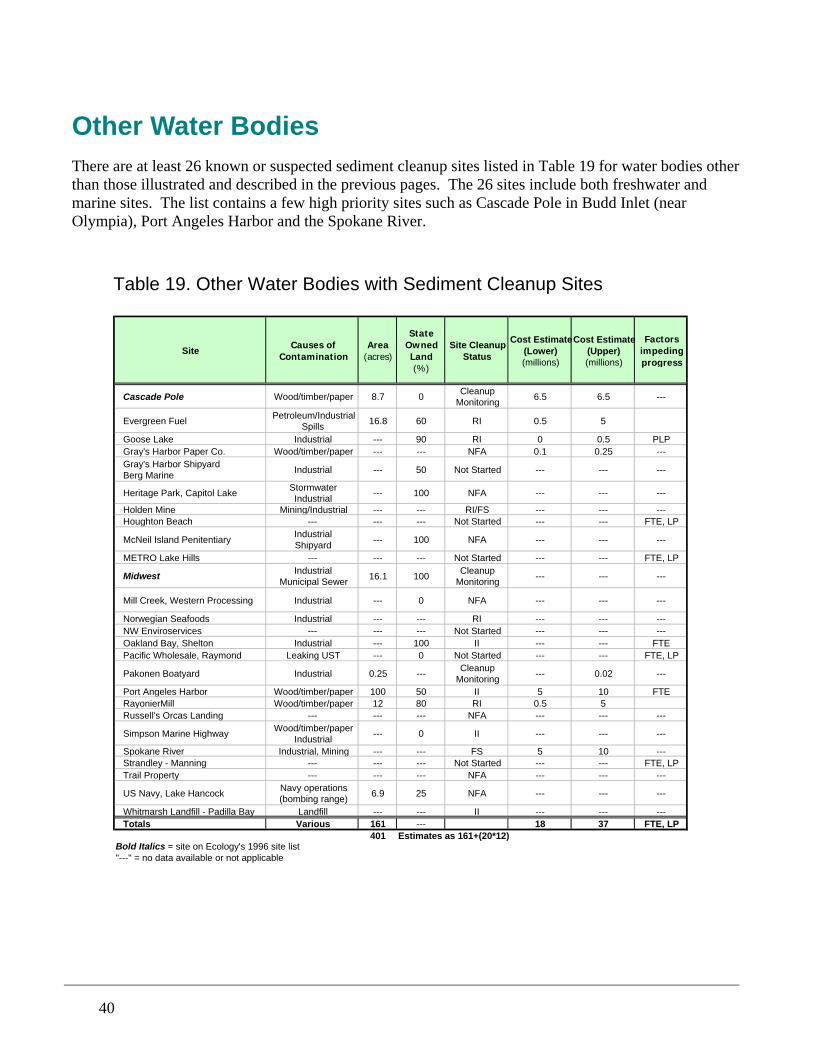
Other Water Bodies There are at least 26 known or suspected sediment cleanup sites listed in Table 19 for water bodies other than those illustrated and described in the previous pages. The 26 sites include both freshwater and marine sites. The list contains a few high priority sites such as Cascade Pole in Budd Inlet (near Olympia), Port Angeles Harbor and the Spokane River. Table 19. Other Water Bodies with Sediment Cleanup Sites
Site Causes of Contamination
Area(acres)
State Owned Land(%)
Site Cleanup Status
Cost Estimate (Lower) (millions)
Cost Estimate (Upper) (millions)
Factors impeding progress
Cascade Pole Wood/timber/paper 8.7 0 CleanupMonitoring 6.5 6.5 ---
Evergreen Fuel Petroleum/IndustrialSpills 16.8 60 RI 0.5 5
Goose Lake Industrial --- 90 RI 0 0.5 PLPGray's Harbor Paper Co. Wood/timber/paper --- --- NFA 0.1 0.25 ---Gray's Harbor Shipyard Berg Marine Industrial --- 50 Not Started --- --- ---
Heritage Park, Capitol Lake StormwaterIndustrial --- 100 NFA --- --- ---
Holden Mine Mining/Industrial --- --- RI/FS --- --- ---Houghton Beach --- --- --- Not Started --- --- FTE, LP
McNeil Island Penitentiary IndustrialShipyard --- 100 NFA --- --- ---
METRO Lake Hills --- --- --- Not Started --- --- FTE, LP
Midwest IndustrialMunicipal Sewer 16.1 100 Cleanup
Monitoring --- --- ---
Mill Creek, Western Processing Industrial --- 0 NFA --- --- ---
Norwegian Seafoods Industrial --- --- RI --- --- ---NW Enviroservices --- --- --- Not Started --- --- ---Oakland Bay, Shelton Industrial --- 100 II --- --- FTEPacific Wholesale, Raymond Leaking UST --- 0 Not Started --- --- FTE, LP
Pakonen Boatyard Industrial 0.25 --- Cleanup Monitoring --- 0.02 ---
Port Angeles Harbor Wood/timber/paper 100 50 II 5 10 FTERayonierMill Wood/timber/paper 12 80 RI 0.5 5 Russell's Orcas Landing --- --- --- NFA --- --- ---
Simpson Marine Highway Wood/timber/paperIndustrial --- 0 II --- --- ---
Spokane River Industrial, Mining --- --- FS 5 10 ---Strandley - Manning --- --- --- Not Started --- --- FTE, LPTrail Property --- --- --- NFA --- --- ---
US Navy, Lake Hancock Navy operations(bombing range) 6.9 25 NFA --- --- ---
Whitmarsh Landfill - Padilla Bay Landfill --- --- II --- --- ---Totals Various 161 --- 18 37 FTE, LP
401 Estimates as 161+(20*12)Bold Italics = site on Ecology's 1996 site list "---" = no data available or not applicable
40

Impaired Water Bodies
Sediment/Water Relationships and 303(d) Listing A significant effort has been undertaken within Ecology to provide information on statewide sediment contamination and the relationship it has with water quality and potential impairment of freshwater and marine water bodies. Because the SMS Sediment Quality Standards used to determine sediment impact are federally approved water quality standards, violations of them are considered for 303(d) listing in the same manner as violations of water quality standards. The Toxics Cleanup Program determines which water body grids are impaired by sediment quality and provides this information to the Water Quality Program for integration into “Washington State’s Water Quality Assessment [303(d) and 305(b) report]” for submittal to EPA. The following figures illustrate water body grids throughout the state that violate water quality standards based on sediment data that exceed either SMS Sediment Quality Standards or Cleanup Screening Levels.
Figure 19: Bellingham Bay Figure 20: Between Fidalgo Bay to Bellingham Bay
41

Figure 21: Eastern Kitsap County Figure 22: Dyes and Sinclair Inlets
(Eastern Kitsap County)
igure 23: Commencement Bay (Tacoma) Figure 24: Duwamish River (Seattle)
F
42

Figure 25: Elliot Bay (Seattle) Figure 26: Everett Harbor
Figure 24: Duwamish River (Seattle) Figure 28: Fidalgo Bay (Anacortes)
43

Figure 29: Lake Union (Seattle) Figure 30: Gray's Harbor
F(S
igure 31: Lake Washington and Lake lssaquah eattle/Bellevue)
44

Figure 32: Strait of Juan de Fuca Figure 33: Budd Inlet (Olympia)
Figure 34: Asarco (Ruston)
45

Figure 35: South Puget Sound
46