w a a a · rubbish removals: williams town removals are carried out every tuesday by a contractor....
TRANSCRIPT
2012/2013
SHIRE OF WILLIAMS
ANNUAL REPORT
27 September 2013
Shire of Williams Page 1
SHIRE OF WILLIAMS
Authority and Legislation
The Williams Shire Council is a statutory organisation responsible to the Minister for Local Government, the Hon. Tony Simpson, MLA. It operates under the provisions of the Local Government Act 1995 (as amended).
Williams Shire Location Shire Offices and Chambers: Brooking Street, WILLIAMS Postal Address: PO Box 96, WILLIAMS 6391 Telephone: (08) 9885 1005 Facsimile: (08) 9885 1020 Email: [email protected] Website: www.williams.wa.gov.au Office Hours: 8:00am – 5:00pm Monday to Friday
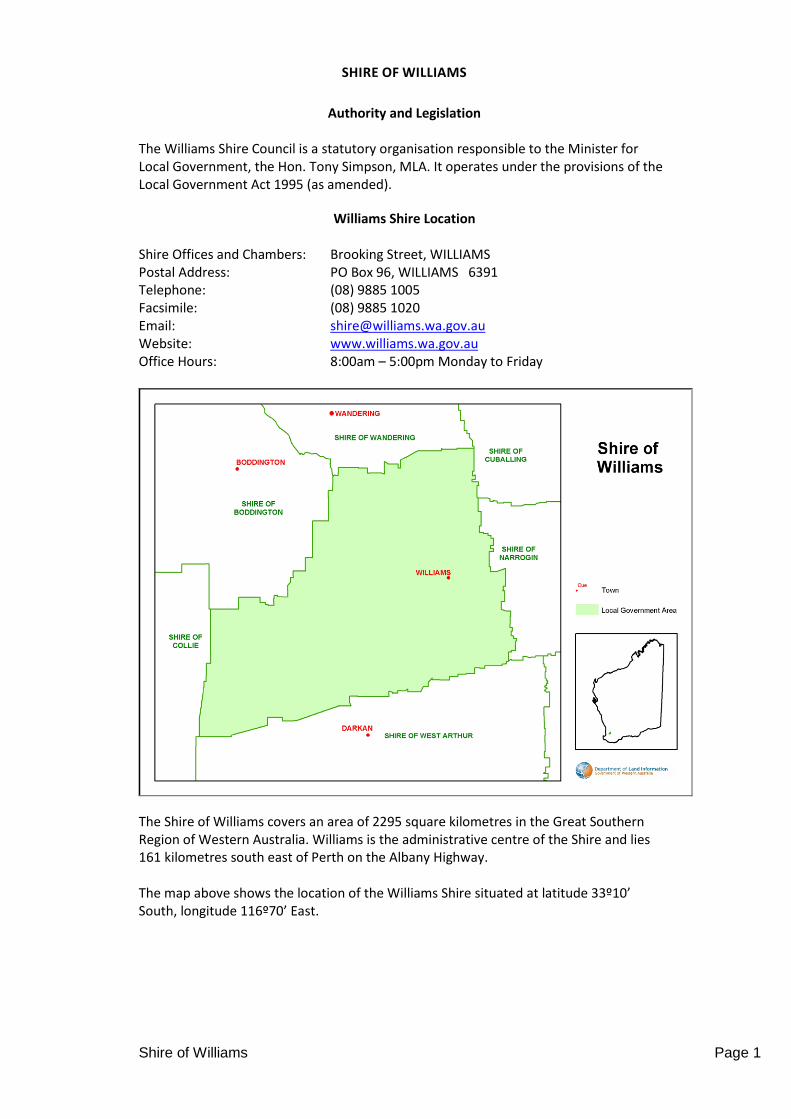
The Shire of Williams covers an area of 2295 square kilometres in the Great Southern Region of Western Australia. Williams is the administrative centre of the Shire and lies 161 kilometres south east of Perth on the Albany Highway. The map above shows the location of the Williams Shire situated at latitude 33º10’ South, longitude 116º70’ East.
Shire of Williams Page 2
Contents
COMMUNITY STRATEGIC PLAN ..................................................... 3 COUNCIL MEMBERS ...................................................................... 4 COUNCIL STAFF ............................................................................. 5 SHIRE STATISTICS & INFORMATION .............................................. 6 MANAGEMENT STRUCTURE ......................................................... 7 COUNCIL FACILITIES ...................................................................... 8 COUNCIL SERVICES ........................................................................ 9 SHIRE PRESIDENT’S REPORT ........................................................ 10 CHIEF EXECUTIVE OFFICER’S REPORT ......................................... 12 STATUTORY REPORTING ............................................................. 17 COMMUNITY PLAN STRATEGIES & OUTCOMES .......................... 20 FINANCIAL REPORT…………………………………………………………………24 INDEPENDENT AUDIT REPORT……………………………….………………..81
Shire of Williams Page 3
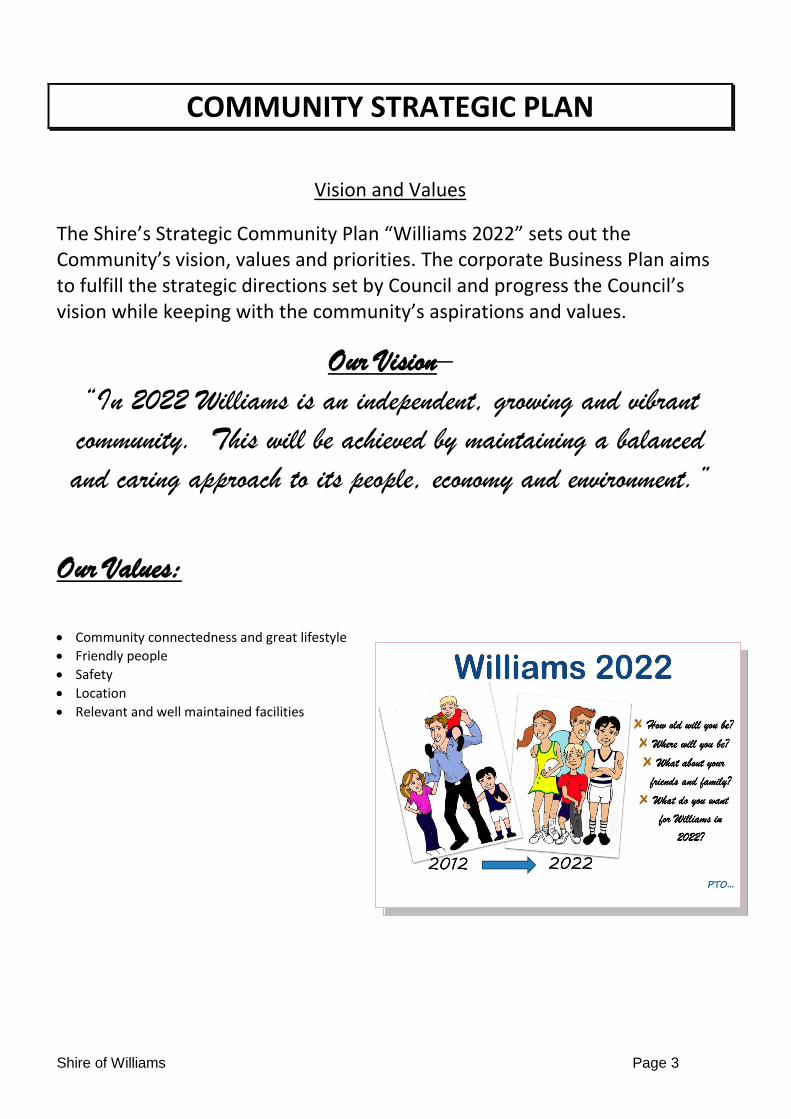
COMMUNITY STRATEGIC PLAN
Vision and Values
The Shire’s Strategic Community Plan “Williams 2022” sets out the Community’s vision, values and priorities. The corporate Business Plan aims to fulfill the strategic directions set by Council and progress the Council’s vision while keeping with the community’s aspirations and values.
Our Vision–
“In 2022 Williams is an independent, growing and vibrant
community. This will be achieved by maintaining a balanced
and caring approach to its people, economy and environment.”
Our Values:
Community connectedness and great lifestyle
Friendly people
Safety
Location
Relevant and well maintained facilities
Shire of Williams Page 4
COUNCIL MEMBERS
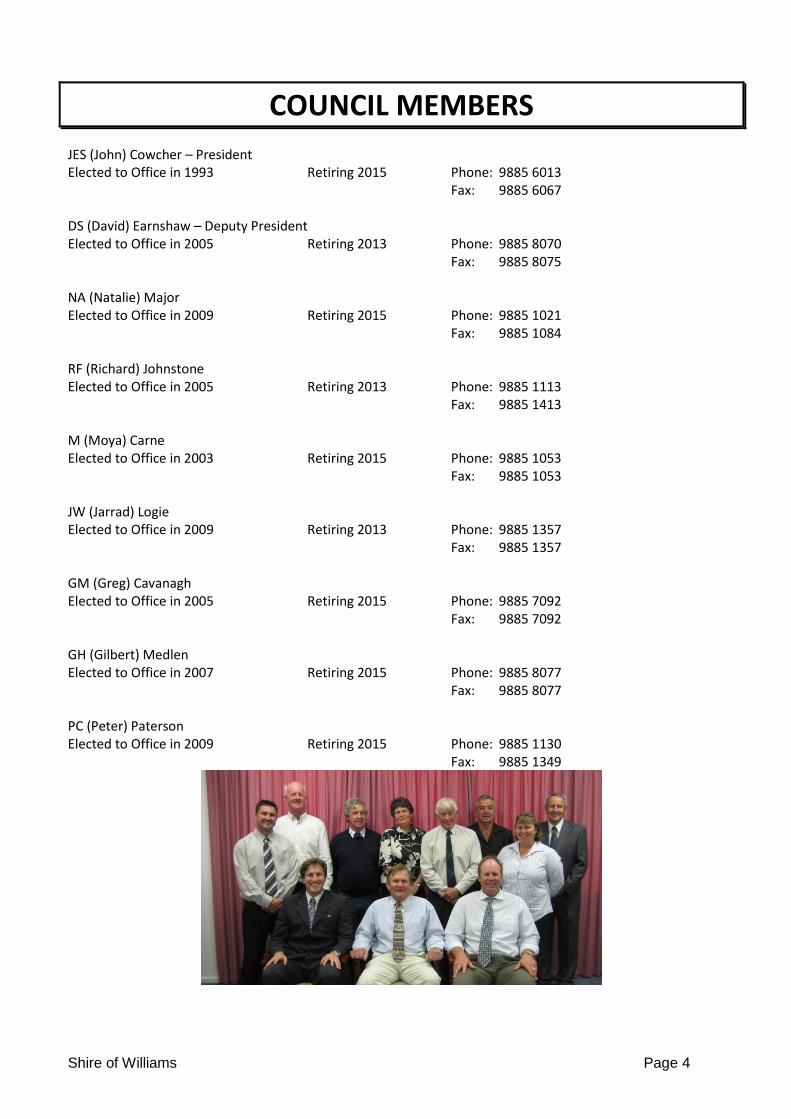
JES (John) Cowcher – President Elected to Office in 1993 Retiring 2015 Phone: 9885 6013 Fax: 9885 6067 DS (David) Earnshaw – Deputy President Elected to Office in 2005 Retiring 2013 Phone: 9885 8070 Fax: 9885 8075 NA (Natalie) Major Elected to Office in 2009 Retiring 2015 Phone: 9885 1021 Fax: 9885 1084 RF (Richard) Johnstone Elected to Office in 2005 Retiring 2013 Phone: 9885 1113 Fax: 9885 1413 M (Moya) Carne Elected to Office in 2003 Retiring 2015 Phone: 9885 1053 Fax: 9885 1053 JW (Jarrad) Logie Elected to Office in 2009 Retiring 2013 Phone: 9885 1357 Fax: 9885 1357 GM (Greg) Cavanagh Elected to Office in 2005 Retiring 2015 Phone: 9885 7092 Fax: 9885 7092 GH (Gilbert) Medlen Elected to Office in 2007 Retiring 2015 Phone: 9885 8077 Fax: 9885 8077 PC (Peter) Paterson Elected to Office in 2009 Retiring 2015 Phone: 9885 1130 Fax: 9885 1349
Shire of Williams Page 5
COUNCIL STAFF
NUMBER OF EMPLOYEES: 23 (FTEs) CHIEF EXECUTIVE OFFICER: RN (Ryan) Duff MANAGER OF FINANCE : CL (Cara) Ryan WORKS SUPERVISOR: AW (Tony) Kett ADMINISTRATION OFFICER: SM (Sharon) Wilkie ADMINISTRATION OFFICER: MC (Manuela) Lenehan ENVIRONMENTAL HEALTH/BUILDING OFFICER: S (Steve) Friend ECONOMIC DEVELOPMENT OFFICER: HJ (Heidi) Cowcher SWIMMING POOL MANAGER: Contracted to Contract Aquatic Services
Shire of Williams Page 6
SHIRE STATISTICS & INFORMATION
Distance from Perth (km) 161 Area (sq km) 2,295 Length sealed roads (km) 166 Length unsealed roads (km) 388 Population 953 Councillors 9 Electors 657 Dwellings 468 Employees (FTE's) 23 Rates (2013) $ 1,343,510 Revenue (2013) $ 4,251,145
History of Shire: The District of Williams was first explored in 1831 by Captain Bannister en route from Perth to King George III Sound (Albany). Williams has been a convenient stopping place for travellers on the same route since the 1850’s. With the tendering of a reliable mail service around 1853, the road was upgraded and Williams became an important stop over point for passengers and changing of horses. It subsequently developed as the District Centre for Local Government, which was granted in 1877. The small town was subject to increasing floods due to the clearing of the land for intensive farming, therefore the town was relocated to the Perth side of the bridge. The town site was surveyed in 1905 and most of the buildings in the present town site were constructed after that time. Williams is still reliant on wool and coarse grains and caters for about 2,500 vehicles per day. The population has stabilised in the district to around 1,000 with about 400 in the town. Economy: The economic activity of the Shire is dominated by agricultural pursuits, including the growing of barley, lupins, peas, canola, wheat, oats, export hay, olives, wine grapes and the rearing of sheep, pigs and cattle. Local industries include grain pellet production, hay processing, holiday farm stays, engineering, retailing and servicing of farm machinery. The average size of agricultural holdings is 800ha and the area of public parks, gardens and play area is 20ha. Climate: The district enjoys a moderate climate characterised by warm dry summers and cool wet winters with average temperatures ranging from a minimum of 3º to a maximum of 25º in winter and a minimum of 20º to a maximum of 35º in summer. The warmest month is January and the average annual rainfall for the Shire of Williams is 550mm.
Shire of Williams Page 7
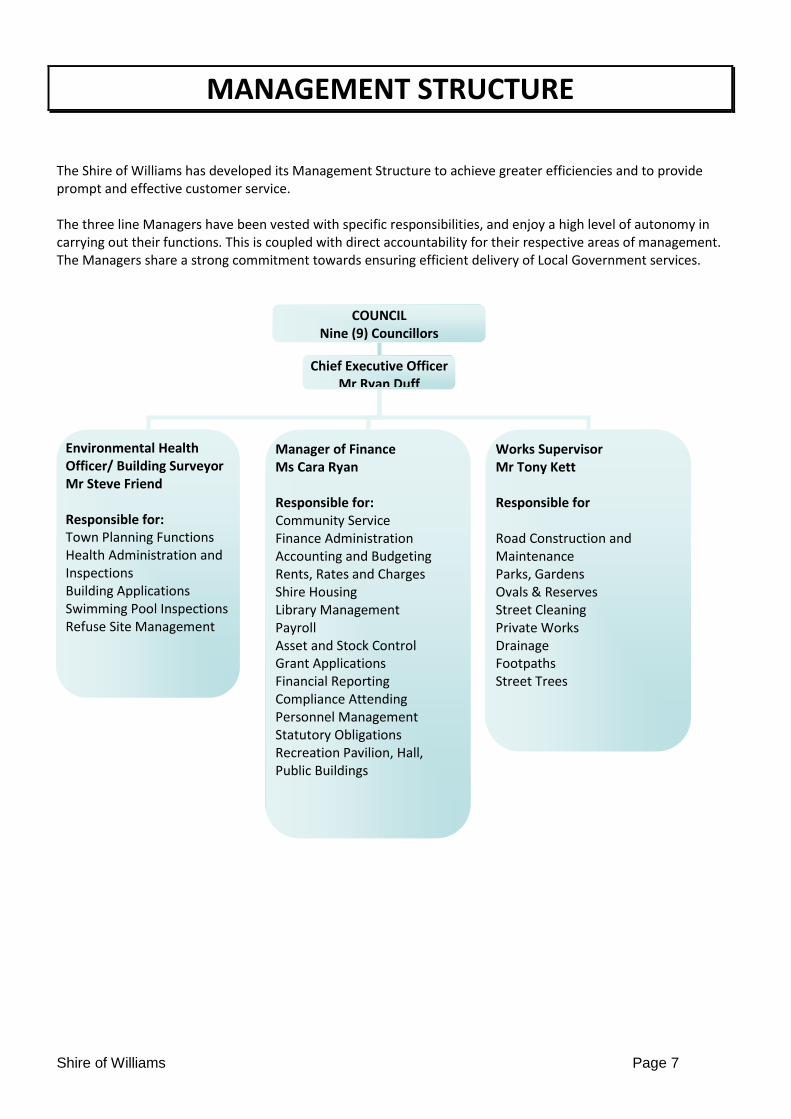
MANAGEMENT STRUCTURE
The Shire of Williams has developed its Management Structure to achieve greater efficiencies and to provide prompt and effective customer service. The three line Managers have been vested with specific responsibilities, and enjoy a high level of autonomy in carrying out their functions. This is coupled with direct accountability for their respective areas of management. The Managers share a strong commitment towards ensuring efficient delivery of Local Government services.
COUNCIL Nine (9) Councillors
Chief Executive Officer
Mr Ryan Duff
Environmental Health Officer/ Building Surveyor Mr Steve Friend Responsible for: Town Planning Functions Health Administration and Inspections Building Applications Swimming Pool Inspections Refuse Site Management
Manager of Finance Ms Cara Ryan
Responsible for: Community Service Finance Administration Accounting and Budgeting Rents, Rates and Charges Shire Housing Library Management Payroll Asset and Stock Control Grant Applications Financial Reporting Compliance Attending Personnel Management Statutory Obligations Recreation Pavilion, Hall, Public Buildings
Works Supervisor Mr Tony Kett Responsible for Road Construction and Maintenance Parks, Gardens Ovals & Reserves Street Cleaning Private Works Drainage Footpaths Street Trees
Shire of Williams Page 8
COUNCIL FACILITIES
Public Library: The Library is open Monday to Friday from 9.00am to 5:00pm. The Library is situated in the Community Resource Centre, Brooking Street, Williams. Books may be returned during office hours. Sports Pavilion:
Situated at the Williams sports ground. Bookings may be made through the Shire Office. This facility accommodates a variety of sports including basketball, tennis, netball, football, hockey, cricket, touch rugby and inter-school sports. The grassed oval is equipped with lighting. The centre also provides a venue for cabarets, discos, weddings, general meetings and a variety of social gatherings. Town Hall and RSL Hall:
Situated on the corner of Brooking Street and Growse Street. Bookings may be made through the Shire Office. Trestles, chairs, cutlery and crockery are available for hire from this facility. The Hall is also used for concerts, theatre and music evenings. Aquatic Centre:
Telephone No. (08) 9885 1096. Situated at the entrance to the Recreation Ground, Pinjarra/ Williams Road. Open for general public use from approximately November to April when the Manager is in attendance. Season and family tickets are available and may be purchased from the Shire Office. Tourist Information Bay:
Situated at the Lions Park near the bridge on Albany Highway. Information on the board includes Shire and town site maps. Aged Persons’ Facilities:
Situated on New Street and Growse Street, Williams. 4 x 1 bedroom units and 6 x 2 bedroom units are available for accredited senior citizens. Single Persons’ Units:
Situated in Growse Street, Williams. Sandalwood Court houses 4 x 2 bedroom units for accredited single persons. Chemical Container Compound:
Situated inside the Refuse Site compound in which approved chemical containers may be deposited when the refuse site is open. All chemical containers must be thoroughly washed and drained before leaving at the compound. Oil Recycling Depot:
Situated near the entrance to the Works Depot compound in which used oil may be placed for collection and recycling. Recycling Depot:
Collection site for aluminium cans, newspapers and glass containers situated near the entrance to the Works Depot and at the Refuse Disposal Site. Additional recycling facilities including Cardboard collections are located at the Refuse site. Refuse Disposal Site:
Situated off Narrogin Williams Road 2.5km east of town.
Shire of Williams Page 9
COUNCIL SERVICES
Private Works: The Shire’s range of modern plant and equipment, operated by trained staff, is available for private works hire. Current hire rates for graders, loaders, trucks, backhoe and other plant are available at the Shire Office. Rubbish Removals:
Williams town removals are carried out every Tuesday by a contractor. Kerbside recycling collections are carried out on the 2nd and 4th Tuesday of each month. Dog Registration:
Dog Registrations become due on 1st November each year. Unsterilised Dog or Bitch 1 year 3 years $30.00 $75.00 Sterilised Dog or Bitch 1 year 3 years $10.00 $18.00 Dog used for tending stock: 25% of ordinary fee. Dog belonging to pensioner: 50% of ordinary fee. Dog Impoundments: Dog owners have an obligation to keep their dogs under control at all times. Dogs wandering at large present a nuisance and a danger to the public. The Shire carries out dog patrols and responds to complaints. The Dog Act provides heavy penalties for owners whose dogs are impounded. Drivers, Motor Vehicle, Boat and Firearm Renewals: Drivers licenses, vehicle licenses, boat licenses and firearm licenses may all be renewed at the Shire Office. Licensing staff are also able to assist with registration of new vehicles, motor vehicle transfers and ordering of personalised number plates. Health and Building Information: The Environmental Health Officer incorporating Health, Building and Town Planning can be contacted at the Shire Office for any matters concerning Health and Building. The Environmental Health Officer is employed in a joint scheme with the Shires of Wagin and West Arthur. Williams’ allocated day is Friday and alternate Wednesdays; however the EHO is available in special circumstances through arrangement with the Chief Executive Officer. Mosquito Control: To assist in controlling mosquitos the following preventative measures should be taken:-
Ensure that all educt vents to plumbing installations are fitted with a mosquito proof cowl.
Remove all rubbish, which may hold water from around the yard eg. old drums, tyres and disused containers.
Ensure that all water tanks have properly fitted lids and treat water with paraffin oil or kerosene in sufficient quantity to provide a film of oil across the surface.
Council staff fogs the Williams Townsite on regular occasions when conditions are right and adult mosquitos are active.
Shire of Williams Page 10
SHIRE PRESIDENT’S REPORT
Shire President Report 2012/13
It is my pleasure, to once again present my report to the community of Williams on some of the activities and achievements of Council over the last twelve months. It has been a busy year, with significant amount of the administration time taken up with the requirements of the new Integrated Planning legislation. The Community Strategic Plan was completed in early 2013 following the engagement of Labyrinth Consultancy to assist with the community consultation. Following on from this Plan has been the commencement of work on the remaining plans, including the Workforce Plan, Asset Management Plan, Long Term Financial Plan and the Corporate Business Plan. The CEO has undertaken much of this work and is appreciated for the extra workload that this created. August 2012 saw the culmination of around 9 months work for our administration team with the official opening of Willi Wag Tails Childcare Centre. Childcare has been bandied around for many years as something that was desperately needed for our community but the logistics of how and where were always difficult to resolve. With St John Ambulance building their own premises in Brooking Street, this resulted in a community building that if renovated was an ideal location. The centre has now been operational for 12 months and has generated an income of around $250,000 and employs 10 local community people. Rhonda Willcocks as Coordinator does an exemplary job and should be commended along with her team of staff for the successes that the Centre has achieved in the first year of operation. The Shire continues to play an active role in the 4WD/Lakes Regional Aged Housing Project. This project involves 7 local governments (Williams, West Arthur, Wagin, Woodanilling, Dumbleyung, Lake Grace and Kent), proposing to construct at least 42 dedicated aged persons units across the 7 shires over the next 5 years. Funding for the project has been secured to date from the Royalties for Regions Country Local Government Fund ($3,074,605) to construct 10 units across the region. January 2013 saw the announcement by the State Government of a further $5,023,646 to the project to construct a further 14 units across the region. Further funding continues to be sought to fund the remaining proposed units. The Shire manages this project on behalf of the 7 local governments involved; including all the reporting required on the expenditure of the funding which is a significant workload on our administration team, but congruently also demonstrates the capacity for smaller local councils to manage significant regional priority projects. Plans continue to take shape for the proposed light industrial area for Williams. The purchase of the land has been approved, and a loan secured to finance the purchase. Council has partnered with Landcorp to undertake the development of the first 6 blocks in the subdivision, and it is hoped that these blocks will be available for sale towards the end of 2013. The Shire has secured Country Local Government Funding to construct rental industrial units on one of the blocks to attract businesses to the industrial area. These units are currently in the design phase. The Shire has also secured funding for the proposed upgrade of the Williams Sport and Recreation precinct, with plans for a refurbishment of the pavilion kitchen, re-sealing and multi-marking for tennis and netball of the 3 bottom tennis courts, lighting of the top 3 tennis courts, re-sealing and multi-marking of the ram shed for netball and basketball and the construction of a new rectangular field (for hockey) between the ram shed and tennis courts. The project is estimated to cost around $625,000 and has been funded through the Country Local Government Fund, Community Sport and additional funding to offset as much of the Shire’s cash contribution as possible. It is hoped that this works on this project will commence on the ground in late 2013. Councillors continue to provide a significant time commitment to their duties to the Shire of Williams, of which the community should be proud. They take the time to commit to so much more than a once a month meeting commitment. Many of the Councillors also represent the Shire on local and regional committees and attend
Shire of Williams Page 11
these meetings as part of their commitment to serving the community. I thank them for their efforts and extend my appreciation to their service to our community, which is often above and beyond. Our team is a strong team and one that works hard to serve the community to the best of their ability. On a rather sad note, during the year, we have experienced an unfortunate incident during mop up of a fire in Quindanning where a volunteer tragically lost his life due to a freak accident. Council extended their condolences to the family and friends and has endeavoured to provide support through the investigation phase. Unfortunately, out of tragedy almost always comes a review of policies, procedures and practices and the Shire of Williams has not been immune to this following this incident. Council has had to invest significant funds in the past year to the legal costs associated with this incident which has still not been completed as we wait for a Coroner's report. It is likely that Council may have continued costs needing to be committed to this investigation. The Shire is actively promoting the registration of all volunteers who may participate in bush fire mitigation during the fire season with their local bush fire brigade to ensure that they have filled in a registration form available from your Brigade Captain or the Shire Office. This is a once off commitment and will register you to actively participate in fire fighting across the district - for which we are very appreciative as without volunteers we could not protect our community. Help us to protect you! As in previous years, the last twelve months has seen the Works Crew busy once again. The Works Crew have been involved with widening a 4km stretch of the York-Williams Road, the sealing of a 4.2km section of the Quindanning-Darkan Road and gravel sheeting and widening of a 5km section of the Tarwonga-Dardadine Road. The Shire purchased a new second-hand front end loader during 2012/13. With a tight budget, Council has had to delay significant capital purchases, including replacing some of the plant. It is hoped that these purchases are not postponed too much longer as it has always been Council’s policy to endeavour to keep the plant and machinery as up to date as financially possible. The works crew has seen the resignation of Kevin Burman and Aaron Gouldon, and the employment of Stuart Cowcher over the past twelve months. In addition, the works crew has been augmented at peak times with a number of casuals, including Lauren Stewart and Lindsay Wood. The cleaning and management of all the Shire facilities is capably undertaken by Starr Gillett. On behalf of Council, I would like to extend our appreciation to the entire works crew. Administration staff are a credit to themselves and our community. The small administration team provide an outstanding level of service to our community, and this rivals many larger Councils. Ryan Duff as CEO, leads a strong, dedicated team of Ian Ball as Deputy CEO until his retirement in April 2013, Sharon Wilkie as Senior Administration Officer, Manuela Lenehan as Administration Officer, Heidi Cowcher as Community Development Officer and Steve Friend as Environmental Health/Building Officer. April 2013 saw the retirement of the Deputy CEO, Ian Ball. Ian has worked for the Shire of Williams since 2000 coming to Williams from Narembeen. His entire working life was in local government, some 30+ years. Council farewelled Ian and his wife Louise at a function following his retirement. We wish him well and lots of success on the bowling green. The position of Deputy CEO was changed to a Manager of Finance, and this saw the employment of Cara Ryan to the position in May 2013. We are very fortunate to have her as part of our administration team as she has proved to be very efficient at her job as well as fitting in very well in the office with excellent people and customer service skills. On behalf of Council, I extend our appreciation to them and thank them for providing our community with excellent customer service, second to none.
Cr John Cowcher Shire President
Shire of Williams Page 12
CHIEF EXECUTIVE OFFICER’S REPORT It is with great pleasure that I present the Chief Executive Officer’s report to the ratepayers of the Shire of Williams for the year ended 30th June 2013.
Financial Sustainability
The Shire has a reasonable financial position given our low debt and low reliance on external operating grants to provide quality services to our ratepayers. In 2012/13 the Shire has experienced some fiscal tightening due to the outstanding storm damage claims from the June 2012 storm event. It is expected that the Shire will receive reimbursement for the clean-up of the storm damage but until the claim has been paid the Shire continue to carry this financial burden. The Workcrew continue to provide private works to external sources in an effort to increase Shire revenue and ensure future rate increases remain at reasonable levels. In 2012/2013 extensive private works were done on the new Landcorp subdivision. The focus of the Administration has been the new mandatory integrated planning and reporting framework for Western Australian Local Government which has been introduced by the WA State Government with the reforms to be introduced by 30 June 2013. This has taken substantial resources from within the office and to date the Community Strategic Plan has been finalised and substantial progress has been made towards the completion of the remaining planning documents with the adoption of these plans to be done by Council early in the new financial year. At a glance • The operating budget for 2012/13 was $3 million (including depreciation). • Staff costs for 23 permanent and casual employees were $1.34 million. • Rates and charges comprised $1.9 million of total income received (49 percent). • Council’s grant funding for the year was $1.91 million. • Operating surplus of almost $524k was down from $705k last year. • A $1.71 million capital works program was delivered. • Cash and investments totalled $1.04 million. • Council borrowing remained at low levels of $298,000 at the end of the year.
Shire of Williams Page 13
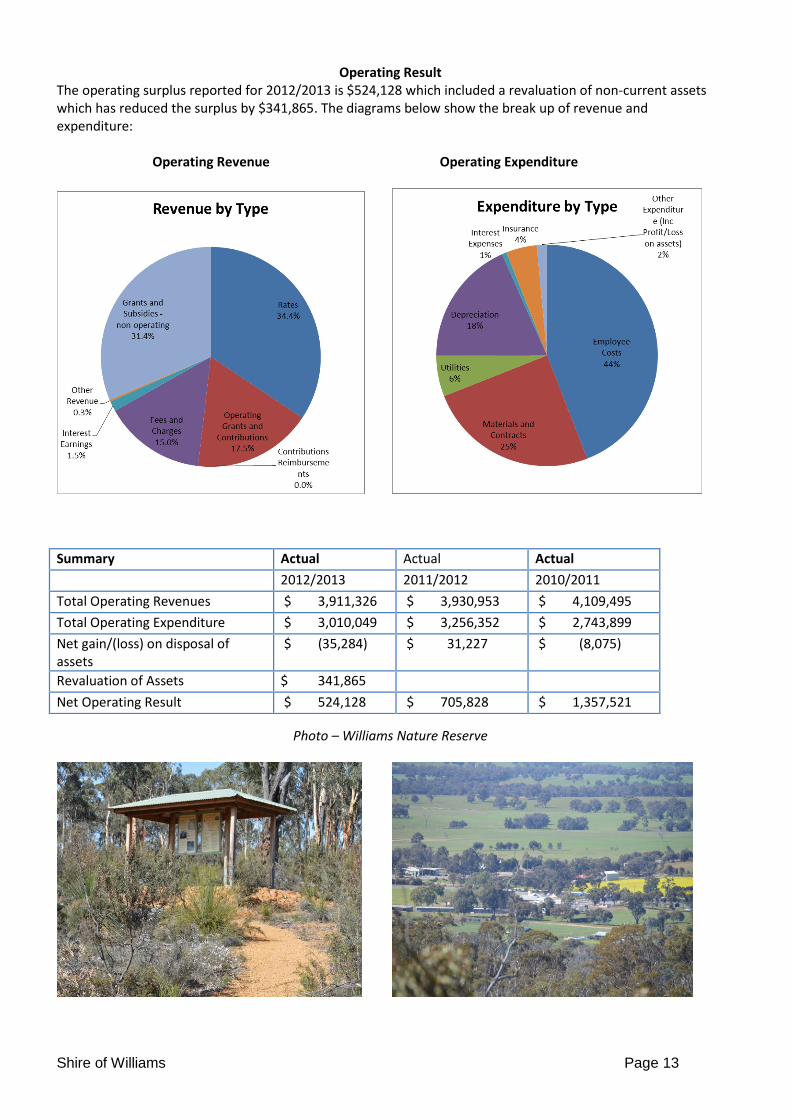
Operating Result The operating surplus reported for 2012/2013 is $524,128 which included a revaluation of non-current assets which has reduced the surplus by $341,865. The diagrams below show the break up of revenue and expenditure:
Operating Revenue Operating Expenditure
Photo – Williams Nature Reserve
Summary Actual Actual Actual
2012/2013 2011/2012 2010/2011
Total Operating Revenues $ 3,911,326 $ 3,930,953 $ 4,109,495
Total Operating Expenditure $ 3,010,049 $ 3,256,352 $ 2,743,899
Net gain/(loss) on disposal of assets
$ (35,284) $ 31,227 $ (8,075)
Revaluation of Assets $ 341,865
Net Operating Result $ 524,128 $ 705,828 $ 1,357,521

Shire of Williams Page 14
Cash and Reserves Council had cash holdings of $1.041 million as at the 30th June 2013.
Rates Council adopted a 4% general rate increase in 2012/13. This resulted in a total rate collection of $1,343,510 compared to $1,279,135 the previous year. The average rate increase since 2000 has been 3.26% which is slightly below the average CPI increase for the same period.
Shire of Williams Page 15
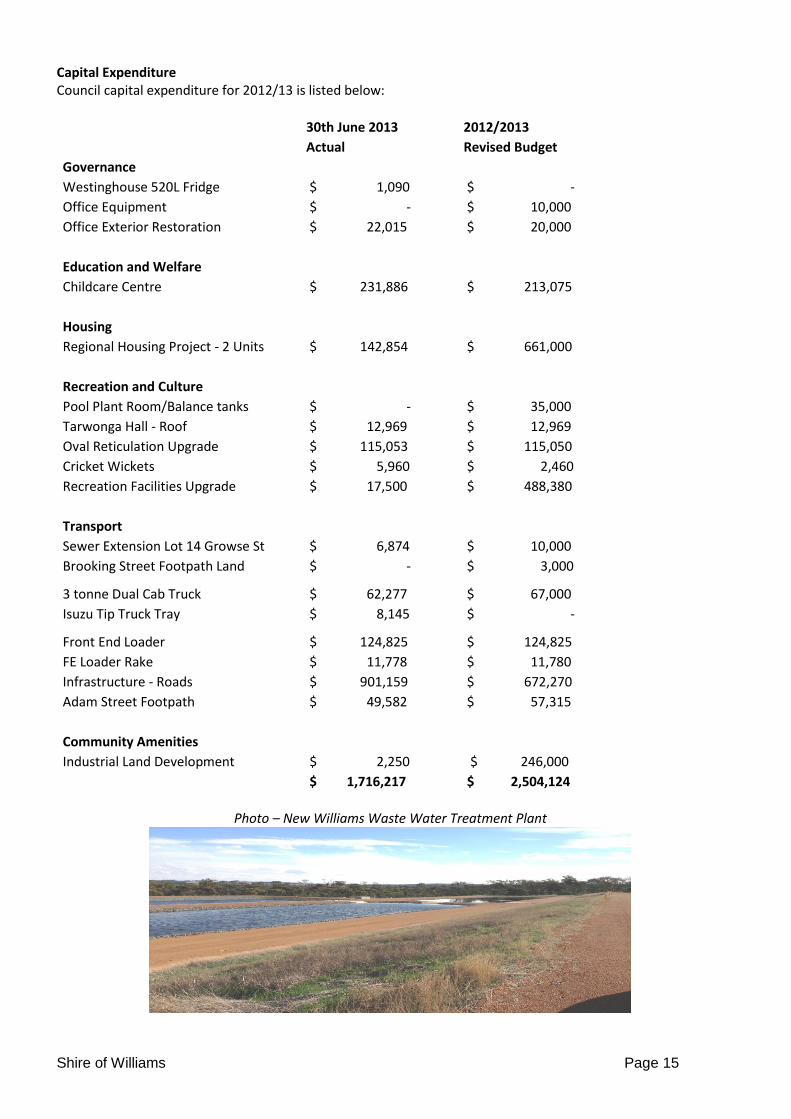
Capital Expenditure Council capital expenditure for 2012/13 is listed below: 30th June 2013 2012/2013 Actual Revised Budget
Governance
Westinghouse 520L Fridge $ 1,090 $ -
Office Equipment $ - $ 10,000
Office Exterior Restoration $ 22,015 $ 20,000
Education and Welfare
Childcare Centre $ 231,886 $ 213,075
Housing
Regional Housing Project - 2 Units $ 142,854 $ 661,000
Recreation and Culture
Pool Plant Room/Balance tanks $ - $ 35,000
Tarwonga Hall - Roof $ 12,969 $ 12,969
Oval Reticulation Upgrade $ 115,053 $ 115,050
Cricket Wickets $ 5,960 $ 2,460
Recreation Facilities Upgrade $ 17,500 $ 488,380
Transport
Sewer Extension Lot 14 Growse St $ 6,874 $ 10,000
Brooking Street Footpath Land $ - $ 3,000
3 tonne Dual Cab Truck $ 62,277 $ 67,000
Isuzu Tip Truck Tray $ 8,145 $ -
Front End Loader $ 124,825 $ 124,825
FE Loader Rake $ 11,778 $ 11,780
Infrastructure - Roads $ 901,159 $ 672,270
Adam Street Footpath $ 49,582 $ 57,315
Community Amenities
Industrial Land Development $ 2,250 $ 246,000 $ 1,716,217 $ 2,504,124
Photo – New Williams Waste Water Treatment Plant
Shire of Williams Page 16
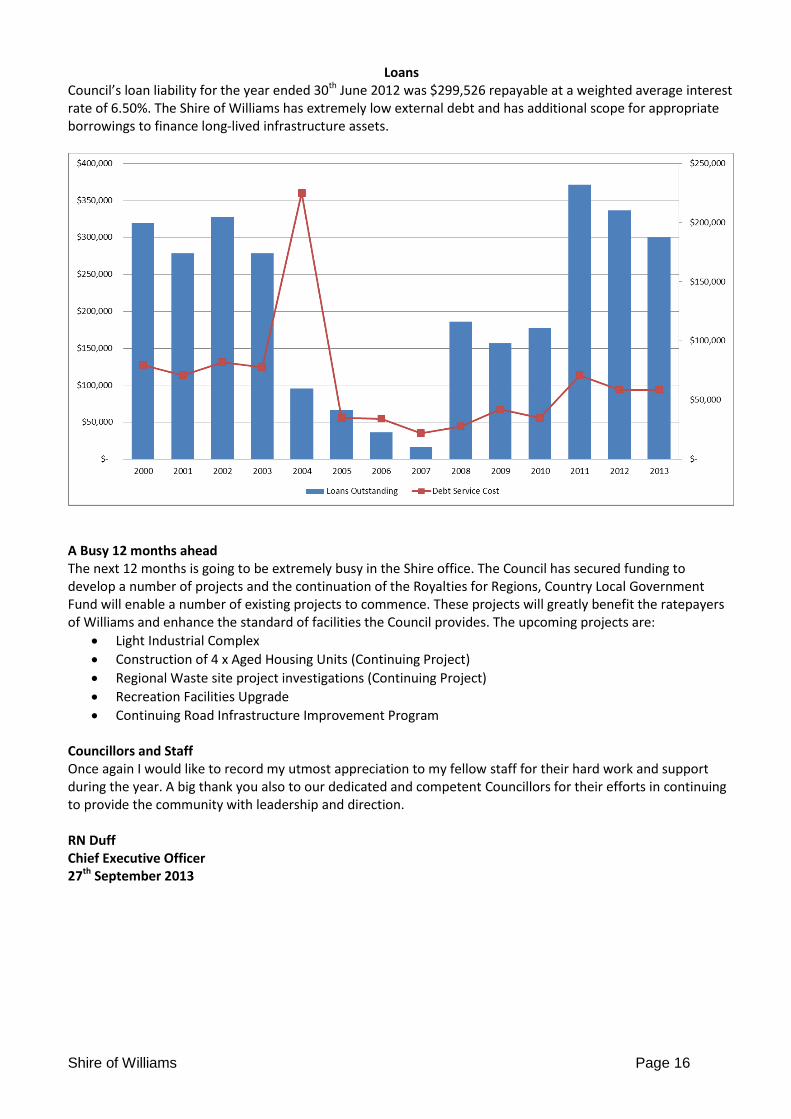
Loans Council’s loan liability for the year ended 30th June 2012 was $299,526 repayable at a weighted average interest rate of 6.50%. The Shire of Williams has extremely low external debt and has additional scope for appropriate borrowings to finance long-lived infrastructure assets.
A Busy 12 months ahead The next 12 months is going to be extremely busy in the Shire office. The Council has secured funding to develop a number of projects and the continuation of the Royalties for Regions, Country Local Government Fund will enable a number of existing projects to commence. These projects will greatly benefit the ratepayers of Williams and enhance the standard of facilities the Council provides. The upcoming projects are:
Light Industrial Complex
Construction of 4 x Aged Housing Units (Continuing Project)
Regional Waste site project investigations (Continuing Project)
Recreation Facilities Upgrade
Continuing Road Infrastructure Improvement Program Councillors and Staff Once again I would like to record my utmost appreciation to my fellow staff for their hard work and support during the year. A big thank you also to our dedicated and competent Councillors for their efforts in continuing to provide the community with leadership and direction. RN Duff Chief Executive Officer 27th September 2013
Shire of Williams Page 17
STATUTORY REPORTING
Report on disability access and inclusion plan
Access and Inclusion Plan The Shire of Williams is committed to ensuring that the community is accessible for and inclusive of people with disabilities, their families and careers. The Shire of Williams interprets an accessible and inclusive community as one in which all council functions, facilities and services (both in-house and contracted) are open, available and accessible to people with disabilities, providing them with the same opportunities, rights and responsibilities as other people in the community. The Shire of Williams believes that people with disabilities, their families and careers who live in country areas should be supported to remain in the community of their choice. The Shire of Williams is committed to consulting with people with disabilities, their families and careers and where required disability organisations to ensure that barriers to access are addresses appropriately. The Shire of Williams is committed to achieving the following outcomes: Outcome 1 Existing functions, facilities and services are adopted to meet the needs of people with disabilities.
Council will endeavour to be adaptable in responding to the barriers experienced by people with various disabilities, including people with physical, sensory, cognitive and psychiatric disabilities.
Council will ensure that all policies and practices that govern the operation of council facilities, functions and services are consistent with Council’s policy on access.
Outcome 2 Access to building and facilities is improved.
Council will undertake to incorporate the priorities regarding access for people with disabilities, identified during public consultation, into its capital works program where practical. Further modifications will be made as funds are made available.
Council with undertake to liaise with developers to increase their awareness of the access requirements of people with disabilities.
Outcome 3 Information about functions, facilities and services is provided in formats, functions which meet the communication requirements of people with disabilities.
Council will produce all of its information on Council facilities, functions and services using clear, concise language.
Council will advise the community that, subject to demand, information about functions, facilities and services can be made available in alternative formats, such as large print, electronically, audio and email.
Outcome 4 Staff awareness of the needs of people with disabilities and skills in delivering advice and services are improved.
Shire of Williams Page 18
Council will undertake to ensure that all staff are aware of the key access needs of residents with disabilities and people who visit the local government area in relation to the provision of all services.
Where required, council will seek expert advice from the relevant disability service organisations on how to meet the access needs of people with disabilities.
Outcome 5 Opportunities for people with disabilities to participate in public consultations, grievance mechanisms and decision making processes are provided.
Council will ensure that information is available in clear, concise language on how residents can participate in decision making processes, public consultations and grievance mechanisms.
Council will advise the community that the information can be made in alternative formats on request.
Council will also undertake to support people with disabilities to attend meetings of Council. Equal Opportunity
The Shire of Williams is committed to providing a workplace where every individual is treated with respect in an environment free from discrimination and harassment. During 2012-13 the Shire reviewed its obligations under the Western Australian Equal Opportunity Act 1984. In addition, the Shire’s processes for resolving EEO grievances and complaints were reviewed.
National Competition Policy The Competition Principles Agreement (CPA) is a contractual agreement between Federal Government and all States and Territory Governments. The CPA aims to ensure that all public enterprises operate in a transparent manner in the best interests of the public. Under the CPA, public enterprises are required to review their operations to ensure that they have no competitive advantage or disadvantages as a result of their public status.
Competitive Neutrality (under the CPA) During the financial year the Shire met its obligations under the National Competition Policy, competitive neutrality addresses potential advantages and disadvantages that public enterprises may have compared to businesses operating within the private sector. Local Government is only required to implement these principles to the extent that the benefits to be realised from implementation far outweigh the costs in respect of individual activities exceeding $500,000 in income. The Shire of Williams did not have any major undertakings reportable under CPA in the 2012/13 Financial Year. Complaints of Minor Breaches
In accordance with Sections 5.53(2) and 5.121 of the Local Government Act 1995, the Annual Report is required to disclose the number of complaints of minor breaches received each year. 2011 -12 No. of complaints 2012-13 Outcome Action taken Nil.
Shire of Williams Page 19
Report on record keeping plan As required under the State Records Act 2000 Council adopted a Record Keeping Plan in February 2004. Principle 6 requires Council to ensure that employees comply with the Record Keeping Plan. The following activities have been undertaken to ensure staff awareness and compliance:
1. Presentations of the record keeping program to staff on a regular basis 2. In house and external training has been conducted for staff 3. Staff information sessions have been held as required. 4. No induction programs were required as there was no staff turnover.
A new Record Keeping Plan was adopted and approved in February 2011.
Employees Remuneration The Local Government (Administration) Regulation 19B requires the annual report to contain details of the number of employees of the local government entitled to an annual salary of $100,000 or more in bands of $10,000 for each such band over $100,000.
Salary Range 2012 2013 $100,000 - $110,000 1 1 RN Duff Chief Executive Officer 27 September 2013

Shire of Williams Page 20
COMMUNITY PLAN STRATEGIES & OUTCOMES
Objective: To support industry and business development success towards 2022.
Strategy Ref
Proposed Strategy Proposed Outcome
ED 1.1 Develop the industrial estate to offer affordable and appropriately serviced allotments.
Affordable and serviced industrial blocks available incrementally over the next ten years.
ED 1.2
Market Williams as an attractive place to do business for new investment and encourage existing businesses to invest in improving their businesses for the future sustainability of our town.
New investment in the town and existing business investing in their own improvement and future.
ED 1.3
Alleviate any shortcomings the building of the by-pass may bring to our businesses by developing and investing in a playground attraction that encourages travellers to pull off the Albany Highway and visit our town.
Numbers of visitors increase and using businesses in the town during their stay.
ED 1.4 Establish a Chamber of Commerce that creates a network of support for business in the town. The Chamber can meet with the Shire on a regular basis.
Businesses supporting each other developing innovative business solutions.
ED 1.5 Develop and promote tourism in Williams to ensure ongoing visitors to our town.
Number of visitors increase. Business turnover improves.
ED 1.6 Develop a strategy as a community to encourage employees (short and long term) to work and stay in Williams.
Larger labour pool for work.
Objective: To have appropriate levels of housing to attract people to stay and or work in Williams
ED 2.1
Offer land for residential development at a reasonable cost and consider the development of housing for professionals and trades people needed to service Williams.
Land is affordable for development, plans for or completed project housing for visiting professionals or trades people.
ED 2.2 Plan and deliver relevant aged housing for our ageing population (linked to SCD 1.1).
Our aged community is staying in Williams and are satisfied with the outcome.
ED 2.3 Seek out investors to develop accommodation for young people and casual workers to encourage them to stay and work in our town. (Linked to ED 1.5).
Investors purchasing land and accommodation units built.
ED 2.4 Encourage the use of sustainable practices in housing development.
New builds are in a sustainable style and construction.
Objective: To ensure people who choose to spend their senior years in our community are supported in a caring and productive manner
Strategy Ref
Proposed Strategy Proposed Outcome
SCD 1.1
Ensure development of aged housing plans take into consideration the numbers of people wanting to personally invest and ensure that they are planned and constructed with the needs of these people in mind. (Linked with ED 2.2).
Relevant planning and construction of aged housing.
SCD 1.2 Oversee the support service needs of our aging community to ensure that these services are appropriate. Act where these are under threat.
Seniors feel supported and their wellbeing needs are understood.
Shire of Williams Page 21
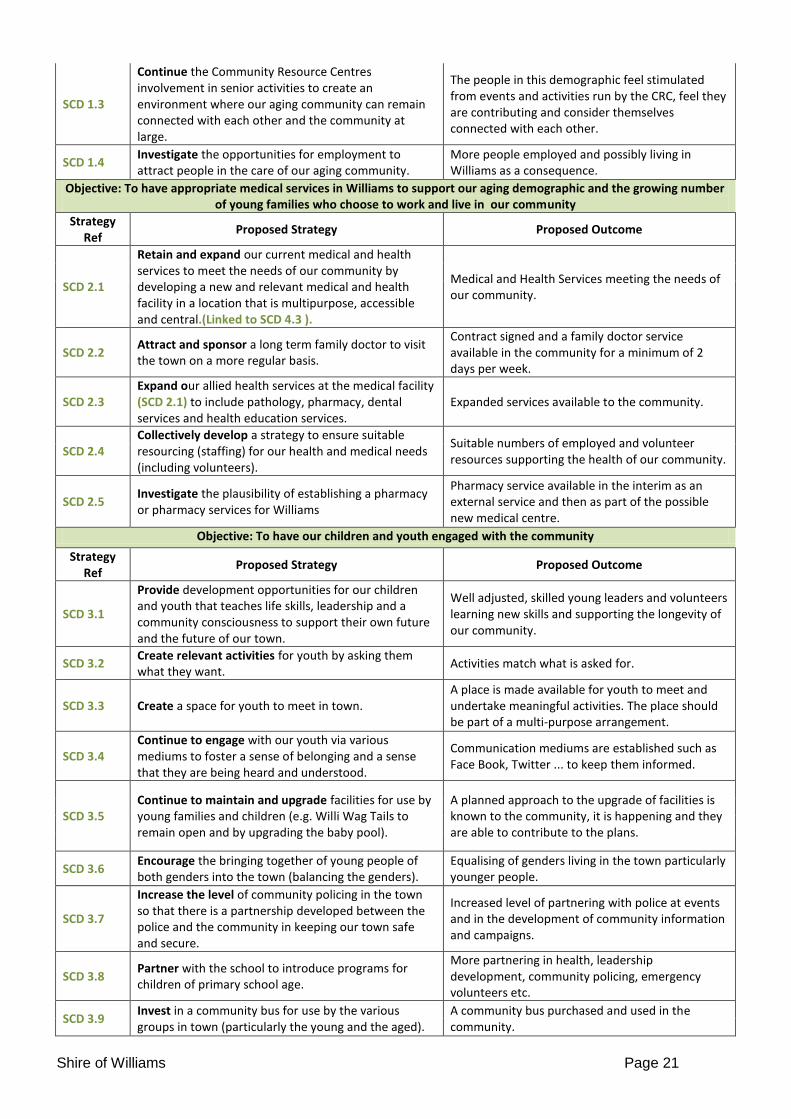
SCD 1.3
Continue the Community Resource Centres involvement in senior activities to create an environment where our aging community can remain connected with each other and the community at large.
The people in this demographic feel stimulated from events and activities run by the CRC, feel they are contributing and consider themselves connected with each other.
SCD 1.4 Investigate the opportunities for employment to attract people in the care of our aging community.
More people employed and possibly living in Williams as a consequence.
Objective: To have appropriate medical services in Williams to support our aging demographic and the growing number of young families who choose to work and live in our community
Strategy Ref
Proposed Strategy Proposed Outcome
SCD 2.1
Retain and expand our current medical and health services to meet the needs of our community by developing a new and relevant medical and health facility in a location that is multipurpose, accessible and central.(Linked to SCD 4.3 ).
Medical and Health Services meeting the needs of our community.
SCD 2.2 Attract and sponsor a long term family doctor to visit the town on a more regular basis.
Contract signed and a family doctor service available in the community for a minimum of 2 days per week.
SCD 2.3 Expand our allied health services at the medical facility (SCD 2.1) to include pathology, pharmacy, dental services and health education services.
Expanded services available to the community.
SCD 2.4 Collectively develop a strategy to ensure suitable resourcing (staffing) for our health and medical needs (including volunteers).
Suitable numbers of employed and volunteer resources supporting the health of our community.
SCD 2.5 Investigate the plausibility of establishing a pharmacy or pharmacy services for Williams
Pharmacy service available in the interim as an external service and then as part of the possible new medical centre.
Objective: To have our children and youth engaged with the community
Strategy Ref
Proposed Strategy Proposed Outcome
SCD 3.1
Provide development opportunities for our children and youth that teaches life skills, leadership and a community consciousness to support their own future and the future of our town.
Well adjusted, skilled young leaders and volunteers learning new skills and supporting the longevity of our community.
SCD 3.2 Create relevant activities for youth by asking them what they want.
Activities match what is asked for.
SCD 3.3 Create a space for youth to meet in town. A place is made available for youth to meet and undertake meaningful activities. The place should be part of a multi-purpose arrangement.
SCD 3.4 Continue to engage with our youth via various mediums to foster a sense of belonging and a sense that they are being heard and understood.
Communication mediums are established such as Face Book, Twitter ... to keep them informed.
SCD 3.5 Continue to maintain and upgrade facilities for use by young families and children (e.g. Willi Wag Tails to remain open and by upgrading the baby pool).
A planned approach to the upgrade of facilities is known to the community, it is happening and they are able to contribute to the plans.
SCD 3.6 Encourage the bringing together of young people of both genders into the town (balancing the genders).
Equalising of genders living in the town particularly younger people.
SCD 3.7
Increase the level of community policing in the town so that there is a partnership developed between the police and the community in keeping our town safe and secure.
Increased level of partnering with police at events and in the development of community information and campaigns.
SCD 3.8 Partner with the school to introduce programs for children of primary school age.
More partnering in health, leadership development, community policing, emergency volunteers etc.
SCD 3.9 Invest in a community bus for use by the various groups in town (particularly the young and the aged).
A community bus purchased and used in the community.
Shire of Williams Page 22
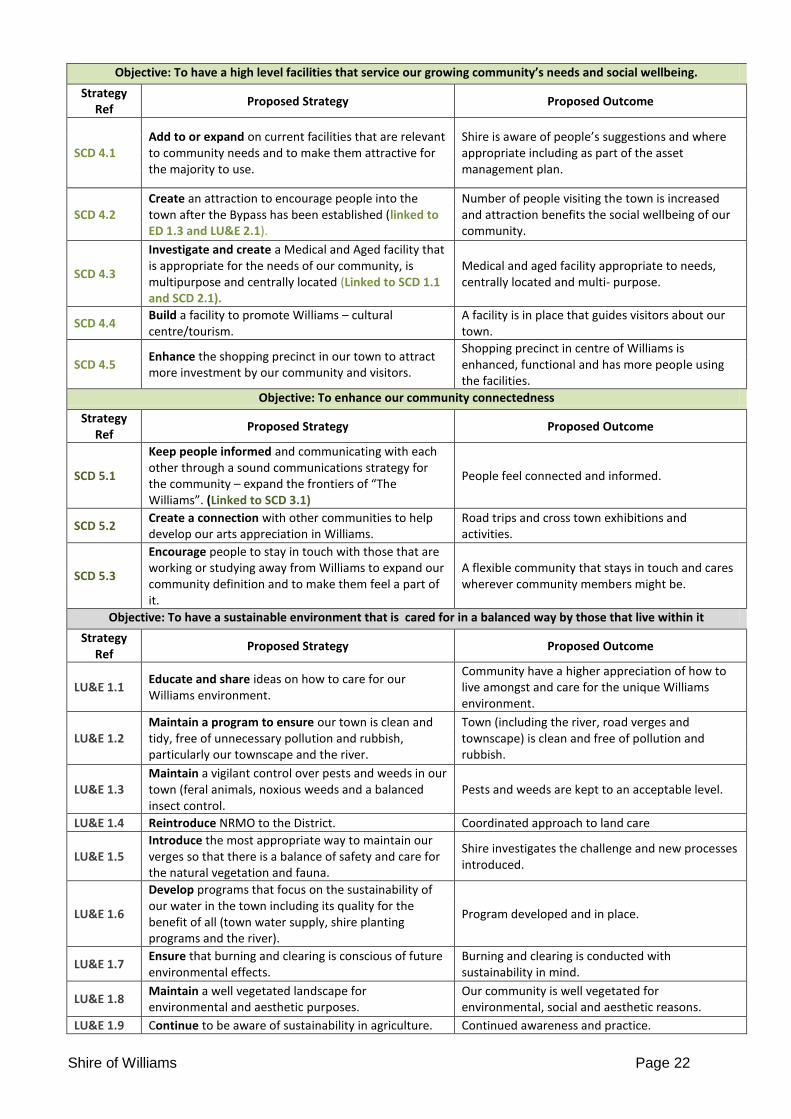
Objective: To have a high level facilities that service our growing community’s needs and social wellbeing.
Strategy Ref
Proposed Strategy Proposed Outcome
SCD 4.1 Add to or expand on current facilities that are relevant to community needs and to make them attractive for the majority to use.
Shire is aware of people’s suggestions and where appropriate including as part of the asset management plan.
SCD 4.2 Create an attraction to encourage people into the town after the Bypass has been established (linked to ED 1.3 and LU&E 2.1).
Number of people visiting the town is increased and attraction benefits the social wellbeing of our community.
SCD 4.3
Investigate and create a Medical and Aged facility that is appropriate for the needs of our community, is multipurpose and centrally located (Linked to SCD 1.1 and SCD 2.1).
Medical and aged facility appropriate to needs, centrally located and multi- purpose.
SCD 4.4 Build a facility to promote Williams – cultural centre/tourism.
A facility is in place that guides visitors about our town.
SCD 4.5 Enhance the shopping precinct in our town to attract more investment by our community and visitors.
Shopping precinct in centre of Williams is enhanced, functional and has more people using the facilities.
Objective: To enhance our community connectedness
Strategy Ref
Proposed Strategy Proposed Outcome
SCD 5.1
Keep people informed and communicating with each other through a sound communications strategy for the community – expand the frontiers of “The Williams”. (Linked to SCD 3.1)
People feel connected and informed.
SCD 5.2 Create a connection with other communities to help develop our arts appreciation in Williams.
Road trips and cross town exhibitions and activities.
SCD 5.3
Encourage people to stay in touch with those that are working or studying away from Williams to expand our community definition and to make them feel a part of it.
A flexible community that stays in touch and cares wherever community members might be.
Objective: To have a sustainable environment that is cared for in a balanced way by those that live within it
Strategy Ref
Proposed Strategy Proposed Outcome
LU&E 1.1 Educate and share ideas on how to care for our Williams environment.
Community have a higher appreciation of how to live amongst and care for the unique Williams environment.
LU&E 1.2 Maintain a program to ensure our town is clean and tidy, free of unnecessary pollution and rubbish, particularly our townscape and the river.
Town (including the river, road verges and townscape) is clean and free of pollution and rubbish.
LU&E 1.3 Maintain a vigilant control over pests and weeds in our town (feral animals, noxious weeds and a balanced insect control.
Pests and weeds are kept to an acceptable level.
LU&E 1.4 Reintroduce NRMO to the District. Coordinated approach to land care
LU&E 1.5 Introduce the most appropriate way to maintain our verges so that there is a balance of safety and care for the natural vegetation and fauna.
Shire investigates the challenge and new processes introduced.
LU&E 1.6
Develop programs that focus on the sustainability of our water in the town including its quality for the benefit of all (town water supply, shire planting programs and the river).
Program developed and in place.
LU&E 1.7 Ensure that burning and clearing is conscious of future environmental effects.
Burning and clearing is conducted with sustainability in mind.
LU&E 1.8 Maintain a well vegetated landscape for environmental and aesthetic purposes.
Our community is well vegetated for environmental, social and aesthetic reasons.
LU&E 1.9 Continue to be aware of sustainability in agriculture. Continued awareness and practice.

Shire of Williams Page 23
Objective: To have safe and well maintained roads that support our economy and our wellbeing
Strategy Ref
Proposed Strategy Proposed Outcome
LU&E 2.1
Keep people informed on the progress of the By Pass construction and facilitate a project with the shire, community and Main Roads in partnership to establish an attraction that compensates and value adds to the Lion Park having to be moved. (Linked to ED 1.3 and SCD 4.2).
People are informed and know what to expect and can contribute to the construction of a new attraction to encourage people to visit our town once the By-Pass is in place.
LU&E 2.2
Construct and maintain our local roads to ensure their safety and lobby Main Roads in partnership with other Albany Highway communities to upgrade the Albany Highway to be either dual carriageway or to have more over taking lanes.
Our roads both locally and regionally are safe.
LU&E 2.3 Continue to audit and maintain roads throughout the whole of the shire to ensure they are maintained in a skilled manner with quality resources.
Safe and well maintained roads throughout the whole of the Shire.
LU&E 2.4 Maintain verges conscious of a balanced safety, flora and fauna approach.(Linked to LU&E 1.5)
Verges maintained well.
LU&E 2.5 Update research on the safety aspects of the Albany Highway to assist in lobbying for dual carriageways or more passing lane s (Linked to LU&E 2.2).
Those lobbying have up to date knowledge.
LU&E 2.6 Improve footpaths in the town. Footpaths are safe and accessible.
LU&E 2.7 Develop and maintain cycle and walker friendly roads. Cyclists and walkers feel safe – no incidents.
Objective: To have visionary leadership within our elected members and to have continued quality service delivery from our Shire staff.
Strategy Ref
Proposed Strategy Proposed Outcome
OP 1.1 Monitor feedback from community on service delivery.
Feedback received and analysed for the purpose of quality improvement.
OP 1.2 Keep the community engaged on subjects or decisions that directly impact.
Community engagement follows policy and community members are actively involved.
OP 1.3 Have a communication plan that works for the majority.
Community and Shire have an infrastructure that works in a timely way.
OP 1.4 Retain and develop skilled staff. Well skilled and knowledgeable staff happy in their jobs.
Objective: To ultimately not be amalgamated
Strategy Ref
Proposed Strategy Proposed Outcome
OP 2.1 Continue to keep updated on the amalgamation subject, keep community informed and do whatever we can to avoid it.
Council, shire administration and community informed and actively working towards remaining independent.
OP 2..2 Have a contingency plan if we do amalgamate. Contingency plan in place.
SHIRE OF WILLIAMS
FINANCIAL REPORT
FOR THE YEAR ENDED 30TH JUNE 2013
TABLE OF CONTENTS
Statement by Chief Executive Officer 25
Statement of Comprehensive Income by Nature or Type 26
Statement of Comprehensive Income by Program 27
Statement of Financial Position 28
Statement of Changes in Equity 29
Statement of Cash Flows 30
Rate Setting Statement 31
Notes to and Forming Part of the Financial Report 32 to 79
Supplementary Ratio Information 80
Independent Audit Report 81
Shire of Williams Page 24
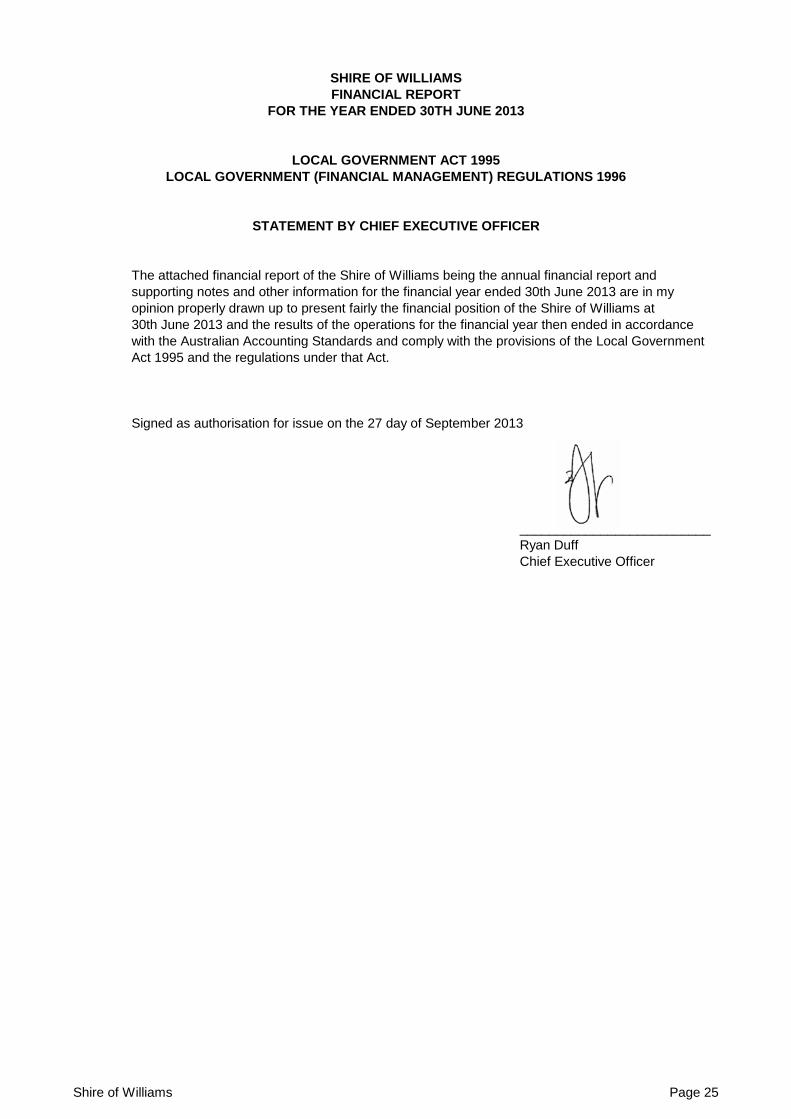
SHIRE OF WILLIAMS
FINANCIAL REPORT
FOR THE YEAR ENDED 30TH JUNE 2013
LOCAL GOVERNMENT ACT 1995
LOCAL GOVERNMENT (FINANCIAL MANAGEMENT) REGULATIONS 1996
STATEMENT BY CHIEF EXECUTIVE OFFICER
The attached financial report of the Shire of Williams being the annual financial report and
supporting notes and other information for the financial year ended 30th June 2013 are in my
opinion properly drawn up to present fairly the financial position of the Shire of Williams at
30th June 2013 and the results of the operations for the financial year then ended in accordance
with the Australian Accounting Standards and comply with the provisions of the Local Government
Act 1995 and the regulations under that Act.
Signed as authorisation for issue on the 27 day of September 2013
__________________________
Ryan Duff
Chief Executive Officer
Shire of Williams Page 25
SHIRE OF WILLIAMS
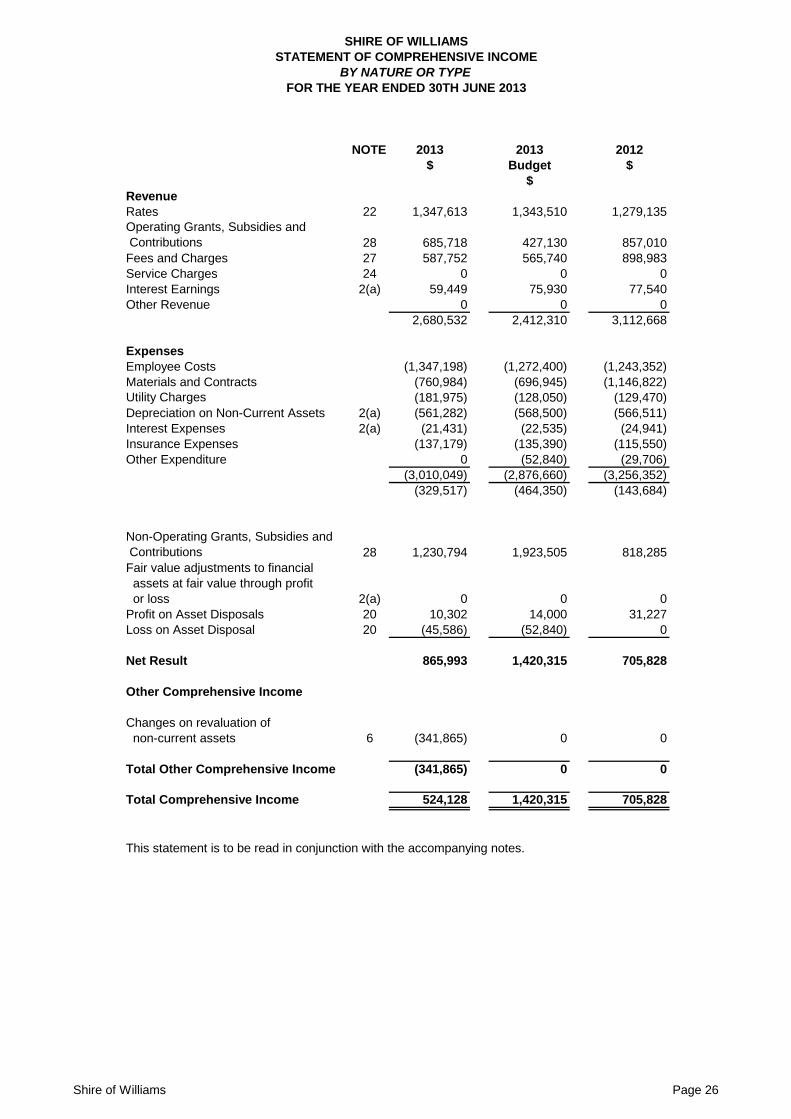
STATEMENT OF COMPREHENSIVE INCOME
BY NATURE OR TYPE
FOR THE YEAR ENDED 30TH JUNE 2013
NOTE 2013 2013 2012
$ Budget $
$
Revenue
Rates 22 1,347,613 1,343,510 1,279,135
Operating Grants, Subsidies and
Contributions 28 685,718 427,130 857,010
Fees and Charges 27 587,752 565,740 898,983
Service Charges 24 0 0 0
Interest Earnings 2(a) 59,449 75,930 77,540
Other Revenue 0 0 0
2,680,532 2,412,310 3,112,668
Expenses
Employee Costs (1,347,198) (1,272,400) (1,243,352)
Materials and Contracts (760,984) (696,945) (1,146,822)
Utility Charges (181,975) (128,050) (129,470)
Depreciation on Non-Current Assets 2(a) (561,282) (568,500) (566,511)
Interest Expenses 2(a) (21,431) (22,535) (24,941)
Insurance Expenses (137,179) (135,390) (115,550)
Other Expenditure 0 (52,840) (29,706)
(3,010,049) (2,876,660) (3,256,352)
(329,517) (464,350) (143,684)
Non-Operating Grants, Subsidies and
Contributions 28 1,230,794 1,923,505 818,285
Fair value adjustments to financial
assets at fair value through profit
or loss 2(a) 0 0 0
Profit on Asset Disposals 20 10,302 14,000 31,227
Loss on Asset Disposal 20 (45,586) (52,840) 0
Net Result 865,993 1,420,315 705,828
Other Comprehensive Income
Changes on revaluation of
non-current assets 6 (341,865) 0 0
Total Other Comprehensive Income (341,865) 0 0
Total Comprehensive Income 524,128 1,420,315 705,828
This statement is to be read in conjunction with the accompanying notes.
Shire of Williams Page 26
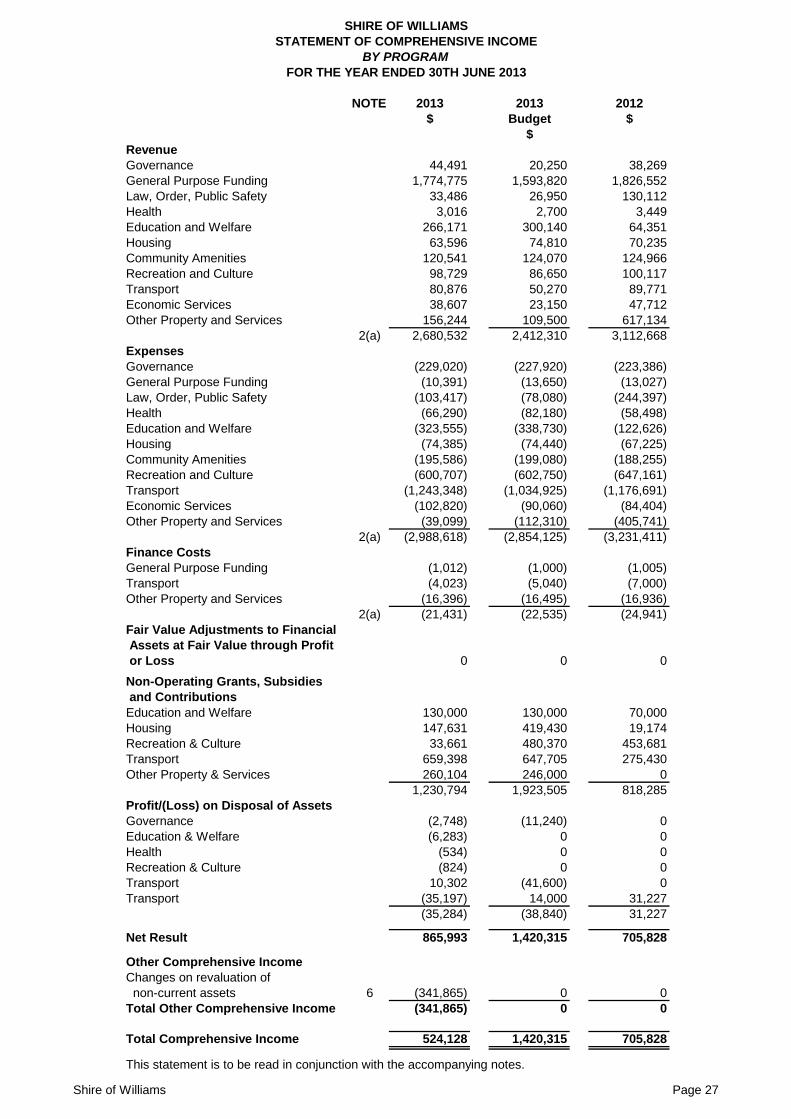
SHIRE OF WILLIAMS
STATEMENT OF COMPREHENSIVE INCOME
BY PROGRAM
FOR THE YEAR ENDED 30TH JUNE 2013
NOTE 2013 2013 2012
$ Budget $
$
Revenue
Governance 44,491 20,250 38,269
General Purpose Funding 1,774,775 1,593,820 1,826,552
Law, Order, Public Safety 33,486 26,950 130,112
Health 3,016 2,700 3,449
Education and Welfare 266,171 300,140 64,351
Housing 63,596 74,810 70,235
Community Amenities 120,541 124,070 124,966
Recreation and Culture 98,729 86,650 100,117
Transport 80,876 50,270 89,771
Economic Services 38,607 23,150 47,712
Other Property and Services 156,244 109,500 617,134
2(a) 2,680,532 2,412,310 3,112,668
Expenses
Governance (229,020) (227,920) (223,386)
General Purpose Funding (10,391) (13,650) (13,027)
Law, Order, Public Safety (103,417) (78,080) (244,397)
Health (66,290) (82,180) (58,498)
Education and Welfare (323,555) (338,730) (122,626)
Housing (74,385) (74,440) (67,225)
Community Amenities (195,586) (199,080) (188,255)
Recreation and Culture (600,707) (602,750) (647,161)
Transport (1,243,348) (1,034,925) (1,176,691)
Economic Services (102,820) (90,060) (84,404)
Other Property and Services (39,099) (112,310) (405,741)
2(a) (2,988,618) (2,854,125) (3,231,411)
Finance Costs
General Purpose Funding (1,012) (1,000) (1,005)
Transport (4,023) (5,040) (7,000)
Other Property and Services (16,396) (16,495) (16,936)
2(a) (21,431) (22,535) (24,941)
Fair Value Adjustments to Financial
Assets at Fair Value through Profit
or Loss 0 0 0
Non-Operating Grants, Subsidies
and Contributions
Education and Welfare 130,000 130,000 70,000
Housing 147,631 419,430 19,174
Recreation & Culture 33,661 480,370 453,681
Transport 659,398 647,705 275,430
Other Property & Services 260,104 246,000 0
1,230,794 1,923,505 818,285
Profit/(Loss) on Disposal of Assets
Governance (2,748) (11,240) 0
Education & Welfare (6,283) 0 0
Health (534) 0 0
Recreation & Culture (824) 0 0
Transport 10,302 (41,600) 0
Transport (35,197) 14,000 31,227
(35,284) (38,840) 31,227
Net Result 865,993 1,420,315 705,828
Other Comprehensive Income
Changes on revaluation of
non-current assets 6 (341,865) 0 0
Total Other Comprehensive Income (341,865) 0 0
Total Comprehensive Income 524,128 1,420,315 705,828
This statement is to be read in conjunction with the accompanying notes.
Shire of Williams Page 27
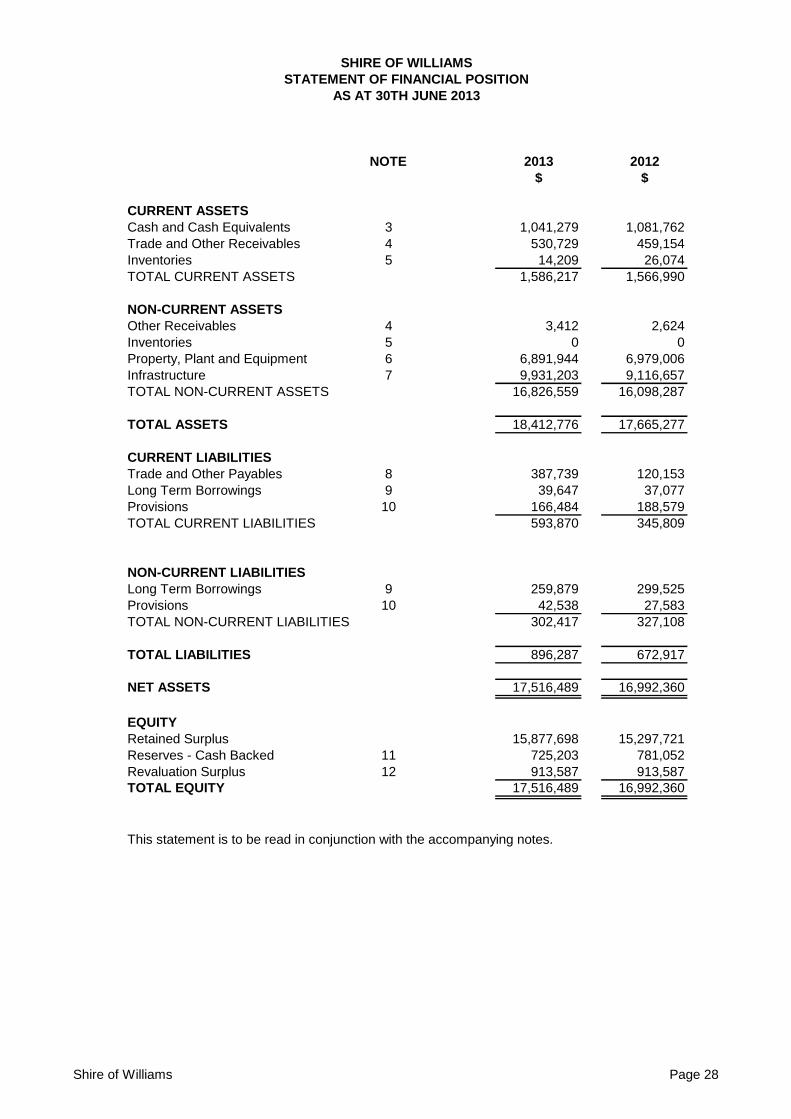
SHIRE OF WILLIAMS
STATEMENT OF FINANCIAL POSITION
AS AT 30TH JUNE 2013
NOTE 2013 2012
$ $
CURRENT ASSETS
Cash and Cash Equivalents 3 1,041,279 1,081,762
Trade and Other Receivables 4 530,729 459,154
Inventories 5 14,209 26,074
TOTAL CURRENT ASSETS 1,586,217 1,566,990
NON-CURRENT ASSETS
Other Receivables 4 3,412 2,624
Inventories 5 0 0
Property, Plant and Equipment 6 6,891,944 6,979,006
Infrastructure 7 9,931,203 9,116,657
TOTAL NON-CURRENT ASSETS 16,826,559 16,098,287
TOTAL ASSETS 18,412,776 17,665,277
CURRENT LIABILITIES
Trade and Other Payables 8 387,739 120,153
Long Term Borrowings 9 39,647 37,077
Provisions 10 166,484 188,579
TOTAL CURRENT LIABILITIES 593,870 345,809
NON-CURRENT LIABILITIES
Long Term Borrowings 9 259,879 299,525
Provisions 10 42,538 27,583
TOTAL NON-CURRENT LIABILITIES 302,417 327,108
TOTAL LIABILITIES 896,287 672,917
NET ASSETS 17,516,489 16,992,360
EQUITY
Retained Surplus 15,877,698 15,297,721
Reserves - Cash Backed 11 725,203 781,052
Revaluation Surplus 12 913,587 913,587
TOTAL EQUITY 17,516,489 16,992,360
This statement is to be read in conjunction with the accompanying notes.
Shire of Williams Page 28
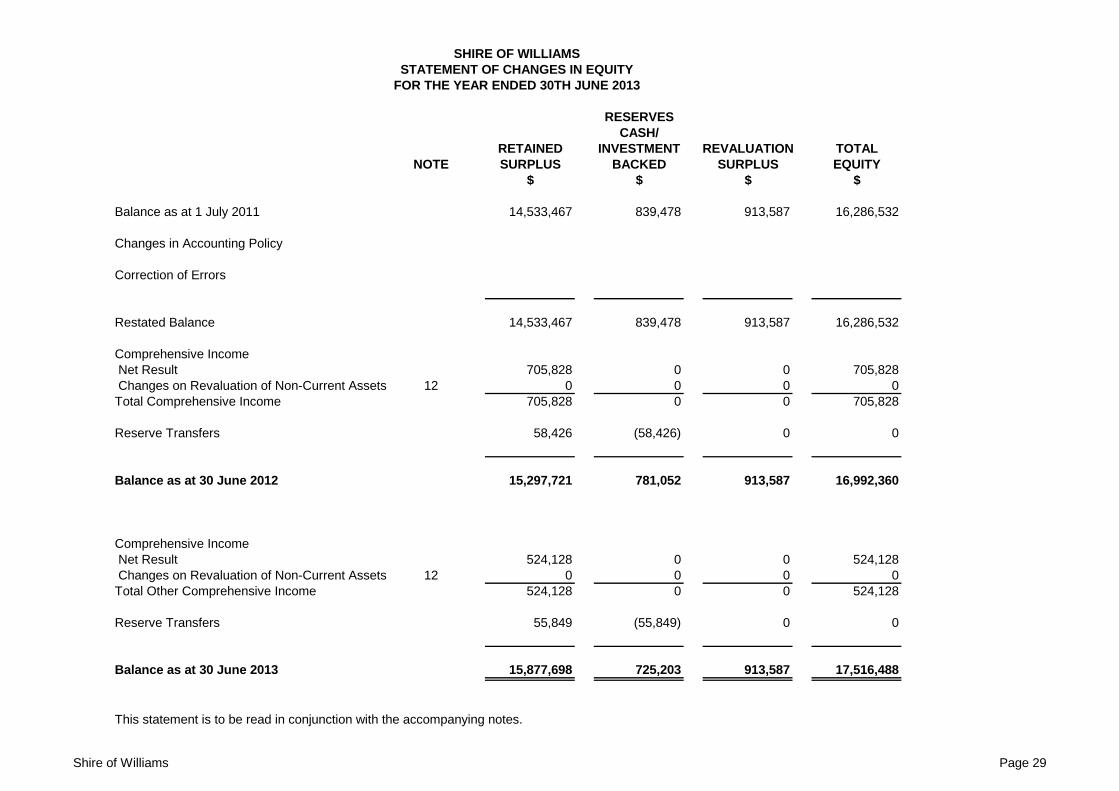
SHIRE OF WILLIAMS
STATEMENT OF CHANGES IN EQUITY
FOR THE YEAR ENDED 30TH JUNE 2013
RESERVES
CASH/
RETAINED INVESTMENT REVALUATION TOTAL
NOTE SURPLUS BACKED SURPLUS EQUITY
$ $ $ $
Balance as at 1 July 2011 14,533,467 839,478 913,587 16,286,532
Changes in Accounting Policy
Correction of Errors
Restated Balance 14,533,467 839,478 913,587 16,286,532
Comprehensive Income
Net Result 705,828 0 0 705,828
Changes on Revaluation of Non-Current Assets 12 0 0 0 0
Total Comprehensive Income 705,828 0 0 705,828
Reserve Transfers 58,426 (58,426) 0 0
Balance as at 30 June 2012 15,297,721 781,052 913,587 16,992,360
Comprehensive Income
Net Result 524,128 0 0 524,128
Changes on Revaluation of Non-Current Assets 12 0 0 0 0
Total Other Comprehensive Income 524,128 0 0 524,128
Reserve Transfers 55,849 (55,849) 0 0
Balance as at 30 June 2013 15,877,698 725,203 913,587 17,516,488
This statement is to be read in conjunction with the accompanying notes.
Shire of Williams Page 29
SHIRE OF WILLIAMS
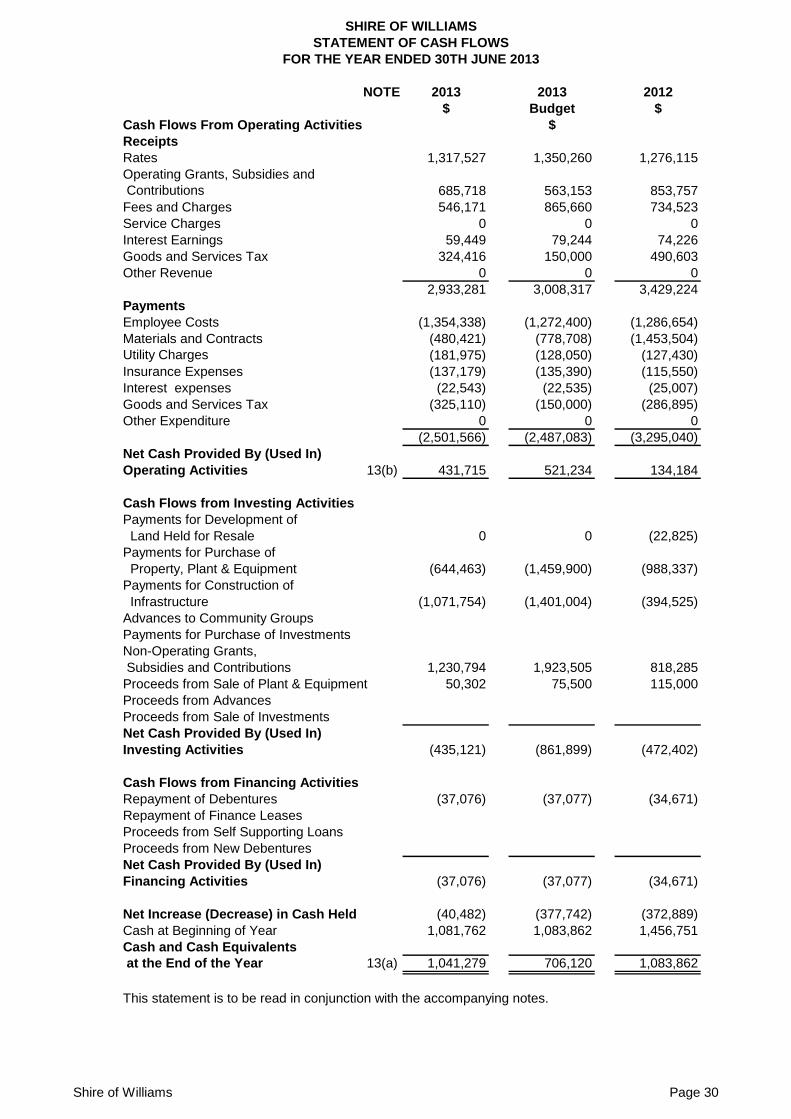
STATEMENT OF CASH FLOWS
FOR THE YEAR ENDED 30TH JUNE 2013
NOTE 2013 2013 2012
$ Budget $
Cash Flows From Operating Activities $
Receipts
Rates 1,317,527 1,350,260 1,276,115
Operating Grants, Subsidies and
Contributions 685,718 563,153 853,757
Fees and Charges 546,171 865,660 734,523
Service Charges 0 0 0
Interest Earnings 59,449 79,244 74,226
Goods and Services Tax 324,416 150,000 490,603
Other Revenue 0 0 0
2,933,281 3,008,317 3,429,224
Payments
Employee Costs (1,354,338) (1,272,400) (1,286,654)
Materials and Contracts (480,421) (778,708) (1,453,504)
Utility Charges (181,975) (128,050) (127,430)
Insurance Expenses (137,179) (135,390) (115,550)
Interest expenses (22,543) (22,535) (25,007)
Goods and Services Tax (325,110) (150,000) (286,895)
Other Expenditure 0 0 0
(2,501,566) (2,487,083) (3,295,040)
Net Cash Provided By (Used In)
Operating Activities 13(b) 431,715 521,234 134,184
Cash Flows from Investing Activities
Payments for Development of
Land Held for Resale 0 0 (22,825)
Payments for Purchase of
Property, Plant & Equipment (644,463) (1,459,900) (988,337)
Payments for Construction of
Infrastructure (1,071,754) (1,401,004) (394,525)
Advances to Community Groups
Payments for Purchase of Investments
Non-Operating Grants,
Subsidies and Contributions 1,230,794 1,923,505 818,285
Proceeds from Sale of Plant & Equipment 50,302 75,500 115,000
Proceeds from Advances
Proceeds from Sale of Investments
Net Cash Provided By (Used In)
Investing Activities (435,121) (861,899) (472,402)
Cash Flows from Financing Activities
Repayment of Debentures (37,076) (37,077) (34,671)
Repayment of Finance Leases
Proceeds from Self Supporting Loans
Proceeds from New Debentures
Net Cash Provided By (Used In)
Financing Activities (37,076) (37,077) (34,671)
Net Increase (Decrease) in Cash Held (40,482) (377,742) (372,889)
Cash at Beginning of Year 1,081,762 1,083,862 1,456,751
Cash and Cash Equivalents
at the End of the Year 13(a) 1,041,279 706,120 1,083,862
This statement is to be read in conjunction with the accompanying notes.
Shire of Williams Page 30
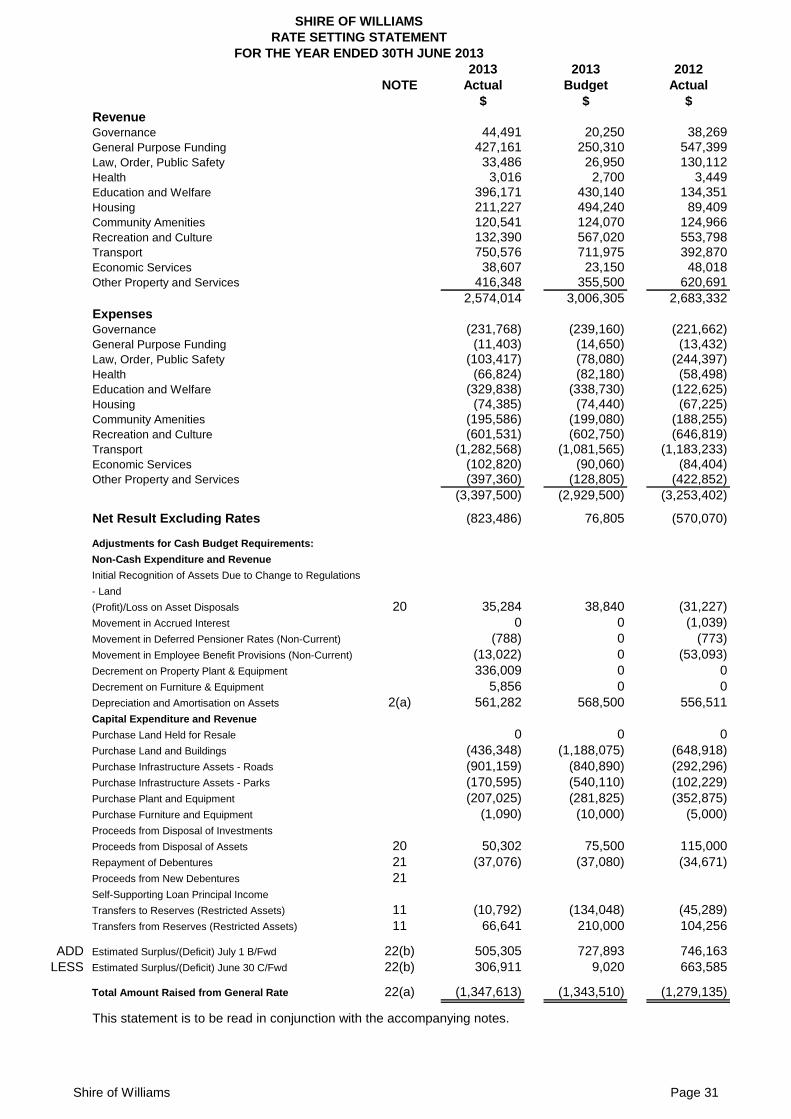
SHIRE OF WILLIAMS
RATE SETTING STATEMENT
FOR THE YEAR ENDED 30TH JUNE 2013
2013 2013 2012
NOTE Actual Budget Actual
$ $ $
RevenueGovernance 44,491 20,250 38,269General Purpose Funding 427,161 250,310 547,399Law, Order, Public Safety 33,486 26,950 130,112Health 3,016 2,700 3,449Education and Welfare 396,171 430,140 134,351Housing 211,227 494,240 89,409Community Amenities 120,541 124,070 124,966Recreation and Culture 132,390 567,020 553,798Transport 750,576 711,975 392,870Economic Services 38,607 23,150 48,018Other Property and Services 416,348 355,500 620,691
2,574,014 3,006,305 2,683,332
ExpensesGovernance (231,768) (239,160) (221,662)General Purpose Funding (11,403) (14,650) (13,432)Law, Order, Public Safety (103,417) (78,080) (244,397)Health (66,824) (82,180) (58,498)Education and Welfare (329,838) (338,730) (122,625)Housing (74,385) (74,440) (67,225)Community Amenities (195,586) (199,080) (188,255)Recreation and Culture (601,531) (602,750) (646,819)Transport (1,282,568) (1,081,565) (1,183,233)Economic Services (102,820) (90,060) (84,404)Other Property and Services (397,360) (128,805) (422,852)
(3,397,500) (2,929,500) (3,253,402)
Net Result Excluding Rates (823,486) 76,805 (570,070)
Adjustments for Cash Budget Requirements:
Non-Cash Expenditure and Revenue
Initial Recognition of Assets Due to Change to Regulations
- Land
(Profit)/Loss on Asset Disposals 20 35,284 38,840 (31,227)
Movement in Accrued Interest 0 0 (1,039)
Movement in Deferred Pensioner Rates (Non-Current) (788) 0 (773)
Movement in Employee Benefit Provisions (Non-Current) (13,022) 0 (53,093)
Decrement on Property Plant & Equipment 336,009 0 0
Decrement on Furniture & Equipment 5,856 0 0
Depreciation and Amortisation on Assets 2(a) 561,282 568,500 556,511
Capital Expenditure and Revenue
Purchase Land Held for Resale 0 0 0
Purchase Land and Buildings (436,348) (1,188,075) (648,918)
Purchase Infrastructure Assets - Roads (901,159) (840,890) (292,296)
Purchase Infrastructure Assets - Parks (170,595) (540,110) (102,229)
Purchase Plant and Equipment (207,025) (281,825) (352,875)
Purchase Furniture and Equipment (1,090) (10,000) (5,000)
Proceeds from Disposal of Investments
Proceeds from Disposal of Assets 20 50,302 75,500 115,000
Repayment of Debentures 21 (37,076) (37,080) (34,671)
Proceeds from New Debentures 21
Self-Supporting Loan Principal Income
Transfers to Reserves (Restricted Assets) 11 (10,792) (134,048) (45,289)
Transfers from Reserves (Restricted Assets) 11 66,641 210,000 104,256
ADD Estimated Surplus/(Deficit) July 1 B/Fwd 22(b) 505,305 727,893 746,163
LESS Estimated Surplus/(Deficit) June 30 C/Fwd 22(b) 306,911 9,020 663,585
Total Amount Raised from General Rate 22(a) (1,347,613) (1,343,510) (1,279,135)
This statement is to be read in conjunction with the accompanying notes.
Shire of Williams Page 31
SHIRE OF WILLIAMS
NOTES TO AND FORMING PART OF THE FINANCIAL REPORT
FOR THE YEAR ENDED 30TH JUNE 2013
1. SIGNIFICANT ACCOUNTING POLICIES
The significant accounting policies which have been adopted in the preparation of this financial
report are presented below and have been consistently applied unless stated otherwise.
(a) Basis of Preparation
Except for cash flow and rate setting information, the report has also been prepared on the accrual basis and is
based on historical costs, modified, where applicable, by the measurement at fair value of the selected
non-current assets, financial assets and liabilities.
Critical Accounting Estimates
(b) The Local Government Reporting Entity
All Funds through which the Council controls resources to carry on its functions have been
included in the financial statements forming part of this financial report.
In the process of reporting on the local government as a single unit, all transactions and balances
between those funds (for example, loans and transfers between Funds) have been eliminated.
All monies held in the Trust Fund are excluded from the financial statements, but a separate
statement of those monies appears at Note 19 to these financial statements.
(c) Goods and Services Tax (GST)
Revenues, expenses and assets are recognised net of the amount of GST, except where the
amount of GST incurred is not recoverable from the Australian Taxation Office (ATO).
Receivables and payables are stated inclusive of GST receivable or payable. The net amount
of GST recoverable from, or payable to the ATO, is included with receivables or payables in the
statement of financial position.
Cash flows are presented on a gross basis. The GST components of cash flows arising from
investing or financing activities which are recoverable from, or payable to the ATO, are
presented as operating cash flows.
The financial report is a general purpose financial statement which has been prepared in accordance with
Australian Accounting Standards (as they apply to local governments and not-for-profit entities), Australian
Accounting Interpretations, other authoritative pronouncements of the Australian Accounting Standards Board, the
local Government Act 1995 and accompanying regulations.
The preparation of a financial report in conformity with Australian Accounting Standards requires management to
make judgements, estimates and assumptions that effect the application of policies and reported amounts of
assets and liabilities, income and expenses.
The estimates and associated assumptions are based on historical experience and various other factors that are
believed to be reasonable under the circumstances; the results of which form the basis of making the judgements
about carrying values of assets and liabilities that are not readily apparent from other sources. Actual results may
differ from these estimates.
Shire of Williams Page 32
SHIRE OF WILLIAMS
NOTES TO AND FORMING PART OF THE FINANCIAL REPORT
FOR THE YEAR ENDED 30TH JUNE 2013
1. SIGNIFICANT ACCOUNTING POLICIES (Continued)
(d) Cash and Cash Equivalents
(e) Trade and Other Receivables
(f) Inventories
General
Land Held for Resale
Land purchased for development and/or resale is valued at the lower of cost and net realisable
value. Cost includes the cost of acquisition, development, borrowing costs and holding costs
until completion of development. Finance costs and holding charges incurred after development
is completed are expensed.
Gains and losses are recognised in the statement of comprehensive income at the time of
signing an unconditional contract of sale if significant risks and rewards, and effective control
over the land, are passed on to the buyer at this point.
Land held for resale is classified as current except where it is held as non-current based on
Council's intention to release for sale.
Trade and other receivables include amounts due from ratepayers for unpaid rates and service
charges and other amounts due from third parties for goods sold and services performed in the
ordinary course of business.
Receivables expected to be collected within 12 months of the end of the reporting period are
classified as current assets. All other receivables are classified as non-current assets.
Collectability of trade and other receivables is reviewed on an ongoing basis. Debts that are
known to be uncollectible are written off when identified. An allowance for doubtful debts is
raised when there is objective evidence that they will not be collectible.
Inventories are measured at the lower of cost and net realisable value.
Cash and cash equivalents include cash on hand, cash at bank, deposits available on demand
with banks, other short term highly liquid investments with original maturities of three months or
less that are readily convertible to known amounts of cash and which are subject to an
insignificant risk of changes in value and bank overdrafts.
Bank overdrafts are shown as short term borrowings in current liabilities in the statement of
financial position.
Net realisable value is the estimated selling price in the ordinary course of business less the
estimated costs of completion and the estimated costs necessary to make the sale.
Shire of Williams Page 33
SHIRE OF WILLIAMS
NOTES TO AND FORMING PART OF THE FINANCIAL REPORT
FOR THE YEAR ENDED 30TH JUNE 2013
1. SIGNIFICANT ACCOUNTING POLICIES (Continued)
(g) Fixed Assets
Mandatory Requirement to Revalue Non-Current Assets
as follows:
(i) that are plant and equipment; and
(ii) that are -
(I) land and buildings; or
(II) infrastructure;
and
Land Under Control
In accordance with Local Government (Financial Management) Regulation 16(a), the Council is
required to include as an asset (by 30 June 2013), Crown Land operated by the local government
as a golf course, showground, racecourse or other sporting or recreational facility of State or
regional significance.
Upon initial recognition, these assets were recorded at cost in accordance with AASB 116. They
were then classified as Land and revalued along with other land in accordance with other policies
detailed in this Note.
Whilst they were initially recorded at cost, fair value at the date of acquisition was deemed cost
as per AASB 116.
Consequently, these assets were initially recognised at cost but revalued along with other items
of Land and Buildings at 30 June 2013.
Each class of fixed assets is carried at cost or fair value as indicated less, where applicable, any
accumulated depreciation or impairment losses.
Effective from 1 July 2012, the Local Government (Financial Management) Regulations were
amended and the measurement of non-current assets at fair value became mandatory.
Relevant disclosures, in accordance with the requirements of Australian Accounting Standards,
have been made in the financial report as necessary.
Council has commenced the process of adopting Fair Value in accordance with the Regulations.
The amendments allow for a phasing in of fair value in relation to fixed assets over three years
(a) for the financial year ending on 30 June 2013, the fair value of all of the assets of the local
government that are plant and equipment; and
(b) for the financial year ending on 30 June 2014, the fair value of all of the assets of the local
government -
Thereafter, in accordance with the regulations, each asset class must be revalued at least every
3 years.
(c) for a financial year ending on or after 30 June 2015, the fair value of all of the assets of the
local government.
Shire of Williams Page 34
SHIRE OF WILLIAMS
NOTES TO AND FORMING PART OF THE FINANCIAL REPORT
FOR THE YEAR ENDED 30TH JUNE 2013
1. SIGNIFICANT ACCOUNTING POLICIES (Continued)
(g) Fixed Assets (Continued)
Initial Recognition
Subsequent costs are included in the asset's carrying amount or recognised as a separate asset,
as appropriate, only when it is probable future economic benefits associated with the item will
flow to the Council and the cost of the item can be measured reliably. All other repairs and
maintenance are recognised as expenses in the statement of comprehensive income in the
period in which they are incurred.
Revaluation
Those assets carried at a revalued amount, being their fair value at the date of revaluation less any
subsequent accumulated depreciation and accumulated impairment losses, are to be revalued with
sufficient regularity to ensure the carrying amount does not differ materially from that determined using
fair value at reporting date.
In addition, the amendments to the Financial Management Regulations mandating the use of Fair
Value, imposes a further minimum of 3 years revaluation requirement. As a minimum, all assets
carried at a revalued amount, will be revalued at least every 3 years.
When performing a revaluation, the Council uses mix of both independent and management
valuations using the following as a guide.
Revalued assets are carried at their fair value being the price that would be received to sell the
asset, in an orderly transaction between market participants at the measurement date.
All assets are initially recognised at cost. Cost is determined as the fair value of the assets given
as consideration plus costs incidental to the acquisition. For assets acquired at no cost or for
nominal consideration, cost is determined as fair value at the date of acquisition. The cost of non-
current assets constructed by the Council includes the cost of all materials used in construction,
direct labour on the project and an appropriate proportion of variable and fixed overheads.
Increases in the carrying amount arising on revaluation of assets are credited to a revaluation
surplus in equity. Decreases that offset previous increases in the same asset are recognised
against revaluation surplus directly in equity. All other decreases are recognised as profit or loss.
For land and buildings, fair value will be determined based on the nature of the asset class. For land
and non-specialised buildings, fair value is determined on the basis of observable open market
values of similar assets, adjusted for conditions and comparability at their highest and best use
(Level 2 inputs in the fair value hierarchy).
With regards to specialised buildings, fair value is determined having regard for current replacement
cost and both observable and unobservable costs. These include construction costs based on
recent contract prices, current condition (observable Level 2 inputs in the fair value hierarchy),
residual values and remaining useful life assessments (unobservable Level 3 inputs in the fair value
hierarchy).
For infrastructure and other asset classes, fair value is determined to be the current replacement
cost of an asset (Level 2 inputs in the fair value hierarchy) less, where applicable, accumulated
depreciation calculated on the basis of such cost to reflect the already consumed or expired future
economic benefits of the asset (Level 3 inputs in the fair value hierarchy).
Any accumulated depreciation at the date of revaluation is eliminated against the gross carrying
amount of the asset and the net amount is restated to the revalued amount of the asset.
Shire of Williams Page 35
SHIRE OF WILLIAMS
NOTES TO AND FORMING PART OF THE FINANCIAL REPORT
FOR THE YEAR ENDED 30TH JUNE 2013
1. SIGNIFICANT ACCOUNTING POLICIES (Continued)
(g) Fixed Assets (Continued)
Transitional Arrangement
Early Adoption of AASB 13 - Fair Value Measurement
Land under Roads
Effective as at 1 July 2008, Council elected not to recognise any value for land under roads
acquired on or before 30 June 2008. This accords with the treatment available in Australian
Accounting Standard AASB1051 - Land Under Roads and the fact Local Government (Financial
Management) Regulation 16(a)(i) prohibits local governments from recognising such land as an
asset.
Those assets carried at cost will be carried in accordance with the policy detailed in the Initial
Recognition section as detailed above.
Those assets carried at fair value will be carried in accordance with the Revaluation
methodology section as detailed above.
During the time it takes to transition the carrying value of non-current assets from the cost
approach to the fair value approach, the Council may still be utilising both methods across
differing asset classes.
Whilst the new accounting standard in relation to fair value, AASB 13 - Fair Value Measurement
does not become applicable until the end of the year ended 30 June 2014 (in relation to Council),
given the legislative need to commence using Fair Value methodology for this reporting period,
the Council chose to early adopt AASB 13 (as allowed for in the standard).
As a consequence, the principles embodied in AASB 13 - Fair Value Measurement have been
applied to this reporting period (year ended 30 June 2013).
Due to the nature and timing of the adoption (driven by legislation), the adoption of this standard
has had no effect on previous reporting periods.
In Western Australia, all land under roads is Crown Land, the responsibility for managing which,
is vested in the local government.
In respect of land under roads acquired on or after 1 July 2008, as detailed above, Local
Government (Financial Management) Regulation 16(a)(i) prohibits local governments from
recognising such land as an asset.
Whilst such treatment is inconsistent with the requirements of AASB 1051, Local Government
(Financial Management) Regulation 4(2) provides, in the event of such an inconsistency, the
Local Government (Financial Management) Regulations prevail.
Consequently, any land under roads acquired on or after 1 July 2008 is not included as an asset
of the Council.
Shire of Williams Page 36
SHIRE OF WILLIAMS
NOTES TO AND FORMING PART OF THE FINANCIAL REPORT
FOR THE YEAR ENDED 30TH JUNE 2013
1. SIGNIFICANT ACCOUNTING POLICIES (Continued)
(g) Fixed Assets (Continued)
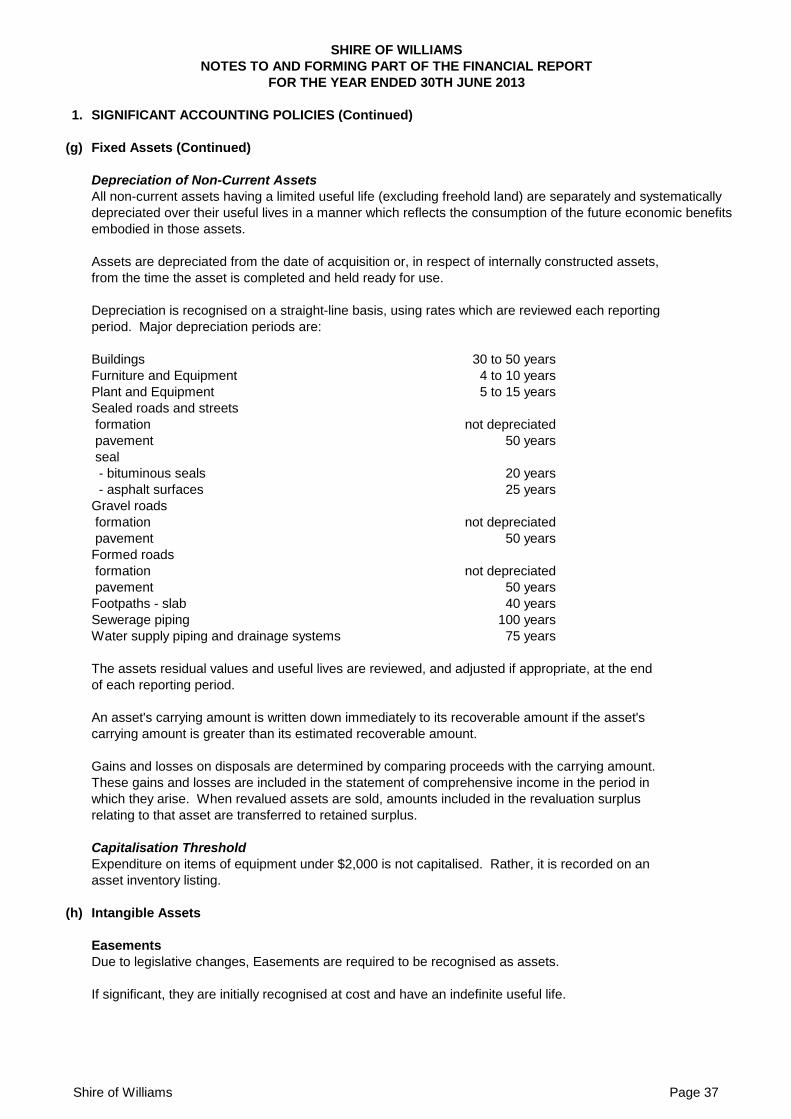
Depreciation of Non-Current Assets
All non-current assets having a limited useful life (excluding freehold land) are separately and systematically
depreciated over their useful lives in a manner which reflects the consumption of the future economic benefits
embodied in those assets.
Assets are depreciated from the date of acquisition or, in respect of internally constructed assets,
from the time the asset is completed and held ready for use.
Depreciation is recognised on a straight-line basis, using rates which are reviewed each reporting
period. Major depreciation periods are:
Buildings 30 to 50 years
Furniture and Equipment 4 to 10 years
Plant and Equipment 5 to 15 years
Sealed roads and streets
formation not depreciated
pavement 50 years
seal
- bituminous seals 20 years
- asphalt surfaces 25 years
Gravel roads
formation not depreciated
pavement 50 years
Formed roads
formation not depreciated
pavement 50 years
Footpaths - slab 40 years
Sewerage piping 100 years
Water supply piping and drainage systems 75 years
Capitalisation Threshold
(h) Intangible Assets
Easements
Due to legislative changes, Easements are required to be recognised as assets.
If significant, they are initially recognised at cost and have an indefinite useful life.
The assets residual values and useful lives are reviewed, and adjusted if appropriate, at the end
of each reporting period.
Expenditure on items of equipment under $2,000 is not capitalised. Rather, it is recorded on an
asset inventory listing.
Gains and losses on disposals are determined by comparing proceeds with the carrying amount.
These gains and losses are included in the statement of comprehensive income in the period in
which they arise. When revalued assets are sold, amounts included in the revaluation surplus
relating to that asset are transferred to retained surplus.
An asset's carrying amount is written down immediately to its recoverable amount if the asset's
carrying amount is greater than its estimated recoverable amount.
Shire of Williams Page 37

SHIRE OF WILLIAMS
NOTES TO AND FORMING PART OF THE FINANCIAL REPORT
FOR THE YEAR ENDED 30TH JUNE 2013
1. SIGNIFICANT ACCOUNTING POLICIES (Continued)
(i) Financial Instruments
Initial Recognition and Measurement
Classification and Subsequent Measurement
(i) Financial assets at fair value through profit and loss
Financial assets at fair value through profit or loss are financial assets held for trading. A financial
asset is classified in this category if acquired principally for the purpose of selling in the short term.
Derivatives are classified as held for trading unless they are designated as hedges. Assets in this
category are classified as current. They are subsequently measured at fair value with changes to
carrying amount being included in profit or loss.
Fair value represents the amount for which an asset could be exchanged or a liability settled,
between knowledgeable, willing parties. Where available, quoted prices in an active market are
used to determine fair value. In other circumstances, valuation techniques are adopted.
Financial instruments are subsequently measured at fair value, amortised cost using the effective
interest rate method or at cost.
The effective interest rate method is used to allocate interest income or interest expense over the
relevant period and is equivalent to the rate that discounts estimated future cash payments or
receipts (including fees, transaction costs and other premiums or discounts) through the
expected life (or when this cannot be reliably predicted, the contractual term) of the financial
instrument to the net carrying amount of the financial asset or financial liability. Revisions to
expected future net cash flows will necessitate an adjustment to the carrying value with a
consequential recognition of an income or expense in profit or loss.
Amortised cost is calculated as:
(a) the amount in which the financial asset or financial liability is measured at initial recognition;
(b) less principal repayments;
(c) plus or minus the cumulative amortisation of the difference, if any, between the amount
initially recognised and the maturity amount calculated using the effective interest rate method;
and
(d) less any reduction for impairment.
Financial assets and financial liabilities are recognised when the Council becomes a party to the
contractual provisions to the instrument. For financial assets, this is equivalent to the date that
the Council commits itself to either the purchase or sale of the asset (ie trade date accounting is
adopted).
Financial instruments are initially measured at fair value plus transaction costs, except where the
instrument is classified 'at fair value through profit or loss', in which case transaction costs are
expensed to profit or loss immediately.
Shire of Williams Page 38
SHIRE OF WILLIAMS
NOTES TO AND FORMING PART OF THE FINANCIAL REPORT
FOR THE YEAR ENDED 30TH JUNE 2013
1. SIGNIFICANT ACCOUNTING POLICIES (Continued)
(i) Financial Instruments (Continued)
Classification and Subsequent Measurement (Continued)
(ii) Loans and receivables
(iii) Held-to-maturity investments
(iv) Available-for-sale financial assets
(v) Financial liabilities
Impairment
Available-for-sale financial assets are included in current assets where they are expected to be sold
within 12 months after the end of the reporting period. All other available-for-sale financial assets
are classified as non-current.
Held-to-maturity investments are non-derivative financial assets with fixed maturities and fixed or
determinable payments and fixed maturities that the Council’s management has the positive
intention and ability to hold to maturity. They are subsequently measured at amortised cost. Gains
or losses are recognised in profit or loss.
Held-to-maturity investments are included in current assets where they are expected to mature
within 12 months after the end of the reporting period. All other investments are classified as non-
current.
At the end of each reporting period, the Council assesses whether there is objective evidence that a
financial instrument has been impaired.
Non-derivative financial liabilities (excluding financial guarantees) are subsequently measured at
amortised cost. Gains or losses are recognised in profit or loss.
Available-for-sale financial assets, are non-derivative financial assets that are either not suitable to
be classified into other categories of financial assets due to their nature, or they are designated as
such by management. They comprise investments in the equity of other entities where there is
neither a fixed maturity nor fixed or determinable.
They are subsequently measured at fair value with changes in such fair value (ie gains or losses)
recognised in other comprehensive income (except for impairment losses). When the financial
asset is derecognised, the cumulative gain or loss pertaining to the asset previously recognised in
other comprehensive income, is reclassified into profit or loss.
Loans and receivables are non-derivative financial assets with fixed or determinable payments that
are not quoted in an active market and are subsequently measured at amortised cost. Gains or
losses are recognised in profit or loss.
Loans and receivables are included in current assets where they are expected to mature within 12
months after the end of the reporting period.
A financial asset is deemed to be impaired if, and only if, there is objective evidence of impairment
as a result of one or more events having occurred, which will have an impact on the estimated future
cash flows of the financial asset(s).
In the case of available-for-sale financial instruments, a significant or prolonged decline in the
market value of the instrument is considered a loss event. Impairment losses are recognised in
profit or loss immediately. Also, any cumulative decline in fair value previously recognised in other
comprehensive income is reclassified into profit or loss at this point.
Shire of Williams Page 39
SHIRE OF WILLIAMS
NOTES TO AND FORMING PART OF THE FINANCIAL REPORT
FOR THE YEAR ENDED 30TH JUNE 2013
1. SIGNIFICANT ACCOUNTING POLICIES (Continued)
(i) Financial Instruments (Continued)
Derecognition
(j) Impairment
In accordance with Australian Accounting Standards the Council's assets, other than inventories,
are assessed at each reporting date to determine whether there is any indication they may be impaired.
Where such an indication exists, an impairment test is carried out on the asset by comparing the
recoverable amount of the asset, being the higher of the asset's fair value less costs to sell and value in
use, to the asset's carrying amount.
For non-cash generating assets such as roads, drains, public buildings and the like, value in use is
represented by the depreciated replacement cost of the asset.
(k) Trade and Other Payables
Trade and other payables represent liabilities for goods and services provided to the Council
prior to the end of the financial year that are unpaid and arise when the Council becomes
obliged to make future payments in respect of the purchase of these goods and services.
The amounts are unsecured, are recognised as a current liability and are normally paid within
30 days of recognition.
(l) Employee Benefits
(m) Borrowing Costs
Borrowing costs are recognised as an expense when incurred except where they are directly
attributable to the acquisition, construction or production of a qualifying asset. Where this is
the case, they are capitalised as part of the cost of the particular asset.
Financial assets are derecognised where the contractual rights to receipt of cash flows expire or the
asset is transferred to another party whereby the Council no longer has any significant continued
involvement in the risks and benefits associated with the asset.
Financial liabilities are derecognised where the related obligations are discharged, cancelled or
expire. The difference between the carrying amount of the financial liability extinguished or
transferred to another party and the fair value of the consideration paid, including the transfer of non-
cash assets or liabilities assumed, is recognised in profit or loss.
Provision is made for the Council's liability for employee benefits arising from services rendered by
employees to the end of the reporting period. Employee benefits that are expected to be settled
within one year have been measured at the amounts expected to be paid when the liability is settled.
Employee benefits payable later than one year have been measured at the present value of the
estimated future cash outflows to be made for those benefits. In determining the liability,
consideration is given to the employee wage increases and the probability the employee may not
satisfy vesting requirements. Those cash flows are discounted using market yields on national
government bonds with terms to maturity matching the expected timing of cash flows.
Any excess of the asset's carrying amount over its recoverable amount is recognised immediately in
profit or loss, unless the asset is carried at a revalued amount in accordance with another standard
(eg AASB 116). Any impairment loss of a revalued asset is treated as a revaluation decrease in
accordance with that other standard.
Shire of Williams Page 40
SHIRE OF WILLIAMS
NOTES TO AND FORMING PART OF THE FINANCIAL REPORT
FOR THE YEAR ENDED 30TH JUNE 2013
1. SIGNIFICANT ACCOUNTING POLICIES (Continued)
(n) Provisions
Provisions are recognised when:
a) the Council has a present legal or constructive obligation as a result of past events;
b) for which it is probable that an outflow of economic benefits will result; and
c) that outflow can be reliably measured.
(o) Leases
Leases of fixed assets, where substantially all the risks and benefits incidental to the ownership
of the asset, but not legal ownership, are transferred to the Council, are classified as finance
leases.
Finance leases are capitalised recording an asset and a liability at the lower amounts equal to the
fair value of the leased property or the present value of the minimum lease payments, including any
guaranteed residual values. Lease payments are allocated between the reduction of the lease liability
and the lease interest expense for the period.
Leased assets are depreciated on a straight line basis over the shorter of their estimated useful lives
or the lease term.
Lease payments for operating leases, where substantially all the risks and benefits remain with the
lessor, are charged as expenses in the periods in which they are incurred.
Lease incentives under operating leases are recognised as a liability and amortised on a straight line
basis over the life of the lease term.
(p) Investments in Associates
Provisions are measured using the best estimate of the amounts required to settle the obligation
at the end of the reporting period.
Associates are entities in which the Council has significant influence through holding, directly or
indirectly, 20% or more of the voting power of the Council. Investments in associates are accounted
for in the financial statements by applying the equity method of accounting, whereby the investment
is initially recognised at cost and adjusted thereafter for the post-acquisition change in the Council's
share of net assets of the associate entity. In addition, Council's share of the profit or loss of the
associate entity is included in the Council's profit or loss.
The carrying amount of the investment includes goodwill relating to the associate. Any discount on
acquisition, whereby the Council's share of the net fair value of the associate exceeds the cost of
investment, is recognised in profit or loss in the period in which the investment is acquired.
Profits and losses resulting from transactions between the Council and the associate are eliminated
to the extent of the Council's interest in the associate.
Shire of Williams Page 41
SHIRE OF WILLIAMS
NOTES TO AND FORMING PART OF THE FINANCIAL REPORT
FOR THE YEAR ENDED 30TH JUNE 2013
1. SIGNIFICANT ACCOUNTING POLICIES (Continued)
(q) Joint Venture
The Council’s interest in a joint venture has been recognised in the financial statements by
including its share of any assets, liabilities, revenues and expenses of the joint venture within
the appropriate line items of the financial statement. Information about the joint venture is set
out in Note 16.
(r) Rates, Grants, Donations and Other Contributions
Rates, grants, donations and other contributions are recognised as revenues when the local
government obtains control over the assets comprising the contributions.
Control over assets acquired from rates is obtained at the commencement of the rating period
or, where earlier, upon receipt of the rates.
Where contributions recognised as revenues during the reporting period were obtained on the
condition that they be expended in a particular manner or used over a particular period, and those
conditions were undischarged as at the reporting date, the nature of and amounts pertaining to
those undischarged conditions are disclosed in Note 2(c). That note also discloses the amount
of contributions recognised as revenues in a previous reporting period which were obtained in
respect of the local government's operation for the current reporting period.
(s) Superannuation
(t) Current and Non-Current Classification
(u) Rounding Off Figures
All figures shown in this annual financial report, other than a rate in the dollar, are rounded to the
nearest dollar.
The Council contributes to a number of superannuation funds on behalf of employees. All funds
to which the Council contributes are defined contribution plans.
The Council's interest in joint venture entities are recorded using the equity method of accounting
(refer to Note 1(p) for details) in the financial report.
When the Council contributes assets to the joint venture or if the Council purchases assets from the
joint venture, only the portion of gain or loss not attributable to the Council's share of the joint venture
shall be recognised. The Council recognises the full amount of any loss when the contribution
results in a reduction in the net realisable value of current assets or an impairment loss.
In the determination of whether an asset or liability is current or non-current, consideration is given to
the time when each asset or liability is expected to be settled. The asset or liability is classified as
current if it is expected to be settled within the next 12 months, being the Council’s operational cycle.
In the case of liabilities where the Council does not have the unconditional right to defer settlement
beyond 12 months, such as vested long service leave, the liability is classified as current even if not
expected to be settled within the next 12 months. Inventories held for trading are classified as
current even if not expected to be realised in the next 12 months except for land held for resale
where it is held as non-current based on Council’s intentions to release for sale.
Shire of Williams Page 42
SHIRE OF WILLIAMS
NOTES TO AND FORMING PART OF THE FINANCIAL REPORT
FOR THE YEAR ENDED 30TH JUNE 2013
1. SIGNIFICANT ACCOUNTING POLICIES (Continued)
(v) Comparative Figures
Where required, comparative figures have been adjusted to conform with changes in presentation
for the current financial year.
(w) Budget Comparative Figures
Unless otherwise stated, the budget comparative figures shown in this annual financial report relate to
the original budget estimate for the relevant item of disclosure.
When the Council applies an accounting policy retrospectively, makes a retrospective
restatement or reclassifies items in its financial statement, a statement of financial position as at
the beginning of the earliest period will be disclosed.
Shire of Williams Page 43
SHIRE OF WILLIAMS
NOTES TO AND FORMING PART OF THE FINANCIAL REPORT
FOR THE YEAR ENDED 30TH JUNE 2013
1. SIGNIFICANT ACCOUNTING POLICIES (Continued)
(x) New Accounting Standards and Interpretations for Application in Future Periods
Title and Topic Issued Applicable (*) Impact
(i) AASB 9 – Financial
Instruments
December 2009 01 January 2013 Nil – The objective of this Standard is to improve and
simplify the approach for classification and
AASB 2012 – 6 Amendments
to Australian Accounting
Standards – Mandatory
effective date of AASB 9 and
Transition Disclosures
September 2012 Deferred AASB 9
until 1 January
2015
measurement of financial assets compared with the
requirements of AASB 139. Given the nature of the
financial assets of the Council, it is not anticipated the
standard will have any material effect.
(ii) AASB 2009 – 11 Amendments
to Australian Accounting
Standards arising from AASB 9
December 2009 01 January 2013 Nil – The revisions embodied in this standard give effect
to the consequential changes arising from the issuance
of AASB 9 which is not anticipated to have any material
effect on the Council (refer (i) above).
[AASB 1, 3, 4, 5, 7, 101, 102,
108, 112, 118, 121, 127, 128,
131, 132, 136, 139, 1023 &
1038 and Interpretations 10 &
12)
The AASB has issued a number of new and amended Accounting Standards and Interpretations that have mandatory application dates for
future reporting periods, some of which are relevant to the Council.
Management’s assessment of the new and amended pronouncement that are relevant to the Council, applicable to future reporting periods and
which have not yet been adopted are set out as follows.
Shire of Williams Page 44
SHIRE OF WILLIAMS
NOTES TO AND FORMING PART OF THE FINANCIAL REPORT
FOR THE YEAR ENDED 30TH JUNE 2013
1. SIGNIFICANT ACCOUNTING POLICIES (Continued)
(x) New Accounting Standards and Interpretations for Application in Future Periods (Continued)
Title and Topic Issued Applicable (*) Impact
(iii) AASB 2010 – 7 Amendments
to Australian Accounting
Standards arising from AASB 9
(December 2010)
December 2010 01 January 2013 Nil – The revisions embodied in this standard give effect
to the consequential changes arising from the issuance
of AASB 9 which is not anticipated to have any material
effect on the Council (refer (i) above).
[AASB 1, 3, 4, 5, 7, 101, 102,
108, 112, 118, 120, 121, 127,
128, 131, 132, 136, 137, 139,
1023 & 1038 and
Interpretations 2, 5, 10, 12, 19
& 127]
(iv) AASB 10 - Consolidated
Financial Statements, AASB
11 - Joint Arrangements, AASB
12 - Disclosure of Interests in
Other Entities, AASB 127 -
Separate Financial
Statements, AASB 128 -
Investments in Associates and
Joint Ventures, AASB 2011 - 7
Amendments to Australian
Accounting Standards arising
from the Consolidation and
Joint Arrangement Standards
August 2011 01 January 2013 Nil - None of these, except for AASB 128 , are expected
to have significant application to the operations of the
Council. With respect to AASB 128, where the Council
has an interest in a Joint Venture, the requirements of
AASB 128 supersede those of the current Joint Venture
Standard AASB 131. The new standard more clearly
defines the accounting treatment and disclosure in
relation to it. Due to the nature of the Joint Venture, it is
not expected to have a significant impact on the
Council.
[AASB 1, 2, 3, 5, 7, 9, 2009-11,
101, 107, 112, 118, 121, 124,
131, 132, 133, 138, 139, 1023
& 1038 and Interpretations 5,
9, 16 & 17]
Shire of Williams Page 45
SHIRE OF WILLIAMS
NOTES TO AND FORMING PART OF THE FINANCIAL REPORT
FOR THE YEAR ENDED 30TH JUNE 2013
1. SIGNIFICANT ACCOUNTING POLICIES (Continued)
(x) New Accounting Standards and Interpretations for Application in Future Periods (Continued)
Title and Topic Issued Applicable (*) Impact
(v) AASB 2011 - 9 Amendments
to Australian Accounting
Standards – Presentation of
Items of Other Comprehensive
Income
September 2011 01 July 2013 The main change embodied in this standard is the
requirement to group items presented in other
comprehensive income on the basis of whether they are
potentially reclassifiable to profit or loss subsequently.
[AASB 1, 5, 7, 101, 112, 120,
121, 132, 133, 134, 1039 &
1049]
It effects presentation only and is not expected to
significantly impact the Council.
(vi) AASB 119 - Employee
Benefits, AASB 2011 - 10
Amendments to Australian
Accounting Standards arising
from AASB 119 [AASB 1, 8,
101, 124, 134, 1049 & 2011-8
and Interpretation 14]
September 2011 01 January 2013 The changes in relation to defined benefit plans
contained in this standard are not expected to
significantly impact the Council nor are the changes to
AASBs in relation to termination benefits.
(vii) AASB 2012-2 Amendments to
Australian Accounting
Standards – Disclosures –
Offsetting Financial Assets and
Financial Liabilities [AASB 7
& 32]
June 2012 01 January 2013 Principally amends AASB 7: Financial Instruments:
Disclosures to require entities to include information that
will enable users of their financial statements to evaluate
the effect or potential effect of netting arrangements,
including rights of set-off associated with the entity’s
recognised financial assets and recognised financial
liabilities, on the entity’s financial position.
This Standard is not expected to significantly impact on
the Council’s financial statements.
Shire of Williams Page 46
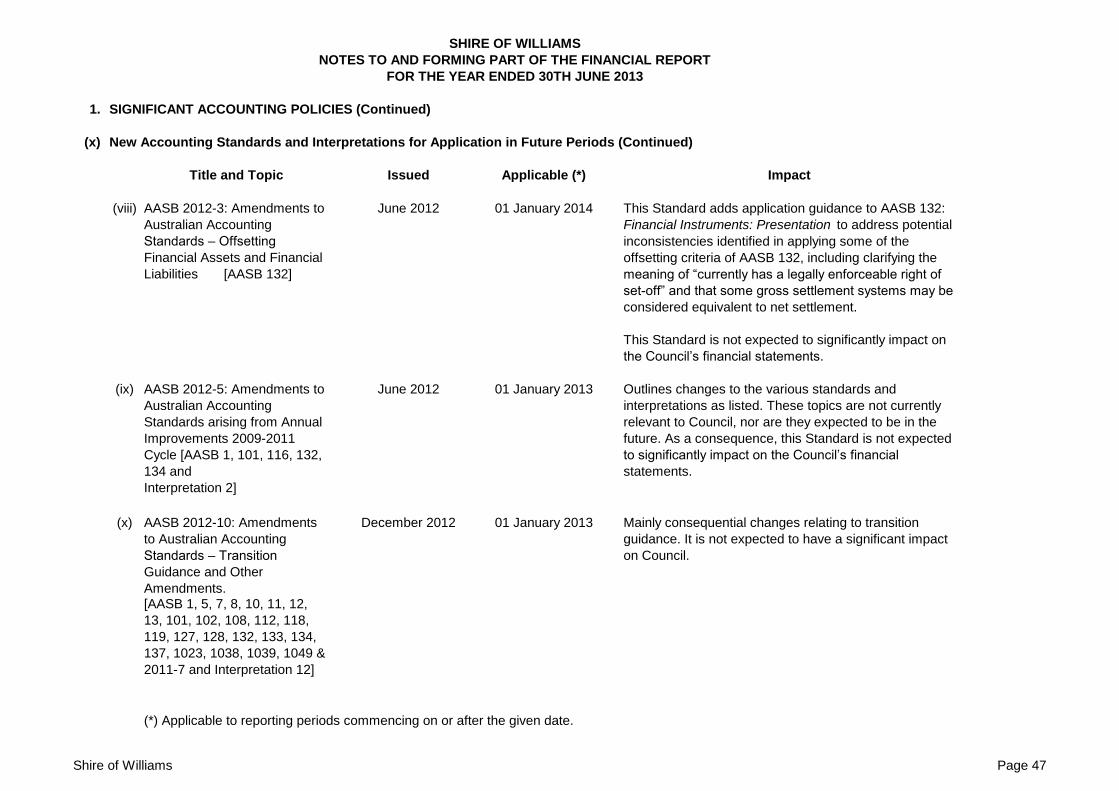
SHIRE OF WILLIAMS
NOTES TO AND FORMING PART OF THE FINANCIAL REPORT
FOR THE YEAR ENDED 30TH JUNE 2013
1. SIGNIFICANT ACCOUNTING POLICIES (Continued)
(x) New Accounting Standards and Interpretations for Application in Future Periods (Continued)
Title and Topic Issued Applicable (*) Impact
(viii) AASB 2012-3: Amendments to
Australian Accounting
Standards – Offsetting
Financial Assets and Financial
Liabilities [AASB 132]
June 2012 01 January 2014 This Standard adds application guidance to AASB 132:
Financial Instruments: Presentation to address potential
inconsistencies identified in applying some of the
offsetting criteria of AASB 132, including clarifying the
meaning of “currently has a legally enforceable right of
set-off” and that some gross settlement systems may be
considered equivalent to net settlement.
This Standard is not expected to significantly impact on
the Council’s financial statements.
(ix) AASB 2012-5: Amendments to
Australian Accounting
Standards arising from Annual
Improvements 2009-2011
Cycle [AASB 1, 101, 116, 132,
134 and
June 2012 01 January 2013 Outlines changes to the various standards and
interpretations as listed. These topics are not currently
relevant to Council, nor are they expected to be in the
future. As a consequence, this Standard is not expected
to significantly impact on the Council’s financial
statements.
Interpretation 2]
(x) AASB 2012-10: Amendments
to Australian Accounting
Standards – Transition
Guidance and Other
Amendments.
December 2012 01 January 2013 Mainly consequential changes relating to transition
guidance. It is not expected to have a significant impact
on Council.
[AASB 1, 5, 7, 8, 10, 11, 12,
13, 101, 102, 108, 112, 118,
119, 127, 128, 132, 133, 134,
137, 1023, 1038, 1039, 1049 &
2011-7 and Interpretation 12]
(*) Applicable to reporting periods commencing on or after the given date.
Shire of Williams Page 47

SHIRE OF WILLIAMS
NOTES TO AND FORMING PART OF THE FINANCIAL REPORT
FOR THE YEAR ENDED 30TH JUNE 2013
1. SIGNIFICANT ACCOUNTING POLICIES (Continued)
(y) Adoption of New and Revised Accounting Standards
AASB 2010 – 8
AASB 2011 - 3
AASB 2011 - 13
The Council also chose to early adopt AASB 13 – Fair Value Measurement as allowed for in the standard. For further details with respect to this
early adoption, refer to Note 1(g).
During the current year, the Council adopted all of the new and revised Australian Accounting Standards and Interpretations which became
mandatory and which were applicable to its operations.
These new and revised standards were:
The standards adopted had a minimal effect on the accounting and reporting practices of the Council as they were either largely editorial in
nature, were revisions to help ensure consistency with presentation, recognition and measurement criteria of IFRSs or related to topics not
relevant to operations.
Shire of Williams Page 48
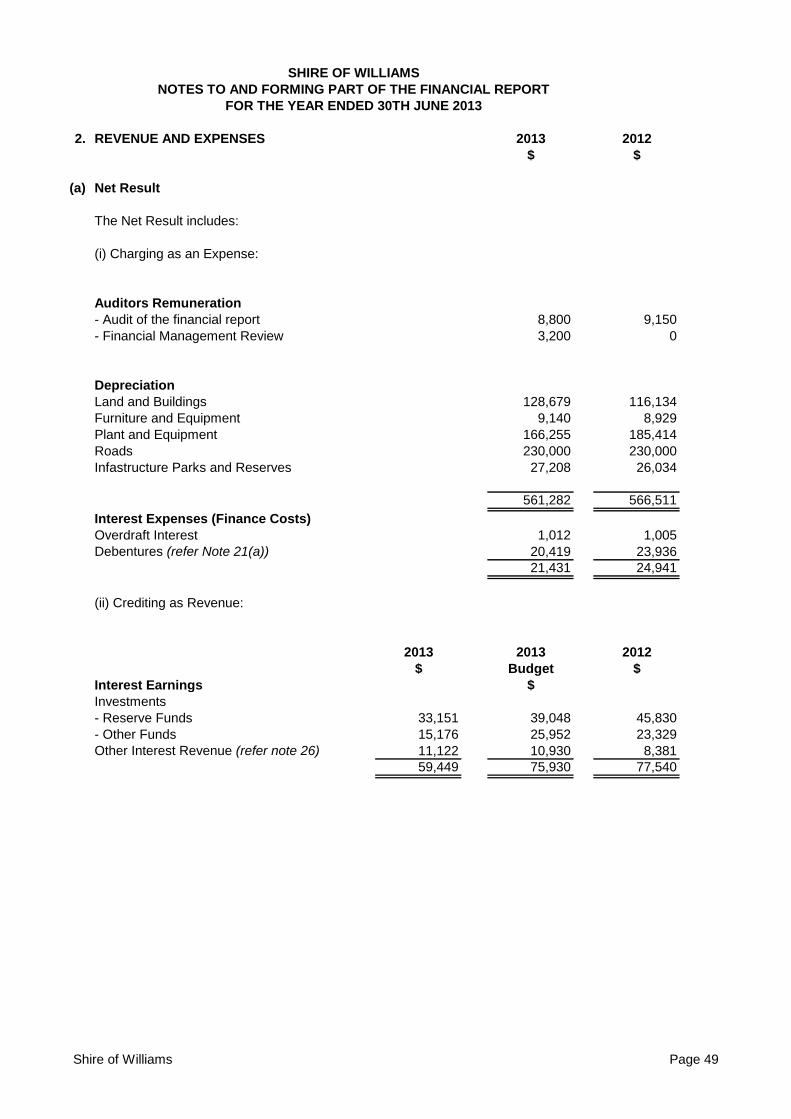
SHIRE OF WILLIAMS
NOTES TO AND FORMING PART OF THE FINANCIAL REPORT
FOR THE YEAR ENDED 30TH JUNE 2013
2. REVENUE AND EXPENSES 2013 2012
$ $
(a) Net Result
The Net Result includes:
(i) Charging as an Expense:
Auditors Remuneration
- Audit of the financial report 8,800 9,150
- Financial Management Review 3,200 0
Depreciation
Land and Buildings 128,679 116,134
Furniture and Equipment 9,140 8,929
Plant and Equipment 166,255 185,414
Roads 230,000 230,000
Infastructure Parks and Reserves 27,208 26,034
561,282 566,511
Interest Expenses (Finance Costs)
Overdraft Interest 1,012 1,005
Debentures (refer Note 21(a)) 20,419 23,936
21,431 24,941
(ii) Crediting as Revenue:
2013 2013 2012
$ Budget $
Interest Earnings $
Investments
- Reserve Funds 33,151 39,048 45,830
- Other Funds 15,176 25,952 23,329
Other Interest Revenue (refer note 26) 11,122 10,930 8,381
59,449 75,930 77,540
Shire of Williams Page 49
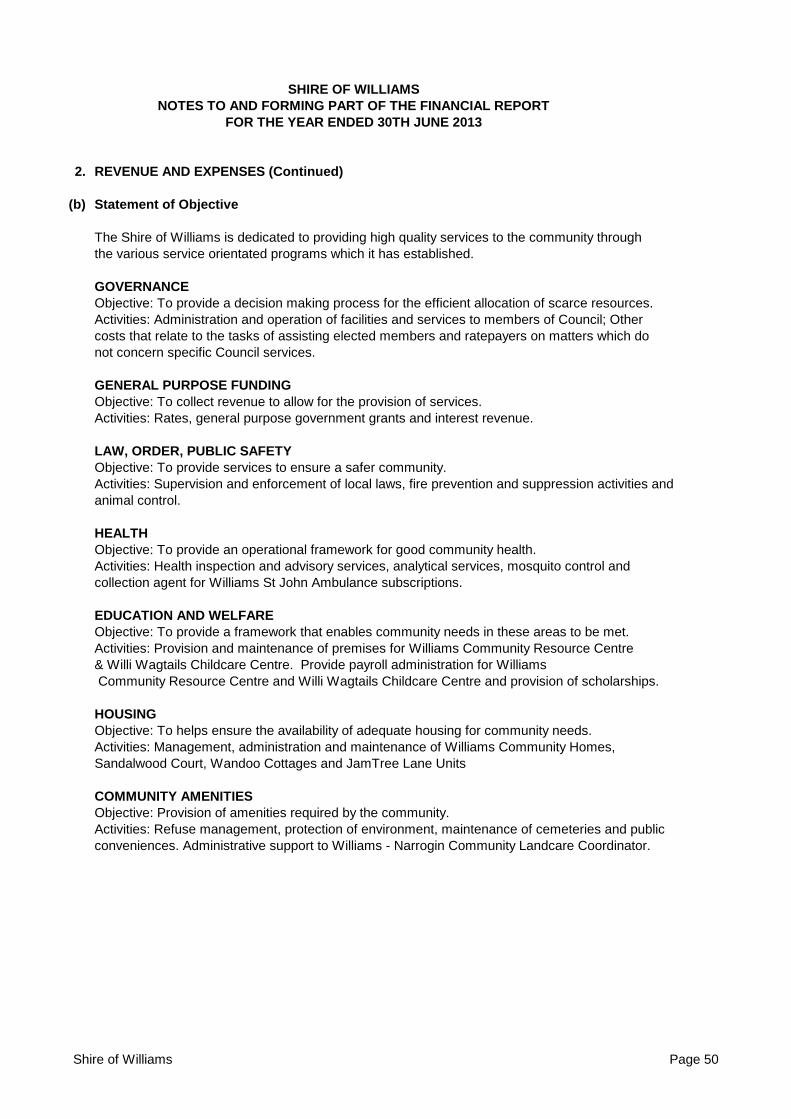
SHIRE OF WILLIAMS
NOTES TO AND FORMING PART OF THE FINANCIAL REPORT
FOR THE YEAR ENDED 30TH JUNE 2013
2. REVENUE AND EXPENSES (Continued)
(b) Statement of Objective
The Shire of Williams is dedicated to providing high quality services to the community through
the various service orientated programs which it has established.
GOVERNANCE
Objective: To provide a decision making process for the efficient allocation of scarce resources.
Activities: Administration and operation of facilities and services to members of Council; Other
costs that relate to the tasks of assisting elected members and ratepayers on matters which do
not concern specific Council services.
GENERAL PURPOSE FUNDING
Objective: To collect revenue to allow for the provision of services.
Activities: Rates, general purpose government grants and interest revenue.
LAW, ORDER, PUBLIC SAFETY
Objective: To provide services to ensure a safer community.
Activities: Supervision and enforcement of local laws, fire prevention and suppression activities and
animal control.
HEALTH
Objective: To provide an operational framework for good community health.
Activities: Health inspection and advisory services, analytical services, mosquito control and
collection agent for Williams St John Ambulance subscriptions.
EDUCATION AND WELFARE
Objective: To provide a framework that enables community needs in these areas to be met.
Activities: Provision and maintenance of premises for Williams Community Resource Centre
& Willi Wagtails Childcare Centre. Provide payroll administration for Williams
Community Resource Centre and Willi Wagtails Childcare Centre and provision of scholarships.
HOUSING
Objective: To helps ensure the availability of adequate housing for community needs.
Activities: Management, administration and maintenance of Williams Community Homes,
Sandalwood Court, Wandoo Cottages and JamTree Lane Units
COMMUNITY AMENITIES
Objective: Provision of amenities required by the community.
Activities: Refuse management, protection of environment, maintenance of cemeteries and public
conveniences. Administrative support to Williams - Narrogin Community Landcare Coordinator.
Shire of Williams Page 50
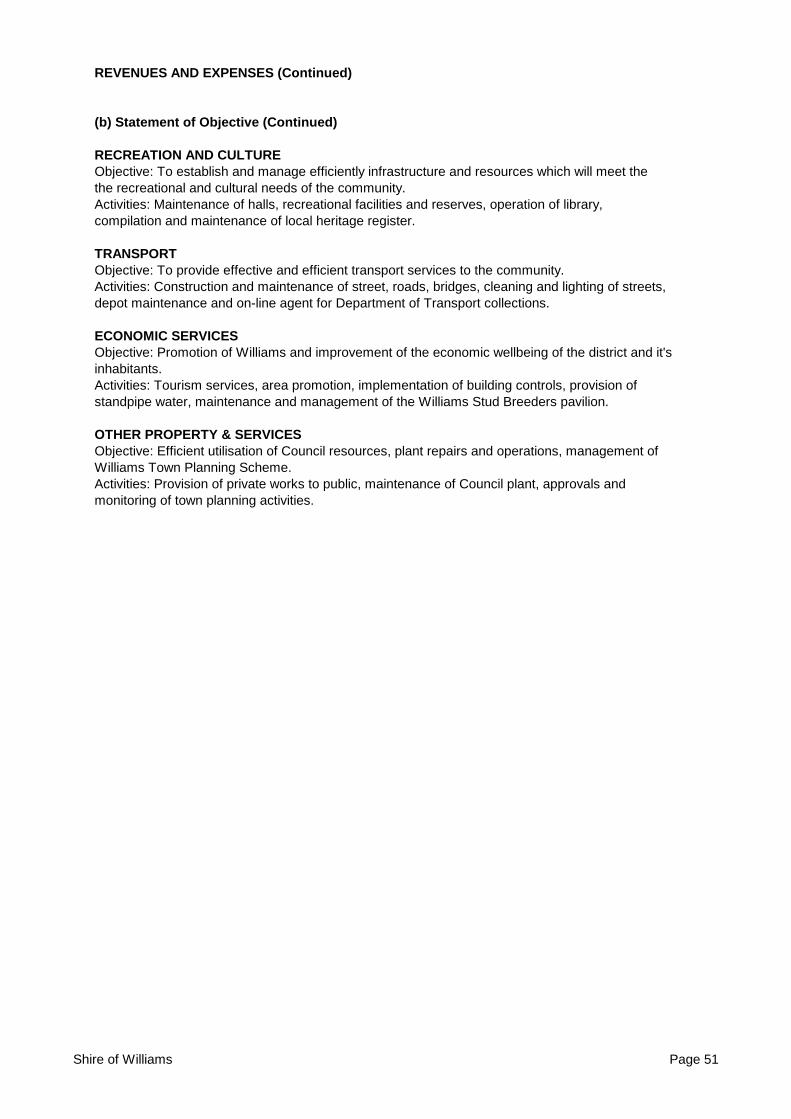
REVENUES AND EXPENSES (Continued)
(b) Statement of Objective (Continued)
RECREATION AND CULTURE
Objective: To establish and manage efficiently infrastructure and resources which will meet the
the recreational and cultural needs of the community.
Activities: Maintenance of halls, recreational facilities and reserves, operation of library,
compilation and maintenance of local heritage register.
TRANSPORT
Objective: To provide effective and efficient transport services to the community.
Activities: Construction and maintenance of street, roads, bridges, cleaning and lighting of streets,
depot maintenance and on-line agent for Department of Transport collections.
ECONOMIC SERVICES
Objective: Promotion of Williams and improvement of the economic wellbeing of the district and it's
inhabitants.
Activities: Tourism services, area promotion, implementation of building controls, provision of
standpipe water, maintenance and management of the Williams Stud Breeders pavilion.
OTHER PROPERTY & SERVICES
Objective: Efficient utilisation of Council resources, plant repairs and operations, management of
Williams Town Planning Scheme.
Activities: Provision of private works to public, maintenance of Council plant, approvals and
monitoring of town planning activities.
Shire of Williams Page 51
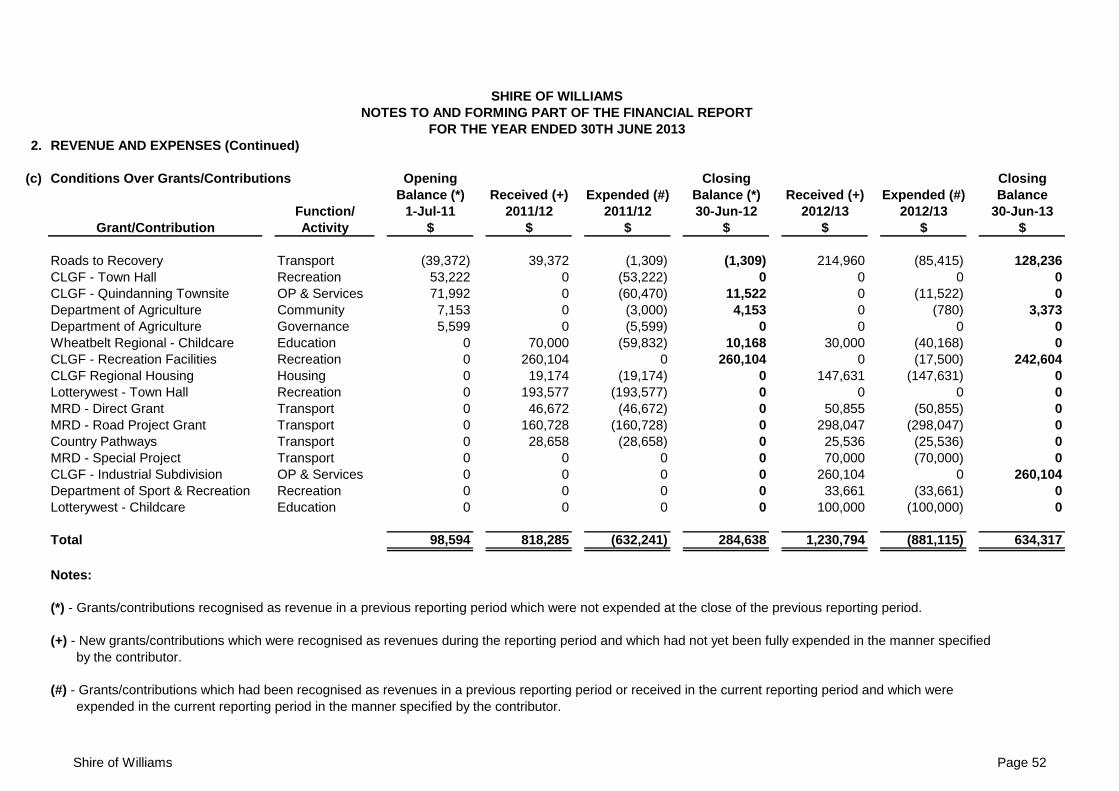
SHIRE OF WILLIAMS
NOTES TO AND FORMING PART OF THE FINANCIAL REPORT
FOR THE YEAR ENDED 30TH JUNE 2013
2. REVENUE AND EXPENSES (Continued)
(c) Conditions Over Grants/Contributions Opening Closing Closing
Balance (*) Received (+) Expended (#) Balance (*) Received (+) Expended (#) Balance
Function/ 1-Jul-11 2011/12 2011/12 30-Jun-12 2012/13 2012/13 30-Jun-13
Grant/Contribution Activity $ $ $ $ $ $ $
Roads to Recovery Transport (39,372) 39,372 (1,309) (1,309) 214,960 (85,415) 128,236
CLGF - Town Hall Recreation 53,222 0 (53,222) 0 0 0 0
CLGF - Quindanning Townsite OP & Services 71,992 0 (60,470) 11,522 0 (11,522) 0
Department of Agriculture Community 7,153 0 (3,000) 4,153 0 (780) 3,373
Department of Agriculture Governance 5,599 0 (5,599) 0 0 0 0
Wheatbelt Regional - Childcare Education 0 70,000 (59,832) 10,168 30,000 (40,168) 0
CLGF - Recreation Facilities Recreation 0 260,104 0 260,104 0 (17,500) 242,604
CLGF Regional Housing Housing 0 19,174 (19,174) 0 147,631 (147,631) 0
Lotterywest - Town Hall Recreation 0 193,577 (193,577) 0 0 0 0
MRD - Direct Grant Transport 0 46,672 (46,672) 0 50,855 (50,855) 0
MRD - Road Project Grant Transport 0 160,728 (160,728) 0 298,047 (298,047) 0
Country Pathways Transport 0 28,658 (28,658) 0 25,536 (25,536) 0
MRD - Special Project Transport 0 0 0 0 70,000 (70,000) 0
CLGF - Industrial Subdivision OP & Services 0 0 0 0 260,104 0 260,104
Department of Sport & Recreation Recreation 0 0 0 0 33,661 (33,661) 0
Lotterywest - Childcare Education 0 0 0 0 100,000 (100,000) 0
Total 98,594 818,285 (632,241) 284,638 1,230,794 (881,115) 634,317
Notes:
(*) - Grants/contributions recognised as revenue in a previous reporting period which were not expended at the close of the previous reporting period.
(+) - New grants/contributions which were recognised as revenues during the reporting period and which had not yet been fully expended in the manner specified
by the contributor.
(#) - Grants/contributions which had been recognised as revenues in a previous reporting period or received in the current reporting period and which were
expended in the current reporting period in the manner specified by the contributor.
Shire of Williams Page 52
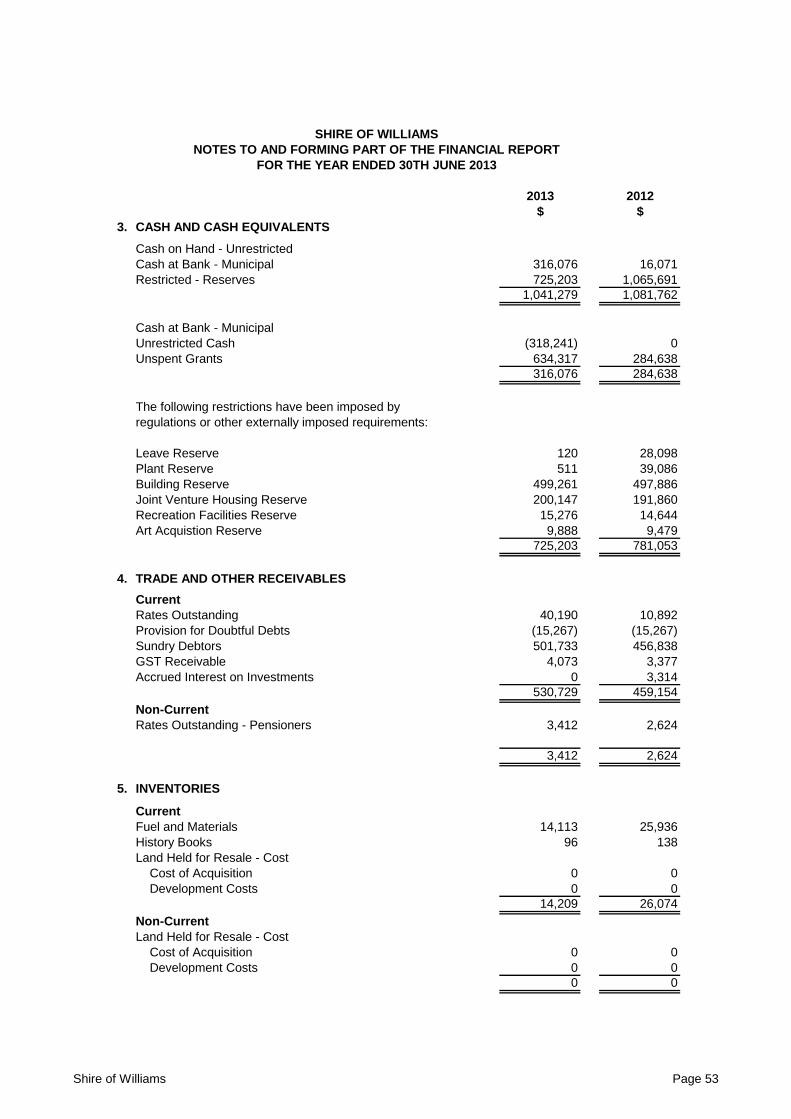
SHIRE OF WILLIAMS
NOTES TO AND FORMING PART OF THE FINANCIAL REPORT
FOR THE YEAR ENDED 30TH JUNE 2013
2013 2012
$ $
3. CASH AND CASH EQUIVALENTS
Cash on Hand - Unrestricted
Cash at Bank - Municipal 316,076 16,071
Restricted - Reserves 725,203 1,065,691
1,041,279 1,081,762
Cash at Bank - Municipal
Unrestricted Cash (318,241) 0
Unspent Grants 634,317 284,638
316,076 284,638
The following restrictions have been imposed by
regulations or other externally imposed requirements:
Leave Reserve 120 28,098
Plant Reserve 511 39,086
Building Reserve 499,261 497,886
Joint Venture Housing Reserve 200,147 191,860
Recreation Facilities Reserve 15,276 14,644
Art Acquistion Reserve 9,888 9,479
725,203 781,053
4. TRADE AND OTHER RECEIVABLES
Current
Rates Outstanding 40,190 10,892
Provision for Doubtful Debts (15,267) (15,267)
Sundry Debtors 501,733 456,838
GST Receivable 4,073 3,377
Accrued Interest on Investments 0 3,314
530,729 459,154
Non-Current
Rates Outstanding - Pensioners 3,412 2,624
3,412 2,624
5. INVENTORIES
Current
Fuel and Materials 14,113 25,936
History Books 96 138
Land Held for Resale - Cost
Cost of Acquisition 0 0
Development Costs 0 0
14,209 26,074
Non-Current
Land Held for Resale - Cost
Cost of Acquisition 0 0
Development Costs 0 0
0 0
Shire of Williams Page 53
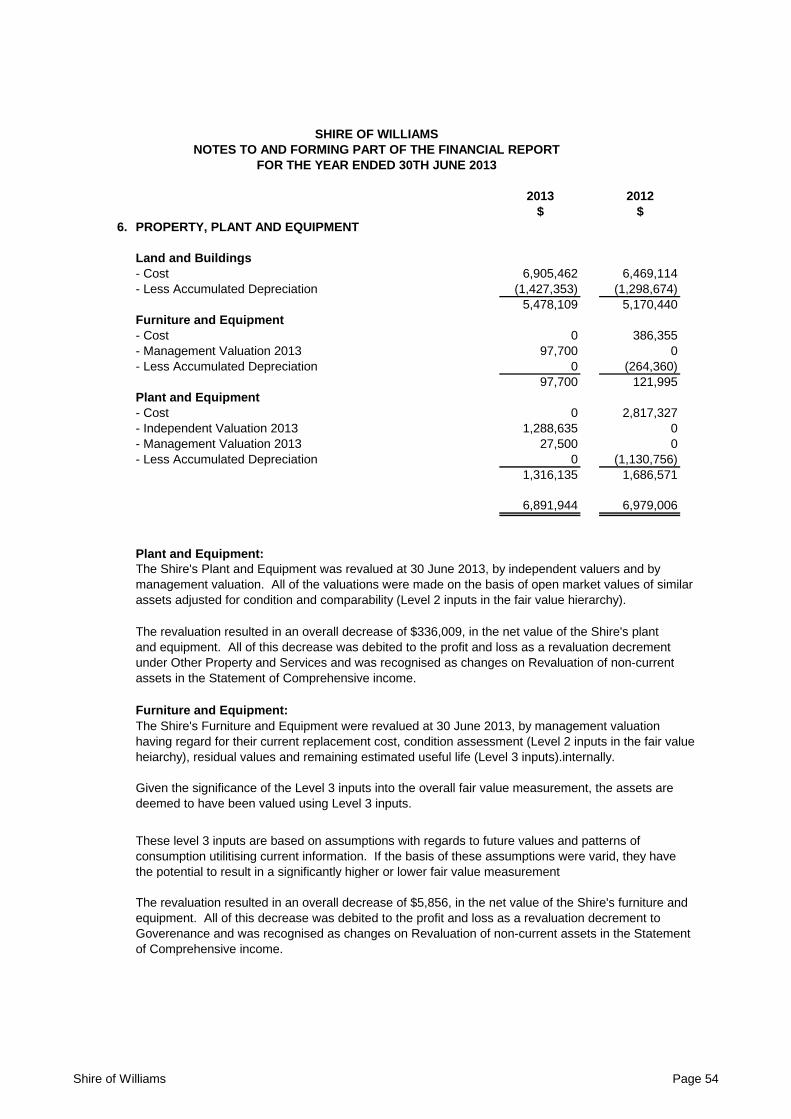
SHIRE OF WILLIAMS
NOTES TO AND FORMING PART OF THE FINANCIAL REPORT
FOR THE YEAR ENDED 30TH JUNE 2013
2013 2012
$ $
6. PROPERTY, PLANT AND EQUIPMENT
Land and Buildings
- Cost 6,905,462 6,469,114
- Less Accumulated Depreciation (1,427,353) (1,298,674)
5,478,109 5,170,440
Furniture and Equipment
- Cost 0 386,355
- Management Valuation 2013 97,700 0
- Less Accumulated Depreciation 0 (264,360)
97,700 121,995
Plant and Equipment
- Cost 0 2,817,327
- Independent Valuation 2013 1,288,635 0
- Management Valuation 2013 27,500 0
- Less Accumulated Depreciation 0 (1,130,756)
1,316,135 1,686,571
6,891,944 6,979,006
Plant and Equipment:
Furniture and Equipment:
The revaluation resulted in an overall decrease of $5,856, in the net value of the Shire's furniture and
equipment. All of this decrease was debited to the profit and loss as a revaluation decrement to
Goverenance and was recognised as changes on Revaluation of non-current assets in the Statement
of Comprehensive income.
The Shire's Plant and Equipment was revalued at 30 June 2013, by independent valuers and by
management valuation. All of the valuations were made on the basis of open market values of similar
assets adjusted for condition and comparability (Level 2 inputs in the fair value hierarchy).
The revaluation resulted in an overall decrease of $336,009, in the net value of the Shire's plant
and equipment. All of this decrease was debited to the profit and loss as a revaluation decrement
under Other Property and Services and was recognised as changes on Revaluation of non-current
assets in the Statement of Comprehensive income.
The Shire's Furniture and Equipment were revalued at 30 June 2013, by management valuation
having regard for their current replacement cost, condition assessment (Level 2 inputs in the fair value
heiarchy), residual values and remaining estimated useful life (Level 3 inputs).internally.
Given the significance of the Level 3 inputs into the overall fair value measurement, the assets are
deemed to have been valued using Level 3 inputs.
These level 3 inputs are based on assumptions with regards to future values and patterns of
consumption utilitising current information. If the basis of these assumptions were varid, they have
the potential to result in a significantly higher or lower fair value measurement
Shire of Williams Page 54
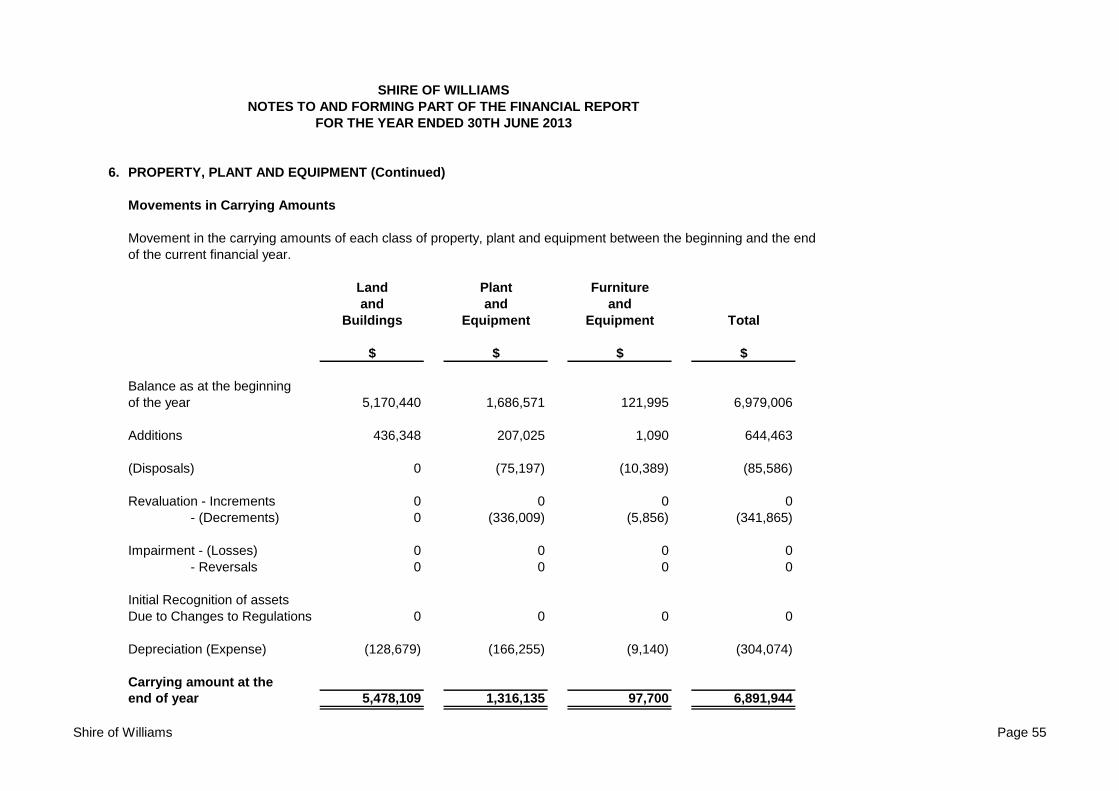
SHIRE OF WILLIAMS
NOTES TO AND FORMING PART OF THE FINANCIAL REPORT
FOR THE YEAR ENDED 30TH JUNE 2013
6. PROPERTY, PLANT AND EQUIPMENT (Continued)
Movements in Carrying Amounts
Movement in the carrying amounts of each class of property, plant and equipment between the beginning and the end
of the current financial year.
Land Plant Furniture
and and and
Buildings Equipment Equipment Total
$ $ $ $
Balance as at the beginning
of the year 5,170,440 1,686,571 121,995 6,979,006
Additions 436,348 207,025 1,090 644,463
(Disposals) 0 (75,197) (10,389) (85,586)
Revaluation - Increments 0 0 0 0
- (Decrements) 0 (336,009) (5,856) (341,865)
Impairment - (Losses) 0 0 0 0
- Reversals 0 0 0 0
Initial Recognition of assets
Due to Changes to Regulations 0 0 0 0
Depreciation (Expense) (128,679) (166,255) (9,140) (304,074)
Carrying amount at the
end of year 5,478,109 1,316,135 97,700 6,891,944
Shire of Williams Page 55
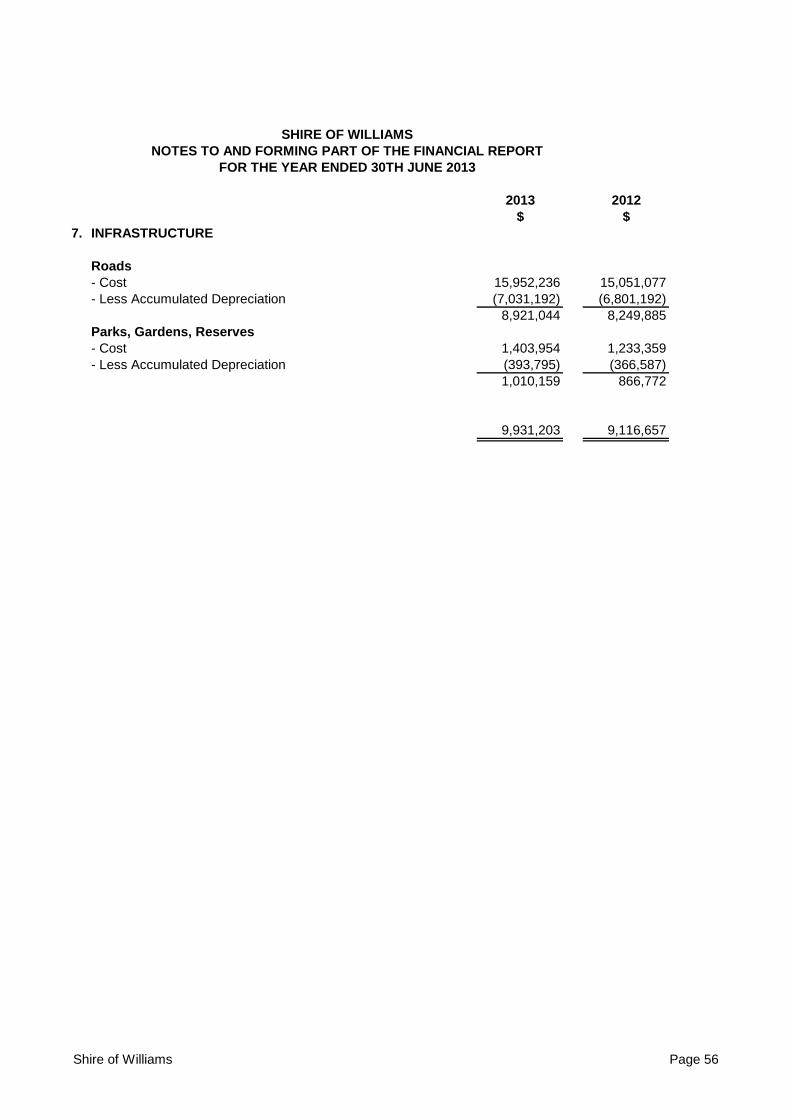
SHIRE OF WILLIAMS
NOTES TO AND FORMING PART OF THE FINANCIAL REPORT
FOR THE YEAR ENDED 30TH JUNE 2013
2013 2012
$ $
7. INFRASTRUCTURE
Roads
- Cost 15,952,236 15,051,077
- Less Accumulated Depreciation (7,031,192) (6,801,192)
8,921,044 8,249,885
Parks, Gardens, Reserves
- Cost 1,403,954 1,233,359
- Less Accumulated Depreciation (393,795) (366,587)
1,010,159 866,772
9,931,203 9,116,657
Shire of Williams Page 56
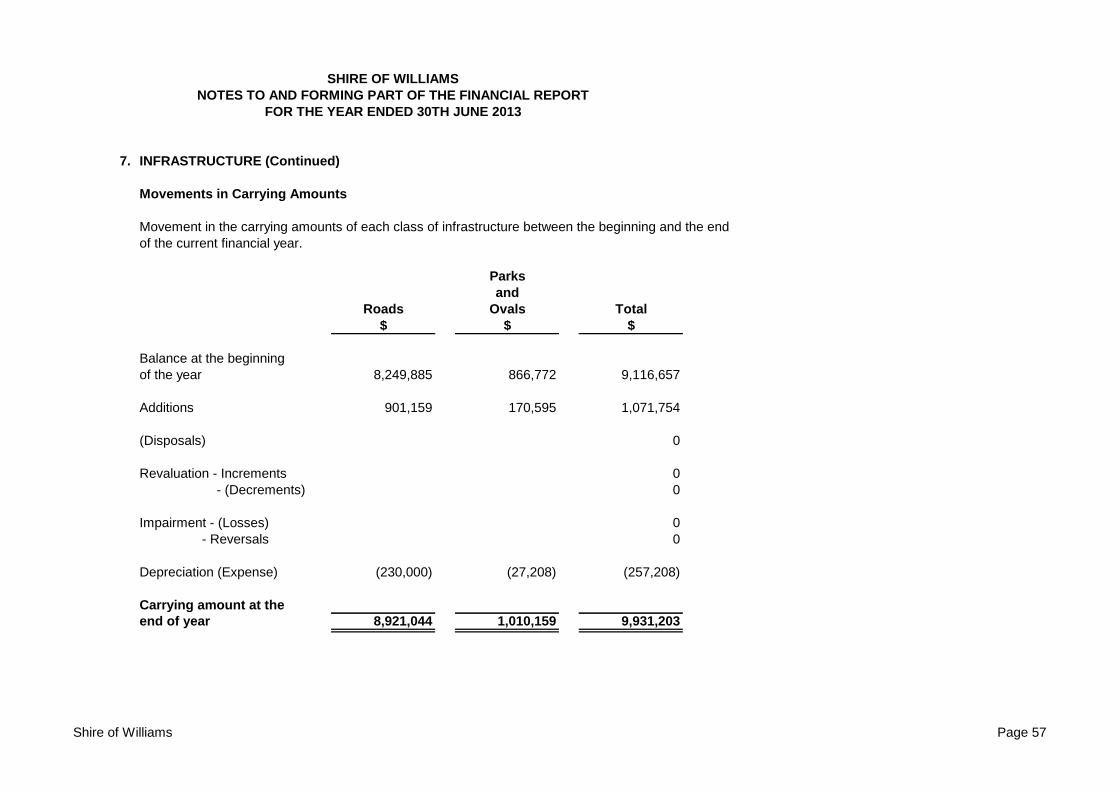
SHIRE OF WILLIAMS
NOTES TO AND FORMING PART OF THE FINANCIAL REPORT
FOR THE YEAR ENDED 30TH JUNE 2013
7. INFRASTRUCTURE (Continued)
Movements in Carrying Amounts
Movement in the carrying amounts of each class of infrastructure between the beginning and the end
of the current financial year.
Parks
and
Roads Ovals Total
$ $ $
Balance at the beginning
of the year 8,249,885 866,772 9,116,657
Additions 901,159 170,595 1,071,754
(Disposals) 0
Revaluation - Increments 0
- (Decrements) 0
Impairment - (Losses) 0
- Reversals 0
Depreciation (Expense) (230,000) (27,208) (257,208)
Carrying amount at the
end of year 8,921,044 1,010,159 9,931,203
Shire of Williams Page 57
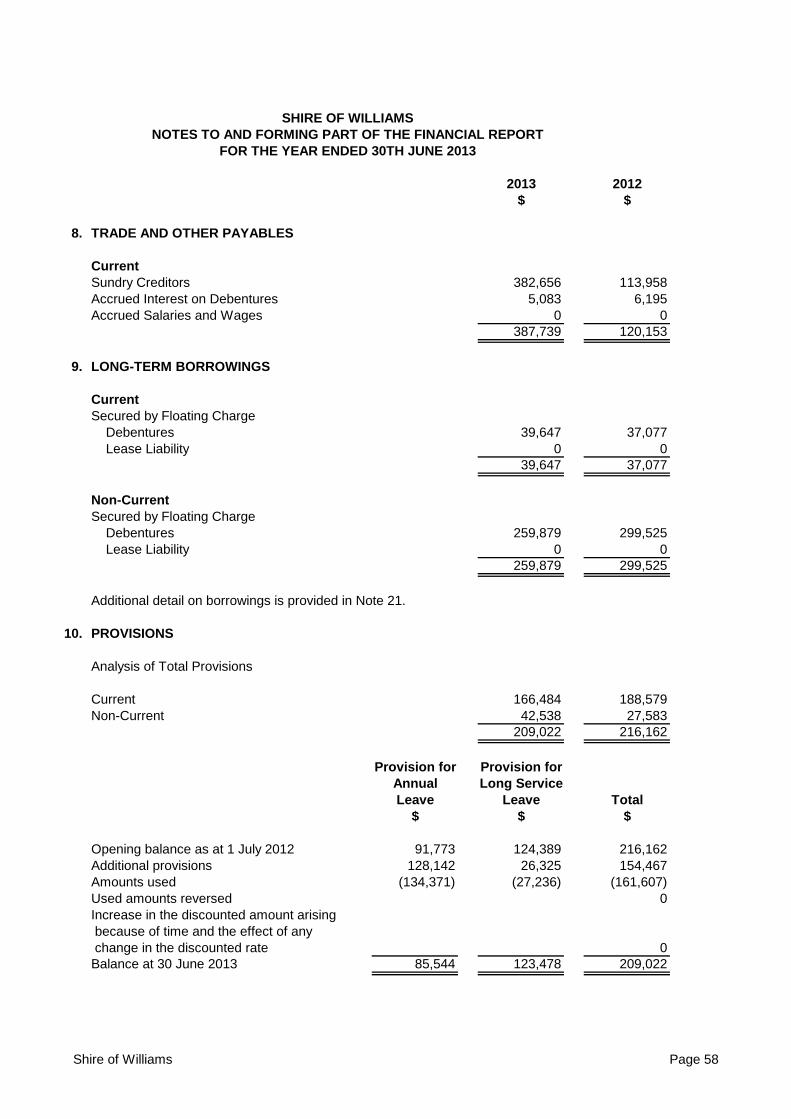
SHIRE OF WILLIAMS
NOTES TO AND FORMING PART OF THE FINANCIAL REPORT
FOR THE YEAR ENDED 30TH JUNE 2013
2013 2012
$ $
8. TRADE AND OTHER PAYABLES
Current
Sundry Creditors 382,656 113,958
Accrued Interest on Debentures 5,083 6,195
Accrued Salaries and Wages 0 0
387,739 120,153
9. LONG-TERM BORROWINGS
Current
Secured by Floating Charge
Debentures 39,647 37,077
Lease Liability 0 0
39,647 37,077
Non-Current
Secured by Floating Charge
Debentures 259,879 299,525
Lease Liability 0 0
259,879 299,525
Additional detail on borrowings is provided in Note 21.
10. PROVISIONS
Analysis of Total Provisions
Current 166,484 188,579
Non-Current 42,538 27,583
209,022 216,162
Provision for Provision for
Annual Long Service
Leave Leave Total
$ $ $
Opening balance as at 1 July 2012 91,773 124,389 216,162
Additional provisions 128,142 26,325 154,467
Amounts used (134,371) (27,236) (161,607)
Used amounts reversed 0
Increase in the discounted amount arising
because of time and the effect of any
change in the discounted rate 0
Balance at 30 June 2013 85,544 123,478 209,022
Shire of Williams Page 58
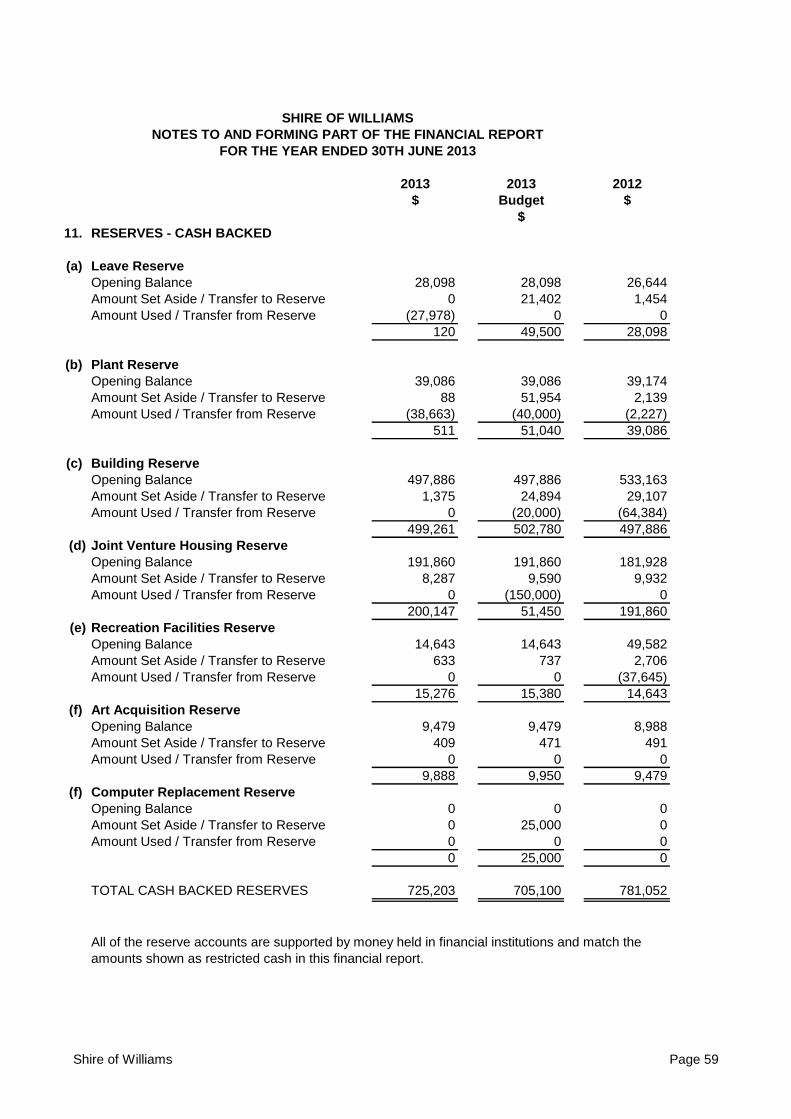
SHIRE OF WILLIAMS
NOTES TO AND FORMING PART OF THE FINANCIAL REPORT
FOR THE YEAR ENDED 30TH JUNE 2013
2013 2013 2012
$ Budget $
$
11. RESERVES - CASH BACKED
(a) Leave Reserve
Opening Balance 28,098 28,098 26,644
Amount Set Aside / Transfer to Reserve 0 21,402 1,454
Amount Used / Transfer from Reserve (27,978) 0 0
120 49,500 28,098
(b) Plant Reserve
Opening Balance 39,086 39,086 39,174
Amount Set Aside / Transfer to Reserve 88 51,954 2,139
Amount Used / Transfer from Reserve (38,663) (40,000) (2,227)
511 51,040 39,086
(c) Building Reserve
Opening Balance 497,886 497,886 533,163
Amount Set Aside / Transfer to Reserve 1,375 24,894 29,107
Amount Used / Transfer from Reserve 0 (20,000) (64,384)
499,261 502,780 497,886
(d) Joint Venture Housing Reserve
Opening Balance 191,860 191,860 181,928
Amount Set Aside / Transfer to Reserve 8,287 9,590 9,932
Amount Used / Transfer from Reserve 0 (150,000) 0
200,147 51,450 191,860
(e) Recreation Facilities Reserve
Opening Balance 14,643 14,643 49,582
Amount Set Aside / Transfer to Reserve 633 737 2,706
Amount Used / Transfer from Reserve 0 0 (37,645)
15,276 15,380 14,643
(f) Art Acquisition Reserve
Opening Balance 9,479 9,479 8,988
Amount Set Aside / Transfer to Reserve 409 471 491
Amount Used / Transfer from Reserve 0 0 0
9,888 9,950 9,479
(f) Computer Replacement Reserve
Opening Balance 0 0 0
Amount Set Aside / Transfer to Reserve 0 25,000 0
Amount Used / Transfer from Reserve 0 0 0
0 25,000 0
TOTAL CASH BACKED RESERVES 725,203 705,100 781,052
All of the reserve accounts are supported by money held in financial institutions and match the
amounts shown as restricted cash in this financial report.
Shire of Williams Page 59
In accordance with council resolutions in relation to each reserve account, the purpose for which
the funds are set aside are as follows:
Leave Reserve
- to be used to fund annual and long service leave requirements.
Plant Reserve
- to be used for the purchase of plant items as per Council's Plant Replacement Program.
Building Reserve
- to be used for the construction, acquisition and major asset maintenance of buildings.
Joint Venture Housing
- to be used to finance long term maintenance requirements of Sandalwood Count and Wandoo Crt
and to finance new joint venture housing construction
Recreation Facilities Reserve
- to be used to finance capital improvements of existing recreation facilities and to fund
acquistion of future recreation facilities
Art Acquisition Reserve
- to be used for the purchase of art pieces for the Williams Art Collection
Computer Replacement Reserve
- to be used to ensure that the administration computer system is maintained
The Leave, Plant, Recreation Facilities, Art Acquisition and Computer Reserves are not expected
to be used within a set period as further transfers to the reserve accounts are expected as funds
are utilised.
The Building and Joint Venture Reserves are expected to be utilised in 2013/2014.
Shire of Williams Page 60
SHIRE OF WILLIAMS
NOTES TO AND FORMING PART OF THE FINANCIAL REPORT
FOR THE YEAR ENDED 30TH JUNE 2013
12. RESERVES - ASSET REVALUATION 2013 2012
$ $
Asset revaluation reserves have arisen on revaluation
of the following classes of non-current assets:
(a) Land and Buildings
Opening balance 891,189 891,189
Revaluation Increment 0 0
Revaluation Decrement 0 0
891,189 891,189
(b) Plant and Equipment
Opening Balance 22,398 22,398
Revaluation Increment 0 0
Revaluation Decrement 0 0
22,398 22,398
TOTAL ASSET REVALUATION RESERVES 913,587 913,587
Shire of Williams Page 61
SHIRE OF WILLIAMS
NOTES TO AND FORMING PART OF THE FINANCIAL REPORT
FOR THE YEAR ENDED 30TH JUNE 2013
13. NOTES TO THE STATEMENT OF CASH FLOWS
(a) Reconciliation of Cash
For the purposes of the statement of cash flows, cash includes cash and cash equivalents,
net of outstanding bank overdrafts. Cash at the end of the reporting period is reconciled to the
related items in the statement of financial position as follows:
2013 2013 2012
$ Budget $
$
Cash and Cash Equivalents 1,041,279 706,120 1,081,762
(b) Reconciliation of Net Cash Provided By
Operating Activities to Net Result
Net Result 524,128 1,420,315 705,828
Amortisation
Depreciation 561,282 568,500 566,511
(Profit)/Loss on Sale of Asset 35,284 38,840 (31,227)
(Increase)/Decrease in Receivables (72,360) 454,566 160,822
(Increase)/Decrease in Inventories 11,865 16,074 (6,985)
Increase/(Decrease) in Payables 267,586 (53,556) (492,598)
Increase/(Decrease) in Employee Provisions (7,140) 0 50,118
Grants/Contributions for 0 0 0
the Development of Assets (1,230,794) (1,923,505) (818,285)
Non-Current Assets recognised due to
changes in legislative requirements 341,865 0 0
Net Cash from Operating Activities 431,716 521,234 134,184
(c) Undrawn Borrowing Facilities
Credit Standby Arrangements
Bank Overdraft limit 10,000 100,000
Bank Overdraft at Balance Date 0 0
Credit Card limit 20,000 20,000
Credit Card Balance at Balance Date 0 0
Total Amount of Credit Unused 30,000 120,000
Loan Facilities
Loan Facilities - Current 39,647 37,077
Loan Facilities - Non-Current 259,879 299,525
Total Facilities in Use at Balance Date 299,526 336,602
Unused Loan Facilities at Balance Date 0 0
Shire of Williams Page 62
SHIRE OF WILLIAMS
NOTES TO AND FORMING PART OF THE FINANCIAL REPORT
FOR THE YEAR ENDED 30TH JUNE 2013
14. CONTINGENT LIABILITIES
There were no contingent liabilities as at 30 June 2013
15. CAPITAL AND LEASING COMMITMENTS
(a) Finance Lease Commitments
There were no financial lease commitments at 30 June 2013
(b) Operating Lease Commitments
There were no operating lease commitments at 30 June 2013
2013 2012
(c) Capital Expenditure Commitments $ $
Contracted for:
- capital expenditure projects 867,720 0
- plant & equipment purchases 0 0
Payable:
- not later than one year 867,720 0
The capital expenditure project outstanding at the end of the current reporting period represents
the construction of the 4 x Aged Care Units located on New Street.
Shire of Williams Page 63
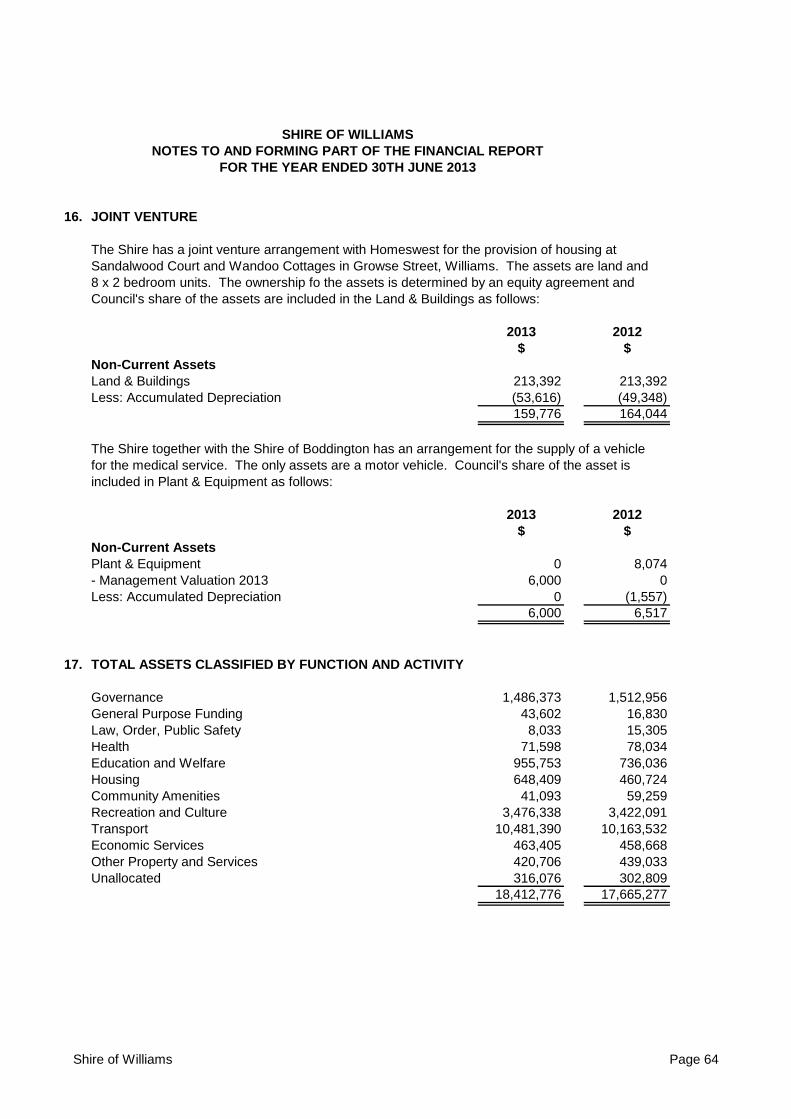
SHIRE OF WILLIAMS
NOTES TO AND FORMING PART OF THE FINANCIAL REPORT
FOR THE YEAR ENDED 30TH JUNE 2013
16. JOINT VENTURE
The Shire has a joint venture arrangement with Homeswest for the provision of housing at
Sandalwood Court and Wandoo Cottages in Growse Street, Williams. The assets are land and
8 x 2 bedroom units. The ownership fo the assets is determined by an equity agreement and
Council's share of the assets are included in the Land & Buildings as follows:
2013 2012
$ $
Non-Current Assets
Land & Buildings 213,392 213,392
Less: Accumulated Depreciation (53,616) (49,348)
159,776 164,044
The Shire together with the Shire of Boddington has an arrangement for the supply of a vehicle
for the medical service. The only assets are a motor vehicle. Council's share of the asset is
included in Plant & Equipment as follows:
2013 2012
$ $
Non-Current Assets
Plant & Equipment 0 8,074
- Management Valuation 2013 6,000 0
Less: Accumulated Depreciation 0 (1,557)
6,000 6,517
17. TOTAL ASSETS CLASSIFIED BY FUNCTION AND ACTIVITY
Governance 1,486,373 1,512,956
General Purpose Funding 43,602 16,830
Law, Order, Public Safety 8,033 15,305
Health 71,598 78,034
Education and Welfare 955,753 736,036
Housing 648,409 460,724
Community Amenities 41,093 59,259
Recreation and Culture 3,476,338 3,422,091
Transport 10,481,390 10,163,532
Economic Services 463,405 458,668
Other Property and Services 420,706 439,033
Unallocated 316,076 302,809
18,412,776 17,665,277
Shire of Williams Page 64
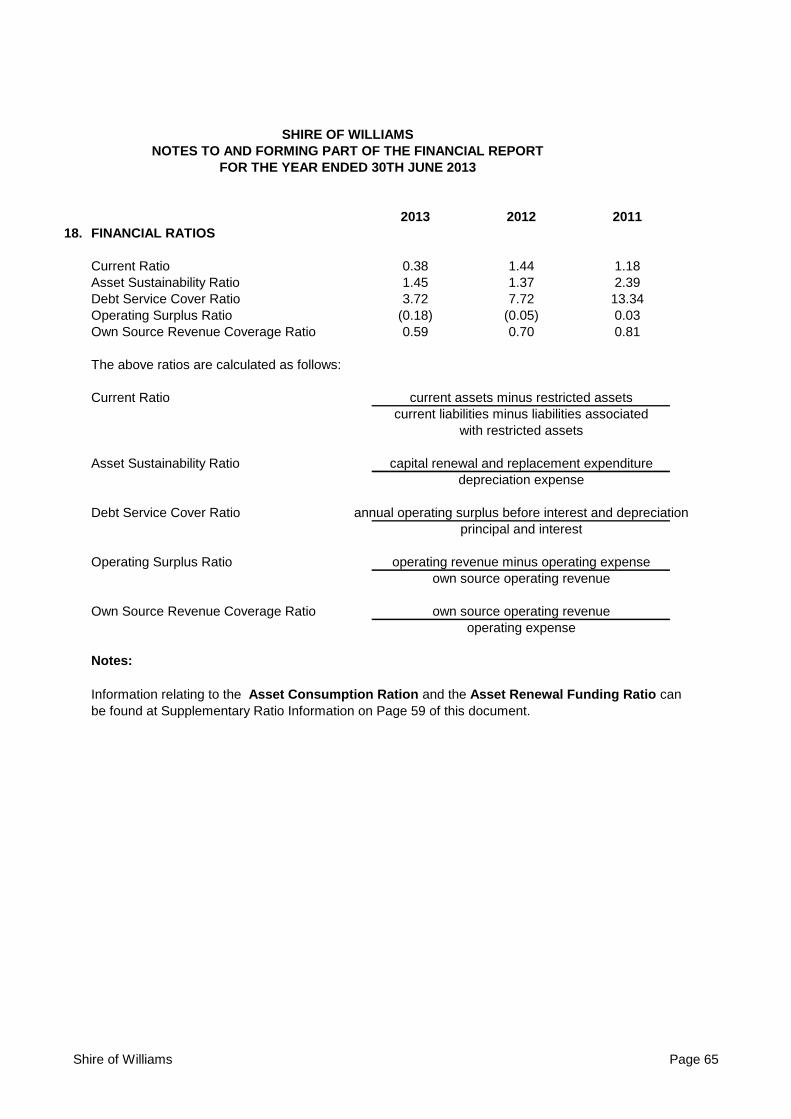
SHIRE OF WILLIAMS
NOTES TO AND FORMING PART OF THE FINANCIAL REPORT
FOR THE YEAR ENDED 30TH JUNE 2013
2013 2012 2011
18. FINANCIAL RATIOS
Current Ratio 0.38 1.44 1.18
Asset Sustainability Ratio 1.45 1.37 2.39
Debt Service Cover Ratio 3.72 7.72 13.34
Operating Surplus Ratio (0.18) (0.05) 0.03
Own Source Revenue Coverage Ratio 0.59 0.70 0.81
The above ratios are calculated as follows:
Current Ratio current assets minus restricted assets
current liabilities minus liabilities associated
with restricted assets
Asset Sustainability Ratio capital renewal and replacement expenditure
depreciation expense
Debt Service Cover Ratio annual operating surplus before interest and depreciation
principal and interest
Operating Surplus Ratio operating revenue minus operating expense
own source operating revenue
Own Source Revenue Coverage Ratio own source operating revenue
operating expense
Notes:
Information relating to the Asset Consumption Ration and the Asset Renewal Funding Ratio can
be found at Supplementary Ratio Information on Page 59 of this document.
Shire of Williams Page 65
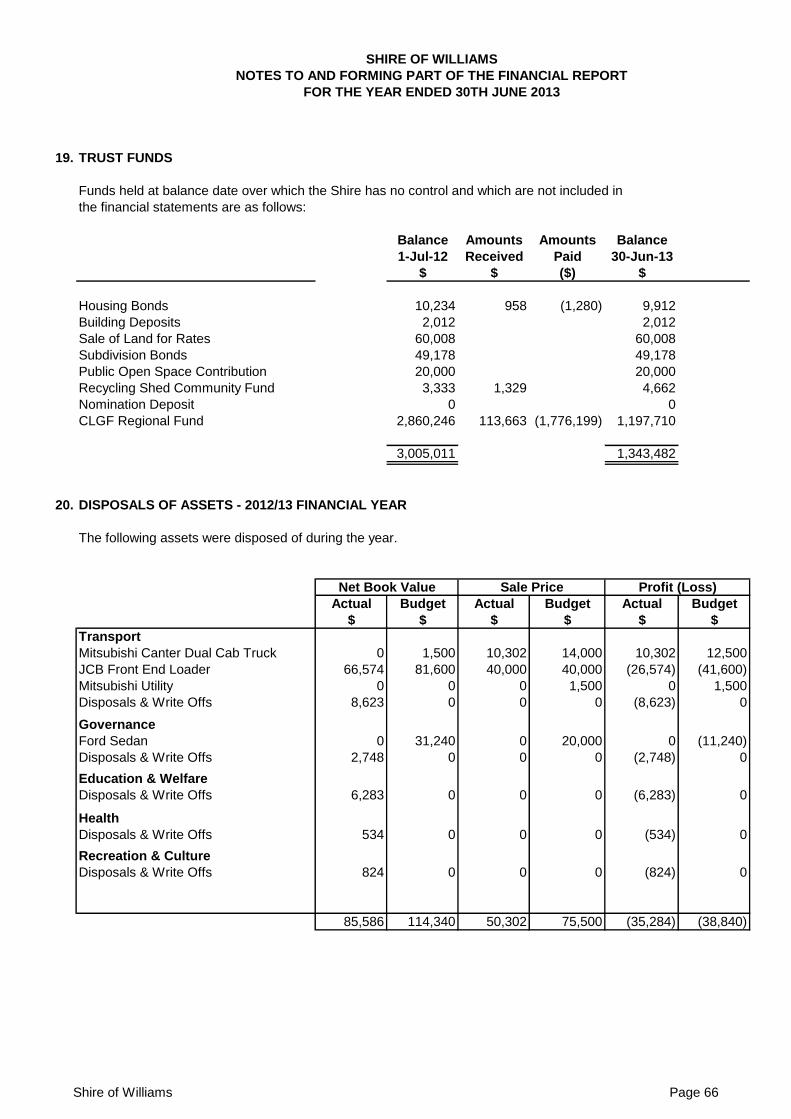
SHIRE OF WILLIAMS
NOTES TO AND FORMING PART OF THE FINANCIAL REPORT
FOR THE YEAR ENDED 30TH JUNE 2013
19. TRUST FUNDS
Funds held at balance date over which the Shire has no control and which are not included in
the financial statements are as follows:
Balance Amounts Amounts Balance
1-Jul-12 Received Paid 30-Jun-13
$ $ ($) $
Housing Bonds 10,234 958 (1,280) 9,912
Building Deposits 2,012 2,012
Sale of Land for Rates 60,008 60,008
Subdivision Bonds 49,178 49,178
Public Open Space Contribution 20,000 20,000
Recycling Shed Community Fund 3,333 1,329 4,662
Nomination Deposit 0 0
CLGF Regional Fund 2,860,246 113,663 (1,776,199) 1,197,710
3,005,011 1,343,482
20. DISPOSALS OF ASSETS - 2012/13 FINANCIAL YEAR
The following assets were disposed of during the year.
Net Book Value Sale Price Profit (Loss)
Actual Budget Actual Budget Actual Budget
$ $ $ $ $ $
Transport
Mitsubishi Canter Dual Cab Truck 0 1,500 10,302 14,000 10,302 12,500
JCB Front End Loader 66,574 81,600 40,000 40,000 (26,574) (41,600)
Mitsubishi Utility 0 0 0 1,500 0 1,500
Disposals & Write Offs 8,623 0 0 0 (8,623) 0
Governance
Ford Sedan 0 31,240 0 20,000 0 (11,240)
Disposals & Write Offs 2,748 0 0 0 (2,748) 0
Education & Welfare
Disposals & Write Offs 6,283 0 0 0 (6,283) 0
Health
Disposals & Write Offs 534 0 0 0 (534) 0
Recreation & Culture
Disposals & Write Offs 824 0 0 0 (824) 0
85,586 114,340 50,302 75,500 (35,284) (38,840)
Shire of Williams Page 66
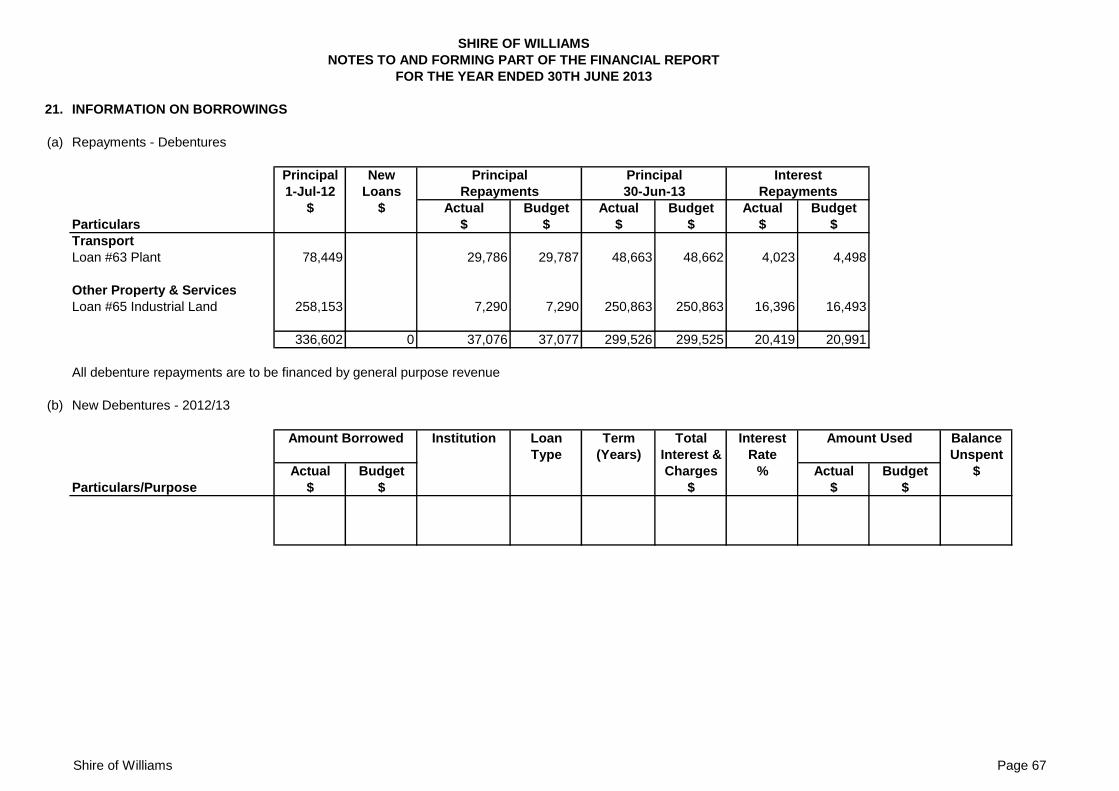
SHIRE OF WILLIAMS
NOTES TO AND FORMING PART OF THE FINANCIAL REPORT
FOR THE YEAR ENDED 30TH JUNE 2013
21. INFORMATION ON BORROWINGS
(a) Repayments - Debentures
Principal New Principal Principal Interest
1-Jul-12 Loans Repayments 30-Jun-13 Repayments
$ $ Actual Budget Actual Budget Actual Budget
Particulars $ $ $ $ $ $
Transport
Loan #63 Plant 78,449 29,786 29,787 48,663 48,662 4,023 4,498
Other Property & Services
Loan #65 Industrial Land 258,153 7,290 7,290 250,863 250,863 16,396 16,493
336,602 0 37,076 37,077 299,526 299,525 20,419 20,991
All debenture repayments are to be financed by general purpose revenue
(b) New Debentures - 2012/13
Amount Borrowed Institution Loan Term Total Interest Amount Used Balance
Type (Years) Interest & Rate Unspent
Actual Budget Charges % Actual Budget $
Particulars/Purpose $ $ $ $ $
Shire of Williams Page 67
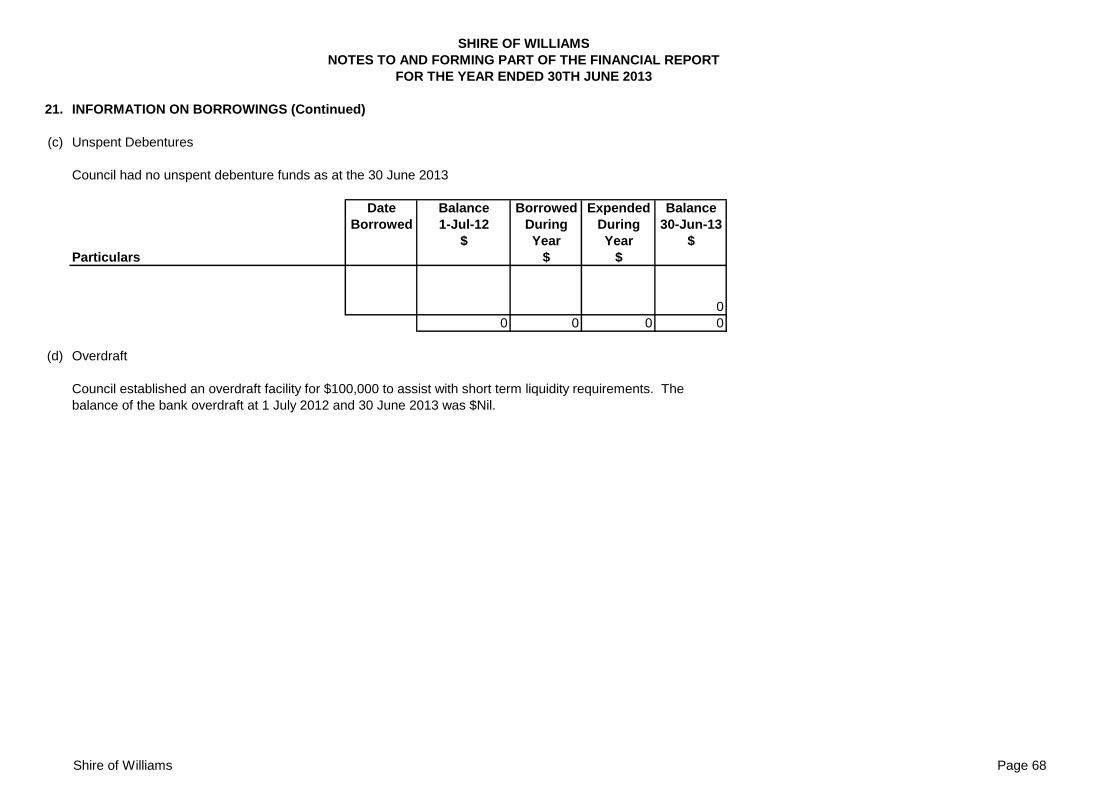
SHIRE OF WILLIAMS
NOTES TO AND FORMING PART OF THE FINANCIAL REPORT
FOR THE YEAR ENDED 30TH JUNE 2013
21. INFORMATION ON BORROWINGS (Continued)
(c) Unspent Debentures
Council had no unspent debenture funds as at the 30 June 2013
Date Balance Borrowed Expended Balance
Borrowed 1-Jul-12 During During 30-Jun-13
$ Year Year $
Particulars $ $
0
0 0 0 0
(d) Overdraft
Council established an overdraft facility for $100,000 to assist with short term liquidity requirements. The
balance of the bank overdraft at 1 July 2012 and 30 June 2013 was $Nil.
Shire of Williams Page 68
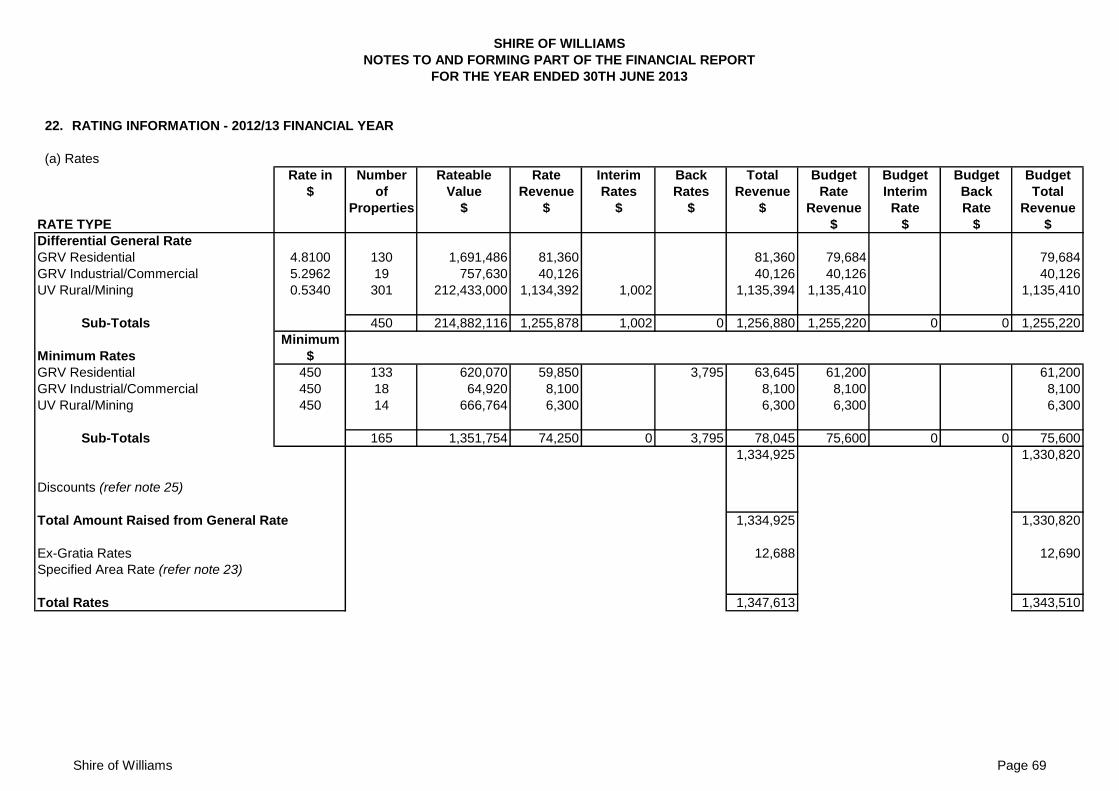
SHIRE OF WILLIAMS
NOTES TO AND FORMING PART OF THE FINANCIAL REPORT
FOR THE YEAR ENDED 30TH JUNE 2013
22. RATING INFORMATION - 2012/13 FINANCIAL YEAR
(a) Rates
Rate in Number Rateable Rate Interim Back Total Budget Budget Budget Budget
$ of Value Revenue Rates Rates Revenue Rate Interim Back Total
Properties $ $ $ $ $ Revenue Rate Rate Revenue
RATE TYPE $ $ $ $
Differential General Rate
GRV Residential 4.8100 130 1,691,486 81,360 81,360 79,684 79,684
GRV Industrial/Commercial 5.2962 19 757,630 40,126 40,126 40,126 40,126
UV Rural/Mining 0.5340 301 212,433,000 1,134,392 1,002 1,135,394 1,135,410 1,135,410
Sub-Totals 450 214,882,116 1,255,878 1,002 0 1,256,880 1,255,220 0 0 1,255,220
Minimum
Minimum Rates $
GRV Residential 450 133 620,070 59,850 3,795 63,645 61,200 61,200
GRV Industrial/Commercial 450 18 64,920 8,100 8,100 8,100 8,100
UV Rural/Mining 450 14 666,764 6,300 6,300 6,300 6,300
Sub-Totals 165 1,351,754 74,250 0 3,795 78,045 75,600 0 0 75,600
1,334,925 1,330,820
Discounts (refer note 25)
Total Amount Raised from General Rate 1,334,925 1,330,820
Ex-Gratia Rates 12,688 12,690
Specified Area Rate (refer note 23)
Total Rates 1,347,613 1,343,510
Shire of Williams Page 69
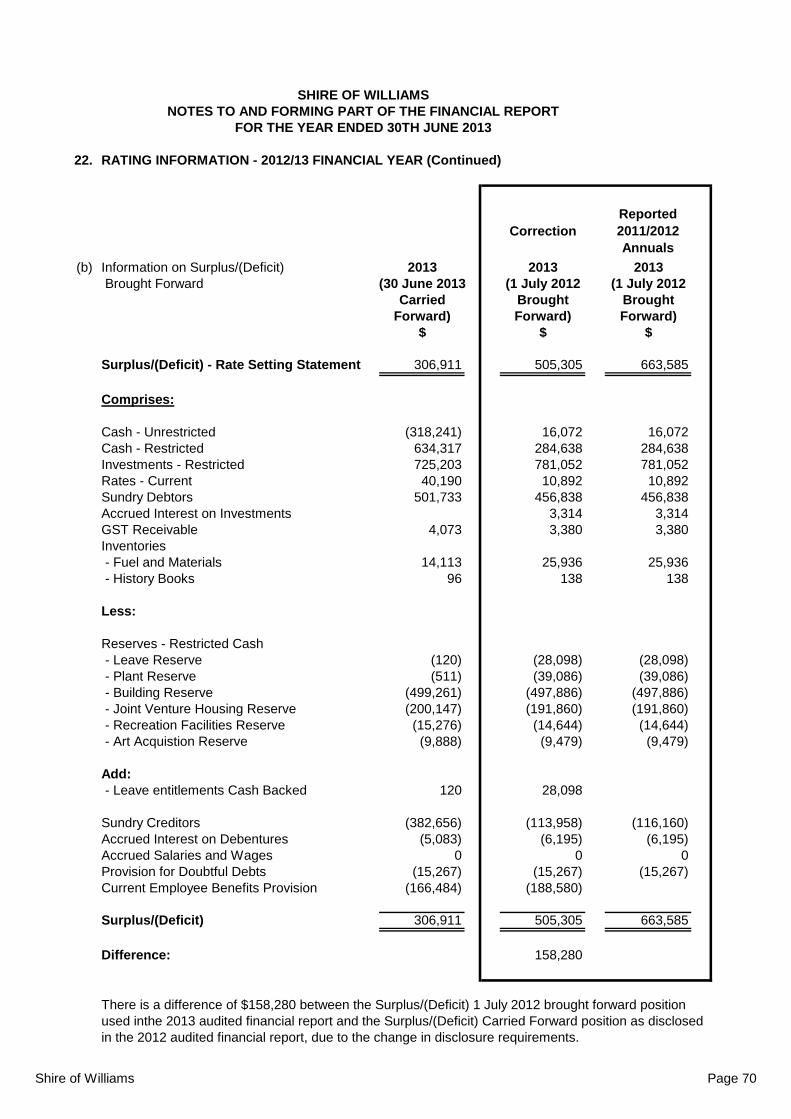
SHIRE OF WILLIAMS
NOTES TO AND FORMING PART OF THE FINANCIAL REPORT
FOR THE YEAR ENDED 30TH JUNE 2013
22. RATING INFORMATION - 2012/13 FINANCIAL YEAR (Continued)
Correction
Reported
2011/2012
Annuals
(b) Information on Surplus/(Deficit) 2013 2013 2013
Brought Forward (30 June 2013 (1 July 2012 (1 July 2012
Carried Brought Brought
Forward) Forward) Forward)
$ $ $
Surplus/(Deficit) - Rate Setting Statement 306,911 505,305 663,585
Comprises:
Cash - Unrestricted (318,241) 16,072 16,072
Cash - Restricted 634,317 284,638 284,638
Investments - Restricted 725,203 781,052 781,052
Rates - Current 40,190 10,892 10,892
Sundry Debtors 501,733 456,838 456,838
Accrued Interest on Investments 3,314 3,314
GST Receivable 4,073 3,380 3,380
Inventories
- Fuel and Materials 14,113 25,936 25,936
- History Books 96 138 138
Less:
Reserves - Restricted Cash
- Leave Reserve (120) (28,098) (28,098)
- Plant Reserve (511) (39,086) (39,086)
- Building Reserve (499,261) (497,886) (497,886)
- Joint Venture Housing Reserve (200,147) (191,860) (191,860)
- Recreation Facilities Reserve (15,276) (14,644) (14,644)
- Art Acquistion Reserve (9,888) (9,479) (9,479)
Add:
- Leave entitlements Cash Backed 120 28,098
Sundry Creditors (382,656) (113,958) (116,160)
Accrued Interest on Debentures (5,083) (6,195) (6,195)
Accrued Salaries and Wages 0 0 0
Provision for Doubtful Debts (15,267) (15,267) (15,267)
Current Employee Benefits Provision (166,484) (188,580)
Surplus/(Deficit) 306,911 505,305 663,585
Difference: 158,280
There is a difference of $158,280 between the Surplus/(Deficit) 1 July 2012 brought forward position
used inthe 2013 audited financial report and the Surplus/(Deficit) Carried Forward position as disclosed
in the 2012 audited financial report, due to the change in disclosure requirements.
Shire of Williams Page 70
SHIRE OF WILLIAMS
NOTES TO AND FORMING PART OF THE FINANCIAL REPORT
FOR THE YEAR ENDED 30TH JUNE 2013
23. SPECIFIED AREA RATE - 2012/13 FINANCIAL YEAR
The Shire of Williams did not raise specified area rates in 2012/2013.
24. SERVICE CHARGES - 2012/13 FINANCIAL YEAR
The Shire of Williams did not raise any service charges for 2012/2013.
Shire of Williams Page 71
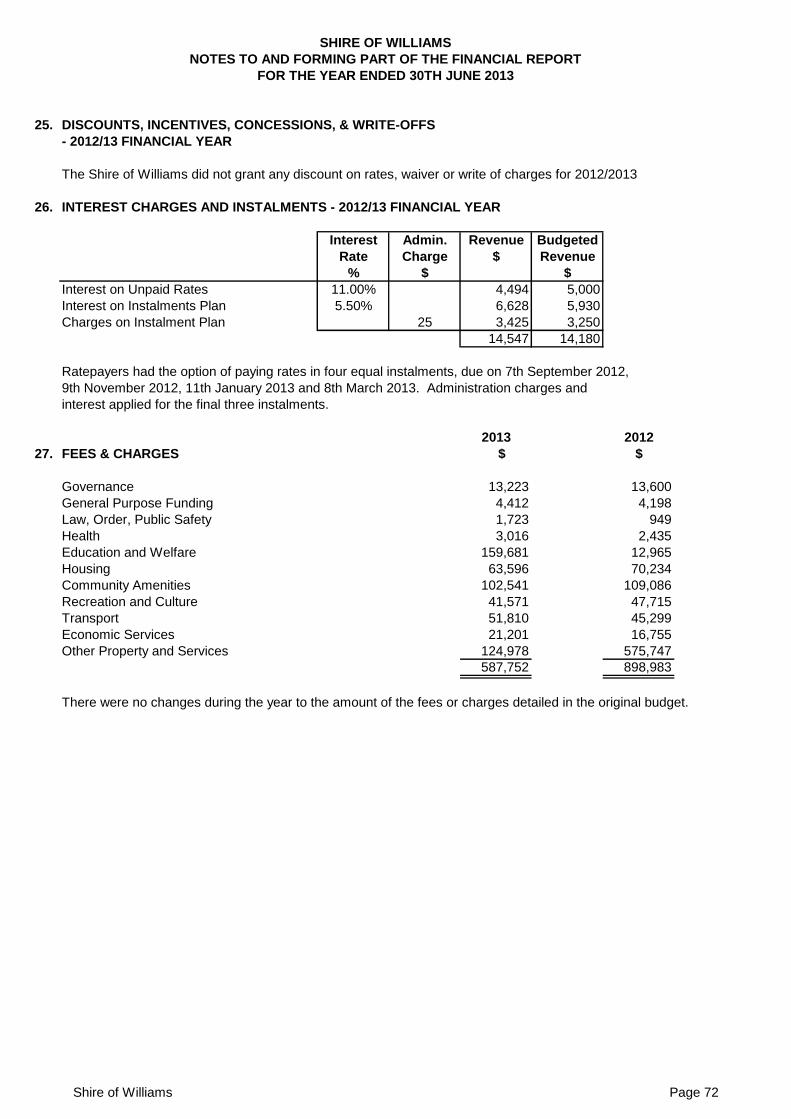
SHIRE OF WILLIAMS
NOTES TO AND FORMING PART OF THE FINANCIAL REPORT
FOR THE YEAR ENDED 30TH JUNE 2013
25. DISCOUNTS, INCENTIVES, CONCESSIONS, & WRITE-OFFS
- 2012/13 FINANCIAL YEAR
The Shire of Williams did not grant any discount on rates, waiver or write of charges for 2012/2013
26. INTEREST CHARGES AND INSTALMENTS - 2012/13 FINANCIAL YEAR
Interest Admin. Revenue Budgeted
Rate Charge $ Revenue
% $ $
Interest on Unpaid Rates 11.00% 4,494 5,000
Interest on Instalments Plan 5.50% 6,628 5,930
Charges on Instalment Plan 25 3,425 3,250
14,547 14,180
Ratepayers had the option of paying rates in four equal instalments, due on 7th September 2012,
9th November 2012, 11th January 2013 and 8th March 2013. Administration charges and
interest applied for the final three instalments.
2013 2012
27. FEES & CHARGES $ $
Governance 13,223 13,600
General Purpose Funding 4,412 4,198
Law, Order, Public Safety 1,723 949
Health 3,016 2,435
Education and Welfare 159,681 12,965
Housing 63,596 70,234
Community Amenities 102,541 109,086
Recreation and Culture 41,571 47,715
Transport 51,810 45,299
Economic Services 21,201 16,755
Other Property and Services 124,978 575,747
587,752 898,983
There were no changes during the year to the amount of the fees or charges detailed in the original budget.
Shire of Williams Page 72
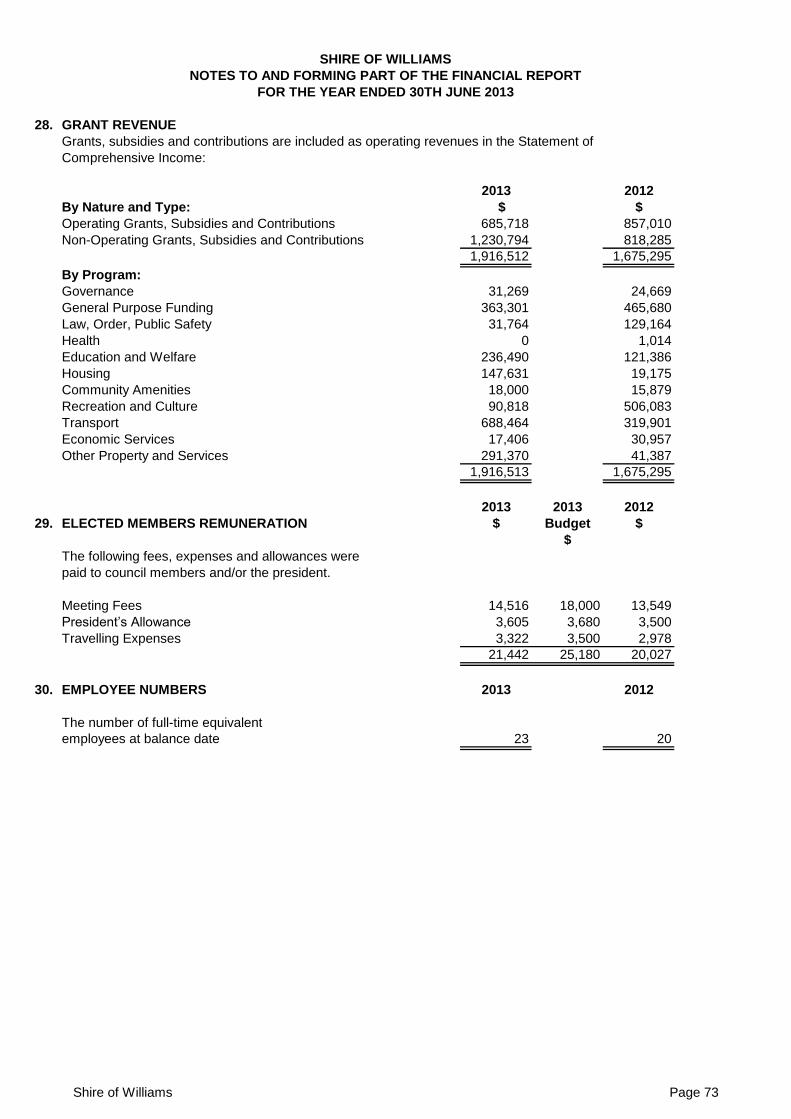
SHIRE OF WILLIAMS
NOTES TO AND FORMING PART OF THE FINANCIAL REPORT
FOR THE YEAR ENDED 30TH JUNE 2013
28. GRANT REVENUE
Grants, subsidies and contributions are included as operating revenues in the Statement of
Comprehensive Income:
2013 2012
By Nature and Type: $ $
Operating Grants, Subsidies and Contributions 685,718 857,010
Non-Operating Grants, Subsidies and Contributions 1,230,794 818,285
1,916,512 1,675,295
By Program:
Governance 31,269 24,669
General Purpose Funding 363,301 465,680
Law, Order, Public Safety 31,764 129,164
Health 0 1,014
Education and Welfare 236,490 121,386
Housing 147,631 19,175
Community Amenities 18,000 15,879
Recreation and Culture 90,818 506,083
Transport 688,464 319,901
Economic Services 17,406 30,957
Other Property and Services 291,370 41,387
1,916,513 1,675,295
2013 2013 2012
29. ELECTED MEMBERS REMUNERATION $ Budget $
$
The following fees, expenses and allowances were
paid to council members and/or the president.
Meeting Fees 14,516 18,000 13,549
President’s Allowance 3,605 3,680 3,500
Travelling Expenses 3,322 3,500 2,978
21,442 25,180 20,027
30. EMPLOYEE NUMBERS 2013 2012
The number of full-time equivalent
employees at balance date 23 20
Shire of Williams Page 73
SHIRE OF WILLIAMS
NOTES TO AND FORMING PART OF THE FINANCIAL REPORT
FOR THE YEAR ENDED 30TH JUNE 2013
31. MAJOR LAND TRANSACTIONS
The Shire of Williams has not been involved in any major land transactions in the 2011/12 financial year
or the 2012/2013 financial year.
32. TRADING UNDERTAKINGS AND MAJOR TRADING UNDERTAKINGS
Council did not participate in any trading undertakings or major trading undertakings during the 2012/13
financial year.
Shire of Williams Page 74
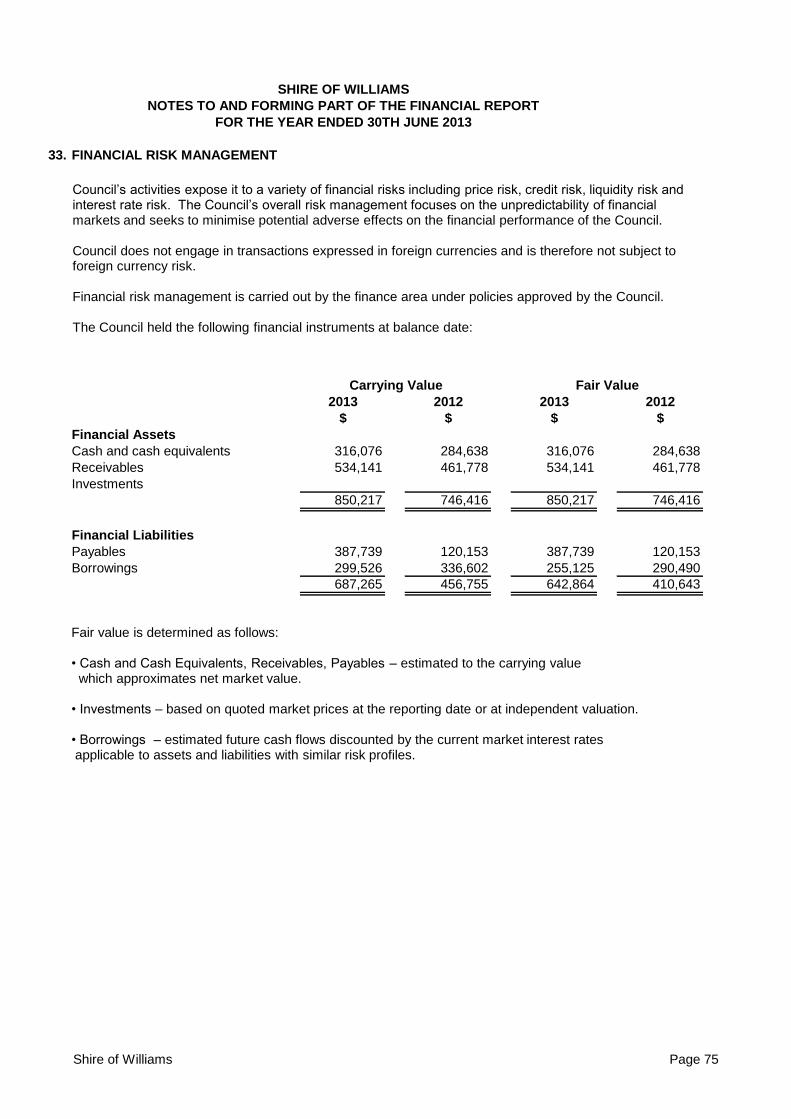
SHIRE OF WILLIAMS
NOTES TO AND FORMING PART OF THE FINANCIAL REPORT
FOR THE YEAR ENDED 30TH JUNE 2013
33. FINANCIAL RISK MANAGEMENT
Carrying Value Fair Value
2013 2012 2013 2012
$ $ $ $
Financial Assets
Cash and cash equivalents 316,076 284,638 316,076 284,638
Receivables 534,141 461,778 534,141 461,778
Investments
850,217 746,416 850,217 746,416
Financial Liabilities
Payables 387,739 120,153 387,739 120,153
Borrowings 299,526 336,602 255,125 290,490
687,265 456,755 642,864 410,643
Council’s activities expose it to a variety of financial risks including price risk, credit risk, liquidity risk and interest rate risk. The Council’s overall risk management focuses on the unpredictability of financial markets and seeks to minimise potential adverse effects on the financial performance of the Council. Council does not engage in transactions expressed in foreign currencies and is therefore not subject to foreign currency risk. Financial risk management is carried out by the finance area under policies approved by the Council. The Council held the following financial instruments at balance date:
Fair value is determined as follows: • Cash and Cash Equivalents, Receivables, Payables – estimated to the carrying value which approximates net market value. • Investments – based on quoted market prices at the reporting date or at independent valuation. • Borrowings – estimated future cash flows discounted by the current market interest rates applicable to assets and liabilities with similar risk profiles.
Shire of Williams Page 75
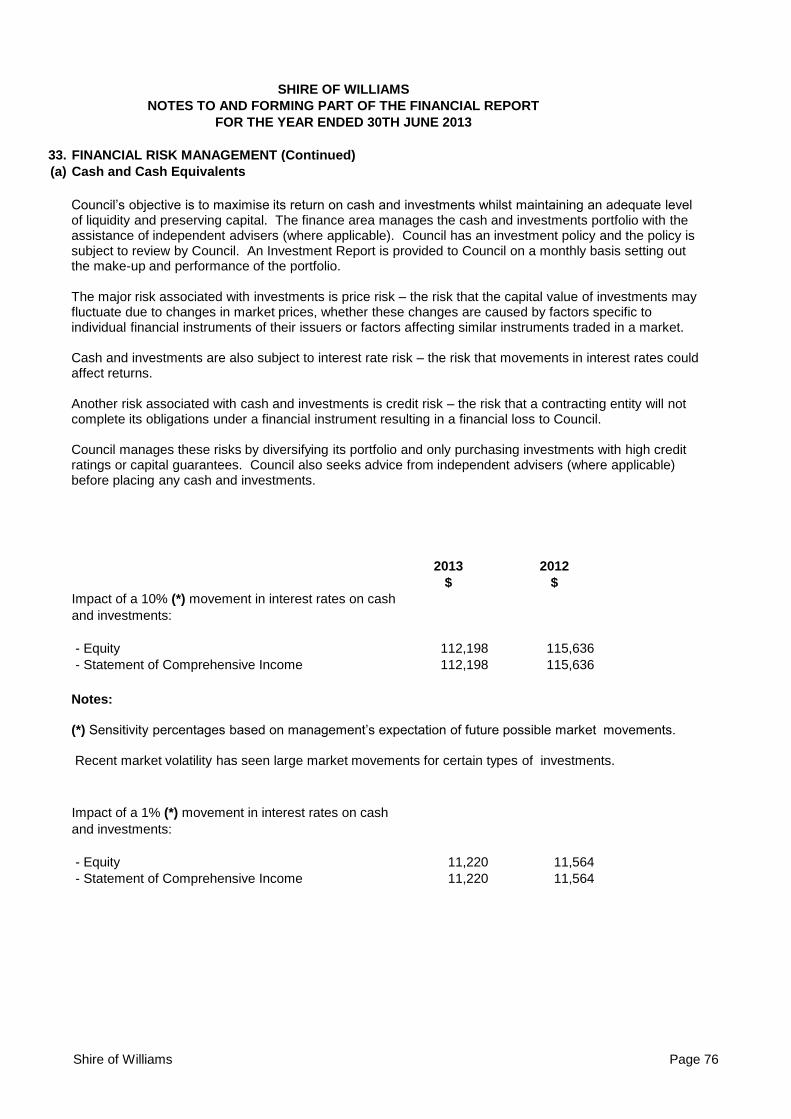
SHIRE OF WILLIAMS
NOTES TO AND FORMING PART OF THE FINANCIAL REPORT
FOR THE YEAR ENDED 30TH JUNE 2013
33. FINANCIAL RISK MANAGEMENT (Continued)
(a) Cash and Cash Equivalents
2013 2012
$ $
Impact of a 10% (*) movement in interest rates on cash
and investments:
- Equity 112,198 115,636
- Statement of Comprehensive Income 112,198 115,636
Impact of a 1% (*) movement in interest rates on cash
and investments:
- Equity 11,220 11,564
- Statement of Comprehensive Income 11,220 11,564
Council’s objective is to maximise its return on cash and investments whilst maintaining an adequate level of liquidity and preserving capital. The finance area manages the cash and investments portfolio with the assistance of independent advisers (where applicable). Council has an investment policy and the policy is subject to review by Council. An Investment Report is provided to Council on a monthly basis setting out the make-up and performance of the portfolio. The major risk associated with investments is price risk – the risk that the capital value of investments may fluctuate due to changes in market prices, whether these changes are caused by factors specific to individual financial instruments of their issuers or factors affecting similar instruments traded in a market. Cash and investments are also subject to interest rate risk – the risk that movements in interest rates could affect returns. Another risk associated with cash and investments is credit risk – the risk that a contracting entity will not complete its obligations under a financial instrument resulting in a financial loss to Council. Council manages these risks by diversifying its portfolio and only purchasing investments with high credit ratings or capital guarantees. Council also seeks advice from independent advisers (where applicable) before placing any cash and investments.
Notes: (*) Sensitivity percentages based on management’s expectation of future possible market movements. Recent market volatility has seen large market movements for certain types of investments.
Shire of Williams Page 76
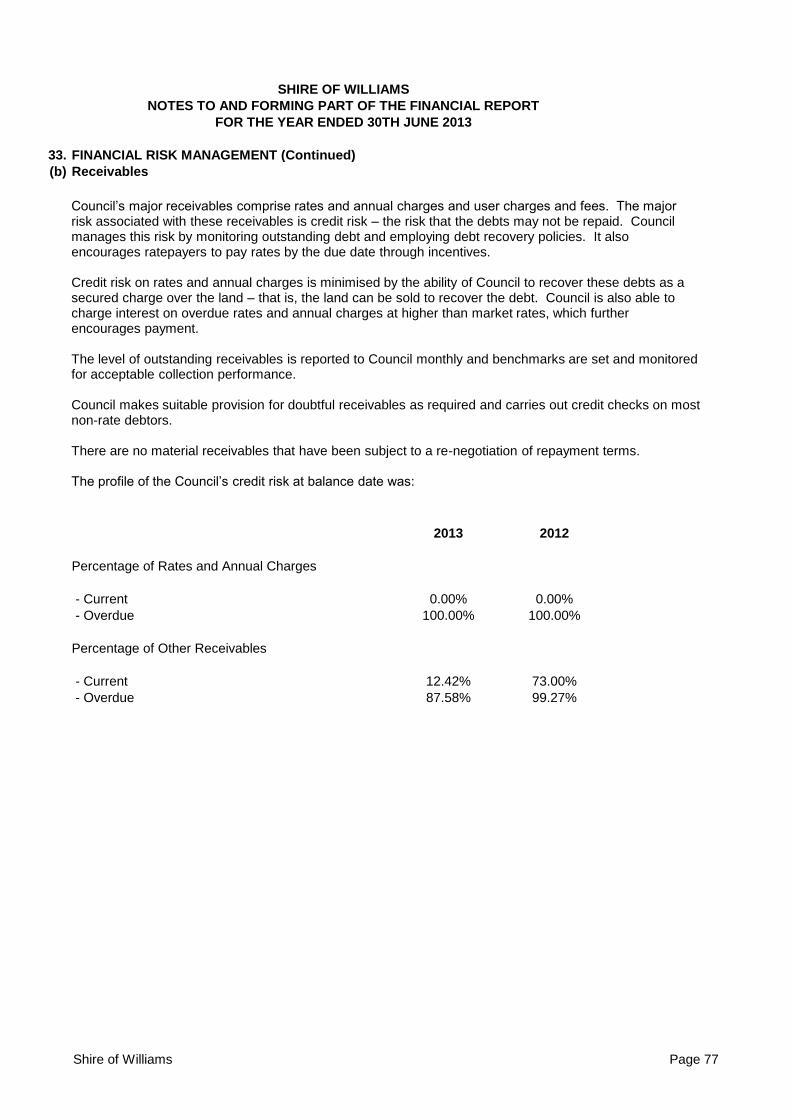
SHIRE OF WILLIAMS
NOTES TO AND FORMING PART OF THE FINANCIAL REPORT
FOR THE YEAR ENDED 30TH JUNE 2013
33. FINANCIAL RISK MANAGEMENT (Continued)
(b) Receivables
2013 2012
Percentage of Rates and Annual Charges
- Current 0.00% 0.00%
- Overdue 100.00% 100.00%
Percentage of Other Receivables
- Current 12.42% 73.00%
- Overdue 87.58% 99.27%
Council’s major receivables comprise rates and annual charges and user charges and fees. The major risk associated with these receivables is credit risk – the risk that the debts may not be repaid. Council manages this risk by monitoring outstanding debt and employing debt recovery policies. It also encourages ratepayers to pay rates by the due date through incentives. Credit risk on rates and annual charges is minimised by the ability of Council to recover these debts as a secured charge over the land – that is, the land can be sold to recover the debt. Council is also able to charge interest on overdue rates and annual charges at higher than market rates, which further encourages payment. The level of outstanding receivables is reported to Council monthly and benchmarks are set and monitored for acceptable collection performance. Council makes suitable provision for doubtful receivables as required and carries out credit checks on most non-rate debtors. There are no material receivables that have been subject to a re-negotiation of repayment terms. The profile of the Council’s credit risk at balance date was:
Shire of Williams Page 77
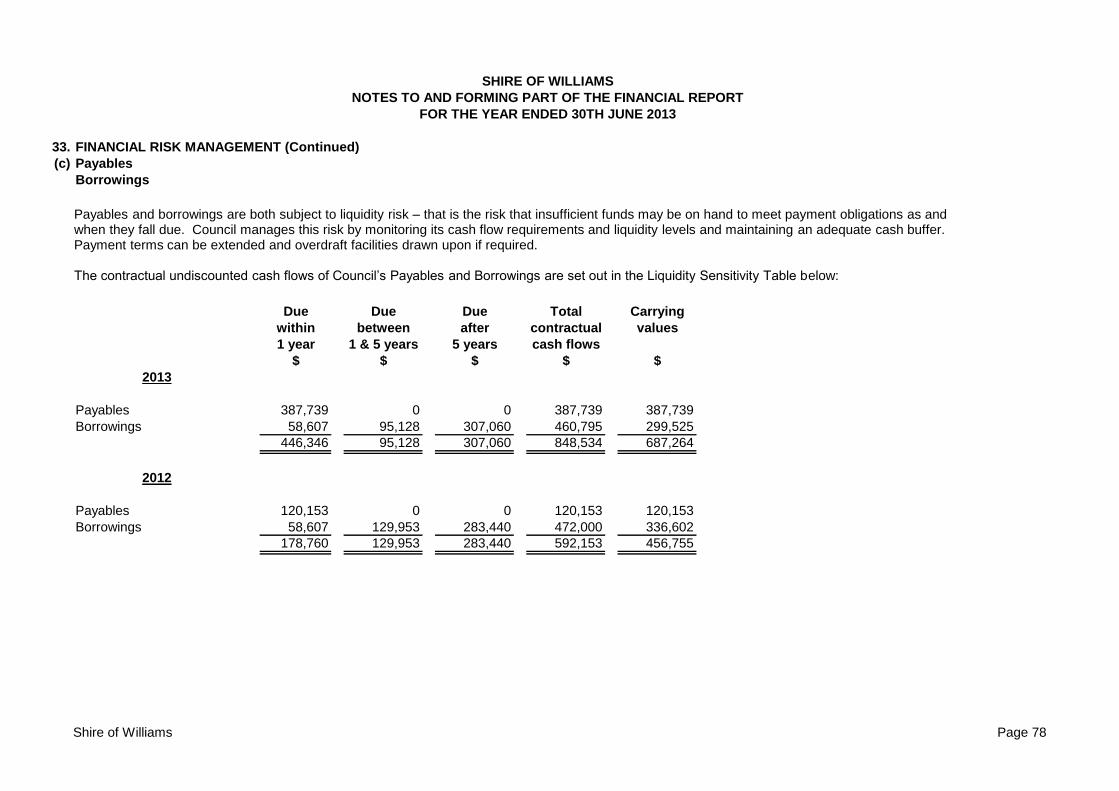
SHIRE OF WILLIAMS
NOTES TO AND FORMING PART OF THE FINANCIAL REPORT
FOR THE YEAR ENDED 30TH JUNE 2013
33. FINANCIAL RISK MANAGEMENT (Continued)
(c) Payables
Borrowings
Due Due Due Total Carrying
within between after contractual values
1 year 1 & 5 years 5 years cash flows
$ $ $ $ $
2013
Payables 387,739 0 0 387,739 387,739
Borrowings 58,607 95,128 307,060 460,795 299,525
446,346 95,128 307,060 848,534 687,264
2012
Payables 120,153 0 0 120,153 120,153
Borrowings 58,607 129,953 283,440 472,000 336,602
178,760 129,953 283,440 592,153 456,755
Payables and borrowings are both subject to liquidity risk – that is the risk that insufficient funds may be on hand to meet payment obligations as and when they fall due. Council manages this risk by monitoring its cash flow requirements and liquidity levels and maintaining an adequate cash buffer. Payment terms can be extended and overdraft facilities drawn upon if required. The contractual undiscounted cash flows of Council’s Payables and Borrowings are set out in the Liquidity Sensitivity Table below:
Shire of Williams Page 78
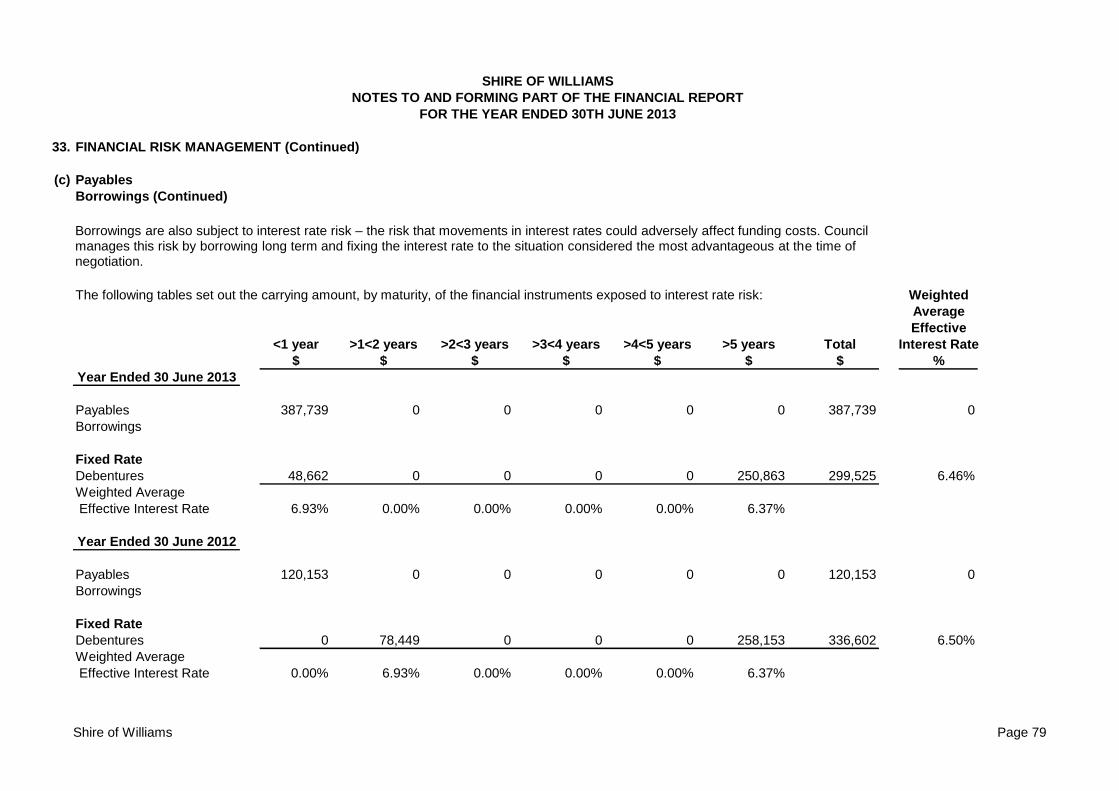
SHIRE OF WILLIAMS
NOTES TO AND FORMING PART OF THE FINANCIAL REPORT
FOR THE YEAR ENDED 30TH JUNE 2013
33. FINANCIAL RISK MANAGEMENT (Continued)
(c) Payables
Borrowings (Continued)
The following tables set out the carrying amount, by maturity, of the financial instruments exposed to interest rate risk: Weighted
Average
Effective
<1 year >1<2 years >2<3 years >3<4 years >4<5 years >5 years Total Interest Rate
$ $ $ $ $ $ $ %
Year Ended 30 June 2013
Payables 387,739 0 0 0 0 0 387,739 0
Borrowings
Fixed Rate
Debentures 48,662 0 0 0 0 250,863 299,525 6.46%
Weighted Average
Effective Interest Rate 6.93% 0.00% 0.00% 0.00% 0.00% 6.37%
Year Ended 30 June 2012
Payables 120,153 0 0 0 0 0 120,153 0
Borrowings
Fixed Rate
Debentures 0 78,449 0 0 0 258,153 336,602 6.50%
Weighted Average
Effective Interest Rate 0.00% 6.93% 0.00% 0.00% 0.00% 6.37%
Borrowings are also subject to interest rate risk – the risk that movements in interest rates could adversely affect funding costs. Council manages this risk by borrowing long term and fixing the interest rate to the situation considered the most advantageous at the time of negotiation.
Shire of Williams Page 79
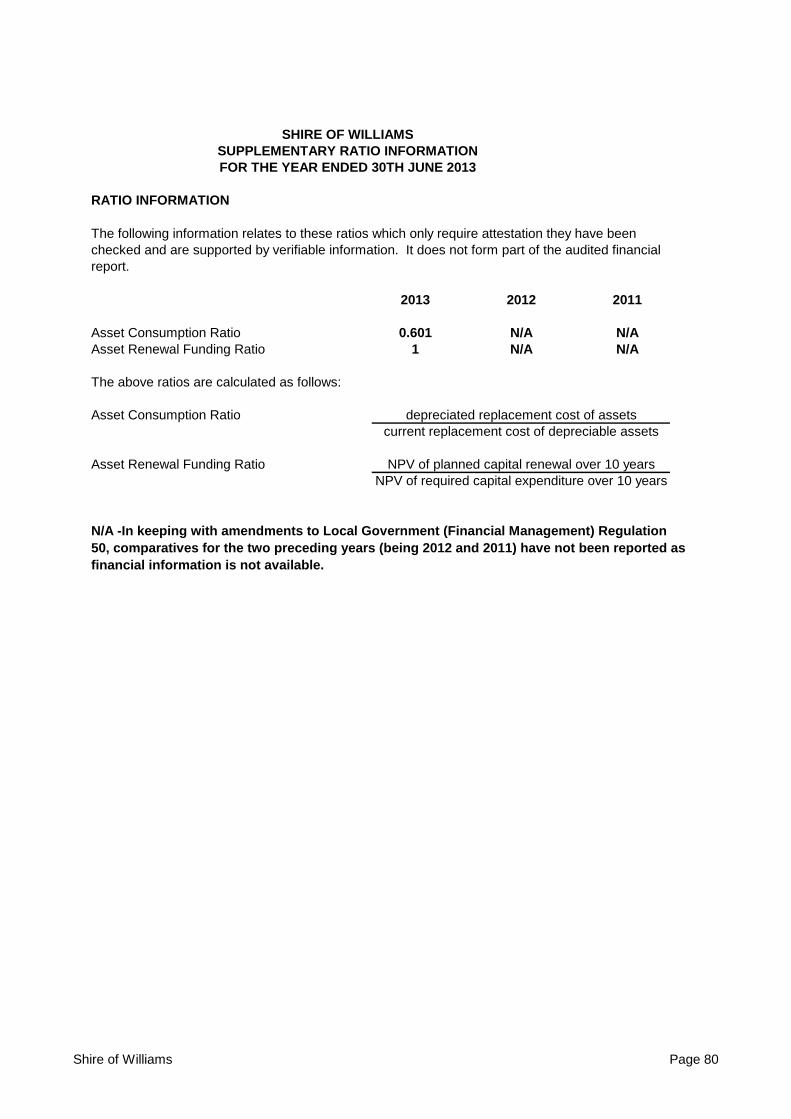
SHIRE OF WILLIAMS
SUPPLEMENTARY RATIO INFORMATION
FOR THE YEAR ENDED 30TH JUNE 2013
RATIO INFORMATION
2013 2012 2011
Asset Consumption Ratio 0.601 N/A N/A
Asset Renewal Funding Ratio 1 N/A N/A
The above ratios are calculated as follows:
Asset Consumption Ratio depreciated replacement cost of assets
current replacement cost of depreciable assets
Asset Renewal Funding Ratio NPV of planned capital renewal over 10 years
NPV of required capital expenditure over 10 years
The following information relates to these ratios which only require attestation they have been
checked and are supported by verifiable information. It does not form part of the audited financial
report.
N/A -In keeping with amendments to Local Government (Financial Management) Regulation
50, comparatives for the two preceding years (being 2012 and 2011) have not been reported as
financial information is not available.
Shire of Williams Page 80