w a a a · rubbish removals . the williams townsite collections are carried out every tuesday by a...
TRANSCRIPT
2016/2017
SHIRE OF WILLIAMS
ANNUAL REPORT
13 October 2017
SHIRE OF WILLIAMS
Authority and Legislation
The Shire of Williams is a statutory organisation responsible to the Minister for Local Government. It operates under the provisions of the Local Government Act 1995 (as amended).
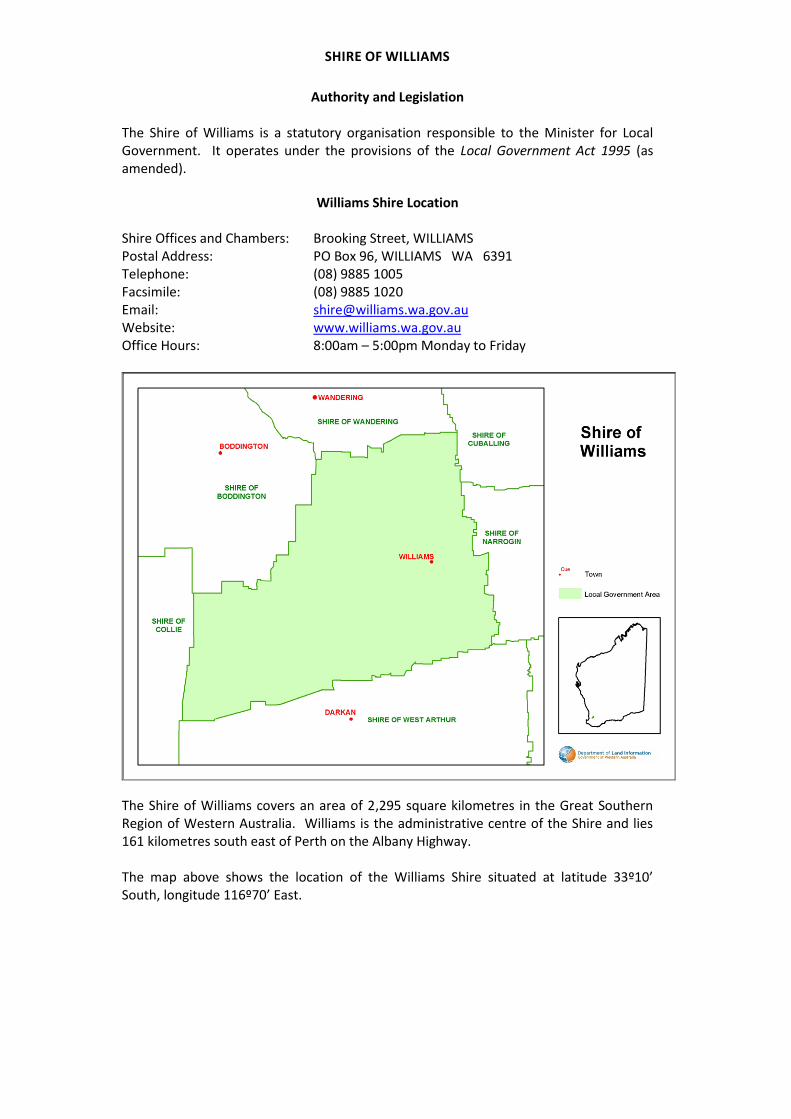
Williams Shire Location Shire Offices and Chambers: Brooking Street, WILLIAMS Postal Address: PO Box 96, WILLIAMS WA 6391 Telephone: (08) 9885 1005 Facsimile: (08) 9885 1020 Email: [email protected] Website: www.williams.wa.gov.au Office Hours: 8:00am – 5:00pm Monday to Friday
The Shire of Williams covers an area of 2,295 square kilometres in the Great Southern Region of Western Australia. Williams is the administrative centre of the Shire and lies 161 kilometres south east of Perth on the Albany Highway. The map above shows the location of the Williams Shire situated at latitude 33º10’ South, longitude 116º70’ East.
Page i
Contents
COMMUNITY STRATEGIC PLAN ..................................................... ii COUNCIL MEMBERS ..................................................................... iii COUNCIL STAFF ............................................................................ iv SHIRE STATISTICS & INFORMATION .............................................. v MANAGEMENT STRUCTURE ........................................................ vi COUNCIL FACILITIES .................................................................... vii COUNCIL SERVICES .................................................................... viii SHIRE PRESIDENT’S REPORT ........................................................ ix CHIEF EXECUTIVE OFFICER’S REPORT .......................................... xi STATUTORY REPORTING ............................................................ xix COMMUNITY PLAN STRATEGIES & OUTCOMES ........................ xxiv ANNUAL FINANCIAL REPORT…….……………………………………………….1 INDEPENDENT AUDIT REPORT……………………………….………………..54
Page ii
COMMUNITY STRATEGIC PLAN
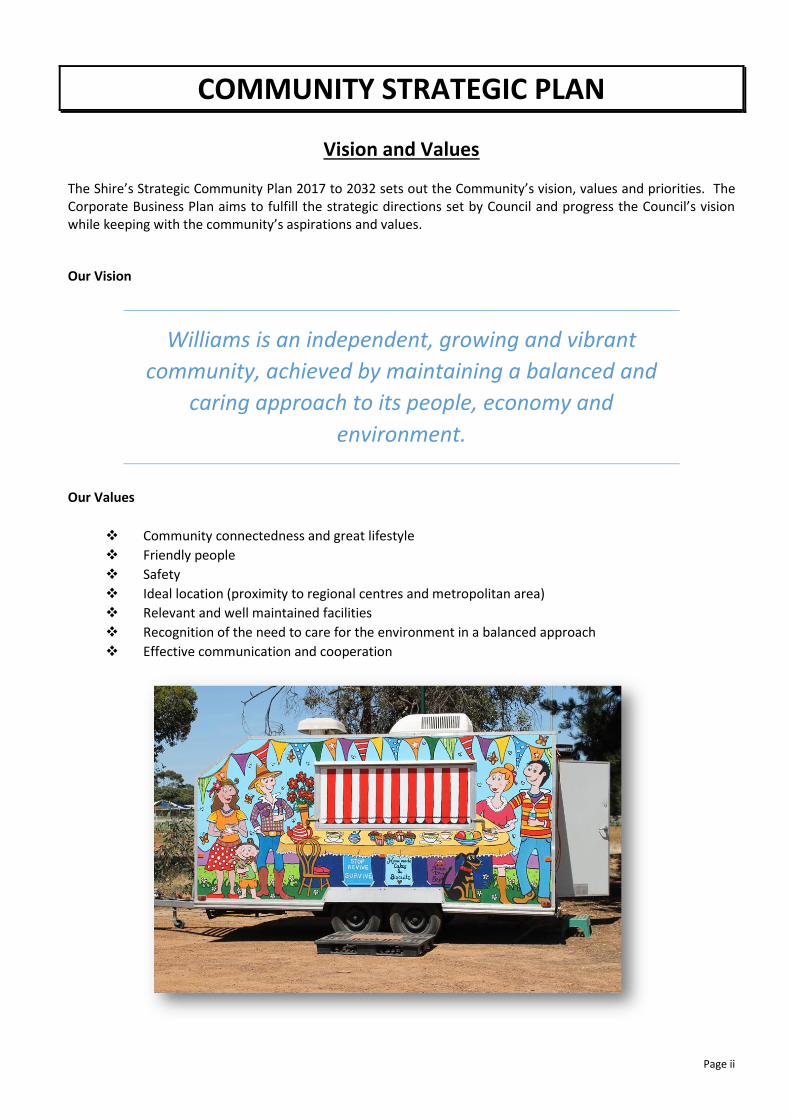
Vision and Values The Shire’s Strategic Community Plan 2017 to 2032 sets out the Community’s vision, values and priorities. The Corporate Business Plan aims to fulfill the strategic directions set by Council and progress the Council’s vision while keeping with the community’s aspirations and values.
Our Vision
Williams is an independent, growing and vibrant
community, achieved by maintaining a balanced and
caring approach to its people, economy and
environment.
Our Values
Community connectedness and great lifestyle
Friendly people
Safety
Ideal location (proximity to regional centres and metropolitan area)
Relevant and well maintained facilities
Recognition of the need to care for the environment in a balanced approach
Effective communication and cooperation
Page iii
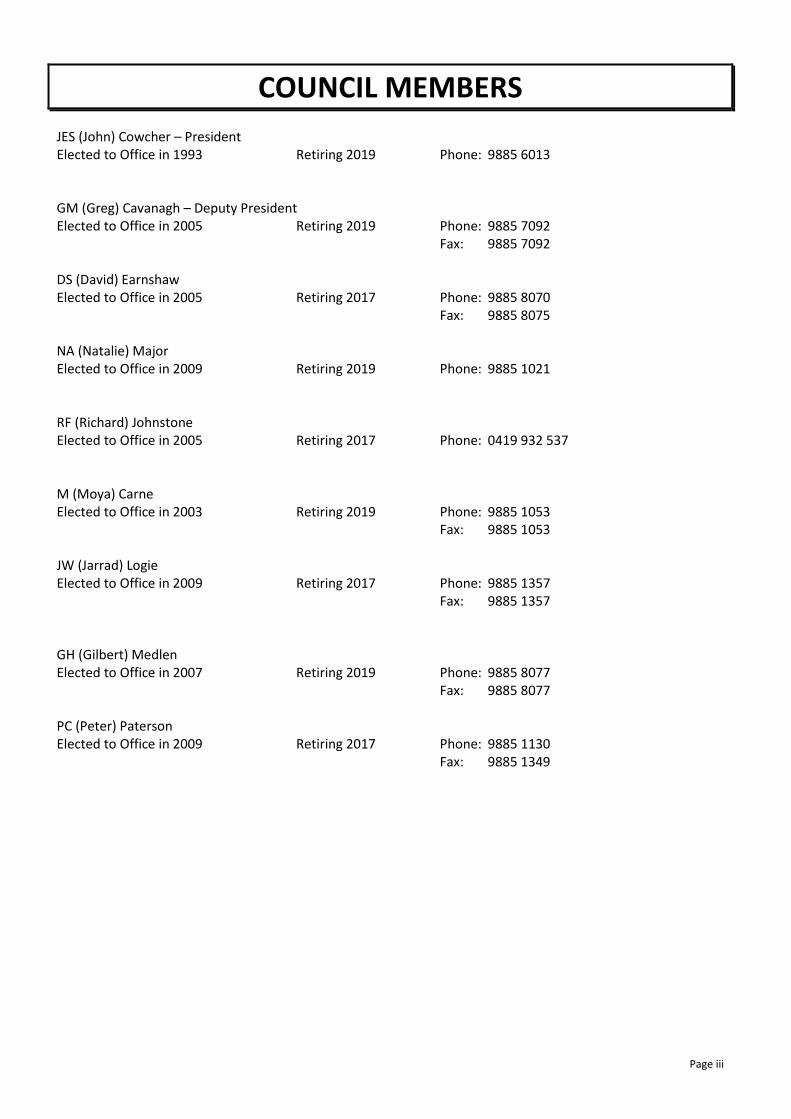
COUNCIL MEMBERS
JES (John) Cowcher – President Elected to Office in 1993 Retiring 2019 Phone: 9885 6013 GM (Greg) Cavanagh – Deputy President Elected to Office in 2005 Retiring 2019 Phone: 9885 7092 Fax: 9885 7092 DS (David) Earnshaw Elected to Office in 2005 Retiring 2017 Phone: 9885 8070 Fax: 9885 8075 NA (Natalie) Major Elected to Office in 2009 Retiring 2019 Phone: 9885 1021 RF (Richard) Johnstone Elected to Office in 2005 Retiring 2017 Phone: 0419 932 537 M (Moya) Carne Elected to Office in 2003 Retiring 2019 Phone: 9885 1053 Fax: 9885 1053 JW (Jarrad) Logie Elected to Office in 2009 Retiring 2017 Phone: 9885 1357 Fax: 9885 1357 GH (Gilbert) Medlen Elected to Office in 2007 Retiring 2019 Phone: 9885 8077 Fax: 9885 8077 PC (Peter) Paterson Elected to Office in 2009 Retiring 2017 Phone: 9885 1130 Fax: 9885 1349
Page iv
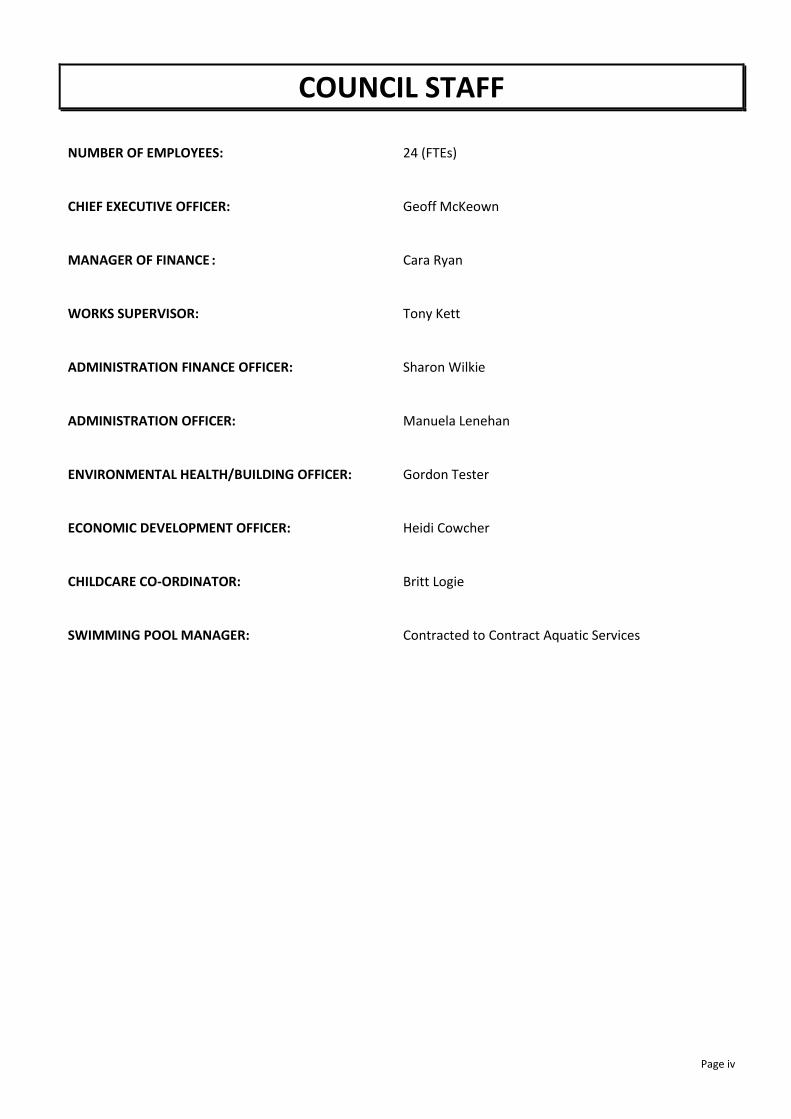
COUNCIL STAFF
NUMBER OF EMPLOYEES: 24 (FTEs) CHIEF EXECUTIVE OFFICER: Geoff McKeown MANAGER OF FINANCE : Cara Ryan WORKS SUPERVISOR: Tony Kett ADMINISTRATION FINANCE OFFICER: Sharon Wilkie ADMINISTRATION OFFICER: Manuela Lenehan ENVIRONMENTAL HEALTH/BUILDING OFFICER: Gordon Tester ECONOMIC DEVELOPMENT OFFICER: Heidi Cowcher CHILDCARE CO-ORDINATOR: Britt Logie SWIMMING POOL MANAGER: Contracted to Contract Aquatic Services

Page v
SHIRE STATISTICS & INFORMATION
Distance from Perth (km) 161 Area (sq km) 2,295 Length sealed roads (km) 166 Length unsealed roads (km) 388 Population (2016 Census) 981 Councillors 9 Electors 726 Dwellings 468 Employees (FTE's) 24 Rates (Budget 2017) $1,681,705 Revenue (Budget 2017) $4,604,074
History of Shire The District of Williams was first explored in 1831 by Captain Bannister en route from Perth to King George III Sound (Albany). Williams has been a convenient stopping place for travellers on the same route since the 1850’s. With the tendering of a reliable mail service around 1853, the road was upgraded and Williams became an important stop over point for passengers and changing of horses. It subsequently developed as the District Centre for Local Government, which was granted in 1877. The small town was subject to increasing floods due to the clearing of the land for intensive farming, therefore the town was relocated to the Perth side of the bridge. The town site was surveyed in 1905 and most of the buildings in the present town site were constructed after that time. Williams is still reliant on wool and coarse grains and caters for about 3,000 – 4,000 vehicles per day. The population has stabilised in the district to approximately 1,000 with about 400 living in the Williams townsite. Economy The economic activity of the Shire is dominated by agricultural pursuits, including the growing of barley, lupins, peas, canola, wheat, oats, export hay, olives, wine grapes and the rearing of sheep, pigs and cattle. Local industries include grain pellet production, hay processing, holiday farm stays, engineering, retailing and servicing of farm machinery. The average size of agricultural holdings is 800ha and the area of public parks, gardens and play area is 20ha. As Williams is located on the very busy Albany Highway, servicing the travelling public with food and fuel is a significant driver for the local economy. It is a popular place to stop and take a break on a long journey. A number of local manufacturing industries and service businesses are located in Williams, taking advantage of the strategic transport routes that pass through the town. Climate The district enjoys a moderate climate characterised by warm dry summers and cool wet winters with average temperatures ranging from a minimum of 3º to a maximum of 25º in winter and a minimum of 20º to a maximum of 35º in summer. The warmest months are January and February. The average annual rainfall for the Shire of Williams is 550mm.

Page vi
MANAGEMENT STRUCTURE
The Shire of Williams has developed its Management Structure to achieve greater efficiencies and to provide prompt and effective customer service. The three line Managers have been vested with specific responsibilities, and enjoy a high level of autonomy in carrying out their functions. This is coupled with direct accountability for their respective areas of management. The Managers share a strong commitment towards ensuring efficient delivery of Local Government services.
COUNCIL Nine (9) Councillors
Chief Executive Officer
Mr Geoff McKeown
Environmental Health Officer/ Building Surveyor Mr Gordon Tester Responsible for: Town Planning Functions Health Administration and Inspections Building Applications Swimming Pool Inspections Refuse Site Management
Manager of Finance Ms Cara Ryan
Responsible for: Community Services Finance Administration Accounting and Budgeting Rents, Rates and Charges Shire Housing Library Management Payroll Asset and Stock Control Grant Applications Financial Reporting Compliance Attending Personnel Management Statutory Obligations Recreation Pavilion, Hall Public Buildings
Works Supervisor Mr Tony Kett Responsible for: Road Construction and Maintenance Parks, Gardens Ovals & Reserves Street Cleaning Private Works Drainage Footpaths Street Trees

Page vii
COUNCIL FACILITIES
Public Library The Library is open Monday to Friday and is located in the Community Resource Centre, Brooking Street, Williams. Books may be returned during office hours.
Childcare Centre Willi Wag-Tails Childcare Centre is located at on Growse Street. The Centre is open Monday to Friday from 8am to 5.30pm. Offering full day care as well as half day sessions, morning or afternoon, and hourly care (minimum of 2 hours) if places are available.
Sports Pavilion Situated at the Williams Sports Ground. Bookings may be made through the Shire Office. This facility accommodates a variety of sports including basketball, tennis, netball, football, hockey, cricket and inter-school sports. The grassed oval is equipped with lighting. The centre also provides a venue for cabarets, discos, weddings, general meetings and a variety of social gatherings.
Town Hall and RSL Hall Situated on the corner of Brooking Street and Growse Street. Bookings may be made through the Shire Office. Trestles, chairs, cutlery and crockery are available for hire from this facility. The Hall is also used for concerts, theatre, and music and film evenings.
Aquatic Centre Telephone No. (08) 9885 1096. Situated at the entrance to the Recreation Ground, Pinjarra-Williams Road. Open for general public use from approximately November to April when the Manager is in attendance. Season and family tickets are available and may be purchased from the Shire Office.
Tourist Information Bay Situated at the Lions Park near the bridge on Albany Highway. Information on the board includes Shire and town site maps.
Williams Community Homes (4 x 1 bedroom units in New St) Built in the 70s they are available to single persons and seniors. Sandalwood Court (6 x 2 bedroom units in Growse Street) Built in 1998, two units are dedicated to seniors and the remaining four are available for other tenants. Wandoo Cottages (2 x 2 bedroom units in Growse Street) Built in 2005, these are dedicated seniors’ units. Jamtree Lane (5 x 2 bedroom units in Jamtree Lane, off New Street) Built in 2014, these are dedicated seniors’ units. New Street (2 x 3 bedroom units in New Street with rear access off Jamtree Lane) Built in 2016, these are dedicated seniors’ units
Chemical Container Compound Situated inside the Refuse Site compound, approved chemical containers may be deposited when the refuse site is open. All chemical containers must be thoroughly washed and drained before leaving at the compound.
Oil Recycling Depot Situated near the entrance to the Works Depot compound. Includes waste oil collection and recycling.
Recycling Depot Collection site for aluminium cans, newspapers and glass containers situated near the entrance to the Works Depot and at the Refuse Disposal Site. Additional recycling, including cardboard, located at the Refuse site.
Refuse Disposal Site Situated off the Narrogin-Williams Road 2.5km east of town.
Page viii
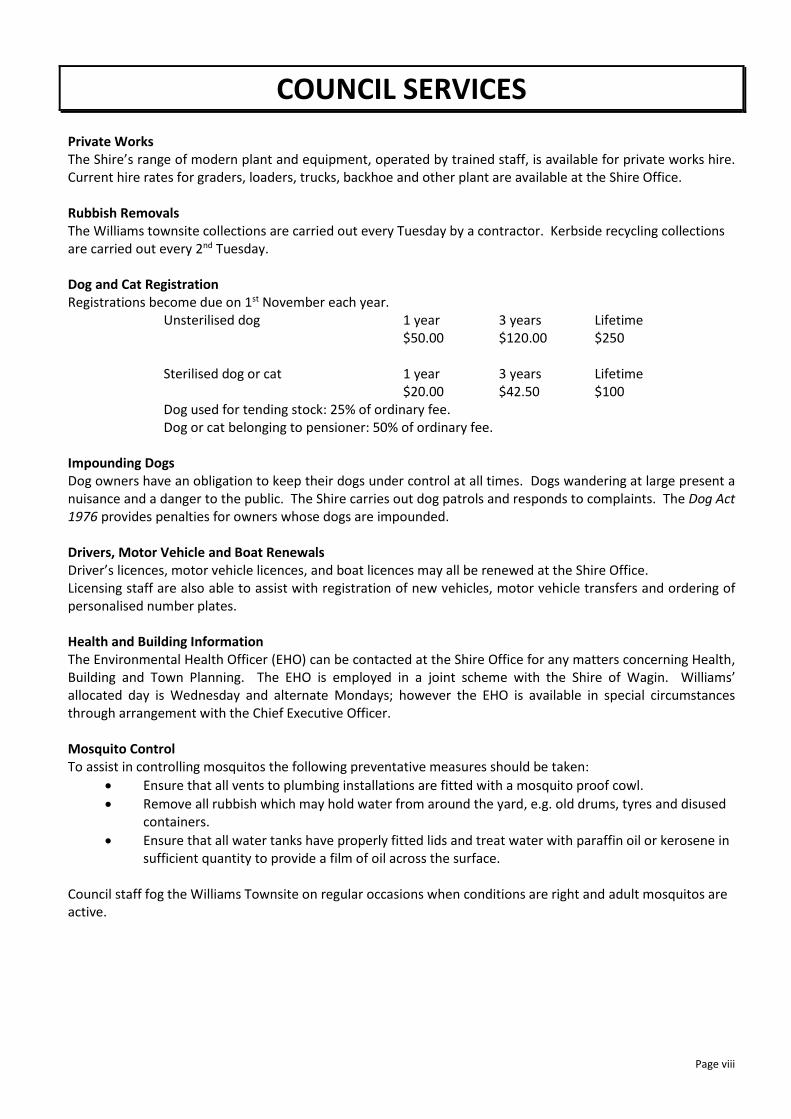
COUNCIL SERVICES Private Works The Shire’s range of modern plant and equipment, operated by trained staff, is available for private works hire. Current hire rates for graders, loaders, trucks, backhoe and other plant are available at the Shire Office.
Rubbish Removals The Williams townsite collections are carried out every Tuesday by a contractor. Kerbside recycling collections are carried out every 2nd Tuesday.
Dog and Cat Registration Registrations become due on 1st November each year. Unsterilised dog 1 year 3 years Lifetime $50.00 $120.00 $250 Sterilised dog or cat 1 year 3 years Lifetime $20.00 $42.50 $100 Dog used for tending stock: 25% of ordinary fee. Dog or cat belonging to pensioner: 50% of ordinary fee. Impounding Dogs Dog owners have an obligation to keep their dogs under control at all times. Dogs wandering at large present a nuisance and a danger to the public. The Shire carries out dog patrols and responds to complaints. The Dog Act 1976 provides penalties for owners whose dogs are impounded. Drivers, Motor Vehicle and Boat Renewals Driver’s licences, motor vehicle licences, and boat licences may all be renewed at the Shire Office. Licensing staff are also able to assist with registration of new vehicles, motor vehicle transfers and ordering of personalised number plates. Health and Building Information The Environmental Health Officer (EHO) can be contacted at the Shire Office for any matters concerning Health, Building and Town Planning. The EHO is employed in a joint scheme with the Shire of Wagin. Williams’ allocated day is Wednesday and alternate Mondays; however the EHO is available in special circumstances through arrangement with the Chief Executive Officer. Mosquito Control To assist in controlling mosquitos the following preventative measures should be taken:
Ensure that all vents to plumbing installations are fitted with a mosquito proof cowl.
Remove all rubbish which may hold water from around the yard, e.g. old drums, tyres and disused containers.
Ensure that all water tanks have properly fitted lids and treat water with paraffin oil or kerosene in sufficient quantity to provide a film of oil across the surface.
Council staff fog the Williams Townsite on regular occasions when conditions are right and adult mosquitos are active.

Page ix
SHIRE PRESIDENT’S REPORT
As President, it gives me great pleasure to present the Annual Report to the electors and ratepayers of the community of Williams. Your Council and Staff work hard to identify and deliver projects and manage all aspects of the administration that will improve the community of Williams and make it a great place to live, work and play. Williams is a community that prides itself on its strong sense of community and is well recognised for its achievements across all aspects – whether it be in its strategic direction in local government or its outstanding achievements on the sporting field. Williams is indeed a great place to live. The Shire’s lead role in the 4WDL Well Aged Housing project continues to highlight the capacity and capability of our administration team, who for the last 7 years have managed an over $15m Royalties for Regions funded project. At completion this project for the collective regional group of local governments will have constructed over 50 dedicated independent aged living units across 7 shires in the Wheatbelt/Great Southern region. The Shire of Williams has built 7 of these units, and officially opened them in February 2017. Council was proud to host the former local MP Hon Terry ‘Tuck’ Waldron to open the units, at one of his final official commitments before he retired at the State Government election earlier this year. This collaborative approach extends to other regional projects including the Shire's continued involvement in the Hotham Williams Economic Development Alliance (HWEDA) collaborative group which is an alliance between 3 local governments, Williams, Wandering and Boddington and continues to identify, plan for and deliver on economic development opportunities for the sub-region. During the past year, the Alliance has applied for and secured funding for a self-drive tourism based project, which aims to attract visitors to visit the region and see all it has on offer. Council continues its financial commitment of HWEDA, given its strength of opportunity to grow economic development opportunities for the sub-region. The road network management is a large part of the Shire’s annual works program as we endeavour to ensure that roads are continually maintained and upgraded where required. Outside staff are responsible for all the parks and gardens in town as well as the maintenance and management of the sporting facilities. As Council, we endeavour to ensure that the program of work is well balanced and strives to ensure that we do not get too far behind in maintenance and/or upgrades as required for the extensive roads network. The significant rainfall event that the Shire received in February 2017 impacted on many culverts and roads, and Council has only recently received the final approval from MRWA and the WA State Government enabling the remediation works to commence. Council appreciates residents’ and ratepayers’ patience during this time. Council has worked hard to advocate for a permanent allocation of a 3.4 Fire Truck under the ESL funding arrangements. After many years of unsuccessful applications, Council was pleased to receive advice that a permanent truck has been approved for the Shire of Williams. As these vehicles are purpose built, it may be a year before the truck arrives, however DFES has confirmed that a high season loan truck will be allocated in the interim, to ensure that the community is protected during this time. During the past year, Council has also contributed to a WALGA led investigation into the ESL and how it is calculated. An important piece of work that was completed during the year, was a comprehensive review of the Shire’s Strategic Community Plan. A review of the 2012 plan was required, and needed to include community consultation. Council engaged the services of Andrew Huffer of Andrew Huffer and Associates, who assisted Council staff with the engagement and involvement of the community members of Williams. Community members were invited to participate in community workshops, as well as the option of completing an online survey. Collectively the information has contributed to the development of the Strategic Community Plan that will guide Council’s investments and priorities over the next 10-15 years. Following the completion of this Plan, Council has also completed a review of the suite of Integrated Planning documents including its Corporate Business Plan, Asset Management Plan and Long Term Financial Plan – all of which will assist Council to ensure that the long term asset management needs are identified and planned for at the appropriate time.
Page x
The Williams River Bridge has reached its used by date, and over the last year, Council has ramped up its pressure on MRWA and the WA State Government advocating for a replacement bridge given its deteriorating state. Props were installed under the bridge in October 2016, but these were dislodged during the floods earlier this year, resulting in MRWA requesting the Shire to breach the weir in order to assist with allowing the water to drain away from the bridge so that new props could be installed. The state of the bridge continues to be of concern to community, and I have certainly been vocal in the media trying to raise the profile of this project to try to secure a decision as to when this work will commence. MRWA, together with Council and the community have established a Community Reference Group, who have been working with the MRWA engaged Consultants to work on the plans for the new bridge. All staff across all areas, from the works crew to the administration staff are a credit to themselves and our community, and are our strongest asset. They work hard to implement the decisions of Council and to ensure that they deliver exceptional work standards and ethics at all times. I personally, together with my fellow Councillors, appreciate the hard work and commitment to serving their community that our small team demonstrates continually, and this rivals many larger Councils. Geoff McKeown as CEO leads a strong, dedicated team of Cara Ryan as Manager of Finance, Sharon Wilkie as Administration Finance Officer, Manuela Lenehan and Britt Logie as Administration Officers, Heidi Cowcher as the Economic Development Officer and Steve Friend as Environmental Health/Building Officer until he retired in September 2016, with his replacement being Gordon Tester. The works crew, led by Works Supervisor Tony Kett, endeavour to deliver an at times challenging works program. During the year, the outside staff added to their team with the employment of Kim Sandilands following the retirement of Ray Scobie in September 2016. Your Councillors continue to provide a significant time commitment to their duties to the Shire of Williams, of which the community should be proud. They take the time to commit to so much more than attending the once a month meeting commitment. Many of the Councillors also represent the Shire on local and regional committees and attend these meetings as part of their commitment to serving the community. I thank them for their efforts and extend my appreciation to their service to our community, which is often above and beyond. Our team is a strong team and one that works hard to serve the community to the best of their ability. All are always available to listen to the community and advocate for and represent the ratepayers at Council level. Finally, to the Council team, my appreciation for your support, your dedication to your roles and your strong advocacy for the residents, ratepayers and electors of the community of Williams. I enjoy working with you and look forward to the next 12 months as we continue to deliver on the strategic objectives for the community of Williams.
Cr John Cowcher Shire President October 2017
Page xi
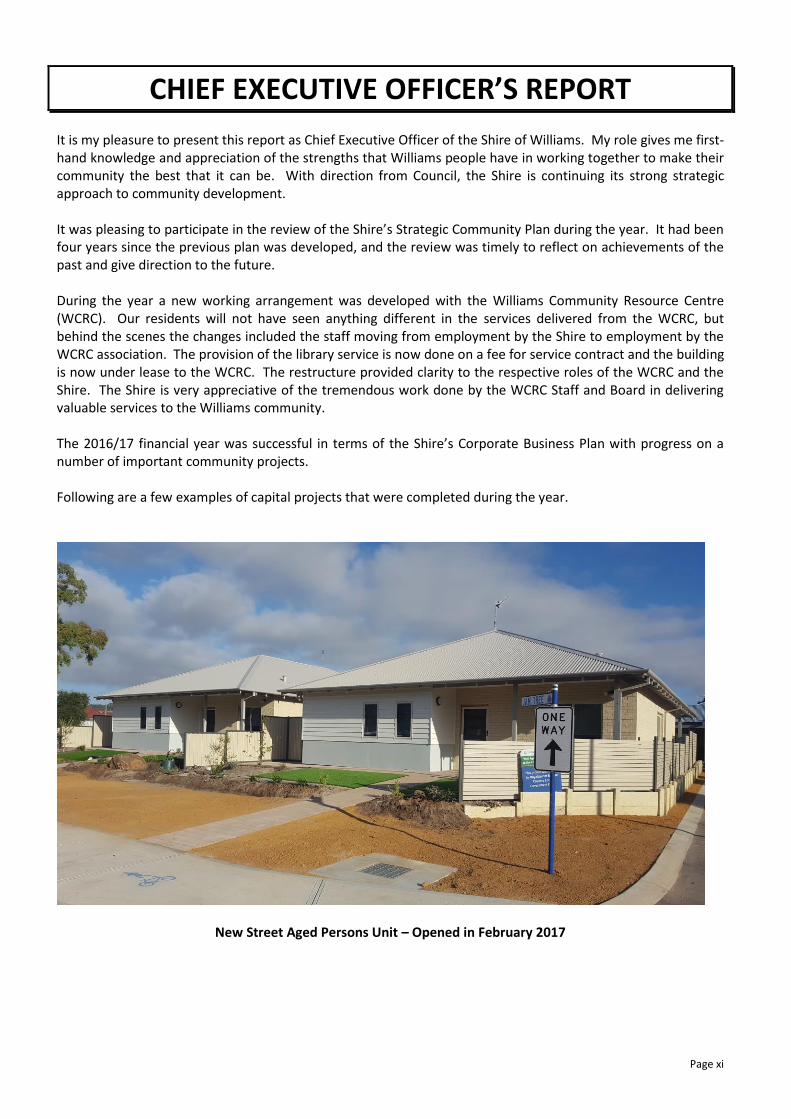
CHIEF EXECUTIVE OFFICER’S REPORT It is my pleasure to present this report as Chief Executive Officer of the Shire of Williams. My role gives me first-hand knowledge and appreciation of the strengths that Williams people have in working together to make their community the best that it can be. With direction from Council, the Shire is continuing its strong strategic approach to community development. It was pleasing to participate in the review of the Shire’s Strategic Community Plan during the year. It had been four years since the previous plan was developed, and the review was timely to reflect on achievements of the past and give direction to the future. During the year a new working arrangement was developed with the Williams Community Resource Centre (WCRC). Our residents will not have seen anything different in the services delivered from the WCRC, but behind the scenes the changes included the staff moving from employment by the Shire to employment by the WCRC association. The provision of the library service is now done on a fee for service contract and the building is now under lease to the WCRC. The restructure provided clarity to the respective roles of the WCRC and the Shire. The Shire is very appreciative of the tremendous work done by the WCRC Staff and Board in delivering valuable services to the Williams community. The 2016/17 financial year was successful in terms of the Shire’s Corporate Business Plan with progress on a number of important community projects. Following are a few examples of capital projects that were completed during the year.
New Street Aged Persons Unit – Opened in February 2017

Page xii
Synthetic Bowling Green at the Williams Bowling Club – Officially opened in March 2017
Page xiii
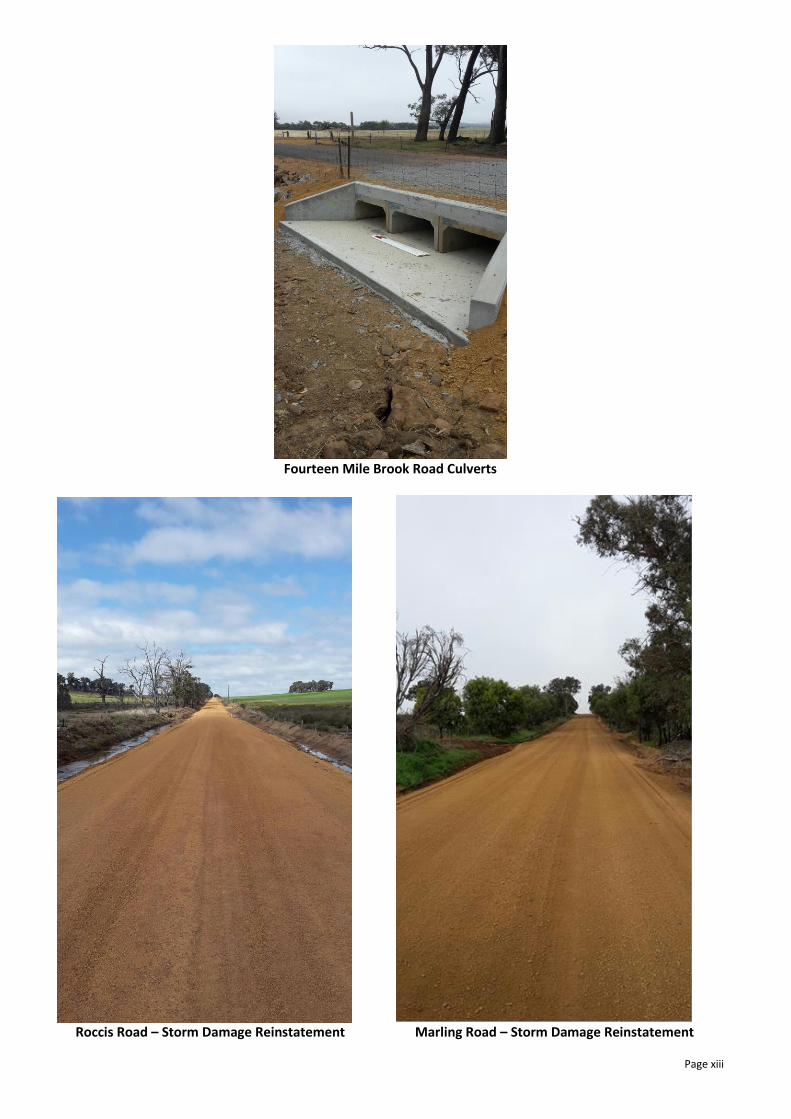
Fourteen Mile Brook Road Culverts
Roccis Road – Storm Damage Reinstatement Marling Road – Storm Damage Reinstatement
Page xiv
Financial Sustainability The Shire completed the 2016-17 financial year in a sound financial position. The Shire focussed on meeting the commitments contained in the budget for the year and adhering to the expenditure limits set. A further explanation is provided in the financial statements that follow in this report. Planning for the future During the financial year a significant amount of work went into a review of plans that form part of the Integrated Planning and Reporting Framework (IPR). The Local Government Act 1995 and Local Government (Administration) Regulations 1996 requires local governments to prepare a plan for the future. All local governments were required to have their first suite of IPR documents in place by 1 July 2013. The core components of the Integrated Planning and Reporting Framework are:
- Strategic Community Plan (full review every four years) - Corporate Business Plan (reviewed annually) - Strategic Resource Plan
Informing Strategies include: - Long Term Financial Plan - Asset Management Plan - Workforce Plan The Strategic Community Plan review was conducted during the year commencing with a series of workshops attended by members of the community. This was followed by a further workshop involving elected members and staff. The Plan was endorsed by Council and now sets the direction of the Shire for the future. There are many exciting strategies in the Plan and Council looks forward to progressing them. Financial Assistance Grants It was reported in last year’s Annual Report that the Shire was to benefit from a new methodology used by the Western Australian Local Grants Commission. For the last three years the Federal Government has frozen the overall distribution of grants to local government which has impacted on the Shire’s ability to take advantage of the new methodology. It is pleasing to note that the Federal Government announced that it will remove the freeze on indexation of these grants effective in the 2017-18 financial year. Staff The total number of Staff remained steady during the year with only minor changes occurring. However we did farewell two long serving and valued employees. Ray Scobie made a decision to retire and moved to Victoria to be closer to family. Also, Steve Friend retired as our Shire Environmental Health Officer/Building Inspector. Steve was officially employed by the Shire of Wagin but worked at Williams on a part time basis. I would like to thank Ray and Steve for their service and commitment to the Williams community. At the 30th June 2017 the employees at the Williams Community Resource Centre (WCRC) ceased employment with the Shire. Under a new arrangement entered into by Shire and the WCRC Inc. the staff will continue in their current roles but will be directly employed by WCRC Inc. I would like to thank Sharon Moore, Hazel Harris, Georgina Paterson and Jane Hillman for their valuable contribution to the running of this important community service and for the support and cooperation during the transition to the new arrangement.

Page xv
At a glance • The operating expenditure for 2016/17 was $4.38m (including depreciation). • Staff costs for 24 permanent and casual employees were $1.56m. • Rates and charges comprised $2.20m of the total income received. • Council’s grant funding for the year was $2.89m. • A $2.54m capital works program was delivered. • Cash and investments totalled $1.37 million. • Council borrowings are $752,531 at the end of the year.
Net Result The Net Result reported for 2016/2017 is $1,156,842 which does not include revaluation of the Shire’s land, buildings and parks/gardens infrastructure. Local governments are required to undertake a revaluation of major asset classes on a three year rotational basis to meet legislation contained in the Local Government Financial Management Regulations 1996. The diagrams below show the break up of revenue and expenditure:
Operating Revenue Operating Expenditure
Summary Actual Actual Actual
2016/2017 2015/2016 2014/2015
Total Operating Revenues $5,537,128 $4,154,011 $3,816,461
Total Operating Expenditure $4,380,286 $4,060,086 $3,272,646
Net Result $1,156,842 $93,925 $543,815
Revaluation of Assets ($2,877,364) $32,971 $108,860,774
Net Operating Result ($1,720,522) $126,896 $109,404,589
Page xvi
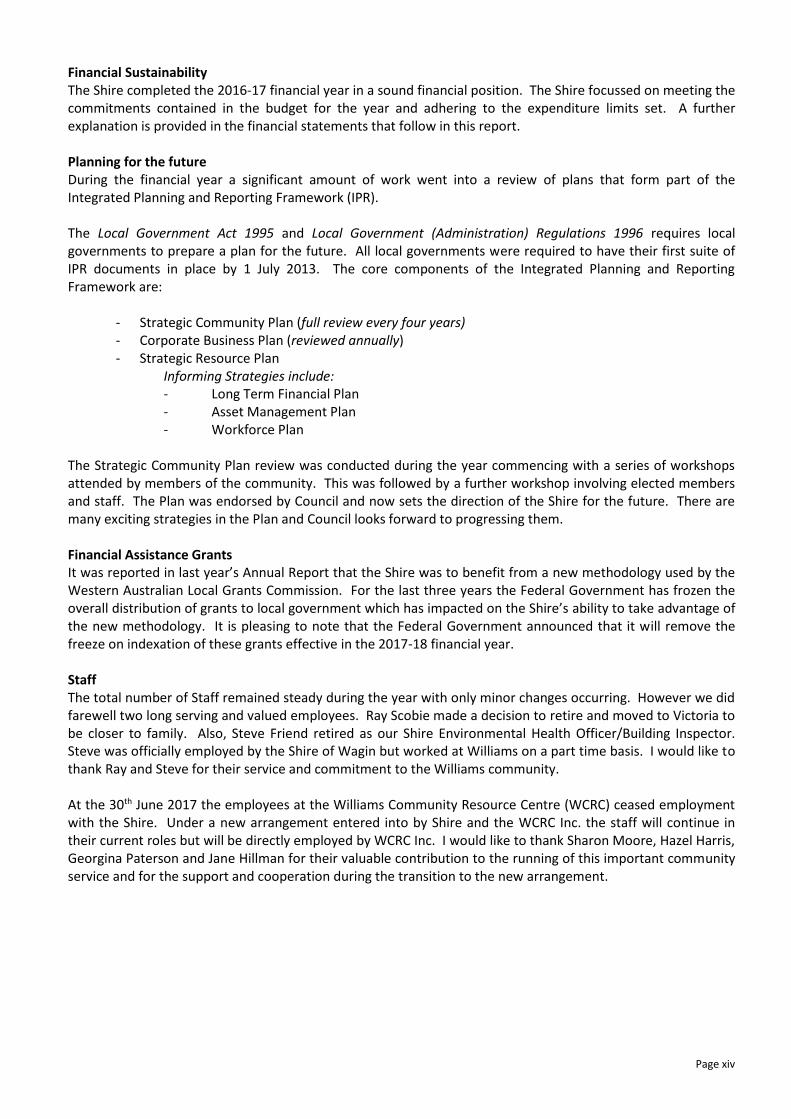
Cash and Reserves Council had cash holdings of $1,373,236 as at the 30th June 2017.
-$500,000
$-
$500,000
$1,000,000
$1,500,000
$2,000,000
2007 2008 2009 2010 2011 2012 2013 2014 2015 2016 2017
Restricted
Unrestricted
Rates Council adopted an 8.42% general rate increase in 2016/17. This resulted in a total rate collection of $1,701,983 compared to $1,557,208 the previous year. The average rate increase since 2007 has been 4.39% which is slightly above the average CPI increase of 2.73% for the same period.
Page xvii
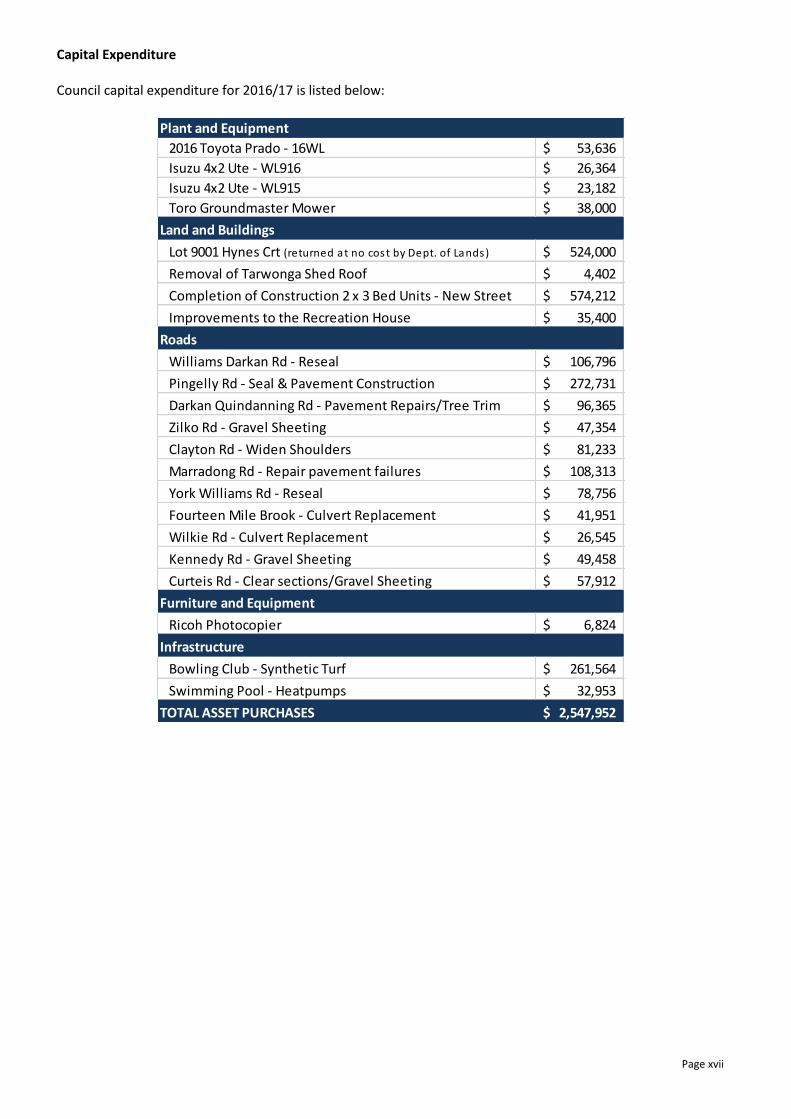
Capital Expenditure Council capital expenditure for 2016/17 is listed below:
Plant and Equipment
2016 Toyota Prado - 16WL 53,636$
Isuzu 4x2 Ute - WL916 26,364$
Isuzu 4x2 Ute - WL915 23,182$
Toro Groundmaster Mower 38,000$
Land and Buildings
Lot 9001 Hynes Crt (returned at no cost by Dept. of Lands) 524,000$
Removal of Tarwonga Shed Roof 4,402$
Completion of Construction 2 x 3 Bed Units - New Street 574,212$
Improvements to the Recreation House 35,400$
Roads
Williams Darkan Rd - Reseal 106,796$
Pingelly Rd - Seal & Pavement Construction 272,731$
Darkan Quindanning Rd - Pavement Repairs/Tree Trim 96,365$
Zilko Rd - Gravel Sheeting 47,354$
Clayton Rd - Widen Shoulders 81,233$
Marradong Rd - Repair pavement failures 108,313$
York Williams Rd - Reseal 78,756$
Fourteen Mile Brook - Culvert Replacement 41,951$
Wilkie Rd - Culvert Replacement 26,545$
Kennedy Rd - Gravel Sheeting 49,458$
Curteis Rd - Clear sections/Gravel Sheeting 57,912$
Furniture and Equipment
Ricoh Photocopier 6,824$
Infrastructure
Bowling Club - Synthetic Turf 261,564$
Swimming Pool - Heatpumps 32,953$
TOTAL ASSET PURCHASES 2,547,952$
Page xviii
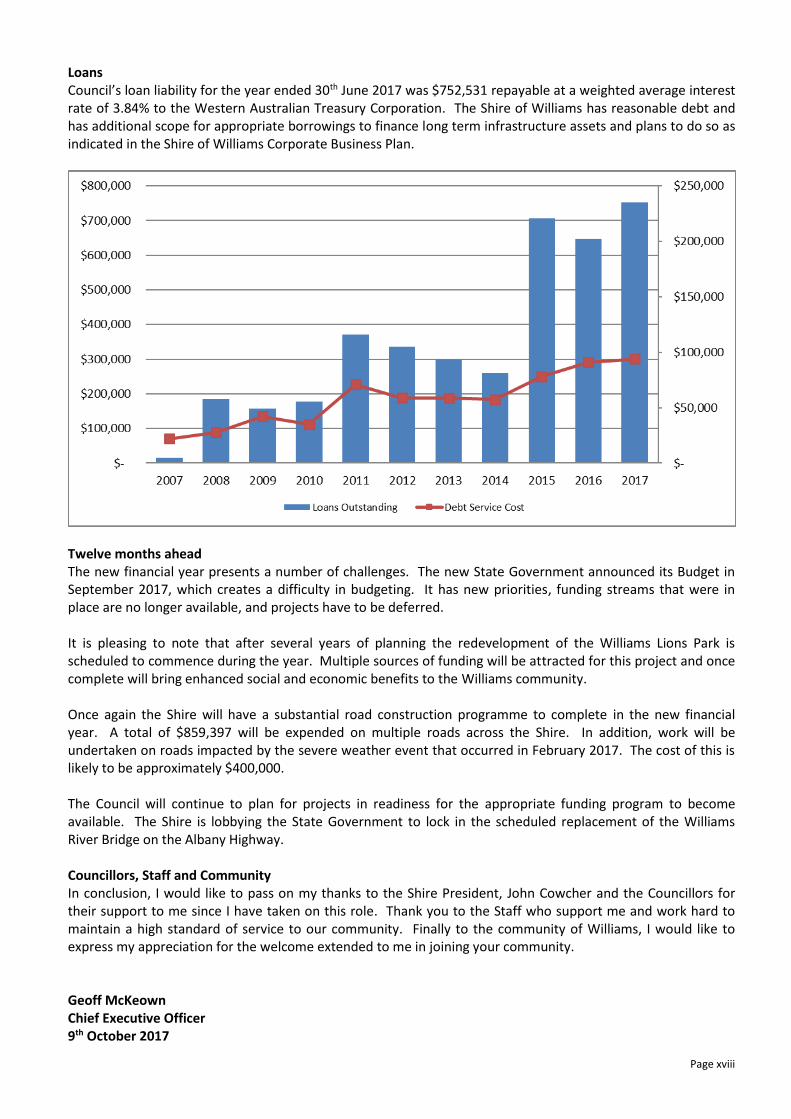
Loans Council’s loan liability for the year ended 30th June 2017 was $752,531 repayable at a weighted average interest rate of 3.84% to the Western Australian Treasury Corporation. The Shire of Williams has reasonable debt and has additional scope for appropriate borrowings to finance long term infrastructure assets and plans to do so as indicated in the Shire of Williams Corporate Business Plan.
Twelve months ahead The new financial year presents a number of challenges. The new State Government announced its Budget in September 2017, which creates a difficulty in budgeting. It has new priorities, funding streams that were in place are no longer available, and projects have to be deferred. It is pleasing to note that after several years of planning the redevelopment of the Williams Lions Park is scheduled to commence during the year. Multiple sources of funding will be attracted for this project and once complete will bring enhanced social and economic benefits to the Williams community. Once again the Shire will have a substantial road construction programme to complete in the new financial year. A total of $859,397 will be expended on multiple roads across the Shire. In addition, work will be undertaken on roads impacted by the severe weather event that occurred in February 2017. The cost of this is likely to be approximately $400,000. The Council will continue to plan for projects in readiness for the appropriate funding program to become available. The Shire is lobbying the State Government to lock in the scheduled replacement of the Williams River Bridge on the Albany Highway. Councillors, Staff and Community In conclusion, I would like to pass on my thanks to the Shire President, John Cowcher and the Councillors for their support to me since I have taken on this role. Thank you to the Staff who support me and work hard to maintain a high standard of service to our community. Finally to the community of Williams, I would like to express my appreciation for the welcome extended to me in joining your community. Geoff McKeown Chief Executive Officer 9th October 2017
Page xix
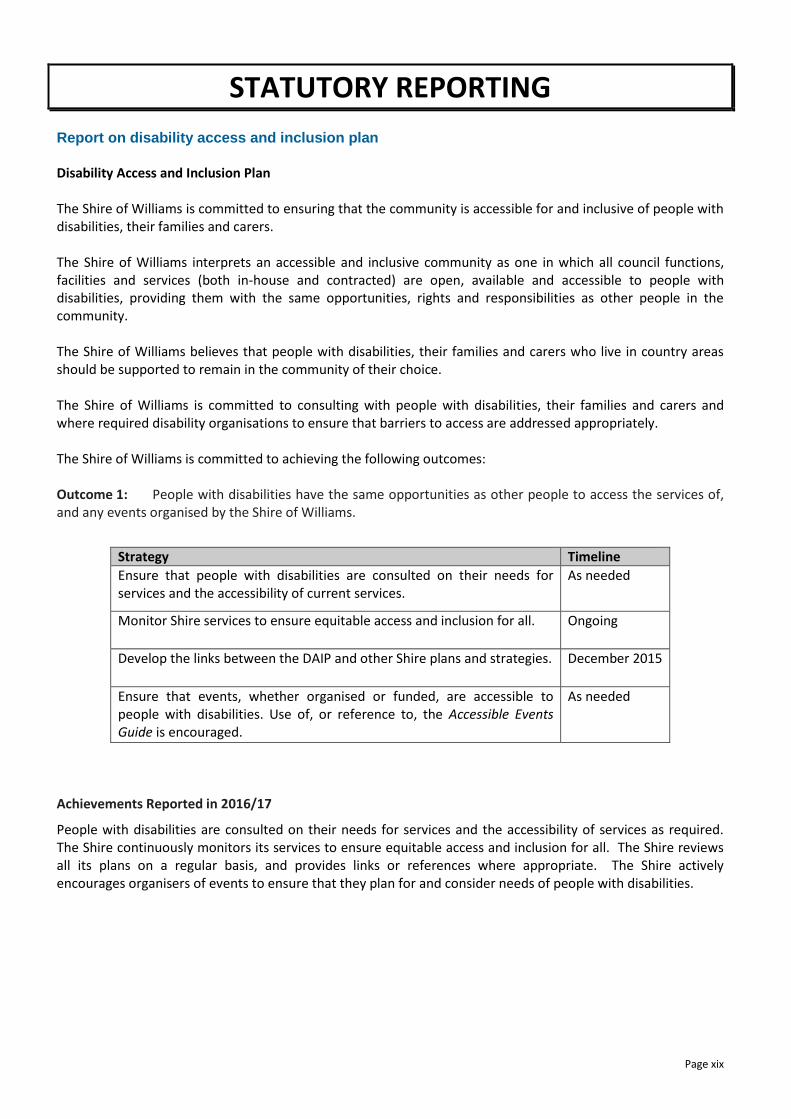
STATUTORY REPORTING Report on disability access and inclusion plan Disability Access and Inclusion Plan The Shire of Williams is committed to ensuring that the community is accessible for and inclusive of people with disabilities, their families and carers. The Shire of Williams interprets an accessible and inclusive community as one in which all council functions, facilities and services (both in-house and contracted) are open, available and accessible to people with disabilities, providing them with the same opportunities, rights and responsibilities as other people in the community. The Shire of Williams believes that people with disabilities, their families and carers who live in country areas should be supported to remain in the community of their choice. The Shire of Williams is committed to consulting with people with disabilities, their families and carers and where required disability organisations to ensure that barriers to access are addressed appropriately. The Shire of Williams is committed to achieving the following outcomes: Outcome 1: People with disabilities have the same opportunities as other people to access the services of, and any events organised by the Shire of Williams.
Strategy Timeline
Ensure that people with disabilities are consulted on their needs for services and the accessibility of current services.
As needed
Monitor Shire services to ensure equitable access and inclusion for all. Ongoing
Develop the links between the DAIP and other Shire plans and strategies. December 2015
Ensure that events, whether organised or funded, are accessible to people with disabilities. Use of, or reference to, the Accessible Events Guide is encouraged.
As needed
Achievements Reported in 2016/17
People with disabilities are consulted on their needs for services and the accessibility of services as required. The Shire continuously monitors its services to ensure equitable access and inclusion for all. The Shire reviews all its plans on a regular basis, and provides links or references where appropriate. The Shire actively encourages organisers of events to ensure that they plan for and consider needs of people with disabilities.

Page xx
Outcome 2: People with disabilities have the same opportunities as other people to access the buildings and other facilities of the Shire of Williams.
Strategy Timeline
Ensure that all public buildings and facilities meet the standards for access and any demonstrated additional need.
Ongoing
Ensure that all new or redevelopment works provide access to people with disabilities, where practicable.
Ongoing
Ensure that ACROD parking meets the needs of people with disabilities in terms of quantity and location.
Ongoing
Advocate to local businesses and tourist venues the requirements for and benefits flowing from the provision of accessible venues.
Ongoing
Planning for access needs for the Williams Lions Park. December 2015
Ensure that all recreational areas are accessible. June 2017
Achievements Reported in 2016/17 All public buildings and facilities meet the standards for access as identified. Any new buildings or facilities are planned to provide access for people with disabilities where practicable. ACROD parking bays are provided where needed and identified. The Shire continuously advocates to local businesses to ensure that they consider access for people with disabilities where they can. The redevelopment of the Williams Lions Park has considered access for people with disabilities and once implemented this project will be able to review its effectiveness. Recreational areas are accessible as appropriate. Outcome 3: People with disabilities receive information from the Shire of Williams in a format that will enable them to access the information as readily as other people are able to access it.
Strategy Timeline
Improve staff awareness of accessible information needs and how to provide information in other formats.
December 2015
Ensure that the Shire’s website meets contemporary good practice. Ongoing
Ensuring that information on the Shire’s website is available in an alternative format upon request.
December 2015
Achievements Reported in 2016/17 Staff are aware of accessible information needs and how to provide this as required and on request. The Shire’s website meets contemporary good practice as required. Information on the Shire’s website can be provided in an alternative format on request, however this request is yet to be made, so this cannot be evaluated for effectiveness.
Page xxi
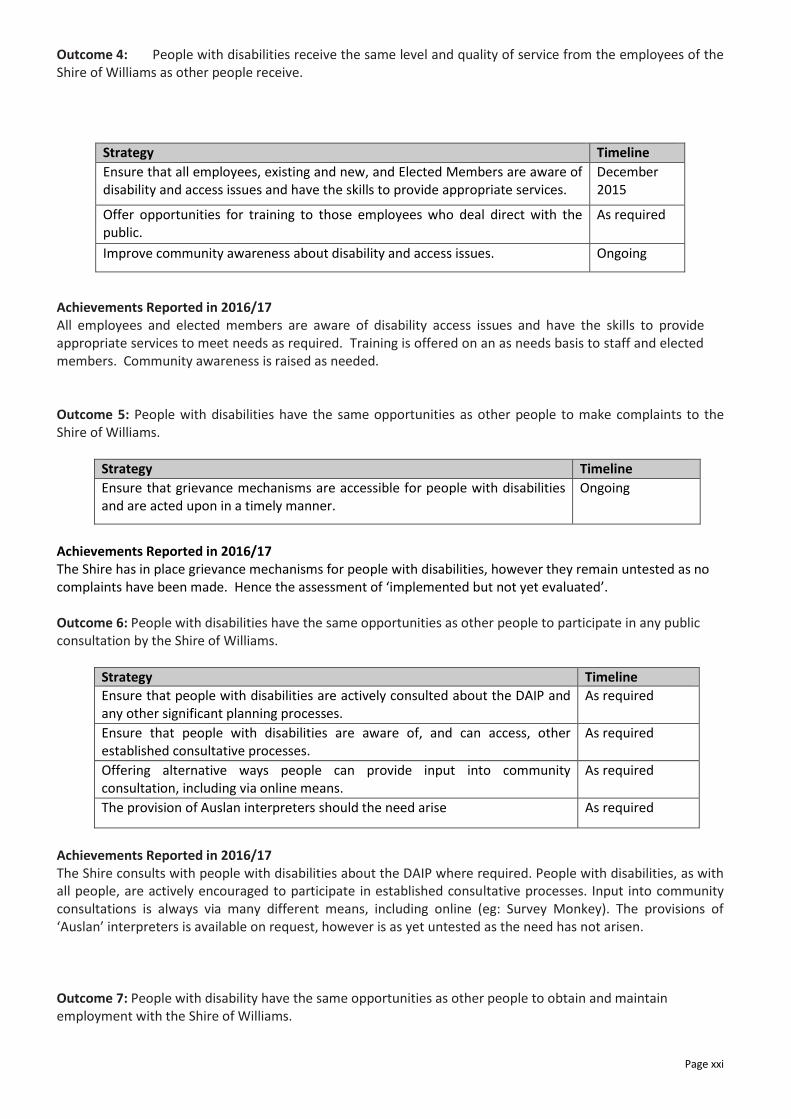
Outcome 4: People with disabilities receive the same level and quality of service from the employees of the Shire of Williams as other people receive.
Strategy Timeline
Ensure that all employees, existing and new, and Elected Members are aware of disability and access issues and have the skills to provide appropriate services.
December 2015
Offer opportunities for training to those employees who deal direct with the public.
As required
Improve community awareness about disability and access issues. Ongoing
Achievements Reported in 2016/17 All employees and elected members are aware of disability access issues and have the skills to provide appropriate services to meet needs as required. Training is offered on an as needs basis to staff and elected members. Community awareness is raised as needed. Outcome 5: People with disabilities have the same opportunities as other people to make complaints to the Shire of Williams.
Strategy Timeline
Ensure that grievance mechanisms are accessible for people with disabilities and are acted upon in a timely manner.
Ongoing
Achievements Reported in 2016/17 The Shire has in place grievance mechanisms for people with disabilities, however they remain untested as no complaints have been made. Hence the assessment of ‘implemented but not yet evaluated’. Outcome 6: People with disabilities have the same opportunities as other people to participate in any public consultation by the Shire of Williams.
Strategy Timeline
Ensure that people with disabilities are actively consulted about the DAIP and any other significant planning processes.
As required
Ensure that people with disabilities are aware of, and can access, other established consultative processes.
As required
Offering alternative ways people can provide input into community consultation, including via online means.
As required
The provision of Auslan interpreters should the need arise As required
Achievements Reported in 2016/17 The Shire consults with people with disabilities about the DAIP where required. People with disabilities, as with all people, are actively encouraged to participate in established consultative processes. Input into community consultations is always via many different means, including online (eg: Survey Monkey). The provisions of ‘Auslan’ interpreters is available on request, however is as yet untested as the need has not arisen. Outcome 7: People with disability have the same opportunities as other people to obtain and maintain employment with the Shire of Williams.
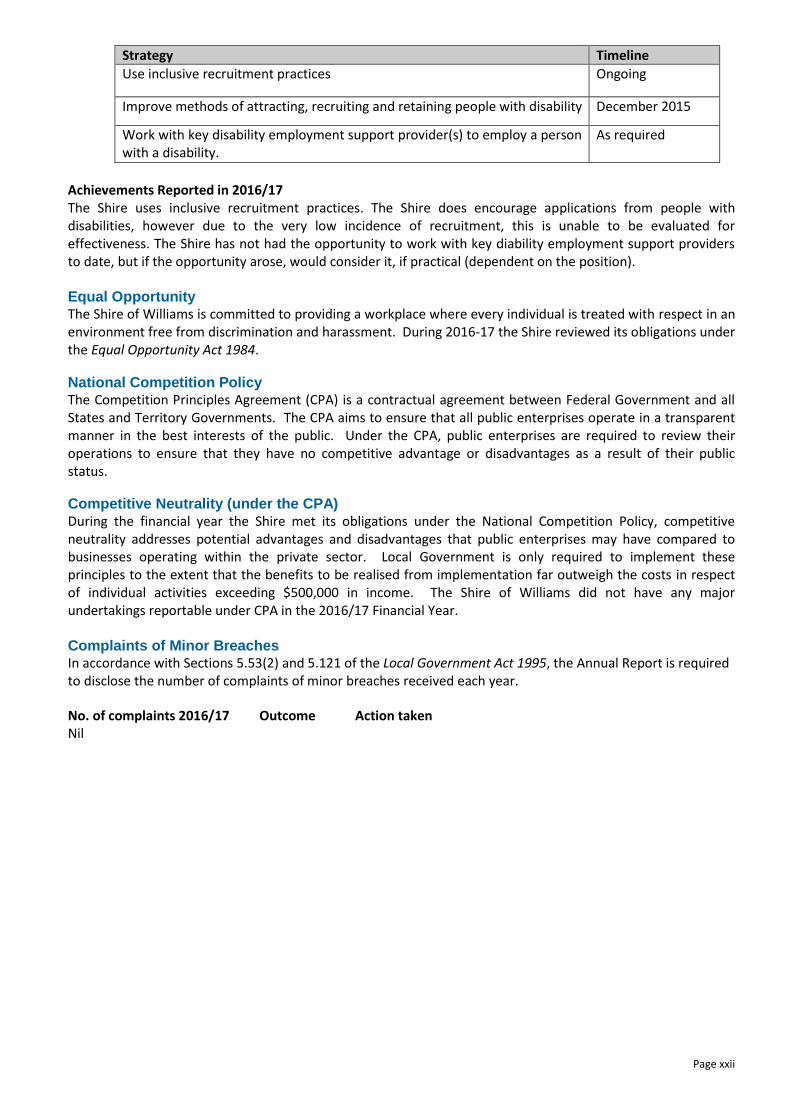
Page xxii
Strategy Timeline
Use inclusive recruitment practices Ongoing
Improve methods of attracting, recruiting and retaining people with disability December 2015
Work with key disability employment support provider(s) to employ a person with a disability.
As required
Achievements Reported in 2016/17 The Shire uses inclusive recruitment practices. The Shire does encourage applications from people with disabilities, however due to the very low incidence of recruitment, this is unable to be evaluated for effectiveness. The Shire has not had the opportunity to work with key diability employment support providers to date, but if the opportunity arose, would consider it, if practical (dependent on the position). Equal Opportunity The Shire of Williams is committed to providing a workplace where every individual is treated with respect in an environment free from discrimination and harassment. During 2016-17 the Shire reviewed its obligations under the Equal Opportunity Act 1984.
National Competition Policy The Competition Principles Agreement (CPA) is a contractual agreement between Federal Government and all States and Territory Governments. The CPA aims to ensure that all public enterprises operate in a transparent manner in the best interests of the public. Under the CPA, public enterprises are required to review their operations to ensure that they have no competitive advantage or disadvantages as a result of their public status.
Competitive Neutrality (under the CPA)
During the financial year the Shire met its obligations under the National Competition Policy, competitive neutrality addresses potential advantages and disadvantages that public enterprises may have compared to businesses operating within the private sector. Local Government is only required to implement these principles to the extent that the benefits to be realised from implementation far outweigh the costs in respect of individual activities exceeding $500,000 in income. The Shire of Williams did not have any major undertakings reportable under CPA in the 2016/17 Financial Year. Complaints of Minor Breaches In accordance with Sections 5.53(2) and 5.121 of the Local Government Act 1995, the Annual Report is required to disclose the number of complaints of minor breaches received each year. 2011 -12
No. of complaints 2016/17 Outcome Action taken Nil

Page xxiii
Report on record keeping plan As required under the State Records Act 2000 Council adopted a Record Keeping Plan in February 2004. A new Record Keeping Plan was adopted and approved in February 2011. An amended plan was submitted for review in January 2017. Principle 6 requires Council to ensure that employees comply with the Record Keeping Plan. The following activities have been undertaken to ensure staff awareness and compliance:
1. Presentations of the record keeping program to staff on a regular basis. 2. In house and external training has been conducted for staff. 3. Staff information sessions have been held as required. 4. Induction programs were undertaken for new staff.
Employees Remuneration The Local Government (Administration) Regulation 19B requires the annual report to contain details of the number of employees of the local government entitled to an annual salary of $100,000 or more in bands of $10,000 for each such band over $100,000.
Salary Range 2016 2017 $100,000 - $110,000 1 0 $110,000 - $120,000 1 0 $120,000 - $130,000 0 1 Geoff McKeown Chief Executive Officer 13th October 2017
Page xxiv
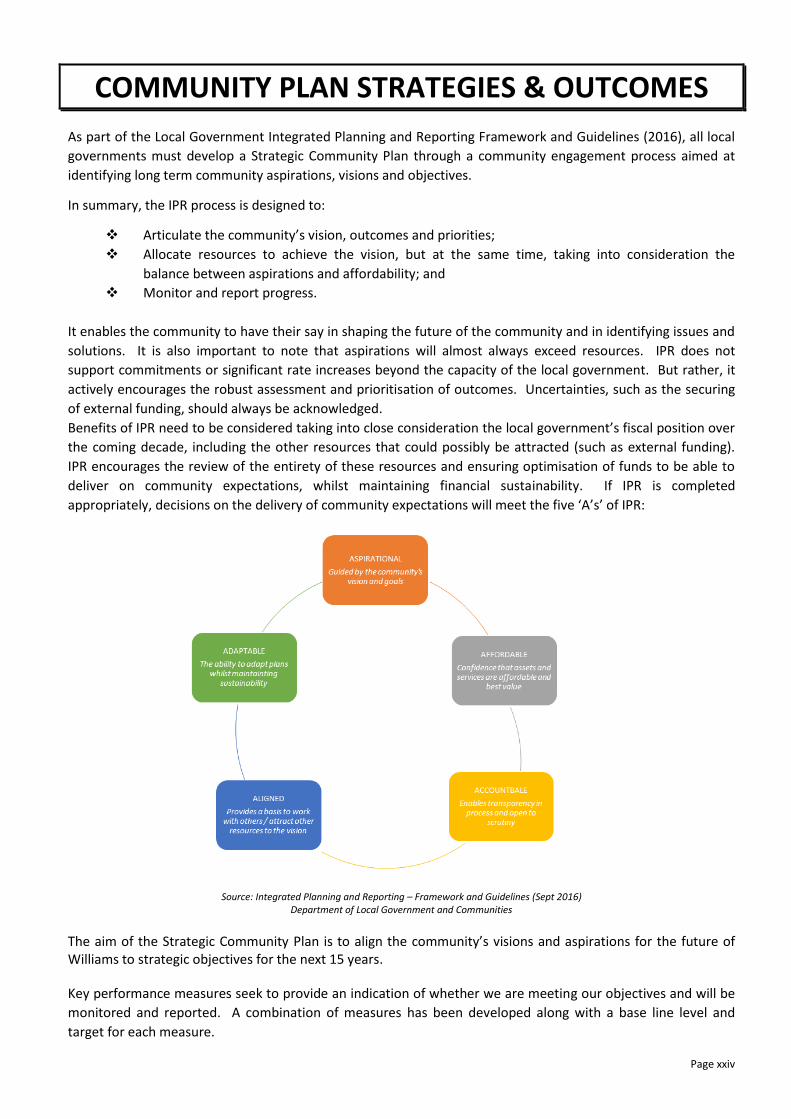
COMMUNITY PLAN STRATEGIES & OUTCOMES
As part of the Local Government Integrated Planning and Reporting Framework and Guidelines (2016), all local
governments must develop a Strategic Community Plan through a community engagement process aimed at
identifying long term community aspirations, visions and objectives.
In summary, the IPR process is designed to:
Articulate the community’s vision, outcomes and priorities;
Allocate resources to achieve the vision, but at the same time, taking into consideration the
balance between aspirations and affordability; and
Monitor and report progress.
It enables the community to have their say in shaping the future of the community and in identifying issues and
solutions. It is also important to note that aspirations will almost always exceed resources. IPR does not
support commitments or significant rate increases beyond the capacity of the local government. But rather, it
actively encourages the robust assessment and prioritisation of outcomes. Uncertainties, such as the securing
of external funding, should always be acknowledged.
Benefits of IPR need to be considered taking into close consideration the local government’s fiscal position over
the coming decade, including the other resources that could possibly be attracted (such as external funding).
IPR encourages the review of the entirety of these resources and ensuring optimisation of funds to be able to
deliver on community expectations, whilst maintaining financial sustainability. If IPR is completed
appropriately, decisions on the delivery of community expectations will meet the five ‘A’s’ of IPR:
Source: Integrated Planning and Reporting – Framework and Guidelines (Sept 2016) Department of Local Government and Communities
The aim of the Strategic Community Plan is to align the community’s visions and aspirations for the future of Williams to strategic objectives for the next 15 years.
Key performance measures seek to provide an indication of whether we are meeting our objectives and will be
monitored and reported. A combination of measures has been developed along with a base line level and
target for each measure.
Page xxv
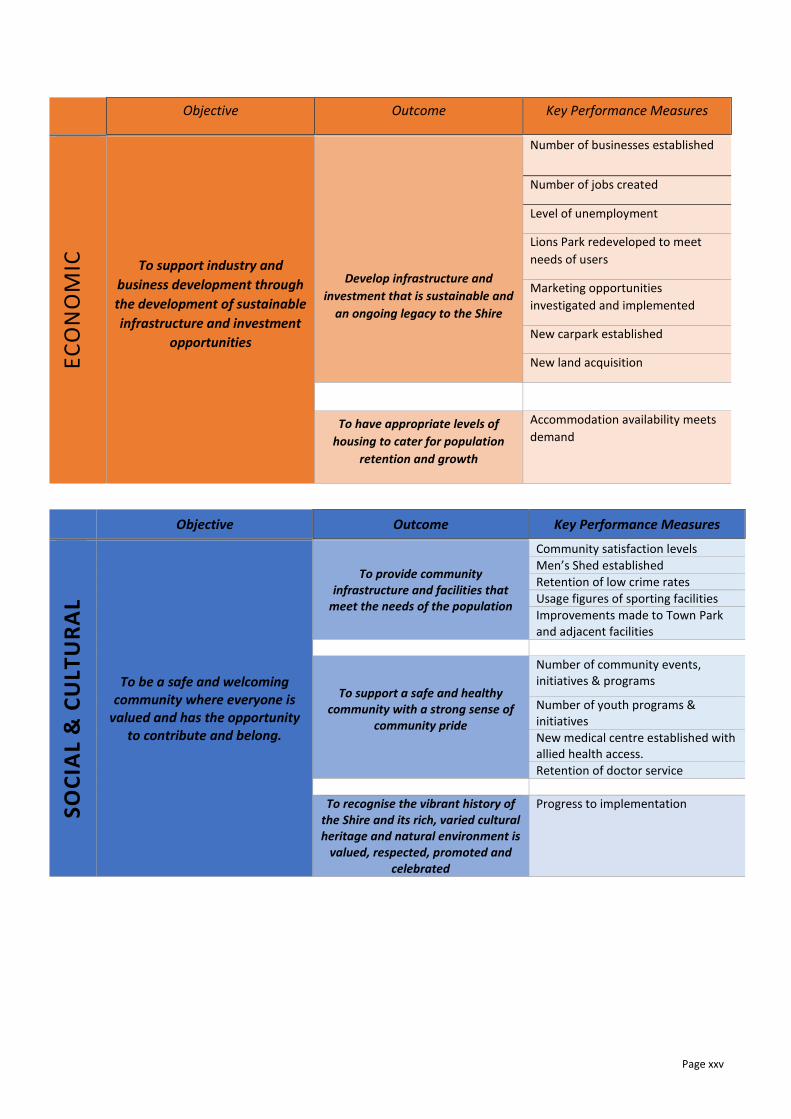
Objective Outcome Key Performance Measures
EC
ON
OM
IC
To support industry and
business development through
the development of sustainable
infrastructure and investment
opportunities
Develop infrastructure and
investment that is sustainable and
an ongoing legacy to the Shire
Number of businesses established
Number of jobs created
Level of unemployment
Lions Park redeveloped to meet
needs of users
Marketing opportunities
investigated and implemented
New carpark established
New land acquisition
To have appropriate levels of
housing to cater for population
retention and growth
Accommodation availability meets
demand
Objective Outcome Key Performance Measures
SO
CIA
L &
CU
LTU
RA
L
To be a safe and welcoming community where everyone is
valued and has the opportunity to contribute and belong.
To provide community infrastructure and facilities that
meet the needs of the population
Community satisfaction levels
Men’s Shed established
Retention of low crime rates
Usage figures of sporting facilities
Improvements made to Town Park and adjacent facilities
To support a safe and healthy community with a strong sense of
community pride
Number of community events, initiatives & programs
Number of youth programs & initiatives
New medical centre established with allied health access.
Retention of doctor service
To recognise the vibrant history of the Shire and its rich, varied cultural heritage and natural environment is
valued, respected, promoted and celebrated
Progress to implementation
Page xxvi
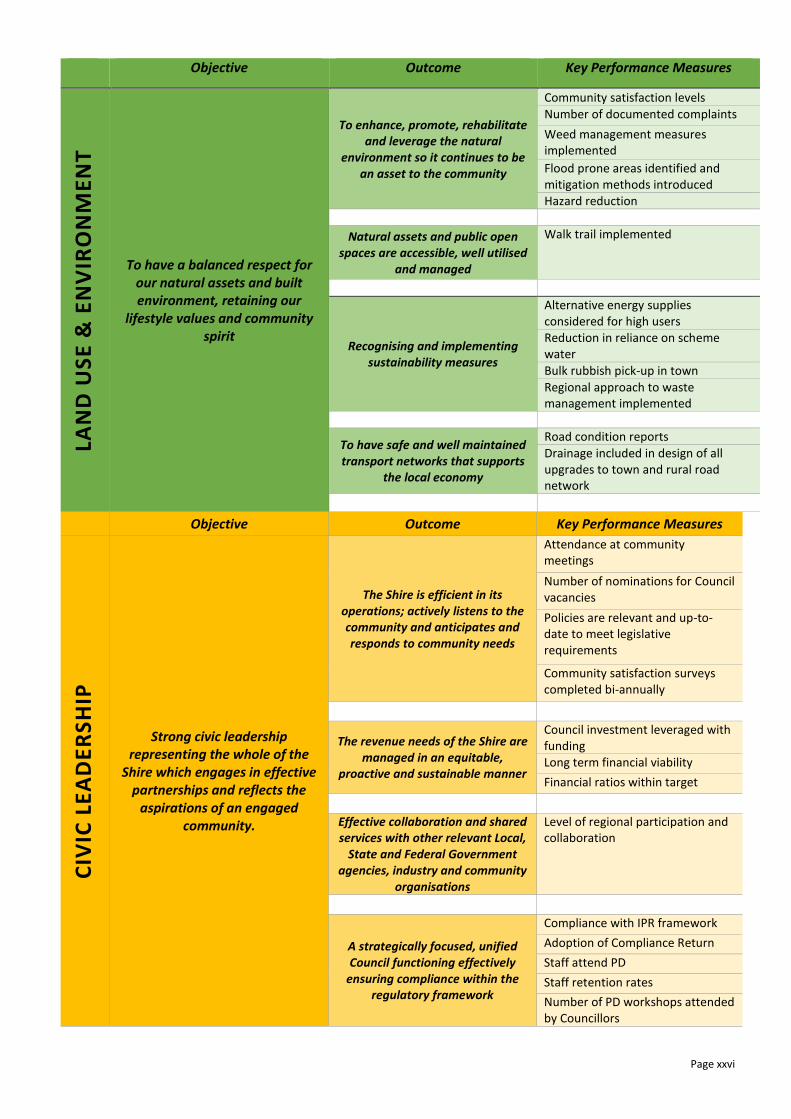
Objective Outcome Key Performance Measures LA
ND
US
E &
EN
VIR
ON
ME
NT
To have a balanced respect for our natural assets and built environment, retaining our
lifestyle values and community spirit
To enhance, promote, rehabilitate and leverage the natural
environment so it continues to be an asset to the community
Community satisfaction levels
Number of documented complaints
Weed management measures implemented
Flood prone areas identified and mitigation methods introduced Hazard reduction
Natural assets and public open spaces are accessible, well utilised
and managed
Walk trail implemented
Recognising and implementing sustainability measures
Alternative energy supplies considered for high users Reduction in reliance on scheme water
Bulk rubbish pick-up in town
Regional approach to waste management implemented
To have safe and well maintained transport networks that supports
the local economy
Road condition reports
Drainage included in design of all upgrades to town and rural road network
Objective Outcome Key Performance Measures
CIV
IC L
EA
DE
RS
HIP
Strong civic leadership representing the whole of the
Shire which engages in effective partnerships and reflects the
aspirations of an engaged community.
The Shire is efficient in its operations; actively listens to the community and anticipates and responds to community needs
Attendance at community meetings
Number of nominations for Council vacancies
Policies are relevant and up-to-date to meet legislative requirements
Community satisfaction surveys completed bi-annually
The revenue needs of the Shire are managed in an equitable,
proactive and sustainable manner
Council investment leveraged with funding Long term financial viability
Financial ratios within target
Effective collaboration and shared services with other relevant Local,
State and Federal Government agencies, industry and community
organisations
Level of regional participation and collaboration
A strategically focused, unified Council functioning effectively
ensuring compliance within the regulatory framework
Compliance with IPR framework
Adoption of Compliance Return
Staff attend PD
Staff retention rates
Number of PD workshops attended by Councillors

Page xxvii
Corporate Business Plan
Workforce Plan
The Shire of Williams Corporate Business Plan 2017 - 2021 is part of a network of plans that outlines the Shire’s activities over the next four years. The plan not only identifies our immediate and longer term operational needs, and services provided, but also provides information on the major projects identified by the community.
The makeup of the workforce in both the public and private sectors have taken on greater importance. It requires greater attention and planning to achieve the necessary and appropriate knowledge and skills to ensure the delivery of efficient and effective quality services. Organisations must now plan to shape their workforce recognising the current and future organisation goals, objectives and direction. This workforce plan is an informing strategy to the Shire of Williams Corporate Business Plan and is integral to the continuous improvement program the Shire is undertaking to plan for our future.
FINANCIAL REPORT
FOR THE YEAR ENDED 30TH JUNE 2017
TABLE OF CONTENTS
Statement by Chief Executive Officer 2
Statement of Comprehensive Income by Nature or Type 3
Statement of Comprehensive Income by Program 4
Statement of Financial Position 5
Statement of Changes in Equity 6
Statement of Cash Flows 7
Rate Setting Statement 8
Notes to and Forming Part of the Financial Report 9 to 53
Independent Audit Report 54 to 57
Supplementary Ratio Information 58
Principal place of business:9 Brooking StreetWilliams WA 6391
SHIRE OF WILLIAMS
Page 1
Page 2

SHIRE OF WILLIAMS
STATEMENT OF COMPREHENSIVE INCOME
BY NATURE OR TYPE
FOR THE YEAR ENDED 30TH JUNE 2017
NOTE 2017 2017 2016
$ Budget $
$
Revenue
Rates 22 1,701,983 1,681,705 1,557,208
Operating grants, subsidies and contributions 29 1,001,391 845,905 370,519
Fees and charges 28 624,046 631,831 639,062
Service charges 25 0 0 0
Interest earnings 2(a) 35,599 38,318 43,609
Other revenue 2(a) 279,373 226,904 245,773
3,642,392 3,424,663 2,856,171
Expenses
Employee costs (1,562,878) (1,583,185) (1,523,099)
Materials and contracts (781,833) (932,193) (537,304)
Utility charges (156,825) (161,200) (154,533)
Depreciation on non-current assets 2(a) (1,577,518) (1,219,800) (1,606,383)
Interest expenses 2(a) (35,992) (32,272) (33,685)
Insurance expenses (147,504) (144,237) (143,549)
Other expenditure 0 0 0
(4,262,550) (4,072,887) (3,998,553)
(620,158) (648,224) (1,142,382)
Non-operating grants, subsidies and contributions 29 1,894,736 1,178,911 1,251,866
Profit on asset disposals 20 0 500 1,526
(Loss) on asset disposals 20 (117,736) 0 (17,085)
(Loss) on revaluation of furniture and equipment 6(b) 0 0 (11,477)
Reversal of prior year loss on revaluation of plant and
equipment 6(b) 0 0 17,770
Net result 1,156,842 531,187 100,218
Other comprehensive income
Items that will not be reclassified subsequently to profit or loss
Changes on revaluation of non-current assets 12 (2,877,364) 0 26,678
Total other comprehensive income (2,877,364) 0 26,678
Total comprehensive income (1,720,522) 531,187 126,896
This statement is to be read in conjunction with the accompanying notes.
Page 3
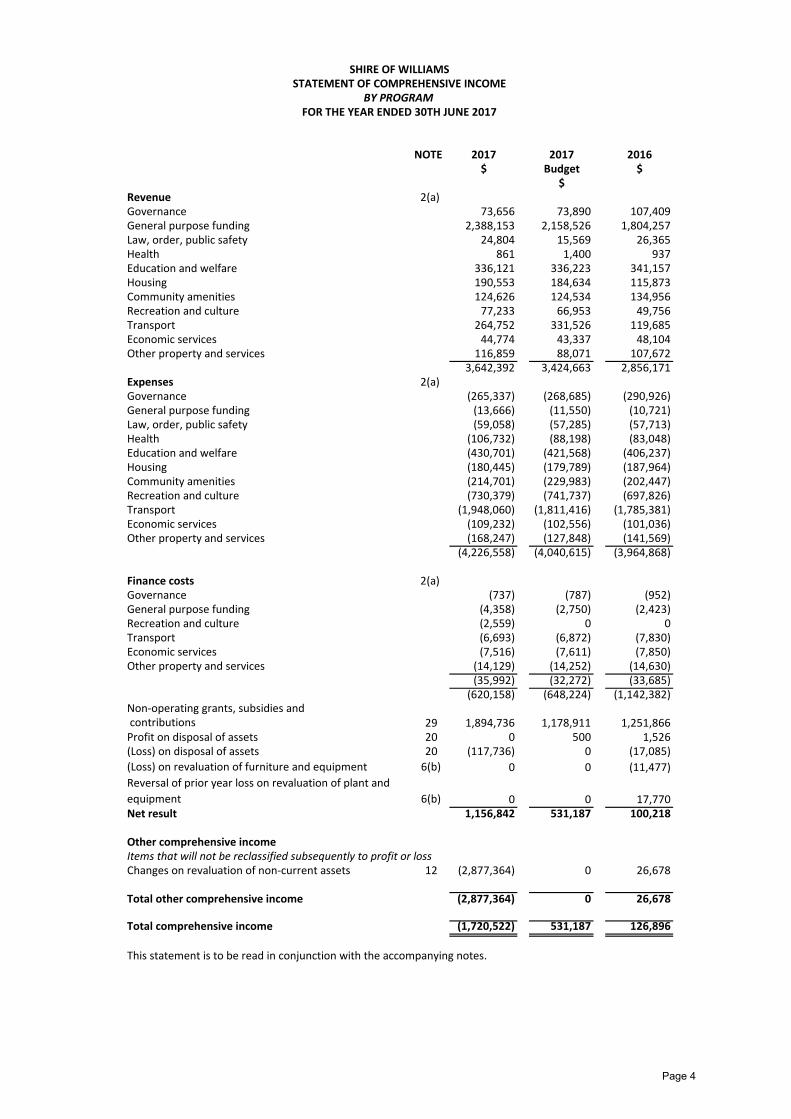
SHIRE OF WILLIAMSSTATEMENT OF COMPREHENSIVE INCOME
BY PROGRAMFOR THE YEAR ENDED 30TH JUNE 2017
NOTE 2017 2017 2016$ Budget $
$Revenue 2(a) Governance 73,656 73,890 107,409General purpose funding 2,388,153 2,158,526 1,804,257Law, order, public safety 24,804 15,569 26,365Health 861 1,400 937Education and welfare 336,121 336,223 341,157Housing 190,553 184,634 115,873Community amenities 124,626 124,534 134,956Recreation and culture 77,233 66,953 49,756Transport 264,752 331,526 119,685Economic services 44,774 43,337 48,104Other property and services 116,859 88,071 107,672
3,642,392 3,424,663 2,856,171Expenses 2(a) Governance (265,337) (268,685) (290,926)General purpose funding (13,666) (11,550) (10,721)Law, order, public safety (59,058) (57,285) (57,713)Health (106,732) (88,198) (83,048)Education and welfare (430,701) (421,568) (406,237)Housing (180,445) (179,789) (187,964)Community amenities (214,701) (229,983) (202,447)Recreation and culture (730,379) (741,737) (697,826)Transport (1,948,060) (1,811,416) (1,785,381)Economic services (109,232) (102,556) (101,036)Other property and services (168,247) (127,848) (141,569)
(4,226,558) (4,040,615) (3,964,868)
Finance costs 2(a) Governance (737) (787) (952)General purpose funding (4,358) (2,750) (2,423)Recreation and culture (2,559) 0 0Transport (6,693) (6,872) (7,830)Economic services (7,516) (7,611) (7,850)Other property and services (14,129) (14,252) (14,630)
(35,992) (32,272) (33,685)(620,158) (648,224) (1,142,382)
Non-operating grants, subsidies and contributions 29 1,894,736 1,178,911 1,251,866Profit on disposal of assets 20 0 500 1,526(Loss) on disposal of assets 20 (117,736) 0 (17,085)
(Loss) on revaluation of furniture and equipment 6(b) 0 0 (11,477)
Reversal of prior year loss on revaluation of plant and
equipment 6(b) 0 0 17,770Net result 1,156,842 531,187 100,218
Other comprehensive incomeItems that will not be reclassified subsequently to profit or lossChanges on revaluation of non-current assets 12 (2,877,364) 0 26,678
Total other comprehensive income (2,877,364) 0 26,678
Total comprehensive income (1,720,522) 531,187 126,896
This statement is to be read in conjunction with the accompanying notes.
Page 4
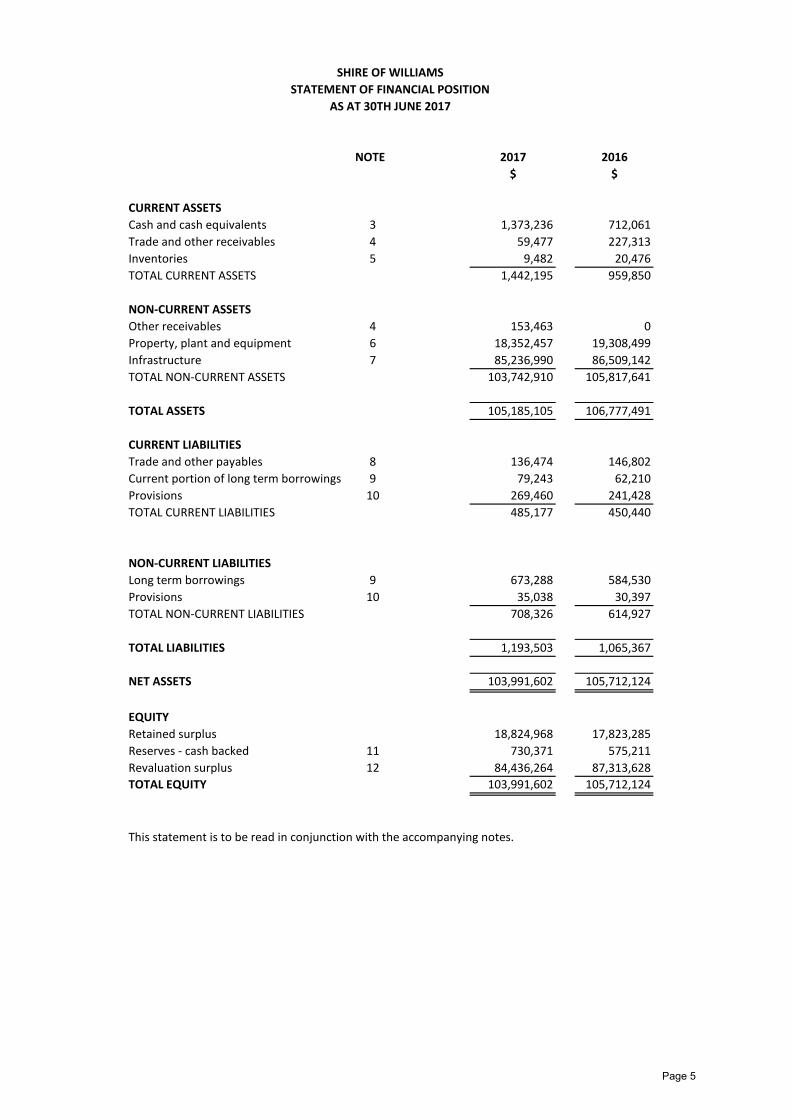
SHIRE OF WILLIAMS
STATEMENT OF FINANCIAL POSITION
AS AT 30TH JUNE 2017
NOTE 2017 2016
$ $
CURRENT ASSETS
Cash and cash equivalents 3 1,373,236 712,061
Trade and other receivables 4 59,477 227,313
Inventories 5 9,482 20,476
TOTAL CURRENT ASSETS 1,442,195 959,850
NON-CURRENT ASSETS
Other receivables 4 153,463 0
Property, plant and equipment 6 18,352,457 19,308,499
Infrastructure 7 85,236,990 86,509,142
TOTAL NON-CURRENT ASSETS 103,742,910 105,817,641
TOTAL ASSETS 105,185,105 106,777,491
CURRENT LIABILITIES
Trade and other payables 8 136,474 146,802
Current portion of long term borrowings 9 79,243 62,210
Provisions 10 269,460 241,428
TOTAL CURRENT LIABILITIES 485,177 450,440
NON-CURRENT LIABILITIES
Long term borrowings 9 673,288 584,530
Provisions 10 35,038 30,397
TOTAL NON-CURRENT LIABILITIES 708,326 614,927
TOTAL LIABILITIES 1,193,503 1,065,367
NET ASSETS 103,991,602 105,712,124
EQUITY
Retained surplus 18,824,968 17,823,285
Reserves - cash backed 11 730,371 575,211
Revaluation surplus 12 84,436,264 87,313,628
TOTAL EQUITY 103,991,602 105,712,124
This statement is to be read in conjunction with the accompanying notes.
Page 5

SHIRE OF WILLIAMS
STATEMENT OF CHANGES IN EQUITY
FOR THE YEAR ENDED 30TH JUNE 2017
RESERVES
RETAINED CASH REVALUATION TOTAL
NOTE SURPLUS BACKED SURPLUS EQUITY
$ $ $ $
Balance as at 1 July 2015 17,801,278 497,000 87,286,950 105,585,228
Comprehensive income
Net result 100,218 0 0 100,218
Changes on revaluation of assets 12 0 0 26,678 26,678
Total comprehensive income 100,218 0 26,678 126,896
Transfers from/(to) reserves (78,211) 78,211 0 0
Balance as at 30 June 2016 17,823,285 575,211 87,313,628 105,712,124
Comprehensive income
Net result 1,156,842 0 0 1,156,842
Changes on revaluation of assets 12 0 0 (2,877,364) (2,877,364)
Total comprehensive income 1,156,842 0 (2,877,364) (1,720,522)
Transfers from/(to) reserves (155,160) 155,160 0 0
Balance as at 30 June 2017 18,824,968 730,371 84,436,264 103,991,602
This statement is to be read in conjunction with the accompanying notes.
Page 6
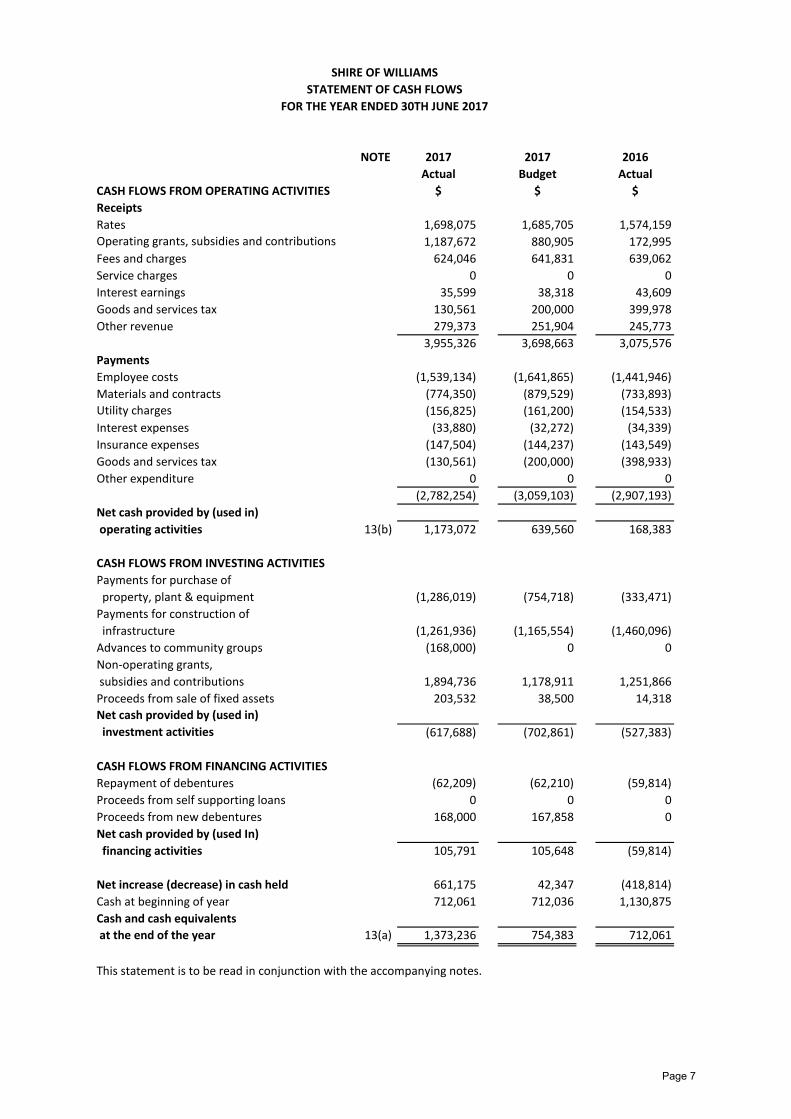
SHIRE OF WILLIAMS
STATEMENT OF CASH FLOWS
FOR THE YEAR ENDED 30TH JUNE 2017
NOTE 2017 2017 2016
Actual Budget Actual
CASH FLOWS FROM OPERATING ACTIVITIES $ $ $
Receipts
Rates 1,698,075 1,685,705 1,574,159
Operating grants, subsidies and contributions 1,187,672 880,905 172,995
Fees and charges 624,046 641,831 639,062
Service charges 0 0 0
Interest earnings 35,599 38,318 43,609
Goods and services tax 130,561 200,000 399,978
Other revenue 279,373 251,904 245,773
3,955,326 3,698,663 3,075,576
Payments
Employee costs (1,539,134) (1,641,865) (1,441,946)
Materials and contracts (774,350) (879,529) (733,893)
Utility charges (156,825) (161,200) (154,533)
Interest expenses (33,880) (32,272) (34,339)
Insurance expenses (147,504) (144,237) (143,549)
Goods and services tax (130,561) (200,000) (398,933)
Other expenditure 0 0 0
(2,782,254) (3,059,103) (2,907,193)
Net cash provided by (used in)
operating activities 13(b) 1,173,072 639,560 168,383
CASH FLOWS FROM INVESTING ACTIVITIES
Payments for purchase of
property, plant & equipment (1,286,019) (754,718) (333,471)
Payments for construction of
infrastructure (1,261,936) (1,165,554) (1,460,096)
Advances to community groups (168,000) 0 0
Non-operating grants,
subsidies and contributions 1,894,736 1,178,911 1,251,866
Proceeds from sale of fixed assets 203,532 38,500 14,318
Net cash provided by (used in)
investment activities (617,688) (702,861) (527,383)
CASH FLOWS FROM FINANCING ACTIVITIES
Repayment of debentures (62,209) (62,210) (59,814)
Proceeds from self supporting loans 0 0 0
Proceeds from new debentures 168,000 167,858 0
Net cash provided by (used In)
financing activities 105,791 105,648 (59,814)
Net increase (decrease) in cash held 661,175 42,347 (418,814)
Cash at beginning of year 712,061 712,036 1,130,875
Cash and cash equivalents
at the end of the year 13(a) 1,373,236 754,383 712,061
This statement is to be read in conjunction with the accompanying notes.
Page 7
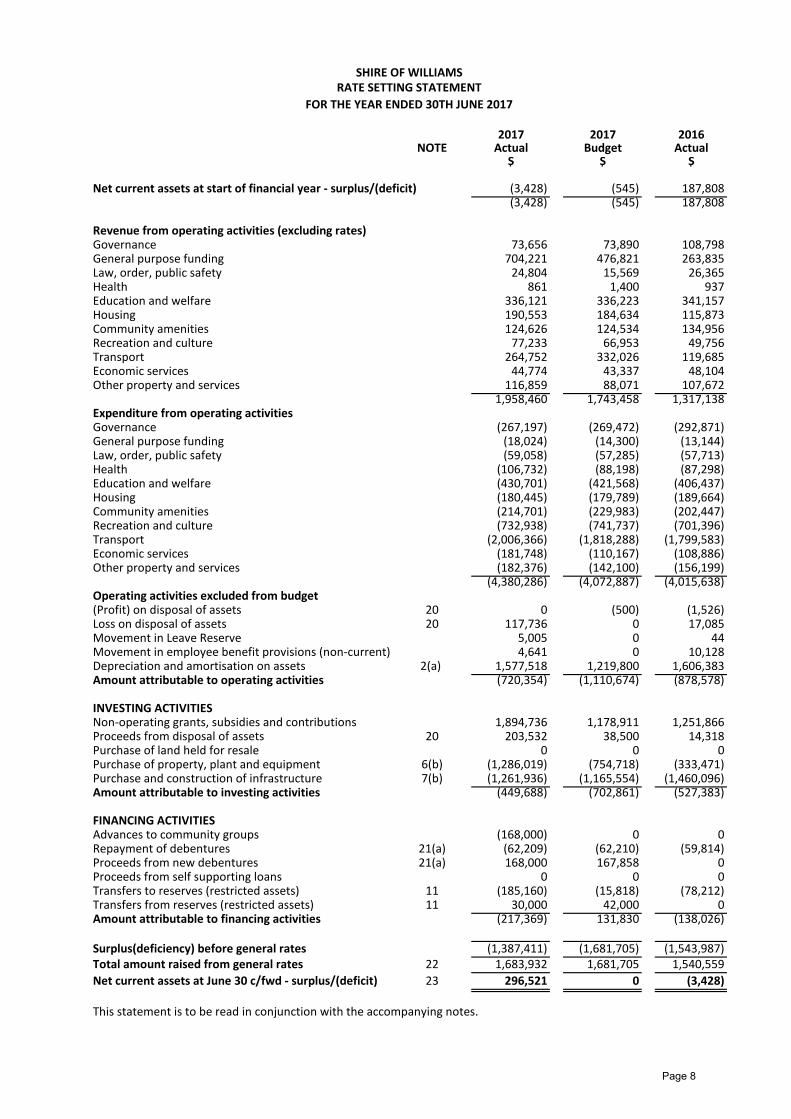
SHIRE OF WILLIAMSRATE SETTING STATEMENT
FOR THE YEAR ENDED 30TH JUNE 2017
2017 2017 2016NOTE Actual Budget Actual
$ $ $
Net current assets at start of financial year - surplus/(deficit) (3,428) (545) 187,808(3,428) (545) 187,808
Governance 73,656 73,890 108,798General purpose funding 704,221 476,821 263,835Law, order, public safety 24,804 15,569 26,365Health 861 1,400 937Education and welfare 336,121 336,223 341,157Housing 190,553 184,634 115,873Community amenities 124,626 124,534 134,956Recreation and culture 77,233 66,953 49,756Transport 264,752 332,026 119,685Economic services 44,774 43,337 48,104Other property and services 116,859 88,071 107,672
1,958,460 1,743,458 1,317,138
Governance (267,197) (269,472) (292,871)General purpose funding (18,024) (14,300) (13,144)Law, order, public safety (59,058) (57,285) (57,713)Health (106,732) (88,198) (87,298)Education and welfare (430,701) (421,568) (406,437)Housing (180,445) (179,789) (189,664)Community amenities (214,701) (229,983) (202,447)Recreation and culture (732,938) (741,737) (701,396)Transport (2,006,366) (1,818,288) (1,799,583)Economic services (181,748) (110,167) (108,886)Other property and services (182,376) (142,100) (156,199)
(4,380,286) (4,072,887) (4,015,638)Operating activities excluded from budget(Profit) on disposal of assets 20 0 (500) (1,526)Loss on disposal of assets 20 117,736 0 17,085Movement in Leave Reserve 5,005 0 44Movement in employee benefit provisions (non-current) 4,641 0 10,128Depreciation and amortisation on assets 2(a) 1,577,518 1,219,800 1,606,383Amount attributable to operating activities (720,354) (1,110,674) (878,578)
INVESTING ACTIVITIESNon-operating grants, subsidies and contributions 1,894,736 1,178,911 1,251,866Proceeds from disposal of assets 20 203,532 38,500 14,318Purchase of land held for resale 0 0 0Purchase of property, plant and equipment 6(b) (1,286,019) (754,718) (333,471)Purchase and construction of infrastructure 7(b) (1,261,936) (1,165,554) (1,460,096)Amount attributable to investing activities (449,688) (702,861) (527,383)
FINANCING ACTIVITIESAdvances to community groups (168,000) 0 0Repayment of debentures 21(a) (62,209) (62,210) (59,814)Proceeds from new debentures 21(a) 168,000 167,858 0Proceeds from self supporting loans 0 0 0Transfers to reserves (restricted assets) 11 (185,160) (15,818) (78,212)Transfers from reserves (restricted assets) 11 30,000 42,000 0Amount attributable to financing activities (217,369) 131,830 (138,026)
Surplus(deficiency) before general rates (1,387,411) (1,681,705) (1,543,987)Total amount raised from general rates 22 1,683,932 1,681,705 1,540,559
Net current assets at June 30 c/fwd - surplus/(deficit) 23 296,521 0 (3,428)
This statement is to be read in conjunction with the accompanying notes.
Revenue from operating activities (excluding rates)
Expenditure from operating activities
Page 8
1. SUMMARY OF SIGNIFICANT ACCOUNTING POLICIES
(a) BASIS OF PREPARATION
The financial report comprises general purpose financial statements which have been prepared in
accordance with Australian Accounting Standards (as they apply to local governments and not-for-profit
entities), Australian Accounting Interpretations, other authoritative pronouncements of the Australian
Accounting Standards Board, the Local Government Act 1995 and accompanying regulations. Material
accounting policies which have been adopted in the preparation of this financial report are presented
below and have been consistently applied unless stated otherwise.
Except for cash flow and rate setting information, the report has been prepared on the accrual basis
and is based on historical costs, modified, where applicable, by the measurement at fair value of selected
non-current assets, financial assets and liabilities. This financial report is presented in Australian dollars.
CRITICAL ACCOUNTING ESTIMATES
The preparation of a financial report in conformity with Australian Accounting Standards requires
management to make judgements, estimates and assumptions that effect the application of policies and
reported amounts of assets and liabilities, income and expenses.
The estimates and associated assumptions are based on historical experience and various other factors
that are believed to be reasonable under the circumstances; the results of which form the basis of making
the judgements about carrying values of assets and liabilities that are not readily apparent from other
sources. Actual results may differ from these estimates.
THE LOCAL GOVERNMENT REPORTING ENTITY
All Funds through which the Shire controls resources to carry on its functions have been included in the
financial statements forming part of this financial report.
In the process of reporting on the local government as a single unit, all transactions and balances
between those Funds (for example, loans and transfers between Funds) have been eliminated.
All monies held in the Trust Fund are excluded from the financial statements. A separate statement of
those monies appears at Note 19 to these financial statements.
(a) Goods and Services Tax (GST)
Revenues, expenses and assets are recognised net of the amount of GST, except where the amount of
GST incurred is not recoverable from the Australian Taxation Office (ATO).
Receivables and payables are stated inclusive of GST receivable or payable.
The net amount of GST recoverable from, or payable to, the ATO is included with receivables or payables
in the statement of financial position.
Cash flows are presented on a gross basis. The GST components of cash flows arising from investing or
financing activities which are recoverable from, or payable to, the ATO are presented as operating
cash flows.
(b) Cash and Cash Equivalents
Cash and cash equivalents include cash on hand, cash at bank, deposits available on demand with
banks and other short term highly liquid investments that are readily convertible to known amounts of
cash and which are subject to an insignificant risk of changes in value and bank overdrafts.
Bank overdrafts are reported as short term borrowings in current liabilities in the statement of financial
position.
SHIRE OF WILLIAMS
NOTES TO AND FORMING PART OF THE FINANCIAL REPORT
FOR THE YEAR ENDED 30TH JUNE 2017
Page 9
1. SUMMARY OF SIGNIFICANT ACCOUNTING POLICIES (Continued)
(c) Trade and Other Receivables
Trade and other receivables include amounts due from ratepayers for unpaid rates and service charges
and other amounts due from third parties for goods sold and services performed in the ordinary course
of business.
Receivables expected to be collected within 12 months of the end of the reporting period are classified
as current assets. All other receivables are classified as non-current assets.
Collectability of trade and other receivables is reviewed on an ongoing basis. Debts that are known to be
uncollectible are written off when identified. An allowance for doubtful debts is raised when there is
objective evidence that they will not be collectible.
(d) Inventories
General
Inventories are measured at the lower of cost and net realisable value.
Net realisable value is the estimated selling price in the ordinary course of business less the estimated
costs of completion and the estimated costs necessary to make the sale.
Land held for sale
Land held for development and sale is valued at the lower of cost and net realisable value. Cost includes
the cost of acquisition, development, borrowing costs and holding costs until completion of development.
Finance costs and holding charges incurred after development is completed are expensed.
Gains and losses are recognised in profit or loss at the time of signing an unconditional contract of sale if
significant risks and rewards, and effective control over the land, are passed on to the buyer at this point.
Land held for sale is classified as current except where it is held as non-current based on the Council’s
intentions to release for sale.
(e) Fixed Assets
Each class of fixed assets within either property, plant and equipment or infrastructure, is carried at cost
or fair value as indicated less, where applicable, any accumulated depreciation and impairment losses.
Mandatory requirement to revalue non-current assets
Effective from 1 July 2012, the Local Government (Financial Management) Regulations were amended and
the measurement of non-current assets at Fair Value became mandatory.
During the year ended 30 June 2013, the Shire commenced the process of adopting Fair Value
in accordance with the Regulations.
Whilst the amendments initially allowed for a phasing in of fair value in relation to fixed assets over three
years, as at 30 June 2015 all non-current assets were carried at Fair Value in accordance with the
the requirements.
Thereafter, each asset class must be revalued in accordance with the regulatory framework established and
Relevant disclosures, in accordance with the requirements of Australian Accounting Standards, have been
made in the financial report as necessary.
SHIRE OF WILLIAMS
NOTES TO AND FORMING PART OF THE FINANCIAL REPORT
FOR THE YEAR ENDED 30TH JUNE 2017
the Shire revalues its asset classes in accordance with this mandatory timetable.
Page 10
1. SUMMARY OF SIGNIFICANT ACCOUNTING POLICIES (Continued)
(e) Fixed Assets (Continued)
Land under control
In accordance with Local Government (Financial Management) Regulation 16(a)(ii), the Shire was required
to include as an asset (by 30 June 2013), Crown Land operated by the local government as a golf course,
showground, racecourse or other sporting or recreational facility of State or Regional significance.
Upon initial recognition, these assets were recorded at cost in accordance with AASB 116. They were
then classified as Land and revalued along with other land in accordance with the other policies detailed
in this Note.
Initial recognition and measurement between mandatory revaluation dates
All assets are initially recognised at cost and subsequently revalued in accordance with the mandatory
measurement framework detailed above.
In relation to this initial measurement, cost is determined as the fair value of the assets given as
consideration plus costs incidental to the acquisition. For assets acquired at no cost or for nominal
consideration, cost is determined as fair value at the date of acquisition. The cost of non-current assets
constructed by the Shire includes the cost of all materials used in construction, direct labour on the project
and an appropriate proportion of variable and fixed overheads.
Individual assets acquired between initial recognition and the next revaluation of the asset class in
accordance with the mandatory measurement framework detailed above, are carried at cost less
accumulated depreciation as management believes this approximates fair value. They will be subject to
subsequent revaluation at the next anniversary date in accordance with the mandatory measurement
framework detailed above.
Revaluation
Increases in the carrying amount arising on revaluation of assets are credited to a revaluation surplus in
equity. Decreases that offset previous increases of the same asset are recognised against revaluation
surplus directly in equity. All other decreases are recognised in profit or loss.
Land under roads
In Western Australia, all land under roads is Crown Land, the responsibility for managing which, is
vested in the local government.
Effective as at 1 July 2008, Council elected not to recognise any value for land under roads acquired
on or before 30 June 2008. This accords with the treatment available in Australian Accounting
Standard AASB 1051 Land Under Roads and the fact Local Government (Financial Management)
Regulation 16(a)(i) prohibits local governments from recognising such land as an asset.
In respect of land under roads acquired on or after 1 July 2008, as detailed above, Local Government
(Financial Management) Regulation 16(a)(i) prohibits local governments from recognising such land
as an asset.
Whilst such treatment is inconsistent with the requirements of AASB 1051, Local Government
(Financial Management) Regulation 4(2) provides, in the event of such an inconsistency, the Local
Government (Financial Management) Regulations prevail.
Consequently, any land under roads acquired on or after 1 July 2008 is not included as an asset of the
Shire.
SHIRE OF WILLIAMS
NOTES TO AND FORMING PART OF THE FINANCIAL REPORT
FOR THE YEAR ENDED 30TH JUNE 2017
Page 11

1. SUMMARY OF SIGNIFICANT ACCOUNTING POLICIES (Continued)
(e) Fixed Assets (Continued)
Depreciation
The depreciable amount of all fixed assets including buildings but excluding freehold land, are depreciated
on a straight-line basis over the individual asset’s useful life from the time the asset is held ready for use.
Leasehold improvements are depreciated over the shorter of either the unexpired period of the lease or the
estimated useful life of the improvements.
When an item of property, plant and equipment is revalued, any accumulated depreciation at the date of
the revaluation is treated in one of the following ways:
a) Restated proportionately with the change in the gross carrying amount of the asset so that the carrying
amount of the asset after revaluation equals its revalued amount; or
b) Eliminated against the gross carrying amount of the asset and the net amount restated to the revalued
amount of the asset.
Major depreciation periods used for each class of depreciable asset are:
Buildings 30 to 50 years
Furniture and equipment 4 to 10 years
Plant and equipment 5 to 15 years
Sealed roads and streets
formation not depreciated
pavement 50 years
seal
- bituminous seals 20 years
- asphalt surfaces 25 years
Gravel roads
formation not depreciated
pavement 50 years
Formed roads (unsealed)
formation not depreciated
pavement 50 years
Footpaths - slab 20 years
Sewerage piping 100 years
Water supply piping and drainage systems 75 years
The assets residual values and useful lives are reviewed, and adjusted if appropriate, at the end of each
reporting period.
An asset's carrying amount is written down immediately to its recoverable amount if the asset's carrying
amount is greater than its estimated recoverable amount.
Gains and losses on disposals are determined by comparing proceeds with the carrying amount.
These gains and losses are included in the statement of comprehensive income in the period in which
they arise.
SHIRE OF WILLIAMS
NOTES TO AND FORMING PART OF THE FINANCIAL REPORT
FOR THE YEAR ENDED 30TH JUNE 2017
Page 12

1. SUMMARY OF SIGNIFICANT ACCOUNTING POLICIES (Continued)
(f) Fair Value of Assets and Liabilities
When performing a revaluation, the Shire uses a mix of both independent and management valuations
using the following as a guide:
Fair Value is the price that the Shire would receive to sell the asset or would have to pay to transfer a
liability, in an orderly (i.e. unforced) transaction between independent, knowledgeable and willing market
participants at the measurement date.
As fair value is a market-based measure, the closest equivalent observable market pricing information is
used to determine fair value. Adjustments to market values may be made having regard to the
characteristics of the specific asset or liability. The fair values of assets that are not traded in an active
market are determined using one or more valuation techniques. These valuation techniques maximise, to
the extent possible, the use of observable market data.
To the extent possible, market information is extracted from either the principal market for the asset or
liability (i.e. the market with the greatest volume and level of activity for the asset or liability) or, in the
absence of such a market, the most advantageous market available to the entity at the end of the
reporting period (i.e. the market that maximises the receipts from the sale of the asset after taking into
account transaction costs and transport costs).
For non-financial assets, the fair value measurement also takes into account a market participant’s ability
to use the asset in its highest and best use or to sell it to another market participant that would use the
asset in its highest and best use.
Fair value hierarchy
AASB 13 requires the disclosure of fair value information by level of the fair value hierarchy, which
categorises fair value measurement into one of three possible levels based on the lowest level that an
input that is significant to the measurement can be categorised into as follows:
Level 1
Measurements based on quoted prices (unadjusted) in active markets for identical assets or liabilities
that the entity can access at the measurement date.
Level 2
Measurements based on inputs other than quoted prices included in Level 1 that are observable for the
asset or liability, either directly or indirectly.
Level 3
Measurements based on unobservable inputs for the asset or liability.
The fair values of assets and liabilities that are not traded in an active market are determined using one or
more valuation techniques. These valuation techniques maximise, to the extent possible, the use of
observable market data. If all significant inputs required to measure fair value are observable, the asset or
liability is included in Level 2. If one or more significant inputs are not based on observable market data,
the asset or liability is included in Level 3.
Valuation techniques
The Shire selects a valuation technique that is appropriate in the circumstances and for which sufficient
data is available to measure fair value. The availability of sufficient and relevant data primarily depends on
the specific characteristics of the asset or liability being measured. The valuation techniques selected by
the Shire are consistent with one or more of the following valuation approaches:
Market approach
Valuation techniques that use prices and other relevant information generated by market transactions for
identical or similar assets or liabilities.
SHIRE OF WILLIAMS
NOTES TO AND FORMING PART OF THE FINANCIAL REPORT
FOR THE YEAR ENDED 30TH JUNE 2017
Page 13
1. SUMMARY OF SIGNIFICANT ACCOUNTING POLICIES (Continued)
(f) Fair Value of Assets and Liabilities (Continued)
Income approach
Valuation techniques that convert estimated future cash flows or income and expenses into a single
discounted present value.
Cost approach
Valuation techniques that reflect the current replacement cost of an asset at its current service capacity.
Each valuation technique requires inputs that reflect the assumptions that buyers and sellers would use
when pricing the asset or liability, including assumptions about risks. When selecting a valuation
technique, the Shire gives priority to those techniques that maximise the use of observable inputs and
minimise the use of unobservable inputs. Inputs that are developed using market data (such as publicly
available information on actual transactions) and reflect the assumptions that buyers and sellers would
generally use when pricing the asset or liability are considered observable, whereas inputs for which
market data is not available and therefore are developed using the best information available about such
assumptions are considered unobservable.
As detailed above, the mandatory measurement framework imposed by the Local Government
(Financial Management) Regulations requires, as a minimum, all assets carried at a revalued amount to
be revalued in accordance with the regulatory framework.
(g) Financial Instruments
Initial recognition and measurement
Financial assets and financial liabilities are recognised when the Shire becomes a party to the
contractual provisions to the instrument. For financial assets, this is equivalent to the date that the
Shire commits itself to either the purchase or sale of the asset (i.e. trade date accounting is
adopted).
Financial instruments are initially measured at fair value plus transaction costs, except where the
instrument is classified 'at fair value through profit or loss', in which case transaction costs are
expensed to profit or loss immediately.
Classification and subsequent measurement
Financial instruments are subsequently measured at fair value, amortised cost using the effective
interest rate method, or at cost.
Amortised cost is calculated as:
(a) the amount in which the financial asset or financial liability is measured at initial recognition;
(b) less principal repayments and any reduction for impairment; and
(c) plus or minus the cumulative amortisation of the difference, if any, between the amount
initially recognised and the maturity amount calculated using the effective interest rate method.
The effective interest method is used to allocate interest income or interest expense over the relevant
period and is equivalent to the rate that discounts estimated future cash payments or receipts
(including fees, transaction costs and other premiums or discounts) through the expected life (or when
this cannot be reliably predicted, the contractual term) of the financial instrument to the net carrying
amount of the financial asset or financial liability. Revisions to expected future net cash flows will
necessitate an adjustment to the carrying value with a consequential recognition of an income or expense
in profit or loss.
FOR THE YEAR ENDED 30TH JUNE 2017
SHIRE OF WILLIAMS
NOTES TO AND FORMING PART OF THE FINANCIAL REPORT
Page 14

1. SUMMARY OF SIGNIFICANT ACCOUNTING POLICIES (Continued)
(g) Financial Instruments (Continued)
Classification and subsequent measurement (continued)
(i) Financial assets at fair value through profit and loss
Financial assets are classified at “fair value through profit or loss” when they are held for trading for the
purpose of short-term profit taking. Such assets are subsequently measured at fair value with changes
in carrying amount being included in profit or loss. Assets in this category are classified as current assets.
(ii) Loans and receivables
Loans and receivables are non-derivative financial assets with fixed or determinable payments that are
not quoted in an active market and are subsequently measured at amortised cost. Gains or losses are
recognised in profit or loss.
Loans and receivables are included in current assets where they are expected to mature within 12 months
after the end of the reporting period.
(iii) Held-to-maturity investments
Held-to-maturity investments are non-derivative financial assets with fixed maturities and fixed or
determinable payments that the Shire has the positive intention and ability to hold to maturity. They
are subsequently measured at amortised cost. Gains or losses are recognised in profit or loss.
Held-to-maturity investments are included in current assets, where they are expected to mature
within 12 months after the end of the reporting period. All other investments are classified as non-
current.
(iv) Available-for-sale financial assets
Available-for-sale financial assets are non-derivative financial assets that are either not suitable to be
classified into other categories of financial assets due to their nature, or they are designated as such
by management. They comprise investments in the equity of other entities where there is neither a
fixed maturity nor fixed or determinable payments.
They are subsequently measured at fair value with changes in such fair value (i.e. gains or losses)
recognised in other comprehensive income (except for impairment losses). When the financial asset
is derecognised, the cumulative gain or loss pertaining to that asset previously recognised in other
comprehensive income is reclassified into profit or loss.
Available-for-sale financial assets are included in current assets, where they are expected to be sold
within 12 months after the end of the reporting period. All other available-for-sale financial assets are
classified as non-current.
(v) Financial liabilities
Non-derivative financial liabilities (excluding financial guarantees) are subsequently measured at
amortised cost. Gains or losses are recognised in profit or loss.
SHIRE OF WILLIAMS
NOTES TO AND FORMING PART OF THE FINANCIAL REPORT
FOR THE YEAR ENDED 30TH JUNE 2017
Page 15
1. SUMMARY OF SIGNIFICANT ACCOUNTING POLICIES (Continued)
(g) Financial Instruments (Continued)
Impairment
A financial asset is deemed to be impaired if, and only if, there is objective evidence of impairment as
a result of one or more events (a “loss event”) having occurred, which will have an impact on the estimated
future cash flows of the financial asset(s).
In the case of available-for-sale financial assets, a significant or prolonged decline in the market value of
the instrument is considered a loss event. Impairment losses are recognised in profit or loss immediately.
Also, any cumulative decline in fair value previously recognised in other comprehensive income is
reclassified to profit or loss at this point.
In the case of financial assets carried at amortised cost, loss events may include: indications that the
debtors or a group of debtors are experiencing significant financial difficulty, default or delinquency in
interest or principal payments; indications that they will enter bankruptcy or other financial reorganisation;
and changes in arrears or economic conditions that correlate with defaults.
For financial assets carried at amortised cost (including loans and receivables), a separate allowance
account is used to reduce the carrying amount of financial assets impaired by credit losses. After
having taken all possible measures of recovery, if management establishes that the carrying amount
cannot be recovered by any means, at that point the written-off amounts are charged to the allowance
account or the carrying amount of impaired financial assets is reduced directly if no impairment amount
was previously recognised in the allowance account.
Derecognition
Financial assets are derecognised where the contractual rights to receipt of cash flows expire or the
asset is transferred to another party whereby the Shire no longer has any significant continual
involvement in the risks and benefits associated with the asset.
Financial liabilities are derecognised where the related obligations are discharged, cancelled or expired.
The difference between the carrying amount of the financial liability extinguished or transferred to
another party and the fair value of the consideration paid, including the transfer of non-cash assets or
liabilities assumed, is recognised in profit or loss.
(h) Impairment of Assets
In accordance with Australian Accounting Standards the Shire's assets, other than inventories,
are assessed at each reporting date to determine whether there is any indication they may be impaired.
Where such an indication exists, an impairment test is carried out on the asset by comparing the
recoverable amount of the asset, being the higher of the asset's fair value less costs to sell and value in
use, to the asset's carrying amount.
Any excess of the asset's carrying amount over its recoverable amount is recognised immediately in
profit or loss, unless the asset is carried at a revalued amount in accordance with another Standard
(e.g. AASB 116) whereby any impairment loss of a revalued asset is treated as a revaluation decrease in
accordance with that other Standard.
For non-cash generating assets such as roads, drains, public buildings and the like, value in use is
represented by the depreciated replacement cost of the asset.
(i) Trade and Other Payables
Trade and other payables represent liabilities for goods and services provided to the Shire prior to the
end of the financial year that are unpaid and arise when the Shire becomes obliged to make future
payments in respect of the purchase of these goods and services. The amounts are unsecured, are
recognised as a current liability and are normally paid within 30 days of recognition.
SHIRE OF WILLIAMS
NOTES TO AND FORMING PART OF THE FINANCIAL REPORT
FOR THE YEAR ENDED 30TH JUNE 2017
Page 16

1. SUMMARY OF SIGNIFICANT ACCOUNTING POLICIES (Continued)
(j) Employee Benefits
Short-term employee benefits
Provision is made for the Shire’s obligations for short-term employee benefits. Short-term employee
benefits are benefits (other than termination benefits) that are expected to be settled wholly before
12 months after the end of the annual reporting period in which the employees render the related service,
including wages, salaries and sick leave. Short-term employee benefits are measured at the
(undiscounted) amounts expected to be paid when the obligation is settled.
The Shire’s obligations for short-term employee benefits such as wages, salaries and personal leave are
recognised as a part of current trade and other payables in the statement of financial position. The
Shire’s obligations for employees’ annual leave and long service leave entitlements are recognised as
provisions in the statement of financial position.
Other long-term employee benefits
Provision is made for employees’ long service leave and annual leave entitlements not expected to be
settled wholly within 12 months after the end of the annual reporting period in which the employees
render the related service. Other long-term employee benefits are measured at the present value of the
expected future payments to be made to employees. Expected future payments incorporate anticipated
future wage and salary levels, durations of service and employee departures and are discounted at rates
determined by reference to market yields at the end of the reporting period on government bonds that
have maturity dates that approximate the terms of the obligations. Any remeasurements for changes in
assumptions of obligations for other long-term employee benefits are recognised in profit or loss in the
periods in which the changes occur.
The Shire’s obligations for long-term employee benefits are presented as non-current provisions in its
statement of financial position, except where the Shire does not have an unconditional right to defer
settlement for at least 12 months after the end of the reporting period, in which case the obligations are
presented as current provisions.
(k) Borrowing Costs
Borrowing costs are recognised as an expense when incurred except where they are directly attributable
to the acquisition, construction or production of a qualifying asset. Where this is the case, they are
capitalised as part of the cost of the particular asset until such time as the asset is substantially ready
for its intended use or sale.
(l) Provisions
Provisions are recognised when the Shire has a present legal or constructive obligation, as a result of
past events, for which it is probable that an outflow of economic benefits will result and that outflow can
be reliably measured.
Provisions are measured using the best estimate of the amounts required to settle the obligation at the
end of the reporting period.
(m) Leases
Leases of fixed assets where substantially all the risks and benefits incidental to the ownership of the
asset, but not legal ownership, are transferred to the Shire, are classified as finance leases.
Finance leases are capitalised recording an asset and a liability at the lower amounts equal to the fair
value of the leased property or the present value of the minimum lease payments, including any
guaranteed residual values. Lease payments are allocated between the reduction of the lease liability
and the lease interest expense for the period.
Leased assets are depreciated on a straight line basis over the shorter of their estimated useful lives or
the lease term.
Lease payments for operating leases, where substantially all the risks and benefits remain with the
lessor, are charged as expenses in the periods in which they are incurred.
Lease incentives under operating leases are recognised as a liability and amortised on a straight line
basis over the life of the lease term.
NOTES TO AND FORMING PART OF THE FINANCIAL REPORT
FOR THE YEAR ENDED 30TH JUNE 2017
SHIRE OF WILLIAMS
Page 17
1. SUMMARY OF SIGNIFICANT ACCOUNTING POLICIES (Continued)
(n) Investment in Associates
An associate is an entity over which the Shire has significant influence. Significant influence is the
power to participate in the financial operating policy decisions of that entity but is not control or joint
control of those policies. Investments in associates are accounted for in the financial statements by
applying the equity method of accounting, whereby the investment is initially recognised at cost and
adjusted thereafter for the post-acquisition change in the Shire’s share of net assets of the associate.
In addition, the Shire’s share of the profit or loss of the associate is included in the Shire’s profit or loss.
The carrying amount of the investment includes, where applicable, goodwill relating to the associate.
Any discount on acquisition, whereby the Shire’s share of the net fair value of the associate exceeds
the cost of investment, is recognised in profit or loss in the period in which the investment is acquired.
Profits and losses resulting from transactions between the Shire and the associate are eliminated to
the extent of the Shire’s interest in the associate.
When the Shire’s share of losses in an associate equals or exceeds its interest in the associate, the
Shire discontinues recognising its share of further losses unless it has incurred legal or constructive
obligations or made payments on behalf of the associate. When the associate subsequently makes
profits, the Shire will resume recognising its share of those profits once its share of the profits equals
the share of the losses not recognised.
(o) Interests in Joint ArrangementsJoint arrangements represent the contractual sharing of control between parties in a business
venture where unanimous decisions about relevant activities are required.
Separate joint venture entities providing joint venturers with an interest to net assets are classified as a
joint venture and accounted for using the equity method. Refer to note 1(n) for a description of the equity
method of accounting.
Joint venture operations represent arrangements whereby joint operators maintain direct interests in
each asset and exposure to each liability of the arrangement. The Shire’s interests in the assets,
liabilities, revenue and expenses of joint operations are included in the respective line items of the financial
statements. Information about the joint ventures is set out in Note
(p) Rates, Grants, Donations and Other Contributions
Rates, grants, donations and other contributions are recognised as revenues when the local government
obtains control over the assets comprising the contributions.
Control over assets acquired from rates is obtained at the commencement of the rating period or, where
earlier, upon receipt of the rates.
Where contributions recognised as revenues during the reporting period were obtained on the condition
that they be expended in a particular manner or used over a particular period, and those conditions were
undischarged as at the reporting date, the nature of and amounts pertaining to those undischarged
conditions are disclosed in Note 2(c) . That note also discloses the amount of contributions recognised
as revenues in a previous reporting period which were obtained in respect of the local government's
operations for the current reporting period.
(q) Superannuation
The Shire contributes to a number of Superannuation Funds on behalf of employees. All funds to
which the Shire contributes are defined contribution plans.
NOTES TO AND FORMING PART OF THE FINANCIAL REPORT
FOR THE YEAR ENDED 30TH JUNE 2017
SHIRE OF WILLIAMS
Page 18
1. SUMMARY OF SIGNIFICANT ACCOUNTING POLICIES (Continued)
(r) Current and Non-Current Classification
In the determination of whether an asset or liability is current or non-current, consideration is given to the
time when each asset or liability is expected to be settled. The asset or liability is classified as current if
it is expected to be settled within the next 12 months, being the Shire’s operational cycle. In the case
of liabilities where the Shire does not have the unconditional right to defer settlement beyond 12 months,
such as vested long service leave, the liability is classified as current even if not expected to be settled
within the next 12 months. Inventories held for trading are classified as current even if not expected to be
realised in the next 12 months except for land held for sale where it is held as non-current based on the
Shire’s intentions to release for sale.
(s) Rounding Off Figures
All figures shown in this annual financial report, other than a rate in the dollar, are rounded to the nearest
dollar.
(t) Comparative Figures
Where required, comparative figures have been adjusted to conform with changes in presentation for the
current financial year.
When the Shire applies an accounting policy retrospectively, makes a retrospective restatement or
reclassifies items in its financial statement, an additional (third) statement of financial position as at the
beginning of the preceding period in addition to the minimum comparative financial statements is
presented.
(u) Budget Comparative Figures
Unless otherwise stated, the budget comparative figures shown in this annual financial report relate to the
original budget estimate for the relevant item of disclosure.
NOTES TO AND FORMING PART OF THE FINANCIAL REPORT
FOR THE YEAR ENDED 30TH JUNE 2017
SHIRE OF WILLIAMS
Page 19

NOTES TO AND FORMING PART OF THE FINANCIAL REPORT
FOR THE YEAR ENDED 30TH JUNE 2017
1. SIGNIFICANT ACCOUNTING POLICIES (Continued)
(v) New Accounting Standards and Interpretations for Application in Future Periods
Management's assessment of the new and amended pronouncements that are relevant to the Shire, applicable to future reporting periods and which have not yetbeen adopted are set out as follows:
Title Issued / Compiled Applicable (1)Impact
(i) AASB 9 Financial Instruments December 2014 1 January 2018 Nil – The objective of this Standard is to improve and simplify the (incorporating AASB 2014-7 and approach for classification and measurement of financial assetsAASB 2014-8) compared with the requirements of AASB 139. Given the nature of
the financial assets of the Shire, it is not anticipated the Standardwill have any material effect.
(ii) AASB 15 Revenue from Contracts with December 2014 1 January 2018 This Standard establishes principles for entities to apply to reportCustomers useful information to users of financial statements about the nature,
amount, timing and uncertainty of revenue and cash flows arisingfrom a contract with a customer.
The effect of this Standard will depend upon the nature of futuretransactions the Shire has with those third parties it has dealingswith. It may or may not be significant.
(iii) AASB 16 Leases February 2016 1 January 2019 Under AASB 16 there is no longer a distinction between financeand operating leases. Lessees will now bring to account aright-to-use asset and lease liability onto their statement of financialposition for all leases. Effectively this means the vast majority ofoperating leases as defined by the current AASB 117 Leases whichcurrently do not impact the statement of financial position will berequired to be capitalised on the statement of financial position onceAASB 16 is adopted.
Currently, operating lease payments are expensed as incurred.This will cease and will be replaced by both depreciation and interest charges. Based on the current number of operating leases held by the Shire, the impact is not expected to besignificant.
Notes:(1) Applicable to reporting periods commencing on or after the given date.
SHIRE OF WILLIAMS
The AASB has issued a number of new and amended Accounting Standards and Interpretations that have mandatory application dates for future reporting periods,some of which are relevant to the Shire.
Page 20

NOTES TO AND FORMING PART OF THE FINANCIAL REPORT
FOR THE YEAR ENDED 30TH JUNE 2017
1. SIGNIFICANT ACCOUNTING POLICIES (Continued)
(v) New Accounting Standards and Interpretations for Application in Future Periods (Continued)
Title Issued / Compiled Applicable (1)Impact
(iv) AASB 1058 Income of Not-for-Profit Entities December 2016 1 January 2019 These standards are likely to have a significant impact on the (incorporating AASB 2016-7 and income recognition for NFP's. Key areas for consideration are:AASB 2016-8) - Assets received below fair value;
- Transfers received to acquire or construct non-financial assets;- Grants received;- Prepaid rates;- Leases entered into at below market rates; and- Volunteer services.
Whilst it is not possible to quantify the financial impact (or if it ismaterial) of these key areas until the details of future transactions are known, they will all have application to the Shire's operations.
Notes:(1) Applicable to reporting periods commencing on or after the given date.
(w) Adoption of New and Revised Accounting Standards
Whilst many reflected consequential changes associate with the amendment of existing standards, the only new standard with material applicationis as follows:
(i) AASB 2015-6 Amendments to Australian The objective of this Standard was to extend the scope Accounting Standards - Extending Related of AASB 124 Related Party Disclosures to include not-for-profit
Party Disclosures to Not-for-Profit Public sector entities.Sector Entities
The Standard has had a significant disclosure impact on
[AASB 10, 124 & 1049] the financial report of the Shire as both Elected Membersand Senior Management are deemed to be Key ManagementPersonnel and resultant disclosures in accordance to AASB 124have been necessary.
and which were applicable to its operations.
SHIRE OF WILLIAMS
During the current year, the Shire adopted all of the new and revised Australian Accounting Standards and Interpretations which were compiled, became mandatory
Page 21

SHIRE OF WILLIAMS
NOTES TO AND FORMING PART OF THE FINANCIAL REPORT
FOR THE YEAR ENDED 30TH JUNE 2017
2. REVENUE AND EXPENSES 2017 2016
$ $
(a) Net Result
The Net result includes:
(i) Charging as an expense:
Auditors remuneration
- Audit of the Annual Financial Report 9,946 7,946
- Other Services 0 2,750
Depreciation
Buildings - non-specialised 72,185 73,260
Buildings - specialised 252,247 252,247
Furniture and equipment 15,182 15,221
Plant and equipment 137,388 177,664
Infrastructure - Roads 668,718 635,067
Infrastructure - Footpaths 13,898 13,039
Infrastructure - Drainage 260,427 288,139
Infrastructure - Bridges 85,586 85,586
Infrastructure - Parks & Gardens 71,888 66,160
1,577,518 1,606,383
Interest expenses (finance costs)
Debentures (refer Note 21 (a)) 31,634 31,263
Overdraft Interest 0 9
Treasury Guarantee Fee on Loans 4,358 2,413
35,992 33,685
Other revenue
Reimbursements and recoveries 220,717 209,349
Other 58,656 36,424
279,373 245,773
2017 2017 2016
Actual Budget Actual
$ $ $
Interest earnings
- Reserve funds 13,160 15,818 13,211
- Other funds 7,901 12,000 17,067
Other interest revenue (refer note 27) 14,539 10,500 13,331
35,599 38,318 43,609
Page 22
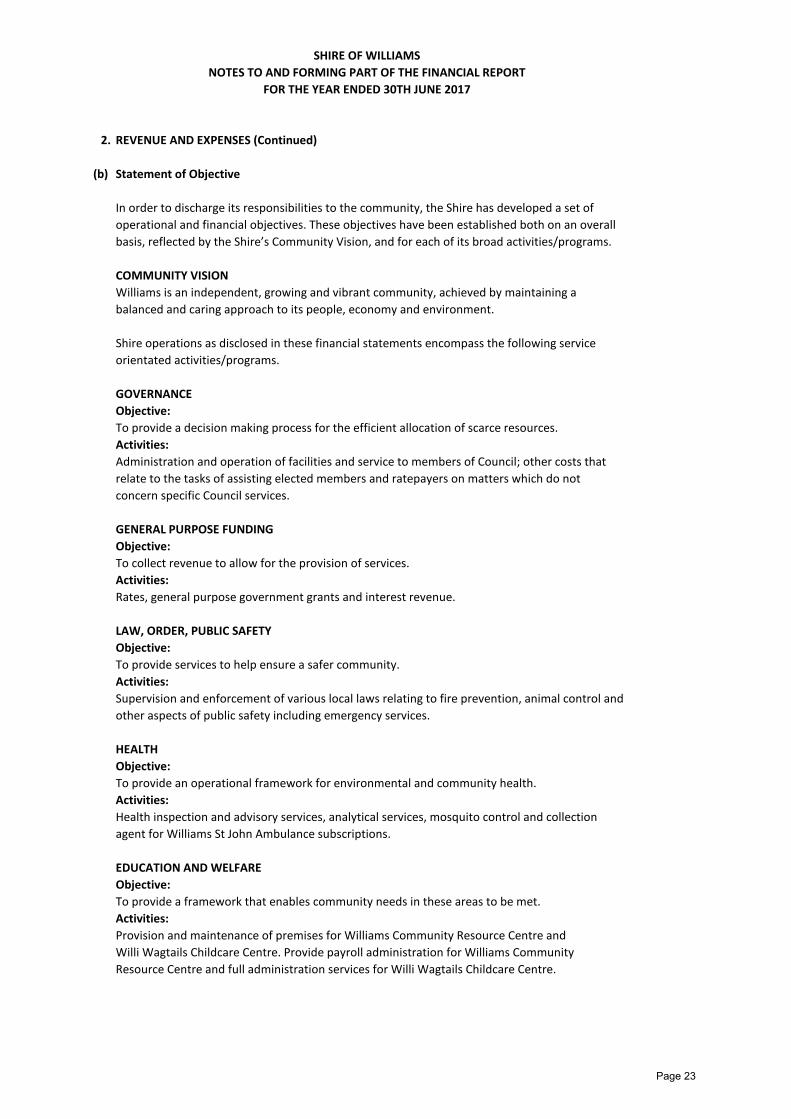
SHIRE OF WILLIAMS
NOTES TO AND FORMING PART OF THE FINANCIAL REPORT
FOR THE YEAR ENDED 30TH JUNE 2017
2. REVENUE AND EXPENSES (Continued)
(b) Statement of Objective
In order to discharge its responsibilities to the community, the Shire has developed a set of
operational and financial objectives. These objectives have been established both on an overall
basis, reflected by the Shire’s Community Vision, and for each of its broad activities/programs.
COMMUNITY VISION
Williams is an independent, growing and vibrant community, achieved by maintaining a
balanced and caring approach to its people, economy and environment.
GOVERNANCE
Objective:
To provide a decision making process for the efficient allocation of scarce resources.
Activities:
Administration and operation of facilities and service to members of Council; other costs that
GENERAL PURPOSE FUNDING
Objective:
Activities:
LAW, ORDER, PUBLIC SAFETY
Objective:
Activities:
HEALTH
Objective:
Activities:
EDUCATION AND WELFARE
Objective:
Activities:
Resource Centre and full administration services for Willi Wagtails Childcare Centre.
Shire operations as disclosed in these financial statements encompass the following service
orientated activities/programs.
relate to the tasks of assisting elected members and ratepayers on matters which do not
concern specific Council services.
To collect revenue to allow for the provision of services.
Rates, general purpose government grants and interest revenue.
To provide services to help ensure a safer community.
Supervision and enforcement of various local laws relating to fire prevention, animal control and
other aspects of public safety including emergency services.
To provide an operational framework for environmental and community health.
Health inspection and advisory services, analytical services, mosquito control and collection
agent for Williams St John Ambulance subscriptions.
To provide a framework that enables community needs in these areas to be met.
Provision and maintenance of premises for Williams Community Resource Centre and
Willi Wagtails Childcare Centre. Provide payroll administration for Williams Community
Page 23
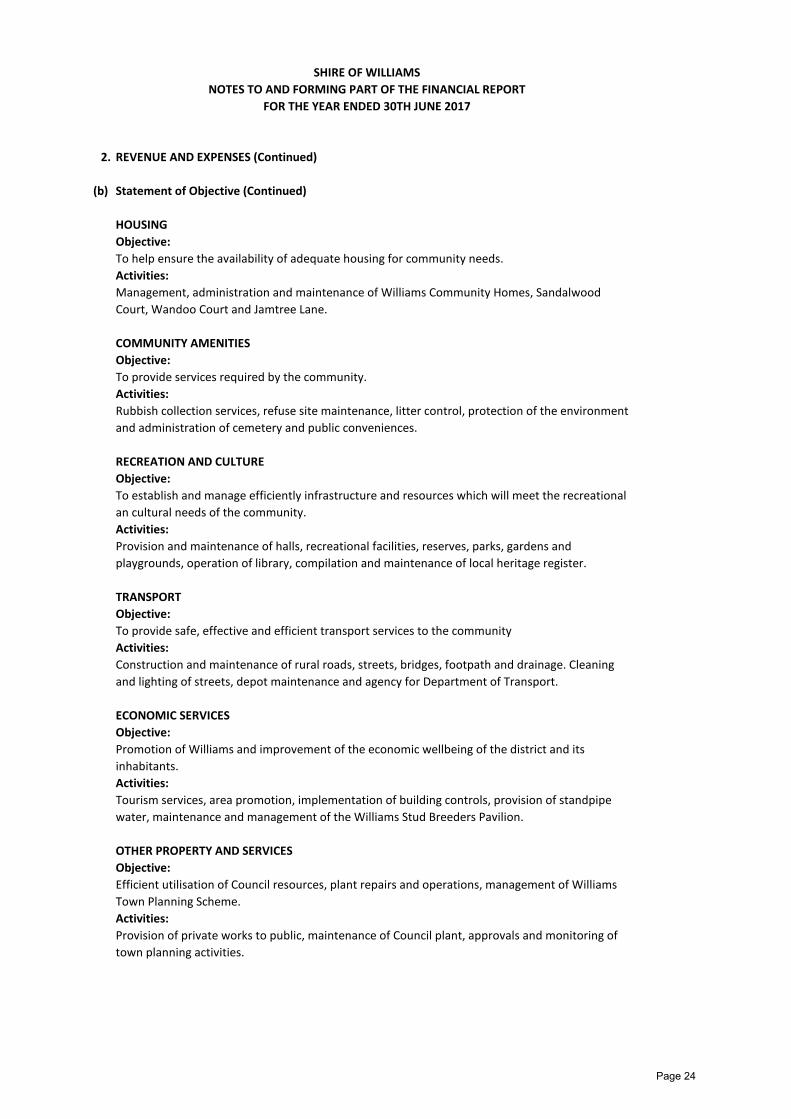
2. REVENUE AND EXPENSES (Continued)
(b) Statement of Objective (Continued)
HOUSING
Objective:
Activities:
Court, Wandoo Court and Jamtree Lane.
COMMUNITY AMENITIES
Objective:
Activities:
RECREATION AND CULTURE
Objective:
an cultural needs of the community.
Activities:
TRANSPORT
Objective:
Activities:
and lighting of streets, depot maintenance and agency for Department of Transport.
ECONOMIC SERVICES
Objective:
inhabitants.
Activities:
OTHER PROPERTY AND SERVICES
Objective:
Town Planning Scheme.
Activities:
town planning activities.
SHIRE OF WILLIAMS
NOTES TO AND FORMING PART OF THE FINANCIAL REPORT
FOR THE YEAR ENDED 30TH JUNE 2017
To help ensure the availability of adequate housing for community needs.
Management, administration and maintenance of Williams Community Homes, Sandalwood
To provide services required by the community.
Rubbish collection services, refuse site maintenance, litter control, protection of the environment
and administration of cemetery and public conveniences.
To establish and manage efficiently infrastructure and resources which will meet the recreational
Provision and maintenance of halls, recreational facilities, reserves, parks, gardens and
water, maintenance and management of the Williams Stud Breeders Pavilion.
Efficient utilisation of Council resources, plant repairs and operations, management of Williams
Provision of private works to public, maintenance of Council plant, approvals and monitoring of
playgrounds, operation of library, compilation and maintenance of local heritage register.
To provide safe, effective and efficient transport services to the community
Construction and maintenance of rural roads, streets, bridges, footpath and drainage. Cleaning
Promotion of Williams and improvement of the economic wellbeing of the district and its
Tourism services, area promotion, implementation of building controls, provision of standpipe
Page 24
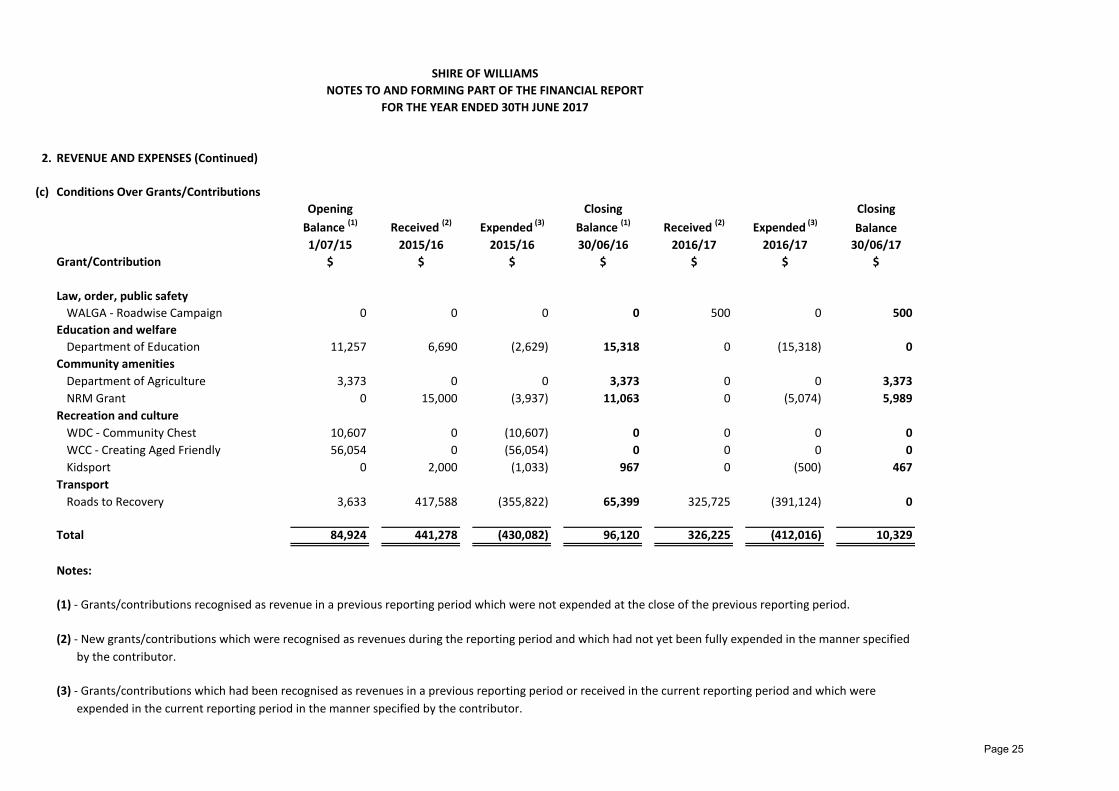
SHIRE OF WILLIAMS
NOTES TO AND FORMING PART OF THE FINANCIAL REPORT
FOR THE YEAR ENDED 30TH JUNE 2017
2. REVENUE AND EXPENSES (Continued)
(c) Conditions Over Grants/Contributions
Opening Closing Closing
Balance (1) Received (2) Expended (3) Balance (1) Received (2) Expended (3)Balance
1/07/15 2015/16 2015/16 30/06/16 2016/17 2016/17 30/06/17
Grant/Contribution $ $ $ $ $ $ $
Law, order, public safety
WALGA - Roadwise Campaign 0 0 0 0 500 0 500
Education and welfare
Department of Education 11,257 6,690 (2,629) 15,318 0 (15,318) 0
Community amenities
Department of Agriculture 3,373 0 0 3,373 0 0 3,373
NRM Grant 0 15,000 (3,937) 11,063 0 (5,074) 5,989
Recreation and culture
WDC - Community Chest 10,607 0 (10,607) 0 0 0 0
WCC - Creating Aged Friendly 56,054 0 (56,054) 0 0 0 0
Kidsport 0 2,000 (1,033) 967 0 (500) 467
Transport
Roads to Recovery 3,633 417,588 (355,822) 65,399 325,725 (391,124) 0
Total 84,924 441,278 (430,082) 96,120 326,225 (412,016) 10,329
Notes:
(1) - Grants/contributions recognised as revenue in a previous reporting period which were not expended at the close of the previous reporting period.
(2) - New grants/contributions which were recognised as revenues during the reporting period and which had not yet been fully expended in the manner specified
by the contributor.
(3) - Grants/contributions which had been recognised as revenues in a previous reporting period or received in the current reporting period and which were
expended in the current reporting period in the manner specified by the contributor.
Page 25

SHIRE OF WILLIAMS
NOTES TO AND FORMING PART OF THE FINANCIAL REPORT
FOR THE YEAR ENDED 30TH JUNE 2017
Note 2017 2016
$ $
3. CASH AND CASH EQUIVALENTS
Unrestricted 632,536 40,730
Restricted 740,700 671,331
1,373,236 712,061
The following restrictions have been imposed by
regulations or other externally imposed requirements:
Reserves cash backed - Leave Reserve 11 5,168 164
Reserves cash backed - Plant Replacement Reserve 11 105,688 5,561
Reserves cash backed - Building Reserve 11 400,642 421,010
Reserves cash backed - Recreation Facilities Reserve 11 87,334 19,880
Reserves cash backed - Art Acquistion Reserve 11 11,197 10,946
Reserves cash backed - Joint Venture Housing Reserve 11 69,198 67,650
Reserves cash backed - Refuse Site Reserve 11 51,144 50,000
Unspent grants 2(c) 10,329 96,120
740,700 671,331
4. TRADE AND OTHER RECEIVABLES
Current
Rates outstanding 14,737 10,829
Sundry debtors 41,106 230,012
GST receivable 0 0
Loans receivable - clubs/institutions 14,537 0
Provision for Doubtful Debts (10,903) (13,528)
59,477 227,313
Non-current
Rates outstanding - pensioners 0 0
Loans receivable - clubs/institutions 153,463 0
153,463 0
5. INVENTORIES
Current
Materials 5,121 7,032
Fuels 3,456 12,507
History Books 905 937
9,482 20,476
Non-current
Land held for resale - cost
Cost of acquisition 0 0
Development costs 0 0
0 0
Page 26

SHIRE OF WILLIAMS
NOTES TO AND FORMING PART OF THE FINANCIAL REPORT
FOR THE YEAR ENDED 30TH JUNE 2017
2017 2016
$ $
6 (a). PROPERTY, PLANT AND EQUIPMENT
Land - freehold land at:
- Independent valuation 2014 - level 2 0 1,965,000
- Independent valuation 2017 - level 2 2,995,500 0
- Additions after valuation - cost 0 488,067
2,995,500 2,453,067
Buildings - non-specialised at:
- Independent valuation 2014 - level 2 0 1,682,669
- Independent valuation 2017 - level 2 2,509,997 0
- Additions after valuation - cost 0 1,716,994
Buildings - non-specialised - Less: accumulated depreciation 0 (114,849)
2,509,997 3,284,814
Buildings - specialised at:
- Independent valuation 2014 - level 3 0 12,501,406
- Independent valuation 2017 - level 3 11,519,570 0
- Additions after valuation - cost 0 37,809
Buildings - specialised - Less: accumulated depreciation 0 (503,260)
11,519,570 12,035,955
Total land and buildings 17,025,067 17,773,836
Furniture and equipment at:
- Management valuation 2016 - level 2 98,640 98,640
- Additions after valuation - cost 6,824 0
Furniture and equipment - Less: accumulated depreciation (15,182) 0
90,282 98,640
Plant and equipment at:
- Management valuation 2016 - level 2 1,230,650 1,271,150
- Additions after valuation - cost 141,182 0
Plant and equipment - Less: accumulated depreciation (134,724) 0
1,237,108 1,271,150
Work in Progress - Specialised Buildings at:
- Additions after valuation - cost 0 164,873
0 164,873
18,352,457 19,308,499
The fair value of property, plant and equipment is determined at least every three years in accordance
with the regulatory framework. Additions since the date of valuation are shown as cost, given they
were acquired at arms length and any accumulated depreciation reflects the usage of service
potential, it is considered the recorded written down value approximates fair value. At the end of each
intervening period the valuation is reviewed and where appropriate the fair value is updated to
reflect current market conditions. This process is considered to be in accordance with Local Government
(Financial Management) Regulation 17A (2) which requires property, plant and equipment to be shown
at fair value.
Page 27
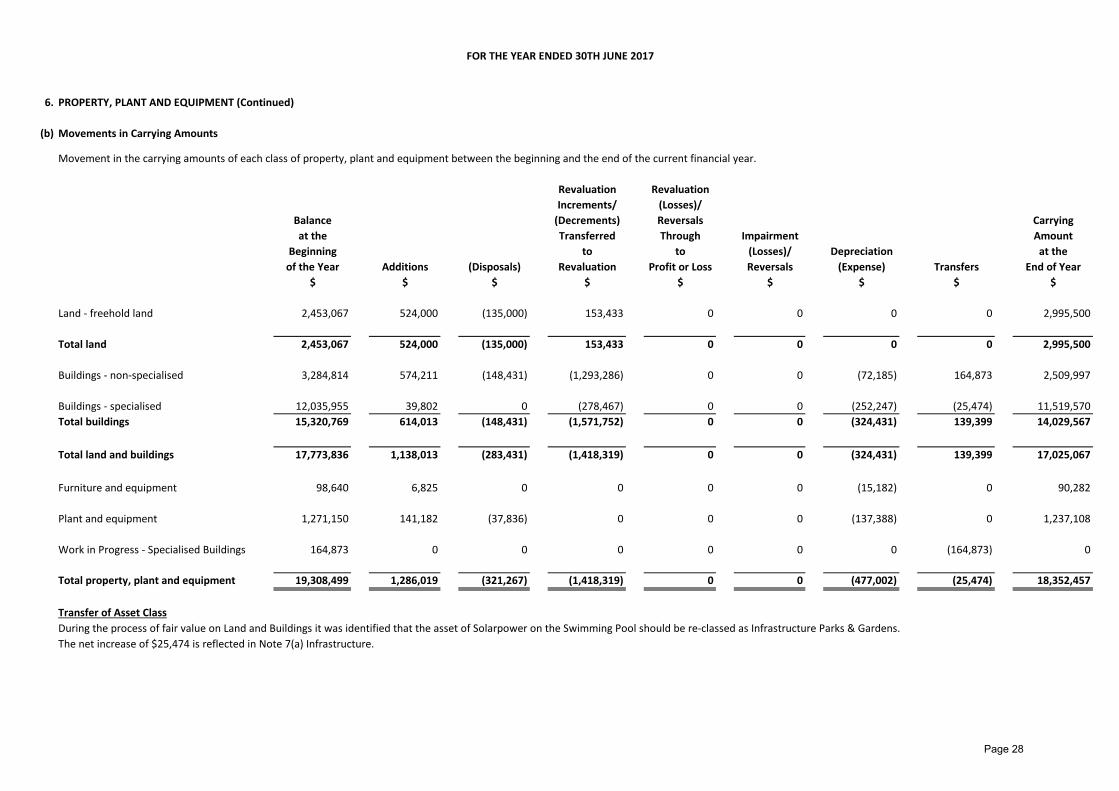
FOR THE YEAR ENDED 30TH JUNE 2017
6. PROPERTY, PLANT AND EQUIPMENT (Continued)
(b) Movements in Carrying Amounts
Movement in the carrying amounts of each class of property, plant and equipment between the beginning and the end of the current financial year.
Revaluation Revaluation
Increments/ (Losses)/
Balance (Decrements) Reversals Carrying
at the Transferred Through Impairment Amount
Beginning to to (Losses)/ Depreciation at the
of the Year Additions (Disposals) Revaluation Profit or Loss Reversals (Expense) Transfers End of Year
$ $ $ $ $ $ $ $ $
Land - freehold land 2,453,067 524,000 (135,000) 153,433 0 0 0 0 2,995,500
Total land 2,453,067 524,000 (135,000) 153,433 0 0 0 0 2,995,500
Buildings - non-specialised 3,284,814 574,211 (148,431) (1,293,286) 0 0 (72,185) 164,873 2,509,997
Buildings - specialised 12,035,955 39,802 0 (278,467) 0 0 (252,247) (25,474) 11,519,570
Total buildings 15,320,769 614,013 (148,431) (1,571,752) 0 0 (324,431) 139,399 14,029,567
Total land and buildings 17,773,836 1,138,013 (283,431) (1,418,319) 0 0 (324,431) 139,399 17,025,067
Furniture and equipment 98,640 6,825 0 0 0 0 (15,182) 0 90,282
Plant and equipment 1,271,150 141,182 (37,836) 0 0 0 (137,388) 0 1,237,108
Work in Progress - Specialised Buildings 164,873 0 0 0 0 0 0 (164,873) 0
Total property, plant and equipment 19,308,499 1,286,019 (321,267) (1,418,319) 0 0 (477,002) (25,474) 18,352,457
Transfer of Asset Class
During the process of fair value on Land and Buildings it was identified that the asset of Solarpower on the Swimming Pool should be re-classed as Infrastructure Parks & Gardens.
The net increase of $25,474 is reflected in Note 7(a) Infrastructure.
Page 28
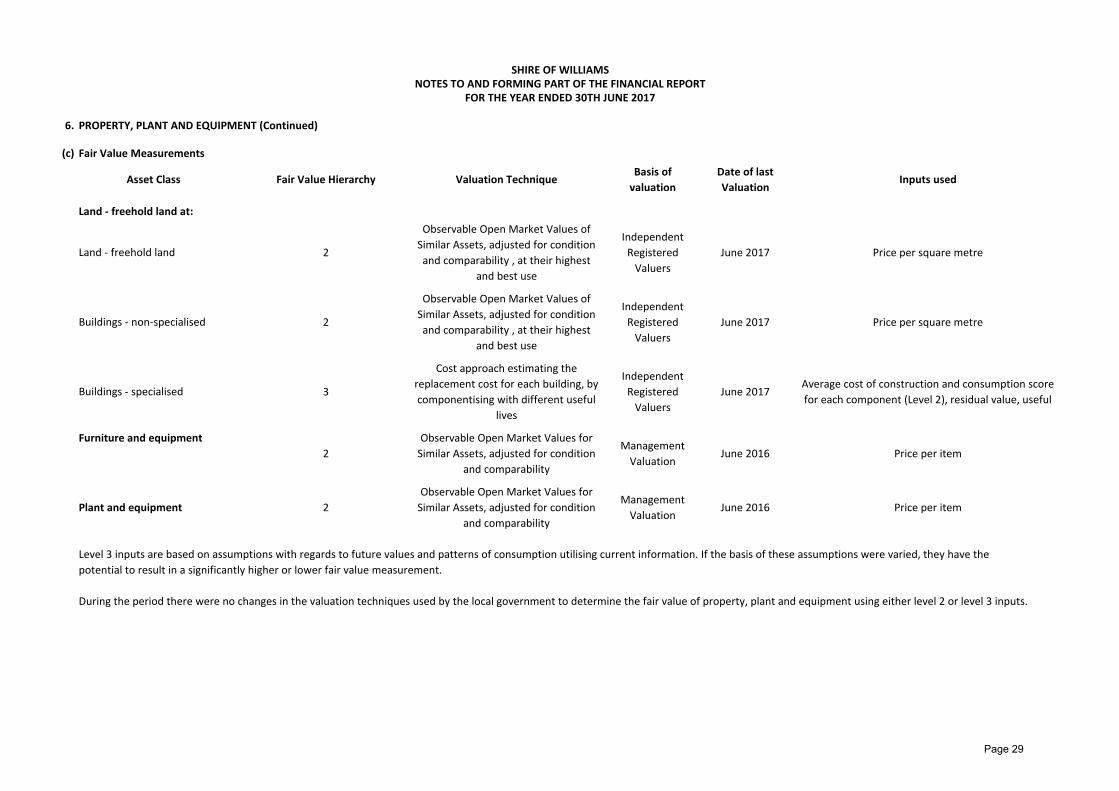
6. PROPERTY, PLANT AND EQUIPMENT (Continued)
(c) Fair Value Measurements
Asset Class Fair Value Hierarchy Valuation TechniqueBasis of
valuation
Date of last
ValuationInputs used
Land - freehold land at:
Land - freehold land 2
Observable Open Market Values of
Similar Assets, adjusted for condition
and comparability , at their highest
and best use
Independent
Registered
Valuers
June 2017 Price per square metre
Buildings - non-specialised 2
Observable Open Market Values of
Similar Assets, adjusted for condition
and comparability , at their highest
and best use
Independent
Registered
Valuers
June 2017 Price per square metre
Buildings - specialised 3
Cost approach estimating the
replacement cost for each building, by
componentising with different useful
lives
Independent
Registered
Valuers
June 2017Average cost of construction and consumption score
for each component (Level 2), residual value, useful
Furniture and equipment
2
Observable Open Market Values for
Similar Assets, adjusted for condition
and comparability
Management
ValuationJune 2016 Price per item
Plant and equipment 2
Observable Open Market Values for
Similar Assets, adjusted for condition
and comparability
Management
ValuationJune 2016 Price per item
Level 3 inputs are based on assumptions with regards to future values and patterns of consumption utilising current information. If the basis of these assumptions were varied, they have the
potential to result in a significantly higher or lower fair value measurement.
During the period there were no changes in the valuation techniques used by the local government to determine the fair value of property, plant and equipment using either level 2 or level 3 inputs.
SHIRE OF WILLIAMSNOTES TO AND FORMING PART OF THE FINANCIAL REPORT
FOR THE YEAR ENDED 30TH JUNE 2017
Page 29
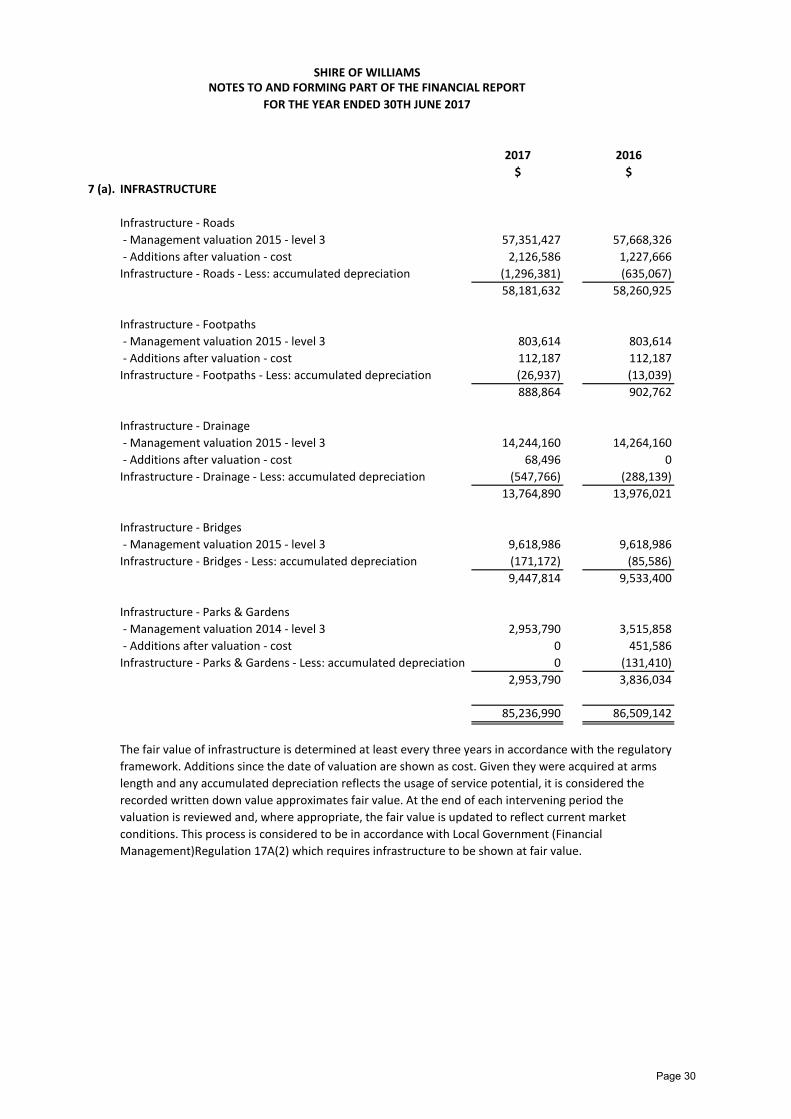
SHIRE OF WILLIAMSNOTES TO AND FORMING PART OF THE FINANCIAL REPORT
FOR THE YEAR ENDED 30TH JUNE 2017
2017 2016
$ $
7 (a). INFRASTRUCTURE
Infrastructure - Roads
- Management valuation 2015 - level 3 57,351,427 57,668,326
- Additions after valuation - cost 2,126,586 1,227,666
Infrastructure - Roads - Less: accumulated depreciation (1,296,381) (635,067)
58,181,632 58,260,925
Infrastructure - Footpaths
- Management valuation 2015 - level 3 803,614 803,614
- Additions after valuation - cost 112,187 112,187
Infrastructure - Footpaths - Less: accumulated depreciation (26,937) (13,039)
888,864 902,762
Infrastructure - Drainage
- Management valuation 2015 - level 3 14,244,160 14,264,160
- Additions after valuation - cost 68,496 0
Infrastructure - Drainage - Less: accumulated depreciation (547,766) (288,139)
13,764,890 13,976,021
Infrastructure - Bridges
- Management valuation 2015 - level 3 9,618,986 9,618,986
Infrastructure - Bridges - Less: accumulated depreciation (171,172) (85,586)
9,447,814 9,533,400
Infrastructure - Parks & Gardens
- Management valuation 2014 - level 3 2,953,790 3,515,858
- Additions after valuation - cost 0 451,586
Infrastructure - Parks & Gardens - Less: accumulated depreciation 0 (131,410)
2,953,790 3,836,034
85,236,990 86,509,142
The fair value of infrastructure is determined at least every three years in accordance with the regulatory
framework. Additions since the date of valuation are shown as cost. Given they were acquired at arms
length and any accumulated depreciation reflects the usage of service potential, it is considered the
recorded written down value approximates fair value. At the end of each intervening period the
valuation is reviewed and, where appropriate, the fair value is updated to reflect current market
conditions. This process is considered to be in accordance with Local Government (Financial
Management)Regulation 17A(2) which requires infrastructure to be shown at fair value.
Page 30
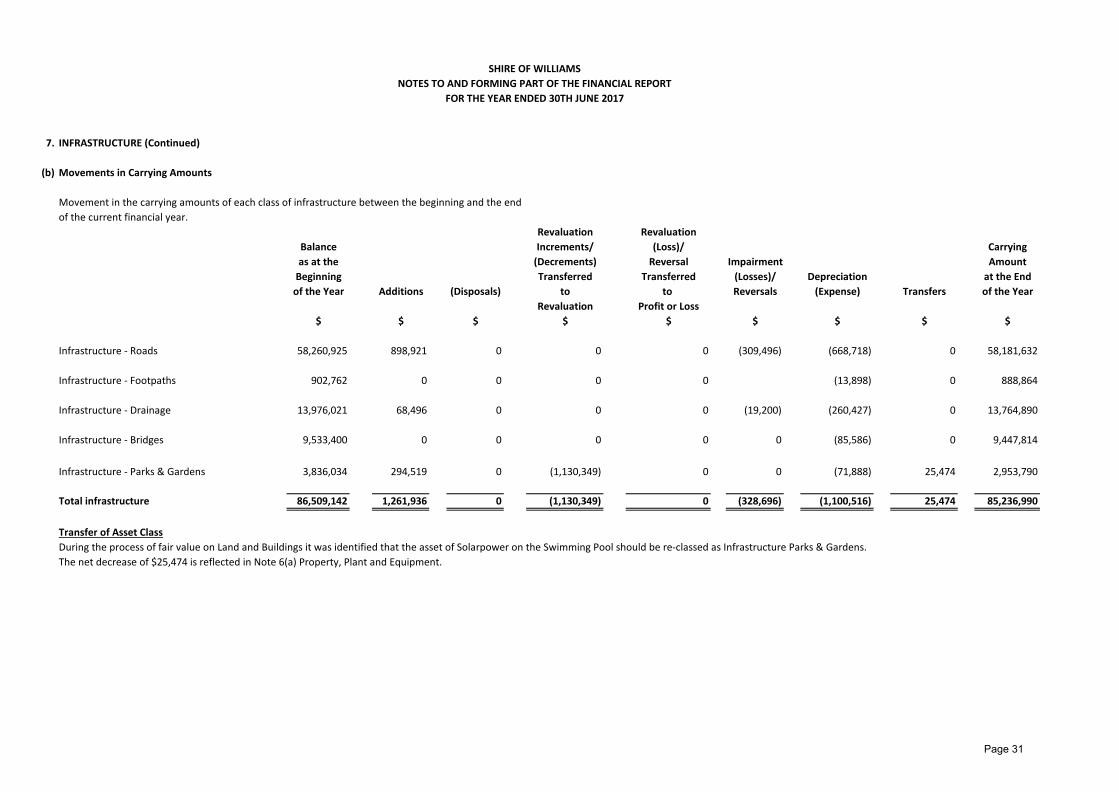
SHIRE OF WILLIAMS
NOTES TO AND FORMING PART OF THE FINANCIAL REPORT
FOR THE YEAR ENDED 30TH JUNE 2017
7. INFRASTRUCTURE (Continued)
(b) Movements in Carrying Amounts
Movement in the carrying amounts of each class of infrastructure between the beginning and the end
of the current financial year.
Revaluation Revaluation
Balance Increments/ (Loss)/ Carrying
as at the (Decrements) Reversal Impairment Amount
Beginning Transferred Transferred (Losses)/ Depreciation at the End
of the Year Additions (Disposals) to to Reversals (Expense) Transfers of the Year
Revaluation Profit or Loss
$ $ $ $ $ $ $ $ $
Infrastructure - Roads 58,260,925 898,921 0 0 0 (309,496) (668,718) 0 58,181,632
Infrastructure - Footpaths 902,762 0 0 0 0 (13,898) 0 888,864
Infrastructure - Drainage 13,976,021 68,496 0 0 0 (19,200) (260,427) 0 13,764,890
Infrastructure - Bridges 9,533,400 0 0 0 0 0 (85,586) 0 9,447,814
Infrastructure - Parks & Gardens 3,836,034 294,519 0 (1,130,349) 0 0 (71,888) 25,474 2,953,790
Total infrastructure 86,509,142 1,261,936 0 (1,130,349) 0 (328,696) (1,100,516) 25,474 85,236,990
Transfer of Asset Class
During the process of fair value on Land and Buildings it was identified that the asset of Solarpower on the Swimming Pool should be re-classed as Infrastructure Parks & Gardens.
The net decrease of $25,474 is reflected in Note 6(a) Property, Plant and Equipment.
Page 31

7. INFRASTRUCTURE (Continued)
(c) Fair Value Measurements
Asset ClassFair Value
HierarchyValuation Technique Basis of valuation
Date of last
ValuationInputs used
Infrastructure - Roads 3
Cost Approach, utilising ROMAN2
software, for depreciated
replacement cost
Independent Valuation June 2015
Construction unit rates for each component and
current condition (Level 2) residual values and
remaining useful life assessments.
Infrastructure - Footpaths 3
Cost Approach, utilising ROMAN2
software, for depreciated
replacement cost
Independent Valuation June 2015
Construction unit rates for each component and
current condition (Level 2) residual values and
remaining useful life assessments.
Infrastructure - Drainage 3
Cost Approach, utilising ROMAN2
software, for depreciated
replacement cost
Independent Valuation June 2015
Construction unit rates for each component and
current condition (Level 2) residual values and
remaining useful life assessments.
Infrastructure - Bridges 3
Cost Approach, utilising ROMAN2
software, for depreciated
replacement cost
Independent Valuation June 2015
Construction unit rates for each component and
current condition (Level 2) residual values and
remaining useful life assessments.
Infrastructure - Parks & Gardens 3
Cost Approach estimating the
replacement cost for each building,
by componentising with different
useful lives.
Independent Registered
ValuersJune 2017
Average cost of construction and consumption score
for each component (Level 2), residual value, useful
life, pattern of consumption and asset condition
assessments (Level 3) inputs.
SHIRE OF WILLIAMS
NOTES TO AND FORMING PART OF THE FINANCIAL REPORT
FOR THE YEAR ENDED 30TH JUNE 2017
Level 3 inputs are based on assumptions with regards to future values and patterns of consumption utilising current information. If the basis of these assumptions were varied , they have the potential
to result in a significantly higher or lower fair value measurement.
During the period there were no changes in the valuation techniques used to determine the fair value of infrastructure using level 3 inputs.
Page 32

SHIRE OF WILLIAMS
NOTES TO AND FORMING PART OF THE FINANCIAL REPORT
FOR THE YEAR ENDED 30TH JUNE 2017
2017 2016
$ $
8. TRADE AND OTHER PAYABLES
Current
Sundry creditors 72,573 76,084
Accrued interest on debentures 8,001 5,889
Accrued salaries and wages 35,162 35,647
ATO liabilities 20,738 29,182
136,474 146,802
9. LONG-TERM BORROWINGS
Current
Secured by floating charge
Debentures 79,243 62,210
79,243 62,210
Non-current
Secured by floating charge
Debentures 673,288 584,530
673,288 584,530
Additional detail on borrowings is provided in Note 21.
10. PROVISIONS
Provision for Provision for
Annual Long Service
Leave Leave Total
$ $ $
Opening balance at 1 July 2016
Current provisions 107,555 133,873 241,428
Non-current provisions 0 30,397 30,397
107,555 164,270 271,825
Additional provision 123,025 46,636 169,661
Amounts used (107,027) (29,961) (136,988)
Balance at 30 June 2017 123,553 180,945 304,498
Comprises
Current 123,553 145,907 269,460
Non-current 0 35,038 35,038
123,553 180,945 304,498
Page 33
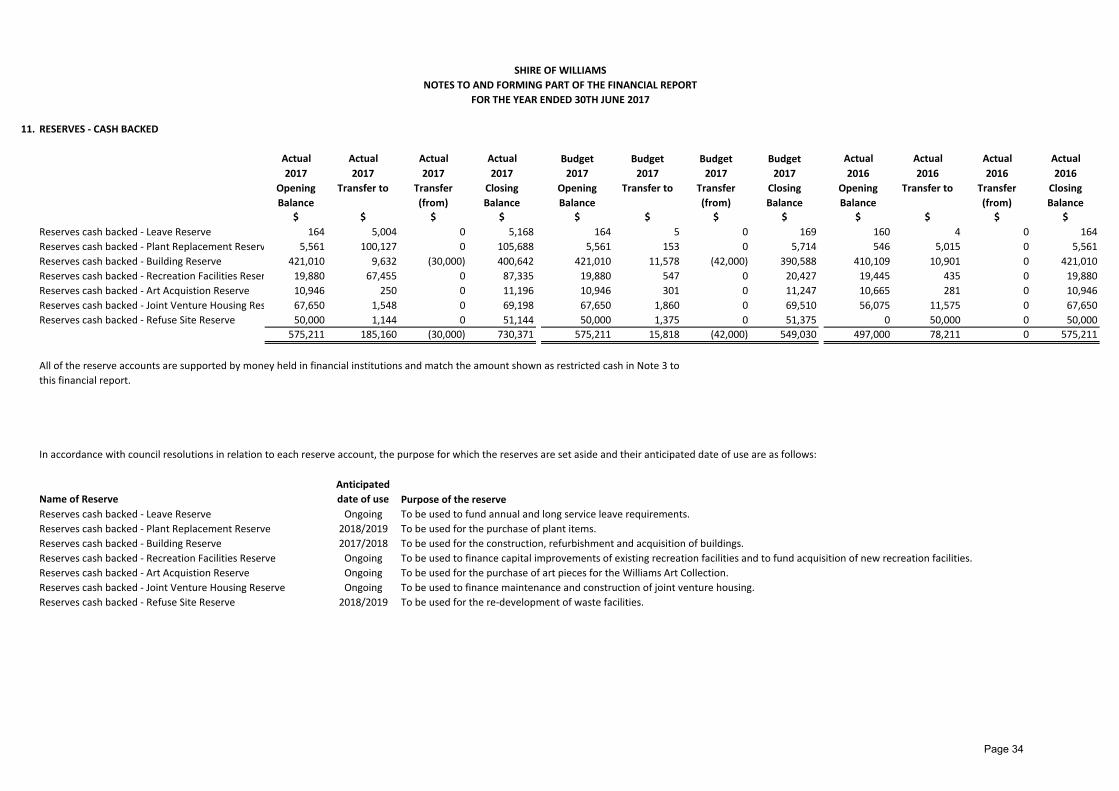
11. RESERVES - CASH BACKED
Actual Actual Actual Actual Budget Budget Budget Budget Actual Actual Actual Actual
2017 2017 2017 2017 2017 2017 2017 2017 2016 2016 2016 2016
Opening
Balance
Transfer to Transfer
(from)
Closing
Balance
Opening
Balance
Transfer to Transfer
(from)
Closing
Balance
Opening
Balance
Transfer to Transfer
(from)
Closing
Balance
$ $ $ $ $ $ $ $ $ $ $ $
Reserves cash backed - Leave Reserve 164 5,004 0 5,168 164 5 0 169 160 4 0 164
Reserves cash backed - Plant Replacement Reserve 5,561 100,127 0 105,688 5,561 153 0 5,714 546 5,015 0 5,561
Reserves cash backed - Building Reserve 421,010 9,632 (30,000) 400,642 421,010 11,578 (42,000) 390,588 410,109 10,901 0 421,010
Reserves cash backed - Recreation Facilities Reserve 19,880 67,455 0 87,335 19,880 547 0 20,427 19,445 435 0 19,880
Reserves cash backed - Art Acquistion Reserve 10,946 250 0 11,196 10,946 301 0 11,247 10,665 281 0 10,946
Reserves cash backed - Joint Venture Housing Reserve 67,650 1,548 0 69,198 67,650 1,860 0 69,510 56,075 11,575 0 67,650
Reserves cash backed - Refuse Site Reserve 50,000 1,144 0 51,144 50,000 1,375 0 51,375 0 50,000 0 50,000
575,211 185,160 (30,000) 730,371 575,211 15,818 (42,000) 549,030 497,000 78,211 0 575,211
In accordance with council resolutions in relation to each reserve account, the purpose for which the reserves are set aside and their anticipated date of use are as follows:
Name of Reserve
Anticipated
date of use Purpose of the reserve
Reserves cash backed - Leave Reserve Ongoing To be used to fund annual and long service leave requirements.
Reserves cash backed - Plant Replacement Reserve 2018/2019 To be used for the purchase of plant items.
Reserves cash backed - Building Reserve 2017/2018 To be used for the construction, refurbishment and acquisition of buildings.
Reserves cash backed - Recreation Facilities Reserve Ongoing To be used to finance capital improvements of existing recreation facilities and to fund acquisition of new recreation facilities.
Reserves cash backed - Art Acquistion Reserve Ongoing To be used for the purchase of art pieces for the Williams Art Collection.
Reserves cash backed - Joint Venture Housing Reserve Ongoing To be used to finance maintenance and construction of joint venture housing.
Reserves cash backed - Refuse Site Reserve 2018/2019 To be used for the re-development of waste facilities.
SHIRE OF WILLIAMS
NOTES TO AND FORMING PART OF THE FINANCIAL REPORT
FOR THE YEAR ENDED 30TH JUNE 2017
All of the reserve accounts are supported by money held in financial institutions and match the amount shown as restricted cash in Note 3 to
this financial report.
Page 34

12. REVALUATION SURPLUS
2017 2016
2017 2017 2017 Total 2017 2016 2016 2016 Total 2016
Opening Revaluation Revaluation Movement on Closing Opening Revaluation Revaluation Movement on Closing
Balance Increment (Decrement) Revaluation Balance Balance Increment (Decrement) Revaluation Balance
$ $ $ $ $ $ $ $ $ $
Revaluation surplus - Land and buildings 12,489,901 0 (1,418,319) (1,418,319) 11,071,582 12,489,901 0 0 0 12,489,901
Revaluation surplus - Plant and equipment 26,678 0 0 0 26,678 0 26,678 0 26,678 26,678
Revaluation surplus - Infrastructure - Roads 72,482,527 0 (328,696) (328,696) 72,153,831 72,482,527 0 0 0 72,482,527
Revaluation surplus - Infrastructure - Parks & Gardens 2,314,522 0 (1,130,349) (1,130,349) 1,184,173 2,314,522 0 0 0 2,314,522
87,313,628 0 (2,877,364) (2,877,364) 84,436,264 87,286,950 26,678 0 26,678 87,313,628
as provided for by AASB 116 Aus 40.1.
SHIRE OF WILLIAMS
NOTES TO AND FORMING PART OF THE FINANCIAL REPORT
FOR THE YEAR ENDED 30TH JUNE 2017
Movements on revaluation of fixed assets are not able to be reliably attributed to a program as the assets were revalued by class
Page 35
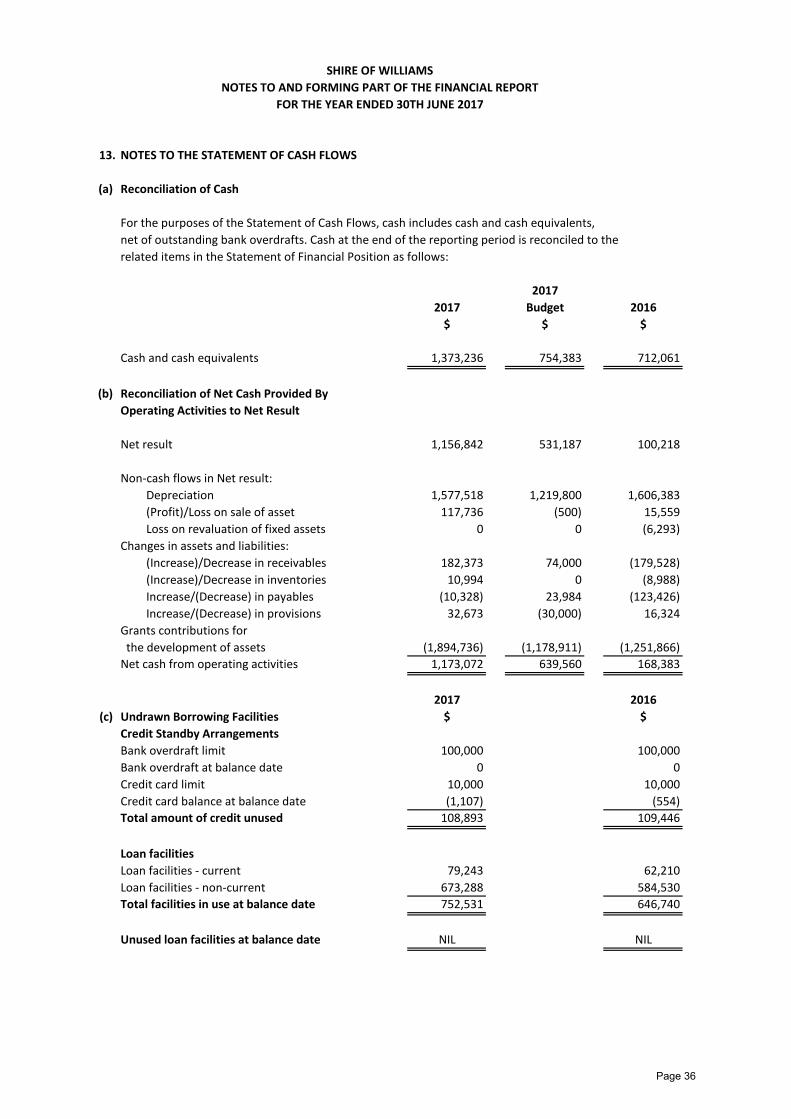
SHIRE OF WILLIAMS
NOTES TO AND FORMING PART OF THE FINANCIAL REPORT
FOR THE YEAR ENDED 30TH JUNE 2017
13. NOTES TO THE STATEMENT OF CASH FLOWS
(a) Reconciliation of Cash
For the purposes of the Statement of Cash Flows, cash includes cash and cash equivalents,
net of outstanding bank overdrafts. Cash at the end of the reporting period is reconciled to the
related items in the Statement of Financial Position as follows:
2017
2017 Budget 2016
$ $ $
Cash and cash equivalents 1,373,236 754,383 712,061
(b) Reconciliation of Net Cash Provided By
Operating Activities to Net Result
Net result 1,156,842 531,187 100,218
Non-cash flows in Net result:
Depreciation 1,577,518 1,219,800 1,606,383
(Profit)/Loss on sale of asset 117,736 (500) 15,559
Loss on revaluation of fixed assets 0 0 (6,293)
Changes in assets and liabilities:
(Increase)/Decrease in receivables 182,373 74,000 (179,528)
(Increase)/Decrease in inventories 10,994 0 (8,988)
Increase/(Decrease) in payables (10,328) 23,984 (123,426)
Increase/(Decrease) in provisions 32,673 (30,000) 16,324
Grants contributions for
the development of assets (1,894,736) (1,178,911) (1,251,866)
Net cash from operating activities 1,173,072 639,560 168,383
2017 2016
(c) Undrawn Borrowing Facilities $ $
Credit Standby Arrangements
Bank overdraft limit 100,000 100,000
Bank overdraft at balance date 0 0
Credit card limit 10,000 10,000
Credit card balance at balance date (1,107) (554)
Total amount of credit unused 108,893 109,446
Loan facilities
Loan facilities - current 79,243 62,210
Loan facilities - non-current 673,288 584,530
Total facilities in use at balance date 752,531 646,740
Unused loan facilities at balance date NIL NIL
Page 36
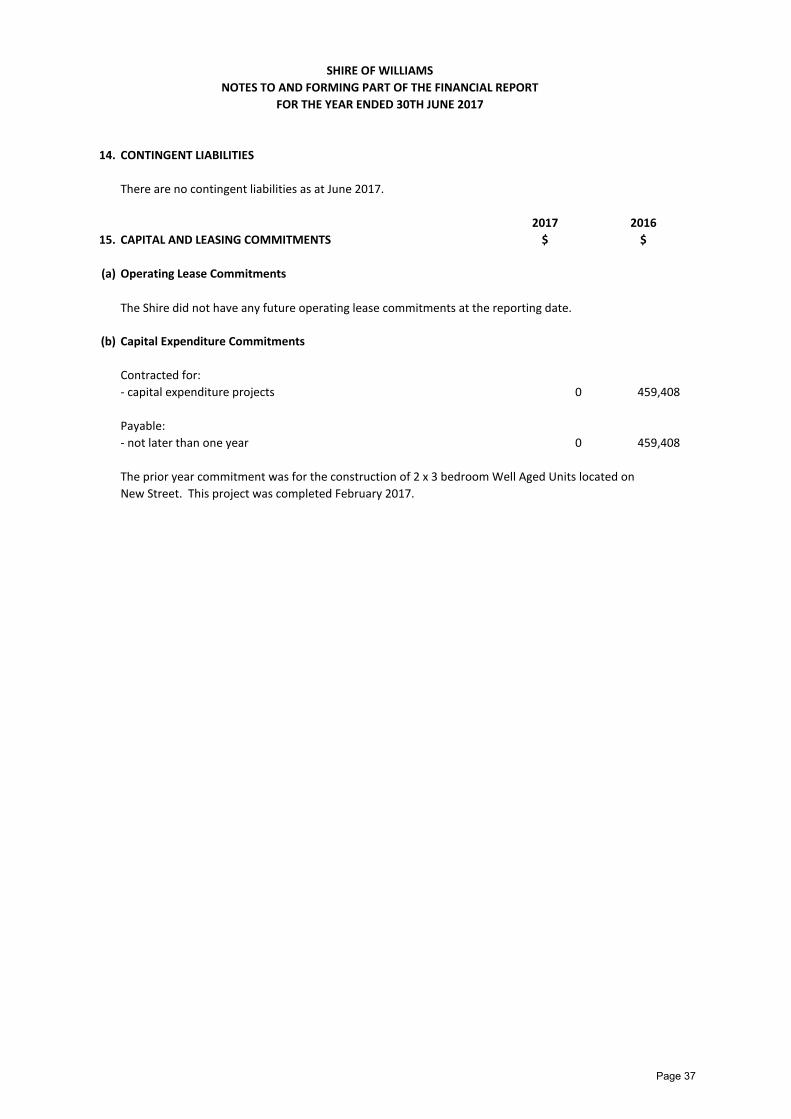
SHIRE OF WILLIAMS
NOTES TO AND FORMING PART OF THE FINANCIAL REPORT
FOR THE YEAR ENDED 30TH JUNE 2017
14. CONTINGENT LIABILITIES
There are no contingent liabilities as at June 2017.
2017 2016
15. CAPITAL AND LEASING COMMITMENTS $ $
(a) Operating Lease Commitments
(b) Capital Expenditure Commitments
Contracted for:
- capital expenditure projects 0 459,408
Payable:
- not later than one year 0 459,408
The Shire did not have any future operating lease commitments at the reporting date.
The prior year commitment was for the construction of 2 x 3 bedroom Well Aged Units located on
New Street. This project was completed February 2017.
Page 37

SHIRE OF WILLIAMS
NOTES TO AND FORMING PART OF THE FINANCIAL REPORT
FOR THE YEAR ENDED 30TH JUNE 2017
16. JOINT VENTURE ARRANGEMENTS
Sandalwood Crt and Wandoo Cottages both located on Growse Street, Williams. The assets are land and
8 x 2 bedroom units. The ownership of the assets is determined by an equity agreement and Councils share
2017 2016
$ $
Non-current assets
Land and buildings 0 1,702,422
- Independent Valuation 2017 1,523,703 0
Less: accumulated depreciation 0 (67,110)
1,523,703 1,635,312
17. TOTAL ASSETS CLASSIFIED BY FUNCTION AND ACTIVITY
2017 2016
$ $
Governance 1,897,711 2,041,476
General purpose funding 0 10,829
Law, order, public safety 56,428 58,578
Health 901,753 862,261
Education and welfare 1,759,696 1,644,911
Housing 2,753,798 3,118,865
Community amenities 220,531 260,764
Recreation and culture 8,121,538 8,231,455
Transport 84,236,504 85,251,897
Economic services 4,590,246 5,163,280
Other property and services 14,938 9,851
Unallocated 631,962 123,324
105,185,105 106,777,491
The Shire has a joint venture arrangement with the Department of Housing for the provision of housing at
of the assets are included in the Land and Buildings as follows;
Page 38
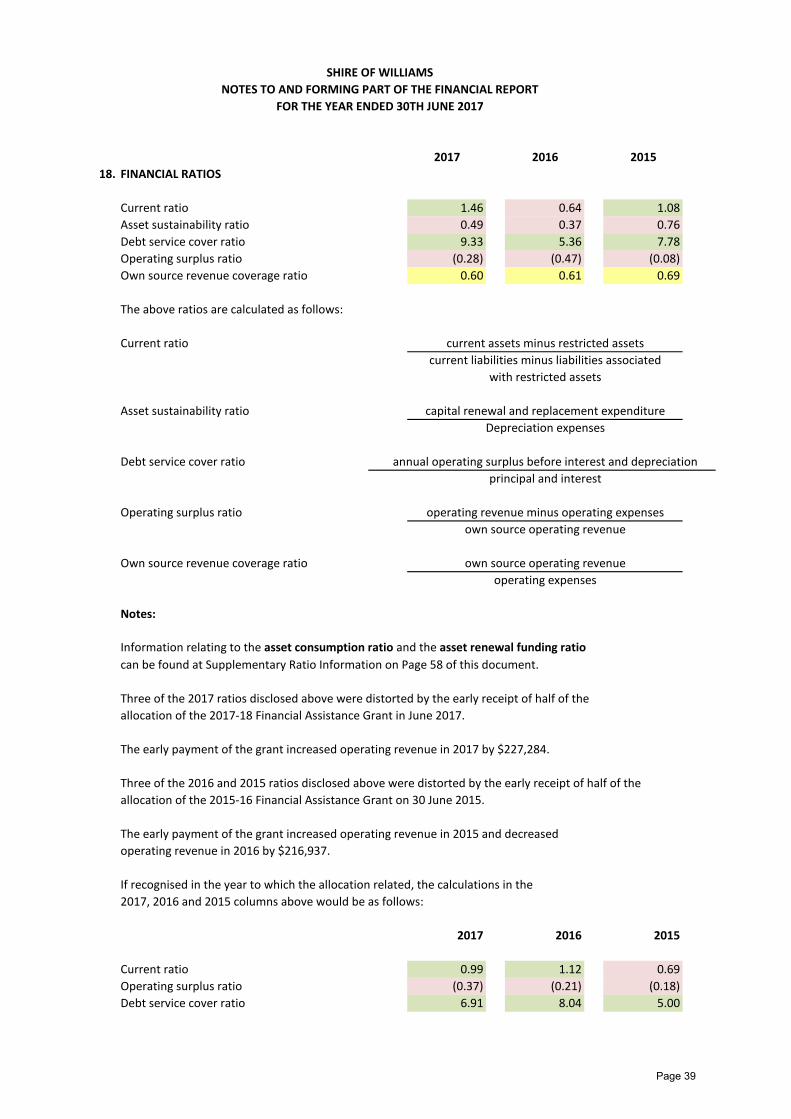
SHIRE OF WILLIAMS
NOTES TO AND FORMING PART OF THE FINANCIAL REPORT
FOR THE YEAR ENDED 30TH JUNE 2017
2017 2016 2015
18. FINANCIAL RATIOS
Current ratio 1.46 0.64 1.08
Asset sustainability ratio 0.49 0.37 0.76
Debt service cover ratio 9.33 5.36 7.78
Operating surplus ratio (0.28) (0.47) (0.08)
Own source revenue coverage ratio 0.60 0.61 0.69
The above ratios are calculated as follows:
Current ratio current assets minus restricted assets
current liabilities minus liabilities associated
with restricted assets
Asset sustainability ratio
Depreciation expenses
Debt service cover ratio annual operating surplus before interest and depreciation
principal and interest
Operating surplus ratio operating revenue minus operating expenses
own source operating revenue
Own source revenue coverage ratio own source operating revenue
operating expenses
Notes:
Information relating to the asset consumption ratio and the asset renewal funding ratio
can be found at Supplementary Ratio Information on Page 58 of this document.
Three of the 2017 ratios disclosed above were distorted by the early receipt of half of the
allocation of the 2017-18 Financial Assistance Grant in June 2017.
The early payment of the grant increased operating revenue in 2017 by $227,284.
Three of the 2016 and 2015 ratios disclosed above were distorted by the early receipt of half of the
allocation of the 2015-16 Financial Assistance Grant on 30 June 2015.
The early payment of the grant increased operating revenue in 2015 and decreased
operating revenue in 2016 by $216,937.
If recognised in the year to which the allocation related, the calculations in the
2017, 2016 and 2015 columns above would be as follows:
2017 2016 2015
Current ratio 0.99 1.12 0.69
Operating surplus ratio (0.37) (0.21) (0.18)
Debt service cover ratio 6.91 8.04 5.00
capital renewal and replacement expenditure
Page 39
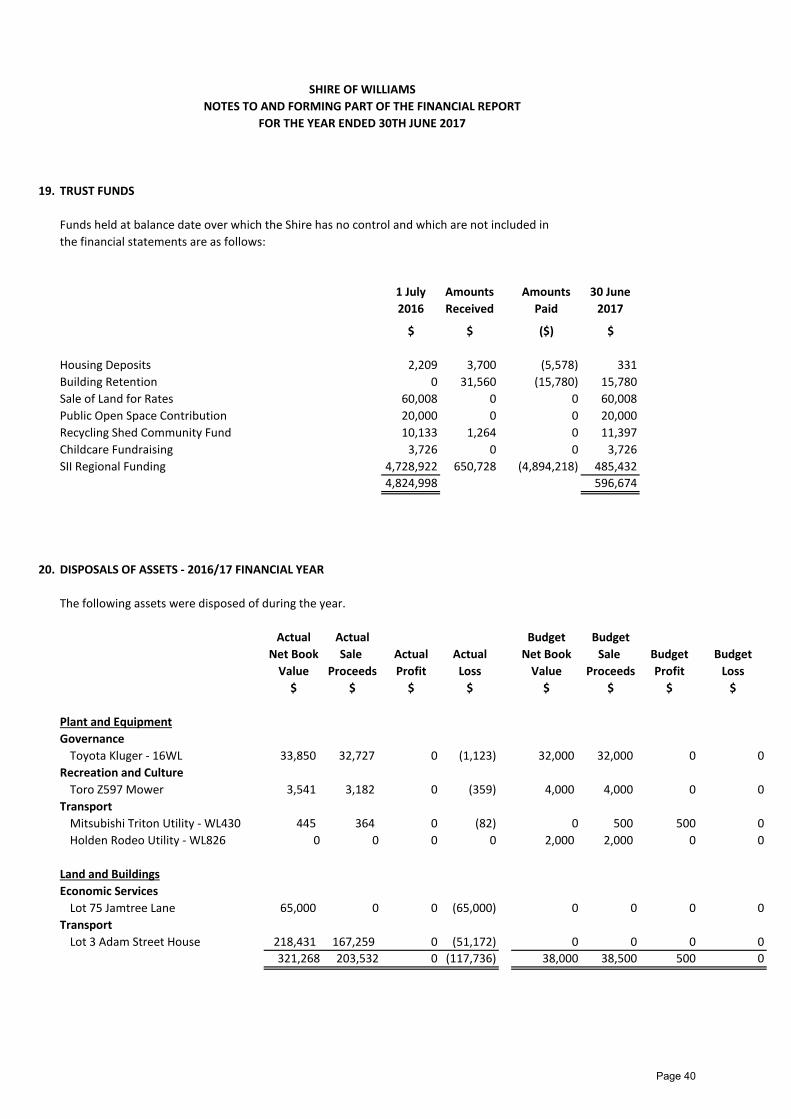
SHIRE OF WILLIAMS
NOTES TO AND FORMING PART OF THE FINANCIAL REPORT
FOR THE YEAR ENDED 30TH JUNE 2017
19. TRUST FUNDS
Funds held at balance date over which the Shire has no control and which are not included in
the financial statements are as follows:
1 July
2016
Amounts
Received
Amounts
Paid
30 June
2017
$ $ ($) $
Housing Deposits 2,209 3,700 (5,578) 331
Building Retention 0 31,560 (15,780) 15,780
Sale of Land for Rates 60,008 0 0 60,008
Public Open Space Contribution 20,000 0 0 20,000
Recycling Shed Community Fund 10,133 1,264 0 11,397
Childcare Fundraising 3,726 0 0 3,726
SII Regional Funding 4,728,922 650,728 (4,894,218) 485,432
4,824,998 596,674
20. DISPOSALS OF ASSETS - 2016/17 FINANCIAL YEAR
The following assets were disposed of during the year.
Actual Actual Budget Budget
Net Book Sale Actual Actual Net Book Sale Budget Budget
Value Proceeds Profit Loss Value Proceeds Profit Loss
$ $ $ $ $ $ $ $
Plant and Equipment
Governance
Toyota Kluger - 16WL 33,850 32,727 0 (1,123) 32,000 32,000 0 0
Recreation and Culture
Toro Z597 Mower 3,541 3,182 0 (359) 4,000 4,000 0 0
Transport
Mitsubishi Triton Utility - WL430 445 364 0 (82) 0 500 500 0
Holden Rodeo Utility - WL826 0 0 0 0 2,000 2,000 0 0
Land and Buildings
Economic Services
Lot 75 Jamtree Lane 65,000 0 0 (65,000) 0 0 0 0
Transport
Lot 3 Adam Street House 218,431 167,259 0 (51,172) 0 0 0 0
321,268 203,532 0 (117,736) 38,000 38,500 500 0
Page 40

SHIRE OF WILLIAMS
NOTES TO AND FORMING PART OF THE FINANCIAL REPORT
FOR THE YEAR ENDED 30TH JUNE 2017
21. INFORMATION ON BORROWINGS
(a) Repayments - Debentures
Principal Principal Principal InterestNew Repayments 30 June 2017 Repayments
Loans Actual Budget Actual Budget Actual Budget
Particulars $ $ $ $ $ $ $ $
Governance
Loan #68 - IT Computer Server 25,919 0 7,109 7,109 18,810 18,810 737 787
Transport
Loan #67 - CAT Grader 209,682 0 35,274 35,274 174,408 174,408 6,693 6,872
Economic services
Loan #66 - Industrial Shed 185,099 0 10,459 10,459 174,640 174,640 7,516 7,611
Other property and services
Loan #65 - Industrial Land 226,040 0 9,368 9,368 216,672 216,672 14,129 14,252
646,740 0 62,209 62,210 584,531 584,530 29,075 29,522
Self Supporting Loans
Recreation and culture
Loan #69 - Bowling Club Synthetic Turf 0 168,000 0 0 168,000 167,858 2,559 0
0 168,000 0 0 168,000 167,858 2,559 0
646,740 168,000 62,209 62,210 752,531 752,388 31,634 29,522
Self supporting loan financed by payments from third parties.
All other loan repayments were financed by general purpose revenue.
1 July
2016
Page 41

SHIRE OF WILLIAMS
NOTES TO AND FORMING PART OF THE FINANCIAL REPORT
FOR THE YEAR ENDED 30TH JUNE 2017
21. INFORMATION ON BORROWINGS (Continued)
(b) New Debentures - 2016/17
Total
Loan Term Interest & Interest Balance
Actual Budget Institution Type (Years) Charges Rate Actual Budget Unspent
Particulars/Purpose $ $ $ % $ $ $
Loan #69 - Bowling Club Synthetic Turf 168,000 167,858 WATC Debenture 10 29,156 3.15% 168,000 167,858 0
168,000 167,858 29,156 168,000 167,858 0
(c) Unspent Debentures
(d) Overdraft
Council established an overdraft facility of $100,000 to assist with short term liquidity requirements. The balance of the overdraft at 1 July 2016 and 30 June 2017
was $NIL.
Amount Borrowed Amount Used
The Shire did not have any unspent debentures as at 30 June 2017.
Page 42

SHIRE OF WILLIAMS
NOTES TO AND FORMING PART OF THE FINANCIAL REPORT
FOR THE YEAR ENDED 30TH JUNE 2017
22. RATING INFORMATION - 2016/17 FINANCIAL YEAR
Number Budget Budget Budget Budget
Rate in of Rateable Rate Interim Back Total Rate Interim Back Total
$ Properties Value Revenue Rates Rates Revenue Revenue Rate Rate Revenue
RATE TYPE $ $ $ $ $ $ $ $ $
GRV Industrial/Commercial 0.06355 19 959,856 60,808 0 0 60,808 61,000 0 0 61,000
GRV Residential 0.06355 154 1,905,016 121,061 489 0 121,550 121,066 0 0 121,066
Unimproved value valuations
UV Rural/Mining 0.00674 295 205,778,000 1,387,148 1,034 0 1,388,182 1,387,149 0 0 1,387,149
Sub-Total 468 208,642,872 1,569,017 1,523 0 1,570,540 1,569,215 0 0 1,569,215
Minimum
$
GRV Industrial/Commercial 610 18 58,875 10,980 0 0 10,980 10,980 0 0 10,980
GRV Residential 610 128 546,500 78,080 (28) 0 78,052 78,080 0 0 78,080
Unimproved value valuations
UV Rural/Mining 710 33 2,048,946 23,430 930 0 24,360 23,430 0 0 23,430
Sub-Total 179 2,654,321 112,490 902 0 113,392 112,490 0 0 112,490
647 211,297,193 1,681,507 2,425 0 1,683,932 1,681,705 0 0 1,681,705
0 0
1,683,932 1,681,705
0 0
18,051 17,610
Totals 1,701,983 1,699,315
Specified Area Rate (refer note 24)
Ex-gratia rates
Differential general rate / general rate
Gross rental value valuations
Minimum payment
Gross rental value valuations
Total amount raised from general rate
Discounts/concessions (refer note 26)
Page 43

SHIRE OF WILLIAMS
NOTES TO AND FORMING PART OF THE FINANCIAL REPORT
FOR THE YEAR ENDED 30TH JUNE 2017
23. NET CURRENT ASSETS
2017 2017 2016
(30 June 2017
Carried Brought Carried
Forward) Forward) Forward)
$ $ $
Surplus/(Deficit) 1 July 16 brought forward 296,521 (3,428) (3,428)
CURRENT ASSETS
Cash and cash equivalents
Unrestricted 642,865 136,849 136,849
Restricted 730,371 575,211 575,211
Receivables
Rates outstanding 14,737 10,829 10,829
Sundry debtors 41,106 230,012 230,012
Loans receivable - clubs/institutions 14,537 0 0
Provision for Doubtful Debts (10,903) (13,528) (13,528)
Inventories
Materials 5,121 7,032 7,032
Fuels 3,456 12,507 12,507
History Books 905 937 937
LESS: CURRENT LIABILITIES
Trade and other payables
Sundry creditors (72,573) (76,084) (76,084)
Accrued interest on debentures (8,001) (5,889) (5,889)
Accrued salaries and wages (35,162) (35,647) (35,647)
ATO liabilities (20,738) (29,182) (29,182)
Current portion of long term borrowings
Secured by floating charge (79,243) (62,210) (62,210)
Provisions
Provision for annual leave (123,553) (107,555) (107,555)
Provision for long service leave (145,907) (133,873) (133,873)
Unadjusted net current assets 957,018 509,409 509,409
Adjustments
Less: Reserves - restricted cash (730,371) (575,211) (575,211)
Less: Loans receivable - clubs/institutions (14,537) 0 0
Add: Secured by floating charge 79,243 62,210 62,210
Add: Leave Entitlements Cash Backed 5,168 164 164
Adjusted net current assets - surplus/(deficit) 296,521 (3,428) (3,428)
Difference
in the 2017 audited financial report and the surplus/(deficit) carried forward position as disclosed
in the 2016 audited financial report.
Composition of net current assets
(30 June 2016
There was no difference between the surplus/(deficit) 1 July 2016 brought forward position used
(1 July 2016
Page 44
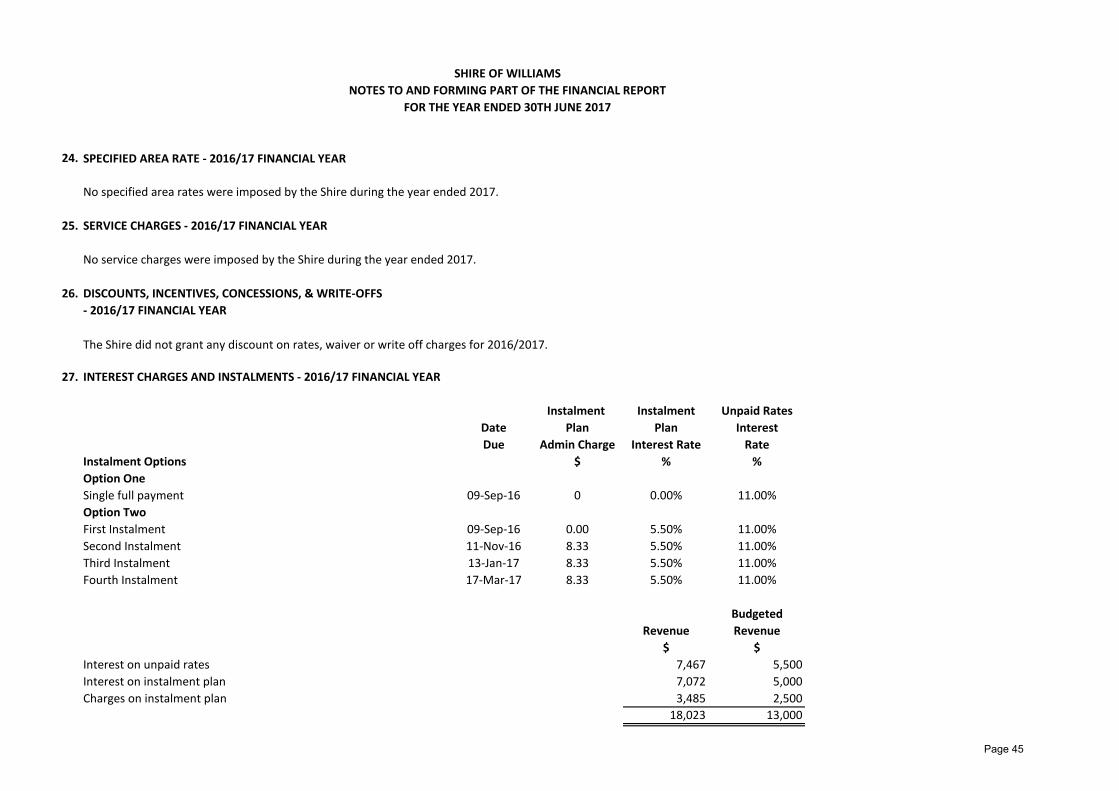
24.
No specified area rates were imposed by the Shire during the year ended 2017.
25. SERVICE CHARGES - 2016/17 FINANCIAL YEAR
No service charges were imposed by the Shire during the year ended 2017.
26. DISCOUNTS, INCENTIVES, CONCESSIONS, & WRITE-OFFS
- 2016/17 FINANCIAL YEAR
The Shire did not grant any discount on rates, waiver or write off charges for 2016/2017.
27. INTEREST CHARGES AND INSTALMENTS - 2016/17 FINANCIAL YEAR
Instalment Instalment Unpaid Rates
Date Plan Plan Interest
Due Admin Charge Interest Rate Rate
Instalment Options $ % %
Option One
Single full payment 09-Sep-16 0 0.00% 11.00%
Option Two
First Instalment 09-Sep-16 0.00 5.50% 11.00%
Second Instalment 11-Nov-16 8.33 5.50% 11.00%
Third Instalment 13-Jan-17 8.33 5.50% 11.00%
Fourth Instalment 17-Mar-17 8.33 5.50% 11.00%
Budgeted
Revenue Revenue
$ $
Interest on unpaid rates 7,467 5,500
Interest on instalment plan 7,072 5,000
Charges on instalment plan 3,485 2,500
18,023 13,000
SHIRE OF WILLIAMS
NOTES TO AND FORMING PART OF THE FINANCIAL REPORT
FOR THE YEAR ENDED 30TH JUNE 2017
SPECIFIED AREA RATE - 2016/17 FINANCIAL YEAR
Page 45
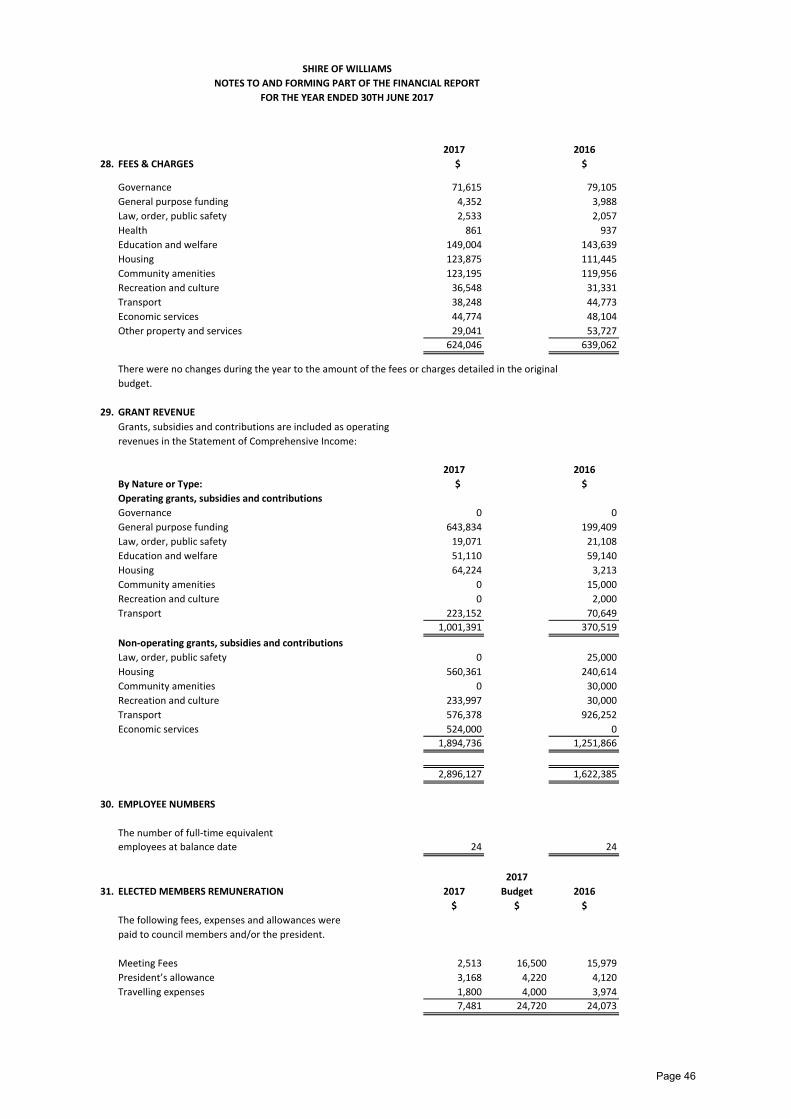
2017 2016
28. FEES & CHARGES $ $
Governance 71,615 79,105
General purpose funding 4,352 3,988
Law, order, public safety 2,533 2,057
Health 861 937
Education and welfare 149,004 143,639
Housing 123,875 111,445
Community amenities 123,195 119,956
Recreation and culture 36,548 31,331
Transport 38,248 44,773
Economic services 44,774 48,104
Other property and services 29,041 53,727
624,046 639,062
There were no changes during the year to the amount of the fees or charges detailed in the original
29. GRANT REVENUE
Grants, subsidies and contributions are included as operating
revenues in the Statement of Comprehensive Income:
2017 2016
By Nature or Type: $ $
Operating grants, subsidies and contributions
Governance 0 0
General purpose funding 643,834 199,409
Law, order, public safety 19,071 21,108
Education and welfare 51,110 59,140
Housing 64,224 3,213
Community amenities 0 15,000
Recreation and culture 0 2,000
Transport 223,152 70,649
1,001,391 370,519
Non-operating grants, subsidies and contributions
Law, order, public safety 0 25,000
Housing 560,361 240,614
Community amenities 0 30,000
Recreation and culture 233,997 30,000
Transport 576,378 926,252
Economic services 524,000 0
1,894,736 1,251,866
2,896,127 1,622,385
30. EMPLOYEE NUMBERS
The number of full-time equivalent
employees at balance date 24 24
2017
31. ELECTED MEMBERS REMUNERATION 2017 Budget 2016
$ $ $
The following fees, expenses and allowances were
paid to council members and/or the president.
Meeting Fees 2,513 16,500 15,979
President’s allowance 3,168 4,220 4,120
Travelling expenses 1,800 4,000 3,974
7,481 24,720 24,073
SHIRE OF WILLIAMS
NOTES TO AND FORMING PART OF THE FINANCIAL REPORT
FOR THE YEAR ENDED 30TH JUNE 2017
budget.
Page 46
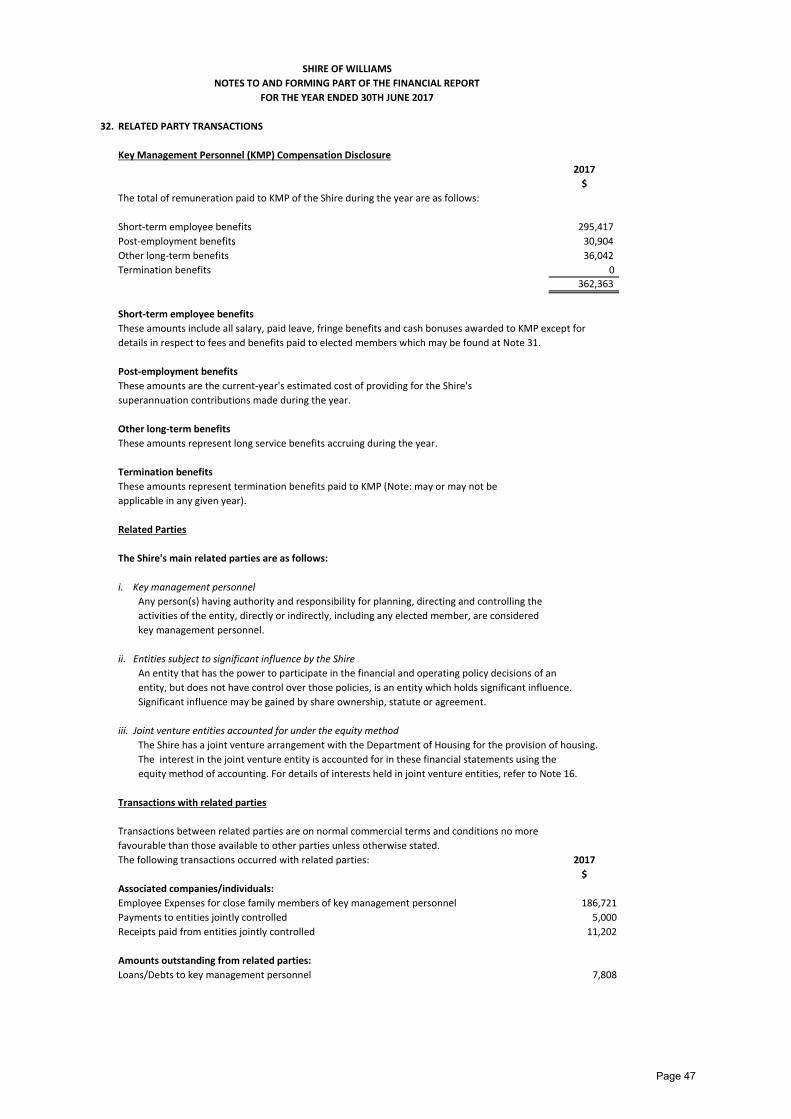
32. RELATED PARTY TRANSACTIONS
Key Management Personnel (KMP) Compensation Disclosure
2017
$
The total of remuneration paid to KMP of the Shire during the year are as follows:
Short-term employee benefits 295,417
Post-employment benefits 30,904
Other long-term benefits 36,042
Termination benefits 0
362,363
Short-term employee benefits
These amounts include all salary, paid leave, fringe benefits and cash bonuses awarded to KMP except for
details in respect to fees and benefits paid to elected members which may be found at Note 31.
Post-employment benefits
These amounts are the current-year's estimated cost of providing for the Shire's
superannuation contributions made during the year.
Other long-term benefits
These amounts represent long service benefits accruing during the year.
Termination benefits
These amounts represent termination benefits paid to KMP (Note: may or may not be
applicable in any given year).
Related Parties
The Shire's main related parties are as follows:
i. Key management personnel
Any person(s) having authority and responsibility for planning, directing and controlling the
activities of the entity, directly or indirectly, including any elected member, are considered
key management personnel.
ii. Entities subject to significant influence by the Shire
An entity that has the power to participate in the financial and operating policy decisions of an
entity, but does not have control over those policies, is an entity which holds significant influence.
Significant influence may be gained by share ownership, statute or agreement.
iii. Joint venture entities accounted for under the equity method
The Shire has a joint venture arrangement with the Department of Housing for the provision of housing.
The interest in the joint venture entity is accounted for in these financial statements using the
equity method of accounting. For details of interests held in joint venture entities, refer to Note 16.
Transactions with related parties
Transactions between related parties are on normal commercial terms and conditions no more
favourable than those available to other parties unless otherwise stated.
The following transactions occurred with related parties: 2017
$
Associated companies/individuals:
Employee Expenses for close family members of key management personnel 186,721
Payments to entities jointly controlled 5,000
Receipts paid from entities jointly controlled 11,202
Amounts outstanding from related parties:
Loans/Debts to key management personnel 7,808
SHIRE OF WILLIAMS
NOTES TO AND FORMING PART OF THE FINANCIAL REPORT
FOR THE YEAR ENDED 30TH JUNE 2017
Page 47
33. MAJOR LAND TRANSACTIONS
The Shire did not participate in any major land transactions during the 2016/2017 financial year.
34. TRADING UNDERTAKINGS AND MAJOR TRADING UNDERTAKINGS
The Shire did not participate in any trading undertakings or major trading undertakings during the 2016/2017
financial year.
SHIRE OF WILLIAMS
NOTES TO AND FORMING PART OF THE FINANCIAL REPORT
FOR THE YEAR ENDED 30TH JUNE 2017
Page 48

SHIRE OF WILLIAMS
NOTES TO AND FORMING PART OF THE FINANCIAL REPORT
FOR THE YEAR ENDED 30TH JUNE 2017
35. FINANCIAL RISK MANAGEMENT
foreign currency risk.
Carrying Value Fair Value
2017 2016 2017 2016
$ $ $ $
Financial assets
Cash and cash equivalents 1,373,236 712,061 1,373,236 712,061
Investments 0 0 0 0
Receivables 212,940 227,313 212,940 230,109
1,586,176 939,374 1,586,176 942,170
Financial liabilities
Payables 136,474 146,802 136,474 146,802
Borrowings 752,531 646,740 691,272 589,882
889,005 793,542 827,746 736,684
Fair value is determined as follows:
• Cash and cash equivalents, receivables, payables - estimated to the carrying value which
approximates net market value.
• Borrowings, held to maturity investments, estimated future cash flows discounted by the current
market interest rates applicable to assets and liabilities with similar risk profiles.
• Financial assets at fair value through profit and loss, available for sale financial assets - based on
quoted market prices at the reporting date or independent valuation.
The Shire’s activities expose it to a variety of financial risks including price risk, credit risk, liquidity risk and
The Shire does not engage in transactions expressed in foreign currencies and is therefore not subject to
Financial risk management is carried out by the finance area under policies approved by the Council.
The Shire held the following financial instruments at balance date:
interest rate risk. The Shire’s overall risk management focuses on the unpredictability of financial
markets and seeks to minimise potential adverse effects on the financial performance of the Shire.
Page 49
SHIRE OF WILLIAMS
NOTES TO AND FORMING PART OF THE FINANCIAL REPORT
FOR THE YEAR ENDED 30TH JUNE 2017
35. FINANCIAL RISK MANAGEMENT (Continued)
(a) Cash and Cash Equivalents
Financial assets at fair value through profit and loss
Available-for-sale financial assets
Held-to-maturity investments
The major risk associated with investments is price risk - the risk that the capital value of investments
may fluctuate due to changes in market prices, whether these changes are caused by factors specific
to individual financial instruments of their issuers or factors affecting similar instruments traded in a
market.
could affect returns.
2017 2016
$ $
Impact of a 1% (1) movement in interest rates on cash
- Equity 13,732 13,516
- Statement of Comprehensive Income 13,732 13,516
Notes:(1)
Cash and investments are also subject to interest rate risk - the risk that movements in interest rates
Another risk associated with cash is credit risk – the risk that a contracting entity will not complete its
The Shire manages these risks by diversifying its portfolio and only investing ininvestments authorised
The Shire’s objective is to maximise its return on cash and investments whilst maintaining an adequate
level of liquidity and preserving capital. The finance area manages the cash and investments portfolio
with the assistance of independent advisers (where applicable). Council has an investment policy and
the policy is subject to review by Council. An Investment Report is provided to Council on a monthly
basis setting out the make-up and performance of the portfolio.
obligations under a financial instrument resulting in a financial loss to the Shire.
by Local Government (Financial Management) Regulation 19C . Council also seeks advice from
independent advisers (where considered necessary) before placing any cash and investments.
Sensitivity percentages based on management's expectation of future possible market movements.
Page 50

SHIRE OF WILLIAMS
NOTES TO AND FORMING PART OF THE FINANCIAL REPORT
FOR THE YEAR ENDED 30TH JUNE 2017
35. FINANCIAL RISK MANAGEMENT (Continued)
(b) Receivables
most non-rate debtors.
2017 2016
Percentage of rates and annual charges
- Current 0% 0%
- Overdue 100% 100%
Percentage of other receivables
- Current 92% 93%
- Overdue 8% 7%
The profile of the Shire’s credit risk at balance date was:
The Shire makes suitable provision for doubtful receivables as required and carries out credit checks on
There are no material receivables that have been subject to a re-negotiation of repayment terms.
encourages ratepayers to pay rates by the due date through incentives.
a secured charge over the land – that is, the land can be sold to recover the debt. The Shire is also able
to charge interest on overdue rates and annual charges at higher than market rates, which further
encourages payment.
monitored for acceptable collection performance.
Credit risk on rates and annual charges is minimised by the ability of the Shire to recover these debts as
Shire manages this risk by monitoring outstanding debt and employing debt recovery policies. It also
The Shire’s major receivables comprise rates and annual charges and user charges and fees. The major
The level of outstanding receivables is reported to Council monthly and benchmarks are set and
risk associated with these receivables is credit risk – the risk that the debts may not be repaid. The
Page 51

SHIRE OF WILLIAMS
NOTES TO AND FORMING PART OF THE FINANCIAL REPORT
FOR THE YEAR ENDED 30TH JUNE 2017
35. FINANCIAL RISK MANAGEMENT (Continued)
(c) Payables
Borrowings
Due Due Due Total
within between after contractual Carrying
1 year 1 & 5 years 5 years cash flows values
$ $ $ $ $
2017
Payables 136,474 0 0 136,474 136,474
Borrowings 111,447 433,944 509,441 1,054,832 752,531
247,921 433,944 509,441 1,191,306 889,005
2016
Payables 146,802 0 0 146,802 146,802
Borrowings 91,731 355,079 410,861 857,671 646,740
238,533 355,079 410,861 1,004,473 793,542
Payables and borrowings are both subject to liquidity risk – that is the risk that insufficient funds may be on hand to meet payment obligations
The contractual undiscounted cash flows of the Shire’s Payables and Borrowings are set out in the Liquidity Sensitivity Table below:
as and when they fall due. The Shire manages this risk by monitoring its cash flow requirements and liquidity levels and maintaining an adequate
cash buffer. Payment terms can be extended and overdraft facilities drawn upon if required.
Page 52

SHIRE OF WILLIAMS
NOTES TO AND FORMING PART OF THE FINANCIAL REPORT
FOR THE YEAR ENDED 30TH JUNE 2017
35. FINANCIAL RISK MANAGEMENT (Continued)
(c) Payables
Borrowings (continued)
negotiation.
The following tables set out the carrying amount, by maturity, of the financial instruments exposed to interest rate risk: Weighted
Average
Effective
<1 year >1<2 years >2<3 years >3<4 years >4<5 years >5 years Total Interest Rate
$ $ $ $ $ $ $ %
Year ended 30 June 2017
Borrowings
Fixed rate
Debentures 79,242 82,309 81,555 101,456 42,145 365,824 752,531 3.84%
Weighted average
Effective interest rate 3.32% 3.34% 3.36% 3.39% 3.38% 4.34%
Year ended 30 June 2016
Borrowings
Fixed rate
Debentures 62,209 64,705 67,310 66,080 85,490 300,946 646,740 4.70%
Weighted average
Effective interest rate 4.06% 4.07% 4.08% 4.15% 3.94% 5.43%
manages this risk by borrowing long term and fixing the interest rate to the situation considered the most advantageous at the time of
Borrowings are also subject to interest rate risk - the risk that movements in interest rates could adversely affect funding costs. The Shire
Page 53

INDEPENDENT AUDITOR’S REPORT TO THE MEMBERS OF THE SHIRE OF WILLIAMS Report on the Financial Report Opinion We have audited the financial report of the Shire of Williams, which comprises the statement of financial position as at 30 June 2017, and the statement of comprehensive income, statement of changes in equity and statement of cash flows for the year then ended, and notes to the financial statements, including a summary of significant accounting policies, and the declaration by the Chief Executive Officer. In our opinion, the financial report of the Shire of Williams is in accordance with the underlying records of the Council, including:
a) giving a true and fair view of the Shire’s financial position as at 30 June 2017 and of its performance for the year ended on that date; and
b) complying with Australian Accounting Standards (including Australia Accounting Interpretations), the Local Government Act 1995 (as amended) and the Local Government (Financial Management) Regulations 1996 (as amended).
Basis for Opinion We have conducted our audit in accordance with Australian Auditing Standards. Our responsibilities under those Standards are further described in the Auditor’s Responsibilities for the Audit of the Financial Report section of our report. We are independent of the Shire in accordance with the auditor independence requirements of the Accounting Professional and Ethical Standards Board’s APES 110 Code of Ethics for Professional Accountants (the Code) that are relevant to our audit of the financial report in Australia. We have also fulfilled our ethical requirements in accordance with the Code. We believe that the audit evidence we have obtained is sufficient and appropriate to provide a basis for our opinion. Other Information The Councillors are responsible for the other information. The other information comprises the information in the Shire’s annual report for the year ended 30 June 2017 but does not include the financial report and the auditor’s report thereon. Our opinion on the financial report does not cover the other information and accordingly we do not express any form of assurance conclusion thereon. In connection with our audit of the financial report, our responsibility is to read the other information and, in doing so, consider whether the other information is materially inconsistent with the financial report or our knowledge obtained in the audit or otherwise appears to be materially misstated.
Page 54

If, based on the work we have performed, we conclude that there is a material misstatement of this other information, we are required to report that fact. We have nothing to report in this regard.
Council’s Responsibility for the Financial Report
Council is responsible for the preparation of the financial report which gives a true and fair view in accordance with Australian Accounting Standards (including Australia Accounting Interpretations), the Local Government Act 1995 (as amended), the Local Government (Financial Management) Regulations 1996 (as amended) and for such internal control as the Council determines is necessary to enable the preparation of the financial report that is free from material misstatement, whether due to fraud or error. Auditor’s Responsibilities for the Audit of the Financial Report Our objectives are to obtain reasonable assurance about whether the financial report as a whole is free from material misstatement, whether due to fraud or error, and to issue an auditor’s report that includes our opinion. Reasonable assurance is a high level of assurance, but is not a guarantee that an audit conducted in accordance with the Australian Auditing Standards will always detect a material misstatement when it exists. Misstatements can arise from fraud or error and are considered material if, individually or in the aggregate, they could reasonably be expected to influence the economic decisions of users taken on the basis of the financial report. As part of an audit in accordance with the Australia Auditing Standards, we exercise professional judgement and maintain professional scepticism throughout the audit. We also: Identify and assess risks of material misstatement of the financial report, whether
due to fraud or error, design and perform audit procedures responsive to those risks, and obtain audit evidence that is sufficient and appropriate to provide a basis for our opinion. The risk of not detecting a material misstatement resulting from fraud is higher than for one resulting from error, as fraud may involve collusion, forgery, intentional omissions, misrepresentations, or the override of internal control.
Obtain and understanding of internal control relevant to the audit in order to design audit procedures that are appropriate in the circumstances, but not for the purpose of expressing an opinion on the effectiveness of the Shire’s internal control.
Evaluate the appropriateness of accounting policies used and the reasonableness
of accounting estimates and related disclosures made by the Councillors. Conclude on the appropriateness of Council’s use of the going concern basis of
accounting and, based on the audit evidence obtained, whether a material uncertainty exists related to events or conditions that may cast significant doubt on the Shire’s ability to continue as a going concern. If we conclude that a material uncertainty exists, we are required to draw attention in our auditor’s report to the related disclosures in the financial report or, if such disclosures are inadequate, to modify our opinion. Our conclusions are based on the audit evidence obtained up to the date of our auditor’s report. However, future events or conditions may cause the Shire to cease to continue as a going concern.
Page 55
Evaluate the overall presentation, structure and content of the financial report, including the disclosures, and whether the financial report represents the underlying transactions and events in a manner that achieves fair presentation.
We communicate with the Council regarding, among other matters, the planned scope and timing of the audit and significant audit findings, including any significant deficiencies in internal control that we identify during our audit. We also provide the Council with a statement that we have complied with relevant ethical requirements regarding independence, and to communicate with them all relationships and other matters that may reasonably be thought to bear on our independence, and where applicable, related safeguards. Emphasis of Matter
Without modifying our opinion, we draw attention to page 58 of the financial report “Supplementary Ratio Information”, which describes certain ratio information relating to the financial report. Management’s calculation of these ratios includes assumptions about future capital expenditure and hence falls outside our audit scope. We do not therefore express an opinion on these ratios. However, we have reviewed the calculations as presented and in our opinion these are based on verifiable information and appear reasonable. Reporting on Other Legal and Regulatory Requirements
We did not, during the course of our audit, become aware of any instances where the Shire did not comply with the statutory requirements of the Local Government Act (1995) (as amended) and the Local Government (Financial Management) Regulations 1996 (as amended). In accordance with the Local Government (audit) Regulations 1996, we also report that:
a) Apart from the operating surplus ratio and asset sustainability ratio there are no
material matters that in our opinion indicate significant adverse trends in the financial position or the financial management practices of the Shire.
b) The Shire substantially complied with Part 6 of the Local Government Act 1995
(as amended) and the Local Government (Financial Management) Regulations 1996 (as amended).
c) All information and explanations required were obtained by us. d) All audit procedures were satisfactorily completed in conducting our audit.
BUTLER SETTINERI (AUDIT) PTY LTD
MARIUS VAN DER MERWE Director Perth Date: 13 October 2017
Page 56
This page has been intentionally
left blank.
Page 57
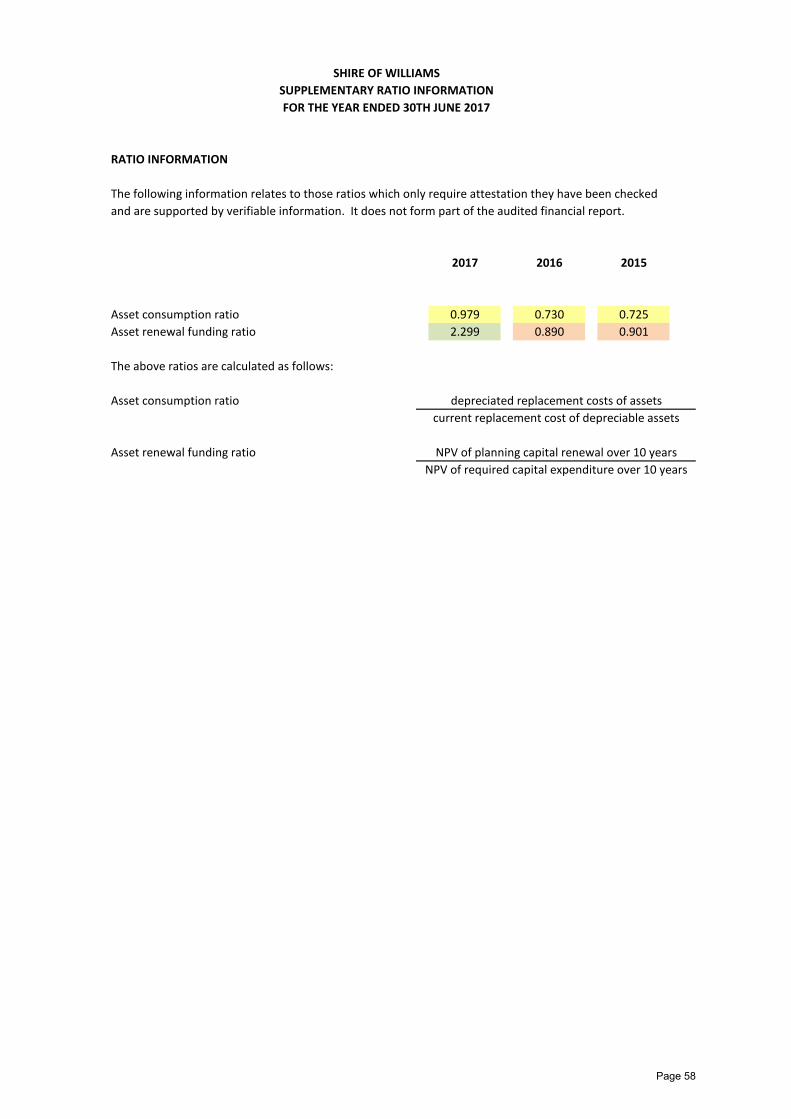
RATIO INFORMATION
2017 2016 2015
Asset consumption ratio 0.979 0.730 0.725
Asset renewal funding ratio 2.299 0.890 0.901
The above ratios are calculated as follows:
Asset consumption ratio
Asset renewal funding ratio
depreciated replacement costs of assets
current replacement cost of depreciable assets
NPV of planning capital renewal over 10 years
NPV of required capital expenditure over 10 years
SHIRE OF WILLIAMS
SUPPLEMENTARY RATIO INFORMATION
The following information relates to those ratios which only require attestation they have been checked
and are supported by verifiable information. It does not form part of the audited financial report.
FOR THE YEAR ENDED 30TH JUNE 2017
Page 58