vowel perception asymmetry in auditory and phonemic...
TRANSCRIPT

Vowel perception asymmetry in auditory and phonemic listening
Keith Johnson
Department of Linguistics
UC Berkeley
short title: Vowel perception asymmetry
Keith Johnson
Department of Linguistics
1203 Dwinelle Hall
UC Berkeley
Berkeley, CA 97420-2650
phone: 510 333 1575
fax: 510 6435688
email: [email protected]
UC Berkeley Phonology Lab Annual Report (2015)
99
Abstract
This paper reports the results a vowel perception study in which two groups of listeners
discriminated among pairs of the vowels [e], [ø], and [o]. One group was in an auditory
listening condition where feedback required listeners to detect within-category
differences and the ISI was short. The other group was in a phonemic listening condition
where feedback was based on vowel category membership and the ISI was long.
Reaction time to discriminate [e]/[o] pairs and [ø]/[e] pairs showed different asymmetry
patterns in the two listening conditions. In the auditory condition, the order [e → o] had
shorter reaction times than did the order [o → e] while in the phonemic condition the
order [o → e] was discriminated more quickly. The results can be modeled with
Tversky's (1977) similarity index where the only difference between the auditory and
phonemic listening conditions is a reduction in the amount of salience given to the
referent of the comparison in the phonemic condition.
Introduction
Vowel discriminability depends on the order in which vowels are presented for a discrimination
judgement. For instance, it has been reported (Polka & Bohn, 2003) that the difference between [y]
and [u] is more detectable when [y] is presented before [u] than in the opposite order. This
phenomenon is one of a class of effects that collectively are called “vowel perception asymmetry”
(Repp & Crowder, 1990; Polka & Bohn, 2003; 2011).
The phenomenon of perceptual asymmetry is important not only as a window into the speech
perception process, but also as a possible mechanism involved in historical language sound change.
This implication of perceptual asymmetry was explored by Chang et al. (2001) who used a feature-
based account of perceptual asymmetry inspired by Gilmore's (1976) research on printed letter
similarities. Gilmore (1976) identified two aspects of similarity – overall similarity of the visual form
of letters, and another parameter that depends on a “critical feature”. Chang et al. (2001) identified this
critical feature component in cases where languages have a fronting process in which /k/ becomes /tʃ/,
while the opposite pattern (/tʃ/ > /k/) is not attested. Their explanation depended crucially on the
presence of an auditory/acoustic feature in /k/ that is not present in /tʃ /. The idea they attribute to
UC Berkeley Phonology Lab Annual Report (2015)
100

Gilmore is that an “extra” feature is much more likely to be missed in perception than it is to be
hallucinated. The directionality of the sound change then reflects a perceptual asymmetry which is
driven by the salience of a spectral component in /k/ which is not present in /tʃ/.
Phoneticians and psychologists have found a number of vowel perception asymmetries and have
offered a variety of explanations for them. For example, Repp, et al. (1979) found an effect of stimulus
order in discrimination judgements along a continuum from /i/ to /I/. There was “a higher percentage
of correct 'different' responses when the more /i/-like stimulus came second in a pair than when it came
first” (Repp & Crowder, 1990).
Cowan & Morse (1986) proposed an account of perceptual asymmetry based on the idea that perceived
vowel quality changes gradually while the vowel is held in memory. Specifically their proposal was
that the perceptual representations of vowels drift toward [ə] while they are being held in memory.
Repp & Crowder (1990) called this the "neutralization hypothesis" and they conducted experiments to
test this hypothesis and ultimately rejected it because stimulus order effects in vowel discrimination
were often not in the direction predicted by the hypothesis.
Repp & Crowder (1990) explained vowel perception asymmetry primarily as a memory effect,
assuming that the decay of items in auditory memory differs by vowel, with some vowel qualities
serving as perceptual anchors by decaying less quickly or completely than other vowel qualities.
They noted that a dual code model of auditory discrimination (Fujisaki & Kawashima, 1970; Pisoni,
1973) holds that vowel representations change in memory in that stimuli are covertly labeled as the
auditory memory "trace" of the stimulus fades. The prediction that Repp and Crowder derive from this
idea (and from properties of vowel contrast, Repp et al., 1979) is that "discrimination should be easier
when the more ambiguous vowel comes first and the less ambiguous vowel comes second in a pair." (p.
2088). [This is formalized below as s(p,q) < s(q,p) – similarity is less (discrimination is easier) when
the more prominent item p is the subject of the comparison and the less prominent item is the referent q
against which the subject is judged.]
MacMillan et al.'s (1988) application of Durlach & Braida's (1969) psychophysical theory is more
UC Berkeley Phonology Lab Annual Report (2015)
101

explicit about the role of memory in perceptual distance. This theory posits three sources of variance in
auditory similarity. They are sensory variance (β), which is a function of neural encoding noise, trace
variance (AT), which is a function of memory decay over time, and context variance (GR), which is a
function of categorization in which stimuli are 'covertly labeled' - perhaps with subphonemic feature
categories.
d' = a / { β2 + [(GR)-2 + (AT)-1]-1]}1/2 (4)
In this model of perceptual distance (d'), a is the sensation difference between stimuli, β is the sensory
variance, R is the stimulus range in an experimental setting, and T is the inter-stimulus interval. The
free parameters G and A determine the size of the context variance component (GR) and the trace
variance component (AT). In this model of the roving AX discrimination task, perceptual distance (d')
is a combination of all three factors. MacMillan et al. suggest that at the extremes of performance in
roving discrimination there are two modes of discrimination, the trace mode in which X is compared
with the 'trace' of A, and the context mode in which A (and X) are 'covertly labeled' and then the labels
are compared (MacMillan et al. 1988, p. 1265). Repp & Crowder (1990) referred to this model in
speculating that vowel perception asymmetry may be due to differences in trace strength or covert
labeling as a function of stimulus or feature salience.
So, there may be a memory mechanism involved in perceptual asymmetry, but as this account suggests,
feature salience is also a key component of perceptual asymmetry. The relative salience of phonetic
properties affects the rate of memory decay for different vowels.
Vowel features in asymmetry
Polka & Bohn (2003) in their survey of vowel perception asymmetries in child language acquisition
suggested that vowel peripherality in the vowel space predicts patterns of perceptual asymmetry. This
is reminiscent of Cowan & Morse's (1986) “neutralization hypothesis”. In their follow-up paper (Polka
& Bohn, 2011, p. 224) they summarized their findings (see also figure 1) this way, “vowel
discrimination is easier for infants when they were presented a change from a less peripheral to a more
peripheral vowel.”
UC Berkeley Phonology Lab Annual Report (2015)
102

Polka & Bohn (2011) hypothesized that what drives perceptual asymmetry involving peripheral vowels
is formant "focalization" (Schwartz et al., 2005) - the convergence of two formant frequencies in a
vowel. On this explanation of vowel perception asymmetry, vowels with a formant convergence will
be more prominent or salient by virtue of having an additional sound feature, which can be more easily
detected when it is added to a vowel sequence than when it is subtracted. This is because change by
adding a feature is more detectable than change by subtracting a feature. Polka & Bohn (2011)
suggested that peripheral vowels with relatively more formant convergence then should be the ones
pointed to by the arrows in figure 1 - /i/ because of the convergence of F2 and F3; /u/, /o/ and /a/
because of the convergence of F1 and F2.
Figure 1. Summary of results of Polka and Bohn's (2003) survey of vowel perceptual
asymmetry findings (following figure xx in Polka and Bohn, 2003). For any pair of
vowel related by an arrow, the arrow points to the member of the pair that is more easily
distinguished from the other. For example, a change from [y] to [u] is more easily
detected than a change from [u] to [y].
UC Berkeley Phonology Lab Annual Report (2015)
103

In the speech perception research literature, there is another important strand of work on perceptual
asymmetry, initiated by Lahiri (1999), that is seemingly unrelated to the memory and focalization
hypotheses just discussed. For example, Lahiri & Reetz (2002) focussed on asymmetric effects in
priming during lexical access where [n] can prime [m] words but [m] can't prime [n] words. Similarly,
Eulitz & Lahiri, 2004) studied asymmetries in mismatch negativity (MMN) in vowel perception where
a larger mismatch effect is produced by [e] in the context of a sequence of [o] than by [o] in the context
of [e]. Lahiri & Reetz' explanation of these asymmetries was to suggest that the feature [coronal] (the
alveolar place of [n] and the frontness of [e]) is underspecified in linguistic representations in the
languages studied. One point of contact between underspecification and Repp & Crowder's (1990)
appeal to auditory memory decay is that both approaches envision a comparison between a sensory
auditory representation and a somewhat more abstract recoded memory representation. The key
difference between the accounts has to do with the designation of the properties of speech sounds that
are retained in the abstract memory representations of speech sounds. Lahiri and Reetz (2002) see their
work as relating directly to the idea in phonological theory (Steriade, 1995) that long-term memory
representations of speech are underspecified, while Repp & Crowder (1990) and also Polka & Bohn
(2011) see their accounts as stemming from theories of auditory memory and the perceptual
prominence of particular acoustic cues for vowels.
In this paper I report that vowel perception asymmetry is malleable – changed as a function of the
nature of the task given to listeners. In the conclusion I will show that the main features of the
behavioral results can be adequately modeled with Tversky's (1977) index of similarity, accounting for
the difference between an auditory listening condition and a phonemic listening condition by changing
the value of a single parameter in the model.
General theories of asymmetric similarity
Goldstone et al. (2010) in their useful overview of “comparison” distinguished between geometric and
featural models of cognitive similarity. In geometric models of similarity, the main conceptual
metaphor that we use to understand cognitive similarity is spatial distance. Two mental states that are
similar to each other are conceived as being close to each other in cognitive or perceptual space. Using
UC Berkeley Phonology Lab Annual Report (2015)
104

this conception, researchers enter various measures of distance or similarity into algorithms like
multidimensional scaling (MDS, Carrol & Wish, 1974; Torgerson, 1965; Shephard 1962a,b) to
visualize the similarity “space” that explains the patterns of perceived similarity of mental states. The
geometric conception of perceptual similarity is helpful in determining perceptual dimensions and
stimulus properties which impact similarity.
However, the main topic of this paper, perceptual distance asymmetry, must be disregarded entirely in
the geometric conception of perceptual space. The metaphor, and the associated mathematics of MDS,
breaks down because spatial distance is symmetric. That is to say, the physical distance between
Newark, NJ and New York City is exactly the same as the distance between NYC and Newark.
Interestingly though, perceived distance, even in the case of judged physical proximity of cities is
asymmetrical. For example, when you ask Americans questions related to the distance between NYC
and Newark the answers given are asymmetric depending on which is the subject of the comparison
and which is the referent. Rosch (1975) found that sentences like (1) (in which a prototypical category
member is used as the referent and a non-prototpye is the subject of the comparison) is more true than
(2) where the prototype is the subject.
(1) “When you are in Newark you are basically in NYC.” (subject: Newark, referent: NYC)
(2) “When you are in NYC you are basically in Newark.” (subject NYC, referent: Newark)
Rosch (1975) proposed a theory of similarity in which "cognitive reference points" have an influence
on similarity judgements based on their role in the comparison (subject or referent). This is not really a
featural model of similarity in Goldstone et al.'s taxonomy because Rosch didn't go into what specific
features make a reference point a reference point, but her approach does make it possible to talk about
perceptual asymmetry.
In this approach, more prototypical category members (which Rosch called "focal" category members)
play a key role in the emergence of perceptual asymmetry. The general form of Rosch's insight
requires that we distinguish between a "referent" stimulus and a "subject" stimulus. We say that the
subject of the comparison is judged in relation to the referent and this can symbolize this as: s(a,b),
where s is a similarity function and you can read the expression as “similarity when a (the subject of
UC Berkeley Phonology Lab Annual Report (2015)
105
the comparison) is in the context of b (the referent)” or “similarity of a given b”. Rosch's data suggest
that the similarity of category members depends on which member is presented as the subject and
which is presented as the referent in a comparison. Stimuli that are prototypical members of a category
(p) will produce asymmetry when they are presented with nonprototypical members (n):
Rosch's rule: s(p,n) < s(n,p) (1)
[Note the tie to Polka &Bohn's (2011) term NRV - “natural referent vowel”. Their observation (in
keeping with Rosch's rule) is that perceived similarity is greatest when the NRV is the referent in the
comparison. ]
Perceived similarity between prototype and nonprototype is greater when the prototype is presented as
the referent of the comparison and the nonprototype is the subject of the comparison. For example,
because "100" is a prototypical or focal number and "96" is not, then the question "how similar is 96 to
100?" yields a larger similarity estimate than the question "how similar is 100 to 96?". In these
comparisons the first mentioned number is the subject of the comparison and then last is the referent.
Tversky (1977) extended Rosch's (1975) ideas by formalizing the similarity rule and identifying what it
is about prototypes that allows them to participate in perceptual asymmetries. He suggested that the key
property of the prototype that causes perceptual asymmetry is that prototypes are more salient than the
nonprototypical members of a group. This is a somewhat more explanatory account than Rosch's and
seems to also apply in studies of mismatch negativity. The reason for this is that because the addition
of a feature is more detectable than the subtraction of a feature (Timm et al., 2011). Thus, vowel
asymmetry may reveal which of the two vowels has the more prominent or additional features.
Asymmetry with Tversky's (1977) index of similarity.
Tversky (1977) presented a formal model of similarity based on the shared and distinguishing features
of the objects being compared. In this model, the similarity of two stimuli, a (the subject of the
comparison) and b (the referent), is a function of shared features A∩B and distinguishing features -
features in a that are not in b (A-B), and features that are uniquely in b (B-A). See formula (2).
UC Berkeley Phonology Lab Annual Report (2015)
106
s(a,b) = f(A∩B)/ [f(A∩B) + αf(A-B) + βf(B-A)] (2)
When similarity s(a,b) = 1 we have a perfect feature match between a and b – all of their features are
shared. When similarity s(a,b) = 0 a and b share no features at all.
This formulation of similarity allows us to recognize that features have different saliences or perceptual
weights, and this is modeled by function f(), an interval scale on which features are ordered – perhaps
by their salience.
Asymmetry in Tversky's similarity measure depends on two conditions. First, α ≠ β: the weights α and
β , given to the distinguishing features, must not be equal to each other. Second, f(A-B) ≠ f(B-A): the
number or salience of the distinguishing features must be unequal. The weights α and β are assumed in
this model to be determined by which of the items being compared is the subject and which is the
referent. So, we stipulate that weight on the distinguishing features of the subject (α) is greater than the
weight given to the distinguishing features of the referent (β) (α > β) in “directional” comparison tasks
where participants are invited to treat one of the stimuli as the referent and the other as the subject.
When α > β the subject of the comparison is given greater weight than the referent, so for Tversky the
weight inequality condition on perceptual asymmetry is associated with characteristics of the given
experimental task. The second condition on perceptual asymmetry in Tversky's model is that the
relative salience of the features of stimuli a and b must be different so that f(B) ≠ f(A). This condition
on perceptual asymmetry suggests that observed perceptual asymmetry will provide a way to identify
the relative salience of the features or stimulus properties that are at play in speech perception. This
has been the focus of both Polka and Bohn (2011) and Eulitz and Lahiri (2004) as they interpret their
perceptual asymmetry data.
Rationale of the current experiment.
We have seen that there is a possible memory component in vowel perception asymmetry because the
memory traces of different vowels decay at different rates, and that it is likely that these different decay
rates are due to differences in vowel salience. Furthermore, it is possible to identify an acoustic
UC Berkeley Phonology Lab Annual Report (2015)
107
property (formant focalization) that seems to lend salience in a way that drives vowel perception
asymmetry. Tversky's index leads us to postulate an elaboration of Rosch's Rule - the “salient subject
rule”. When the more salient member (p) of a pair is presented as the subject of a comparison the
difference between the items is more noticeable than when the more salient item is presented as the
referent of the comparison. s(p,q) < s(q,p)
It has also been shown that vowel representations change over the course of processing – as the sensory
impression is encoded as a memory trace, and then further recoded into a linguistic (or possibly
gestural) phonetic representation. This raises the possibility that salience may change during
processing, so that in addition to simple decay of auditory information, there may be some reordering
of salience as, for instance, lexical access draws attention to linguistically “important” features.
Based on these considerations, we can predict that vowel perception asymmetry will be malleable –
alterable by processing depth in an experimental setting. The following experiment tests this prediction
by presenting the same vowel tokens for discrimination judgements in two different listening
conditions which differ in terms of the processing depth that the tasks elicit.
Method.
Stimuli. The nine German vowel tokens used by Eulitz and Lahiri (2004) were also used in this
experiment. These are three naturally produced tokens (10 kHz sampling, 16 bit samples) of each of
the vowels [e], [o], and [ø]. The critical vowel formant differences in F2 and F3 were shown in figure
2. The first formant is within a few Hz of 320 Hz in all of the stimuli. The stimuli are matched in
duration (200ms), amplitude, and pitch (110 Hz), spoken by a male speaker of German for whom these
are native vowels. Figure 2(b) shows vowel spectra for three representative tokens, one of each vowel
category, as well as the positive portion of the difference between the spectra for each pair of tokens.
The difference spectra are labeled to show the spectral change that occurs in transitioning from one
vowel to the next. So, for example, in a trial where we present first [o] and then [ø] we expect that the
listener will experience the emergence of two prominent mid-frequency spectral peaks as labeled “o →
ø” in figure 2(d).
UC Berkeley Phonology Lab Annual Report (2015)
108
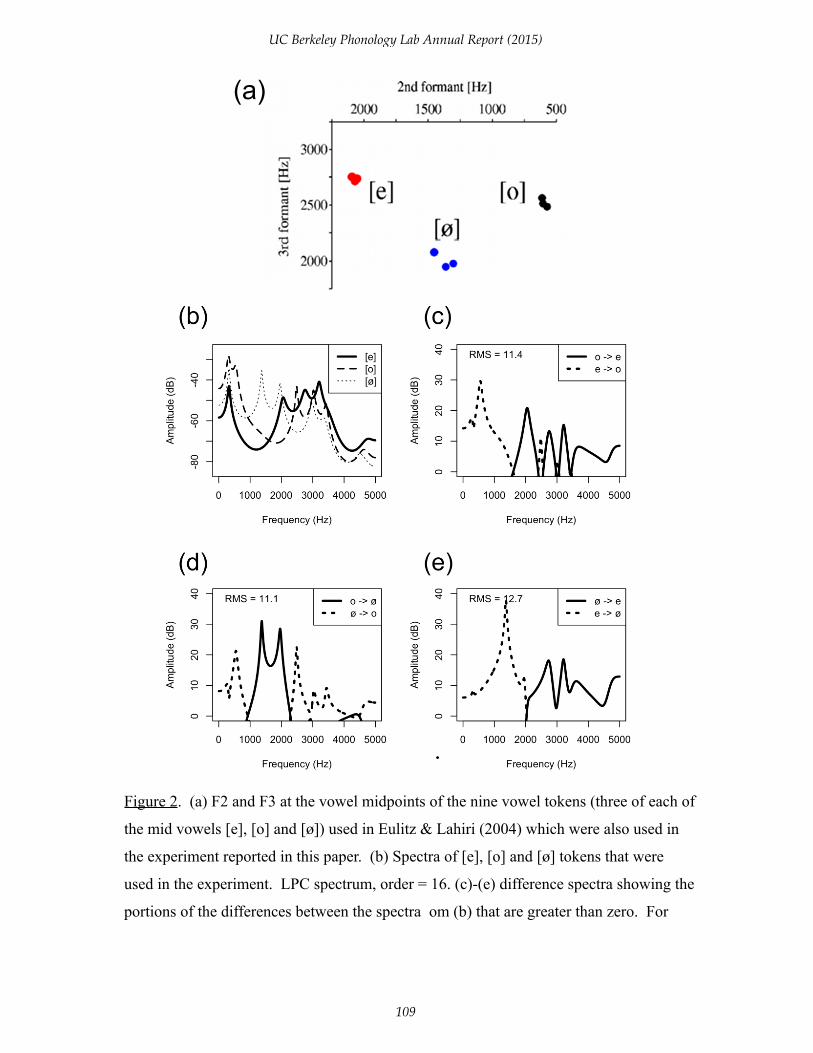
(a)
Figure 2. (a) F2 and F3 at the vowel midpoints of the nine vowel tokens (three of each of
the mid vowels [e], [o] and [ø]) used in Eulitz & Lahiri (2004) which were also used in
the experiment reported in this paper. (b) Spectra of [e], [o] and [ø] tokens that were
used in the experiment. LPC spectrum, order = 16. (c)-(e) difference spectra showing the
portions of the differences between the spectra om (b) that are greater than zero. For
UC Berkeley Phonology Lab Annual Report (2015)
109
example, the curve labelled “o → ø” shows the spectral peaks that are present in the [ø]
token that are not in the [o] token. The overall RMS spectral distance between each
vowel pair is printed on each difference spectrum.
Subjects. There were two groups of nineteen listeners in each group. Group 1 (5 men, 4 women, the
gender of 10 of the listeners was mistakenly not noted at the time of the experiment) heard the stimuli
in an auditory listening condition, as detailed in the “procedures” section below. Group 2 (11 men, 8
women) heard the stimuli in a phonemic listening condition. The listeners were native speakers of
English, college students UC Berkeley, with normal, uncorrected hearing, who participated for course
credit. Half of the subjects were spoke a second language in addition to English which was their first
language (14/28 for whom we have records), and about 25% of the subjects could speak a language that
has front rounded vowels.
Procedure. Perceptual asymmetry was tested in an AX discrimination experiment. Pairs of vowels
were presented over headphones (AKG K240 Studio Headphones) at a comfortable listening level and
the listener was asked to respond as quickly and accurately as possible by pressing buttons labeled
“same” and “different”. Reaction time was measured from the onset of the second vowel token in each
pair. Each group of listeners heard 243 trials. This is every possible pairwise combination of the nine
stimulus vowels (81 pairs), presented three times. With three tokens of [e] and three tokens of [o], for
example, this means that the pair [e] → [o] was presented 27 times per subject as was the pair [o] →
[e].
One group of listeners participated under auditory listening conditions and the other under phonemic
listening conditions. To make the task more of an auditory task for the first group, inspired by Pisoni
(1973), we used a short ISI (100 ms). We also provided feedback on every trial and told listeners that
their “same” response was incorrect if they pressed “same” for two different tokens of [e] (for
example). So, in the auditory condition subjects were expected to respond on the basis of whether they
were hearing identical sound files, regardless of what the categorical vowel identities were. They took
this to heart and recorded much longer reaction times for “same” responses than for “different”
responses.
UC Berkeley Phonology Lab Annual Report (2015)
110

To make the task more of a phonemic listening task for the second group we increased the ISI to 700
ms and gave feedback based on the categorical membership of the stimuli, regardless of whether the
same sound file had been repeated or not. Note that the "long" ISI condition in this experiment is a
little shorter than the 1 or 2 second ISIs that previous researchers used to induce "phonetic" or
"phonemic" listening (e.g. Pisoni, 1973; Crowder, 1982). The addition of trial-by-trial feedback
provided additional motivation for listeners to use relatively fine-grained or general auditory/phonetic
properties in the two different conditions.
Results
In the auditory listening condition there were 4617 trials (19 subjects * 243 trials each) and in 4104 of
these the sound files differed. As might be expected with this distribution, there was a strong bias to
call the pairs "different". About 38% of the trials where the same sound file was presented twice,
listeners responded incorrectly with "different". The error rate for different trials (those in which the
sound files did not match) where the vowel qualities were different was only about 1%, but when
listeners were asked to distinguish different tokens of the same vowel category they were incorrect
about 14% of the time. When listeners did correctly identify the tokens as being the "same" their
reaction time was on average 1010ms, while the average reaction time to the correct different trials was
834ms. So, it seems reasonable to conclude that although listeners were biased by the preponderance
of different trials to use the "different" response, they did stay engaged with the task and struggled over
the same trials. Note that the analysis here will focus on the different trials in the auditory listening
condition where the vowel qualities were different, the within vowel different trials were fillers used to
make the task a difficult auditory task that required listening for subtle acoustic/phonetic differences
between the stimuli. In this way, the trials selected for analysis from the auditory listening condition
are the same trials that count as "different" in the phonemic listening condition.
In the phonemic condition there were also 4617 trials (19 subjects * 243 trials each) and of these 3078
were different trials. In this condition a trial was only considered to require a "different" answer if the
vowel qualities presented were different. In 2/3 of "same" trials the sound files presented in the pair
UC Berkeley Phonology Lab Annual Report (2015)
111
were not physically identical. Again there were more errors on the "same" trials than on the "different"
trials, indicating a response bias. About 10% of the same trials where incorrectly called "different", and
only about 4% of the different trials were incorrectly called "same".
Overall, of the trials of interest – where a difference judgement was being requested for vowels that
differ in vowel quality (e.g. [e] vs [o], not [e]i vs [e]j) – the error rate was less than 5%. The error trials
were removed from the data set before further analysis. Clearly, with so few error trials in both the
auditory and phonemic listening conditions, it is not meaningful to analyze the accuracy of responding
- instead the data of main interest are the reaction times. I removed a further 3% of the trials - evenly
split across the listening conditions on the basis of their reaction times. Trials with reaction times less
than 100ms or more than 1500 ms were removed from the data set.
Reaction time (RT) is taken here as an indication of the difficulty of saying “different” when the tokens
or vowels were in fact different. The assumption (following prior researchers Luce, 1986, pp. 224ff) is
that the main source of difficulty in saying that two tokens were different is the similarity of the tokens.
With these assumptions we justify treating RT on correct discrimination trials as a behavioral measure
of the perceptual similarity of the items being discriminated.
In the analyses reported here, I entered log RT rather than the raw RT values because the RT
distribution showed a slight positive skew that is removed by the log transformation. Effects that were
statistically reliable in the log RT analysis were also reliable (and usually a little stronger) in the raw
RT analyses.
I removed a small but significant effect of trial count before submitting the data to hypothesis testing.
Using simple least-squares estimation, I fit a model predicting the log(RT) as a function of log of the
trial number. The effect of trial number on log RT was non-linear and approximately logarithmic.
Taking the residual of this regression removes a small negative trend (successive trials were on average
about 1/3 millisecond faster than the previous trial) that accounted for about 2% of the variance in RT.
The residualized log RT data were then entered into two separate repeated-measures ANOVAs. The
first of these disregarded perceptual asymmetry, and the second was designed to directly explore the
UC Berkeley Phonology Lab Annual Report (2015)
112
crucial asymmetry patterns in the data.
Unordered vowel pair effect – Disregarding asymmetry
The first statistical analysis disregards vowel ordering asymmetries by collapsing over pairs (e.g. "o →
e" and "e → o" were collapsed into a factor "e_o"). This analysis treats perceptual similarity (as
measured by RT) as a function of the experimental CONDITION (auditory vs phonemic task) and as a
function of PAIR (e_o, e_ø, ø_o).
The listeners had very different average RT values (ranging from 500 to 900ms) and this accounts for
about 30% of the variance in these RT data. The overall differences between subjects are controlled in
repeated measures analysis of variance where the by-subjects interaction terms are the error terms in
tests of experimental variables (please see Barr et al., 2013 on the adequacy of repeated measures
ANOVA for designs with a single random grouping variable). The residualized log RT data were
submitted to a repeated measures analysis of variance with CONDITION as a within subjects variable
and PAIR as a between subjects variable. The PAIR main effect was significant [F(2,72)=13.69, p <
0.01] and the other F values (for CONDITION and the CONDITION:PAIR interaction) were less than
1. This indicates that the pairs on average differed from each other in the same way for both groups of
listeners. The average RT to pair "e_ø" was 638 ms, which was not reliably different from the RT to
pair "e_o" (650 ms). Pair "ø_o" was reliably different (p < 0.01) from both of the other pairs with an
average reaction time of 680 ms. The post-hoc tests reported in this paragraph were planned
comparisons using repeated measures ANOVA with a pair variable reduced to just two levels instead of
three.
UC Berkeley Phonology Lab Annual Report (2015)
113
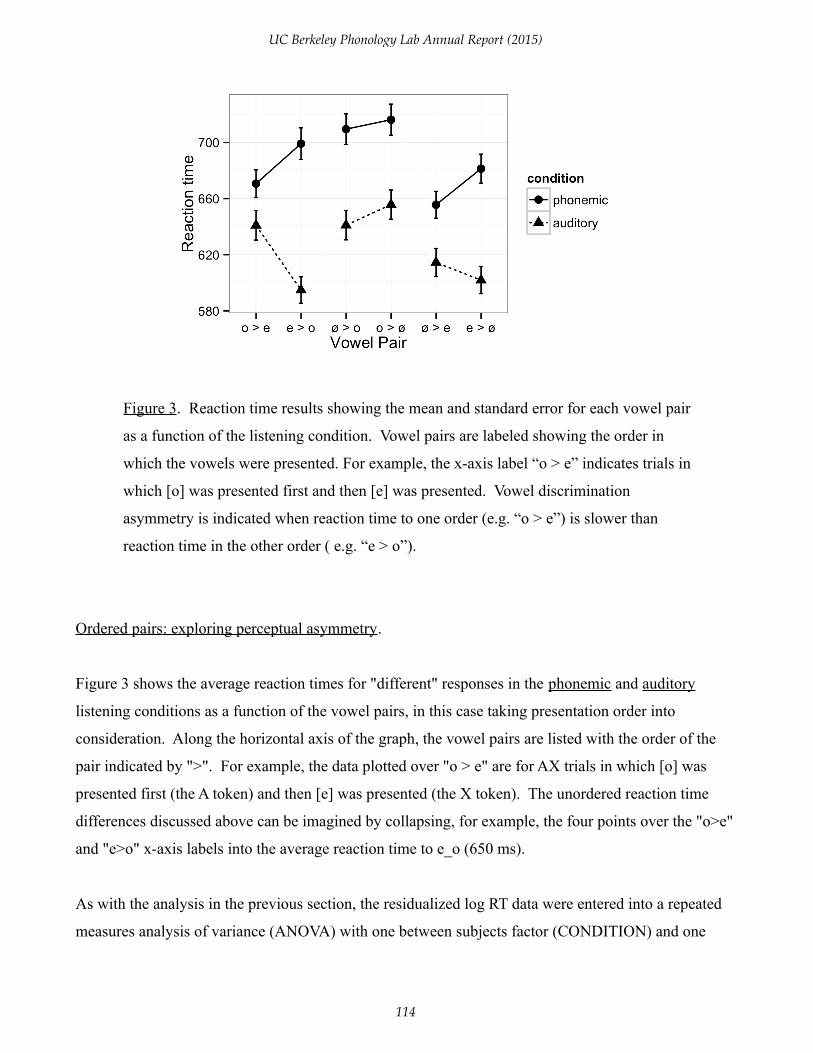
Figure 3. Reaction time results showing the mean and standard error for each vowel pair
as a function of the listening condition. Vowel pairs are labeled showing the order in
which the vowels were presented. For example, the x-axis label “o > e” indicates trials in
which [o] was presented first and then [e] was presented. Vowel discrimination
asymmetry is indicated when reaction time to one order (e.g. “o > e”) is slower than
reaction time in the other order ( e.g. “e > o”).
Ordered pairs: exploring perceptual asymmetry.
Figure 3 shows the average reaction times for "different" responses in the phonemic and auditory
listening conditions as a function of the vowel pairs, in this case taking presentation order into
consideration. Along the horizontal axis of the graph, the vowel pairs are listed with the order of the
pair indicated by ">". For example, the data plotted over "o > e" are for AX trials in which [o] was
presented first (the A token) and then [e] was presented (the X token). The unordered reaction time
differences discussed above can be imagined by collapsing, for example, the four points over the "o>e"
and "e>o" x-axis labels into the average reaction time to e_o (650 ms).
As with the analysis in the previous section, the residualized log RT data were entered into a repeated
measures analysis of variance (ANOVA) with one between subjects factor (CONDITION) and one
UC Berkeley Phonology Lab Annual Report (2015)
114
within subjects factor (PAIR). In this analysis, the PAIR factor included differences in the order of
presentation in the AX trials as shown in on the horizontal axis of figure 4, so the analysis is an explicit
test of order of presentation asymmetries.
Despite the quite wide individual differences in average RT, the between-subjects CONDITION main
effect in this analysis was almost (but not quite) large enough to be considered significant [F(1,26) =
3.388, p=0.077]. As seen in figure 4, listeners responses were somewhat faster in the auditory task than
in the phonemic task.
The PAIR main effect was reliable [F(5,180) = 7.52, p < 0.01], and more importantly the PAIR *
CONDITION interaction was significant [F(5,180) = 3.37, p < 0.01]. To further test whether the PAIR
* CONDITION effect should be taken as evidence that vowel perception asymmetry differed as a
function of listening condition, I tested the interaction effects separately for each pair of vowels.
The CONDITION:PAIR interaction was strongest for [e] and [o] [F(1,36) = 11.98, p < 0.01], next
strongest for [e] and [ø] [F(1,36) = 4.84, p < 0.05], and absent for pairs with [o] and [ø] [F < 1].
Discussion
The main finding of this study is that the pattern of perceptual asymmetry in a phonemic listening
condition (with a relatively long inter-stimulus interval and in which listeners were told to classify
stimuli by their phonemic categories) was the opposite of the perceptual asymmetry found in an
auditory listening condition (with a relatively short ISI and in which listeners were required to base
their decisions on physical identity or difference of stimuli).
As we saw in the introduction, a number of researchers have proposed differing theories of perceptual
vowel asymmetry in speech processing. To conclude the paper we will consider a couple of different
ways to model these results.
Lahiri's scoring formula
Lahiri (1999) introduced a scoring formula to describe how input sounds activate lexical items. The
UC Berkeley Phonology Lab Annual Report (2015)
115
Lahiri scoring formula (5) is similar to Tversky's (1977) similarity metric, which we discussed in the
introduction.
s(a,b) = |A∩B| / (|A| × |B|) (5)
In (5), |A| is the number of features of item a and |B| is the number of features in item b, and |A∩B| is
the number of features shared by the items. If we compute the denominator of (5) using addition rather
than multiplication then we have a version of Tversky's index where α=β=1. One additional stipulation
of Lahiri's model of lexical activation is that s(a,b) = 0 when features are contradictory (i.e. when A ∈
F and B ∈ F and A ≠ B, for some F a family of aligned features. This is a version of an alignment-
based metric (see Goldstone et al., 2010).
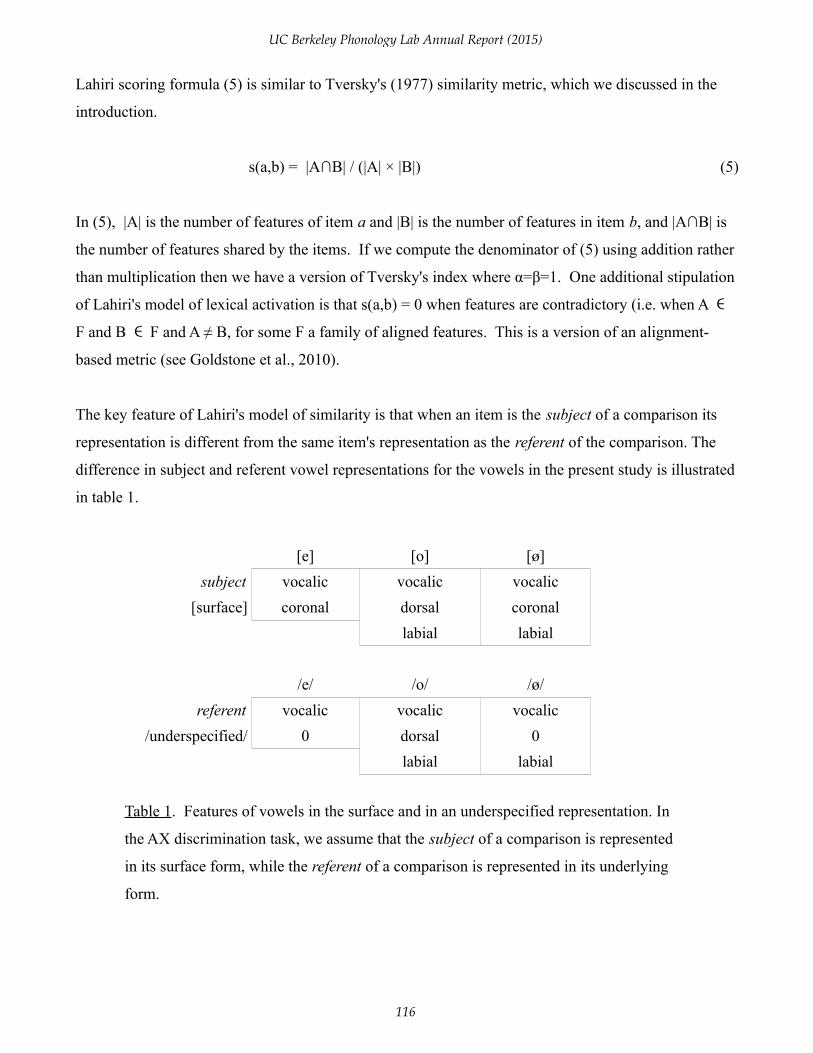
The key feature of Lahiri's model of similarity is that when an item is the subject of a comparison its
representation is different from the same item's representation as the referent of the comparison. The
difference in subject and referent vowel representations for the vowels in the present study is illustrated
in table 1.
[e] [o] [ø]
subject vocalic vocalic vocalic
[surface] coronal dorsal coronal
labial labial
/e/ /o/ /ø/
referent vocalic vocalic vocalic
/underspecified/ 0 dorsal 0
labial labial
Table 1. Features of vowels in the surface and in an underspecified representation. In
the AX discrimination task, we assume that the subject of a comparison is represented
in its surface form, while the referent of a comparison is represented in its underlying
form.
UC Berkeley Phonology Lab Annual Report (2015)
116
The key assumption of Lahiri's approach is that input speech is compared to a lexicon where some
surface features are missing - i.e. they are underspecified in long-term memory. We can model this by
assuming that the feature [coronal] is absent or underspecified in the referent in the Tversky formula
while [coronal] is present in the subject.
In some paradigms it is easy to identify the subject and the referent. For example, in a change
detection paradigm, such as mismatch negativity, the participant hears several copies of the referent and
then the subject stimulus is presented. In roving AX discrimination (the paradigm used in the study
reported here), I will assume that the A stimulus serves as a reference against which the X stimulus is
compared. This means that the second stimulus of the AX pair is the subject and the first stimulus is of
the pair is the referent. Thus, in the model of roving AX discrimination presented here, similarity in
Tversky's index is symbolized s(X,A). It is worth noting, though, that Tversky analyzed different
"same"/"different" discriminations with different assumptions about which was the referent and which
the subject. The experiments that led him to his analysis compared long and short signals (Rothkopf,
1957; Wish, 1967) and Tversky assumed that long stimuli (say long Morse Code letters) were more
salient than short ones. Based on this assumption, he identified similarity in AX discrimination as
s(A,X) with the “A” stimulus as the subject of the comparison. His salience assumption may or may
not be true, but his analysis of the AX paradigm does not appear to match the assumption that I'm
making here. I'm also not sure what to do with Repp et al.'s (1979) observation that “retroactive”
contrast (the effect of the second item in a pair on the perceived identity of the first) is larger than
“proactive” contrast. Nonetheless, the choice of s(X,A) used here matches MacMillan et al.'s (1988)
assumption about AX discrimination.
To continue then with the implementation of Lahari's similarity index, s(e,o) compares subject [e] =
[vocalic, coronal] with referent /o/ = [vocalic, dorsal, labial] while s(o,e) compares subject [o] =
[vocalic, dorsal, labial] with referent /e/ = [vocalic]. Thus, there is one shared feature in s(e,o) [vocalic],
two features in [e] and three features in /o/ (6).
UC Berkeley Phonology Lab Annual Report (2015)
117
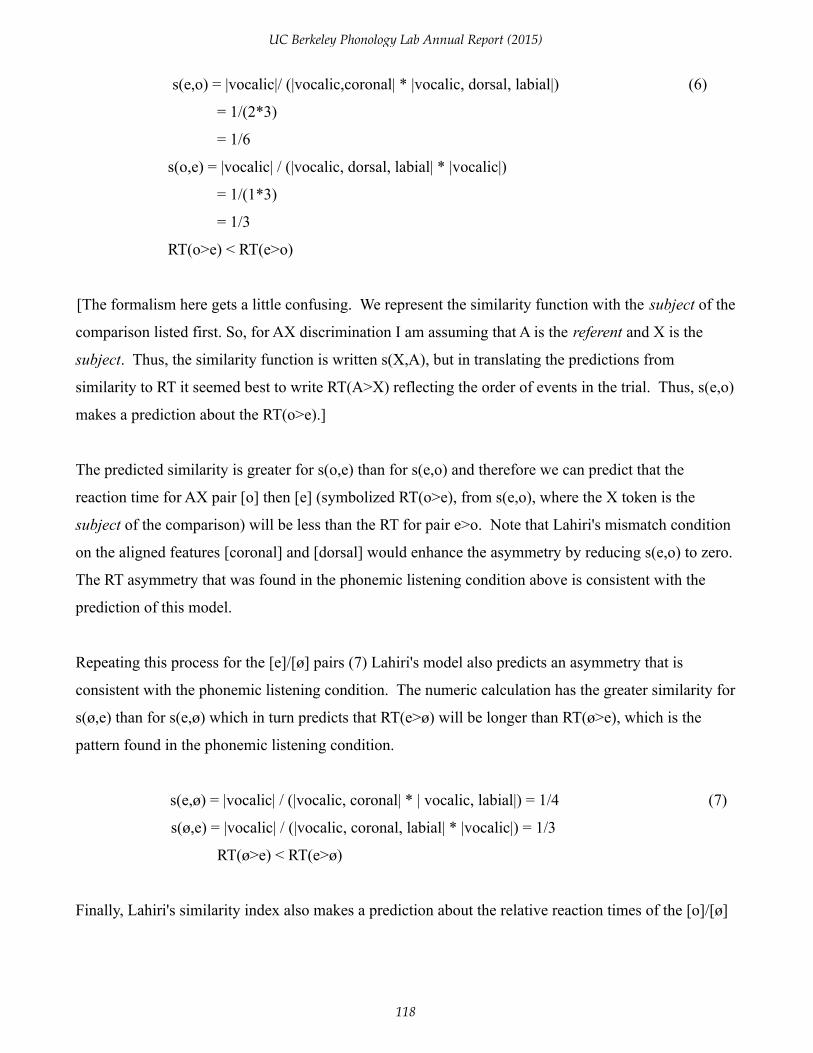
s(e,o) = |vocalic|/ (|vocalic,coronal| * |vocalic, dorsal, labial|) (6)
= 1/(2*3)
= 1/6
s(o,e) = |vocalic| / (|vocalic, dorsal, labial| * |vocalic|)
= 1/(1*3)
= 1/3
RT(o>e) < RT(e>o)
[The formalism here gets a little confusing. We represent the similarity function with the subject of the
comparison listed first. So, for AX discrimination I am assuming that A is the referent and X is the
subject. Thus, the similarity function is written s(X,A), but in translating the predictions from
similarity to RT it seemed best to write RT(A>X) reflecting the order of events in the trial. Thus, s(e,o)
makes a prediction about the RT(o>e).]
The predicted similarity is greater for s(o,e) than for s(e,o) and therefore we can predict that the
reaction time for AX pair [o] then [e] (symbolized RT(o>e), from s(e,o), where the X token is the
subject of the comparison) will be less than the RT for pair e>o. Note that Lahiri's mismatch condition
on the aligned features [coronal] and [dorsal] would enhance the asymmetry by reducing s(e,o) to zero.
The RT asymmetry that was found in the phonemic listening condition above is consistent with the
prediction of this model.
Repeating this process for the [e]/[ø] pairs (7) Lahiri's model also predicts an asymmetry that is
consistent with the phonemic listening condition. The numeric calculation has the greater similarity for
s(ø,e) than for s(e,ø) which in turn predicts that RT(e>ø) will be longer than RT(ø>e), which is the
pattern found in the phonemic listening condition.
s(e,ø) = |vocalic| / (|vocalic, coronal| * | vocalic, labial|) = 1/4 (7)
s(ø,e) = |vocalic| / (|vocalic, coronal, labial| * |vocalic|) = 1/3
RT(ø>e) < RT(e>ø)
Finally, Lahiri's similarity index also makes a prediction about the relative reaction times of the [o]/[ø]
UC Berkeley Phonology Lab Annual Report (2015)
118
pairs (8). In this case, the model seems to make a prediction that isn't borne out in either of the
conditions in the present experiment.
s(ø,o) = |vocalic, labial| / (|vocalic, coronal, labial| * |vocalic, dorsal, labial|) = 2/9 (8)
s(o,ø) = |vocalic,labial| / (|vocalic, dorsal, labial| *|vocalic, labial|) = 1/3
RT(o>ø) < RT(ø>o)
On the whole then, Lahiri's underspecification model predicts reaction times that match the observed
patterns of asymmetry that were reported above in the phonemic listening condition. Disregarding for
the moment any aspects of the present data that aren't really captured by this model (the predicted
asymmetry in [o]/[ø] pairs, or the overall greater similarity of, and hence longer RTs, to the [o]/[ø]
pairs), the obvious deficiency of Lahiri's underspecification model is that it has nothing to say about the
difference between auditory and phonemic listening. As we will see in the next section, we can get a
better approximation to the discrimination reaction time data with a variant of Tversky's (1977)
similarity index, and derive the flip in perceptual asymmetry with the change of a single parameter in
the model.
Modeling auditory and phonemic perceptual asymmetry
The main finding of this paper is that the direction of perceptual asymmetry changed as a function of
parameters of the listening task (ISI and feedback).
Underspecification is at one extreme of salience – zero salience. In this model, I used the salience
function f() of Tversky's (1977) index of similarity (2) to manipulate the relative salience of the vowel
features in two ways. First, I scaled the intrinsic salience of the vowel features (based on phonetic
intuition and the confusion data in Peterson & Barney, 1952) by giving the feature [vocalic] a weight of
10, the feature [round] a weight of 5, and the features [dorsal] and [coronal] each a weight of 1. I also
simulated the listeners' relative unfamiliarity with the vowel [ø] by giving [coronal] a weight of only
0.25 in [ø]. Second, in the phonemic listening condition I reduced the overall salience of the referent of
the comparison (B) relative to the salience of the subject of the comparison (A), resulting in a type of
context coding (Durlach & Braida, 1969). Given the low weight for [coronal] relative to [labial] this
UC Berkeley Phonology Lab Annual Report (2015)
119

may also be viewed as an implementation of underspecification.
s(a,b) = f(A∩B)/ (f(A∩B) + αf(A-B) + βf(B-A)) (2)
The difference in weight given to the referent (β) and the subject (α) in Tversky's model simulates the
directionality of the task. Greater weight is given to the subject of the comparison (α > β) reflecting
greater attention given to the X token in the AX task. In my simulations I set α = 0.8 and let β = 1- α.
To simuliate the difference between the auditory condition and the phonemic condition I changed the
salience of subject and referent features in the comparisons so that the reference salience was equal to
the subject salience in the auditory condition, but features in the subject are 20 times stronger than
those in the referent in the phonemic condition. The idea with this is to incorporate Dulach & Braida's
(1969) context mode of perception, in which the referent has been covertly labeled.
Figure 4 shows the result of the simulation. The fit of the model results to the reaction time data shown
in figure 3 can be measured by the correlation between the two. The overall fit (taking both the
phonemic and auditory conditions) gives an R2 of this model is 0.89. Taking the two listening
conditions separately (to test the shapes of the curves results in an R2 of 0.72 for the phonemic
condition, and an R2 of 0.75 for the auditory condition.
Figure 4. Simulated results. The horizontal axis is the same as in figure 3. The vertical
axis is the Tversky index of similarity which ranges from 0 = least, to 1 = most similar.
UC Berkeley Phonology Lab Annual Report (2015)
120
Thus, we have a rough fit to the observed data keeping our assumptions about the relative salience of
features constant, and keeping our assumptions about the nature of the task ( α) the same, and by
assuming that in the phonemic task the salience of the referent is much smaller than the salience of the
subject.
We can conclude with five main observations about vowel perception from this study. First, this study
extended earlier research on vowel perception asymmetry by finding that different patterns of
asymmetry emerge in different listening conditions. This presents a serious challenge for the various
accounts of perceptual asymmetry that have been proposed up to now. Second, this study adapted an
old, and probably overly simplistic model of similarity to capture the main outlines of the data. Third,
as predicted by much of the literature on vowel perception this successful model of perceptual
asymmetry relied upon memory, and selective decay of phonetic features in memory in order to be able
to account for the data. Fourth, the model relied upon the same features and segmental representations
to account for both the auditory listening and phonemic listening conditions. Fifth, in order to fit
reaction time data with any degree of match it was necessary to scale the phonetic salience of features
in a gradient fashion. The last three of these points recur often enough in speech perception research to
be taken as the current state of the art - centrality of a theory of memory, continuity of representation
across levels, and gradience of representations.
Acknowledgements. Aditi Lahiri and Carsten Eulitz shared their stimuli with me. UC Berkeley
Linguistics students Benjamin Breen, Emil Minas, Jackson Harris, and Anneliise Rehn helped collect
the data. This research project was supported by NIH R01 DC011295 and NSF BCS 1147583.
References
Barr, D.J., Levy, R., Scheepers, C., & Tily, H.J. (2013) Random effects structure for confirmatory
hypothesis testing; Keep it maximal. J. Mem. Lang. 68, 255-278.
Carroll, J.D. & Wish, M. (1974) Models and methods for three-way multidimensional scaling. In D.H.
Krantz, R.C. Atkinson, R.D. Luce & P. Suppes (eds.):Contemporary developments in
mathematical psychology: Vol. 2 Measurement, psychophysics, and neural information
processing, 283–319. New York: Academic Press.
UC Berkeley Phonology Lab Annual Report (2015)
121

Chang, S.S., Plauché, M.C. and Ohala, J.J. (2001) Markedness and consonant confusion asymmetries.
In The Role of Speech Perception in Phonology (Ed. Elizabeth Hume & Keith Johnson) NY:
Academic Press. pp. 79-101.
Cowan, N., & Morse, P. a. (1986). The use of auditory and phonetic memory in vowel discrimination.
J. Acoust. Soc. Am. 79, 500–507. doi:10.1121/1.393537
Crowder, R. G. (1982). Decay of auditory memory in vowel discrimination. Journal of Experimental
Psychology. Learning, Memory, and Cognition, 8(2), 153–162. doi:10.1037/0278-7393.8.2.153
Durlach, N.I. & Braida, L.D. (1969) Intensity perception. I. Preliminary theory of intensity resolution.
J. Acoust. Soc. Am. 46(2): 372-383.
Eulitz, C., & Lahiri, A. (2004). Neurobiological evidence for abstract phonological representations in
the mental lexicon during speech recognition. Journal of Cognitive Neuroscience, 16, 577–583.
doi:10.1162/089892904323057308
Fujisaki, H. & Kawashima, T. (1970) Some experiments on speech perception and a model for the
speech perception mechanism. Annual Report of the Engineering Research Institute, University
of Tokyo 29, 577-588.
Gilmore, G. C. (1976) The interactions among letters in a visual display (Doctoral dissertation, The
Johns Hopkins University, 1975). Dissertation Abstracts International, 1976, 36, 3645B.
(University Microfilms No. DAH76-01S40)
Goldstone, R. L., Day, S., & Son, J. Y. (2010). Comparison. In B. M. Glatzeder (Ed.), Towards a
Theory of Thinking (pp. 103–121). Berlin: Springer-Verlag. doi:10.1007/978-3-642-03129-8
Lahiri, A. (1999). Speech recognition with phonological features. 14th International Congress of
Phonetic Sciences (ICPhS XIV), (ii), 719–722.
Lahiri, A., & Reetz, H. (2002). Underspecified recognition. Laboratory Phonology 7, 637–675.
Luce, R. Duncan (1986). Response Times: Their Role in Inferring Elementary Mental Organization.
Oxford: Oxford University Press.
Macmillan, N.A.; Goldberg, R.G. and Braida, L.D.. (1988). Resolution for speech sounds: Basic
sensitivity and context memory on vowel and consonant continua. The Journal of the
Acoustical Society of America, 84, 1262–1280. doi:10.1121/1.396626
Pisoni, D. B. (1973). Auditory and phonetic memory codes in the discrimination of consonants and
vowels. Perception & Psychophysics, 13(2), 253–260. doi:10.3758/BF03214136
Polka, L., & Bohn, O. S. (2003). Asymmetries in vowel perception. Speech Communication, 41, 221–
UC Berkeley Phonology Lab Annual Report (2015)
122

231. doi:10.1016/S0167-6393(02)00105-X
Polka, L., & Bohn, O. S. (2011). Natural Referent Vowel (NRV) framework: An emerging view of
early phonetic development. Journal of Phonetics, 39(4), 467–478.
doi:10.1016/j.wocn.2010.08.007
Repp. B.H.; Healy, B.H.; and Crowder, R.G. (1979) Categories and context in the perception of
isolated steady-state vowels. J. Exp. Psychol.: Hum. Percept. Perf. 5, 129-145.
Repp, B. H., & Crowder, R. G. (1990). Stimulus order effects in vowel discrimination. The Journal of
the Acoustical Society of America, 88, 2080–2090. doi:10.1121/1.400105
Rosch, E. (1975). Cognitive reference points. Cognitive Psychology, 7, 532–547. doi:10.1016/0010-
0285(75)90021-3
Rothkopf, E.Z. (1957) A measure of stimulus similarity and errors in some paired-associate learning
tasks. J. Exp. Psychol. 53, 94-101.
Schwartz, J.-L., Boë, L.-J., Vallée, N., & Abry, C. (1997). The Dispersion-Focalization Theory of
vowel systems. Journal of Phonetics, 25, 255–286. doi:10.1006/jpho.1997.0043
Shepard, R.N. (1962a) The analysis of proximities: miltidimensional scaling with an undnown distance
function. Part I. Psychometrika 27: 125-140.
Shapard, R.N. (1962b) The analysis of proximities: miltidimensional scaling with an undnown distance
function. Part II. Psychometrika 27: 219-246.
Steriade, D. (1995) Underspecification and Markedness. In J.A. Goldsmith (Ed). The Handbook of
Phonological Theory. Cambridge, MA: Blackwell Publishers, pp. 114-174.
Timm J., Weise A., Grimm S. and Schröger E. (2011) An asymmetry in the automatic detection of the
presence or absence of a frequency modulation within a tone: a mismatch negativity study.
Front. Psychology 2, 189.
Torgerson, W.S. (1965) Multidimensional scaling of similarity. Psychometrika 30: 379-393.
Tversky, A. (1977). Features of Similarity. Psychological Review 84(4), 327–352.
Wish, M. (1967) A model for the perception of Morse code like signals. Human Factors 9, 529-540.
UC Berkeley Phonology Lab Annual Report (2015)
123