voting rights in arizona 1982-2006 · a. history of discrimination in voting and other areas in...
TRANSCRIPT
VOTING RIGHTS IN ARIZONA 1982-2006
A REPORT OF RENEWTHEVRA.ORG
PREPARED BY JAMES THOMAS TUCKER AND RODOLFO ESPINO
MARCH 2006
VOTING RIGHTS IN ARIZONA 1982-2006
DR. JAMES THOMAS TUCKER,1 DR. RODOLFO ESPINO,2 TARA BRITE, SHANNON CONLEY,
BEN HOROWITZ, ZAK WALTER, SHON ZELMAN3
TABLE OF CONTENTS
Executive Summary 4
I. Introduction to the Voting Rights Act 6
A. History of Discrimination in Voting and Other Areas in Arizona 6
B. Arizona’s English Literacy Test and its Suspension by the VRA 8
C. Section 4(f)(4) Coverage 10
D. Section 203 Coverage 10
E. The Continuing Need for the Voting Rights Act in Arizona 16
II. Arizona’s Demographics 18
A. Hispanic Voting-Age Citizens 18
B. American Indian Voting-Age Citizens 19
III. Testimonials from Arizonans about the Continuing Need for the VRA 22
A. Apache County Voters 22
1. Matthew Noble 22
2. Harold Noble 24
3. Alice Anderson 26
4. Felicia Tsosie 26
5. Stella Begay 27
6. Ernestine Reeder 27
7. Rose Williams 28
8. Lee Chee 29
9. James Henderson 29
10. Alfred Lee Kahn Sr. 29
B. Pima County Voters 30
1 Adjunct Professor, Barrett Honors College, Arizona State University 2 Assistant Professor, Political Science Department, Arizona State University 3 Student Researchers, Barrett Honors College, Arizona State University

1. Manuel “Manny” Herrera 30
2. Steve Leal 31
3. Alex Rodriguez 32
IV. Survey of Voters in Coconino and Maricopa Counties 33
A. Purposes of the Survey 33
B. Overview of the Survey 33
C. Survey Questions 34
D. November 2, 2004 Survey 35
E. Post-Election Telephonic Survey 36
F. The Need for Language Assistance 37
G. The Availability of Language Assistance 38
H. The Quality of Language Assistance 39
V. Voting Discrimination in Apache County 41
A. Background and Demographics 41
B. Shirley v. Superior Court for Apache County (1973) 42
C. Goodluck v. Apache County (1975) 43
D. Apache County High School District 90 v. United States (1980) 44
E. Navapache Hospital Region Section 5 Objection (1985) 45
F. Failure to Provide Language Assistance to Navajo Voters (1987) 45
G. United States v. State of Arizona (1989) 46
H. The Continued Lack of Language Assistance for Navajo Voters (2002) 47
I. Recent Improvements in Voter Registration and Turnout (2005) 48
VI. United States Department of Justice Activities in Arizona 49
A. Enforcement Actions Since 1982 49
B. Federal Observers and Monitors Since 1982 50
C. Section 5 Objections Since 1982 54
VII. The Continued Need for Language Assistance: English-Only Education in Arizona’s
Public Schools 58
A. The English-Only Amendment and its Impact on Arizona’s Schools 58
B. Proposition 203: A Growing Language Gap in Arizona’s Schools 60
1. Studies Showing the Effects of Inadequate Education to ELL Students 62
2

2. Waiver Options under Proposition 203 62
3. Confusion and Discrimination Resulting from Implementation of
Proposition 203 63
4. Tribal Languages Targeted by English-Only Initiatives 63
5. The Impact on Schools 64
VIII. Flores v. Arizona (2005) – the Failure to Teach ELL Students 64
A. Background on the Flores Litigation 64
B. Judicial Findings of Widespread Violations of Lau v. Nichols (2000) 65
C. Arizona’s Intransigence in Remedying the Violations 66
D. Post-Judgment Order Requiring Arizona to Adequately Fund ELL
Programs (Jan. 2005) 68
E. Competing Studies of What is Required to Adequately Fund Arizona’s
ELL Programs 68
F. Arizona Cited For Contempt and Fined Minimum of $500,000
Per Day (Dec. 2005) 69
G. The Impact of Arizona’s Inadequate ELL and ESL Funding 71
1. Low Test Scores by Language Minorities 71
2. Waiting Lists for ESL Programs 73
IX. Proposition 200 73
A. Background 73
B. Court Challenges and Section 5 Preclearance 74
C. Community Responses 74
D. Impact of Proposition 200 75
E. The Future of Proposition 200 76
X. Electoral Participation and Representation in Arizona 78
A. Hispanic and American Indian Voter Registration and Turnout 78
B. Number of Hispanic and American Indian Elected Officials 80
3
EXECUTIVE SUMMARY
Since 1965, the temporary provisions of the Voting Rights Act have applied to portions of Arizona. During that time, Arizona has made great progress toward providing Latino and American Indian voting-age citizens with equal access to the political process. Arizona has discontinued the use of its English-only literacy test. Latino and American Indian voting-age citizens are registering and turning out in record numbers and are increasingly making a difference in state and local elections. Nevertheless, Arizona’s record since 1982, when the temporary provisions were last reauthorized, shows that the state still has a long way to go.
Recent examples of measures with a discriminatory effect on language minority voting-age citizens illustrate the continuing need for the Voting Rights Act in Arizona:
• In November 1988, Arizona voters approved an “English as the Official
Language” amendment that was struck down by the Arizona Supreme Court under the First and Fourteenth Amendments because of the barriers it created for Spanish and American-Indian speaking citizens and their representatives.
• In 2000, Arizona voters adopted Proposition 203, banning bilingual education in public schools to the detriment of tens of thousands of English Language Learner (ELL) students.
• In 2004, Arizona voters adopted Proposition 200, which has made it increasingly difficult for voting-age citizens, particularly elderly American Indian voters, to register or vote because of lack of requisite documentation including birth certificates and other federal or state forms of identification.
Although Arizona’s English literacy test was repealed in 1972 after being suspended by the 1970 amendments to the Voting Rights Act, these and other similar measures reinstitute de facto English literacy tests that effectively deny political access to tens of thousands of Arizonans. Several discriminatory measures adopted since 1982 demonstrate the need for continued Section 5 coverage of Arizona:
• The Justice Department has objected to four statewide redistricting plans
because of their discriminatory impact on language minority voting-age citizens, including one in the 1980’s, two in the 1990’s, and one in 2002.
• Over 80 percent of all Section 5 objections in Arizona have occurred since 1982.
• The Justice Department has interposed Section 5 objections to discriminatory voting changes in seven of Arizona’s 15 counties since 1982.
• Several of the post-1982 Section 5 objections have been directed at discriminatory practices with the purpose or effect of denying language assistance and other basic election access to limited-English proficient (LEP)
4

American Indian voting-age citizens, such as discriminatory practices remedied in 1989 and 1994 cases brought by the Department of Justice.
There also continues to be a need for language assistance under Section 203 of the Act, with recent evidence of persistent and ongoing discrimination in education, high illiteracy rates, and non-compliance with the Act showing the importance of these provisions:
• According to the 2000 Census, 20.6 percent of all Hispanic voting-age
citizens are LEP and 21.7 percent of all American Indian voting-age citizens are LEP. The need is most acute among elderly American Indian citizens, with 46.5 percent of all American Indian citizens over 65 requiring language assistance.
• The need for language assistance among Navajo voting-age citizens in Apache, Coconino, and Navajo Counties is extreme, with approximately one-third of those citizens LEP, among whom the illiteracy rate is over 25 percent, roughly nineteen times the national illiteracy rate.
• In the December 2005 decision of Flores v. State, a federal court cited Arizona for contempt for under-funding its English Language Learner (ELL) programs by as much as 90 percent. Arizona’s failure has denied equal educational opportunities to 175,000 ELL Latino and American Indian students, in violation of Lau v. Nichols and Title VI of the Civil Rights Act. The state has taken no action to correct the problem since originally being found liable six years ago, resulting in fines of at least $500,000 per day.
• Denial of equal educational opportunities has resulted in high failure rates among Latino and American Indian students on state-mandated graduation tests. On national testing, more than 60 percent of all Latino and American Indian students score below grade level.
• Arizona has inadequate English as a Second Language (ESL) and adult ELL courses to help bridge the language gap.
• As recently as 2002, the Department of Justice identified substantial non-compliance with Section 203 by Apache County, denying thousands of American Indian voting-age citizens equal access to the election process.
Sections 6 through 9 of the Act also have made a difference in Arizona since 1982:
• Since 1982, there have been more than 1200 federal observers deployed to
Apache, Navajo, and Yuma Counties, identifying substantial non-compliance in the availability and quality of language assistance to American Indian and Latino voting-age citizens.
• Since 2004, the use of monitors in six Arizona counties not designated for federal observers highlights the need to increase the attorney general’s power to designate jurisdictions to ensure compliance with the Voting Rights Act.
5
The record in Arizona demonstrates the continuing need for coverage under Section 4(f)(4), and reauthorization of the expiring provisions of the VRA for an additional twenty-five years. I. Introduction to the Voting Rights Act A. History of Discrimination in Voting and Other Areas Prior to passage of the Voting Rights Act of 1965 (“VRA”), Arizonans of Hispanic, American Indian, African-American, and Asian heritage were the victims of discrimination in virtually every other area of their social and political life. For example, the town of Winslow adopted a policy segregating public swimming pools that allowed only Anglos to use the pool on days it was cleaned and Mexican Americans, American Indians and blacks on other days.4 Similarly, Arizona adopted an anti-miscegenation law banning marriages between persons of “Caucasian blood” and those of “Negro, Mongolian, Malay, or Hindu” blood.5 American Indians were included in an earlier version of the anti-miscegenation statute, but were removed as a result of a 1942 amendment.6 African Americans were not removed from the statute until 1962, just five years before the landmark Supreme Court case of Loving v. Virginia.7
Segregated schooling was widespread after it was sanctioned by the state Supreme Court8 and state legislature, which passed a statute permitting school districts “to make such segregation of pupils as they may deem advisable.”9 Spanish-speaking Latino students were specifically targeted for segregation on the basis of their language.10 It was not until the 1950s, after Brown v. Board of Education, that Latino students were integrated into Arizona’s public schools.11 American Indian students remained largely segregated from non-Indians because they attended Bureau of Indian Affairs (BIA) schools on reservations.
4 The policy ended as a result of a consent agreement in Baca v. Winslow, No. Civ-394-Pct (D. Ariz. 1955). 5 Ariz. Rev. Stat. § 25-101(A) (1956). The statute was struck down in 1959 in Oyama v. O’Neill, No. 61269 (Ariz. Super. Ct. Dec. 23, 1959). 6 Arizona’s anti-miscegenation statute was originally enacted by the Territorial legislature in 1865. 7 388 U.S. 1 (1967). 8 See Dameron v. Bayless, 14 Ariz. 180, 126 P. 273 (Ariz. 1912) (upholding segregated schools under Plessy v. Ferguson).9 Ariz. Rev. Stat. § 2750 (1913). 10 Laura K. Muñoz, “Separate But Equal? A Case Study of Romo v. Laird and Mexican American Education,” at 1 (Organization of American Historians). 11 In Ortiz v. Jack, No. Civ-1723 (D. Ariz. 1955), the Glendale Board of Education agreed to discontinue the segregation and discrimination of Mexican school children. Similarly, in Gonzalez v. Sheeley, the Court enjoined the segregation of Mexican school children in public schools. The Court reasoned, “a paramount requisite in the American system of public education is social equality. It must be open to all children by unified school association, regardless of lineage.” 96 F. Supp. 1004, 1008-09 (D. Ariz. 1951).
6
Even after the public schools were desegregated, Latinos continued to be subjected to Arizona’s sweeping limitations on bilingual education. Arizona has had a longstanding tradition of English-only education in public schools, with English-only courses (known as “1C classes”) mandated by Arizona law in 1919. In districts, with large numbers of English as a Second Language (ESL) and English Language Learner (ELL) students, students received English lessons at a low-level, simplified curriculum. Many of the students in the 1C classes remained behind for several years before dropping out of school, never receiving the opportunity to learn age-appropriate material. The 1C courses remained the only option until 1965, when some bilingual programs were introduced. However, a limit was placed on the number of programs that were permitted, and English-only flourished.12 Limitations on bilingual education had the effect of denying Latinos access to voting once they were eligible, particularly due to Arizona’s English literacy test, which is discussed below.
Similarly, for much of Arizona’s history, American Indians were excluded from voting because they were treated as “wards of the state” who were not full citizens.13 American Indians in Arizona remained officially disenfranchised until 1948.14 Even then, barriers to participation by American Indians persisted:
Some Indian people were unsure about their newly won voting rights. Many did not see themselves as active participants in the federal and state political process—simply because they did not view it as their process. Some feared that involvement in this non-Indian process would lead to taxation, further loss of reservation lands, and the termination of their special relationship with the federal government. These fears stemmed in large part from statements generated by the non-Indian community.
In addition to fears about changes in taxation and the loss of the special federal relationship, an estimated 80 to 90 percent of the Indian population was illiterate, according to a 1948 Arizona Republic article.15 Even as Arizona allowed more American Indians to vote, Indians were still subjected to second-class citizenship. Like African Americans in the South during Reconstruction, American Indians had the legal right to vote, but were not guaranteed that they would be able to cast a meaningful ballot. Language barriers prevented many from being able to read the ballot. “Using poll taxes, literacy tests, English language tests, and refusing to place polling places in or near Indian communities, western states were successful in their efforts to prevent Indians from voting.”16
12 Rolstad, Kellie, Kate S. Mahoney, and Gene V. Glass. “Weighing the Evidence: A Meta-Analysis of Bilingual Education in Arizona.” Bilingual Research Journal 29 (2005): 1-18. 13 Porter v. Hall, 34 Ariz. 308, 271 P. 411 (Ariz. 1928). 14 Harrison v. Laveen, 67 Ariz. 337, 196 P.2d 456 (Ariz. 1948). 15 Inter Tribal Council of Arizona. “The History of Indian Voting in Arizona.” 2004. 16 Rollings, Willard Hughes. “Citizenship and Suffrage: The American Indian Struggle for Civil Rights in the American West, 1830-1965.” 5 Nev. L.J. 126.
7
B. Arizona’s English Literacy Test and its Suspension by the VRA
Arizona enacted its first English literacy test in 1912, shortly after it became a state. The statute, as later amended, provided:
Every resident of the state is qualified to become an elector and may register to vote at all elections authorized by law if he: 4. Is able to read the Constitution of the United States in the English
language in such manner as to show he is neither prompted nor reciting from memory, unless prevented from doing so by physical disability.
5. Is able to write his name, unless prevented from so doing by physical disability.”17
According to historian David Berman, the literacy test was enacted “to limit ‘the ignorant Mexican vote’ …. As recently as the 1960s, registrars applied the test to reduce the ability of blacks, Indians, and Hispanics to register to vote.” Berman explained, “Anglos sometimes challenged minorities at the polls and asked them to read and explain ‘literacy’ cards. Intimidators hoped to discourage minorities from standing in line to vote.”18
On August 7, 1965, Apache County, Arizona was included in the original list of jurisdictions covered by Section 5 of the Voting Rights Act.19 On November 19, 1965, Navajo and Coconino Counties also became covered by Section 5.20 As a result of this coverage, application of the literacy test was suspended in each of the three counties, where a majority of the voters were American Indian. In 1966, these three counties became the first jurisdictions to successfully bail out from coverage under Section 5 after the U.S. District Court for the District of Columbia held that Arizona’s literacy test had not been discriminatorily applied against Indians in the preceding five years.21
When the Voting Rights Act was amended in 1970 and the temporary provisions were extended for an additional five years, one of the measures of voting discrimination was changed to registration and turnout in the 1968 presidential election. As a result of this amendment, Apache, Coconino, and Navajo Counties again became covered by Section 5, along with five additional Arizona counties. In addition, the amendments included a nationwide ban on literacy tests, which again preempted the operation of Arizona’s literacy test.22
17 Ariz. Rev. Stat. Ann. §§ 16-101.A.4, 16-101.A.5 (1956). 18 David R. Berman, Arizona Politics and Government: The Quest for Autonomy, Democracy, and Development (University of Nebraska Press 1998), pp. 48-49. 19 30 Fed. Reg. 9897 (Aug. 7, 1965). 20 30 Fed. Reg. 14505 (Nov. 19, 1965). 21 Apache County v. United States, 256 F. Supp. 903 (D.D.C. 1966). 22 42 U.S.C. § 1973aa.
8

In Oregon v. Mitchell, the U.S. Supreme Court considered a challenge to several provisions of the Voting Rights Act Amendments of 1970, including the nationwide ban on literacy tests in any federal, state, or local election.23
Arizona maintained that the ban could not be enforced to the extent it was inconsistent with the state’s literacy test requirement. The Supreme Court rejected that argument and held that the ban was constitutional under the Enforcement Clause of the Fourteenth Amendment and that it superseded the Arizona statute under the Supremacy Clause of the United States Constitution. Congress enacted Title II in order to ban literacy tests that were used to discriminate against voters on account of their race. There was overwhelming evidence showing that the ban on tests or devices in the Voting Rights Act had a remarkable impact on minority registration. There was also evidence that voter registration and participation were consistently greater in states without literacy tests.24
Moreover, in enacting the new legislation, Congress was aware of the history of discriminatory educational opportunities in America. The Court noted that Arizona’s discriminatory education system had resulted in disenfranchisement of its American Indian citizens:
In Arizona, for example, only two counties out of eight with Spanish surname populations in excess of 15% showed a voter registration equal to the state-wide average. Arizona also has a serious problem of deficient voter registration among Indians. Congressional concern over the use of a literacy test to disfranchise Puerto Ricans in New York State is already a matter of record in this Court. Katzenbach v. Morgan, supra. And as to the Nation as a whole, Congress had before it statistics which demonstrate that voter registration and voter participation are consistently greater in States without literacy tests.25
Justice Douglas similarly observed: [Congress] can rely on the fact that most States do not have literacy tests; that the tests have been used at times as a discriminatory weapon against some minorities, not only Negroes but Americans of Mexican ancestry, and American Indians; that radio and television have made it possible for a person to be well informed even though he may not be able to read and write. We know from the legislative history that these and other desiderata influenced Congress in the choice it made in the present legislation; and we certainly cannot say that the means used were inappropriate.26
23 400 U.S. 112 (1970). 24 400 U.S. at 132-33. 25 400 U.S. at 132-33. 26 400 U.S. at 147 (Douglas, J., dissenting).
9

The Court concluded that American citizens could be informed in their own native language and responsibly and knowledgably cast a ballot. However, Arizona did not repeal its English literacy test until 1972, two years after Oregon v. Mitchell was decided.
C. Section 4(f)(4) Coverage
As a result of its lengthy history of discrimination and its English literacy test, Arizona became covered by Section 5 and the other special provisions of the Voting Rights Act after the Act was amended in 1975. Arizona is one of just three states covered statewide under Section 4(f)(4) of the Act, for Spanish Heritage (Alaska for Alaskan Natives and Texas for Spanish Heritage are the other two). Arizona became covered after the 1975 Amendments to the Voting Rights Act were passed, based upon the determination that:
• More than five percent of the voting-age citizens (persons 18 years and older) on November 1, 1972 were members of a single language minority group (Spanish); and
• The U.S. Attorney General found that election materials were provided in English only on November 1, 1972 (as a result of Arizona’s English literacy requirement in Ariz. Rev. Stat. Ann. §§ 16-101.A.4, 16-101.A.5 (1956)); and
• The Director of the Census determined that fewer than fifty percent of voting-age citizens were registered to vote on November 1, 1972 or that fewer than fifty percent voted in the November 1972 presidential election.27
See 42 U.S.C. § 1973b(b). As a result of this determination, all political subdivisions in Arizona (including counties, cities, and special districts) must comply with Section 203 by providing all election materials, including assistance and ballots, in the language of the applicable language minority group. See 28 C.F.R. § 55.8(a). In addition, the jurisdictions are subject to the special provisions of the VRA, including Section 5 preclearance.
D. Section 203 Coverage
In addition to statewide coverage under Section 4(f)(4), twelve of Arizona’s fifteen counties are separately covered by Section 203 of the Voting Rights Act. Six counties are covered for Spanish: Cochise, Greenlee, Maricopa, Pima, Santa Cruz, and Yuma. Nine counties are covered for American Indian languages: Apache, Coconino, Gila, Graham, Maricopa, Navajo, Pima, Pinal, and Yuma. See Figure 1.1. The coverage basis for each county is summarized in Figures 1.3 and 1.4.
27 28 C.F.R. Part 55, Appendix (summarizing coverage determinations). Coverage determinations were published at 40 Fed. Reg. 43746 (Sept. 23, 1975), 40 Fed. Reg. 49422 (Oct. 22, 1975), 41 Fed. Reg. 784 (Jan. 5, 1976) (corrected at 41 Fed. Reg. 1503 (Jan. 8, 1976)), and 41 Fed. Reg. 34329 (Aug. 13, 1976).
10

Figure 1.1: Arizona Counties Separately Covered by Section 203 of the Voting Rights Act.
Arizona CountiesCovered by Section 203** Arizona is covered statewide under Section 4(f)(4) for Spanish Heritage
YUMA
APACHE
COCHISE
COCONINO
GILA
GRAHAM
GREENLEE
MARICOPA
MOHAVENAVAJO
PIMA
PINAL
SANTA CRUZ
YAVAPAI
LA PAZ
Spanish covered
American Indian covered
Spanish & American Indian covered
No separate Section 203 coverage
Source: Voting Rights Act Amendments of 1992, Determinations Under Section 203, 67 Fed. Reg. 48,871 (July 26, 2002)
11
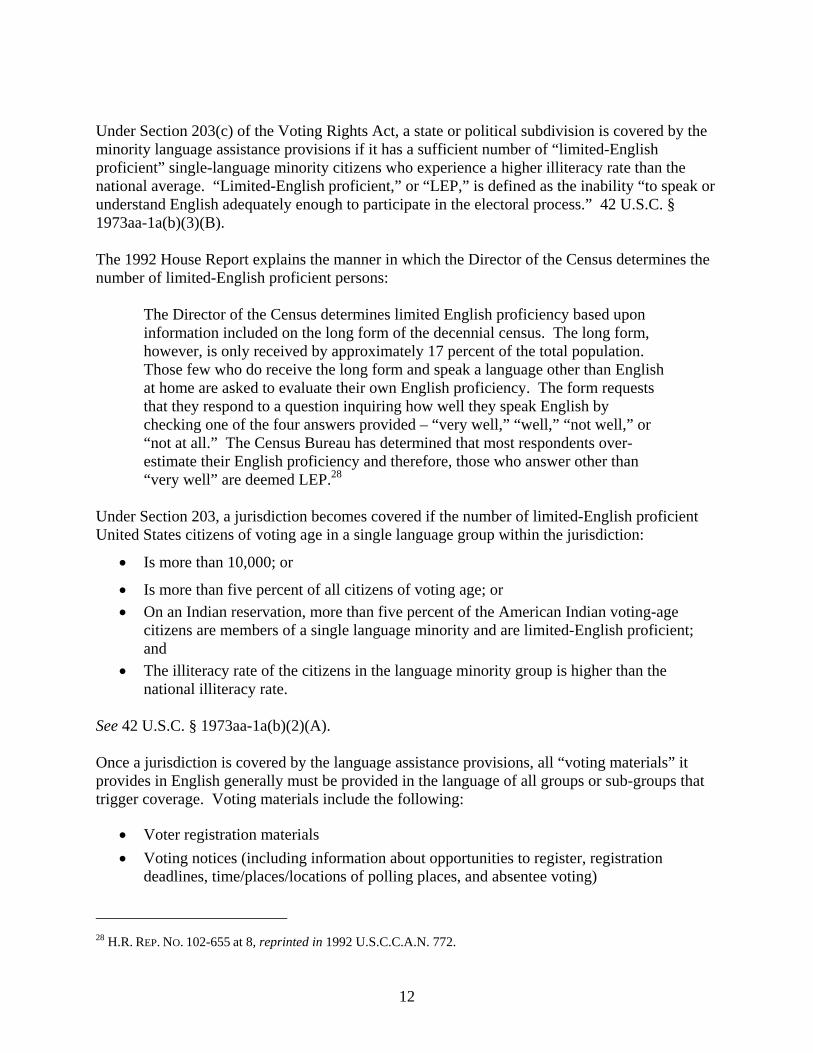
Under Section 203(c) of the Voting Rights Act, a state or political subdivision is covered by the minority language assistance provisions if it has a sufficient number of “limited-English proficient” single-language minority citizens who experience a higher illiteracy rate than the national average. “Limited-English proficient,” or “LEP,” is defined as the inability “to speak or understand English adequately enough to participate in the electoral process.” 42 U.S.C. § 1973aa-1a(b)(3)(B).
The 1992 House Report explains the manner in which the Director of the Census determines the number of limited-English proficient persons:
The Director of the Census determines limited English proficiency based upon information included on the long form of the decennial census. The long form, however, is only received by approximately 17 percent of the total population. Those few who do receive the long form and speak a language other than English at home are asked to evaluate their own English proficiency. The form requests that they respond to a question inquiring how well they speak English by checking one of the four answers provided – “very well,” “well,” “not well,” or “not at all.” The Census Bureau has determined that most respondents over-estimate their English proficiency and therefore, those who answer other than “very well” are deemed LEP.28
Under Section 203, a jurisdiction becomes covered if the number of limited-English proficient United States citizens of voting age in a single language group within the jurisdiction:
• Is more than 10,000; or
• Is more than five percent of all citizens of voting age; or • On an Indian reservation, more than five percent of the American Indian voting-age
citizens are members of a single language minority and are limited-English proficient; and
• The illiteracy rate of the citizens in the language minority group is higher than the national illiteracy rate.
See 42 U.S.C. § 1973aa-1a(b)(2)(A). Once a jurisdiction is covered by the language assistance provisions, all “voting materials” it provides in English generally must be provided in the language of all groups or sub-groups that trigger coverage. Voting materials include the following:
• Voter registration materials • Voting notices (including information about opportunities to register, registration
deadlines, time/places/locations of polling places, and absentee voting)
28 H.R. REP. NO. 102-655 at 8, reprinted in 1992 U.S.C.C.A.N. 772.
12

• Voting materials provided by mail • All election forms • Polling place activities and materials • Instructions • Publicity • Ballots • Other materials or information relating to the electoral process • Assistance
See 42 U.S.C. § 1973aa-1a(c); 28 C.F.R. §§ 55.15, 55.18. Written materials generally do not have to be provided to members of Alaskan Native and American Indian groups whose languages historically are unwritten. Instead, oral instructions, assistance, or other information in the covered language must be available for members of those groups at every stage of the electoral process. See 42 U.S.C. § 1973aa-1a(c). The covered jurisdiction is responsible for providing effective assistance to members of the covered minority language groups. See 28 C.F.R. § 55.2(c). The minority language assistance provisions apply to all stages of the electoral process for “any type of election, whether it is a primary, general or special election.” 28 C.F.R. § 55.10. This includes not only elections of officers, but also elections on such matters as bond issues, constitutional amendments and referendums. Federal, state, and local elections are covered, as well as special district elections, such as school districts and water districts. See 28 C.F.R. § 55.10. Arizona’s statewide coverage for Spanish language assistance is based upon its Section 4(f)(4) coverage, and not Section 203, because it cannot meet the five percent voting-age citizen LEP threshold at the state level. Nevertheless, there is a great need for language assistance among Latino voting-age citizens in Arizona. According to the 2000 Census, 20.6 percent (104,967) of Arizona’s 510,488 Latino voting-age citizens speak English “less than very well” and need language assistance to vote.
The need for language assistance is equally great among eligible American Indian voters. According to the 2000 Census, 21.7 percent (38,457) of Arizona’s American Indian voting-age citizens are LEP and need voting assistance. The need is particularly acute among Arizona’s elderly American Indian citizens: 46.5 percent of all American Indian citizens over the age of 65 are LEP. The percentage is even higher among American Indians over 75 years of age, with 49.4 percent (2,994) of the 6,059 persons needing language assistance in the voting process. See Figure 1.2.
13
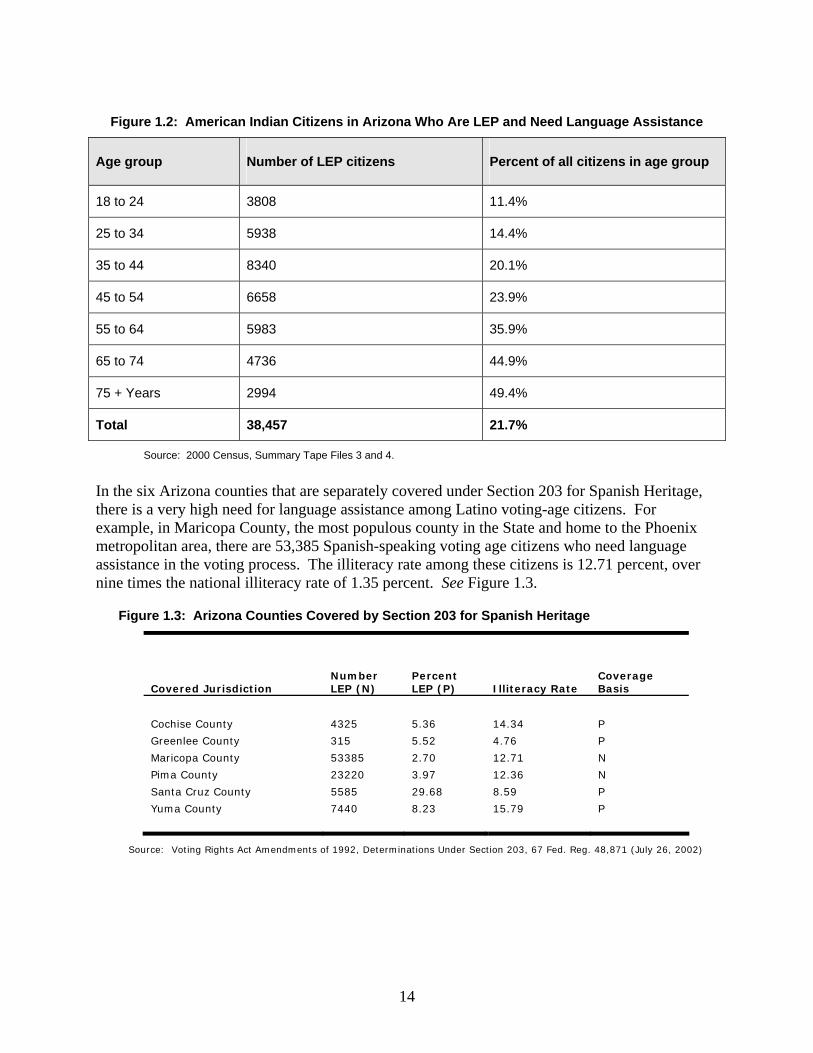
Figure 1.2: American Indian Citizens in Arizona Who Are LEP and Need Language Assistance
Age group Number of LEP citizens Percent of all citizens in age group
18 to 24 3808 11.4%
25 to 34 5938 14.4%
35 to 44 8340 20.1%
45 to 54 6658 23.9%
55 to 64 5983 35.9%
65 to 74 4736 44.9%
75 + Years 2994 49.4%
Total 38,457 21.7%
Source: 2000 Census, Summary Tape Files 3 and 4.
In the six Arizona counties that are separately covered under Section 203 for Spanish Heritage, there is a very high need for language assistance among Latino voting-age citizens. For example, in Maricopa County, the most populous county in the State and home to the Phoenix metropolitan area, there are 53,385 Spanish-speaking voting age citizens who need language assistance in the voting process. The illiteracy rate among these citizens is 12.71 percent, over nine times the national illiteracy rate of 1.35 percent. See Figure 1.3. Figure 1.3: Arizona Counties Covered by Section 203 for Spanish Heritage
Covered Jurisdiction Number LEP (N)
Percent LEP (P) Illiteracy Rate
Coverage Basis
Cochise County 4325 5.36 14.34 P
Greenlee County 315 5.52 4.76 P
Maricopa County 53385 2.70 12.71 N
Pima County 23220 3.97 12.36 N
Santa Cruz County 5585 29.68 8.59 P
Yuma County 7440 8.23 15.79 P
Source: Voting Rights Act Amendments of 1992, Determinations Under Section 203, 67 Fed. Reg. 48,871 (July 26, 2002)
14

The need for language assistance is even greater among American Indian voting-age citizens in the nine Arizona counties covered under Section 203 for American Indian languages. Apache County, home to the capital of the Navajo Nation, is the only jurisdiction in the United States that is covered under all three Section 203 coverage formulas: among all voting-age citizens in the County, 26.52 percent – numbering 11,245 – are Navajo-speaking LEP persons. Apache County is also covered by the partial reservation trigger because 36.11 percent of all persons living on the Navajo Reservation, which is divided between several states and counties, are Navajo-speaking LEP persons. The illiteracy rate among these Navajo voting-age citizens is extreme. It includes more than 25 percent of all eligible Navajo voters, which is nearly 19 times the national illiteracy rate. Apache County also is covered for the Apache and Hopi (Pueblo) languages. See Figure 1.4.
Figure 1.4: Arizona Counties Covered by Section 203 for American Indian Languages
Covered Jurisdiction Covered Language
Indian Reservation (RP or RW)
Number LEP (L)
Percent LEP (P)
Illiteracy Rate
Coverage Basis
Apache County Apache Fort Apache Reservation 15 10 0 RP
Navajo 11245 26.52 25.43 N, P
Navajo Navajo Nation Reservation and
Off-Reservation Trust Land 11175 36.11 25.37 RP
Pueblo Zuni Reservation and Off
Reservation Trust Land 0 0 0 RP
Coconino County Navajo 5405 6.74 26.64 P
Navajo Navajo Nation Reservation and
Off-Reservation Trust Land 4555 35.41 29.75 RP
Pueblo Hopi Reservation and Off-
Reservation Trust Land 90 14.75 0 RP
Gila County Apache Fort Apache Reservation 270 32.53 1.48 RP
Apache San Carlos Reservation 570 22.01 2.63 RP
Apache Tonto Apache Reservation 0 * * RP
Graham County Apache San Carlos Reservation 715 29.24 0.56 RP
Maricopa County Tohono O'Odham
Tohono O'odham Reservation and Off-Reservation Trust Land
190 62.3 28.95 RP
15
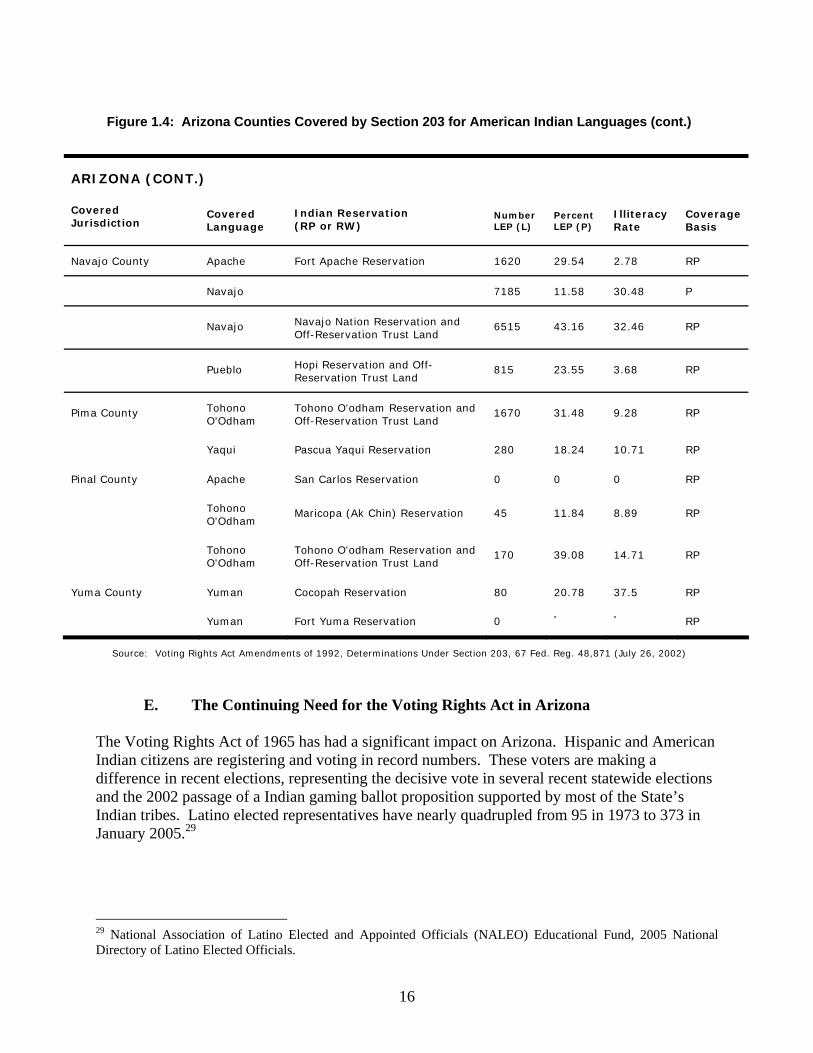
Figure 1.4: Arizona Counties Covered by Section 203 for American Indian Languages (cont.)
ARIZONA (CONT.)
Covered Jurisdiction
Covered Language
Indian Reservation (RP or RW)
Number LEP (L)
Percent LEP (P)
Illiteracy Rate
Coverage Basis
Navajo County Apache Fort Apache Reservation 1620 29.54 2.78 RP
Navajo 7185 11.58 30.48 P
Navajo Navajo Nation Reservation and
Off-Reservation Trust Land 6515 43.16 32.46 RP
Pueblo Hopi Reservation and Off-
Reservation Trust Land 815 23.55 3.68 RP
Pima County Tohono O'Odham
Tohono O'odham Reservation and Off-Reservation Trust Land
1670 31.48 9.28 RP
Yaqui Pascua Yaqui Reservation 280 18.24 10.71 RP
Pinal County Apache San Carlos Reservation 0 0 0 RP
Tohono O'Odham
Maricopa (Ak Chin) Reservation 45 11.84 8.89 RP
Tohono O'Odham
Tohono O'odham Reservation and Off-Reservation Trust Land
170 39.08 14.71 RP
Yuma County Yuman Cocopah Reservation 80 20.78 37.5 RP
Yuman Fort Yuma Reservation 0 * * RP
Source: Voting Rights Act Amendments of 1992, Determinations Under Section 203, 67 Fed. Reg. 48,871 (July 26, 2002)
E. The Continuing Need for the Voting Rights Act in Arizona
The Voting Rights Act of 1965 has had a significant impact on Arizona. Hispanic and American Indian citizens are registering and voting in record numbers. These voters are making a difference in recent elections, representing the decisive vote in several recent statewide elections and the 2002 passage of a Indian gaming ballot proposition supported by most of the State’s Indian tribes. Latino elected representatives have nearly quadrupled from 95 in 1973 to 373 in January 2005.29
29 National Association of Latino Elected and Appointed Officials (NALEO) Educational Fund, 2005 National Directory of Latino Elected Officials.
16
Nevertheless, Arizona still has a long way to go. More than 80 percent of Arizona’s twenty-two Section 5 objections have occurred for voting changes enacted since 1982. Four post-1982 objections have been for statewide redistricting plans, including one in the 1980s, two in the 1990s and one as recently as 2002. Since 1982, the Department of Justice has interposed objections to voting changes from nearly half of Arizona’s 15 counties that have had the purpose or effect of discriminating against Latino or American Indian voters.
Northern Arizona has a lengthy history of discrimination against Navajo, Apache, and Hopi voters. In 1989 and 1994, successful cases were brought against Coconino, Navajo, and Apache Counties for denying American Indian voters access to the political process. Those same three counties account for nearly half of all of the post-1982 Section 5 objections in Arizona. Prior to 1998, all of the federal observers and monitors deployed to Arizona were sent to observe elections in Apache and Navajo Counties. As recently as 2002, the Department of Justice identified significant deficiencies in the availability and quality of language assistance offered to American Indian voters in Apache County.
Other barriers to voting persist for American Indians. Polling places and registration sites can be few and far between. Geographical isolation and long travel distances make it difficult for many Indian people living on reservation to register and to vote. Disparate education opportunities for American Indians enrolled in BIA schools have also led to high illiteracy rates. Socio-economic barriers have heightened the crippling effect of illiteracy, resulting in voter registration and turnout rates that continue to lag far behind non-Hispanic white voters.
In December 2005, Arizona was cited for contempt by a federal court for failing to provide adequate English language instruction to the 175,000 limited-English proficient (LEP) students enrolled in its English Language Learner (ELL) programs in the public schools. The problem has worsened since Arizona’s passage of a ban on bilingual education in 2000. According to some estimates, Arizona has under-funded ELL education by as much as ninety percent for decades, resulting in tens of thousands of voting-age citizens who are LEP and illiterate. Language barriers also remain in place because of lengthy waiting periods for English as a Second Language (ESL) and adult ELL programs.
Proposition 200 has been one of the most recent and controversial issues facing Latino and American Indian voters in Arizona. The “Protect Arizona Now” committee authored this referendum to curb the use of public services by undocumented immigrants. It passed in November 2004 with 56 percent of the vote. Proposition 200 requires individuals to produce proof of citizenship before they can register to vote or apply for public benefits and makes it a misdemeanor for public officials to fail to report persons unable to produce documentation of citizenship who apply for benefits. Opponents say the measure is unconstitutional, xenophobic, racist and inhumane.30 The measure has not simply impaired the ability of Latino voting-age citizens to participate in elections. Many American Indian voters, particularly the elderly, do not have birth certificates or other means to prove their citizenship. Hispanic and American Indian voters have widely protested Proposition 200, and legal challenges are expected. Regardless of the outcome, one thing remains clear: the Voting Rights Act remains needed in Arizona. 30 http://www.pan2004.com.
17
II. Arizona’s Demographics
A. Hispanic Voting-Age Citizens
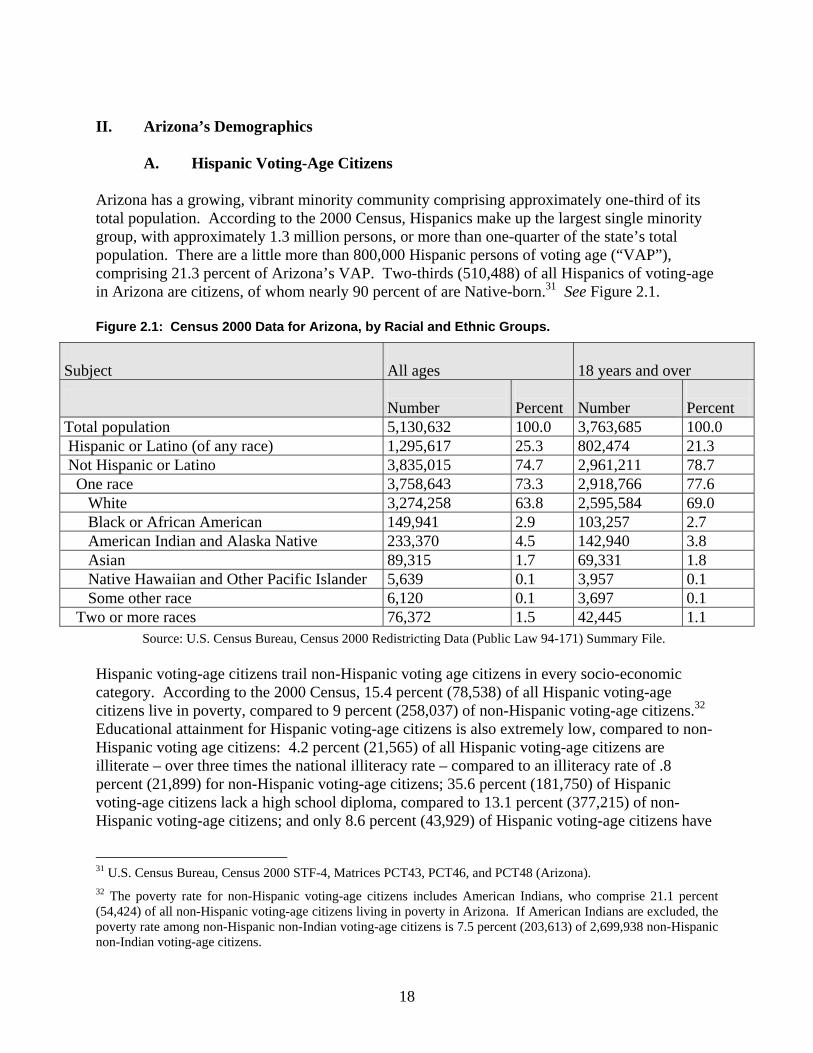
Arizona has a growing, vibrant minority community comprising approximately one-third of its total population. According to the 2000 Census, Hispanics make up the largest single minority group, with approximately 1.3 million persons, or more than one-quarter of the state’s total population. There are a little more than 800,000 Hispanic persons of voting age (“VAP”), comprising 21.3 percent of Arizona’s VAP. Two-thirds (510,488) of all Hispanics of voting-age in Arizona are citizens, of whom nearly 90 percent of are Native-born.31 See Figure 2.1. Figure 2.1: Census 2000 Data for Arizona, by Racial and Ethnic Groups.
Subject
All ages
18 years and over
Number
Percent
Number
Percent
Total population 5,130,632 100.0 3,763,685 100.0 Hispanic or Latino (of any race) 1,295,617 25.3 802,474 21.3 Not Hispanic or Latino 3,835,015 74.7 2,961,211 78.7 One race 3,758,643 73.3 2,918,766 77.6
White 3,274,258 63.8 2,595,584 69.0 Black or African American 149,941 2.9 103,257 2.7 American Indian and Alaska Native 233,370 4.5 142,940 3.8 Asian 89,315 1.7 69,331 1.8 Native Hawaiian and Other Pacific Islander 5,639 0.1 3,957 0.1 Some other race 6,120 0.1 3,697 0.1
Two or more races 76,372 1.5 42,445 1.1 Source: U.S. Census Bureau, Census 2000 Redistricting Data (Public Law 94-171) Summary File. Hispanic voting-age citizens trail non-Hispanic voting age citizens in every socio-economic category. According to the 2000 Census, 15.4 percent (78,538) of all Hispanic voting-age citizens live in poverty, compared to 9 percent (258,037) of non-Hispanic voting-age citizens.32 Educational attainment for Hispanic voting-age citizens is also extremely low, compared to non-Hispanic voting age citizens: 4.2 percent (21,565) of all Hispanic voting-age citizens are illiterate – over three times the national illiteracy rate – compared to an illiteracy rate of .8 percent (21,899) for non-Hispanic voting-age citizens; 35.6 percent (181,750) of Hispanic voting-age citizens lack a high school diploma, compared to 13.1 percent (377,215) of non-Hispanic voting-age citizens; and only 8.6 percent (43,929) of Hispanic voting-age citizens have
31 U.S. Census Bureau, Census 2000 STF-4, Matrices PCT43, PCT46, and PCT48 (Arizona). 32 The poverty rate for non-Hispanic voting-age citizens includes American Indians, who comprise 21.1 percent (54,424) of all non-Hispanic voting-age citizens living in poverty in Arizona. If American Indians are excluded, the poverty rate among non-Hispanic non-Indian voting-age citizens is 7.5 percent (203,613) of 2,699,938 non-Hispanic non-Indian voting-age citizens.
18

at least a four-year college degree, compared to 24.7 percent (710,029) of non-Hispanic voting-age citizens.33
B. American Indian Voting-Age Citizens There are more than a quarter million American Indians in Arizona, making up 4.5 percent of the State’s total population. Like Hispanics, American Indians are, on average, a younger group, with a VAP of a little more than 140,000 persons, making up 3.8 percent of Arizona’s VAP. Figure 2.1. Most of the members of Arizona’s 21 American Indian tribes live on reservations. The Census data for each of these reservations is provided in Figure 2.2, along with information about the size of the reservations. Arizona’s American Indian voting-age citizen population, like its Hispanic population, trails non-Hispanic non-Indian voting-age citizens in every significant socio-economic category. According to the 2000 Census, nearly one-third of all Indian voting-age citizens are below the poverty level. Poverty has a particularly great impact on younger Indians. Among all American Indians in Arizona:
• The average per capita income is $7,642, nearly four times less than for non-Indian white persons.
• 42.1 percent are below the poverty level.
• 37.8 percent of families are below the poverty level.
See Figure 2.3. Furthermore, over 40.9 percent of American Indians in Arizona are 65 years and older. The large percent of older American Indian citizens highlights the importance of continuing to provide language assistance in Arizona: 46.5 percent of all American Indian citizens over the age of 65 are LEP. See Figure 1.2. As a result of these socio-economic barriers and other structural obstacles, particularly lack of language assistance, American Indian turnout remains low, comprising just over 54 percent of all registered American Indian voters in the 2004 presidential election, compared to the statewide turnout of 76 percent. See Figure 10.2.
33 2000 Census, Summary Tape Files 3 and 4.
19
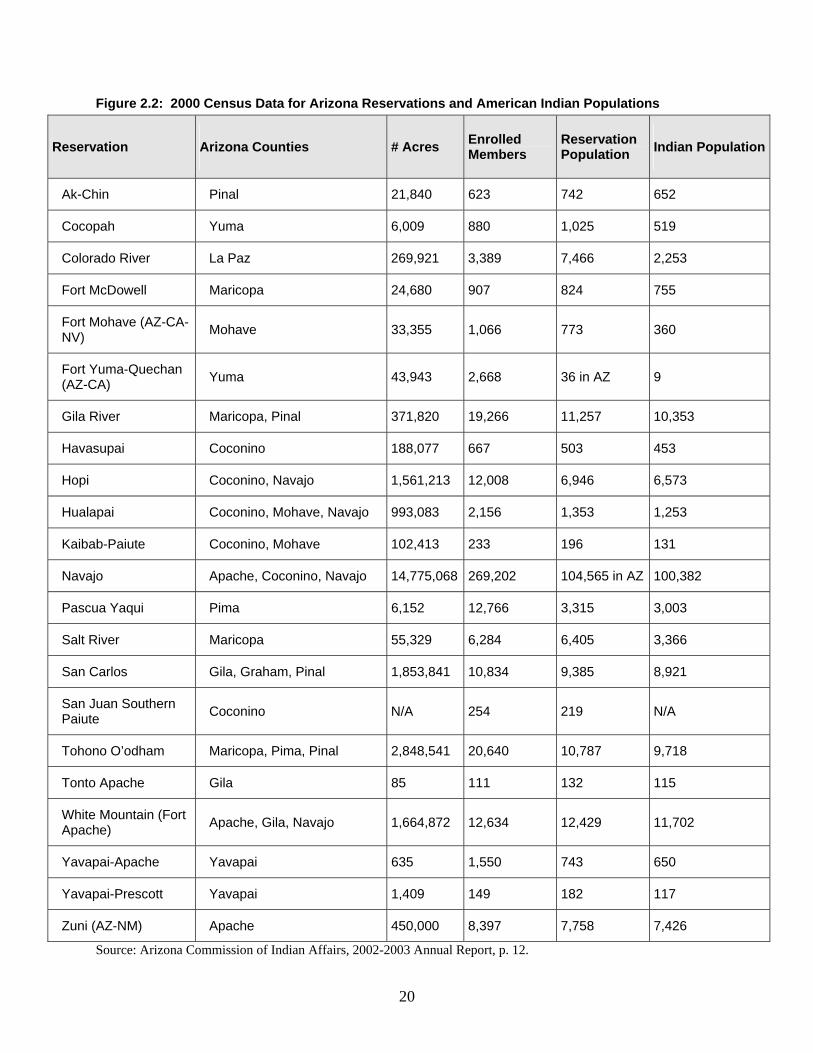
Figure 2.2: 2000 Census Data for Arizona Reservations and American Indian Populations
Reservation Arizona Counties # Acres Enrolled Members
Reservation Population Indian Population
Ak-Chin Pinal 21,840 623 742 652
Cocopah Yuma 6,009 880 1,025 519
Colorado River La Paz 269,921 3,389 7,466 2,253
Fort McDowell Maricopa 24,680 907 824 755
Fort Mohave (AZ-CA-NV) Mohave 33,355 1,066 773 360
Fort Yuma-Quechan (AZ-CA) Yuma 43,943 2,668 36 in AZ 9
Gila River Maricopa, Pinal 371,820 19,266 11,257 10,353
Havasupai Coconino 188,077 667 503 453
Hopi Coconino, Navajo 1,561,213 12,008 6,946 6,573
Hualapai Coconino, Mohave, Navajo 993,083 2,156 1,353 1,253
Kaibab-Paiute Coconino, Mohave 102,413 233 196 131
Navajo Apache, Coconino, Navajo 14,775,068 269,202 104,565 in AZ 100,382
Pascua Yaqui Pima 6,152 12,766 3,315 3,003
Salt River Maricopa 55,329 6,284 6,405 3,366
San Carlos Gila, Graham, Pinal 1,853,841 10,834 9,385 8,921
San Juan Southern Paiute Coconino N/A 254 219 N/A
Tohono O’odham Maricopa, Pima, Pinal 2,848,541 20,640 10,787 9,718
Tonto Apache Gila 85 111 132 115
White Mountain (Fort Apache) Apache, Gila, Navajo 1,664,872 12,634 12,429 11,702
Yavapai-Apache Yavapai 635 1,550 743 650
Yavapai-Prescott Yavapai 1,409 149 182 117
Zuni (AZ-NM) Apache 450,000 8,397 7,758 7,426
Source: Arizona Commission of Indian Affairs, 2002-2003 Annual Report, p. 12.
20
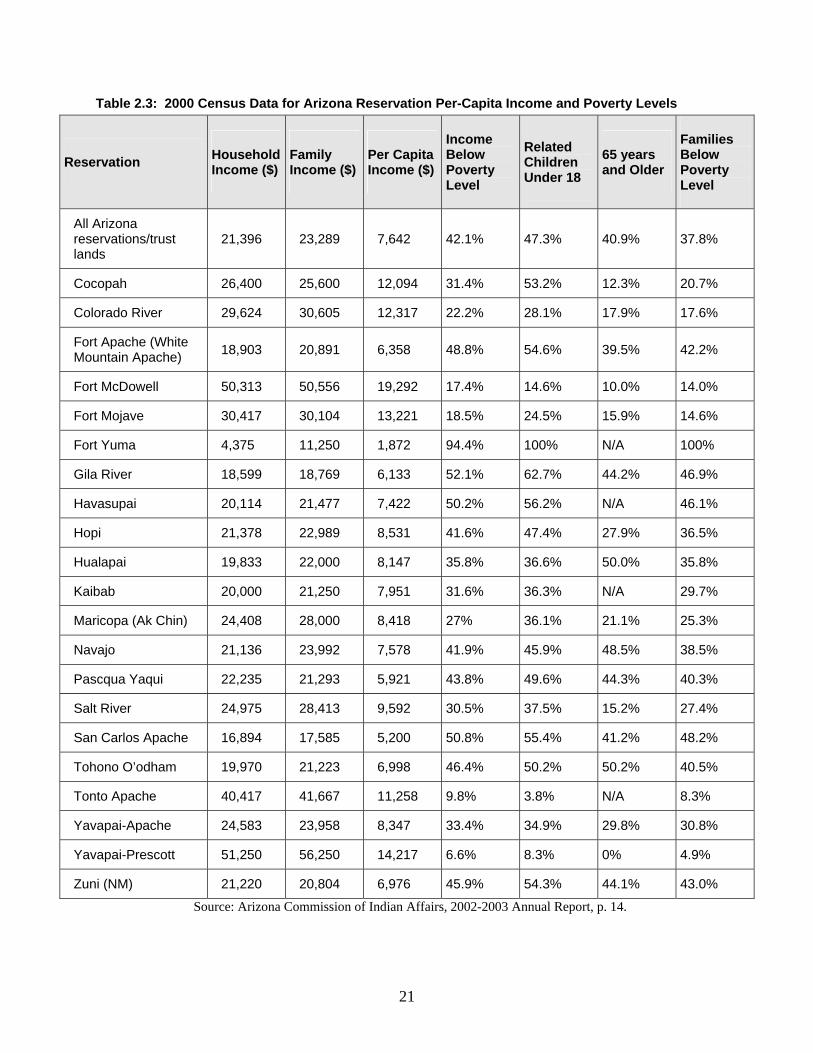
Table 2.3: 2000 Census Data for Arizona Reservation Per-Capita Income and Poverty Levels
Reservation Household Income ($)
Family Income ($)
Per Capita Income ($)
Income Below Poverty Level
Related Children Under 18
65 years and Older
Families Below Poverty Level
All Arizona reservations/trust lands
21,396 23,289 7,642 42.1% 47.3% 40.9% 37.8%
Cocopah 26,400 25,600 12,094 31.4% 53.2% 12.3% 20.7%
Colorado River 29,624 30,605 12,317 22.2% 28.1% 17.9% 17.6%
Fort Apache (White Mountain Apache) 18,903 20,891 6,358 48.8% 54.6% 39.5% 42.2%
Fort McDowell 50,313 50,556 19,292 17.4% 14.6% 10.0% 14.0%
Fort Mojave 30,417 30,104 13,221 18.5% 24.5% 15.9% 14.6%
Fort Yuma 4,375 11,250 1,872 94.4% 100% N/A 100%
Gila River 18,599 18,769 6,133 52.1% 62.7% 44.2% 46.9%
Havasupai 20,114 21,477 7,422 50.2% 56.2% N/A 46.1%
Hopi 21,378 22,989 8,531 41.6% 47.4% 27.9% 36.5%
Hualapai 19,833 22,000 8,147 35.8% 36.6% 50.0% 35.8%
Kaibab 20,000 21,250 7,951 31.6% 36.3% N/A 29.7%
Maricopa (Ak Chin) 24,408 28,000 8,418 27% 36.1% 21.1% 25.3%
Navajo 21,136 23,992 7,578 41.9% 45.9% 48.5% 38.5%
Pascqua Yaqui 22,235 21,293 5,921 43.8% 49.6% 44.3% 40.3%
Salt River 24,975 28,413 9,592 30.5% 37.5% 15.2% 27.4%
San Carlos Apache 16,894 17,585 5,200 50.8% 55.4% 41.2% 48.2%
Tohono O’odham 19,970 21,223 6,998 46.4% 50.2% 50.2% 40.5%
Tonto Apache 40,417 41,667 11,258 9.8% 3.8% N/A 8.3%
Yavapai-Apache 24,583 23,958 8,347 33.4% 34.9% 29.8% 30.8%
Yavapai-Prescott 51,250 56,250 14,217 6.6% 8.3% 0% 4.9%
Zuni (NM) 21,220 20,804 6,976 45.9% 54.3% 44.1% 43.0%
Source: Arizona Commission of Indian Affairs, 2002-2003 Annual Report, p. 14.
21
III. Testimonials from Arizonans about the Continuing Need for the Voting Rights Act
Project staff interviewed election officials, community leaders and activists, and voters in Apache and Pima Counties, which each have large populations of American Indian and Hispanic voters. The two counties were selected to supplement the separate voter surveys conducted in Coconino and Maricopa Counties during the November 2004 presidential election and the telephonic voter survey conducted in Maricopa County from December 2004 until March 2005.
A. Apache County Voters
Apache County has a storied history of discrimination against American Indian voters which has been documented by the United States Civil Rights Commission and a series of court decisions discussed in this report. Demographics for Apache County are likewise included in this report.
This section includes testimonials from ten members of the Navajo Nation who live in Apache County. Their life stories may differ, but they all agree on one thing: The Voting Rights Act has made a significant impact in their ability to participate in elections, and continues to be needed so they will have full access to voting in the future.
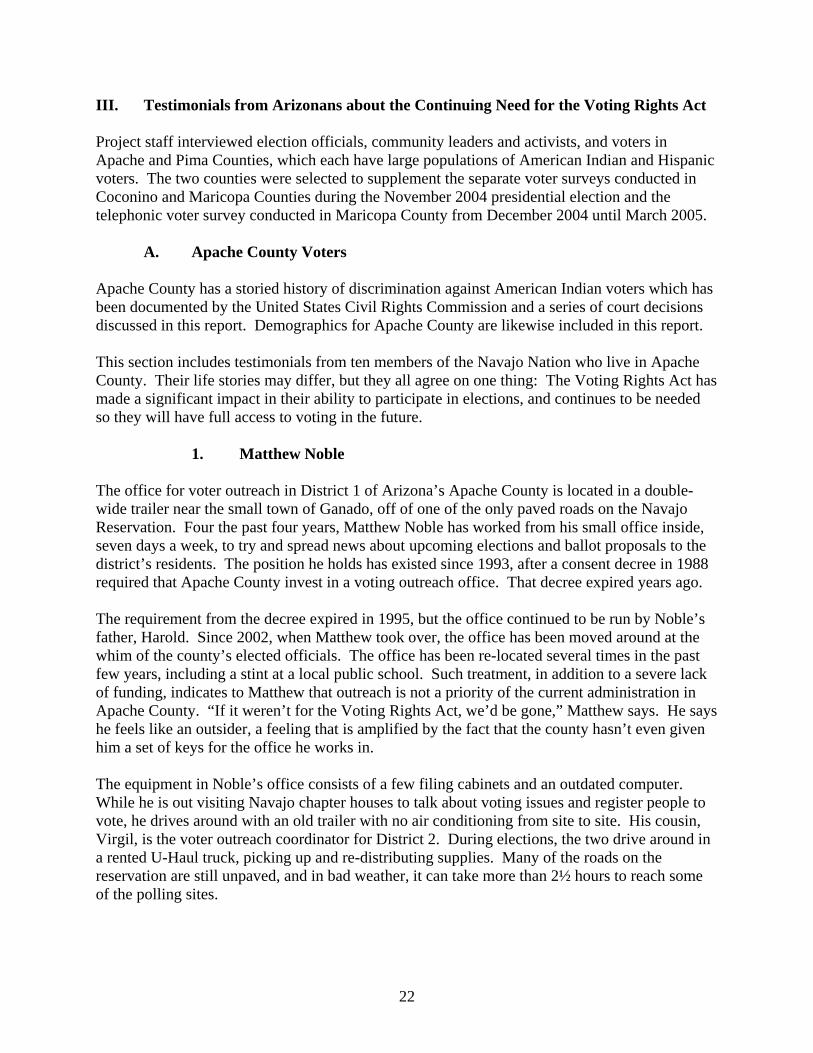
1. Matthew Noble
The office for voter outreach in District 1 of Arizona’s Apache County is located in a double-wide trailer near the small town of Ganado, off of one of the only paved roads on the Navajo Reservation. Four the past four years, Matthew Noble has worked from his small office inside, seven days a week, to try and spread news about upcoming elections and ballot proposals to the district’s residents. The position he holds has existed since 1993, after a consent decree in 1988 required that Apache County invest in a voting outreach office. That decree expired years ago. The requirement from the decree expired in 1995, but the office continued to be run by Noble’s father, Harold. Since 2002, when Matthew took over, the office has been moved around at the whim of the county’s elected officials. The office has been re-located several times in the past few years, including a stint at a local public school. Such treatment, in addition to a severe lack of funding, indicates to Matthew that outreach is not a priority of the current administration in Apache County. “If it weren’t for the Voting Rights Act, we’d be gone,” Matthew says. He says he feels like an outsider, a feeling that is amplified by the fact that the county hasn’t even given him a set of keys for the office he works in. The equipment in Noble’s office consists of a few filing cabinets and an outdated computer. While he is out visiting Navajo chapter houses to talk about voting issues and register people to vote, he drives around with an old trailer with no air conditioning from site to site. His cousin, Virgil, is the voter outreach coordinator for District 2. During elections, the two drive around in a rented U-Haul truck, picking up and re-distributing supplies. Many of the roads on the reservation are still unpaved, and in bad weather, it can take more than 2½ hours to reach some of the polling sites.
22

“It comes from the heart,” he says. “You’ve got to love to talk to the people, or you won’t make it.” In spite of the logistical obstacles, Virgil and Matthew have made much progress toward making sure every registered voter gets a chance to exercise their right to vote. They spend hours translating every proposition from English to Navajo, a process which is made even more complicated by the lack of government vocabulary in the Navajo language. Fortunately, the pair have a glossary, started by Harold Noble, to guide them, but there are still many language barriers that are hard to anticipate, much less resolve. “A few years ago, there was a proposition on the ballot to legalize marijuana,” Matthew says. “The way it was worded allowed for four ounces. We don’t know how much four ounces of marijuana is, so we tried measuring four ounces of spices from our spice rack. Then we put it in a drinking cup, and saw that it filled it up about halfway. So we translated four ounces as ‘half of a drinking cup.’” Their translations are then delivered to the residents of the reservation in several forms. Printed pamphlets are distributed at the chapter houses, where Matthew and Virgil also travel on meeting days to explain the propositions and answer questions. The translations are also read in Navajo over radio stations such as KTNN, KNDN, and KGLX. The biggest problems the two workers anticipate in the near future relate to Proposition 200. Even filling out the new elections form’s portion on address proves problematic for the Navajo. The closest word for address in Navajo means “place in which you pick up your mail.” Unfortunately for those registering to vote, the place in which many Elderly Navajo pick up their mail is different from what the form requires, which is physical address. If the Elderly are made to understand what is being asked of them, their actual physical address may be miles from any official roads and be hard to draw. In addition to the address issue, many Elderly Navajo do not have any of the accepted forms of identification. Most are without driver’s licenses, and because many were born outside of state hospitals, they do not have birth certificates. While some do have tribal identification cards, those who do not often have no other acceptable form to allow their votes to be counted. Finally, the passage of Proposition 200 may exacerbate a problem that already exists. One of the biggest challenges Matthew and Virgil face is finding enough poll workers to keep polling places running efficiently on voting days. Even when they do have large turnouts of translators for the training days before elections, they do not have enough funding to pay for all of the poll workers needed. Moreover, many of the trainees fail to show up on election days. This problem has been somewhat alleviated by the distribution of audio tapes to polling places, but sometimes even these fail to show up when appropriate. According to Matthew, Proposition 200 will create an even greater need for poll workers. Specifically, the additional identification checks will call for more personnel to help keep lines moving. Matthew and his cousin worry that with their budget already under funded, they won’t be able to hire enough people to keep lines moving while meeting the new requirements.
23
Poll workers work closely with federal observers required by the Voting Rights Act. At first, the federal observers who showed up to help poll workers in Apache County were seen as enemies. Often, they would stand by silently, watching over people’s shoulders as they voted. Now, both sides have come to a mutual understanding, with observers making sure that everyone knows why they are there and poll workers making sure the observers respect voter privacy. Still, an element of tension remains, as Matthew says many of the observers intimidate the poll workers by maintaining rigid requirements for communication. He says that this tension may be resolved if the observers had a better understanding of what was on the paper, and of the delicate nature of translation from English to Navajo. Matthew’s devotion to America is apparent just by walking into his office. Two of his four children are in the military, and the walls are covered in patriotic imagery. His biggest fear for Apache County is that someday he may no longer be able to help maintain everyone’s right to vote. “We’re pushed off to the side,” he says. “We are always seen as a thorn in someone’s side.” 2. Harold Noble In the 1950s, the Navajo people were not voting. Harold Noble remembers when Dwight Eisenhower visited a ceremony in Gallup, New Mexico, with American Indian servicemen in attendance. Eisenhower asked them what they wanted from him in return for their support. They replied that they wanted to be treated equally; they didn’t want to be separated based on their skin color in the restaurants and bars. They wanted to vote. Eisenhower promised, “When I get into office, you will vote.”
“The Voting Rights Act is very necessary,” says Harold. The Department of Justice sued Arizona and Apache County for discrimination against American Indians, which resulted in a consent decree in 1989. Until 1993, Apache County was in the dark about voting when Harold started working as a voter outreach official. At that time, there was a lack of outreach and information on elections for the Navajo citizenry.
The first time Harold translated an election pamphlet from English into Navajo, it took him an entire month. When it was electronically recorded in Navajo for the bilingual poll workers, since the language is historically oral, the duration of the translation was 37 hours from start to finish. Harold called the Department of Justice (DOJ) and said, “We need to talk, we can’t translate Navajo word-for-word. It takes too long!” From that point on, Harold would translate the title and legislative analysis of ballot initiatives instead of translating word-for-word; he would do an interpretation and look for meaning. According to Harold, it’s no wonder that Navajos don’t understand the complicated initiatives, because even the lawmakers themselves don’t.
As the newly appointed Apache County voter outreach official, Harold knew that in order to improve voting conditions for the Navajo he would have to first: 1) educate himself on the issues, initiatives, and local politics; and 2) educate the people – “The Navajo people need to be
24
informed in every election.” In 1993, he started translating the Navajo Language Election Glossary, which is an effort to make the Navajo election terminology as uniform as possible across the county. Around the same time, voters started noticing “strange people” at the polling places. These people were actually federal observers from the DOJ. Although having the DOJ federal observers watching the election took some getting used to, Harold has no problem with them. In fact, he welcomes them as DOJ should be there to tell the county what they are doing wrong, and how they can improve. For the first time, Navajo citizens came into the elections office and asked if they had a right to run in the elections. Today, more Navajos are beginning to run, and the current county officials are becoming uneasy because of the new challengers.
Although the consent decree has technically expired, the DOJ assures Harold and the current outreach workers that the improvements in the county will continue to be built upon. “There is still a lot of work to be done,” says Harold. The county is more than 11,000 square miles, making reaching and informing every voter difficult to do with only a few full-time outreach workers. It is important to Harold that everyone be able to understand the issues and vote, and that everyone hears the same thing. That is becoming more of a reality now that issues are being explained in both English and Navajo.
It is difficult for people to travel in the area; many people do not have four-wheel drive, which is essential in order to travel on the unpaved roads. It is especially difficult in bad weather, and most people would rather stay in than brave the roads and weather to vote. Even though people have the option of early voting, it is very difficult for Navajo-speakers to do so by themselves. They need the outreach workers to explain the concept to them. The Elders will often bring their early voting ballot to the outreach office on Election Day to ask for help, too late for their vote to be counted.
“Everybody lines up for assistance – young and old.” In the elementary and high schools, there is very little access to information about voting. Apache County participated in “Kids Vote,” with much success; however, the county has since stopped the program. There are some people in the area who do not have much education. Harold only attended school up to seventh grade. He grew up in the 1930s and 1940s, when times were even harder for the Navajo. There were a lot of problems with the school system. There was not much transportation, and the elements prevented many people from traveling. If someone was lucky enough to get to school, he or she would “just be taught to say ‘yes and no’.”
Although there are still problems, things are getting better. Because of the efforts of the outreach office, the Navajo are finally talking about their current situation and the issues facing them. One of the topics of discussion is the Proposition 200 voter identification requirements. According to Harold, the proposition is “scary, not needed here, and makes things too complicated.” It definitely discourages people from going to the polls. It is not needed because people already have to show either their driver’s license or Navajo Nation I.D. (which costs $5). Everybody knows everyone else at the polls, and Harold has never observed or heard of anyone voting twice. Proposition 200 has a disproportionate impact on Elders, most of whom do not have a photo I.D. driver’s license or a birth certificate. Navajo Nation members can get a
25

certificate for the Navajo elections, but they still have to vote by provisional ballot for non-tribal elections because there is no picture on the certificate. Problems also arise when people get married and a woman changes her last name, but not her I.D. 3. Alice Anderson Alice Anderson splits her time between Montana, where her husband lives, and her home, the Navajo reservation in Apache County, Arizona. She has been voting at the St. Michael’s chapter house since 1970, and says she’s seen lots of changes. She said sometimes this can be a source of confusion, as they change the voting form almost every year. Anderson is fluent in Navajo, but also speaks English, so she rarely has a problem voting, though she does say that a lack of personnel at the polling places leads her to believe that it would be hard for anyone who didn’t speak English to vote in Apache County. One of these people is her father, Ben Francis. Francis doesn’t speak or read English at all, but cares deeply about politics. Since officials do not care enough to come out and explain things to the Navajo speakers, Anderson says, Francis asks Anderson and her sister to read him the paper in the mornings so he knows what’s going on. “There should be a tribal representative to explain voting,” she says. “The Elders don’t know what’s going on – there’s not enough help.” 4. Felicia Tsosie Felicia Tsosie has only been voting for the past ten years, but during that time, she has had the opportunity to observe many problems with voting in Apache County. She says that older people in the tribe, especially the ones that do not speak English, have difficulties voting. Often, they’ll only fill out a few of the issues, and leave the ones that they do not understand blank, she says. As one of the more experienced workers at a hotel in Window Rock, Tsosie often talks to the younger workers about voting. She says she tries to tell them how important it is to vote so that their rights are protected. Tsosie votes at a precinct combining the Ft. Defiance and Window Rock areas, which leads to long lines. While voters stand in line to get to the polls, they are frequently yelled at by supporters of propositions or candidates, who are technically breaking the law, but are never stopped. The wait can take hours, she says, especially since more young people have started to turn out to vote. Tsosie says that the people she knows pay more attention to local government than the larger elections, not just because they think they have more of an impact on their lives, but also because the tribal governments make much more of an effort to reach out to everyone.
26

5. Stella Begay Stella Begay works at a museum and library in Apache County, a building with an auditorium that also serves as a gathering place for various groups on the reservation. She has been voting for the past 15 years in both United States and tribal elections in the Sawmill district. She says that people are generally more interested in local and tribal issues, and more people show up at her polling place for the tribal elections than the state or federal elections. This is despite the fact that the Navajo Nation requires voters to register every four years, she says. Begay says reservation voters face some unique barriers. She says that in addition to language issues, many Navajo live far from paved roads. If the weather is bad, the roads can become treacherous or even useless. When they do get to the polling places, help for illiterate people fluctuates – sometimes there are helpers, sometimes there are not. In general, though, Stella says that in the past ten years, elections have been getting better. Though there seemed to be fewer people in the last few years, more people have been showing up, and more Navajo were running for office, even women, a practice that was formerly severely frowned upon. And elections are certainly better than when her mother, Nellie Begay, began voting. Stella says her mother would tell her of how in past elections, the Navajo would be put into a room, with votes taken by raised hands. 6. Ernestine Reeder Ernestine Reeder grew up on the reservation, fluent in Navajo. When it came time to raise her own son, she thought it was more important for him to learn English. She is now being considered as a principal for a new school Arizona State University is building on the reservation, and says that education is one of the primary barriers Navajo face when they go to the polls. “They translate the ballots into Navajo,” she says. “But people who only speak Navajo usually don’t know how to read it.” With illiteracy still a problem, she says that interpretation is a major issue. But even those who speak English need more outreach, she says. Reeder says that the propositions are often written in ways that are hard for many Navajo to understand. “We’re not attorneys!” she says. The polling places themselves are often problematic, too, she says. Precincts change without much notice, and during the last election, Reeder didn’t even vote after spending hours waiting in lines, only to be told she was at the wrong place. Troublesome roads also prevent people from coming. “Government officials come out here and talk about issues in the Third World,” she says. “I don’t think they realize that in a lot of places here on the reservation, people are living in the Third World.”
27
7. Rose Williams Rose Williams is a poll worker in Apache County. She is an Elder and speaks both English and Navajo fluently. She remembers when American Indians voted for the first time. After Eisenhower took office and the Navajo were enfranchised, the Republican registrars came to Apache County and gave the Navajos a pink sheet to vote for one candidate and a blue one for the other. Since that point, voting conditions for American Indians have been improving. Rose feels that there has been a great stride forward with the establishment of the voter outreach office in Ganado because of the consent decree. “This is just the beginning.” Speaking from her experience as a poll worker, Rose knows that as long as there is ballot language that needs to be translated and explained, outreach workers will still be needed. The current resources provided to the outreach workers are not enough, however. Funding is a big issue, and “the county’s answer is to shut the office down.” The office needs better equipment so it can relay information to the Navajo, instead of relying on information coming from St. Johns, one hundred miles away. Funding is also needed in order to provide more poll workers, because long lines at the polls are always a problem, and often discourage Elders who do not want to wait outside in the elements to vote. More poll workers will be needed to check I.D.s because of the new Proposition 200 voter I.D. requirement. With limited funds already, Rose does not know how this will be feasible. Ganado is the center of tribal life. According to Rose, there needs to be a permanent outreach base, not subject to the whims of local politics, “so the Navajo people know where to go.” Since the consent decree expired, the outreach workers have had to vacate the office because they were “taking up space.” They moved into a spare room in a local school, but when a new superintendent was elected, they were forced to move because they were again “in the way.” The poll workers know that there is no alternative though; it has to be there for the people. In addition to a permanent base, the county also needs more outreach workers. Two full-time employees are not enough for such a large county. More outreach workers would mean that more citizens would be informed on issues, initiatives, and candidates. Rose believes that problems with voting are a symptom of larger problems. The Navajo Nation holds special status with the U.S. government because of its dual sovereignty. The tribe abides by the Trust signed in 1868, and they want the government to hold up to its end of the bargain. The Navajo cannot even buy the land they live on – it is owned by the federal government. Because of that, they do not have any rights to minerals or any other resources that may be found on their land. Rose wants “President Bush to do something out here” for American Indians: to educate and empower America’s first people. The Navajo people need good housing, grocery stores, and healthcare: “People are suffering.”
She reflected on how the government built up Hiroshima after destroying it, and how it is building up Iraq and other Third World countries. Many Navajo still live in impoverished conditions, with inadequate education, food, water, and healthcare. “What about the Navajo? The Third World is right here, right in America’s backyard.”
28

8. Lee Chee Lee Chee has been voting since 1975, when he moved from San Francisco back to Chinle in Apache County with his wife. A true patriot, he served from 1966 to 1967 in Vietnam as a member of the 1st Infantry. He proudly dons his veteran’s 1st Infantry hat wherever he goes, despite having lost much of his hearing due to his service to his country. He was on burial detail, giving last respects to his fellow Navajo who had served in the war and gave the ultimate sacrifice to their country. Fluent in both Navajo and English, Lee is dissatisfied with his Navajo council delegates, and local and U.S. representatives. “Every time they want some votes, they run to us veterans. We vote for them because we believe in what they’re saying, we believe the promises. But once we vote, that’s always the last we see of them.” He believes that there is no accountability, but still thinks that ballot box is the most powerful weapon people can use to affect change. He recently attended the Diné (Tribal) Change 2006 conference, which focuses on initiating change within the Navajo government. In addition to being an active citizen, he religiously reads the newspaper to stay up-to-date on issues facing his people, so he can be informed when he goes to vote. When voting, Lee notices that many of the other Elders need assistance. “A lot of Elders don’t know English, so there needs to be someone there to help them.” Sometimes Lee will see bilingual poll workers helping. Other times, there is no one to help the Navajo speakers. He said that there are also people who can speak English, but are illiterate, and they need help understanding what they are voting for as well.
Lee suggests that there be more voter outreach to those who cannot read or speak English well. For example, more bilingual outreach workers need to be hired so they can reach the community chapter house meetings. This way, when people go in to vote, they will already be informed and educated on the candidates, issues, and initiatives beforehand. 9. James Henderson Former Arizona state Senator James Henderson was one of the first American Indians in the state legislature. Born in 1942, Senator Henderson did not start paying attention to voting and voter outreach issues until he was elected to serve in the 37th Legislature in 1985. He said that like most Navajo people, “I just voted for whoever sent the most pamphlets…because that’s all I had to base my choice on.” At that time, there was no voter outreach office, and no one who would come to chapter house meetings to inform and educate the Navajo on issues. This can be a major issue for Navajo speakers and people who cannot read or write English because candidate pamphlets are in English. He also said that there are not enough bilingual poll workers to accommodate the Navajo speaking population. 10. Alfred Lee Kahn, Sr. Alfred Lee Kahn Sr. has lived in Apache County his whole life. From the time he was young, he was told, “If I vote, then I can get the resources from the chapter, local, state, and national
29
government.” He worked in construction for a number of years, and is now employed as a nurse’s aide and helps out at his local chapter house as a community organizer. Alfred has been voting since he turned eighteen, about thirty years ago. He says that one of the biggest barriers to voting is education. “People don’t have rights around here, especially the Elders and uneducated.”
Many Navajo are uneducated, about the issues, and in general. It is not just Elders who are illiterate; many of the younger people can barely read and write. He and his children are lucky enough to have received an education; his daughter Seowah recently received her G.E.D from a program though a community college in Ganado, and hopes to pursue a college degree in environmental engineering.
Political disillusionment is also a problem. Every election season, candidates will come to the local chapter houses and ask members to vote for them, in return for the candidate keeping promises. This is the only time the tribe will see the candidates, though. Once election season is over, the Navajo never see them again and the promises are never kept. Despite the disillusionment over candidates, more Navajo are participating in politics than ever before. Alfred holds his right to vote close to his heart – it is his way of creating change. “My right to vote makes me more of a person. I am counted. I am more of a citizen.”
B. Pima County Voters
Pima County is the second most populous county in Arizona, bolstered by the growth of Tucson and its suburbs. It is home to a large Latino population, in addition to the Tohono O’odham and Pascua Yacqui Indian Reservations. According to the 2000 Census, Pima County has a total population of 843,746 persons, of whom 29.3 percent (247,578 persons) are Hispanic and 3.2 percent (27,178 persons) are American Indian. The County has a voting age population of 635,850 persons, of whom 24.9 percent (158,415 persons) are Hispanic and 2.7 percent (17,338 persons) are American Indian. Among the Hispanic voting age population, 31.0 percent (49,205 persons) are limited-English proficient. Among the American Indian voting age population, 19.5 percent (3,525 persons) are limited-English proficient. Nearly one-third (1,670) of the voting age citizens on the Tohono O’odham Reservation are limited-English proficient. Nearly one-fifth (280) of the voting age citizens on the Pascua Yacqui Reservation are limited-English proficient. The illiteracy rate for both tribes is approximately ten percent, which is more than seven times the national illiteracy rate. 1. Manuel “Manny” Herrera
Manuel “Manny” Herrera, a 79-year-old retired postmaster, has lived in the same neighborhood in the city of South Tucson for more than 50 years. Manny’s family is of Hispanic descent, but he is of the fifth generation to be born in Tucson. A World War II veteran, Manny has invested a lot of time and effort into making sure his community stays active in the political arena.
30

Manny said his experience in politics began when he was young. He said he remembers attending political rallies in local parks where politicians would distribute beer to the adults and the kids would run around and have fun. He said he and his wife, Yolanda, registered to vote as soon as they turned 21. “We’ve been voting ever since,” he said. “We felt we could make a difference but we had to get involved.” Manny said he remembers voting being more difficult for people who did not speak English when he was younger, because fewer materials were available for them. But Manny said language has not been an issue in recent elections as it had been in the past. Newspapers, radio shows, fliers, and voting materials are all offered in English and Spanish these days, he said. He also said polling places in his area are close enough for everyone to get to. The only drawbacks are insufficient parking and a slight socio-economic barrier. He said many workers who are paid hourly can’t afford to take the time off work to vote.
While obstacles for language minority voters have decreased overall, Herrera said the media portrays candidates negatively, so many people do not want to vote. The solution to this, Herrera said, is to get rid of the view that one vote doesn’t make a difference. “If more people were involved, it could be a different community, a different town, a different state or a different world,” he said.
To help make a difference, Manny formed the Sunnyside Neighborhood Association — a group that hosts meetings and speakers to advertise for important issues in one square mile of South Tucson — to encourage people to get involved in their community and vote. Together with a friend and fellow WWII veteran, he also created the All-American Student Awards in the mid-1990s to award children in the community for their commitment, community service and respect toward the community. After the program drew more attention, Manny gained support from community and state leaders, including Gov. Janet Napolitano, Tucson Councilmen Steve Leal and Jose Ibarra, and Mayor Laila Sarah, who give certificates to the award recipients “so [the children] can follow in their footsteps,” he said. “Involvement is voting,” he added. “Who else is going to lead us in the future?” 2. Steve Leal Steve Leal, a Tucson city councilman, has lived in Tucson since 1977. He says that through his experience as a councilman, he has seen many barriers restricting minority voters in the past decades.
The first obstacle, he said, is the ever-changing location of polling places. He said Tucson rents out local schools and churches to host polling places, but sometimes these locations will not renew their contracts with the city. Leal said this often confuses voters who have been going to the same polling place for 10 or more years. Instead of looking for their new polling place, they often do not vote, he said.
Leal said there is often a language barrier for minority voters as well. “Not all candidates go out of their way to have things done bilingually or to advertise either in Latino papers or radio,” he said. This discourages people who do not speak English very well from voting, he added.
31

He also said he has been trying to get Spanish subtitles on the local Tucson news channel for more than six years. Leal said many people make important decisions on who to vote for based on how they have seen that candidate in the news coverage. “[Hispanics] have the right to vote. Do we not want them to make an informed choice?” he asked. He said this solution may not be appropriate for all communities, but in Tucson where there is a large Hispanic population, it could solve a lot of problems. 3. Alex Rodriguez Alex Rodriguez, a native to Arizona, was the youngest of ten children in an immigrant working class family. The first in his family to attend college (he received his B.A. from the University of Arizona and his masters of public policy from Harvard), Alex has been involved in many Pima County organizations, including the University of Arizona Hispanic Advisory Council and the Tucson Hispanic Coalition.
Alex has also worked as the U.S. Department of Defense International Policy Advisor and in International Security Affairs. He is currently running for U.S. Congress.
As a minority citizen who has often run for public office, Alex said, “The Voting Rights Act is a landmark piece of legislation for our promised democracy. It is crucial for minorities.”
But Alex said there are many barriers for Hispanic and other minority candidates who choose to engage in the political process by running for office.
Minority populations are often diluted, he said. He cited Proposition 200—the legislation passed in 2004 that requires specific forms of identification in order to vote—as a large impact on minority voters. “It has had a impact on citizens’ willingness to participate in the political process,” he said. While it has created a barrier for all voters by requiring additional identification, it has been an extra burden on minorities, he added. He said one would expect that more people would want to participate by voting in order to change the face of the nation. But Alex said “drastic measures” like Proposition 200 have had an opposite effect.
Another barrier barring minorities from having easy access to voting is the language on the ballots, Alex said. He said there are two issues surrounding the language.
First of all, ballots should be offered in Spanish and other minority languages, he said. While he believes American citizens should learn and be able to speak English, he said it is often easier for native Spanish speakers to understand materials when they are written in Spanish. “My mom would rather read something in Spanish that she could fully understand,” Alex said. “She’s a citizen just like your mom, but she is unable to understand what is being asked of her as a citizen.”
The second language issue is that the ballots are often too difficult to understand even for native English-speakers. He said when he votes, he asks himself if his brother or his neighbor would understand the ballot. In general, the answer is no, he said. “The language is much too complex,” he added. “You would get a lot more people involved in the political process if you
32

gave them the confidence of going into a polling place and understanding what they’re looking at.”
In addition to language barriers, there are often economic barriers to voting. Alex said there is a general lack of outreach to the less-wealthy, minority communities because the candidates have less at stake in those communities. Also, the voters have less at stake in the political process, he said. “The higher [a person’s] income, the higher their propensity to vote because people have economic interests at stake in the political process,” Alex said.
Though there are problems in the voting process in Arizona, Alex said the Voting Rights Act has helped. He compared the VRA to major accomplishments in U.S. history such as the abolishment of slavery, the interstate system, and public education.
“We’ve always gotten the big things right,” he said. “The Voting Rights Act is a big thing.” III. Survey of Voters in Coconino and Maricopa Counties
A. Purposes of the Survey This section describes a study of voters in Coconino and Maricopa Counties, designed to obtain the perspective of affected voters who voted on November 2, 2004 throughout the state of Arizona; assess the need for minority language assistance among voters; determine the availability and quality of oral and written assistance; and assess the effectiveness of the practices of public elections officials in providing oral and written language assistance to voters.
The study assessed the need for, the availability and quality of, and the effectiveness of assistance by surveying several different areas about the voter or the election process: the ethnicity and nation of origin of voters; the primary language spoken at home; the oral and written English language ability of voters; the voters’ need for language assistance on election day; oral language assistance at every stage of the election process; written language materials provided to limited-English proficient voters; and the ability of voters to receive assistance from the person of their choice. These areas were selected because they commonly affect minority language assistance voters or because they are common components of successful language assistance programs. Finally, respondents were asked their opinion of the quality of the language assistance provided to them in their primary language, and what could be done to improve written and oral language assistance provided to non-English speaking voters. A total of 829 surveys were completed by voters, including 668 in Maricopa County and 161 in Coconino County. Of these 829 completed surveys, 679 were completed on Election Day and 150 were completed through the telephonic survey that followed Election Day.
B. Overview of the Survey
Voter interviews were conducted on November 2, 2004 at polling locations in Coconino County in Arizona for American Indian language minority groups; and Maricopa County for Spanish
33

language minorities. In addition, telephonic interviews were conducted in February and March of 2005 in Maricopa County precincts surveyed on Election Day, to capture the large number of voters who cast early or mail-in ballots.
All survey questions were derived from the Voting Rights Act, the legislative history of the Act, Department of Justice guidelines, and commonly used Census terms.
The survey was designed to provoke honest answers from respondents about their actual election and voting experiences. Interviews were conducted in English, Spanish, or Navajo by bilingual volunteers. Survey questions were worded carefully to avoid skewing the results and were designed to take less than five minutes of the voters’ time. Non-leading questions were used in combination with a non-exhaustive list of possible responses. Respondents were encouraged to provide amplifying information by checking “other” and specifying responses not included in the survey. Several attorneys, voting rights experts, and social scientists with experience enforcing the language assistance provisions reviewed the survey questions. Early versions of the survey were also reviewed and approved by bilingual experts fluent in election terminology. All of the resulting suggestions were incorporated into the final version used in the study.
All references to Navajo voters refer to voters surveyed in Coconino County and all references to Hispanic voters refer to voter surveyed in Maricopa County.
C. Survey Questions
The Election Day voter survey and the telephone survey both consisted of twenty-two questions and were nearly identical. The only deviation arose if the respondent to the telephone survey did not vote in the November 2004 election. The survey questions were simple enough that responding voters could complete the entire survey in as little as five minutes. Respondents were advised of the likely short duration of the interview to decrease the burden on them and thereby increase the overall response rate. English and Spanish versions of the Election Day voter survey are included as Exhibit C. Question 1 of the survey requested information about whether the respondent was able to vote that day (November 2, 2004) and what method they used; whether they have ever experienced problems voting; any reason why they were not able to vote; and whether they were offered a provisional ballot. For respondents to the telephone survey who did not vote in the 2004 presidential election, Question 1 asked why they did not vote that year and when they had most recently voted. In Questions 2 through 8, respondents were asked to self-identify in several ways. Question 2 asked how they identify their ethnicity, and if they self-identified as Hispanic or Latino, they were then asked for their national origin. Question 3 asked for the respondent’s birth year. Question 4 asked if the respondent was a first-time voter and if not, how long they had been voting in the United States. Question 5 asked for the primary language spoken at home. Questions 6 and 7 respectively asked respondents to describe their ability to speak and read
34

English on a scale that reflects commonly used census terms and that ranges from ‘very well’ to ‘well’ to ‘not well’ to ‘cannot speak English.’ Question 8 asked if any members of the respondent’s household who are older than age 18 speak English very well. Question 9 asked respondents to characterize the poll workers at their polling site in terms of being helpful versus rude/threatening. Questions 10 through 16 are a series of questions aimed to determine how the availability of language assistance for voters can be improved. These questions asked whether language assistance was needed for the respondent to vote that day, and in what ways language assistance was offered to the respondent by election officials. Respondents were also asked to describe the quality of oral and written language assistance that was provided to them by election officials and to respond with suggestions for ways that oral or written language assistance for non-English speaking voters could be improved. Questions 17 through 19 asked the respondent about circumstances in which they may have ever provided language assistance to another voter. Questions 20 through 22 were asked to assess the needs of all voters based on their background, including their method of transportation to the polls that day, their educational level of achievement, and their citizenship status and country of origin. After conducting the interview, the volunteer was instructed to make several notes about their interaction with the voter. They were instructed to note the voter’s gender, whether or not they were accompanied and by whom, their levels of cooperation and understanding, as well as any other information necessary to successfully interpret the interview.
D. November 2, 2004 Survey
In order to accomplish the Election Day voter survey, project staff recruited more than 100 volunteers. Project staff focused recruitment efforts on Arizona State University undergraduate students from the Barrett Honors College and members of campus student organizations likely to have high percentages of bilingual students, as well as on high school students from Coconino County who were bilingual in the Navajo language.
For Maricopa County, project staff divided up approximately 105 volunteers into pairs with at least one volunteer in each pair having some Spanish proficiency. These 105 volunteers were placed at forty-three polling locations for at least one of three shifts on Election Day with each shift lasting three hours. The three shifts took place from 6:00AM-9:00AM, 10:30AM-1:30PM, and 4:00PM-7:00PM. Several volunteers worked more than one three-hour shift, and six of covered precincts had interviewers for two of the three shifts throughout the day.
For Coconino County, a total of thirteen individuals conducted interviews: one thesis project advisor, one thesis project student, two ASU student volunteers, and nine bilingual Navajo students from Page High School. The students’ Navajo language teacher screened them prior to their participation to ensure they were bilingual. The surveys were conducted in two separate
35
teams. The two ASU student volunteers coordinated with the Page group, focusing on five polling sites (three in Page, and two chapter houses on the Navajo Reservation) from 10:00AM-4:30PM. The thesis project advisor and student coordinated the Tuba City group, focusing on four voting precincts at three polling places in Tuba City: the elementary (one precinct), middle (one precinct), and high schools (two precincts) from 11:30AM-3:45PM.
The Maricopa County volunteers were required to attend one out of the five offered training sessions throughout the week prior to November 2, 2004. The sessions lasted approximately one hour and the volunteers were trained on the laws they needed to abide by at the polling places, as well as the rules they needed to follow in order to assure accurate and honest responses from voters participating in the surveys.
The Page High School students were given a similar one-hour training session at Page High School on Election Day.
As part of the voter study, project staff placed interviewers at approximately fifty voting precincts in these two counties. The voting precincts were selected by stratified random sampling. Bilingual interviewers were instructed to select voters at random to be asked a set of questions about their ability to access election information. Interviewers were also instructed to make objective observations of the polling sites, such as the type of assistance provided and the clarity of presented information. The interviews resulted in a total of 679 completed surveys.
E. Post-Election Telephonic Survey
To capture the full range of perspectives of potential voters on Election Day, project staff followed up the Election Day voter survey with a telephonic voter survey in Maricopa County. The intent of the telephonic survey was to account for the fact that the Election Day voter survey would not have reached any of the voters who cast early (mail-in ballots) or registered voters who did not vote at all. This was a factor in Arizona, because in 2004, approximately one-half of all Arizonans voted early in the November election. Additionally, the telephonic survey aimed to reach persons who were not able to vote at all on Election Day, in order to assess whether or not the availability or quality of language assistance was a factor in preventing them from voting.
Project staff obtained phone numbers for registered voters in Maricopa County. Utilizing a portion of the volunteers from the Election Day survey, project staff made telephone calls to approximately two thousand people in nearly fifty precincts of the original precincts covered in Maricopa County on Election Day. These telephone calls took place in an on-campus calling center beginning on December 7, 2004. The calls began again in late February and continued until March 10, 2005. Approximately two thousand attempted phone calls resulted in responses from 150 registered voters because of wrong numbers, calls that went unanswered, persons who already had completed the Election Day survey, and persons who declined to answer the survey questions. Some precincts that were selected for the telephonic survey were chosen because they have a higher percentage of Latino voters. Project staff also conducted a Spanish surname analysis to
36

identify registered voters who were likely of Spanish heritage and who would have a greater likelihood to need language assistance.
F. The Need for Language Assistance
The data compiled from the voter and telephonic surveys shows that there is a continuing need for language assistance during the voting process in the State of Arizona. The survey results corroborate the need for assistance established by the July 2002 Census determinations that resulted in Section 203 coverage of Coconino and Maricopa Counties. See Figures 1.3 and 1.4. The Election Day survey conducted in Maricopa and Coconino Counties asked voters if they required language assistance to vote on Election Day. Among all voters surveyed, 7 percent reported needing language assistance. Among those of Navajo descent, 20 percent reported that they required language assistance in order to vote on Election Day. By comparison, 9 percent of Hispanic voters reported requiring language assistance on Election Day. Under Section 208 of the Voting Rights Act, people who require assistance while voting are permitted to bring any person of their choice (with a few exceptions) into the voting booth. Among those Navajo voters who needed language assistance, 49 percent reported bringing someone along to assist them while voting. On the other hand, 10 percent of Hispanic voters who required assistance reported bringing someone to aid them in the voting process.
Among Arizona’s voting population who needed assistance, 38 percent brought someone with them to assist in voting; the remaining 62 percent relied on government assistance at the polls in order to cast a meaningful ballot. This finding highlights the need for election officials to ensure that language assistance is available for non-English speaking voters at every stage of the election process. It appears that the lower percentage of Hispanic voters who reported bringing someone with them to assist in voting may be because they believed they would be able to obtain language assistance at the polls, as is required by Section 203. Many of these voters reported that assistance was not available to them in Maricopa County. The high number of Navajo respondents in Coconino County who brought someone with to assist them could be a result of many elections being held at chapter houses where there were many Navajo-speaking people available to assist voters. The distance many Navajo voters had to travel to vote combined with the limited availability of transportation meant that many voters came in groups and were able to assist each other. The percentage of voters who have assisted another voter on Election Day is much higher among Hispanic and Navajo voters compared to the general population. Among those surveyed, 29 percent of Hispanic voters and 24 percent of Navajo voters have assisted another voter at the polls. By comparison, 19 percent of all voters surveyed (including Hispanic, Navajo, and non-Hispanic voters) reported assisting another voter.
37

Survey respondents were asked to report their primary language, that is, the language they speak at home. The results showed that 8 percent of surveyed voters reported Navajo was their primary language and 8 percent reported Spanish was their primary language. There is a clear need for language assistance among language minority voting age citizens in Arizona. The data shows that at least 20 percent of surveyed Navajo voters and at least 9 percent of surveyed Hispanic voters require language assistance when they vote. These percentages are actually a little bit lower than the need for assistance identified by the July 2002 Census determinations, probably because of a lower turnout rate among voters who need language assistance. See Figures 1.3 and 1.4. Nevertheless, they confirm that there is a substantial need for language assistance among the language groups covered in Arizona.
G. The Availability of Language Assistance
The Election Day and telephonic surveys revealed that 68 percent of surveyed Hispanic and Navajo voters reported receiving some type of language assistance when voting. Among these voters, 17 percent reported receiving written assistance in the mail, 9 percent reported receiving written assistance at the polls, 7 percent reported receiving a bilingual ballot, 7 percent reported receiving assistance from a bilingual poll worker, 13 percent reported receiving assistance from two or more of these categories, and 15 percent reported receiving language assistance from some other source. The remaining 32 percent of voters reported receiving no language assistance of ant kind. See Figure 4.1.
Figure 4.1
38

Hispanic and Navajo voters from Arizona who speak English as their primary language and voters who speak another language as their primary language were compared according to their perceptions of receiving language assistance on Election Day. Among these voters whose primary language is English, 64 percent reported receiving language assistance, while the remaining 36 percent reported that they did not receive any type of language assistance. Among those voters who speak a primary language other than English, 76 percent reported receiving language assistance and 24 percent reported receiving no assistance. This difference between voters with English as their primary language and voters with a non-English primary language is statistically significant (difference-of-means test: t = 2.34, p < 0.02). Therefore, there is a 98 percent certainty that the primary language spoken by a voter significantly affects his or her perceptions of the availability of language assistance.
This test was repeated in order to compare voters who speak Spanish as their primary language and voters who speak English as their primary language. Among voters who speak Spanish as their primary language, 67 percent reported receiving language assistance. Since this percentage is very similar to the percentage of voters who reported English as their primary language (64 percent), it demonstrates that voters whose primary language is Spanish do not significantly differ in their perceptions of language assistance availability from voters whose primary language is English.
On the other hand, there is a statistically significant difference between voters whose primary language is Navajo compared to voters whose primary language is English. Eighty-one percent of voters with a primary language of Navajo reported receiving some type of language assistance. Therefore, the difference in perceptions of language assistance between English and non-English primary language groups is most likely driven by Navajo-speaking voters.
It appears that there are at least two explanations for why voters whose primary language is Navajo perceive more availability of language assistance than voters whose primary language is either Spanish or English. First, Navajo is not a written language and Navajo-speaking voters therefore must rely exclusively on oral language assistance, unlike Spanish-speaking voters who may have access to both written and oral language assistance. Second, it also appears that although Navajo-speaking poll workers are available in covered polling places for Navajo voters in Coconino County, Spanish-speaking poll workers may not be available in all covered polling places in Maricopa County.
H. The Quality of Language Assistance
The Election Day and telephonic voter surveys also provide information on voters’ perceptions of the quality of oral and written language assistance that is available to them. Perceptions vary slightly based upon ethnicity and primary language used at home. Among Hispanic voters, 44 percent rated the quality of oral assistance as “excellent,” and 54 percent as “good.” Among Navajo voters, 43 percent rated the quality of oral assistance as “excellent,” and 51 percent as “good.”
39
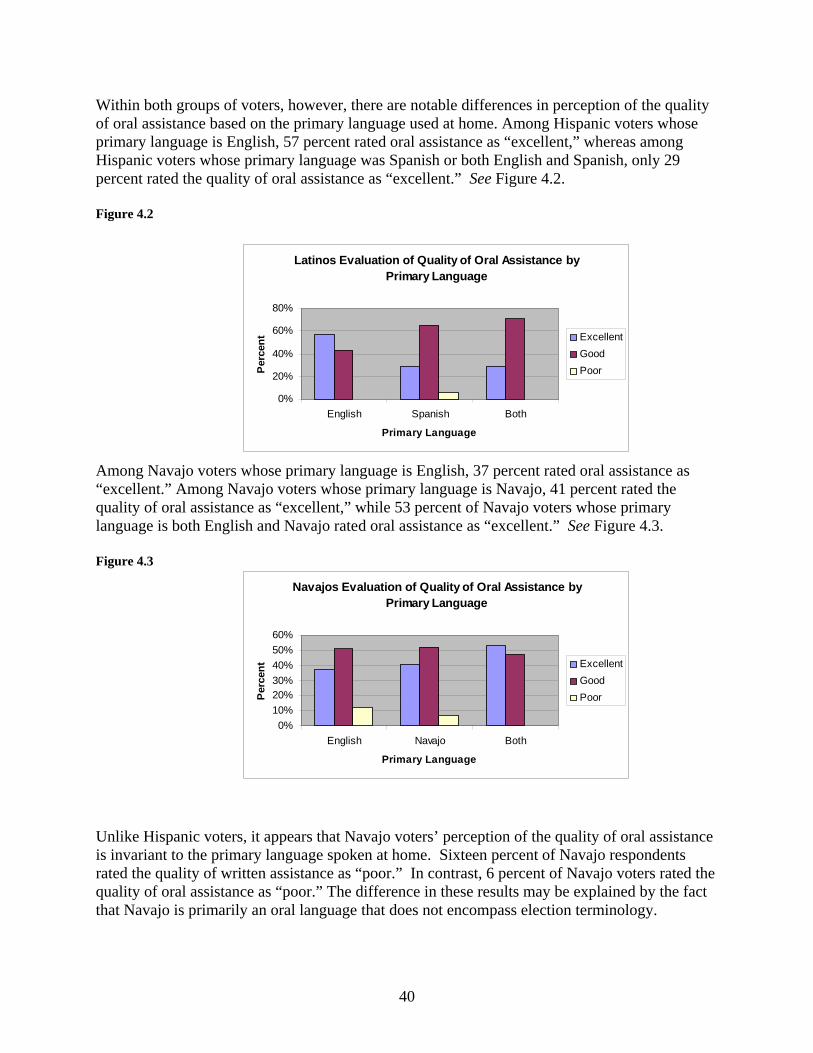
Within both groups of voters, however, there are notable differences in perception of the quality of oral assistance based on the primary language used at home. Among Hispanic voters whose primary language is English, 57 percent rated oral assistance as “excellent,” whereas among Hispanic voters whose primary language was Spanish or both English and Spanish, only 29 percent rated the quality of oral assistance as “excellent.” See Figure 4.2.
Figure 4.2
Latinos Evaluation of Quality of Oral Assistance by
Primary Language
0%
20%
40%
60%
80%
English Spanish Both
Primary Language
Per
cent Excellent
GoodPoor
Among Navajo voters whose primary language is English, 37 percent rated oral assistance as “excellent.” Among Navajo voters whose primary language is Navajo, 41 percent rated the quality of oral assistance as “excellent,” while 53 percent of Navajo voters whose primary language is both English and Navajo rated oral assistance as “excellent.” See Figure 4.3.
Figure 4.3 Navajos Evaluation of Quality of Oral Assistance by
Primary Language
0%10%20%30%40%50%60%
English Navajo Both
Primary Language
Per
cent Excellent
GoodPoor
Unlike Hispanic voters, it appears that Navajo voters’ perception of the quality of oral assistance is invariant to the primary language spoken at home. Sixteen percent of Navajo respondents rated the quality of written assistance as “poor.” In contrast, 6 percent of Navajo voters rated the quality of oral assistance as “poor.” The difference in these results may be explained by the fact that Navajo is primarily an oral language that does not encompass election terminology.
40

Voters were asked their perceptions about the quality of both oral and written language assistance. Their responses are summarized in Figure 4.4. Figure 4.4
No Improvement needed
More Translators Needed/Higher Visibility for
Translators
More Technologically Advanced Use of Media
Assistance Shouldn't Be Available
More Training for Translators/Improve Quality
of Assistance Provided
Simpler Translations
More Languages Provided
Doesn't Identify w ith Question
The data depicted in Figure 4.4 shows that majority of voters who answered this question felt that more translators would be helpful or should have a higher visibility if they were available to assist. The second largest response was that there is no improvement needed on the part of the government in provided both oral and written assistance. Some other responses listed in order of highest to least amount or responses include: more training for translators/improve quality of assistance provided, assistance should not be provided, more technology/advanced use of media, more languages provided, does not identify with question, and simpler translations. Overall, the quality of language assistance available to voting age citizens in Arizona’s covered languages can be improved significantly. V. Voting Discrimination in Apache County
A. Background and Demographics
Apache County is home to the Navajo Nation, the most populous Indian Reservation in the United States. In addition, the county is home to the Apache (located on the Fort Apache Reservation), and the Hopi (located on the Zuni Reservation).
41

Apache County is, in acreage, the third largest county in Arizona, but by population is the tenth largest. According to the 2000 Census, Apache County has a total population of 69,423 persons, of whom 76.9 percent (53375 persons) are American Indian. The county has a voting age population of 42,692, of whom 73.7 percent (31,470 persons) are American Indian. In the 1990s, Apache County’s American Indian population was one of the fastest growing in the United States, growing by more than 11 percent, a net increase of over 5,000 citizens.
The county’s population density is extremely low, with an average of just six citizens per square mile. By comparison, Arizona’s average density is 45 people per square mile, and Phoenix’s density is almost 3,000 people per square mile. Even in Apache County’s seat, St. Johns, the most densely populated area of the county, the average density doesn’t exceed 500 persons per square mile.
Apache County is one of just three counties in the United States in which the predominant languages spoken are American Indian. Of these languages, the most commonly used is Navajo, a historically unwritten language. As a result of its demographics, over one-third (11,175) of the voting age citizens on the Navajo Nation Reservation are limited-English proficient. Over one-quarter of the voting age citizens on the Navajo Nation Reservation are illiterate, which is nearly nineteen times the national illiteracy rate. See Figure 1-4.
American Indians in Apache County have been the victims of voting discrimination since the County was organized in 1879. Some of the key voting cases in the county in the last three decades are described below.
B. Shirley v. Superior Court for Apache County (1973)
In 1973, the Apache County Board of Supervisors (the county’s three-member governing body) obtained a permanent injunction preventing Tom Shirley from assuming his office as a County Supervisor from District 3. Shirley was an enrolled member of the Navajo Indian tribe, residing on the portion of the Navajo Indian Reservation in the County’s Supervisorial District Number 3.
In the November 1972 election, Shirley had soundly defeated his non-Indian opponent by a margin of approximately three to one. Nevertheless, the Board of Supervisors refused to certify Shirley as duly elected. The unsuccessful non-Indian candidate brought an action against the county Board of Supervisors seeking an injunction restraining the board from certifying that Shirley had been elected. The Superior Court agreed, holding that Shirley was ineligible to serve as a supervisor because he was immune from service of process while on the reservation, he did not own any real or personal property subject to taxation by the state of Arizona, and he had been a trustee for the Apache County School District at the time he was elected (though he resigned within three weeks after his election).
In Shirley v. Superior Court, the Arizona Supreme Court reversed the Superior Court’s decision.34 The court first noted that in light of its 1948 decision in Harrison v. Laveen,35 34 109 Ariz. 510, 513 P.2d 939 (Ariz. 1973). 35 67 Ariz. 337, 196 P.2d 456 (Ariz. 1948).
42
Indians who lived on a reservation, such as Shirley, were eligible to vote and therefore qualified to run for office. The court further held that Shirley was not disqualified from serving because he was a school trustee for two reasons. First, he had resigned well before the time of assuming office in January 1973. Second, the unpaid position of school trustee was not a conflicting “public office,” and Shirley therefore could remain in that office without being disqualified as Supervisor.
The court rejected out of hand the remaining reasons cited by the Superior Court for disqualifying Shirley. The fact that he was immune from service of civil process did not negate the fact that he was subject to recall like any other state officer. The court also dismissed the lower court’s reliance on the argument that Shirley was not subject to state taxation, observing, “That Tom Shirley is not a taxpayer has been declared no obstacle to voting or holding office. The Supreme Court of the United States has resolved this question ….” Accordingly, the Arizona Supreme Court vacated the Superior Court’s injunction and directed the Apache County Board of Supervisors to certify Shirley as the elected supervisor of District 3.36
C. Goodluck v. Apache County (1975)
Apache County and its non-Indian governing Board of Supervisors also resorted to gerrymandering in its effort to prevent Navajo voters, who made up an overwhelming majority of the County, from taking control of the Board. The county drew lines for its three supervisor districts with the following populations: District 1 with a population of 1,700, of whom 70 were Indian; District 2 with a population of 3,900, of whom 300 were Indian; and District 3 with a population of 26,700, of whom 23,600 were Indian. Each district elected one representative.
In Goodluck v. Apache County, several Indian voters who lived on the Navajo Reservation sued the county for violating the one-person, one-vote principle. The plaintiffs argued that: (1) the districts were unconstitutionally malapportioned in violation of the Fourteenth Amendment; (2) the malapportionment abridged their right to vote on account of race or color in violation of the Fifteenth Amendment and Section 2 of the Voting Rights Act; (3) the apportionment plan was a distinction by race in voting in violation of 42 U.S.C. §1971; and (4) the apportionment plan was a racially discriminatory application of state laws in violation of 42 U.S.C. §1971.37
In response, Apache County made two arguments. First, they asserted that 8 U.S.C. § 1401, which granted citizenship to Indians, was unconstitutional. Second, they maintained that Indians could not vote because they were not “subject to the jurisdiction” of the United States and did not pay state taxes, both qualifications mentioned in the Fourteenth Amendment. The defendants based their second argument on Elk v. Wilkins, an 1884 case holding that Indians not taxed were not to be counted for purposes of representation under the Fourteenth Amendment because they were not citizens of the United States.
The three-judge federal court summarily rejected Apache County’s arguments. The court found that “it is clear that a malapportionment of supervisorial districts is present. It therefore appears 36 109 Ariz. at 516, 513 P.2d at 945. 37 417 F. Supp. 13, 14 (D. Ariz. 1975), aff’d, 429 U.S. 876 (1976).
43
that Apache County Arizona must be redistricted so that the apportionment may conform to the standards dictated in Baker v. Carr…” Consequently, the Goodluck court granted the Indian plaintiffs summary judgment.38
D. Apache County High School District 90 v. United States (1980)
In 1976, Apache County attempted to avoid integration of its public schools to include Indian students by holding a special bond election to fund a new school in the almost entirely non-Indian southern part of the county. Although the special election afected Indian students who would be denied equal schooling, Indian turnout for the election was abnormally low. The circumstances that led to this election were subsequently addressed in a series of Section 5 objections.
Several changes in the number, location, availability, and convenience of polling places for the special bond election prevented most Indians from voting. Between 1974 and 1976, 11 polling places were closed down and no new ones were opened. Of these 11 polling places, nine were on the Navajo Reservation. These closings forced most Navajo voters without transportation to travel at least 12 more miles to get to their polling place. At the same time, the polling place changes had virtually no impact on non-Indian voters. Although the population of Indian voters had not changed, the number of reservation polling places was reduced nearly in half, compared to only a 20 percent decrease in non-Indian areas.
The polling place changes were compounded by the total lack of language assistance provided to Indian voters on the reservation, leading to dramatically low voter turnout. Although two Navajo poll workers were provided for each polling place on the reservation, none of these workers were designated or trained as interpreters. All of the absentee voting procedures were conducted in English-only.
No Navajo language informational meetings regarding the bond election took place anywhere in the county. Even the English-language informational meeting excluded most Indian voters who spoke English because it was held almost 100 miles from any Navajo community.
As a result of the outright disenfranchisement of Indian voters, the attorney general objected to several of the changes and procedures when they were submitted for Section 5 preclearance. The first of these objections came in 1976, when the attorney general objected to the redistricting of School District 90 because of the inadequacy of Navajo-language voting materials and assistance. Similar objections continued over the next four and one-half years, in which the county would meet every objection with a new method of voting discrimination.
Finally, Apache County responded to the objections raised by the special bond election by completely dissolving School District 90. In its place, the county sought to create six smaller school districts, closing 18 polling places (including 15 on the Navajo Reservation). When the Attorney General objected, Apache County responded by starting to provide Navajo language assistance, coordinating with a board of Navajo officials to select new polling places, and
38 417 F. Supp. at 16.
44
offering oral language assistance for non-English speaking Navajo voters trying to cast absentee ballots. As a result of these, and other remedial steps, the county’s six district plan was approved in a May 1980 Consent Decree.39
E. Navapache Hospital Region Section 5 Objection (1985)
Voting discrimination also occurred in an area of western Apache County (and eastern Navajo County) known as the Navapache Hospital Region. In 1985, the Apache County Board of Supervisors proposed several voting changes including the elimination of two polling places; the implementation of a rotating polling place system; and a reduction in the daily hours of operation for those voting stations that remained open. Of the two polling places that were closing, one was the last remaining polling place on the Fort Apache Reservation. The elimination of all polling places on the reservation was exacerbated by the new rotating poll system, which made polling places even less accessible to Navajo voters. Absentee voting opportunities also were not provided to Indian voters. As a result of the clear discriminatory purpose and effect of these voting changes, the attorney general objected to the voting changes.
F. Failure to Provide Language Assistance to Navajo Voters (1987)
By 1987, Apache County had still failed to provide adequate language assistance to non-English speaking Indian voters in Apache County. When Apache County submitted new guidelines for multilingual election procedures, the attorney general objected because they did not provide language assistance to the primary Navajo speakers in the County.
The attorney general informed Apache County that although some English-only documents and assistance were provided to Indians on the reservation, the county still failed to provide adequate language assistance to the 55 percent of the American Indian population who could not speak or read English. The attorney general acknowledged that the county provided oral absentee ballots and had reformed voter registration processes and voting deadlines to accommodate Navajo speakers. However, the attorney general concluded that the lack of Navajo language assistance prevented the county from effectively promoting the availability of the materials and procedures to voters who required them. The assistant attorney general further pointed out that Apache County had taken no steps to improve the quality of on-site assistance offered to non-English speakers. Although some Navajo poll workers were provided, the county did not train them on translations and how to provide assistance and there was no process for having English-language documents disseminated to non-English speakers at a local level. The Apache County Board of Supervisors responded by forming an advisory committee, which would seek to better inform new voting protocol and multilingual election procedure. However, the Attorney General insisted that the mere promise of a future remedy was not sufficient, and
39 Consent Decree, Apache County High School District No. 90 v. United States (D.D.C. June 12, 1980) (No. 77-1815).
45

continued to deny preclearance until the adequate language assistance was provided to non-English speaking Indian voters covered by Section 203 of the Voting Rights Act.
G. United States v. State of Arizona (1989) In 1989, the attorney general agreed to allow Apache County to implement a series of improvements to its language assistance program in a Consent Decree.40 The United States alleged that the State of Arizona and Apache and Navajo Counties employed various election standards, practices, and procedures that denied or abridged the voting rights of Navajo citizens residing in the two counties.41 The consent decree summarized the complaint: “The challenged practices include alleged discriminatory voter registration, absentee ballot, and voter registration cancellation procedures, and the alleged failure of the defendants to implement, as required by Section 4(f)(4), effective bilingual election procedures, including the effective dissemination of election information in Navajo and providing for a sufficient number of adequately trained bilingual persons to serve as translators for Navajo voters needing assistance at the polls on election day.”42 In response, the defendants agreed to a variety of relief to bring them into compliance with Sections 2, 4(f)(4), 5, 203, and 208 of the Voting Rights Act. Without admitting liability, the defendants agreed to the court’s May 22, 1989 consent decree requiring that defendants:
• Adopt a Navajo Language Election Information Program that would be submitted to the Attorney General for preclearance under Section 5 of the Voting Rights Act within thirty days of entry of the decree;
• Employ at least two full-time, permanent, voter outreach employees who were bilingual in Navajo and English to serve as deputy voter registrars for purposes of voter registration and implementation of the language program;
• Train translators and election personnel who were responsible for implementing the language program and encourage the participation of the Navajo Nation’s government;
• Increase the number and availability of Navajo-speaking deputy registrars to increase voter registration opportunities;
• Appoint and train as deputy registrars at least three persons fluent in English and Navajo in each county precinct situated entirely or in part on the Navajo Reservation;
• Make training available to all deputy registrars about all phases of the election process, including voter registration, candidate qualification
40 Consent Decree, United States v. Arizona (D. Ariz. May 22, 1989) (amended Sept. 27, 1993) (No. 88-1989-PHX EHC). 41 Slip p. at 1-2. 42 Ibid.
46

procedures and deadlines, election day activities, the differences between state and tribal election regulations and procedures, voter purges and reinstatement, and absentee voting;
• Train all deputy registrars in Navajo and English, as requested;
• Conduct periodic voter registration drives at tribal chapter houses, to be coordinated with the Navajo Nation to occur at times convenient for Navajo citizens;
• Disseminate and publicize election information to Navajo voters, including at scheduled chapter house meetings;
• Prepare and disseminate audio tapes with oral translations in the Navajo language of ballot propositions;
• Make public service announcements about election activities and requirements in the Navajo language on designated radio stations and provide written announcements in newspapers relied upon by Navajo voters;
• Provide information and publicity about absentee voting to Navajo voters;
• Ensure sufficient staffing of polling places with effectively trained precinct board workers fluent in Navajo and English;
• Prevent unreasonable delays in voting or translation of ballots on election day;
• Provide training in the proper translation of election information;
• Disseminate information about Navajo voters purged from voter registration lists to allow them to register again;
• Inform voters about registration and voter purge procedures;
• Maintain copies of all records and prepare reports of their efforts under the consent decree, to be provided to members of the public and the United States on request; and
• Adjust the program as necessary to address unforeseen problems.
Nevertheless, even after entry of the consent decree, Apache County continued to fail to provide adequate language assistance.
H. The Continued Lack of Language Assistance for Navajo Voters (2002)
In September of 2002, the U.S. Department of Justice (DOJ) documented several Indian voter complaints in Apache and Navajo counties. DOJ noted that in the November 5, 2002 election, the counties improved their practices in opening polling places on time, allowing for early voting at some reservation locations, providing better inter-county cooperation, and making language flip charts available. However, DOJ also documented several problems.
47

First, training for poll workers and interpreters was too brief to be useful. At the time, training was completely contained in a two-hour session that left some poll workers confused about the location of, and use for, certain components of the elections supply box they were provided with. The Justice Department suggested that the training be extended to a full day, but Apache County only extended the training to six and a half hours.
DOJ also expressed concern about cross-over voting within tribal communities. Because tribal elections take place independently of county elections, Indians who live on the Navajo Reservation near to county lines often vote in tribal elections at different locations than they do for county or state elections. The confusion created by the use of separate voting places caused many voters to attempt to vote in a County in which they are not registered, resulting in them being turned away from the polls or having their votes disqualified. To address this issue, the Justice Department suggested that each polling site near a county line be provided with registration lists from each county so that they could inform voters and try to contact appropriate county election departments before refusing voters. Although the counties acted on this suggestion, federal observers later found that most poll workers did not use the registration lists.
I. Recent Improvements in Voter Registration and Turnout (2005)
In November of 2005, Penny Pew, the elections director for Apache County, testified before the House Judiciary Committee in support of reauthorizing the expiring provisions of the Voting Rights Act.43 Ms. Pew emphasized the importance of Sections 6 and 8 of the Voting Rights Act in helping Apache County to establish an effective “indigenous” Navajo Language Election Information Program. Ms. Pew also stressed the importance of voter outreach and education, the effective use of radio and newspaper advertisement to raise voter awareness, and the development of a Navajo Language Election Glossary to assist with translating election materials.44 She also informed the committee that the use of a uniform manual, role playing, and the establishment of a training cassette library for personal use have all served to improve the effectiveness of the training for poll workers and translators. Ms. Pew highlighted the importance of the tri-county, tri-state coordination to monitor the effectiveness of programs initiated to improve Indian voter awareness and turnout. She also cited the 25 percent increase in voter turnout between 2000 and 2004 resulting from the increase in voter education and enthusiasm garnered by the “Get the Vote Out” campaign. This campaign was accompanied by the distribution of Navajo language brochures and the distribution of “I Voted” stickers in the Navajo language. Ms. Pew concluded by linking the success of all of Apache County’s programs to the continued use of local and federal observers to monitor proceedings and offer educated solutions. 43 Oversight Testimony: Written testimony of Penny L. Pew, Apache County Elections Director, US House of Representative Committee on the Judiciary (November 15, 2005), available at <http://judiciary.house.gov/OversightTestimony.aspx?ID=526>. 44 Copies of Apache County’s Navajo language election terminology guide and an example of bilingual instructions on Proposition 200 are provided as Appendix D to this report.
48

Additional Sources Section 5 Objection letters Department of Justice’s Activities to Address Past Election-Related Voting Irregularities. Oct. 14, 2004. GAO (Government Accountability Office). 2006 <http://www.gao.gov/htext/d041041r.html>. Barnes, Will C.; Granger, Byrd (ed.) Arizona Place Names University of Arizona Press. 1960. p. 2 from <http://jeff.scott.tripod.com/apacheco.html> 2006. Population Working Paper No. 45 – An Analysis of State and County Population Changes by Characteristics: 1990-1999. August 27, 2004. US Census Bureau, Arizona QuickFacts, available at http://www.census.gov/population/www/documentation/twps0045/twps0045.html and US Census Bureau. 2006 <http://quickfacts.census.gov/qfd/states/04000.html>. VI. United States Department of Justice Activities in Arizona
A. Enforcement Actions Since 1982
1. United States v. State of Arizona, No. CIV-94-1845, 1994 U.S. Dist. LEXIS 17606 (D. Ariz. 1994). Decision by: Carroll, District Judge, Browning, Circuit Judge, Roll, District Judge. Majority: Carroll and Browning; Minority: Roll. Complaint: Coconino County created two new Superior Court divisions in 1980 and 1990 and held elections to fill the judgeships. Navajo County established two divisions in 1975 and 1988. Neither county sought preclearance under the Voting Rights Act. Despite warnings from the attorney general that further activity would violate the Act, the counties proceeded to qualify candidates for the 1994 election. VRA Claim(s): In creating new Superior Court divisions, the federal government claimed that the two state counties made changes that are subject to Section 5 preclearance and therefore, must be precleared before adoption. Id. at *8. Both counties are “covered” jurisdictions under the VRA. Id. at *10. Issue(s): (1) Whether the creation of new judgeships qualifies as a change of voting practices subject to Section 5 preclearance requirements. And if so, (2) whether preclearance is necessary in this case. Id. at *10. Holding: Section 5 applies to the creation of new judgeships because they directly affect voting standards and practices. Id. at *12. The court further held that the creation of the new
49
judgeships “does have the potential of causing discrimination or retrogression”45 and therefore should be subject to preclearance. Id. at *18. Settlement/Consent Decree/Order: The court held that the establishment of judgeships constituted a “covered change” under the Act that had the potential of causing discrimination or retrogression with respect to minorities within those jurisdictions. 1994 U.S. Dist. LEXIS 17606 at *12, 18. The challenged elections were preliminarily enjoined pending resolution of the defendants’ declaratory action. Id. at *25. 2. United States v. State of Arizona, No. CIV-88-1989-PHX-EHC (D. Ariz. 1989) (unpublished). Decision by: Carroll, District Judge. Complaint: The United States alleged that the state of Arizona and Apache and Navajo Counties employed various election standards, practices, and procedures that denied or abridged the voting rights of Navajo citizens residing in the two counties. Slip Op. at 1-2. VRA Claim(s): “The challenged practices include alleged discriminatory voter registration, absentee ballot, and voter registration cancellation procedures, and the alleged failure of the defendants to implement, as required by Section 4(f)(4), effective bilingual election procedures, including the effective dissemination of election information in Navajo and providing for a sufficient number of adequately trained bilingual persons to serve as translators for Navajo voters needing assistance at the polls on election day.” Id. at 1-2. Settlement/Consent Decree/Order: For more details, see previous discussion on Apache County.
B. Federal Observers and Monitors Since 1982
Since 1982, the U.S. Department of Justice has deployed at least 1,204 federal observers who are employees of the Office of Personnel Management (OPM) to Arizona to monitor compliance with federal consent decrees and the availability and quality of language assistance to voters provided under Section 203 of the VRA. Of these observers, 93.8 percent (1,129) have been deployed to monitor access of American Indians in Apache and Navajo Counties, with the remaining 6.2 percent (75) deployed to Yuma to monitor access of American Indian and Latino voters. See Figures 6.1 and 6.2. The presence of the federal observers has made a tremendous impact on the ability of American Indian and Spanish-speaking voting-age citizens to participate in elections, as demonstrated by the successful VRA enforcement actions described above in the previous discussion of Apache County.
In addition, since 2004, the Department of Justice has deployed dozens of monitors in elections held in six other counties: Cochise, Gila, Graham, Maricopa, Pima, and Santa Cruz Counties. See Figures 6.1 and 6.2. Federal monitors are generally attorneys, paralegals, or civil rights 45 “‘Retrogression’ has been defined as the reduction or diminution of minority voting rights or strength.” United States v. State of Arizona, 1994 U.S. Dist. LEXIS 17606 at *13.
50
analysts employed by the Department of Justice, and not OPM employees. Unlike federal observers, federal monitors have no statutory right to observe elections in polling places. Federal monitors typically are used where there are suspected issues of non-compliance, but a jurisdiction has not been designated for coverage by a federal court or the Attorney General. Although each of these six counties is covered by one or more non-English languages under Section 203, none of these counties has been designated for observer coverage.
The growing use of monitors highlights the need for modifications to Sections 6 through 9 of the VRA to facilitate the ability of the Department of Justice to use federal observers in non-designated jurisdictions to enforce the Act.
51
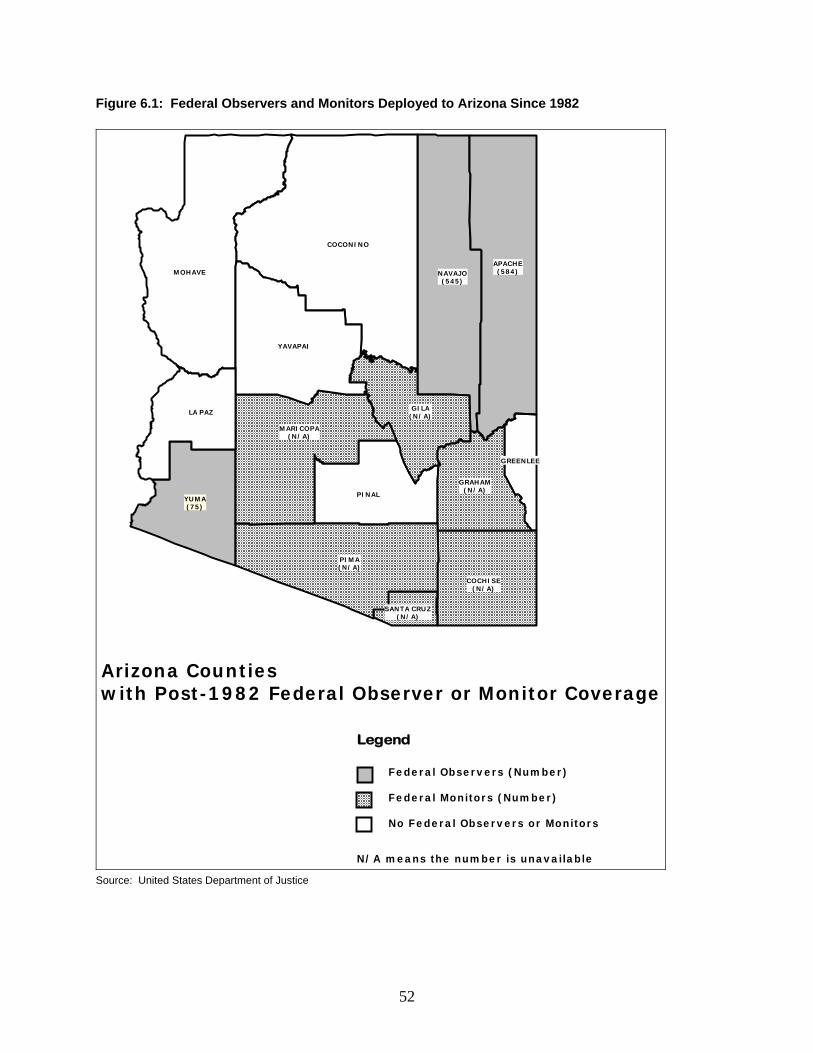
Figure 6.1: Federal Observers and Monitors Deployed to Arizona Since 1982
Arizona Countieswith Post-1982 Federal Observer or Monitor Coverage
YUMA(75)
APACHE(584)
COCHISE(N/A)
COCONINO
GILA(N/A)
GRAHAM(N/A)
GREENLEE
MARICOPA(N/A)
MOHAVE NAVAJO(545)
PIMA(N/A)
PINAL
SANTA CRUZ(N/A)
YAVAPAI
LA PAZ
Federal Observers (Number)
Federal Monitors (Number)
No Federal Observers or Monitors
N/A means the number is unavailable
Legend
Source: United States Department of Justice
52
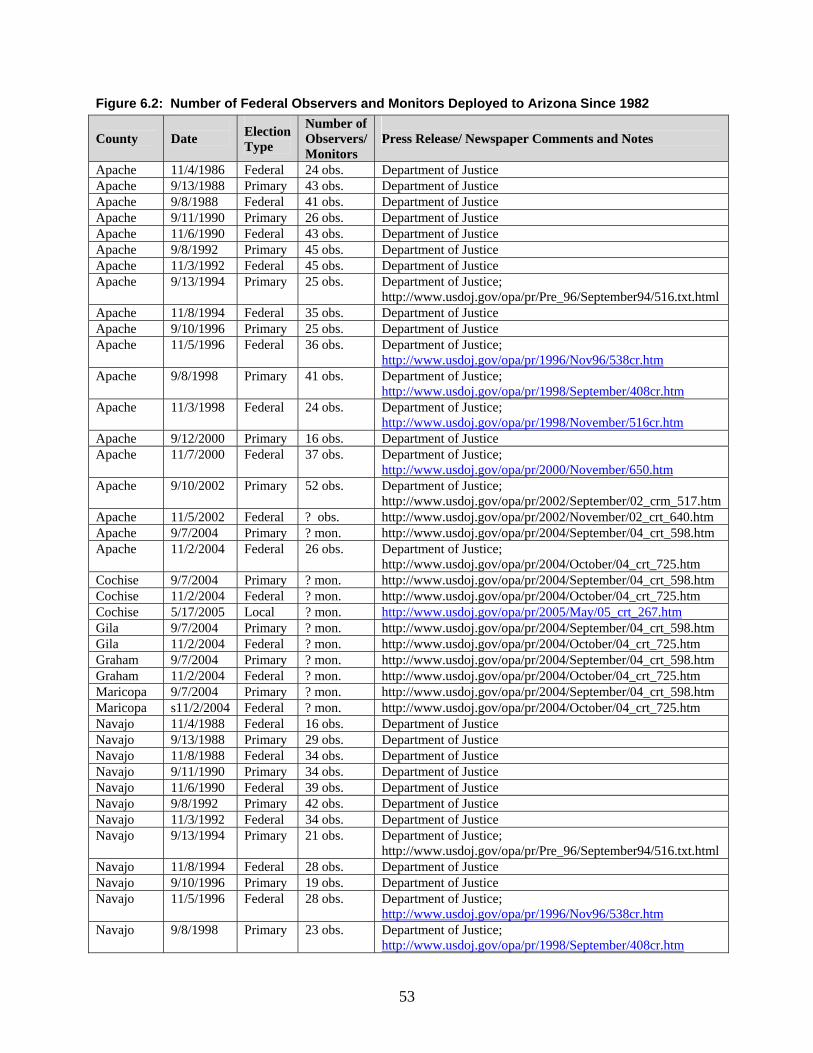
Figure 6.2: Number of Federal Observers and Monitors Deployed to Arizona Since 1982 County
Date Election
Type
Number of Observers/ Monitors
Press Release/ Newspaper Comments and Notes
Apache 11/4/1986 Federal 24 obs. Department of Justice Apache 9/13/1988 Primary 43 obs. Department of Justice Apache 9/8/1988 Federal 41 obs. Department of Justice Apache 9/11/1990 Primary 26 obs. Department of Justice Apache 11/6/1990 Federal 43 obs. Department of Justice Apache 9/8/1992 Primary 45 obs. Department of Justice Apache 11/3/1992 Federal 45 obs. Department of Justice Apache 9/13/1994 Primary 25 obs. Department of Justice;
http://www.usdoj.gov/opa/pr/Pre_96/September94/516.txt.html Apache 11/8/1994 Federal 35 obs. Department of Justice Apache 9/10/1996 Primary 25 obs. Department of Justice Apache 11/5/1996 Federal 36 obs. Department of Justice;
http://www.usdoj.gov/opa/pr/1996/Nov96/538cr.htm Apache 9/8/1998 Primary 41 obs. Department of Justice;
http://www.usdoj.gov/opa/pr/1998/September/408cr.htm Apache 11/3/1998 Federal 24 obs. Department of Justice;
http://www.usdoj.gov/opa/pr/1998/November/516cr.htm Apache 9/12/2000 Primary 16 obs. Department of Justice Apache 11/7/2000 Federal 37 obs. Department of Justice;
http://www.usdoj.gov/opa/pr/2000/November/650.htm Apache 9/10/2002 Primary 52 obs. Department of Justice;
http://www.usdoj.gov/opa/pr/2002/September/02_crm_517.htm Apache 11/5/2002 Federal ? obs. http://www.usdoj.gov/opa/pr/2002/November/02_crt_640.htm Apache 9/7/2004 Primary ? mon. http://www.usdoj.gov/opa/pr/2004/September/04_crt_598.htm Apache 11/2/2004 Federal 26 obs. Department of Justice;
http://www.usdoj.gov/opa/pr/2004/October/04_crt_725.htm Cochise 9/7/2004 Primary ? mon. http://www.usdoj.gov/opa/pr/2004/September/04_crt_598.htm Cochise 11/2/2004 Federal ? mon. http://www.usdoj.gov/opa/pr/2004/October/04_crt_725.htm Cochise 5/17/2005 Local ? mon. http://www.usdoj.gov/opa/pr/2005/May/05_crt_267.htm Gila 9/7/2004 Primary ? mon. http://www.usdoj.gov/opa/pr/2004/September/04_crt_598.htm Gila 11/2/2004 Federal ? mon. http://www.usdoj.gov/opa/pr/2004/October/04_crt_725.htm Graham 9/7/2004 Primary ? mon. http://www.usdoj.gov/opa/pr/2004/September/04_crt_598.htm Graham 11/2/2004 Federal ? mon. http://www.usdoj.gov/opa/pr/2004/October/04_crt_725.htm Maricopa 9/7/2004 Primary ? mon. http://www.usdoj.gov/opa/pr/2004/September/04_crt_598.htm Maricopa s11/2/2004 Federal ? mon. http://www.usdoj.gov/opa/pr/2004/October/04_crt_725.htm Navajo 11/4/1988 Federal 16 obs. Department of Justice Navajo 9/13/1988 Primary 29 obs. Department of Justice Navajo 11/8/1988 Federal 34 obs. Department of Justice Navajo 9/11/1990 Primary 34 obs. Department of Justice Navajo 11/6/1990 Federal 39 obs. Department of Justice Navajo 9/8/1992 Primary 42 obs. Department of Justice Navajo 11/3/1992 Federal 34 obs. Department of Justice Navajo 9/13/1994 Primary 21 obs. Department of Justice;
http://www.usdoj.gov/opa/pr/Pre_96/September94/516.txt.html Navajo 11/8/1994 Federal 28 obs. Department of Justice Navajo 9/10/1996 Primary 19 obs. Department of Justice Navajo 11/5/1996 Federal 28 obs. Department of Justice;
http://www.usdoj.gov/opa/pr/1996/Nov96/538cr.htm Navajo 9/8/1998 Primary 23 obs. Department of Justice;
http://www.usdoj.gov/opa/pr/1998/September/408cr.htm
53
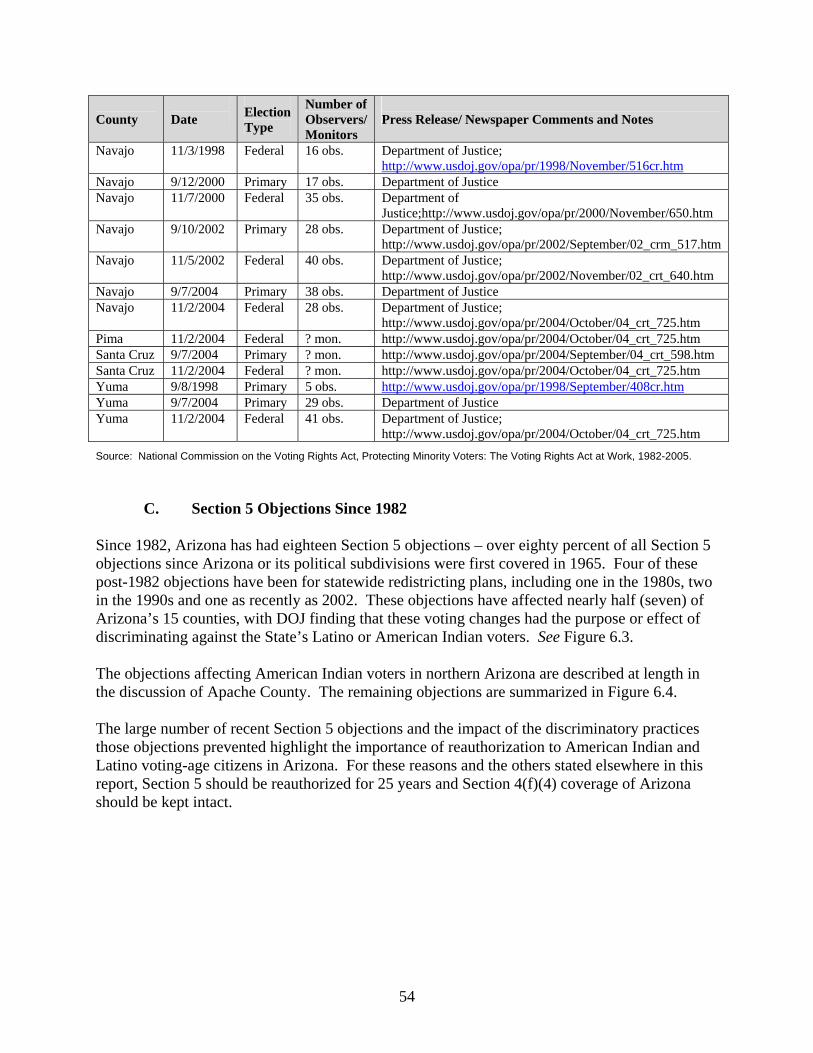
County
Date Election
Type
Number of Observers/ Monitors
Press Release/ Newspaper Comments and Notes
Navajo 11/3/1998 Federal 16 obs. Department of Justice; http://www.usdoj.gov/opa/pr/1998/November/516cr.htm
Navajo 9/12/2000 Primary 17 obs. Department of Justice Navajo 11/7/2000 Federal 35 obs. Department of
Justice;http://www.usdoj.gov/opa/pr/2000/November/650.htm Navajo 9/10/2002 Primary 28 obs. Department of Justice;
http://www.usdoj.gov/opa/pr/2002/September/02_crm_517.htm Navajo 11/5/2002 Federal 40 obs. Department of Justice;
http://www.usdoj.gov/opa/pr/2002/November/02_crt_640.htm Navajo 9/7/2004 Primary 38 obs. Department of Justice Navajo 11/2/2004 Federal 28 obs. Department of Justice;
http://www.usdoj.gov/opa/pr/2004/October/04_crt_725.htm Pima 11/2/2004 Federal ? mon. http://www.usdoj.gov/opa/pr/2004/October/04_crt_725.htm Santa Cruz 9/7/2004 Primary ? mon. http://www.usdoj.gov/opa/pr/2004/September/04_crt_598.htm Santa Cruz 11/2/2004 Federal ? mon. http://www.usdoj.gov/opa/pr/2004/October/04_crt_725.htm Yuma 9/8/1998 Primary 5 obs. http://www.usdoj.gov/opa/pr/1998/September/408cr.htm Yuma 9/7/2004 Primary 29 obs. Department of Justice Yuma 11/2/2004 Federal 41 obs. Department of Justice;
http://www.usdoj.gov/opa/pr/2004/October/04_crt_725.htm Source: National Commission on the Voting Rights Act, Protecting Minority Voters: The Voting Rights Act at Work, 1982-2005.
C. Section 5 Objections Since 1982
Since 1982, Arizona has had eighteen Section 5 objections – over eighty percent of all Section 5 objections since Arizona or its political subdivisions were first covered in 1965. Four of these post-1982 objections have been for statewide redistricting plans, including one in the 1980s, two in the 1990s and one as recently as 2002. These objections have affected nearly half (seven) of Arizona’s 15 counties, with DOJ finding that these voting changes had the purpose or effect of discriminating against the State’s Latino or American Indian voters. See Figure 6.3.
The objections affecting American Indian voters in northern Arizona are described at length in the discussion of Apache County. The remaining objections are summarized in Figure 6.4. The large number of recent Section 5 objections and the impact of the discriminatory practices those objections prevented highlight the importance of reauthorization to American Indian and Latino voting-age citizens in Arizona. For these reasons and the others stated elsewhere in this report, Section 5 should be reauthorized for 25 years and Section 4(f)(4) coverage of Arizona should be kept intact.
54

Figure 6.3: Section 5 Objections in Arizona Arizona Since 1982
Arizona Countieswith Post-1982 Section 5 Objections** Arizona has had four post-1982 statewide Section 5 objections to redistricting plans
YUMA
APACHE
COCHISE
COCONINO
GILA
GRAHAM
GREENLEE
MARICOPA
MOHAVENAVAJO
PIMA
PINAL
SANTA CRUZ
YAVAPAI
LA PAZ
1 Objection
2 Objections
3 Objections
No Objections
Legend
Source: United States Department of Justice
55

Figure 6.4: Section 5 Objections to Voting Changes in Arizona
Submitting Authority (DOJ Submission No.)
Description of Voting Change Disposition and Date
State (V5782) Chapter 159--method of circulating recall petitions
10-9-73 Withdrawn 3-15-74
Cochise Cty. College Board (7071A)
Redistricting 2-3-75
Apache Cty. High School District No. 90 (X7759)
Bond election; multilingual procedures 10-4-76 Declaratory judgment denied in Apache County High School District No. 90 v. United States, No. 77-1815
Apache Cty. High School District No. 90 (7X-0067)
Special dissolution election and changes relating to election, including polling places and multilingual procedures (D.D.C. June 12, 1980)
3-20-80 Withdrawn 5-7-80
State (82-1539) H.B. No. 2001--House and Senate reapportionment
3-8-82
Douglas (Cochise Cty.) (83-1403, 83-1404)
At-large method of election; residency districts; staggered terms; majority vote requirements; limitation on the number of terms council members may serve; special election
12-5-83 Withdrawn 6-23-98
Navajo County (84-1778) Redistricting for the five supervisor districts
8-31-84
Navapache Hospital District (Navajo and Apache Ctys.) (85-1768)
Elimination of two polling places, the implementation of a five-polling place rotation system, and the reduction in the polling hours
8-16-85
Cochise Cty. Community College District (83-1398)
1983 redistricting plan 11-3-86
Apache County (80-1278) Navajo-language bilingual election procedures
7-17-87
Apache County (87-1799) Navajo-language bilingual election procedures
2-10-88
Coconino County (91-3167)
Voter registration challenge and purge procedures
11-4-91
State (92-1347) Act No. 1 (1992)--Senate and House redistricting plan
6-10-92
La Paz County (92-2285) 1992 redistricting plan for the board of 7-17-92
56

Submitting Authority (DOJ Submission No.)
Description of Voting Change Disposition and Date
supervisors State (92-3395) Act No. 240 (1992)--House and Senate
redistricting plan 8-12-92
Yuma County (92-2355) 1992 redistricting plan for the board of supervisors
9-28-92
Arizona Western College District (Yuma and La Paz Ctys.) (88-2479)
1992 and existing redistricting plans for Yuma County portion of the district
9-28-92
Graham County (92-2466) 1992 redistricting plan for the board of supervisors
2-22-93
Coconino County (93-0681)
Two additional superior court judgeships 4-8-94
Navajo County (93-0684) Two additional superior court judgeships 5-16-94 State (2002-0276) (pdf) 2001 legislative redistricting plan 5-20-02 Coconino Association for Vocations, Industry, and Technology (Coconino Cty.) (2002-3844) (pdf)
Method of election 2-4-03
Source: United States Department of Justice
57
VII. The Continued Need for Language Assistance: English-Only Education in Arizona’s
Public Schools The following discussion demonstrates the continuing importance of the language assistance provisions of the Act.
A. The English-Only Amendment and its Impact on Arizona’s Schools
In October 1987, Arizonans for Official English initiated a petition drive to amend Arizona’s constitution to designate English as the state’s official language and to require state and local governments in Arizona to conduct business only in English. As a result of the general election in November 1988, the amendment was added to the Arizona Constitution, receiving affirmative votes from 50.5 percent of Arizona citizens casting ballots.46 The amendment, entitled “English as the Official Language,” provides that “[t]he State and all political subdivisions of [the] State shall act in English and in no other language.” The amendment bound all government officials and employees in Arizona during the performance of all government business, and provided that any “person who resides in or does business in this State shall have standing to bring suit to enforce this article in a court of record of the State.”
Two days after the voters passed the amendment, Maria-Kelley F. Yniguez sued the state of Arizona, the governor, and various parties pursuant to 42 U.S.C. § 1983 in the U.S. District Court for the District of Arizona, seeking to enjoin enforcement of the amendment and to have it declared unconstitutional under the First and Fourteenth Amendments. She also contended that it violated federal civil rights laws. When she filed her action, Yniquez was employed by the Arizona Department of Administration and handled medical malpractice claims asserted against the state. Yniguez was bilingual, fluent and literate in both Spanish and English, and, prior to the amendment’s passage, she communicated in Spanish with monolingual Spanish-speaking claimants and in a combination of English and Spanish with bilingual claimants.47
In November 1992, ten plaintiffs brought a separate action in Superior Court against then-Governor J. Fife Symington, III and the attorney general. The plaintiffs sought a declaratory judgment that the Amendment violated the First, Ninth, and Fourteenth Amendments of the U.S. Constitution. The plaintiffs included four elected officials, five state employees, and one public school teacher. They were all bilingual and regularly communicated in both Spanish and English as private citizens and during the performance of government business. The plaintiffs alleged that they spoke Spanish during the performance of their government jobs and that they feared “communicating in Spanish ‘during the performance of government business’ in violation of Article XXVIII of the Arizona Constitution.”
46 See Yniguez v. Arizonans for Official English, 69 F.3d 920, 924 (9th Cir.1995) (en banc). 47 Yniguez v. Mofford, 730 F. Supp. 309 (D. Ariz.1990).
58

In Ruiz v. Hull,48 the Arizona Supreme Court struck down the English-only amendment as unconstitutional under the First and Fourteenth Amendments. The Ruiz court described the breadth of the amendment:
Although English-only provisions have recently become quite common, Arizona’s is unique…. Twenty-one states and forty municipalities have official English statutes. However, most of those provisions are substantially less encompassing and certainly less proscriptive than the Amendment. The official English provisions in most states appear to be primarily symbolic…. Indeed, the Amendment has been identified as “by far the most restrictively worded official-English law to date” … This observation is shared by other commentators – who note that the Amendment “is the most restrictive of the current wave of official-language laws,” and “is so far the most restrictive Official English measure.”49
The court based its reasoning in part on the impact the amendment had on public school teachers such as one of the plaintiffs:
Assuming arguendo that the government may, under certain circumstances and for appropriate reasons, restrict public employees from using non-English languages to communicate while performing their duties, the Amendment’s reach is too broad. For example, by its express language, it prohibits a public school teacher, such as Appellant Garcia, and a monolingual Spanish-speaking parent from speaking in Spanish about a child’s education ….50
The court also described the dramatically negative impact the amendment would have on political participation by language minorities:
Citizens of limited English proficiency, such as many of the named legislator's constituents, often face obstacles in petitioning their government for redress and in accessing the political system. Legislators and other elected officials attempting to serve limited-English-proficient constituents face a difficult task in helping provide those constituents with government services and in assisting those constituents in both understanding and accessing government. The Amendment makes the use of non-English communication to accomplish that task illegal. In Arizona, English is not the primary language of many citizens. A substantial number of Arizona’s American Indians, Spanish-speaking citizens, and other citizens for whom English is not a primary language, either do not speak English at all or do not speak English well enough to be able to express their political beliefs, opinions, or needs to their elected officials. Under the Amendment, with few exceptions, no elected official can speak with his or her constituents except in English, even though such a requirement renders the speaking useless. While certainly not dispositive, it is also worth noting that in everyday experience, even
48 191 Ariz. 441, 957 P.2d 984 (Ariz. 1998). 49 191 Ariz at 451-52, 957 P.2d at 994-95. 50 191 Ariz at 453, 957 P.2d at 996.
59

among persons fluent in English as a second language, it is often more effective to communicate complex ideas in a person’s primary language because some words, such as idioms and colloquialisms, do not translate well, if at all. In many cases, though, it is clear that the Amendment jeopardizes or prevents meaningful communication between constituents and their elected representatives, and thus contravenes core principles and values undergirding the First Amendment.51
As a result, the state Supreme Court concluded that the English-only amendment was unconstitutional.
B. Proposition 203: A Growing Language Gap in Arizona’s Schools
In 2000, Arizona voters passed Proposition 203, a ballot initiative that banned bilingual education and required schools to use mostly English immersion programs to educate children who have limited English proficiency. The proposition was the second one of its kind in the United States. It was adopted two years after California adopted a less restrictive measure in its Proposition 227,52 which was widely regarded as having a negative impact on English-learners.53 Proposition 203 ended the flexibility in local program options by repealing Article 3.1 of the Arizona Revised Statutes, replacing it with a requirement that all English-learners in the state be taught using Structured English Immersion (SEI).54 Proposition 203 includes the following components:
• Prohibits any “teaching of reading, writing, or subject matter” and the use of
“books and instructional materials” in a language other than English;
• Restricts “waivers” of the English-only rule for children under age 10 to those with “physical or psychological handicaps” such as special education students. Schools only have flexibility to exercise an “informed belief” about what is in the best interest of the student for children age 10 and older;
• Allows parental waiver requests to be denied “without explanation or legal consequence;”55
• Requires English learners to be reassigned to mainstream classrooms once they have acquired “a good working knowledge of English,” which is a standard that the Proposition leaves undefined;
51 191 Ariz at 455, 957 P.2d at 998. 52 For an extended discussion of Proposition 227 and its impact on English language learners, see Kevin R. Johnson & George A Martínez, Discrimination by proxy: The Case of Proposition 227 and the Ban on Bilingual Education, 33 U. CAL.-DAVIS L. REV. 1227 (2002). 53 Nearly two years after Proposition 227 was passed in California, nearly one million LEP students in the state were still classified as limited-English proficient after more than a year of English-only immersion. O Ricardo Pimentel. “Facts Carry Little Clout in Bilingual-Ed Debate.” Arizona Republic. (Sept. 6, 2001). 54 Rolstad, Kellie, Kate S. Mahoney, and Gene V. Glass. "Weighing the Evidence: A Meta-Analysis of Bilingual Education in Arizona." Bilingual Research Journal 29 (2005): 1-18. Westlaw. 55 This provision was included to avoid waivers such as those provided to 170,000 LEP students in California – 12 percent of all English learners – to continue to receive bilingual education.
60
• Repeals all Arizona statutes governing the education of English learners, including standards of student assessment, teacher training, program accountability, parental choice, and other civil rights guarantees;
• Mandates English language achievement tests for all Arizona students, regardless of their English proficiency;
• Permits any “parent or legal guardian of any Arizona school child” to have standing to enforce the requirements;
• Holds educational administrators and school board members who violate the law personally liable for damages, which cannot be paid by an insurance policy or other third party; and
• May never be repealed by the Arizona legislature. Amendments to “further the purposes” of the law are permitted with a three-fourths super-majority vote in both houses, but substantive changes can only be enacted through another statewide ballot measure.
Proponents of the initiative stressed that limited-English proficient students should not receive unfair advantages, such as native language instruction in the classroom. They contended that bilingual education is an ineffective approach to English instruction. They argued that English immersion would help improve academic performance among English-learners by drawing them into education’s mainstream, but so far there have been no marked improvements.56
Children who have trouble speaking English are one of the largest and fastest-growing segments of the school population in Arizona. The vast majority of those children are mostly segregated in a small number of schools. These children also tend to be low-income and live in households where little, if any, English is spoken. For example, the Isaac School district serves largely Spanish speaking immigrant neighborhoods in west Phoenix. More than half of its 9,000 students are English learners, and 93 percent are poor.
School officials in the district say that additional funding would allow schools to create more ELL programs, reduce class sizes, and provide more teacher training. Currently, Arizona provides an additional $360 per English-learner student, but this is far below the $1,200 to $2,500 recommended by a court-ordered cost study in the Flores decision, discussed above. These circumstances compound the challenges for public schools, who are already struggling to meet new federal academic standards, according to studies by researchers with two D.C.-based nonpartisan research groups, the Migration Policy Institute and the Urban Institute.57 These 56 The Arizona Supreme Court struck down the Legislative Council’s written description of Proposition 203 stating that “the existing laws of this state require that public schools provide bilingual education instruction to every pupil who is not fluent in English, without a specific time limit on services.” According to the state Supreme Court, “This is misleading because it suggests that English and Spanish instruction must be given in all classes. However, state law requires schools to ‘provide a bilingual program or English as a second language [ESL] program for ... limited English proficient pupils.’ Ariz.Rev.Stat. § 15-754(A) (1991). ESL instruction is performed entirely in English, and therefore is not bilingual. In Arizona, over 67% of limited English proficient students attend English-taught ESL classes.” Sotomayor v. Burns, 199 Ariz. 81, 82, 13 P.3d 1198, 1199 (Ariz. 2000). 57 Gonzalez, Daniel. "Language Gap Grows." Arizona Republic 12 Oct. 2005. Westlaw.
61
studies are particularly relevant in Arizona, which is one of the few states to ban bilingual education. 1. Studies Showing the Effects of Inadequate Education to ELL Students
The studies by the Urban Institute and Migration Policy Institute measured the size and growth of the school population of ELL students to determine how that population is affecting schools trying to meet the federal standards of the federal No Child Left Behind Act. In 2000, there were 56,000 ELL students in pre-kindergarten to fifth grade, or 12 percent of the whole population of pre-kindergarten though fifth grade students, the fourth highest share of all states. Only California, Texas, and New Mexico have a higher proportion of ELL students. Arizona currently has between 150,000 and 175,000 students enrolled in its ELL programs.
Nationwide, the studies found that one half of all ELL students were born in the United States, including ELL students in high school – which means that they spent their entire lives attending school in the U.S. yet failed to learn English adequately. It was also found that ELL students tend to be highly segregated, with 70 percent attending 10 percent of U.S. schools, mostly located in urban settings. Additionally, more ELL students attend schools most likely to fail federal standards and face sanctions. In 2000, there were 3.4 million school children in the U.S. with limited English proficiency, or 6 percent of the total student population. The most common language spoken was Spanish, although many students speak other languages including Arizona’s many American Indian languages and dialects.58
2. Waiver Options under Proposition 203 Proposition 203 permits extremely limited waivers from SEI programs for some students. It allows parents to submit waivers for children younger than 10 years of age who “already know English,” which is defined as good English skills as measured by oral or standardized tests, in which the child scores at or above the state average for his or her grade level or at or above the fifth grade average, whichever is lower. The state grade level average on English oral language assessments has not yet been determined for students in Arizona, so some districts asked test publishers for estimated averages and some estimated an average based on their own district test data. However, in February 2003, the Tom Horne, the newly elected State Superintendent of Public Instruction who had run for office on the promise of enforcing Proposition 203, issued guidelines that had the effect of altering the waiver requirement. These changes have imposed the most restrictions in any state in the nation for ELL, leaving parents who seek a bilingual education for their children with no alternative to SEI. Horne insisted that the “passing score” listed by the test publisher serve as the minimum requirement for a waiver. The publisher scores are determined arbitrarily, and do not factor in ELL students, only English-proficient test takers. The available evidence reveals that bilingual education programs have been more effective at raising students’ test scores than SEI in Arizona.59
58 Gonzalez, Daniel. "Language Gap Grows." Arizona Republic 12 Oct. 2005. Westlaw. 59 Rolstad, Kellie, Kate S. Mahoney, and Gene V. Glass. "Weighing the Evidence: A Meta-Analysis of Bilingual Education in Arizona." Bilingual Research Journal 29 (2005): 1-18. Westlaw.
62

3. Confusion and Discrimination Resulting from Implementation of Proposition 203
There have been widespread instances of confusion and discrimination over how non-English languages can be used in the schools after Proposition 203:
• Teachers are afraid that they will be disciplined or fired if they speak to a student
in Spanish at any time. Teachers in the Isaac Elementary School District were asked to keep Spanish out of the cafeteria, hallways, and recess. The principal and district superintendent believed that the spirit of Proposition 203 meant that no Spanish could be spoken at school under any circumstance, when teachers and students can actually use Spanish for non-instructional purposes.
• In April 2004, the Roosevelt School District was reprimanded by a State Department of Education employee because “to conduct a Spanish spelling bee was against the law: ‘For kids that are just learning English, they should be just learning English.’”
• In April 2003, a teacher allegedly slapped students for speaking Spanish: “[A] school district investigation said she hit and slapped students for speaking Spanish in class…[The teacher] told district investigators that she was enforcing the district’s English immersion program.”
• A study was conducted in Tucson, where many ELL students were forced into all-English instruction and showed signs of trauma, such as depression, fear of school, crying, and acting out at school and at home.60
4. Tribal Languages Targeted by English-Only Initiatives
Given the unique demographics of the state of Arizona, the English-only Proposition 203 not only has an impact on Spanish-speaking students, but members of Arizona’s 21 American Indian tribes as well. Margaret Garcia-Dugan, co-chairwoman of the Arizona English for the Children group, was under the impression that tribal sovereignty would exempt American Indians from English-only requirements. That would be true if American Indian children were being taught in tribal schools; however, eighty percent of tribal children are in public and charter schools. American Indians well remember the era from the 1800s to the 1960s when American Indian children were placed in government-run boarding schools and punished for speaking their native language. Proposition 203 revitalizes that much-maligned policy.
Arizona Superintendent of Public Instruction Tom Horne stated in August 2004, “Now that we are enforcing the voter-approved requirement that students who are not proficient in English be in structured English immersion programs, hopefully there are no additional students subjected to these educationally inferior bilingual programs.” How this agenda will apply to the Navajo
60 Hunnicutt, Kay, and Mario Castro. "How Census 2000 Data Suggest Hostility Toward Mexican-Origin Arizonians." Bilingual Research Journal 29 (2005). Westlaw.
63
Nation is unclear. Horne thinks that the impact is minor because most Navajo children come to school proficient in English: “It’s a much more serious problem with Latinos.”
Since voters approved Proposition 203, Arizona and the Navajo Nation have struggled to establish how the law applies to Navajo students. Horne said that for those who come to school where Navajo is spoken at home, a bilingual program would be inappropriate. The controversy is due largely to the vagueness of the language in the legislation. While the preface addresses immigration and makes no mention of American Indians, the body text fails to specify whom the law will apply to. At its heart, the debate is over tribal sovereignty. The opposition to English-only has forged a coalition between the tribes and Latino organizations. The initiative spurred many American Indians to register to vote, and a rally at the state Capitol drew almost 1,000 protesters from even the most remote reservations. The rally was the largest American Indian protest in Arizona in recent history.61
5. The Impact on Schools Many school administrators and teachers in Arizona’s schools complained about the negative impact that Proposition 203 would have on their ability to run successful ELL programs. For example, in 2000 Martha Carrasco, bilingual and ELL coordinator at Frye Elementary School in Chandler, said that Proposition 203 would “dismantle the school’s successful bilingual program and leave Spanish speaking children at an academic disadvantage.” At the time, nearly 300 students were enrolled in Frye’s bilingual program and according to Principal Paul Ritz, within four years most would be “transferred to regular classes proficient in reading, writing and speaking English.” According to Ms. Carrasco, “We need to have the freedom to say this child is not ready to be put in a regular class with no support, and we won’t have the opportunity to do that any more. Immersion is very limited and won’t work for all kids.”62
VIII: Flores v. Arizona (2005) – the Failure to Teach ELL Students
A. Background on the Flores Litigation
Federal courts have found that the state of Arizona has repeatedly failed to provide adequate funding to teach non-English speaking students how to speak English proficiently enough to get an education. The lack of funding has resulted in high dropout rates and depressed voter registration and turnout that are exacerbated by inadequate language assistance. The problem has significantly worsened with the passage of Proposition 203 and the burgeoning number of LEP students in Arizona’s public schools.
Spanish-speaking plaintiffs have spent more than thirteen years battling with the State over its violations of federal law. In December 2005, the lengthy battle came to an end in the lower court, resulting in fines levied against the state of $500,000 per day that are being placed directly into programs to teach limited-English proficient (LEP) students. The state’s intransigence in 61 Cart, Julie. "Tribal Languages Unintended Target in English-Only Drive." Navajo Times. 4 Nov. 2000. 62 David Proffit. “Districts Fret Over Bilingual Ed Ban.” Arizona Republic (Nov. 15, 2000).
64
complying with the federal court orders was pointedly noted by the court, observing that its ruling “came against a backdrop of state inaction, existing in 1992 when Plaintiffs filed the class action law suit and continuing through the duration of the case.”63
On August 20, 1992, Miriam Flores filed a class action as a parent and on behalf of her child seeking declaratory relief against the state of Arizona for failing to provide LEP children with a program of instruction calculated to make them proficient in speaking, understanding, reading, and writing English, while enabling them to master the standard academic curriculum as required of all students. The case was brought under Lau v. Nichols,64 in which the U.S. Supreme Court held that the failure to provide English instruction to students of Chinese descent who do not speak English denies them a meaningful opportunity to participate in public education. The plaintiffs further challenged the defendants’ funding, administration and oversight of the public school system in districts enrolling predominantly low-income minority children because defendants allowed these schools to provide fewer educational benefits and opportunities than those available to students who attend predominantly Anglo-schools.65
The plaintiffs alleged that the state of Arizona and other defendants violated the Equal Education Act of 1974 (EEOA),66 and the implementing regulations, (34 C.F.R. Part 100), for Title VI of the Civil Rights Act of 1964 (Title VI)67. Plaintiffs sought relief against all the defendants, except the state of Arizona, under 42 U.S.C. § 1983 which provides “every person who, under color of any statute, ordinance, regulation, custom, or usage, of any state or territory, subjects, or causes to be subjected, any citizen of the United States ... to the deprivation of any rights, privileges, or immunities secured by the Constitution and laws, shall be liable to the party injured in an action at law, suit in equity, or other proper proceeding for redress ...”
B. Judicial Findings of Widespread Violations of Lau v. Nichols (2000) On January 24, 2000, U.S. District Judge Alfredo Marquez issued a declaratory judgment against the defendants following a bench trial. Judge Marquez concluded that the state’s system of ELL programs that appropriated only $150 for each non-English speaking student was “arbitrary and
63 160 F. Supp.2d 1043, 1044 (D. Ariz. 2000). 64 414 U.S. 563 (1974). Lau was cited extensively by Congress in adding the language assistance provisions to the Voting Rights Act in 1975. 65 Flores v. State of Arizona, Case No. No. CIV. 92-596-TUC-ACM (D. Ariz.). 66 The EEOA provides that “No state shall deny equal educational opportunity to an individual on account of his or her race, color, sex, or national origin, by - (f) the failure by an educational agency to take appropriate action to overcome language barriers that impede equal participation by its students in its instructional programs.” 20 U.S.C. § 1703. 67 Title VI provides that “No person in the United States shall, on the ground of race, color, or national origin, be excluded from participation in, be denied the benefits of, or be subjected to discrimination under any program or activity receiving Federal financial assistance.” 42 U.S.C. § 2000d.
65

capricious.”68 The impact of the lack of funding was particularly hard on local school districts, which were asked to shoulder the burden despite the absence of a tax base to do so.69
The court held as a matter of law the state's minimum base level for funding Lau programs bore no relation to the actual funding needed to ensure that LEP students are achieving mastery of the State's specified “essential skills.” The court ruled that the State's appropriation per LEP student was arbitrary and capricious because it was not reasonably calculated to effectively implement the Lau programs adopted by the Nogales Unified School District (NUSD), which have been approved by the State. The court cited the following Lau program deficiencies in support of its judgment:
• Too many students in a classroom.
• Not enough classrooms.
• Not enough qualified teachers, including teachers to teach ELL and bilingual teachers to teach content area studies.
• Not enough teacher aides.
• An inadequate tutoring program, and
• Insufficient teaching materials for both ELL classes and content area courses. The court concluded that these “deficiencies are not the result of an inadequate model. The model was prescribed by the state and adopted by NUSD. The problem is the state's inadequate funding to support the model.”70 The court made this finding based on a 1987-88 cost study that showed it cost approximately $450.00 per LEP student – three times what the State actually budgeted – to provide Lau program instruction.71
C. Arizona’s Intransigence in Remedying the Violations
At the time the court ruled, the state defendants questioned the reliability of their own 1987-88 cost study. Defendants attacked their study’s credibility because it was so old, and the methodology for the study was not ascertainable, calling into question its integrity. Moreover, the study had never been updated. At trial, the defendants informed the court that the state legislature had established the English as a Second Language and Bilingual Education Study Committee to conduct a cost study to determine the amount of funding provided by the state and federal governments for English instruction of LEP students and the amount of money being spent by schools to educate those students. The court noted that this was the first step the state
68 Flores v. State of Arizona, 172 F.Supp.2d 1225 (D. Ariz. 2000). 69 For example, Washington Elementary School District reported in 2001 that the state only paid approximately ten percent of the cost of its ESL program, or $159 out of the $1,527 per pupil annual cost. The District was forced to levy “desegregation taxes” to try to fill in as much of the funding gap as possible. Lori Baker. “Proposal Would Hike WESD Taxes by 37 Percent.” Arizona Republic (July 7, 2001). 70 Flores v. State of Arizona, 172 F.Supp.2d 1225 (D. Ariz. 2000). 71 160 F. Supp.2d 1043, 1044 (D. Ariz. 2000).
66
needed to take towards setting a minimum base funding level for Lau programs that would not be arbitrary and capricious.72
A state legislative committee was supposed to submit the report to the governor's office by December 1, 1999, to recommend the level of funding necessary to support the programs that it determined to be the most effective. The report was timely submitted, but it failed to contain the recommendations for funding levels. After the regular legislative session convened in January, 2000, the plaintiffs sent a letter to the legislature asking that the cost study be performed. A Senate bill was introduced that would have provided for the study, but it was defeated. Several amendments were also defeated which would have provided funding for the State Department of Education to perform the cost study. The legislative session ended April 18, 2000, with the state continuing its pattern of inaction.73
On June 6, 2000, Governor Jane Hull convened a special session on education to address a 0.6 percent funding increase in the state sales tax for specified educational programs. Lau programs were removed from the list of permissible items to be funded by the state sales tax. Again, the legislature rejected an amendment that required the state to conduct the cost study of Lau programs. On June 30, 2000, Governor Hull signed the bill providing for the increase in state sales tax to finance education. Again, the state failed to take any action to fund Lau programs in Arizona at a level reasonably calculated to make LEP students proficient in speaking, understanding, reading, and writing English. The court found that “contrary to the information provided to this Court in January of 2000, the State has not even taken the first step of conducting the cost study.”74
On October 12, 2000, the federal court granted post-judgment relief to the plaintiffs to address Arizona’s failure to comply with the January 2000 judgment. In doing so, the court rejected the state’s argument for more delay:
There is no reason to wait to address [the] cost of the deficiencies identified by the Court. The cost implications of those deficiencies have not changed as a result of the Consent Order. The Consent Order did not change the models for providing bilingual and ELL instruction at all. Instead, the Consent Order prescribes implementation procedures for those models.... While there may be additional cost implications associated with the Consent Order, they are most assuredly modest compared to the structural funding problems identified by the Court.75
The court also rejected the state’s argument to await development of a “new” English immersion model after the passage of Proposition 203 because “there are costs which are common to all programs of instruction for LEP students.”76 The court found that “unless a realistic cost 72 Ibid. 73 Ibid. 74 Ibid. 75 160 F. Supp.2d at 1046-47. 76 160 F. Supp.2d at 1047.
67

assessment is prepared and available this legislative session, which begins January 8, 2001, Plaintiffs will miss the biannual budget process and will have to wait until 2003 for Lau programs to be funded at a level that is not arbitrary and capricious.”77 The court concluded that “against the egregious backdrop of state agency and judicial inactivity …. without judicial action, the federal law violations as set out in this Court's Order of January 24, 2000, will continue for at least another three years.” 78
On January 11, 2001, members of Arizona’s Senate released a report estimating that it would cost an additional $170 million per year to meet the requirements of the Flores decision. At the time, only $20 million was budgeted for ELL programs in Arizona’s public schools. According to one report, “Arizona spends about $150 on every student who is classified as an ‘English learner.’ The study says about $1,500 per student would fulfill the judge’s ruling.”79
In December of 2001, the legislature passed House Bill 2010. This bill was to be an interim measure that would allow for the study to be completed and for the legislature to have time to pass the necessary legislation to comply with the Court's order. Ultimately, with the court’s consent, the legislature gave itself nearly three years to accomplish this process.
D. Post-Judgment Order Requiring Arizona to Adequately Fund ELL Programs (Jan. 2005)
In January 2005, the plaintiffs approached the court (now presided over by U.S. District Judge Raner Collins) to complain that the study had yet to be completed and that they believed more than enough time had passed for the legislature to complete its obligation.
On January 28, 2005, the court gave the state until the close of the 2005 legislative session to comply with the court's order and essentially fulfill its promise to set the appropriate funding for ELL programs. Against that backdrop, the court gave the legislature and the state one last chance to comply with Judge Marquez’s February 2000 order before applying sanctions. The legislature passed HB 2718 at the end of the 2005 session, which would have added $13.5 million to the $80 million that the state currently spends a year on English-learner programs. However, Governor Janet Napolitano vetoed it because she believed it was inadequate to comply with the court’s order and was far less than the $1,200 to $2,500 annual cost per student recommended by a court-ordered cost study of Lau compliance.80
E. Competing Studies of What is Required to Adequately Fund Arizona’s ELL
Programs The parties and amici in the Flores litigation have offered several competing studies of how much funding is required to bring Arizona into compliance with Title VI and Lau v. Nichols. 77 Ibid. 78 Ibid. 79 Chip Scutari. “Bilingual Spending Falls Short, Court Order Puts State in a Jam.” Arizona Republic (Jan. 11, 2001). 80 Flores v. State of Arizona, 2005 WL 3455102, at *1 (D. Ariz. Dec. 15, 2005).
68
Although the studies reported different amounts for what the authors believed was necessary to satisfy the Flores order, each of the studies agreed on the bottom line: Arizona’s ELL programs are significantly underfunded.
The Arizona Legislative Council, a statutory committee of Arizona’s State Legislature, contracted with the National Conference of State Legislature’s (NCSL) National Center on Education Finance to estimate the additional cost of educating ELL students. The NCSL study analyzed data from fourteen school districts and charter schools, looking at student instruction costs (such as teacher and aide salaries and benefits), the costs of administering ELL programs and student assessments, and staff development. As a result of its analysis, the NCSL concluded that the average additional annual cost for an effective ELL program in Arizona was $670 per ELL student. Thus, according to the state legislature’s own study, Arizona needed to spend approximately four and one-half times the $150 per ELL student in 2001, and nearly twice the currently budgeted $360 per ELL student.81 The NCSL study proposes funding significantly less than what the Arizona state Senate previously found in 2001, when it estimated an annual cost of $170 million (compared to the existing $20 million) was needed to comply with Flores, at a time that the education costs were lower.
Two professional panels disagreed with the NCSL’s findings and the state’s proposal. A panel of ELL experts from Arizona recommended spending that based on grade level, ranging from annual costs of $1,785 per ELL student in K-2, to $1,447 in grades 3012. The ELL experts proposed the differential in funding levels because they believed that earlier investment would result in greater proficiency and lower costs later on. The panels further found that the ELL programs could be improved by establishing clearer oversight and accountability, placing ELL specialists in schools to work with staff, and providing native language support programs in schools with large ELL populations. National experts examining the issue have determined that the appropriate annual per student costs range from $1,026 for lower-need, high school ELLs, to $2,571 for high-need, elementary school ELLs. The panel based its conclusions on a combination of proficiency, socioeconomic status, and age. The panel further recommended that Arizona provide adequate funding and adopt quality ELL curricula and train administrators, among other recommendations. The plan from the state Legislature proposes ELL-per student funding of $432, far short of the $670 per student proposed by its own NCSL report. Governor Napolitano has said that she wants an increase to $1,289 per ELL student.82
F. Arizona Cited for Contempt and Fined Minimum of $500,000 Per Day (Dec.
2005) Despite the federal court order, the state of Arizona still failed to comply. On December 15, 2005 – over five years after the court granted post-judgment relief and over thirteen years after
81 National Conference of State Legislatures, “Arizona English Language Learner Cost Study” (Feb. 2005). 82 See ACCESS, Project of the Campaign for Educational Equity, Teachers College, Columbia University (visited Mar. 11, 2006), at http://www.schoolfunding.info/news/litigation/2-28-06azellcoststudy.php3.
69
the action was filed – Judge Collins cited the defendants for contempt. In doing so, Judge Collins observed that “thousands of children who have now been impacted by the State's continued inadequate funding of ELL programs had yet to begin school when Plaintiffs filed this case.”83 The court strongly criticized Arizona’s intransigence:
The Court can only imagine how many students have started school since Judge Marquez entered the Order in February 2000, declaring these programs were inadequately funded in an arbitrary and capricious manner that violates ELL students' rights under the EEOA. How many students may have stopped school, by dropping out or failing because of foot-dragging by the State and its failure to comply with the original Order and compliance directives such as the Order issued on January 28, 2005? Plaintiffs are no longer inclined to depend on the good faith of the Defendants or to have faith that without some extraordinary pressure, the State will ever comply with the mandates of the respective Orders issued by this Court.84
The court granted the plaintiffs’ request to enjoin the state from requiring that ELL students be subject to passing the state-mandated AIMS test as a graduation requirement “until such time as ELL student's education have been funded at an appropriate level and have had appropriate time to benefit from such funding.” Judge Collins reasoned, “The State has failed to comply with the Court's judgment for almost six years by under-funding ELL programs, which would provide ELL students with the necessary tools to pass the AIMS test. The State's offering tutoring outside the classroom and other things to all students for the purpose of passing the AIMS test does not remedy the fact that the under-funded ELL programs deprive ELL students of an equal opportunity to pass the AIMS test in the first instance.”85
In addition, the court held that if the state of Arizona did not comply with its January 28, 2005 order within 15 calendar days after the beginning of the 2006 legislative session, it would impose a fine of $500,000 per day for the first thirty days, $1 million per day for the next thirty days, followed by fines of $1.5 million per day until the end of the legislative session, and $2 million per day if appropriate funding was not allocated during the 2006 legislative session.86
Despite the state’s lengthy history of noncompliance with the decisions of two federal judges in the Flores case, State Superintendent of Schools Tom Horne expressed his intent to continue to fight the decision. In a press release issued on December 16, 2005, the day after the state was cited for contempt, Superintendent Horne stated, “I am asking the Attorney General to file an immediate appeal to the Ninth Circuit, with a request that the district judge’s order not take effect until the Ninth Circuit has a chance to review the important public policy issues presented.” Horne cited many reasons for wanting to continue to delay providing adequate
83 2005 WL 3455102, at *2. 84 Ibid. 85 2005 WL 3455102, at *8. 86 Ibid.
70
funding for Arizona’s ELL programs, including that “this problem was originally created, in part, by the negligence of the federal government in guarding our borders.”87
Arizona lawmakers passed a bill that adds $14 million for one year into programs for Arizona’s 150,000 ELL students. Furthermore, the funding would last for only one year. New requests could be rejected by Superintendent of Public Instruction Tom Horne and lawmakers if the schools were not spending enough of their federal education and desegregation money on ELL programs. Governor Napolitano vetoed the bill because she believed it was necessary to add $185 million a year to the programs and make an ongoing commitment to compliance with the court order.88
On January 24, 2006, Arizona failed to meet the court deadline, accumulating $20 million in fines though the end of February 2006.89 Governor Napolitano currently has new draft legislation that retains the core of her previous proposals to increase the state’s current per-student funding for ELL programs. In the interim period, at the request of Arizona’s Attorney General, Judge Collins has directed that all of the fines paid under the contempt order be placed directly in the State’s ELL programs.
G. The Impact of Arizona’s Inadequate ELL and ESL Funding
1. Low Test Scores by Language Minorities The inadequate public education provided to Arizona’s language minorities is reflected in the low test scores that they receive on national and state standardized tests. Arizona uses what it calls the AIMS test, which ranks students in four categories:
• “Exceeds the standard”: Academic performance goes substantially beyond the state’s goals.
• “Meets the standard”: Solid academic performance with challenging subject matter. Students at this level are ready to begin working on material required for the next grade.
• “Approaches the standard”: Partial understanding of subject matter. Students demonstrate competency in required skills but do not demonstrate full understanding.
• “Falls far below the standard”: Insufficient evidence of skills needed to meet standards. Students at this level have serious gaps in knowledge and
87 Arizona Department of Education. “State Superintendent of Schools Horne Issues Statement in Court Order of Dec. 15.” 2005 WL 20506849 (Dec. 16, 2005). 88 Scutari, Chip, and Robbie Sherwood. "English Bill Beats Deadline." Arizona Republic 24 Jan. 2006, sec. A: 1-4. 89 See ACCESS, Project of the Campaign for Educational Equity, Teachers College, Columbia University (visited Mar. 11, 2006), at http://www.schoolfunding.info/news/litigation/2-28-06azellcoststudy.php3.
71
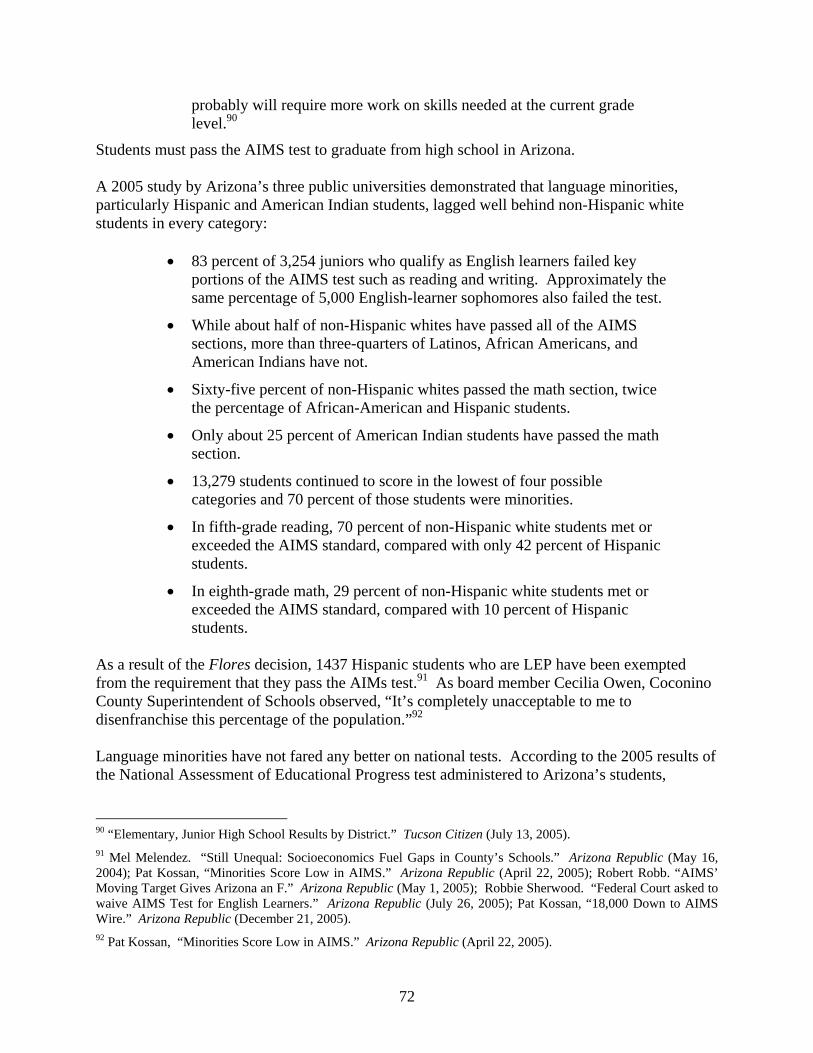
probably will require more work on skills needed at the current grade level.90
Students must pass the AIMS test to graduate from high school in Arizona. A 2005 study by Arizona’s three public universities demonstrated that language minorities, particularly Hispanic and American Indian students, lagged well behind non-Hispanic white students in every category:
• 83 percent of 3,254 juniors who qualify as English learners failed key
portions of the AIMS test such as reading and writing. Approximately the same percentage of 5,000 English-learner sophomores also failed the test.
• While about half of non-Hispanic whites have passed all of the AIMS sections, more than three-quarters of Latinos, African Americans, and American Indians have not.
• Sixty-five percent of non-Hispanic whites passed the math section, twice the percentage of African-American and Hispanic students.
• Only about 25 percent of American Indian students have passed the math section.
• 13,279 students continued to score in the lowest of four possible categories and 70 percent of those students were minorities.
• In fifth-grade reading, 70 percent of non-Hispanic white students met or exceeded the AIMS standard, compared with only 42 percent of Hispanic students.
• In eighth-grade math, 29 percent of non-Hispanic white students met or exceeded the AIMS standard, compared with 10 percent of Hispanic students.
As a result of the Flores decision, 1437 Hispanic students who are LEP have been exempted from the requirement that they pass the AIMs test.91 As board member Cecilia Owen, Coconino County Superintendent of Schools observed, “It’s completely unacceptable to me to disenfranchise this percentage of the population.”92
Language minorities have not fared any better on national tests. According to the 2005 results of the National Assessment of Educational Progress test administered to Arizona’s students,
90 “Elementary, Junior High School Results by District.” Tucson Citizen (July 13, 2005). 91 Mel Melendez. “Still Unequal: Socioeconomics Fuel Gaps in County’s Schools.” Arizona Republic (May 16, 2004); Pat Kossan, “Minorities Score Low in AIMS.” Arizona Republic (April 22, 2005); Robert Robb. “AIMS’ Moving Target Gives Arizona an F.” Arizona Republic (May 1, 2005); Robbie Sherwood. “Federal Court asked to waive AIMS Test for English Learners.” Arizona Republic (July 26, 2005); Pat Kossan, “18,000 Down to AIMS Wire.” Arizona Republic (December 21, 2005). 92 Pat Kossan, “Minorities Score Low in AIMS.” Arizona Republic (April 22, 2005).
72

Arizona’s scores were far below the national average of students who scored below the “basic” grade level:
• 48 percent of Arizona’s students scored below “basic” in fourth grade
reading, compared to the national average of 38 percent.
• 30 percent of Arizona’s students scored below “basic” in fourth grade math, compared to the national average of 21 percent.
• 35 percent of Arizona’s students scored below “basic” in eighth grade reading, compared to the national average of 29 percent.
• 36 percent of Arizona’s students scored below “basic” in eighth grade math, compared to the national average of 32 percent.
According to one commentator, “The test results were grim for poor and minority children. More than 60 percent of Arizona’s poor, African-American, and Latino kids in the fourth grade scored below grade level in reading, double the percent of White and wealthier kids falling behind.”93 2. Waiting Lists for ESL Programs
The absence of adequate ESL programs for adults exacerbates the lack of ESL education that children are receiving in Arizona’s schools. For example, it was reported in 2000 that 16,000 adults completed Rio Salado Community College’s ESL classes in Maricopa County in a single year as part of the college’s basic education program in 1999. Rio Salado is the largest provider of ESL classes in the Phoenix area. Despite the large number of adults completing the ESL program, Rio Salado has been unable to keep up with demand. According to Kelly Price, who coordinates the college’s Adult Basic Education program, “The school could add 20 more classes at any given time and still not meet the demand.”94
IX. Proposition 200
A. Background
The latest voting controversy in Arizona has arisen from a ballot-approved initiative in the state-wide election of 2004. The bill is known as the Arizona Taxpayer and Citizen Protection Act, and is more popularly referred to by its proposition number, Proposition 200. Its supporters say that it exists to prevent undocumented immigrants from voting, or taking advantage of other benefits of United States citizenships. Its detractors say that it prevents many legal citizens from voting, or taking advantage of those benefits. Two years after its passage, debate over its impact on Arizona’s racial and ethnic minority voting-age citizens continues.
93 Pat Kossan. “Arizona Students Lag on National Test.” Arizona Republic (October 20, 2005). 94 O Ricardo Pimentel. “Who are these Mexicans who won’t Learn English?” Arizona Republic (Oct. 28, 2000).
73

B. Court Challenges and Section 5 Preclearance
Concerned about the changes to voting and concerned about Arizona’s jurisdiction in regulating undocumented immigrants, Arizona’s governor, Janet Napolitano, decided to wait for Section 5 preclearance before signing the voter-approved measures into law. On November 30, U.S. District Court Judge David C. Bury signed an order prohibiting the implementation of the provisions in Proposition 200 that apply to public services, stating that further investigation into whether or not the new law would illegally contradict federal regulations was necessary. He did, however, rule that Napolitano could sign into law the portions of the Proposition dealing with changes on the requirements to register to vote. The law requires that proof of citizenship be provided in order to register to vote and that identification be shown at the polls in order to vote. According to the Maricopa County Recorder’s Office, acceptable forms of identification include: an Arizona driver’s license number (or copy of the license) or non-operating identification license number (or copy of the identification license), issued after October, 1, 1996; a driver’s license or non-operating identification license from another state that identifies United States Citizenship; a legible photocopy of a birth certificate with the name of the applicant that verifies United States Citizenship; a legible photocopy of the pertinent pages of the United States passport; United States naturalization certificate number or the presentation of the original certificate of naturalization. (If only the number is provided, the County Recorder must verify the number with INS prior to adding the applicant to the voter rolls.); Bureau of Indian Affairs Card Number, Tribal Treaty Card Number or Tribal Enrollment Number. In January 2005, the Department of Justice precleared the proposed changes. Arizona Secretary of State Jan Brewer then moved forward to implement the changes necessary for registration to meet the new requirements. Resistance to Proposition 200 continued throughout the year. In one attempt to stop Proposition 200, a group of state employees sought to prevent the law from going into effect in Friendly House v. Napolitano. Initially denied by the District Court, the group continued to the Ninth Circuit Court of Appeals, where the court upheld the District Court’s decision in the summer of 2005.95 The courts both held that the employees did not have sufficient standing as persons who would be adversely affected by the laws, as they could offer no example of how they would personally be potentially injured by it.
C. Community Responses The response among Hispanic community organizations has been varied. Some argue that Hispanic voters supported the Proposition, even though the majority of Hispanic rights groups voiced strong opposition to the effect they thought it would have on Hispanic Americans. They claim that the legislation will prevent legal citizens from voting, and legal residents from
95 Friendly House v. Napolitano, 419 F.3d 930 (9th Cir. 2005).
74
receiving benefits. Community groups offering resistance included the League of United Latin American Citizens (LULAC) and the Mexican American Legal Defense and Educational Fund. One way in which the Latino community attempted to derail Proposition 200 was through the use of their economic power. Several groups called for boycotts across the Phoenix area, hoping that by flexing their economic muscle they would be able to convince local business owners to pull support of the legislation. While the boycotts had varying levels of economic impact, for the most part, they did little to convince the business owners that supporting Proposition 200 was an unwise decision. In a different move, one group chose to provide a toll free number to Hispanic voters who may have difficulties understanding the new requirements of the Proposition. The group, Unidos Contra 200, provided the number with an answering service. Callers could ask any question they might have about the new legislation. Messages were then returned, and questions answered, by volunteers. Unidos Contra 200 is not necessarily operating in opposition to the law, but is trying to educate as many Hispanic residents of Arizona as possible about what Proposition 200 will mean for them. Representing the broad-based concern about the legislation among Hispanic community leaders, Unidos Contra 200 was founded by members of the Phoenix Catholic Diocese, the Arizona Bankers Association, the superintendent of the Tolleson Union High School District, Value Options, the Phoenix Police Department, and the First New Life Baptist Church. The City Council of Phoenix has declared that the city will pay to defend any city employee charged for failing to report an undocumented migrant; other cities may follow suit.96
D. Impact of Proposition 200
Between the time the new voting requirements went into effect and November of 2005, the results of Proposition 200 on voter registration were severe. More than 12,000 applications were rejected because of the new requirements in Pima and Maricopa counties alone. In addition, in the period from April until August in Pima County, only 5,872 new voters even attempted to register (1,492 were denied), compared to 2004, when more than 30,000 voters were successfully registered. Had the laws been in effect in 2004, more than 10,000 of those new voters would have been rejected. Of the voter registration applications rejected in Pima Country, none were because the applicant was a non-citizen. In Maricopa County, county officials identified and charged 10 non-citizens attempting to register to vote, 3 of whom cast effective ballots in the 2004 election. According to several reports, the non-citizens were incorrectly told by individuals paid to circulate petitions that they could register to vote because they were in the final stages of becoming naturalized citizens. Proponents of Proposition 200 contend that one of the purposes of the bill is to prevent undocumented immigrants from voting. The lack of results from the new law may reflect the 96 http://en.wikipedia.org/wiki/Arizona_Proposition_200_%282004%29
75

already existing misperceptions about the number of undocumented residents of Arizona, as shown in studies by the Behavior Research Center. In September of 2005, the Center reported that a poll with a five percent margin of error showed that adults in Maricopa County, on average, think that 39 percent of Hispanic people in Arizona are undocumented immigrants. Census data reports that only 24 percent of Hispanic people in Arizona are non-citizens, which includes legal resident aliens who have not yet attained citizenship.
E. The Future of Proposition 200 With the first statewide election approaching in 2006, voting outreach officials, as well as potential new voters, face many new obstacles. The new current address requirement for identification presents many unique problems for American Indians, some of whom may not have traditional mailing addresses. The new requirements are also expected to be a problem for college-age voters, especially those who may be living in Arizona from out-of-state. Students may not have long-term addresses, and may not have access to other forms such as birth certificates, which are often the parent’s responsibility to keep up with. Married couples may face barriers as well, as often the forms of proof-of-residence may only have one of the spouses name on it. Elderly voters, especially those who may be living in assisted living, may also lack the necessary identification. The biggest problem for election officials may come after election days. Voters who show up with improper identification (a driver’s license with an old address, for example) or no license at all will vote provisionally. Each provisional ballot must be verified and counted by hand in the days after the election. The new requirements in manpower and training will be intense.
76

Sources
Wingett, Yvonne. “Number offers Prop. 200 info.” The Arizona Republic. 3 Dec. 2004. Davenport, Paul. “Arizona governor signs immigration initiative.” Associated Press. 8 Dec. 2004. Wingett, Yvonne. “Younger Latinos React to Prop. 200.” The Arizona Republic. 12 Dec. 2004. Davenport, Paul. “Feds OK Arizona immigration law’s election changes.” Associated Press. 25 Jan. 2005. LoMonaco, Claudine and wire staff. “10 charged with voter fraud in Maricopa County.” Tucson Citizen. 13 Aug. 2005. Editorial. “Prop. 200 causing voter registration rejections.” Arizona Daily Star. 22 Aug. 2005. Davenport, Paul. “Survey: Public's beliefs on immigration stray from census data.” Associated Press. 19 Sep. 2005. Scutari, Chip and Yvonne Wingett. “Arizonans Lacking ID won’t have Vote Counted.” Arizona Republic. 8 Oct. 2005. Flannery, Pat. “Voters Tangled in New ID Law.” Arizona Republic. 26 Nov. 2005.
77

X. Electoral Participation and Representation in Arizona
A. Hispanic and American Indian Voter Registration and Turnout
As a result of its large Hispanic and American Indian citizen voting age populations, Arizona continues to have one of the lowest voter turnout rates in the United States. According to a recent study, Arizona ranks 47th out of the 50 states in voter turnout.97 The depressed voter registration and turnout has a negative impact on Latino and Indian voters in their representation at the state level. It also has a particularly detrimental effect on minority voters because of the number of ballot initiatives. According to the Morrison Institute, Arizona ranks fifth nationally in ballot initiatives at 150, trailing only Oregon, California, Colorado, and North Dakota.98 Many of these ballot measures, such as Proposition 203’s ban on bilingual education (see above) and Proposition 200’s impact on minority voters through new registration and identification procedures (see above), have a particularly high impact on Hispanic and American Indian voters.
The turnout rate of Hispanics of voting age who turn out to vote substantially trails the turnout rate of non-Latinos. See Figure 10.1.
Figure 10.1: Hispanic Registration & Turnout in Arizona Between 1992 & 2002
Year Hispanic Turnout of Reg. Voters %
Total Turnout of Reg. Voters %
1992 79.2% 91.8%
1994 69.7% 74.0%
1996 70.9% 80.7%
1998 58.3% 66.0%
2000 81.3% 87.5%
2002 59.8% 72.4% Source: U.S. Census Bureau, Current Population Reports: Voting and Registration in the Election of November 1992, 1994, 1996, 1998, 2000, and 2002.
American Indian voter registration and turnout in Arizona has also increased as a result of the Voting Rights Act, although in most cases it is still far below the statewide average. In the two most recent presidential elections, in which turnout is historically the highest, American Indians continued to trail the statewide average by approximately 23 percent. At the same time, however, some Indian tribes continue to see record numbers of voters turning out. In 2004, the Ft. McDowell tribe matched the statewide turnout average of 77 percent. The Colorado River and Salt River tribes had all-time highs of over 60 percent of registered voters turning out, and most of the remaining tribes had turnout over 50 percent. See Figure 10.2. Reauthorization of
97 See Arizona State University, Morrison Institute for Public Policy in the School of Public Affairs/College of Public Programs, How Arizona Compares: Real Numbers and Hot Topics, Government 46 (2005). 98 Ibid. at 47-48.
78

the Voting Rights Act is necessary to lower the disparity between American Indians and non-Indians in voter registration and turnout.
Figure 10.2: Increases in American Indian Registration & Turnout in Arizona Between 2000 & 2004
2000 Voter Reg.
2000 Voter Turnout
2000 Turnout %
2004 Voter Reg.
2004 Voter Turnout
2004 Turnout %
Navajo 56,326 27,736 49.24% 63,618 34,213 53.79%
Hopi 1,851 555 29.99% 2,075 905 43.63%
Tohono O’odham 3,964 2,236 56.43% 4,739 2,806 59.24%
Gila River 2,836 964 34.00% 3,166 1,504 47.51%
White Mountain 4,243 1,876 44.22% 4,865 2,442 50.20%
San Carlos 1,418 721 50.86% 1,735 1,012 58.34%
Colorado River 1,414 757 53.56% 2,187 1,370 62.66%
Hualapai 365 184 50.43% 420 233 55.49%
Cocopah 2,089 1,010 48.35% 2,647 1,457 55.07%
Ft. McDowell 196 97 49.50% 355 274 77.22%
Havasupai 131 59 45.05% 102 57 55.90%
Salt River 1,763 939 53.28% 2,444 1,475 60.39%
Totals 76,596 37,133 48.48% 88,350 47,748 54.04%
Statewide Totals 2.17M 1.56M 71.79% 2.64M 2.04M 77.16%
Source: First American Education Project, Native Vote 2004: A National Survey and Analysis of Efforts to Increase the Native Vote in 2004 and the Results Achieved 17-18 (2005).
As a result of language assistance and outreach efforts pursuant to Section 203, turnout in Navajo precincts in Apache County, Arizona increased 26 percent in four years. In 2004, 17,955 registered voters cast ballots in the 33 Navajo precincts, compared to 14,277 voters in 2000.99
This follows the trend of increasing registration and turnout since Arizona has been covered by Section 4(f)(4) of the Voting Rights Act. Voter turnout in precincts on seven Arizona Indian reservations rose from 11,789 in 1972 to 15,982 in 1980, with voter registration increasing by 87 99 Testimony of Penny Pew, Election Director of Apache County, Arizona, before the Subcomm. on the Const. of the House Judiciary Committee (Nov. 15, 2005).
79

percent in Navajo County, Arizona, and 165 percent in Coconino County, Arizona. Turnout among American Indians in Navajo County increased by 120 percent between 1972 and 1990, while Apache County, Arizona experienced an 88 percent increase during the same period. American Indians in New Mexico and Utah experienced similar increases in voter registration and turnout.100
B. Number of Hispanic and American Indian Elected Officials
The Voting Rights Act has had a substantial impact on the number of Hispanic and American Indian candidates elected to public office in Arizona. The impact has come in many forms. Section 2 of the Act has removed structural barriers to participation in places such as Apache County and other areas. Section 5 of the Act also has eliminated barriers and prevented their implementation. Section 203 has dramatically increased voter registration and turnout of language minorities by making oral and written language assistance available to non-English speaking voting age citizens. The federal examiner and observer provisions have allowed the U.S. Department of Justice to monitor state and local compliance in Arizona.
American Indian representation has been greatest at the local level, as a direct result of the litigation in northern counties including Apache, Coconino, and Navajo Counties. On the other hand, American Indian representation in the state legislature has declined in the last five years as a result of statewide redistricting changes following the 2000 Census and demographic changes because of the large growth of non-Indian population moving into Arizona. The National Conference of State Legislatures reported that there were five American Indian state legislators in 2001, dropping to three in 2003 and two in 2006. Both of the American Indians in Arizona’s legislature, Senator Albert Hale and Representative Albert Tom, are Navajo.101
American Indians also have had a substantial impact on recent elections in Arizona. In 2002, American Indian turnout was credited with the passage of Proposition 202, an Indian gaming initiative supported by 17 of the State’s tribes, which passed by 20,836 votes (about two percent of all of the ballots cast).102 In that same election, American Indians were the difference in a close gubernatorial race decided by only 11,819 votes, less than one percent of all those cast.103
The Act’s impact is most apparent in the number of Hispanics elected to every level of public office in Arizona. Between 1973 and 1984, Latino representation in Arizona increased by 154 percent, growing from 95 to 184 elected officials.104 That trend has continued in the past twenty
100 H. Rep. No. 102-655 at 6-7, reprinted in 1992 U.S.C.C.A.N. 770-71; S. Rep. No. 102-315 at 12; S. 2236 Hearings, 102d Cong., 2d Sess., S. Hrg. 102-1066, at 181-89 (1992) (statement of Navajo Nation Vice-President Marshall Plummer). 101 National Conference of State Legislatures, at http://www.ncsl.org/programs/statetribe/2006triblg.htm. 102 Russ Lehrman and the First American Education Project, The Emerging Role of American Indians in the American Electoral Process 14-15 (Jan. 2003). 103 First American Education Project, Native Vote 2004: A National Survey and Analysis of Efforts to Increase the Native Vote in 2004 and the Results Achieved 13, 19 (2005). 104 National Association of Latino Elected Officials (NALEO) Educational Fund, National Roster of Hispanic Elected Officials xiii (1985).
80

years. Between 1985 and 2005, the number of Latino elected officials in Arizona increased by 62 percent, from 230 to 373.
Latinos are elected at every level of office in Arizona, except for statewide office where elections are at-large among all voters in the State. In 1974, Raul Castro, born to indigent parents in Cananea, Sonora, Mexico, became Arizona's first Mexican-American governor.105 Arizona has added two Hispanic representatives to its congressional delegation, the Honorable Raul Grivalja (elected in 2003) and the Honorable Ed Pastor (elected in 1991). The greatest increases have occurred at the local level, particularly on county commissions and local school boards where Latinos have more than doubled their representation in the past twenty years. See Figure 10.3.
Figure 10.3: Increases in Latinos Elected to Office in Arizona Between 1985 and 2005.
Level of Office 1985 Total 2005 Total Change % Change
U.S. Representatives 0 2 + 2 N/A
State Officials 0 0 0 0%
State Senators 6 5 - 1 - 17%
State Representatives 6 11 + 5 + 83%
County Officials 9 19 + 10 + 111%
Municipal Officials 104 122 + 18 + 17%
Judicial/Law Enforcement 29 44 + 15 + 52%
Education/School Board 76 159 + 83 + 109%
Special District Officials 0 11 + 11 N/A
Totals 230 373 + 143 + 62%
Source: National Association of Latino Elected Officials (NALEO) Educational Fund, 1985 National Roster of Hispanic Elected Officials and 2005 National Roster of Hispanic Elected Officials.
105 http://www.azcentral.com/culturesaz/hispanic/HISTcastro.html
81

Appendix A: Project Co-Directors Dr. James Thomas Tucker (Chandler, Arizona) Dr. Tucker is an Adjunct Professor at the Barrett Honors College at Arizona State University, and co-director of the study of minority language assistance practices in public elections. Dr. Tucker is a Shareholder with the Phoenix law firm of Ogletree Deakins, P.C. He formerly served as a senior trial attorney with the Voting Section of the Civil Rights Division at the United States Department of Justice in Washington, D.C. He has authored several articles on the Voting Rights Act, including a forthcoming piece on the language assistance provisions of the VRA. Dr. Tucker received his S.J.D. and LL.M. from the University of Pennsylvania, his J.D. from the University of Florida, his M.P.A. from the University of Oklahoma, and his B.A. in History from Arizona State University's Barrett Honors College. Dr. Rodolfo Espino (Phoenix, Arizona) Dr. Rodolfo Espino is an Assistant Professor in the Department of Political Science at Arizona State University, and is co-director of the study of minority language assistance practices in public elections. Dr. Espino received his B.A from Luther College and his M.A. and Ph.D. from the University of Wisconsin-Madison. Dr. Espino’s primary research and teaching interests are in the fields of American politics and political methodology. Dr. Espino is presently engaged in a number of research projects, including an examination of the effects of residency patterns on public policy attitudes, the determinants of instability in congressional roll call voting, translation effects in surveys of Latinos in the United States, and midpoint inflation bias in public opinion surveys.
82

Student Researchers at the Barrett Honors College Tara Brite (Phoenix, Arizona) Ms. Brite is a junior in the Barrett Honors College majoring in print journalism with a minor in Italian. She is currently serving her third semester working at the ASU student newspaper The State Press. After graduation, Ms. Brite plans to either participate in Teach For America or work as a reporter for a daily metropolitan newspaper. Shannon Conley (Wyandotte, Michigan) Ms. Conley is a Junior in the Barrett Honors College at Arizona State University, with a double major in Justice and Social Inquiry and Political Science, in addition to a certificate in Philosophy, Politics, and Law. She is currently a Political Science Junior Fellow. Ms. Conley is a Pat Tillman Scholar and a recipient of the Sun Devil scholarship. After graduation she plans to attend law school. Ben Horowitz (Jacksonville, Florida) Mr. Horowitz is a Junior in the Barrett Honors College at Arizona State University, majoring in Media Analysis and Criticism with a minor in Political Science. Mr. Horowitz is a National Merit Scholar, and is a recipient of the Freedom Forum Scholarship. In addition to being an active writer for the State Press, Arizona State’s student newspaper, he has received a Swarthout Award for short fiction. Mr. Horowitz is undecided about his post-graduation plans, but hopes it makes a positive impact somewhere. Zak Walter (Neenah, Wisconsin) Mr. Walter is a Senior in the Barrett Honors College at ASU, majoring in Secondary Education with a focus/minor in Political Science. He was awarded a National Merit Scholarship and the Herb Kohl Student Excellence Award, and serves as a Resident Advisor and soccer coach. Mr. Walter is undecided about his post-graduation plans.
Shon Zelman (Phoenix, Arizona)
Mr. Zelman is a Senior in the Barrett Honors College at Arizona State University, majoring in Political Science. Mr. Zelman is a recipient of the ASU Provost Scholarship and the ASU Parents Association First Generation Scholarship. After graduation, Mr. Zelman plans to participate in Teach For America and then attend law school.
83

Appendix B: Explanation of Census Data from July 2002 Section 203(c) Coverage Determinations Figures 1.3 and 1.4 were compiled from sampled data used by the Census Bureau to make its July 26, 2002 determinations under Section 203 of the Voting Rights Act. According to the Voting Rights Output File Documentation, the determination data was created from sampled weights of data from the Census 2000 long forms (Summary Table Files 3 and 4). The file contains records for the entire United States, including all states and political subdivisions, which are defined as “counties for all states except for Connecticut, Maine, Massachusetts, Michigan, New Hampshire, Rhode Island, Vermont, and Wisconsin” where political subdivisions are minor civil divisions (“MCDs”) or MCD equivalents. There are 62 records in the file, including one each for total population and Spanish/Hispanic/Latino, one for American Indian/Alaskan Native and 42 for American Indian/Alaskan Natives tribal groups, one for Asian and 16 for Asian groups. The Census Bureau has suppressed data for jurisdictions indicated by an asterisk (“*”) to avoid disclosure of specific persons. According to Census documentation, “[t]his means that data in a record are suppressed if the unweighted count of voting age citizens for a record is less than 50 and the weighted population count for the record is not 0 or the unweighted population count for the record is not 0.” The Census Bureau rounded data that has not been suppressed. Section 203 determinations are based on data prior to rounding and prior to suppression. “LEP Number (N)” refers to the number of voting age citizens in the identified language group who are limited-English proficient, or “LEP.” A person is LEP if they speak English less than “very well.” “LEP Percent (P)” refers to the percentage of voting age citizens in the identified language group who are LEP. “Illiteracy Rate” refers to the percent of voting age citizens in the identified language group who are LEP and illiterate. According to the Census Bureau, “voting age limited-English proficient illiteracy” refers to all voting age citizens who are limited-English proficient and who have completed less than fifth grade. Jurisdictions are covered if they meet one of the population triggers and have an illiteracy rate among voting age citizens in a single language minority group that exceeds the national illiteracy rate of all voting age citizens of 1.35 percent. “Coverage basis” refers to the population trigger resulting in Section 203 coverage. There are four different bases for coverage: “N” if the number of LEP voting age citizens in a single language group is more than 10,000; “P” if the percentage of LEP voting age citizens in a single language group is more than five percent of all voting age citizens; “RW” if an Alaskan Native or American Indian reservation is wholly located within the jurisdiction and the percentage of LEP voting age citizens in a single language group is more than five percent of all voting age citizens on that reservation; and “RP” if an Alaskan Native or American Indian reservation is partially located within the jurisdiction and the percentage of LEP voting age citizens in a single language group is more than five percent of all voting age citizens on that reservation. A jurisdiction can be covered for a single language group by multiple population triggers.
84

Appendix C: Language Assistance in Voting Survey (English Version)
Precinct # ____ Surveyor #_____ Voter #______ Time _______ AM / PM ___________________________________________________________________________________________
1. Were you able to vote today? Yes No
(**If Yes**)
a.: In what way did you vote today? (**Read Choices**) Paper ballot fed through machine Provisional ballot (paper ballot not fed through machine) Early or Mail-in Ballot
b.: Have you ever experienced any problems voting? Yes No If yes, please explain________________________________________________________________________________________________________________________________________________________________________________________________
(**If No**) c.: Why were you not able to vote? ____________________________________________________________________________________________________________________________________
i. Were you offered a provisional ballot? Yes No
___________________________________________________________________________________________
2. How do you identify your ethnicity? (**Read Choices**) Hispanic or Latino White Black or African-American American Indian Asian-American or Pacific Islander Other ___________________________________________________
(**If Hispanic or Latino**) a. What is your national origin? For example, Mexican, Guatemalan, etc. ______________________________________________________
___________________________________________________________________________________________
3. What year were you born? 19
85
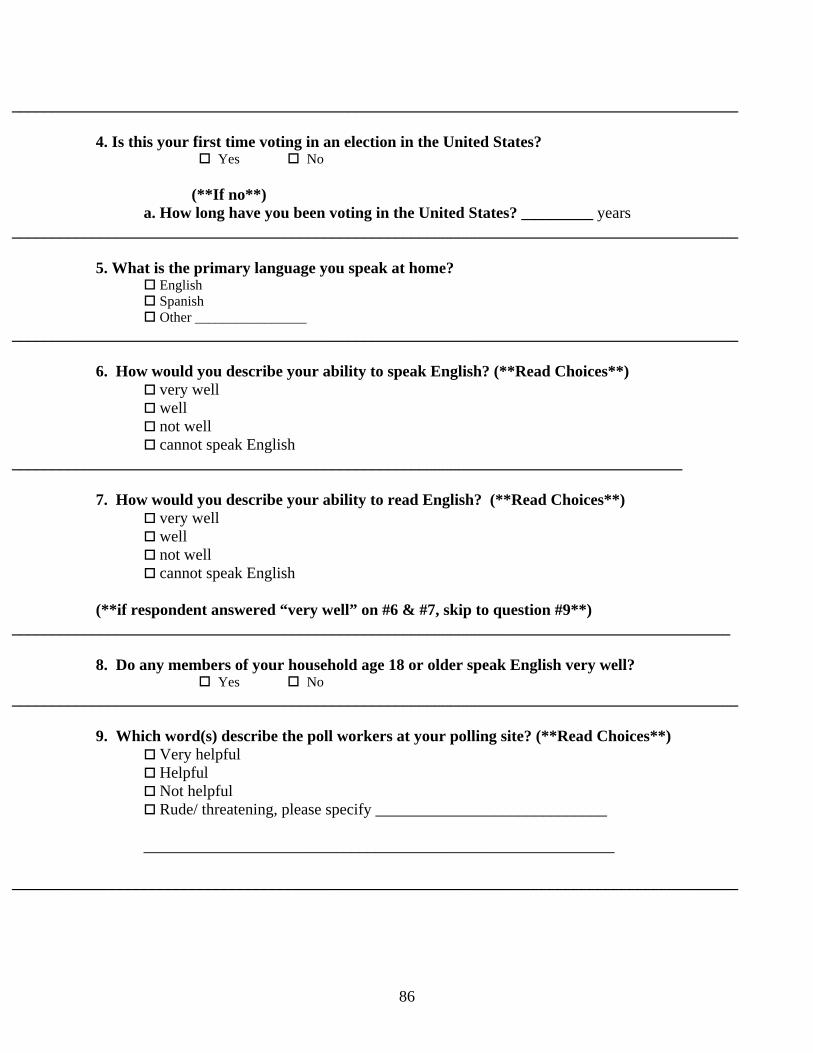
___________________________________________________________________________________________ 4. Is this your first time voting in an election in the United States?
Yes No
(**If no**) a. How long have you been voting in the United States? _________ years
___________________________________________________________________________________________
5. What is the primary language you speak at home? English Spanish Other ________________
___________________________________________________________________________________________ 6. How would you describe your ability to speak English? (**Read Choices**)
very well well not well cannot speak English
____________________________________________________________________________________ 7. How would you describe your ability to read English? (**Read Choices**)
very well well not well cannot speak English
(**if respondent answered “very well” on #6 & #7, skip to question #9**)
__________________________________________________________________________________________ 8. Do any members of your household age 18 or older speak English very well?
Yes No ___________________________________________________________________________________________
9. Which word(s) describe the poll workers at your polling site? (**Read Choices**) Very helpful Helpful Not helpful Rude/ threatening, please specify _____________________________ ___________________________________________________________
___________________________________________________________________________________________
86
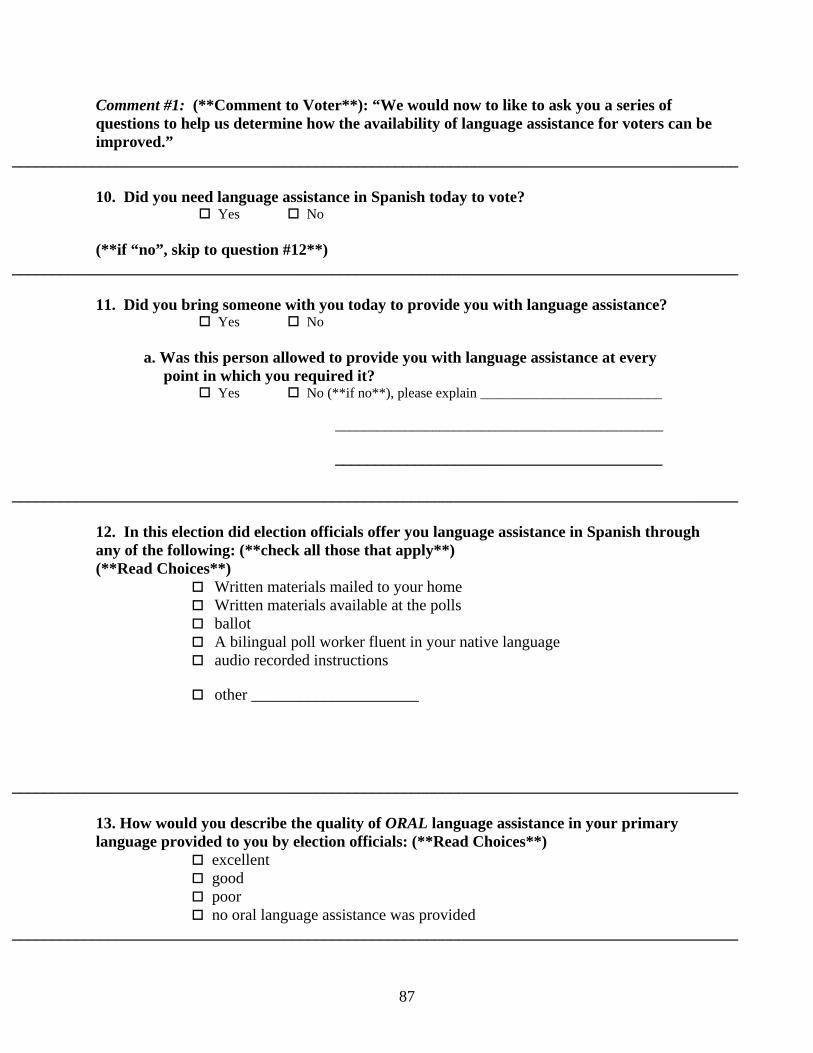
Comment #1: (**Comment to Voter**): “We would now to like to ask you a series of questions to help us determine how the availability of language assistance for voters can be improved.”
___________________________________________________________________________________________ 10. Did you need language assistance in Spanish today to vote?
Yes No (**if “no”, skip to question #12**)
___________________________________________________________________________________________ 11. Did you bring someone with you today to provide you with language assistance?
Yes No
a. Was this person allowed to provide you with language assistance at every point in which you required it? Yes No (**if no**), please explain __________________________ _______________________________________________
_________________________________________
___________________________________________________________________________________________ 12. In this election did election officials offer you language assistance in Spanish through any of the following: (**check all those that apply**) (**Read Choices**)
Written materials mailed to your home Written materials available at the polls ballot A bilingual poll worker fluent in your native language audio recorded instructions
other _____________________
___________________________________________________________________________________________
13. How would you describe the quality of ORAL language assistance in your primary language provided to you by election officials: (**Read Choices**)
excellent good poor no oral language assistance was provided
___________________________________________________________________________________________
87

14. In what ways, if any, can ORAL language assistance for non-English speaking voters be improved?
___________________________________________________________________________________________ 15. How would you describe the quality of WRITTEN language materials available to you in your primary language? (**Read Choices**)
excellent good poor no written language assistance was provided
___________________________________________________________________________________________ 16. In what ways, if any, can WRITTEN language assistance for non-English speaking voters be improved?
___________________________________________________________________________________________ 17. Have you ever been asked by the government to be a poll worker?
Yes No ___________________________________________________________________________________________
18. Have you ever provided language assistance to another voter?
Yes No (**if “no”, skip to Comment #2**)
___________________________________________________________________________________________ 19. Have you ever experienced problems giving language assistance to another voter?
Yes No (**If “yes”), please explain _____________________________________________________ _____________________________________________________________________________
88

_____________________________________________________________________________
Comment #2: (**Comment to voter**): “To help us understand the needs of all voters we would like to ask you a few questions about your background. Again, all your answers are strictly confidential.”
___________________________________________________________________________________________ 20. What was your method of transportation here today? (**Read Choices**) Drove yourself Someone else drove you here Bus Walk Other ____________________________
___________________________________________________________________________________________ 21. Please select your highest level of education from this chart?
less than fifth grade completed fifth grade high school some college college
___________________________________________________________________________________________ 22. What is your citizenship status? Were you….
Born a U.S. citizen? Naturalized less than 3 years ago? Naturalized 3-10 years ago? Naturalized more than 10 years ago?
(**If Naturalized**): a. When did you come to the United States? 19 b. What is your country of origin? ___________________
___________________________________________________________________________________________
(**Comment to Voter**): “Thank you very much for participating in this survey. We greatly appreciate your help. If you have any questions or concerns about this survey you can contact us with the information on this sheet.” (**Hand voter Contact Sheet**)
89

___________________________________________________________________________________________
90

Interviewer Notes ___________________________________________________________________________________________
23. What is the gender of the voter?
Male Female ___________________________________________________________________________________________
24. Was anyone else accompanying the voter?
Yes No (**If yes, check all that apply**) Adult Male(s). How many? ________ Adult Female(s). How many?_______ Anyone under 18. How many?______
a. Did (he/she/they) make any comments during the interview about the questions or the respondent’s answers? Yes No
___________________________________________________________________________________________ 25. Respondent’s overall level of cooperation was: Very Good Good Fair Poor
___________________________________________________________________________________________ 26. Respondent’s overall level of understanding of the questions was: Very Good Good Fair Poor
___________________________________________________________________________________________ 27. Is there anything else you think we ought to know that would help us to understand or interpret the interview?
91