2015 report card arizona’s infrastructure arizona section of the american society of civil...
TRANSCRIPT
EVERY DAY EVERY CITIZEN USES INFRASTRUCTURE20
15
Arizona’s InfrastructureREPORT CARDFOR
www.infrastructurereportcard.org/arizona
TRAN
SIT
WAS
TEW
ATER
EVERY DAY EVERY CITIZEN USES INFRASTRUCTURE
DRIN
KING
W
ATER
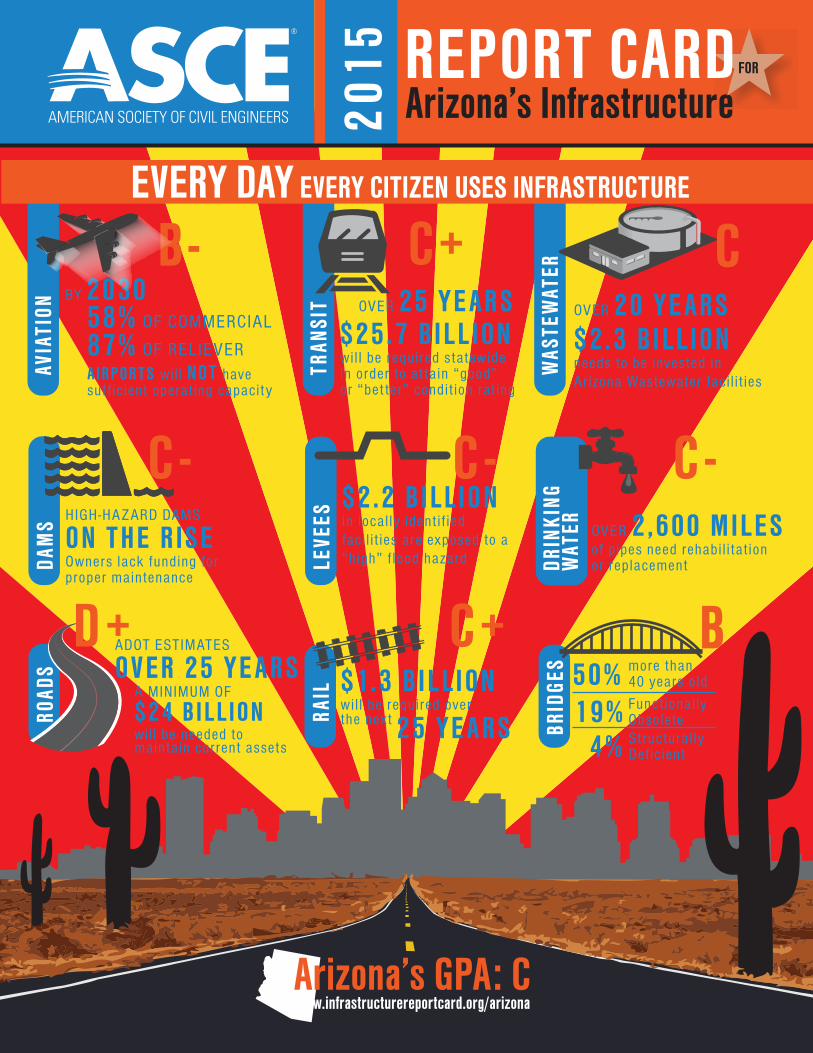
C -OVER 2,600 MILESof pipes need rehabi l i tat ion or replacement
Arizona’s GPA: C
B -
AVIA
TION
BY 2030OVER 25 YE ARS
C -HIGH-HA Z ARD DAMS
ON THE RISEOwners lack funding forproper maintenance
58% OF COMMERCIAL
87% OF RELIEVER AIRPORT S wi l l NOT have suf f ic ient operat ing capacit y
2015
Arizona’s InfrastructureREPORT CARDFOR
ROAD
SDA
MS
LEVE
ES
$1.3 BILLIONwil l be required over the next
$2.2 BILLIONin local ly ident i f iedfaci l i t ies are exposed to a“high” f lood hazard
D+
RAIL
C+more than 40 years old
BRID
GES
B
C+
C -
50%19% Funct ional ly
Obsolete
4% Structural lyDef ic ient
ADOT ESTIMATES
OVER 25 YE ARSA MINIMUM OF
$24 BILLIONwil l be needed to maintain current assets
25 YE ARS
$25.7 BILLIONwil l be required statewidein order to at tain “good” or “bet ter” condit ion rat ing
OVER 20 YE ARS$2.3 BILLIONneeds to be invested inArizona Wastewater faci l i t ies
C
www.infrastructurereportcard.org/arizona
2015 REPORT CARD FOR ARIZONA’S INFRASTRUCTURE
Infrastructure is all of the systems built to
make our lives better and our economy
more efficient. Roads, water pipes, dams,
railways and much more make up the
modern infrastructure you use every day.
Generations of Arizonans built today’s expansive infrastructure,
and our leaders are responsible for keeping it working for us today
and keeping up with a growing population that uses more
infrastructure. While some of Arizona’s infrastructure is relatively
new, many of our systems are starting to show signs of wear
across the state from aging and tight budgets that didn’t allow for
the maintenance that would have expanded their useful service
life.
So, how is Arizona’s infrastructure doing
overall and what needs to be done?
The Arizona Section of the American Society of Civil Engineers
(ASCE) compiled a volunteer team of civil engineers from the public, private and non-profit sectors with wide-ranging
infrastructure industry expertise to prepare a school-style Report Card for Arizona’s Infrastructure. Using a simple A to
F grading system, the Report Card takes stock of information related to Arizona’s infrastructure for 9 specific
infrastructure types and what should be done to raise the grades. This Report Card builds upon the findings of ASCE’s
National Report Card for America’s Infrastructure, most recently published in 2013. Evaluations were based on the
following criteria:
Capacity – Does Arizona’s infrastructure have adequate capacity to serve the public now and in the future?
Condition – What is the condition of the existing infrastructure and how will it affect its reliability and safety?
Operations and Maintenance – Is there adequate funding and planning for proper operations and maintenance
now and in the future? Will facilities meet regulatory requirements?
Funding – Is there adequate funding for capital and capacity improvements as well as operations and
maintenance to extend the working life of infrastructure assets?
Public Safety – Without needed improvements, will public safety be jeopardized? What are the consequences
of a failure to maintain the state’s infrastructure?
Resilience – Is the current infrastructure adequate to protect against natural hazards? Can critical services be
recovered quickly in an emergency?
Innovation – How innovative is the operation, financing, and maintenance of the infrastructure?
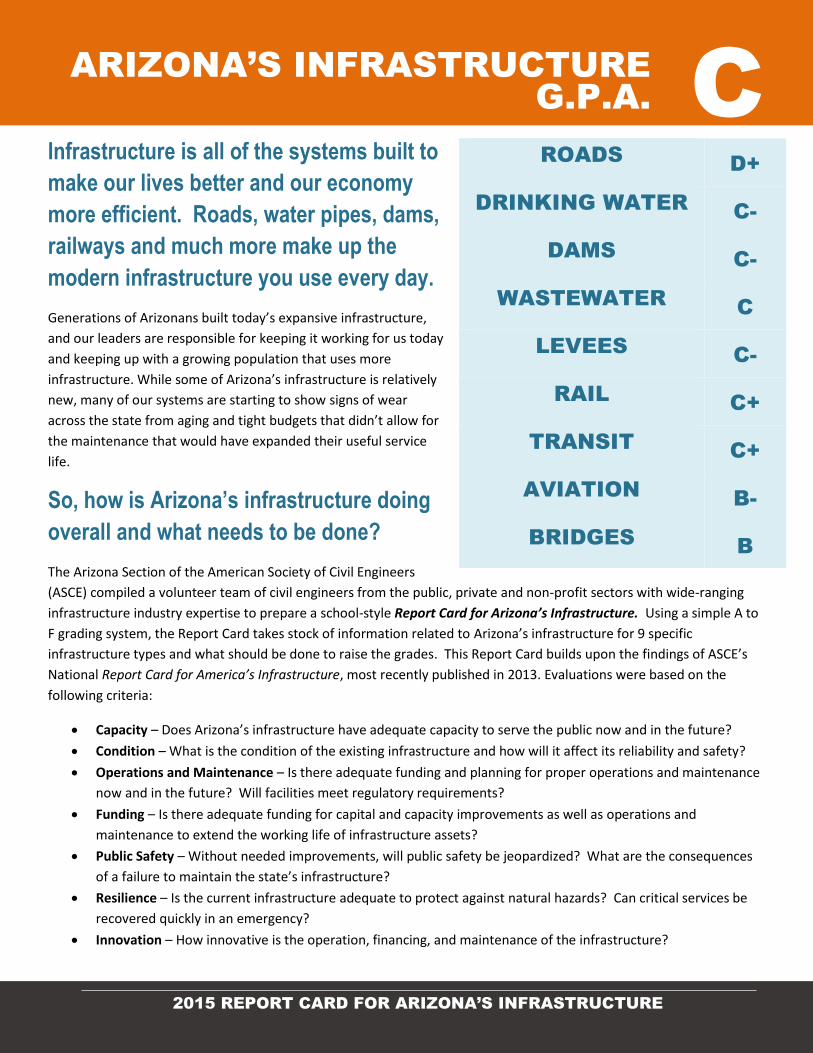
ROADS D+
DRINKING WATER C-
DAMS C-
WASTEWATER C
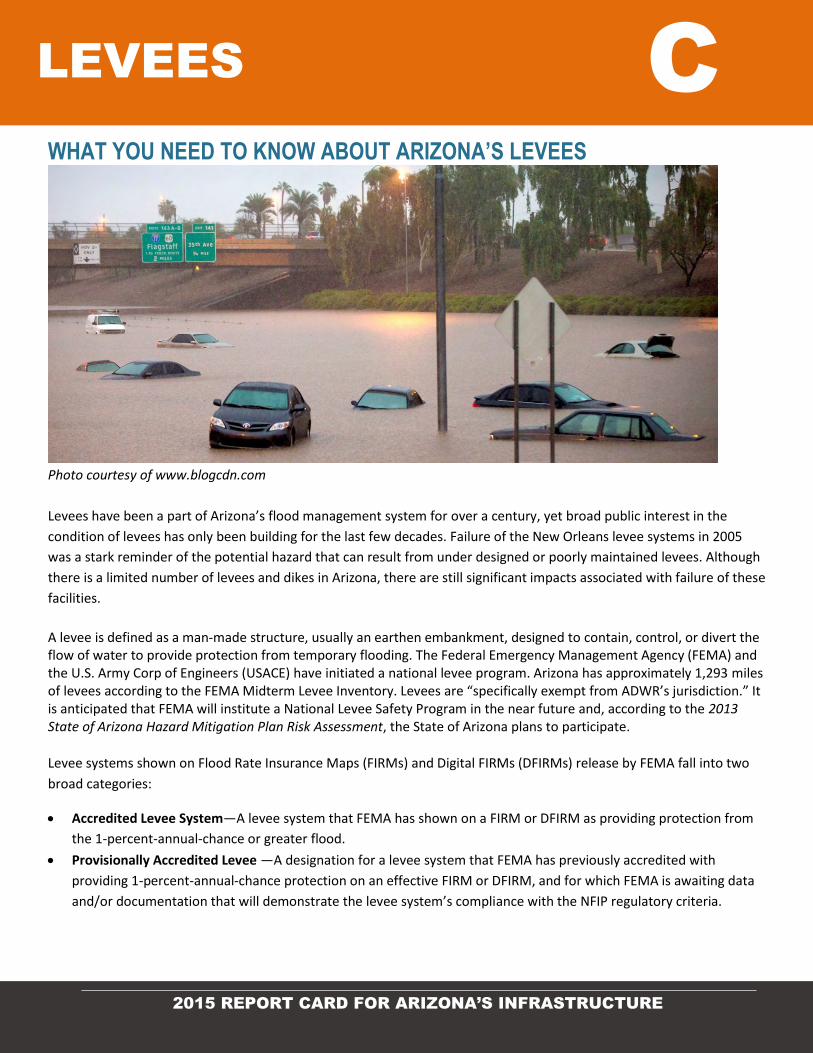
LEVEES C-
RAIL C+
TRANSIT C+
AVIATION B-
BRIDGES B
ARIZONA’S INFRASTRUCTURE
G.P.A. C
2015 REPORT CARD FOR ARIZONA’S INFRASTRUCTURE
The Report Card for Arizona’s Infrastructure shows that some our state’s infrastructure needs attention both for
today and the future. Many of Arizona’s grades are low Cs and on the edge of slipping into Ds - especially as the
state grows. 1. We need infrastructure every day so we have to keep it
working with good maintenance.
Maintenance is the every day work you just have to do to keep things moving, and Arizona’s infrastructure
needs it. Sometimes it’s all about the basics, and maintenance is the basic, first step to good infrastructure.
2. Investing in infrastructure has allowed Arizona to
grow, and investing in smart projects will keep it
growing.
Arizona has seen exciting new infrastructure projects over the last decade become selling points for the
state and bring in new residents and businesses. New investments in critical corridors and freight
connections can lead to new opportunities. Let’s keep this going!
3. Every community’s leaders should order an
infrastructure health check-up.
Just like your body, infrastructure is a system. The water pipes and roads and railways are the arteries that
keep the state moving so it’s worth asking – how is your area’s infrastructure doing? Just like a physical,
infrastructure needs regular evaluations.
4. Borrowing from infrastructure funds just means you’ll
pay more tomorrow.
Arizona’s leaders have to make tough budget choices, but not using infrastructure dollars for needed
projects today will lead to more expensive project costs down the road and infrastructure conditions that
hinder growth rather than support it.
5. Planning for Arizona’s future starts today with
sustainable choices, innovative investments, and
resilience.
Arizona’s projected growth is both an opportunity and a challenge. It will require continued focus by the
state’s leaders to adopt sustainable practices and innovate to be competitive.
RAISE THE GRADES
2015 REPORT CARD FOR ARIZONA’S INFRASTRUCTURE
BRIDGE SUFFICIENCY
Sufficiency Rating Scale: 0 – 100 Fully Sufficient Bridge: 100
Sufficiency Rating Components: Structural Adequacy & Safety: 0-55 Serviceability & Functionality: 0-30 Essentiality for Public Use: 0-15 Reductions (Type, Detour, Traffic): 0-13 (neg.)
WHAT YOU SHOULD KNOW ABOUT ARIZONA’S BRIDGES
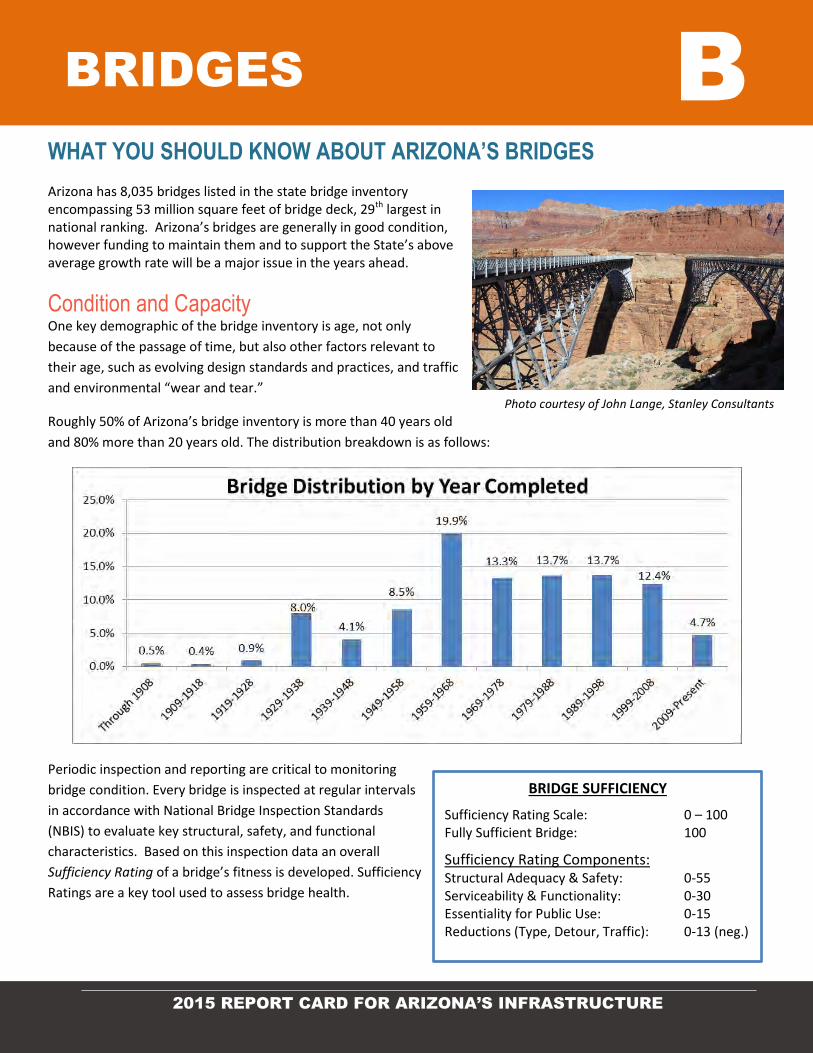
Arizona has 8,035 bridges listed in the state bridge inventory encompassing 53 million square feet of bridge deck, 29th largest in national ranking. Arizona’s bridges are generally in good condition, however funding to maintain them and to support the State’s above average growth rate will be a major issue in the years ahead.
Condition and Capacity One key demographic of the bridge inventory is age, not only
because of the passage of time, but also other factors relevant to
their age, such as evolving design standards and practices, and traffic
and environmental “wear and tear.”
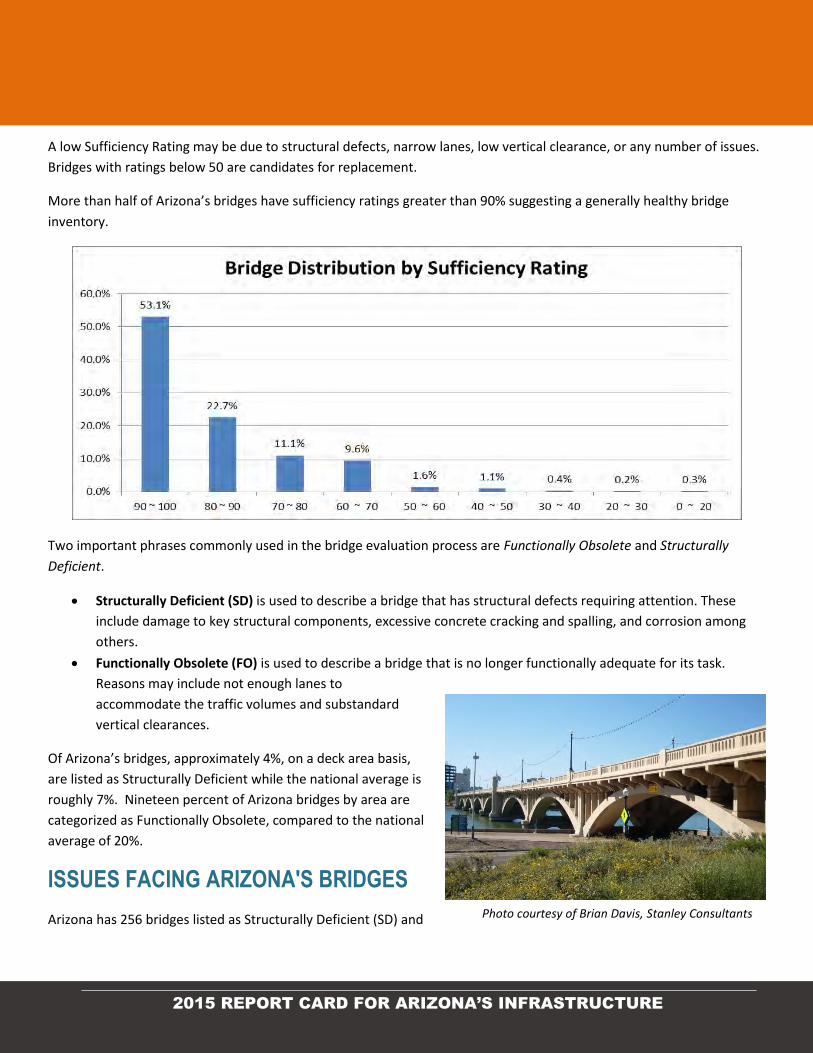
Roughly 50% of Arizona’s bridge inventory is more than 40 years old
and 80% more than 20 years old. The distribution breakdown is as follows:
Periodic inspection and reporting are critical to monitoring
bridge condition. Every bridge is inspected at regular intervals
in accordance with National Bridge Inspection Standards
(NBIS) to evaluate key structural, safety, and functional
characteristics. Based on this inspection data an overall
Sufficiency Rating of a bridge’s fitness is developed. Sufficiency
Ratings are a key tool used to assess bridge health.
BRIDGES B
Photo courtesy of John Lange, Stanley Consultants
2015 REPORT CARD FOR ARIZONA’S INFRASTRUCTURE
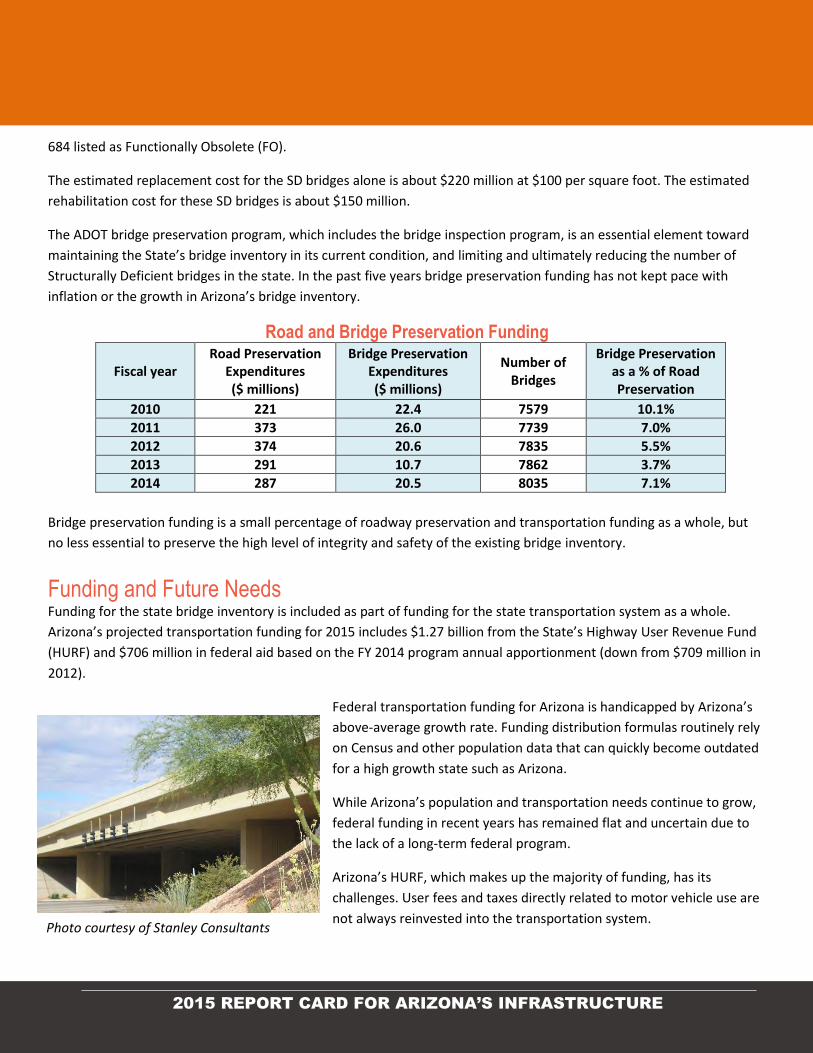
A low Sufficiency Rating may be due to structural defects, narrow lanes, low vertical clearance, or any number of issues.
Bridges with ratings below 50 are candidates for replacement.
More than half of Arizona’s bridges have sufficiency ratings greater than 90% suggesting a generally healthy bridge
inventory.
Two important phrases commonly used in the bridge evaluation process are Functionally Obsolete and Structurally
Deficient.
Structurally Deficient (SD) is used to describe a bridge that has structural defects requiring attention. These
include damage to key structural components, excessive concrete cracking and spalling, and corrosion among
others.
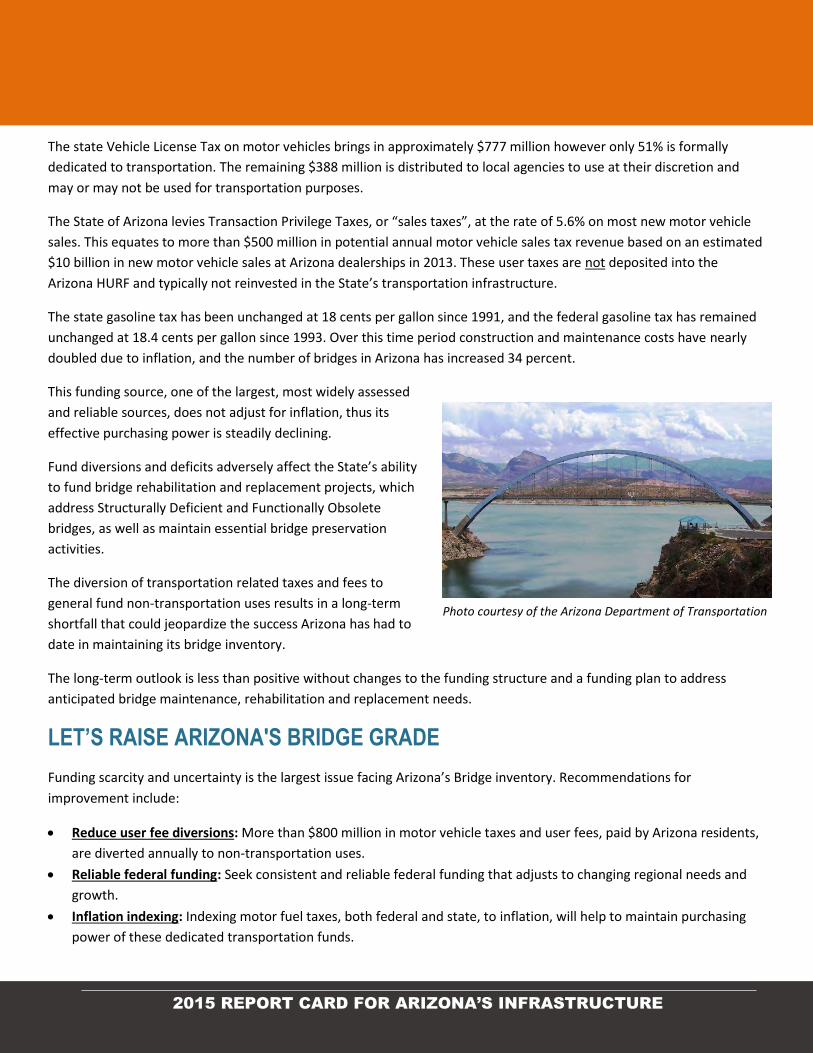
Functionally Obsolete (FO) is used to describe a bridge that is no longer functionally adequate for its task.
Reasons may include not enough lanes to
accommodate the traffic volumes and substandard
vertical clearances.
Of Arizona’s bridges, approximately 4%, on a deck area basis,
are listed as Structurally Deficient while the national average is
roughly 7%. Nineteen percent of Arizona bridges by area are
categorized as Functionally Obsolete, compared to the national
average of 20%.
ISSUES FACING ARIZONA'S BRIDGES
Arizona has 256 bridges listed as Structurally Deficient (SD) and Photo courtesy of Brian Davis, Stanley Consultants
2015 REPORT CARD FOR ARIZONA’S INFRASTRUCTURE
684 listed as Functionally Obsolete (FO).
The estimated replacement cost for the SD bridges alone is about $220 million at $100 per square foot. The estimated
rehabilitation cost for these SD bridges is about $150 million.
The ADOT bridge preservation program, which includes the bridge inspection program, is an essential element toward
maintaining the State’s bridge inventory in its current condition, and limiting and ultimately reducing the number of
Structurally Deficient bridges in the state. In the past five years bridge preservation funding has not kept pace with
inflation or the growth in Arizona’s bridge inventory.
Road and Bridge Preservation Funding
Fiscal year Road Preservation
Expenditures ($ millions)
Bridge Preservation Expenditures ($ millions)
Number of Bridges
Bridge Preservation as a % of Road Preservation
2010 221 22.4 7579 10.1%
2011 373 26.0 7739 7.0%
2012 374 20.6 7835 5.5%
2013 291 10.7 7862 3.7%
2014 287 20.5 8035 7.1%
Bridge preservation funding is a small percentage of roadway preservation and transportation funding as a whole, but
no less essential to preserve the high level of integrity and safety of the existing bridge inventory.
Funding and Future Needs Funding for the state bridge inventory is included as part of funding for the state transportation system as a whole.
Arizona’s projected transportation funding for 2015 includes $1.27 billion from the State’s Highway User Revenue Fund
(HURF) and $706 million in federal aid based on the FY 2014 program annual apportionment (down from $709 million in
2012).
Federal transportation funding for Arizona is handicapped by Arizona’s
above-average growth rate. Funding distribution formulas routinely rely
on Census and other population data that can quickly become outdated
for a high growth state such as Arizona.
While Arizona’s population and transportation needs continue to grow,
federal funding in recent years has remained flat and uncertain due to
the lack of a long-term federal program.
Arizona’s HURF, which makes up the majority of funding, has its
challenges. User fees and taxes directly related to motor vehicle use are
not always reinvested into the transportation system. Photo courtesy of Stanley Consultants
2015 REPORT CARD FOR ARIZONA’S INFRASTRUCTURE
The state Vehicle License Tax on motor vehicles brings in approximately $777 million however only 51% is formally
dedicated to transportation. The remaining $388 million is distributed to local agencies to use at their discretion and
may or may not be used for transportation purposes.
The State of Arizona levies Transaction Privilege Taxes, or “sales taxes”, at the rate of 5.6% on most new motor vehicle
sales. This equates to more than $500 million in potential annual motor vehicle sales tax revenue based on an estimated
$10 billion in new motor vehicle sales at Arizona dealerships in 2013. These user taxes are not deposited into the
Arizona HURF and typically not reinvested in the State’s transportation infrastructure.
The state gasoline tax has been unchanged at 18 cents per gallon since 1991, and the federal gasoline tax has remained
unchanged at 18.4 cents per gallon since 1993. Over this time period construction and maintenance costs have nearly
doubled due to inflation, and the number of bridges in Arizona has increased 34 percent.
This funding source, one of the largest, most widely assessed
and reliable sources, does not adjust for inflation, thus its
effective purchasing power is steadily declining.
Fund diversions and deficits adversely affect the State’s ability
to fund bridge rehabilitation and replacement projects, which
address Structurally Deficient and Functionally Obsolete
bridges, as well as maintain essential bridge preservation
activities.
The diversion of transportation related taxes and fees to
general fund non-transportation uses results in a long-term
shortfall that could jeopardize the success Arizona has had to
date in maintaining its bridge inventory.
The long-term outlook is less than positive without changes to the funding structure and a funding plan to address
anticipated bridge maintenance, rehabilitation and replacement needs.
LET’S RAISE ARIZONA'S BRIDGE GRADE
Funding scarcity and uncertainty is the largest issue facing Arizona’s Bridge inventory. Recommendations for
improvement include:
Reduce user fee diversions: More than $800 million in motor vehicle taxes and user fees, paid by Arizona residents,
are diverted annually to non-transportation uses.
Reliable federal funding: Seek consistent and reliable federal funding that adjusts to changing regional needs and
growth.
Inflation indexing: Indexing motor fuel taxes, both federal and state, to inflation, will help to maintain purchasing
power of these dedicated transportation funds.
Photo courtesy of the Arizona Department of Transportation
2015 REPORT CARD FOR ARIZONA’S INFRASTRUCTURE
FIND OUT MORE
Arizona Department of Transportation, Overview of Bridges in Arizona, An Executive Summary of Bridge
Information from the National Bridge Inventory, 2013.
U.S. Department of Transportation Federal Highway Administration, Deficient Bridges by State and Highway
System 2014.
Arizona Department of Transportation, Comprehensive Annual Financial Report for the Fiscal Year Ended June
30, 2014.
Arizona Highway User Revenue Fund Forecasting Process & Results FY 2015-2024, ADOT Financial Management
Services, September 2014.
U.S. Department of Transportation, Summary of Apportionments of Federal-aid Program Funds Authorized
under the Moving Ahead for Progress in the 21st Century Act.
Arizona Department of Transportation, Vehicle License Tax Distribution FY 2014.
National Automobile Dealers, NADA Data, 2014.
2015 REPORT CARD FOR ARIZONA’S INFRASTRUCTURE
Photographs courtesy of Valley Metro/RPTA/RTA
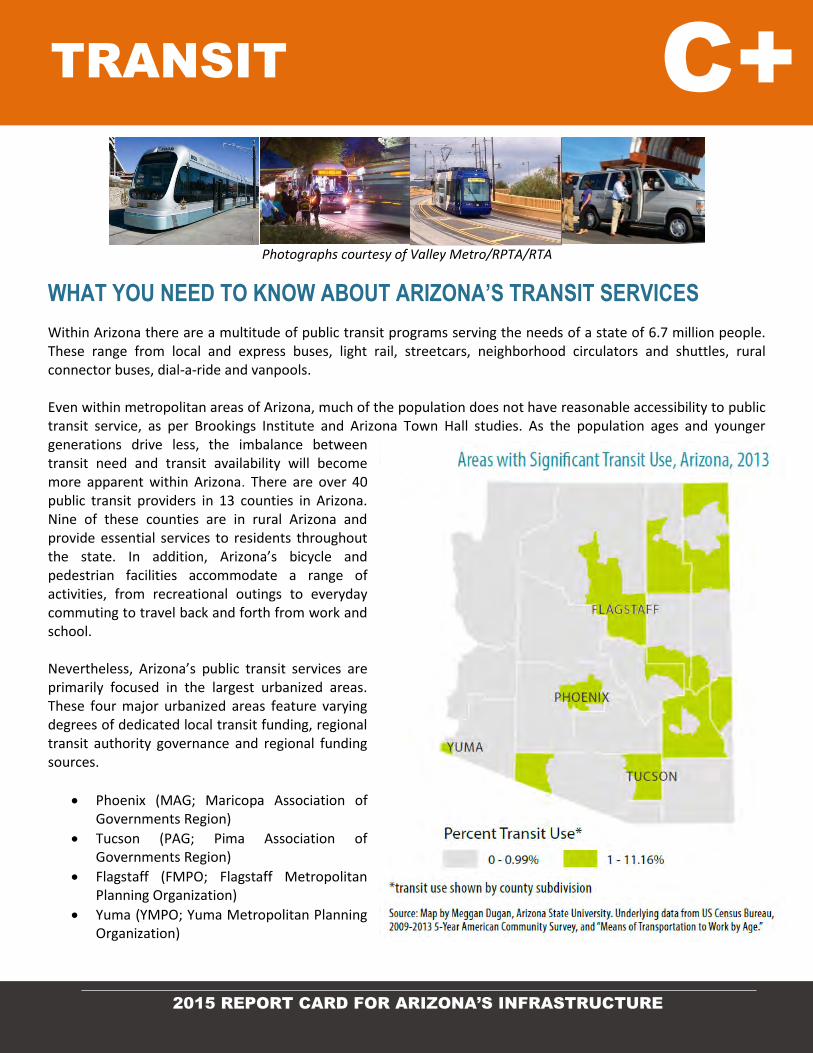
WHAT YOU NEED TO KNOW ABOUT ARIZONA’S TRANSIT SERVICES
Within Arizona there are a multitude of public transit programs serving the needs of a state of 6.7 million people. These range from local and express buses, light rail, streetcars, neighborhood circulators and shuttles, rural connector buses, dial-a-ride and vanpools. Even within metropolitan areas of Arizona, much of the population does not have reasonable accessibility to public transit service, as per Brookings Institute and Arizona Town Hall studies. As the population ages and younger generations drive less, the imbalance between transit need and transit availability will become more apparent within Arizona. There are over 40 public transit providers in 13 counties in Arizona. Nine of these counties are in rural Arizona and provide essential services to residents throughout the state. In addition, Arizona’s bicycle and pedestrian facilities accommodate a range of activities, from recreational outings to everyday commuting to travel back and forth from work and school. Nevertheless, Arizona’s public transit services are primarily focused in the largest urbanized areas. These four major urbanized areas feature varying degrees of dedicated local transit funding, regional transit authority governance and regional funding sources.
Phoenix (MAG; Maricopa Association of Governments Region)
Tucson (PAG; Pima Association of Governments Region)
Flagstaff (FMPO; Flagstaff Metropolitan Planning Organization)
Yuma (YMPO; Yuma Metropolitan Planning Organization)
TRANSIT C+
2015 REPORT CARD FOR ARIZONA’S INFRASTRUCTURE
Non-motorized transit While bicycle and pedestrian improvements are implemented primarily by local governments, major construction and reconstruction highway projects in the State consider provisions for bicycle travel per design guidelines, and local agencies may fund the incorporation of bicycle lanes on the State Highway System. Most off street bike facilities/pathways systems are funded, maintained and managed by those respective communities. These include: the 3,520-mile metropolitan Phoenix MAG Bikeways system, the 100-mile Pima County Loop, the 50-mile City of Flagstaff Urban Trail system and the 48-mile Prescott Mile High Trail system. ADOT has begun development of a statewide bicycle and pedestrian plan to consider strengthening existing provisions, determine needs and funding, as well as recommended policies associated with non-motorized travel in the State. Cities and Agencies have also adopted “Complete Streets” concepts – supporting highways that are safe and accommodating for all users – may be explored to accommodate all users of the State Highway System, with a focus on bicycle and pedestrian safety. While there is no current dedicated, statewide, funding source for public transit, the Arizona Department of Transportation Multimodal Planning Division (ADOT-MPD) manages and administers a variety of transit programs on behalf of the Federal Transit Administration (FTA) and Moving Ahead for Progress in the 21st Century (MAP-21). Among the most common Public Transit programs are:
FTA 5311: funds for rural areas, states for admin, capital and operating assistance.
FTA 5307: funds for small urbanized areas (UZAs), available through ADOT’s competitive pool process to fund operating and capital project(s).
FTA 5339: MAP-21 funds Bus and Bus Facilities programs, funds to replace, rehabilitate, and purchase buses; equipment and bus facilities. Available through ADOT’s competitive pool process, limited to existing small urban designated UZAs.
FTA 5310: formula funds for private nonprofit agencies, Native American Indian communities or groups in small urban/ rural areas under the auspices of Enhanced Mobility of Seniors and Individuals with Disabilities. Surface Transportation Program (STP) flex component also provides up to $6.5 million annually for capital improvements, car, vanpool projects, fringe and corridor parking facilities, bicycle and pedestrian facilities, and intercity or intracity bus terminals and bus facilities.
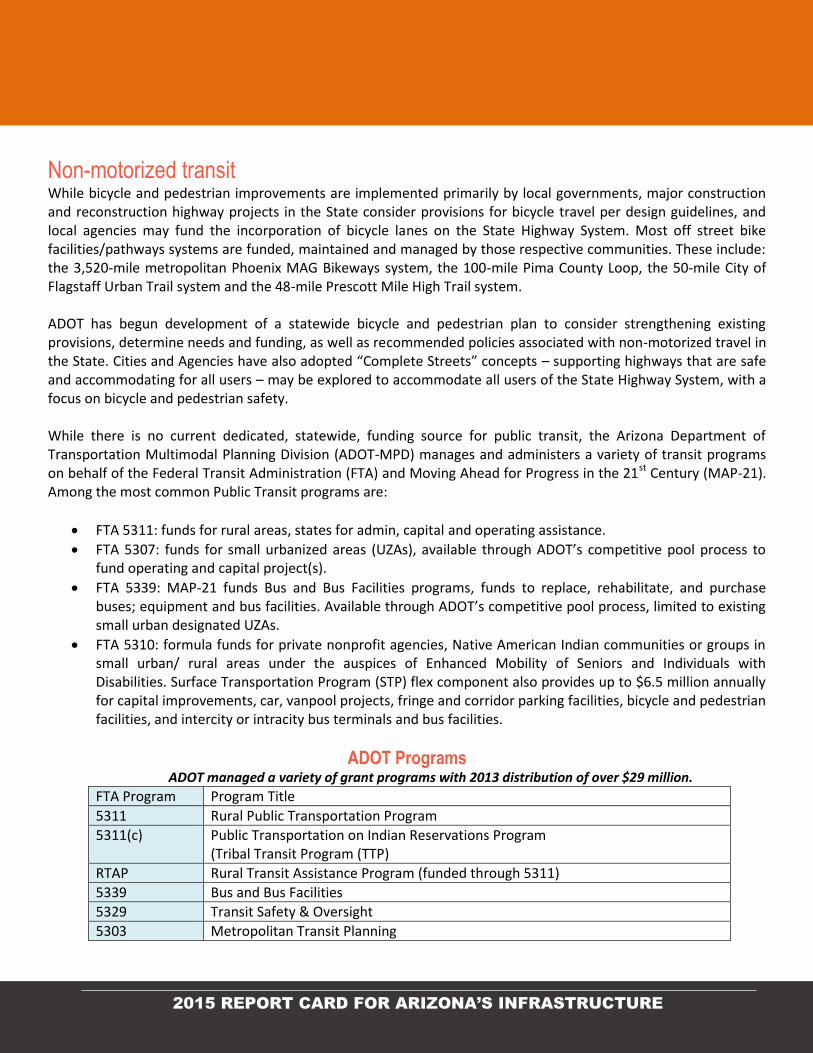
ADOT Programs ADOT managed a variety of grant programs with 2013 distribution of over $29 million.
FTA Program Program Title
5311 Rural Public Transportation Program
5311(c) Public Transportation on Indian Reservations Program (Tribal Transit Program (TTP)
RTAP Rural Transit Assistance Program (funded through 5311)
5339 Bus and Bus Facilities
5329 Transit Safety & Oversight
5303 Metropolitan Transit Planning
2015 REPORT CARD FOR ARIZONA’S INFRASTRUCTURE
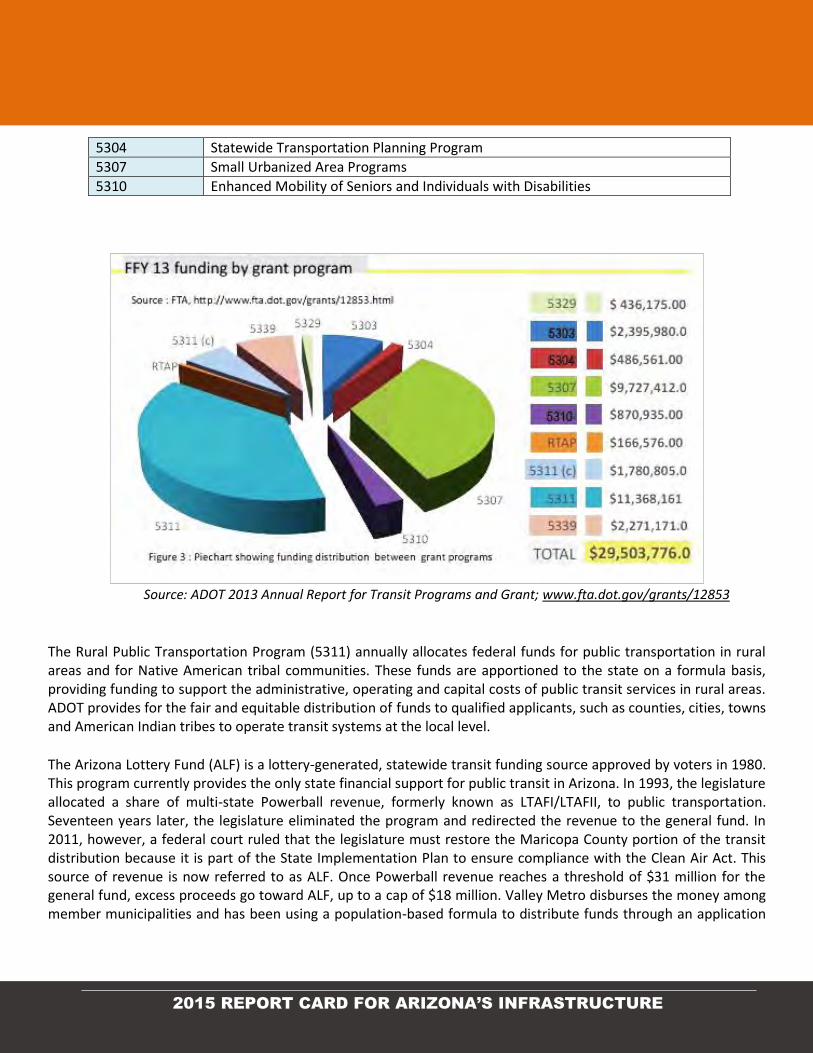
5304 Statewide Transportation Planning Program
5307 Small Urbanized Area Programs
5310 Enhanced Mobility of Seniors and Individuals with Disabilities
Source: ADOT 2013 Annual Report for Transit Programs and Grant; www.fta.dot.gov/grants/12853
The Rural Public Transportation Program (5311) annually allocates federal funds for public transportation in rural areas and for Native American tribal communities. These funds are apportioned to the state on a formula basis, providing funding to support the administrative, operating and capital costs of public transit services in rural areas. ADOT provides for the fair and equitable distribution of funds to qualified applicants, such as counties, cities, towns and American Indian tribes to operate transit systems at the local level.
The Arizona Lottery Fund (ALF) is a lottery-generated, statewide transit funding source approved by voters in 1980. This program currently provides the only state financial support for public transit in Arizona. In 1993, the legislature allocated a share of multi-state Powerball revenue, formerly known as LTAFI/LTAFII, to public transportation. Seventeen years later, the legislature eliminated the program and redirected the revenue to the general fund. In 2011, however, a federal court ruled that the legislature must restore the Maricopa County portion of the transit distribution because it is part of the State Implementation Plan to ensure compliance with the Clean Air Act. This source of revenue is now referred to as ALF. Once Powerball revenue reaches a threshold of $31 million for the general fund, excess proceeds go toward ALF, up to a cap of $18 million. Valley Metro disburses the money among member municipalities and has been using a population-based formula to distribute funds through an application
2015 REPORT CARD FOR ARIZONA’S INFRASTRUCTURE
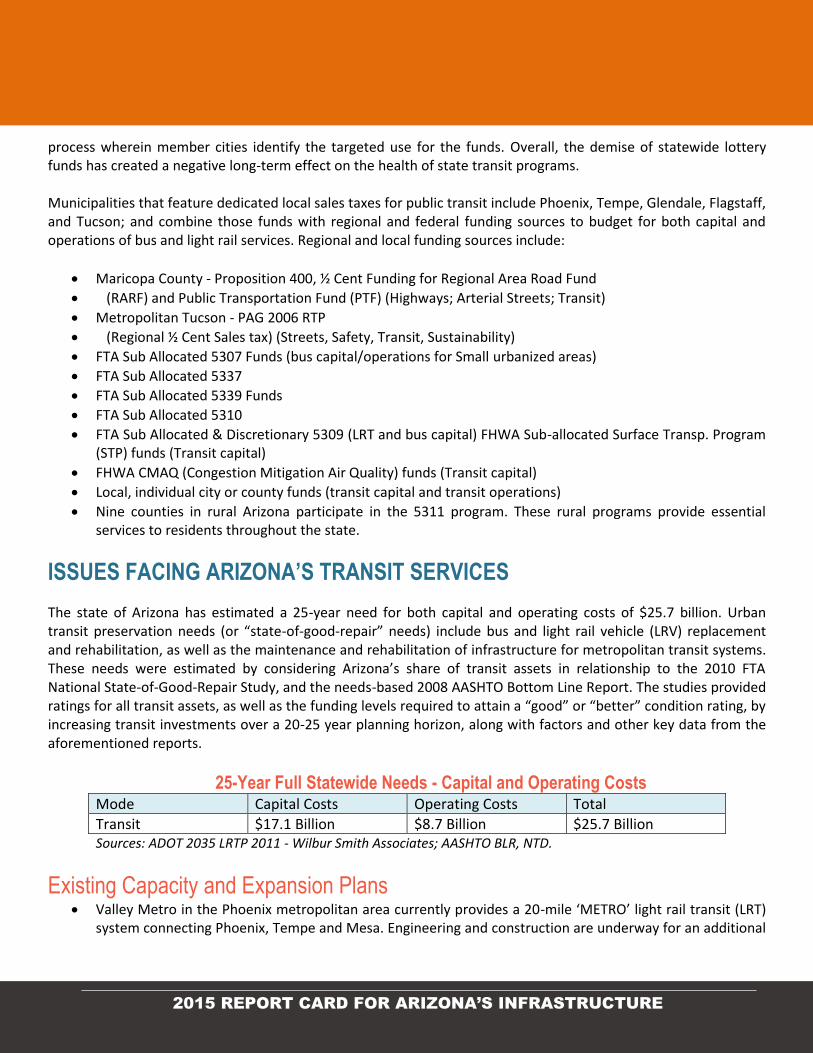
process wherein member cities identify the targeted use for the funds. Overall, the demise of statewide lottery funds has created a negative long-term effect on the health of state transit programs. Municipalities that feature dedicated local sales taxes for public transit include Phoenix, Tempe, Glendale, Flagstaff, and Tucson; and combine those funds with regional and federal funding sources to budget for both capital and operations of bus and light rail services. Regional and local funding sources include:
Maricopa County - Proposition 400, ½ Cent Funding for Regional Area Road Fund
(RARF) and Public Transportation Fund (PTF) (Highways; Arterial Streets; Transit)
Metropolitan Tucson - PAG 2006 RTP
(Regional ½ Cent Sales tax) (Streets, Safety, Transit, Sustainability)
FTA Sub Allocated 5307 Funds (bus capital/operations for Small urbanized areas)
FTA Sub Allocated 5337
FTA Sub Allocated 5339 Funds
FTA Sub Allocated 5310
FTA Sub Allocated & Discretionary 5309 (LRT and bus capital) FHWA Sub-allocated Surface Transp. Program (STP) funds (Transit capital)
FHWA CMAQ (Congestion Mitigation Air Quality) funds (Transit capital)
Local, individual city or county funds (transit capital and transit operations)
Nine counties in rural Arizona participate in the 5311 program. These rural programs provide essential services to residents throughout the state.
ISSUES FACING ARIZONA’S TRANSIT SERVICES
The state of Arizona has estimated a 25-year need for both capital and operating costs of $25.7 billion. Urban transit preservation needs (or “state-of-good-repair” needs) include bus and light rail vehicle (LRV) replacement and rehabilitation, as well as the maintenance and rehabilitation of infrastructure for metropolitan transit systems. These needs were estimated by considering Arizona’s share of transit assets in relationship to the 2010 FTA National State-of-Good-Repair Study, and the needs-based 2008 AASHTO Bottom Line Report. The studies provided ratings for all transit assets, as well as the funding levels required to attain a “good” or “better” condition rating, by increasing transit investments over a 20-25 year planning horizon, along with factors and other key data from the aforementioned reports.
25-Year Full Statewide Needs - Capital and Operating Costs Mode Capital Costs Operating Costs Total
Transit $17.1 Billion $8.7 Billion $25.7 Billion Sources: ADOT 2035 LRTP 2011 - Wilbur Smith Associates; AASHTO BLR, NTD.
Existing Capacity and Expansion Plans Valley Metro in the Phoenix metropolitan area currently provides a 20-mile ‘METRO’ light rail transit (LRT)
system connecting Phoenix, Tempe and Mesa. Engineering and construction are underway for an additional
2015 REPORT CARD FOR ARIZONA’S INFRASTRUCTURE
8.2 miles of new light rail (Northwest Phase 1, Mesa Ext. and Gilbert Rd Ext.), and up to 3-miles of Tempe Streetcar by 2018. A full 57 mile LRT system plan was approved by voters in 2004.
City of Phoenix’s Sky Harbor International Airport implemented an automated people mover (APM) linking the METRO light rail service with Terminal 4 in April 2013 and with Terminal 3 in December 2014. Long term vision calls for a 5-mile system linking car rental, parking and all three terminals. The technology, while a rubber tired train, is considered ‘fixed-guideway’, hence its inclusion herein.
RTA/PAG in the Tucson metropolitan area opened the 4-mile ‘SUNLINK’ modern streetcar system in July 2014. The line operates between the University of Arizona campus, downtown Tucson and the Rio Nuevo/I-10 development.
LET’S RAISE ARIZONA’S TRANSIT GRADE
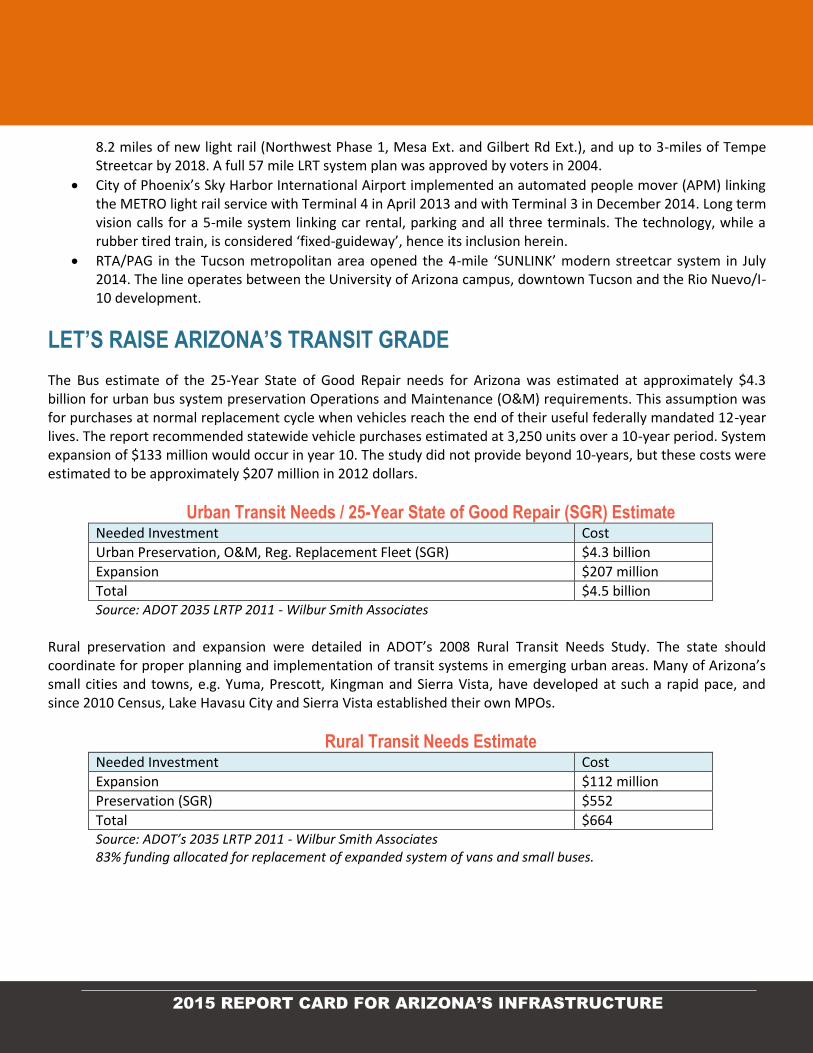
The Bus estimate of the 25-Year State of Good Repair needs for Arizona was estimated at approximately $4.3 billion for urban bus system preservation Operations and Maintenance (O&M) requirements. This assumption was for purchases at normal replacement cycle when vehicles reach the end of their useful federally mandated 12-year lives. The report recommended statewide vehicle purchases estimated at 3,250 units over a 10-year period. System expansion of $133 million would occur in year 10. The study did not provide beyond 10-years, but these costs were estimated to be approximately $207 million in 2012 dollars.
Urban Transit Needs / 25-Year State of Good Repair (SGR) Estimate Needed Investment Cost
Urban Preservation, O&M, Reg. Replacement Fleet (SGR) $4.3 billion
Expansion $207 million
Total $4.5 billion Source: ADOT 2035 LRTP 2011 - Wilbur Smith Associates
Rural preservation and expansion were detailed in ADOT’s 2008 Rural Transit Needs Study. The state should coordinate for proper planning and implementation of transit systems in emerging urban areas. Many of Arizona’s small cities and towns, e.g. Yuma, Prescott, Kingman and Sierra Vista, have developed at such a rapid pace, and since 2010 Census, Lake Havasu City and Sierra Vista established their own MPOs.
Rural Transit Needs Estimate Needed Investment Cost
Expansion $112 million
Preservation (SGR) $552
Total $664 Source: ADOT’s 2035 LRTP 2011 - Wilbur Smith Associates 83% funding allocated for replacement of expanded system of vans and small buses.
2015 REPORT CARD FOR ARIZONA’S INFRASTRUCTURE
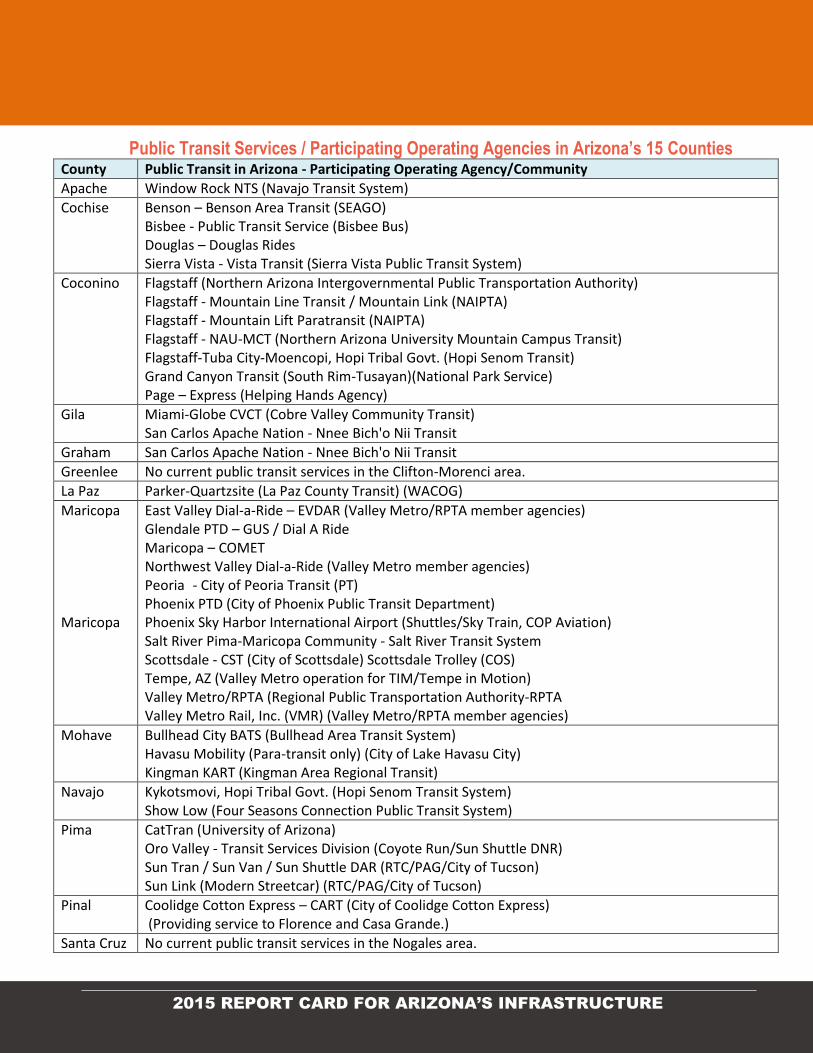
Public Transit Services / Participating Operating Agencies in Arizona’s 15 Counties County Public Transit in Arizona - Participating Operating Agency/Community
Apache Window Rock NTS (Navajo Transit System)
Cochise Benson – Benson Area Transit (SEAGO) Bisbee - Public Transit Service (Bisbee Bus) Douglas – Douglas Rides Sierra Vista - Vista Transit (Sierra Vista Public Transit System)
Coconino Flagstaff (Northern Arizona Intergovernmental Public Transportation Authority) Flagstaff - Mountain Line Transit / Mountain Link (NAIPTA) Flagstaff - Mountain Lift Paratransit (NAIPTA) Flagstaff - NAU-MCT (Northern Arizona University Mountain Campus Transit) Flagstaff-Tuba City-Moencopi, Hopi Tribal Govt. (Hopi Senom Transit) Grand Canyon Transit (South Rim-Tusayan)(National Park Service) Page – Express (Helping Hands Agency)
Gila Miami-Globe CVCT (Cobre Valley Community Transit) San Carlos Apache Nation - Nnee Bich'o Nii Transit
Graham San Carlos Apache Nation - Nnee Bich'o Nii Transit
Greenlee No current public transit services in the Clifton-Morenci area.
La Paz Parker-Quartzsite (La Paz County Transit) (WACOG)
Maricopa Maricopa
East Valley Dial-a-Ride – EVDAR (Valley Metro/RPTA member agencies) Glendale PTD – GUS / Dial A Ride Maricopa – COMET Northwest Valley Dial-a-Ride (Valley Metro member agencies) Peoria - City of Peoria Transit (PT) Phoenix PTD (City of Phoenix Public Transit Department) Phoenix Sky Harbor International Airport (Shuttles/Sky Train, COP Aviation) Salt River Pima-Maricopa Community - Salt River Transit System Scottsdale - CST (City of Scottsdale) Scottsdale Trolley (COS) Tempe, AZ (Valley Metro operation for TIM/Tempe in Motion) Valley Metro/RPTA (Regional Public Transportation Authority-RPTA Valley Metro Rail, Inc. (VMR) (Valley Metro/RPTA member agencies)
Mohave Bullhead City BATS (Bullhead Area Transit System) Havasu Mobility (Para-transit only) (City of Lake Havasu City) Kingman KART (Kingman Area Regional Transit)
Navajo Kykotsmovi, Hopi Tribal Govt. (Hopi Senom Transit System) Show Low (Four Seasons Connection Public Transit System)
Pima CatTran (University of Arizona) Oro Valley - Transit Services Division (Coyote Run/Sun Shuttle DNR) Sun Tran / Sun Van / Sun Shuttle DAR (RTC/PAG/City of Tucson) Sun Link (Modern Streetcar) (RTC/PAG/City of Tucson)
Pinal Coolidge Cotton Express – CART (City of Coolidge Cotton Express) (Providing service to Florence and Casa Grande.)
Santa Cruz No current public transit services in the Nogales area.
2015 REPORT CARD FOR ARIZONA’S INFRASTRUCTURE
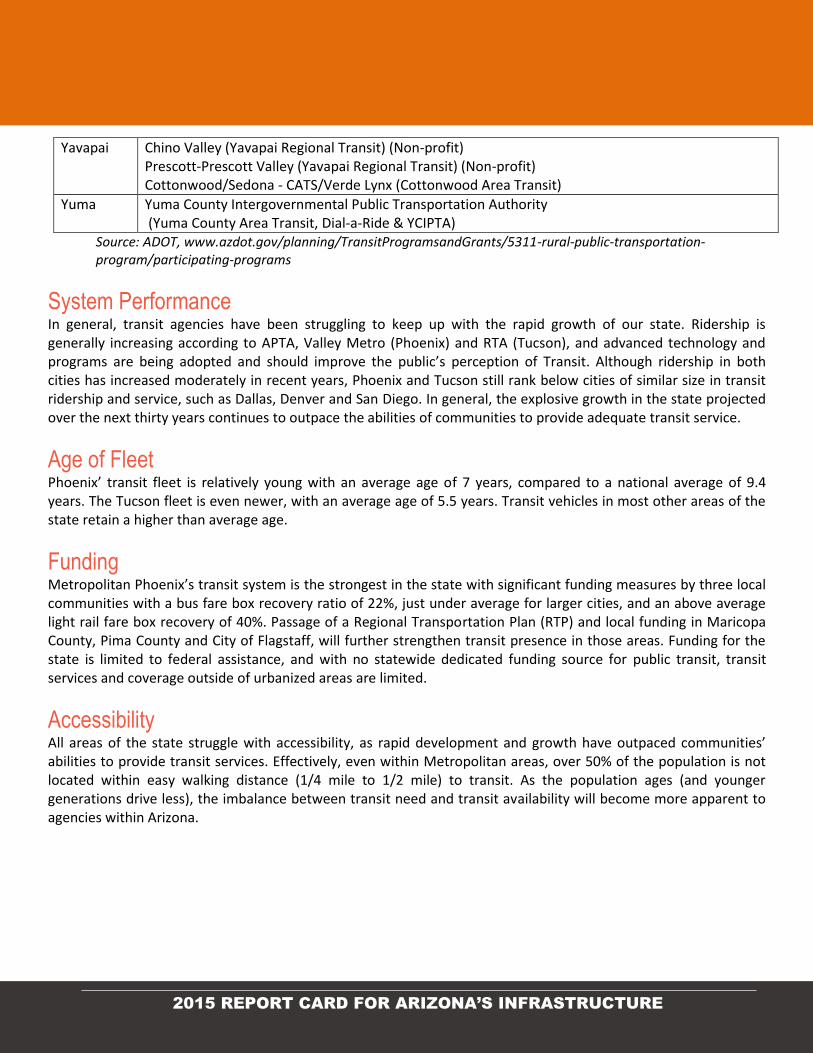
Yavapai Chino Valley (Yavapai Regional Transit) (Non-profit) Prescott-Prescott Valley (Yavapai Regional Transit) (Non-profit) Cottonwood/Sedona - CATS/Verde Lynx (Cottonwood Area Transit)
Yuma Yuma County Intergovernmental Public Transportation Authority (Yuma County Area Transit, Dial-a-Ride & YCIPTA)
Source: ADOT, www.azdot.gov/planning/TransitProgramsandGrants/5311-rural-public-transportation-program/participating-programs
System Performance In general, transit agencies have been struggling to keep up with the rapid growth of our state. Ridership is generally increasing according to APTA, Valley Metro (Phoenix) and RTA (Tucson), and advanced technology and programs are being adopted and should improve the public’s perception of Transit. Although ridership in both cities has increased moderately in recent years, Phoenix and Tucson still rank below cities of similar size in transit ridership and service, such as Dallas, Denver and San Diego. In general, the explosive growth in the state projected over the next thirty years continues to outpace the abilities of communities to provide adequate transit service.
Age of Fleet Phoenix’ transit fleet is relatively young with an average age of 7 years, compared to a national average of 9.4 years. The Tucson fleet is even newer, with an average age of 5.5 years. Transit vehicles in most other areas of the state retain a higher than average age.
Funding Metropolitan Phoenix’s transit system is the strongest in the state with significant funding measures by three local communities with a bus fare box recovery ratio of 22%, just under average for larger cities, and an above average light rail fare box recovery of 40%. Passage of a Regional Transportation Plan (RTP) and local funding in Maricopa County, Pima County and City of Flagstaff, will further strengthen transit presence in those areas. Funding for the state is limited to federal assistance, and with no statewide dedicated funding source for public transit, transit services and coverage outside of urbanized areas are limited.
Accessibility All areas of the state struggle with accessibility, as rapid development and growth have outpaced communities’ abilities to provide transit services. Effectively, even within Metropolitan areas, over 50% of the population is not located within easy walking distance (1/4 mile to 1/2 mile) to transit. As the population ages (and younger generations drive less), the imbalance between transit need and transit availability will become more apparent to agencies within Arizona.
2015 REPORT CARD FOR ARIZONA’S INFRASTRUCTURE
FIND OUT MORE
ADOT Multimodal Planning Department - Transit Programs and Grants, www.azdot.gov/planning/TransitProgramsandGrants
ADOT 2008 Arizona Statewide Transportation Investment Strategy
ADOT 2014 Annual Report for Transit Programs and Grants
ADOT 2035 Long Range Transportation Plan 2011 - Wilbur Smith Associates
AASHTO Bottom Line Report
Federal Transit Administration Grants - www.fta.dot.gov/grants/12853
National Transit Database (NTD)
MAG Transportation Programming Guidebook MPO/COG Reg. Transp. Plans and Long Range Transportation Plans (2010-2014)
Transportation & Arizona: Spring 2015 Arizona Town Hall Background Report; Michael Kuby And Aaron Golub, School Of Geographical Sciences And Urban Planning, Arizona State University
2015 REPORT CARD FOR ARIZONA’S INFRASTRUCTURE
WHAT YOU NEED TO KNOW
ABOUT ARIZONA’S AVIATION
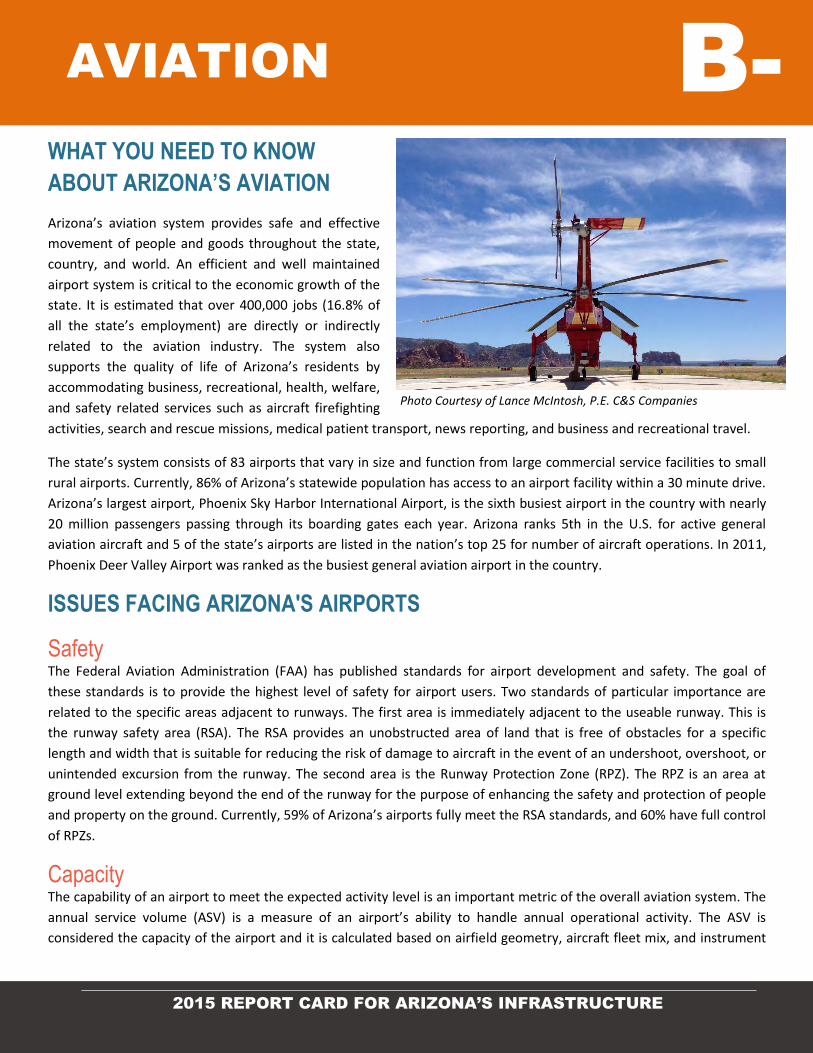
Arizona’s aviation system provides safe and effective
movement of people and goods throughout the state,
country, and world. An efficient and well maintained
airport system is critical to the economic growth of the
state. It is estimated that over 400,000 jobs (16.8% of
all the state’s employment) are directly or indirectly
related to the aviation industry. The system also
supports the quality of life of Arizona’s residents by
accommodating business, recreational, health, welfare,
and safety related services such as aircraft firefighting
activities, search and rescue missions, medical patient transport, news reporting, and business and recreational travel.
The state’s system consists of 83 airports that vary in size and function from large commercial service facilities to small
rural airports. Currently, 86% of Arizona’s statewide population has access to an airport facility within a 30 minute drive.
Arizona’s largest airport, Phoenix Sky Harbor International Airport, is the sixth busiest airport in the country with nearly
20 million passengers passing through its boarding gates each year. Arizona ranks 5th in the U.S. for active general
aviation aircraft and 5 of the state’s airports are listed in the nation’s top 25 for number of aircraft operations. In 2011,
Phoenix Deer Valley Airport was ranked as the busiest general aviation airport in the country.
ISSUES FACING ARIZONA'S AIRPORTS
Safety The Federal Aviation Administration (FAA) has published standards for airport development and safety. The goal of
these standards is to provide the highest level of safety for airport users. Two standards of particular importance are
related to the specific areas adjacent to runways. The first area is immediately adjacent to the useable runway. This is
the runway safety area (RSA). The RSA provides an unobstructed area of land that is free of obstacles for a specific
length and width that is suitable for reducing the risk of damage to aircraft in the event of an undershoot, overshoot, or
unintended excursion from the runway. The second area is the Runway Protection Zone (RPZ). The RPZ is an area at
ground level extending beyond the end of the runway for the purpose of enhancing the safety and protection of people
and property on the ground. Currently, 59% of Arizona’s airports fully meet the RSA standards, and 60% have full control
of RPZs.
Capacity The capability of an airport to meet the expected activity level is an important metric of the overall aviation system. The
annual service volume (ASV) is a measure of an airport’s ability to handle annual operational activity. The ASV is
considered the capacity of the airport and it is calculated based on airfield geometry, aircraft fleet mix, and instrument
Photo Courtesy of Lance McIntosh, P.E. C&S Companies
AVIATION B-
2015 REPORT CARD FOR ARIZONA’S INFRASTRUCTURE
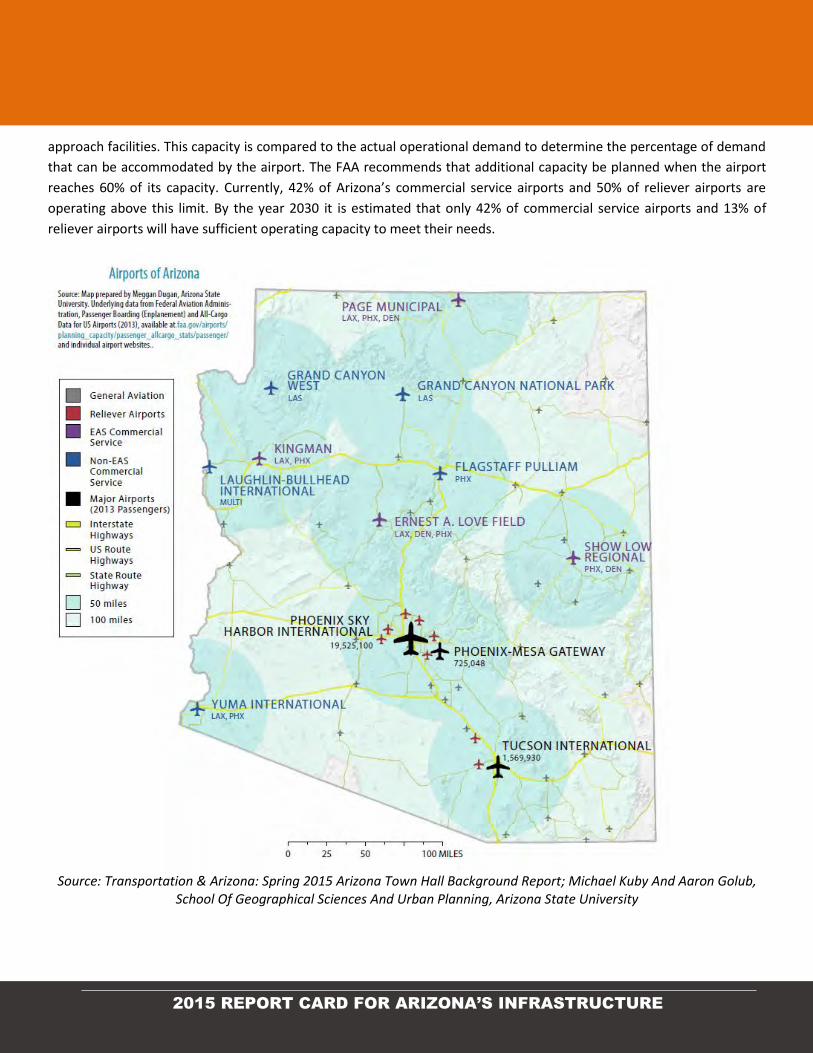
approach facilities. This capacity is compared to the actual operational demand to determine the percentage of demand
that can be accommodated by the airport. The FAA recommends that additional capacity be planned when the airport
reaches 60% of its capacity. Currently, 42% of Arizona’s commercial service airports and 50% of reliever airports are
operating above this limit. By the year 2030 it is estimated that only 42% of commercial service airports and 13% of
reliever airports will have sufficient operating capacity to meet their needs.
Source: Transportation & Arizona: Spring 2015 Arizona Town Hall Background Report; Michael Kuby And Aaron Golub, School Of Geographical Sciences And Urban Planning, Arizona State University
2015 REPORT CARD FOR ARIZONA’S INFRASTRUCTURE
Accessibility An efficient airport system must be capable of supporting the economic development of local and regional businesses.
Industries that utilize aviation as part of their business must have reasonable access (e.g. within a 30 minute drive) to
airports that meet the specific user needs below:
A minimum 5,000 foot long runway
An instrument approach
Access to jet fuel
Terminal facilities
Ground transportation
Currently, 35% of the state’s airports meet this criteria, and they serve 79% of the population. To assist in driving
economic growth, it is recommended that a minimum of 55% of airports meet the criteria to cover 82% of the
population.
Minimum Facility Requirements Several criteria were examined to determine the adequacy of each airport to meet the minimum facility and service
objectives to fulfill their role in the state aviation system. Inadequate facility and service requirements of Arizona’s
aviation system include:
65% of airports do not have visual aides (runway lighting, taxiway lighting or visual approach guidance)
60% of airports do not have hangar spaces
53% of airports do not have safety and security plans
50% of airports do not have edge lighting
30% of runways do not have adequate primary runway length
Funding One of the most critical issues airport owners face is the limited ability to complete necessary capital improvements and
maintenance at their facilities. There are a variety of funding sources available from outside agencies such as the state
and FAA, however, each year the funding requested far exceeds the amount available. Historically, investment in
Arizona’s airport system has been approximately $100 million per year when all federal, state, and local sources are
combined. However, it is estimated that approximately $490 million is needed annually to complete each airport’s
capital improvement projects, planning projects, and maintenance projects. The result is a shortfall each year of nearly
$390 million. Also, rural Arizonans remain dependent on the federal Essential Air Services program to subsidize
commercial carriers to continue serving the state’s smaller airports.
2015 REPORT CARD FOR ARIZONA’S INFRASTRUCTURE
LET’S RAISE ARIZONA'S AVIATION GRADE
Maintain airports at their current service levels: The aviation industry is vital to the Arizona economy and
serves important community functions such as medical transport and fire-fighting. Current projected funding
levels do not maintain airports at their current service levels. Additional funding is required to improve the
system’s level of service and fund construction of improvements to increase capacity and enhance safety.
Stop diverting aviation funds away from aviation: Changes in current policy and legislation is required to
prevent diversion from the State Aviation Fund to the General fund. In recent years, nearly $82 million dollars
was diverted. This severely limited the ability of Arizona’s airports to make safety improvements, perform
routine maintenance, and expand capacity.
Invest where it can provide the most benefit: Additional planning is vital to ensure that the limited available
funding is allocated strategically to key areas of the state where the largest benefit to the overall aviation
system is predicted.
Increase or eliminate the cap on the Passenger Facilities Charges (PFCs): Allowing variation in these fees will
allow airports the flexibility to invest in their own facilities.
FIND OUT MORE
Arizona Department of Transportation 2010 Arizona Airports Pavement Management System Update,
www.azdot.gov/planning/airportdevelopment/development-and-planning/airport-pavement-management-
system
Arizona Department of Transportation 2008 State Airport Systems Plan,
www.azdot.gov/planning/airportdevelopment/development-and-planning/state-airports-system-plan
Arizona Department of Transportation Economic Impact of Aviation in Arizona, www.azdot.gov/docs/default-
source/airport-development/az_aviation_impact_study_final_web.pdf?sfvrsn=2
2015 REPORT CARD FOR ARIZONA’S INFRASTRUCTURE
26%
10%
24%
3%
Dams Owned in Arizona
Federal
State
Local Government
Utilities
Private
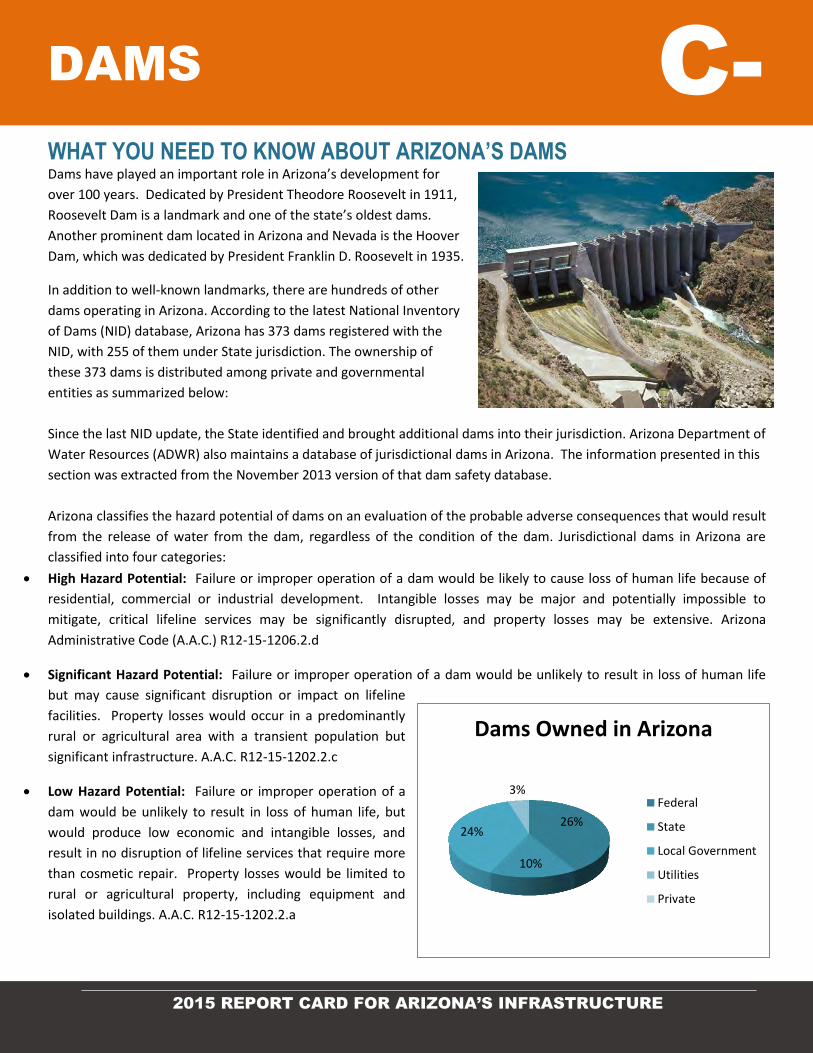
WHAT YOU NEED TO KNOW ABOUT ARIZONA’S DAMS Dams have played an important role in Arizona’s development for
over 100 years. Dedicated by President Theodore Roosevelt in 1911,
Roosevelt Dam is a landmark and one of the state’s oldest dams.
Another prominent dam located in Arizona and Nevada is the Hoover
Dam, which was dedicated by President Franklin D. Roosevelt in 1935.
In addition to well-known landmarks, there are hundreds of other
dams operating in Arizona. According to the latest National Inventory
of Dams (NID) database, Arizona has 373 dams registered with the
NID, with 255 of them under State jurisdiction. The ownership of
these 373 dams is distributed among private and governmental
entities as summarized below:
Since the last NID update, the State identified and brought additional dams into their jurisdiction. Arizona Department of
Water Resources (ADWR) also maintains a database of jurisdictional dams in Arizona. The information presented in this
section was extracted from the November 2013 version of that dam safety database.
Arizona classifies the hazard potential of dams on an evaluation of the probable adverse consequences that would result
from the release of water from the dam, regardless of the condition of the dam. Jurisdictional dams in Arizona are
classified into four categories:
High Hazard Potential: Failure or improper operation of a dam would be likely to cause loss of human life because of
residential, commercial or industrial development. Intangible losses may be major and potentially impossible to
mitigate, critical lifeline services may be significantly disrupted, and property losses may be extensive. Arizona
Administrative Code (A.A.C.) R12-15-1206.2.d
Significant Hazard Potential: Failure or improper operation of a dam would be unlikely to result in loss of human life
but may cause significant disruption or impact on lifeline
facilities. Property losses would occur in a predominantly
rural or agricultural area with a transient population but
significant infrastructure. A.A.C. R12-15-1202.2.c
Low Hazard Potential: Failure or improper operation of a
dam would be unlikely to result in loss of human life, but
would produce low economic and intangible losses, and
result in no disruption of lifeline services that require more
than cosmetic repair. Property losses would be limited to
rural or agricultural property, including equipment and
isolated buildings. A.A.C. R12-15-1202.2.a
DAMS C-
2015 REPORT CARD FOR ARIZONA’S INFRASTRUCTURE
Very Low Hazard Potential: Failure or improper operation of a dam would be unlikely to result in loss of human life and
would produce no lifeline losses and very low economic and intangible losses. Losses would be limited to the 100-year
floodplain or property owned or controlled by the dam owner under long-term lease. A.A.C. R12-15-1202.2.b
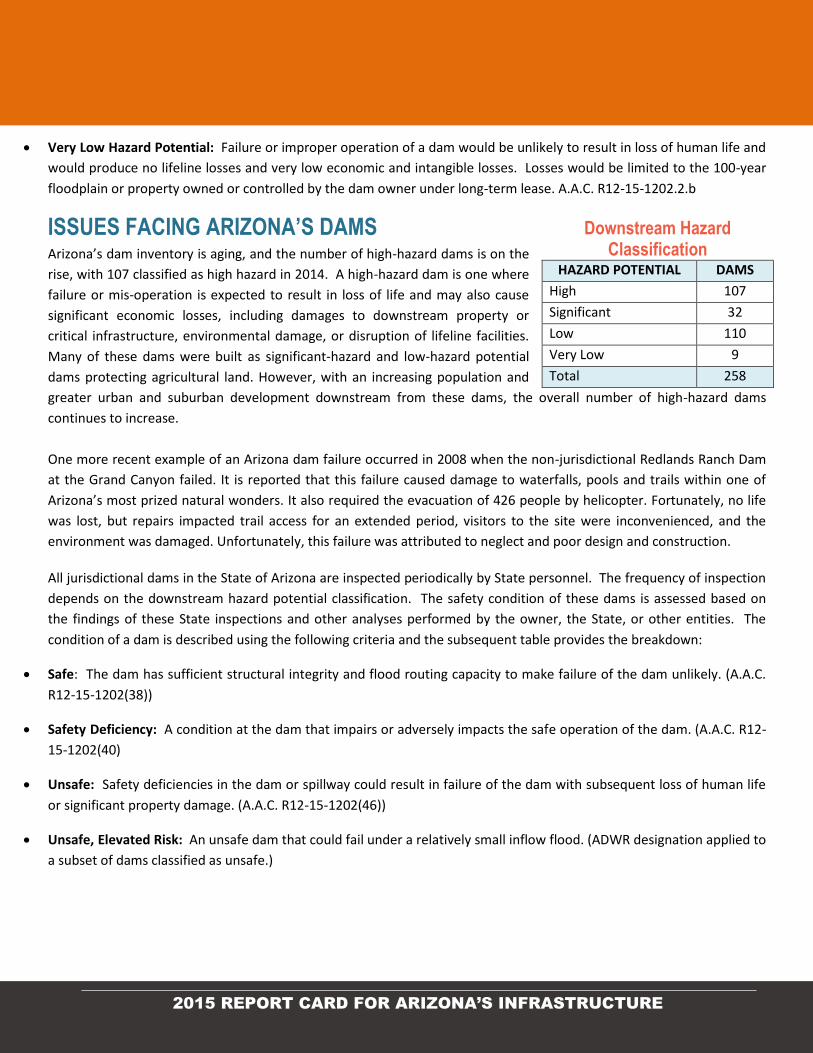
ISSUES FACING ARIZONA’S DAMS Arizona’s dam inventory is aging, and the number of high-hazard dams is on the
rise, with 107 classified as high hazard in 2014. A high-hazard dam is one where
failure or mis-operation is expected to result in loss of life and may also cause
significant economic losses, including damages to downstream property or
critical infrastructure, environmental damage, or disruption of lifeline facilities.
Many of these dams were built as significant-hazard and low-hazard potential
dams protecting agricultural land. However, with an increasing population and
greater urban and suburban development downstream from these dams, the overall number of high-hazard dams
continues to increase.
One more recent example of an Arizona dam failure occurred in 2008 when the non-jurisdictional Redlands Ranch Dam
at the Grand Canyon failed. It is reported that this failure caused damage to waterfalls, pools and trails within one of
Arizona’s most prized natural wonders. It also required the evacuation of 426 people by helicopter. Fortunately, no life
was lost, but repairs impacted trail access for an extended period, visitors to the site were inconvenienced, and the
environment was damaged. Unfortunately, this failure was attributed to neglect and poor design and construction.
All jurisdictional dams in the State of Arizona are inspected periodically by State personnel. The frequency of inspection
depends on the downstream hazard potential classification. The safety condition of these dams is assessed based on
the findings of these State inspections and other analyses performed by the owner, the State, or other entities. The
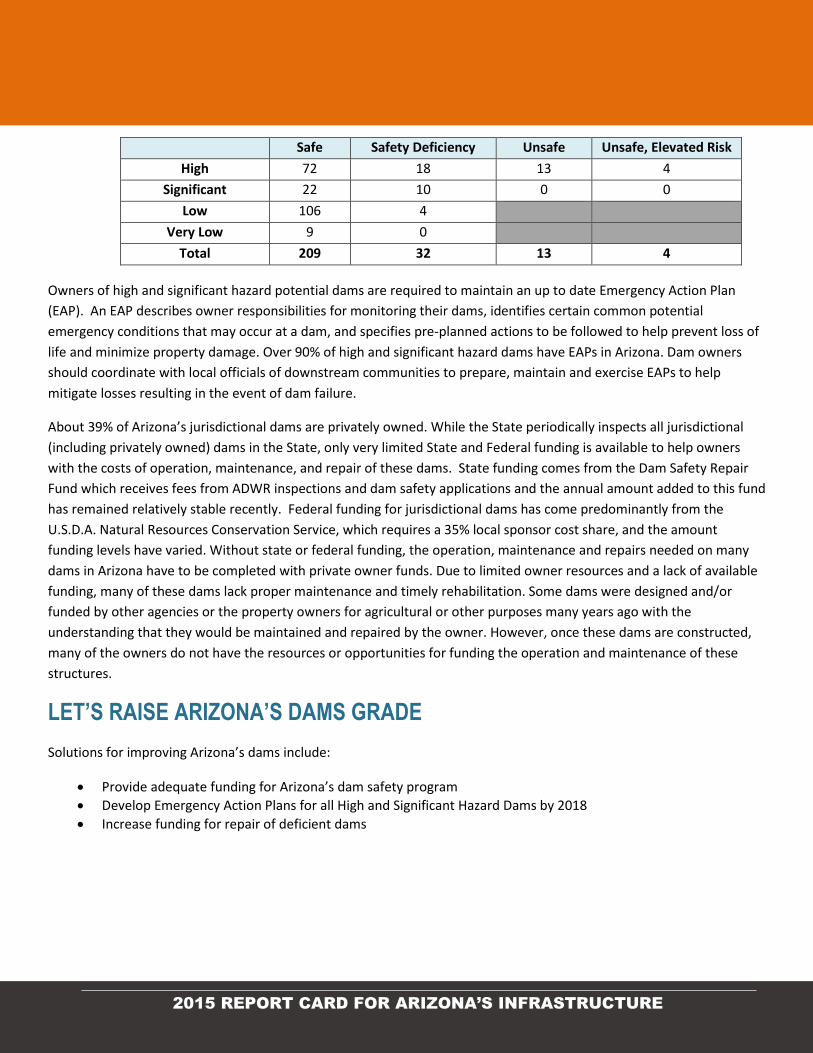
condition of a dam is described using the following criteria and the subsequent table provides the breakdown:
Safe: The dam has sufficient structural integrity and flood routing capacity to make failure of the dam unlikely. (A.A.C.
R12-15-1202(38))
Safety Deficiency: A condition at the dam that impairs or adversely impacts the safe operation of the dam. (A.A.C. R12-
15-1202(40)
Unsafe: Safety deficiencies in the dam or spillway could result in failure of the dam with subsequent loss of human life
or significant property damage. (A.A.C. R12-15-1202(46))
Unsafe, Elevated Risk: An unsafe dam that could fail under a relatively small inflow flood. (ADWR designation applied to
a subset of dams classified as unsafe.)
Downstream Hazard Classification
HAZARD POTENTIAL DAMS
High 107
Significant 32
Low 110
Very Low 9
Total 258
2015 REPORT CARD FOR ARIZONA’S INFRASTRUCTURE
Safe Safety Deficiency Unsafe Unsafe, Elevated Risk
High 72 18 13 4
Significant 22 10 0 0
Low 106 4
Very Low 9 0
Total 209 32 13 4
Owners of high and significant hazard potential dams are required to maintain an up to date Emergency Action Plan
(EAP). An EAP describes owner responsibilities for monitoring their dams, identifies certain common potential
emergency conditions that may occur at a dam, and specifies pre-planned actions to be followed to help prevent loss of
life and minimize property damage. Over 90% of high and significant hazard dams have EAPs in Arizona. Dam owners
should coordinate with local officials of downstream communities to prepare, maintain and exercise EAPs to help
mitigate losses resulting in the event of dam failure.
About 39% of Arizona’s jurisdictional dams are privately owned. While the State periodically inspects all jurisdictional
(including privately owned) dams in the State, only very limited State and Federal funding is available to help owners
with the costs of operation, maintenance, and repair of these dams. State funding comes from the Dam Safety Repair
Fund which receives fees from ADWR inspections and dam safety applications and the annual amount added to this fund
has remained relatively stable recently. Federal funding for jurisdictional dams has come predominantly from the
U.S.D.A. Natural Resources Conservation Service, which requires a 35% local sponsor cost share, and the amount
funding levels have varied. Without state or federal funding, the operation, maintenance and repairs needed on many
dams in Arizona have to be completed with private owner funds. Due to limited owner resources and a lack of available
funding, many of these dams lack proper maintenance and timely rehabilitation. Some dams were designed and/or
funded by other agencies or the property owners for agricultural or other purposes many years ago with the
understanding that they would be maintained and repaired by the owner. However, once these dams are constructed,
many of the owners do not have the resources or opportunities for funding the operation and maintenance of these
structures.
LET’S RAISE ARIZONA’S DAMS GRADE
Solutions for improving Arizona’s dams include:
Provide adequate funding for Arizona’s dam safety program
Develop Emergency Action Plans for all High and Significant Hazard Dams by 2018
Increase funding for repair of deficient dams
2015 REPORT CARD FOR ARIZONA’S INFRASTRUCTURE
FIND OUT MORE
Association of State Dam Safety Officials, www.damsafety.org
National Inventory of Dams, www.geo.usace.army.mil/pgis/f?p=397:12
Association of State Dam Safety Officials, Dam Failures, Dam Incidents (Near Failures); www.damsafety.org/media/Documents/PDF/US_FailuresIncidents.pdf
Arizona Revised Statutes (A.R.S.) Title 45, Chapter 6 Dams and Reservoirs, www.azleg.state.az.us/ArizonaRevisedStatutes.asp?Title=45
Arizona Administrative Code (A.A.C.) Title 12, Chapter 15, Article 12 Dam Safety Procedures; www.apps.azsos.gov/public_services/Title_12/12-15.pdf
2015 REPORT CARD FOR ARIZONA’S INFRASTRUCTURE
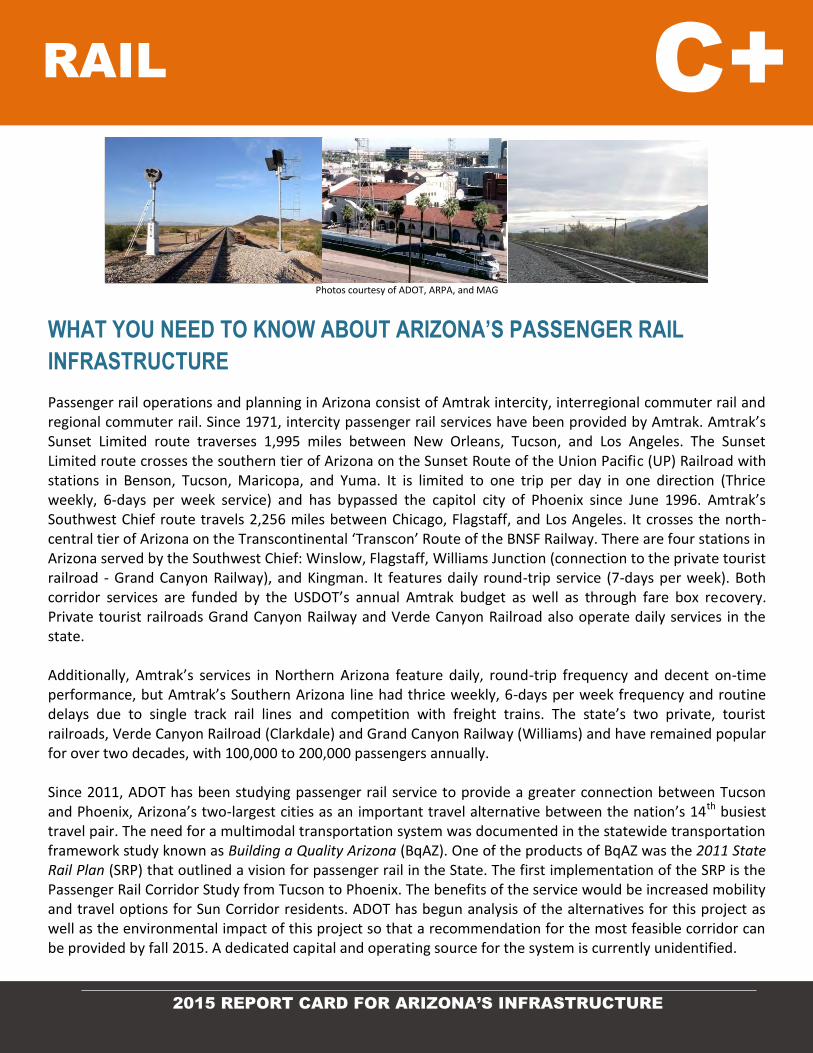
Photos courtesy of ADOT, ARPA, and MAG
WHAT YOU NEED TO KNOW ABOUT ARIZONA’S PASSENGER RAIL
INFRASTRUCTURE
Passenger rail operations and planning in Arizona consist of Amtrak intercity, interregional commuter rail and regional commuter rail. Since 1971, intercity passenger rail services have been provided by Amtrak. Amtrak’s Sunset Limited route traverses 1,995 miles between New Orleans, Tucson, and Los Angeles. The Sunset Limited route crosses the southern tier of Arizona on the Sunset Route of the Union Pacific (UP) Railroad with stations in Benson, Tucson, Maricopa, and Yuma. It is limited to one trip per day in one direction (Thrice weekly, 6-days per week service) and has bypassed the capitol city of Phoenix since June 1996. Amtrak’s Southwest Chief route travels 2,256 miles between Chicago, Flagstaff, and Los Angeles. It crosses the north-central tier of Arizona on the Transcontinental ‘Transcon’ Route of the BNSF Railway. There are four stations in Arizona served by the Southwest Chief: Winslow, Flagstaff, Williams Junction (connection to the private tourist railroad - Grand Canyon Railway), and Kingman. It features daily round-trip service (7-days per week). Both corridor services are funded by the USDOT’s annual Amtrak budget as well as through fare box recovery. Private tourist railroads Grand Canyon Railway and Verde Canyon Railroad also operate daily services in the state. Additionally, Amtrak’s services in Northern Arizona feature daily, round-trip frequency and decent on-time performance, but Amtrak’s Southern Arizona line had thrice weekly, 6-days per week frequency and routine delays due to single track rail lines and competition with freight trains. The state’s two private, tourist railroads, Verde Canyon Railroad (Clarkdale) and Grand Canyon Railway (Williams) and have remained popular for over two decades, with 100,000 to 200,000 passengers annually. Since 2011, ADOT has been studying passenger rail service to provide a greater connection between Tucson and Phoenix, Arizona’s two-largest cities as an important travel alternative between the nation’s 14th busiest travel pair. The need for a multimodal transportation system was documented in the statewide transportation framework study known as Building a Quality Arizona (BqAZ). One of the products of BqAZ was the 2011 State Rail Plan (SRP) that outlined a vision for passenger rail in the State. The first implementation of the SRP is the Passenger Rail Corridor Study from Tucson to Phoenix. The benefits of the service would be increased mobility and travel options for Sun Corridor residents. ADOT has begun analysis of the alternatives for this project as well as the environmental impact of this project so that a recommendation for the most feasible corridor can be provided by fall 2015. A dedicated capital and operating source for the system is currently unidentified.
RAIL C+
2015 REPORT CARD FOR ARIZONA’S INFRASTRUCTURE
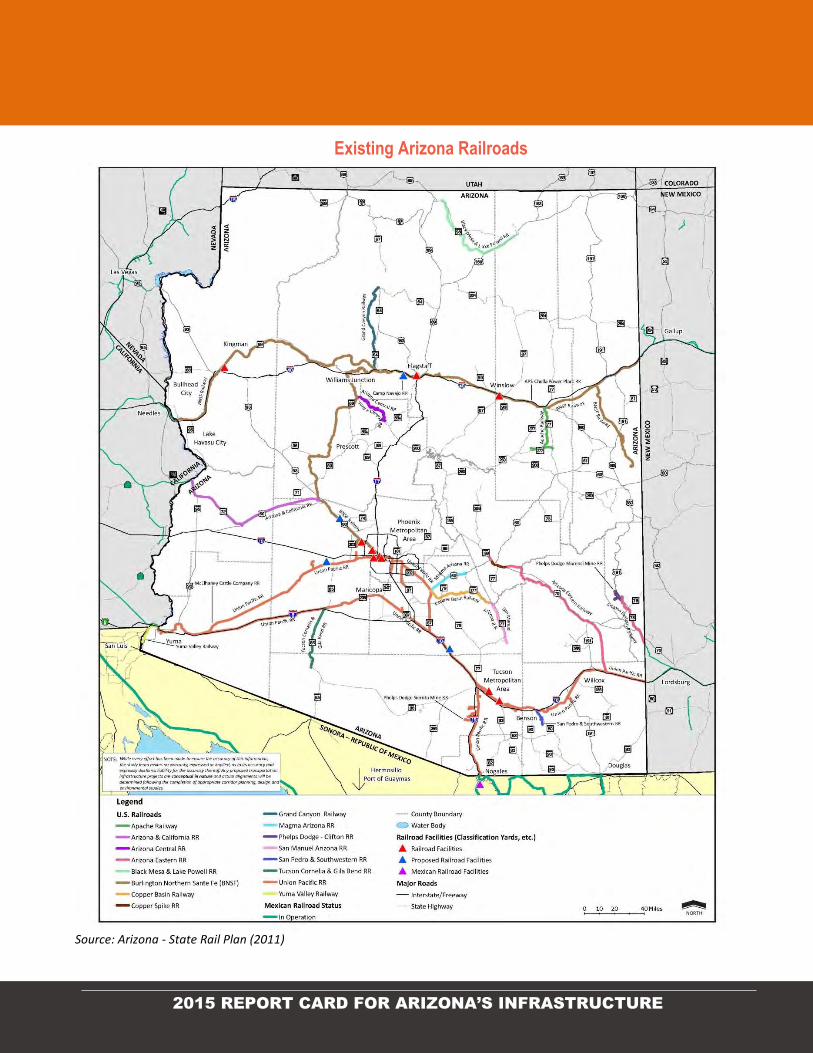
Existing Arizona Railroads
Source: Arizona - State Rail Plan (2011)
2015 REPORT CARD FOR ARIZONA’S INFRASTRUCTURE
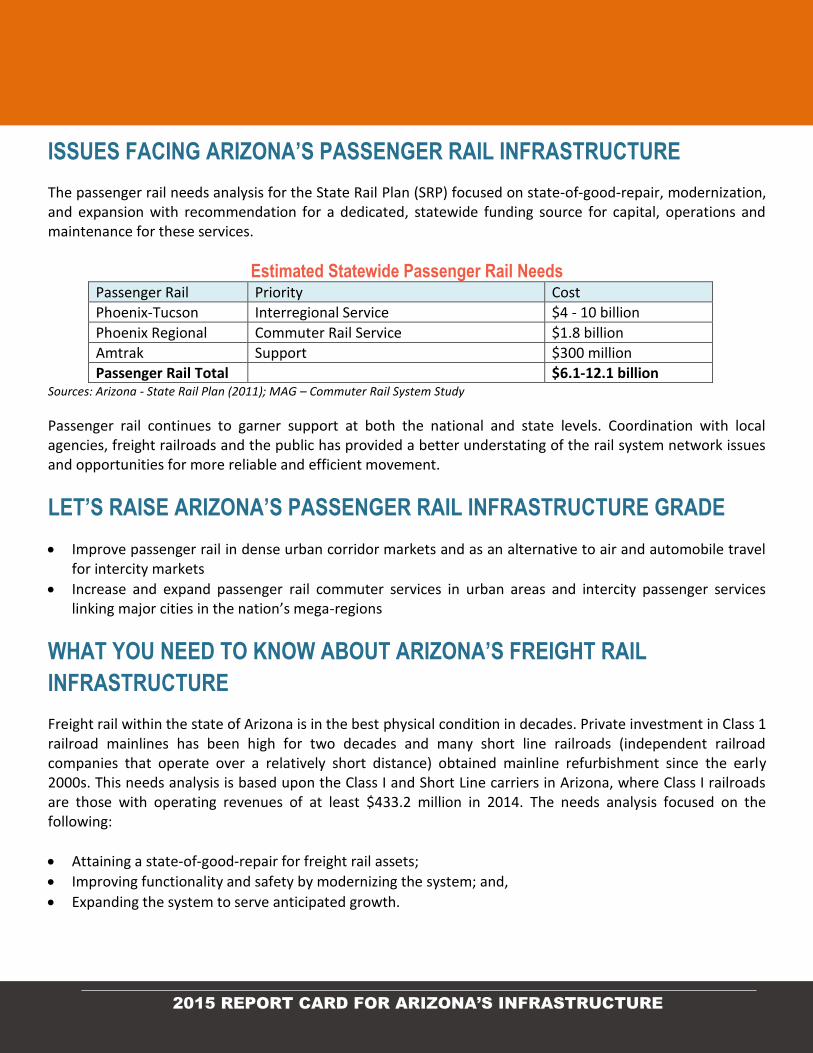
ISSUES FACING ARIZONA’S PASSENGER RAIL INFRASTRUCTURE
The passenger rail needs analysis for the State Rail Plan (SRP) focused on state-of-good-repair, modernization, and expansion with recommendation for a dedicated, statewide funding source for capital, operations and maintenance for these services.
Estimated Statewide Passenger Rail Needs Passenger Rail Priority Cost
Phoenix-Tucson Interregional Service $4 - 10 billion
Phoenix Regional Commuter Rail Service $1.8 billion
Amtrak Support $300 million
Passenger Rail Total $6.1-12.1 billion Sources: Arizona - State Rail Plan (2011); MAG – Commuter Rail System Study
Passenger rail continues to garner support at both the national and state levels. Coordination with local agencies, freight railroads and the public has provided a better understating of the rail system network issues and opportunities for more reliable and efficient movement.
LET’S RAISE ARIZONA’S PASSENGER RAIL INFRASTRUCTURE GRADE
Improve passenger rail in dense urban corridor markets and as an alternative to air and automobile travel for intercity markets
Increase and expand passenger rail commuter services in urban areas and intercity passenger services linking major cities in the nation’s mega-regions
WHAT YOU NEED TO KNOW ABOUT ARIZONA’S FREIGHT RAIL
INFRASTRUCTURE
Freight rail within the state of Arizona is in the best physical condition in decades. Private investment in Class 1 railroad mainlines has been high for two decades and many short line railroads (independent railroad companies that operate over a relatively short distance) obtained mainline refurbishment since the early 2000s. This needs analysis is based upon the Class I and Short Line carriers in Arizona, where Class I railroads are those with operating revenues of at least $433.2 million in 2014. The needs analysis focused on the following:
Attaining a state-of-good-repair for freight rail assets;
Improving functionality and safety by modernizing the system; and,
Expanding the system to serve anticipated growth.
2015 REPORT CARD FOR ARIZONA’S INFRASTRUCTURE
Long-term freight rail investment needs in the Arizona were collected from the above noted studies as well as follow-up discussions with the individual railroads. The rail transportation network in Arizona includes two Class 1 Railroads, BNSF and UP and a variety of short lines, industrial and tourist railroads. Needs for these Class 1 Railroads and additional general needs of short line railroads are summarized as follows: BNSF Railway had begun double‐tracking it’s Transcon through New Mexico and may pursue triple‐tracking select sections through Arizona when the economy recovers. The Transcon traverses Arizona’s Interstate 40/Route 66 corridor between Needles, CA and Gallup, NM. Additionally, facility access, elimination of grade crossings, and realignments of the rail bed were cited as potential needs in the 2009 Multimodal Freight Analysis Study. The improvements would improve the operational efficiency and safety of rail operations. Union Pacific Railroad’s primary asset in Arizona is its east-west Sunset Route parallel to Interstate 8/10, between Yuma, AZ and Lordsburg, NM. The UPRR is improving the Sunset Route into a high‐capacity route (double‐tracked throughout Arizona), which will increase its use in the future. Double-tracking the line potentially would triple its practical capacity. This program continues through 2020. For Arizona’s short lines, the primary need is for track and bridge-structure upgrades to permit heavier carloads. The 2007 Railroad Inventory and Assessment cited Arizona short lines requiring track and structure upgrades to handle AAR 286,000lb cars.
ISSUES FACING ARIZONA’S FREIGHT RAIL INFRASTRUCTURE
For freight rail, asset preservation and capacity investments are handled by the private rail companies who own the tracks and the rail cars within Arizona. However, using the available sources to estimate freight rail needs from the LRTP, resulted in a total of approximately $850 million required through 2035. Under the SRP, other state or federal programs such as Railroad Rehabilitation & Improvement Financing (RRIF) may permit ADOT to engage opportunistic funding partnerships with private freight rail carriers, where it helps to advance the goals and objectives of the State Rail Plan. Union Pacific Railroad has invested $468 million in Arizona from 2009-2013 for the Sunset Route double-tracking project, while BNSF Railway has invested over $300 million on its Transcontinental mainline and Phoenix Subdivision since 2008.
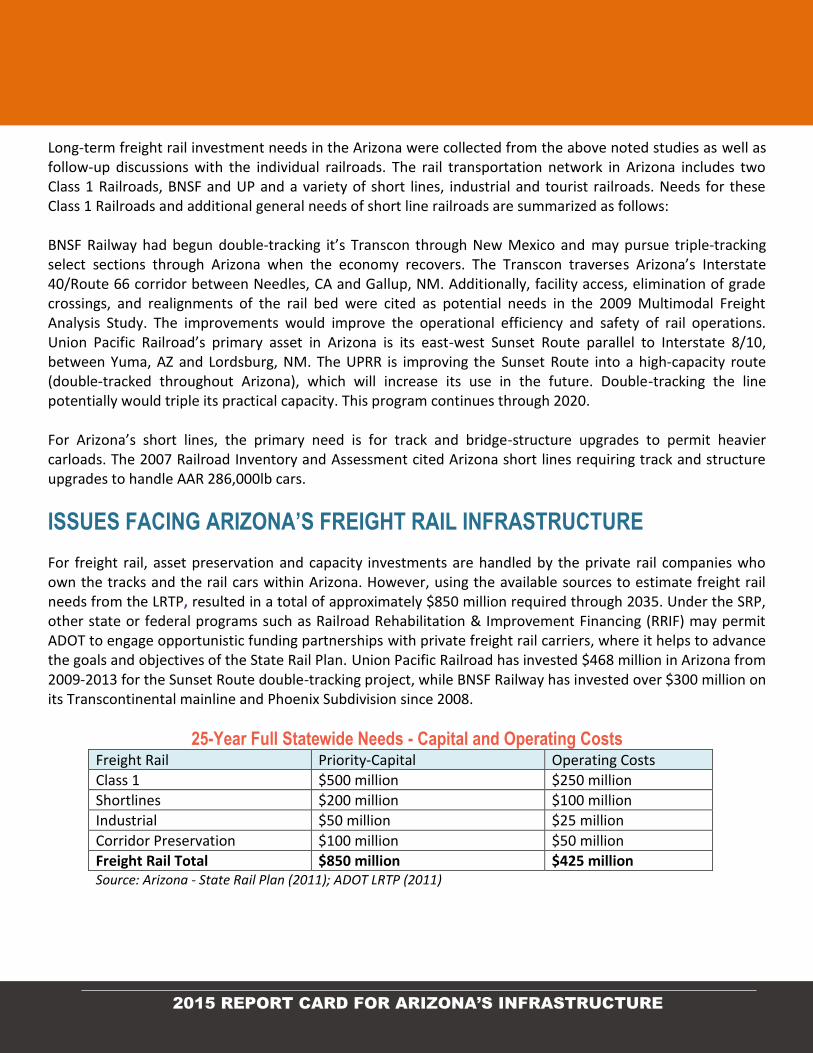
25-Year Full Statewide Needs - Capital and Operating Costs
Freight Rail Priority-Capital Operating Costs
Class 1 $500 million $250 million
Shortlines $200 million $100 million
Industrial $50 million $25 million
Corridor Preservation $100 million $50 million
Freight Rail Total $850 million $425 million Source: Arizona - State Rail Plan (2011); ADOT LRTP (2011)
2015 REPORT CARD FOR ARIZONA’S INFRASTRUCTURE
The State Rail Plan reported that the operational performance of freight railroads was good but in need of a long-term vision. Population demand has stressed an already overburdened highway system, and investment in Arizona’s freight rail system may provide some relief to future highway congestion. Most of the Class 1, short line, industrial and tourist railroads within Arizona were originally commissioned between 1880 and 1920, with a few exceptions, these lines have kept up with routine, annual maintenance and modern infrastructure improvements. Aside from abandoned railroads in Southern Arizona from the 1960s to the 1990s and the Prescott area in the early 1990s, all of the operational railroad lines in Arizona have retained sound conditions for today’s market. All of the Class 1, short line, industrial and tourist railroads within Arizona are privately funded. At present, operational and maintenance of way assets are budgeted annually by the parent corporation, although some have applied for bridge-rehab programs such as FRA Railroad Rehabilitation & Improvement Financing (RRIF). Amtrak has been classified as a not-for-profit corporation since 1971 and is funded within Arizona via a combination of annual federal subsidies and fare-box recovery. Increasing Amtrak Intercity service in Arizona would require either a larger expenditure of USDOT funding or an entirely new ADOT or rail authority mechanism to fund statewide operations. The State Rail Plan (2011) defined how accessible the rail system is to customers who might want to use both freight and passenger service. The SRP reports adequate market reach, but some rail lines are limited by urban encroachment, unavailable land for yard expansion, limited connections to Mexico and constrained freight car fleet markets (AAR 286,000lb standard). Central Yavapai county and areas of Southern Arizona also lack any direct freight rail access since the 1990s abandonments.
FIND OUT MORE
Arizona - State Rail Plan (2011)
ADOT Passenger Rail Study (2011-2014)
MAG – Commuter Rail System Study (2010)
Federal Railroad Administration (FRA) – www.fra.dot.gov
ADOT 2035 Long Range Transportation Plan 2011 - Wilbur Smith Associates;
ADOT – Multimodal Planning Dept. - Transit Programs and Grants www.azdot.gov/planning/TransitProgramsandGrants
National Transit Database (NTD)
MPO/COG Reg. Transp. Plans/Long Range Transportation Plans (2010-2014)
ADOT State Rail Plan (2011)
ADOT Long Range Transportation Plan (LRTP) (2011)
ADOT Statewide Rail Framework Study (2010)
MAG Commuter Rail System Study (2010);
Federal Railroad Administration (FRA) High Speed Rail Strategic Plan (2009)
ADOT Multimodal Freight Analysis Study (2009)
2015 REPORT CARD FOR ARIZONA’S INFRASTRUCTURE
BQAZ (Building a Quality Arizona) Report (2008)
ADOT High Speed Passenger Rail Strategic Plan (2008)
ADOT Railroad Inventory and Assessment (2007)
Amtrak Report on Accessibility and Compliance with the Americans with Disabilities Act of 1990 (2009) and internal route performance initiative.
2015 REPORT CARD FOR ARIZONA’S INFRASTRUCTURE
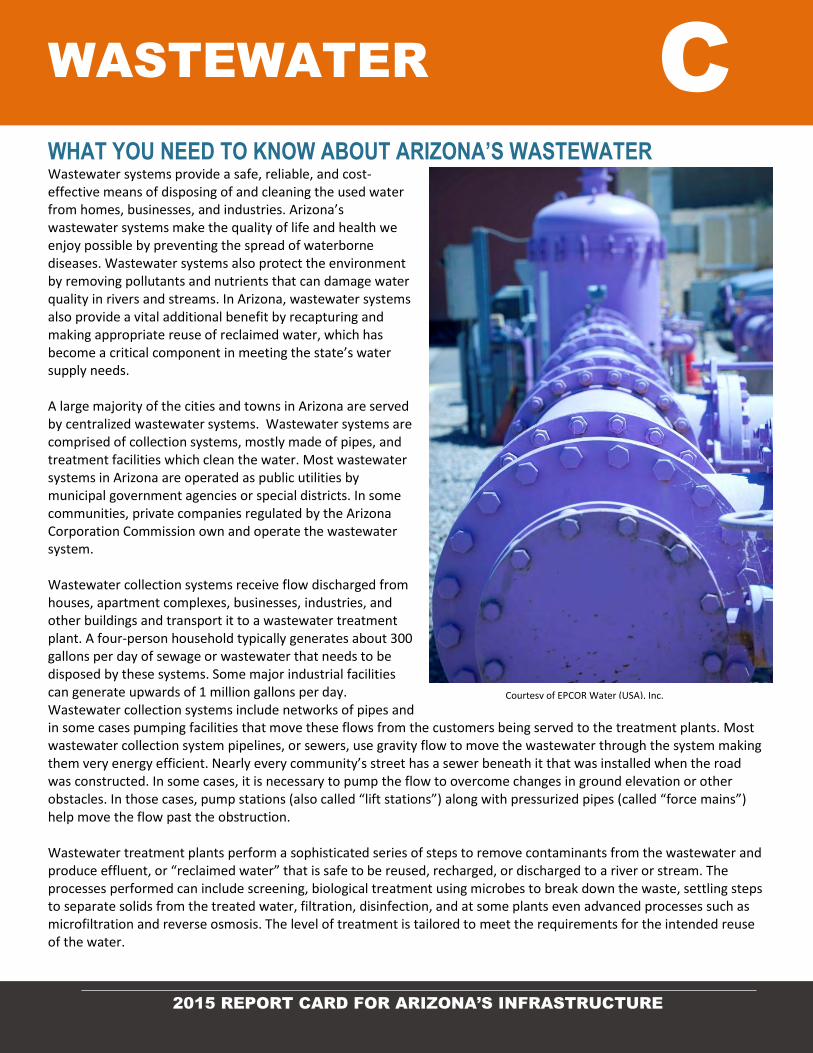
WHAT YOU NEED TO KNOW ABOUT ARIZONA’S WASTEWATER Wastewater systems provide a safe, reliable, and cost-effective means of disposing of and cleaning the used water from homes, businesses, and industries. Arizona’s wastewater systems make the quality of life and health we enjoy possible by preventing the spread of waterborne diseases. Wastewater systems also protect the environment by removing pollutants and nutrients that can damage water quality in rivers and streams. In Arizona, wastewater systems also provide a vital additional benefit by recapturing and making appropriate reuse of reclaimed water, which has become a critical component in meeting the state’s water supply needs. A large majority of the cities and towns in Arizona are served by centralized wastewater systems. Wastewater systems are comprised of collection systems, mostly made of pipes, and treatment facilities which clean the water. Most wastewater systems in Arizona are operated as public utilities by municipal government agencies or special districts. In some communities, private companies regulated by the Arizona Corporation Commission own and operate the wastewater system. Wastewater collection systems receive flow discharged from houses, apartment complexes, businesses, industries, and other buildings and transport it to a wastewater treatment plant. A four-person household typically generates about 300 gallons per day of sewage or wastewater that needs to be disposed by these systems. Some major industrial facilities can generate upwards of 1 million gallons per day. Wastewater collection systems include networks of pipes and in some cases pumping facilities that move these flows from the customers being served to the treatment plants. Most wastewater collection system pipelines, or sewers, use gravity flow to move the wastewater through the system making them very energy efficient. Nearly every community’s street has a sewer beneath it that was installed when the road was constructed. In some cases, it is necessary to pump the flow to overcome changes in ground elevation or other obstacles. In those cases, pump stations (also called “lift stations”) along with pressurized pipes (called “force mains”) help move the flow past the obstruction. Wastewater treatment plants perform a sophisticated series of steps to remove contaminants from the wastewater and produce effluent, or “reclaimed water” that is safe to be reused, recharged, or discharged to a river or stream. The processes performed can include screening, biological treatment using microbes to break down the waste, settling steps to separate solids from the treated water, filtration, disinfection, and at some plants even advanced processes such as microfiltration and reverse osmosis. The level of treatment is tailored to meet the requirements for the intended reuse of the water.
WASTEWATER C
Courtesy of EPCOR Water (USA), Inc.
2015 REPORT CARD FOR ARIZONA’S INFRASTRUCTURE
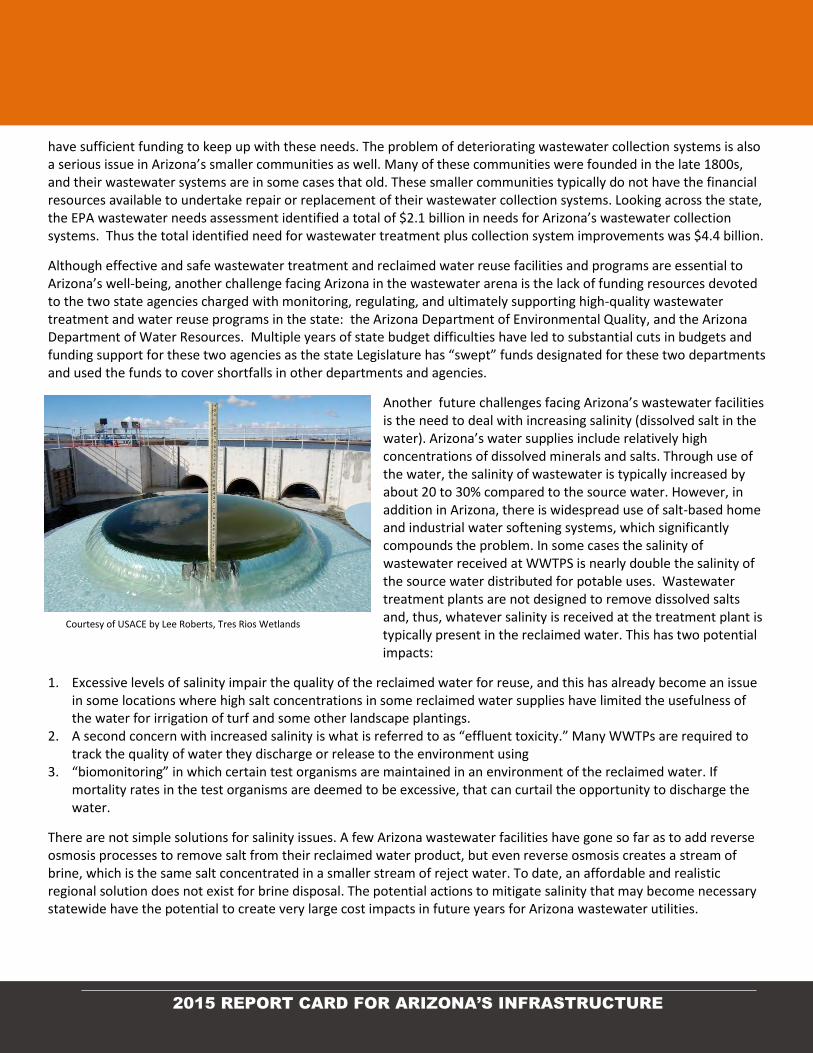
There are approximately 120 wastewater treatment plants in communities throughout the state with several dozen more planned to be constructed in the next two decades as flows continue to increase with the growth of the state. Wastewater plants vary widely in their size or treatment capacity. Some treat as little as 10,000 gallons per day; in contrast, the largest wastewater plant in Arizona treats well over 100 million gallons per day. In 2008, the most-recent year for which statewide totals are currently available, the total volume of wastewater treated by Arizona’s WWTPs totaled an average of 419 million gallons per day (mgd). Arizona communities have recognized the resource value of reclaimed water, and the state has long been a national leader in making beneficial use of reclaimed water. Reclaimed water must be treated to a very high level of quality, subject to stringent standards established by ADEQ. Reclaimed water reuses include agricultural irrigation of non-food crops, irrigation of turf and landscaping at parks and golf courses, and industrial applications, such as providing cooling water for the Palo Verde Nuclear Generating Station (PVNGS) outside Phoenix. Highly-treated reclaimed water also has become a valuable water supply for indirect use through long-term recharge of groundwater aquifers. Over three decades of experience have demonstrated that Arizona’s innovative efforts to reuse highly-treated reclaimed water for appropriate applications is safe and of tremendous value in augmenting the state’s water supplies. Finally, some of Arizona’s reclaimed water has been reused to create environmental amenities and restorations. One example is the Tres Rios constructed wetlands operated by the City of Phoenix, which assists in providing additional advanced treatment of the reclaimed water from the regional 91st Avenue wastewater treatment plant, and also creates a large area of valuable wildlife habitat. It has been estimated that through the work of Arizona’s wastewater systems, as much as 85% of the state’s wastewater is ultimately reused for a beneficial purpose.
ISSUES FACING ARIZONA’S WASTEWATER INFRASTRUCTURE Over the past several decades, regulatory standards for the quality of treated water, or effluent, produced by wastewater facilities have become increasingly stringent, resulting in ongoing improvement in the quality of the treated water. Wastewater systems must continuously monitor the quality and effectiveness of their systems, and they must comply with new public health and environmental regulatory mandates as they are enacted by agencies such as the U.S. Environmental Protection Agency (EPA) and the Arizona Department of Environmental Quality. This leads to an ongoing need to upgrade the level of treatment being performed resulting in additional improvements in reclaimed water quality. In some smaller, mostly rural, communities, less sophisticated treatment facilities such as lagoons are used to slowly treat the wastewater before it is released back to the environment. These facilities do not provide as high a level of treatment as the more-sophisticated “mechanical’” wastewater plants, and in some cases, water quality problems have resulted. There is a long-term trend toward the elimination of lagoon-type treatment plants except in appropriate locations. Some smaller communities do not have any wastewater collection and treatment systems; those locations rely on private on-site treatment systems, usually consisting of a septic tank with a leaching field that allows effluent back into the soil. To work, these systems require a significant amount of land area to work adequately and thus are only effective in areas of low-density development. Because septic tanks provide only a limited amount of treatment, in some cases, septic tanks can jeopardize groundwater quality. As a result, a number of communities which formerly had only on-site septic tanks for wastewater treatment and disposal have constructed centralized wastewater collection systems and treatment plants over the past 20 years. Several hundred million dollars have been invested in these “septic-to-sewer” projects, resulting in improved groundwater protection.
2015 REPORT CARD FOR ARIZONA’S INFRASTRUCTURE
Arizona’s wastewater utilities have been dealing with the challenges of growth for many decades, with ongoing efforts to extend collection systems to serve new developments and additional existing development, and to expand treatment capacity to handle increasing wastewater flows. Another longstanding challenge has been the ongoing trend of increasingly high standards for the quality of reclaimed water produced by the facilities. As environmental standards tighten, and reclaimed water reuses expand and become more sophisticated, the result is a need to add higher levels of treatment and more robust treatment processes at Arizona’s wastewater plants. Most of the wastewater plants in Arizona now include filtration processes which were not found two or three decades ago. Standards for disinfection of the reclaimed water have become more stringent; in many cases non-detect for any microbial hazard has become the norm. Arizona communities will need to continue to expand the reuse of reclaimed water to fully benefit from that resource and with that expansion will come additional needs for treatment plant upgrades. Due in particular to the economic downturn, many of Arizona’s wastewater plants suffer from deferred maintenance issues that will require attention to correct in the near future. Many utilities’ revenues and budgets were significantly reduced during the downturn, with needed projects deferred or cancelled. It is now necessary to address the needs which have been postponed at many plants. EPA, with assistance from ADEQ in Arizona, periodically compiles a “needs assessments” for wastewater systems. The most recent EPA needs assessment was prepared in year 2008. It documented that 20% of the state’s wastewater treatment plants, mostly located in smaller rural communities, were receiving flows approaching or exceeding their rated and permitted treatment capacity. The larger communities in general have more treatment capacity available, due in part to the slowing in growth that occurred during the recent economic downturn. Overall, the state’s wastewater plants were at 75% of their rated flow-treating capacity in 2008. Arizona’s urban communities have continued to grow and growth is projected to accelerate with the improvement in the economy. It is required that facilities begin the process of expanding when flows reach 80% of rated capacity. According to the needs assessment, wastewater flows statewide are projected to more than double to nearly 850 million gallons per day within the next 20 years. In total, the ADEQ-EPA needs assessment documented a statewide need for $2.3 billion in investment in Arizona wastewater treatment facilities over the next 20 years. Another challenge that has emerged for Arizona wastewater systems in recent years is the need for rehabilitation or replacement of existing facilities that are nearing or past the end of their expected useful life. Although Arizona is a relatively young state, many portions of the wastewater systems are 50 years old or more. In particular, pipelines in Arizona’s Thus thte wastewater collection systems are deteriorating due to age and also due to corrosive attack by hydrogen sulfide which is a harsh problem in Arizona due to the warm climate. In the past decade there have a number of sewer collapses or breaks due to structural failure of the pipes themselves, which in some cases can be completely eaten away by corrosion. Many of the largest sewers in the metropolitan Phoenix and Tucson areas were constructed in the 1950s, 60s and 70s. Although these lines might otherwise have been expected to last as long as 100 years, due to the challenging conditions in our climate these pipes cannot be expected to last more than 50 years. A major failure of one of these pipelines could disrupt wastewater service to tens of thousands of people. The solution to this problem is well-known to wastewater system managers: proactively identify the issues by inspecting sewers and other collection facilities in advance to identify damage and deterioration before it worsens to the point of failure, and take corrective actions to reline the pipe or otherwise reinforce the facilities. However, most utilities do not
2015 REPORT CARD FOR ARIZONA’S INFRASTRUCTURE
have sufficient funding to keep up with these needs. The problem of deteriorating wastewater collection systems is also a serious issue in Arizona’s smaller communities as well. Many of these communities were founded in the late 1800s, and their wastewater systems are in some cases that old. These smaller communities typically do not have the financial resources available to undertake repair or replacement of their wastewater collection systems. Looking across the state, the EPA wastewater needs assessment identified a total of $2.1 billion in needs for Arizona’s wastewater collection systems. Thus the total identified need for wastewater treatment plus collection system improvements was $4.4 billion.
Although effective and safe wastewater treatment and reclaimed water reuse facilities and programs are essential to Arizona’s well-being, another challenge facing Arizona in the wastewater arena is the lack of funding resources devoted to the two state agencies charged with monitoring, regulating, and ultimately supporting high-quality wastewater treatment and water reuse programs in the state: the Arizona Department of Environmental Quality, and the Arizona Department of Water Resources. Multiple years of state budget difficulties have led to substantial cuts in budgets and funding support for these two agencies as the state Legislature has “swept” funds designated for these two departments and used the funds to cover shortfalls in other departments and agencies.
Another future challenges facing Arizona’s wastewater facilities is the need to deal with increasing salinity (dissolved salt in the water). Arizona’s water supplies include relatively high concentrations of dissolved minerals and salts. Through use of the water, the salinity of wastewater is typically increased by about 20 to 30% compared to the source water. However, in addition in Arizona, there is widespread use of salt-based home and industrial water softening systems, which significantly compounds the problem. In some cases the salinity of wastewater received at WWTPS is nearly double the salinity of the source water distributed for potable uses. Wastewater treatment plants are not designed to remove dissolved salts and, thus, whatever salinity is received at the treatment plant is typically present in the reclaimed water. This has two potential impacts:
1. Excessive levels of salinity impair the quality of the reclaimed water for reuse, and this has already become an issue in some locations where high salt concentrations in some reclaimed water supplies have limited the usefulness of the water for irrigation of turf and some other landscape plantings.
2. A second concern with increased salinity is what is referred to as “effluent toxicity.” Many WWTPs are required to track the quality of water they discharge or release to the environment using
3. “biomonitoring” in which certain test organisms are maintained in an environment of the reclaimed water. If mortality rates in the test organisms are deemed to be excessive, that can curtail the opportunity to discharge the water.
There are not simple solutions for salinity issues. A few Arizona wastewater facilities have gone so far as to add reverse osmosis processes to remove salt from their reclaimed water product, but even reverse osmosis creates a stream of brine, which is the same salt concentrated in a smaller stream of reject water. To date, an affordable and realistic regional solution does not exist for brine disposal. The potential actions to mitigate salinity that may become necessary statewide have the potential to create very large cost impacts in future years for Arizona wastewater utilities.
Courtesy of USACE by Lee Roberts, Tres Rios Wetlands
2015 REPORT CARD FOR ARIZONA’S INFRASTRUCTURE
LET’S RAISE ARIZONA’S WASTEWATER GRADE To improve Arizona’s wastewater infrastructure grade, these steps are recommended:
Increase funding for the Water Infrastructure Financing Authority that assists Arizona communities with grants and low-interest loans to pay for wastewater and water improvement projects.
Increase the funding for and attention paid to collection system repair and rehabilitation.
Ensure that developers of projects that create additional demands on our wastewater systems pay their fair share of the capital costs of constructing the systems that serve their projects.
Continue to provide adequate funding so that the Arizona Department of Environmental Quality can carry out its mission to keep Arizona’s water healthy.
Consider taking a variety of innovative and preventative actions to reduce the salinity of Arizona’s wastewater to reduce future costs.
Expand upon the initial efforts by the U.S. Bureau of Reclamation and others to develop a regional or statewide solution to the salinity issue, including potentially a system for management and disposal or recovery of brines and reject streams from advances wastewater treatment processes.
Increase opportunities for public-private partnerships to obtain funding for appropriate projects.
FIND OUT MORE 1. Arizona Department of Environmental Quality 2. U.S. Bureau of Reclamation 3. U.S. Environmental Protection Agency, Clean Watersheds Needs Survey (CWNS), 2008;
www.water.epa.gov/scitech/datait/databases/cwns/upload/cwns2008rtc.pdf
2015 REPORT CARD FOR ARIZONA’S INFRASTRUCTURE
WHAT YOU NEED TO KNOW ABOUT ARIZONA’S LEVEES
Photo courtesy of www.blogcdn.com
Levees have been a part of Arizona’s flood management system for over a century, yet broad public interest in the
condition of levees has only been building for the last few decades. Failure of the New Orleans levee systems in 2005
was a stark reminder of the potential hazard that can result from under designed or poorly maintained levees. Although
there is a limited number of levees and dikes in Arizona, there are still significant impacts associated with failure of these
facilities.
A levee is defined as a man-made structure, usually an earthen embankment, designed to contain, control, or divert the flow of water to provide protection from temporary flooding. The Federal Emergency Management Agency (FEMA) and the U.S. Army Corp of Engineers (USACE) have initiated a national levee program. Arizona has approximately 1,293 miles of levees according to the FEMA Midterm Levee Inventory. Levees are “specifically exempt from ADWR’s jurisdiction.” It is anticipated that FEMA will institute a National Levee Safety Program in the near future and, according to the 2013 State of Arizona Hazard Mitigation Plan Risk Assessment, the State of Arizona plans to participate.
Levee systems shown on Flood Rate Insurance Maps (FIRMs) and Digital FIRMs (DFIRMs) release by FEMA fall into two
broad categories:
Accredited Levee System—A levee system that FEMA has shown on a FIRM or DFIRM as providing protection from
the 1-percent-annual-chance or greater flood.
Provisionally Accredited Levee —A designation for a levee system that FEMA has previously accredited with
providing 1-percent-annual-chance protection on an effective FIRM or DFIRM, and for which FEMA is awaiting data
and/or documentation that will demonstrate the levee system’s compliance with the NFIP regulatory criteria.
LEVEES C
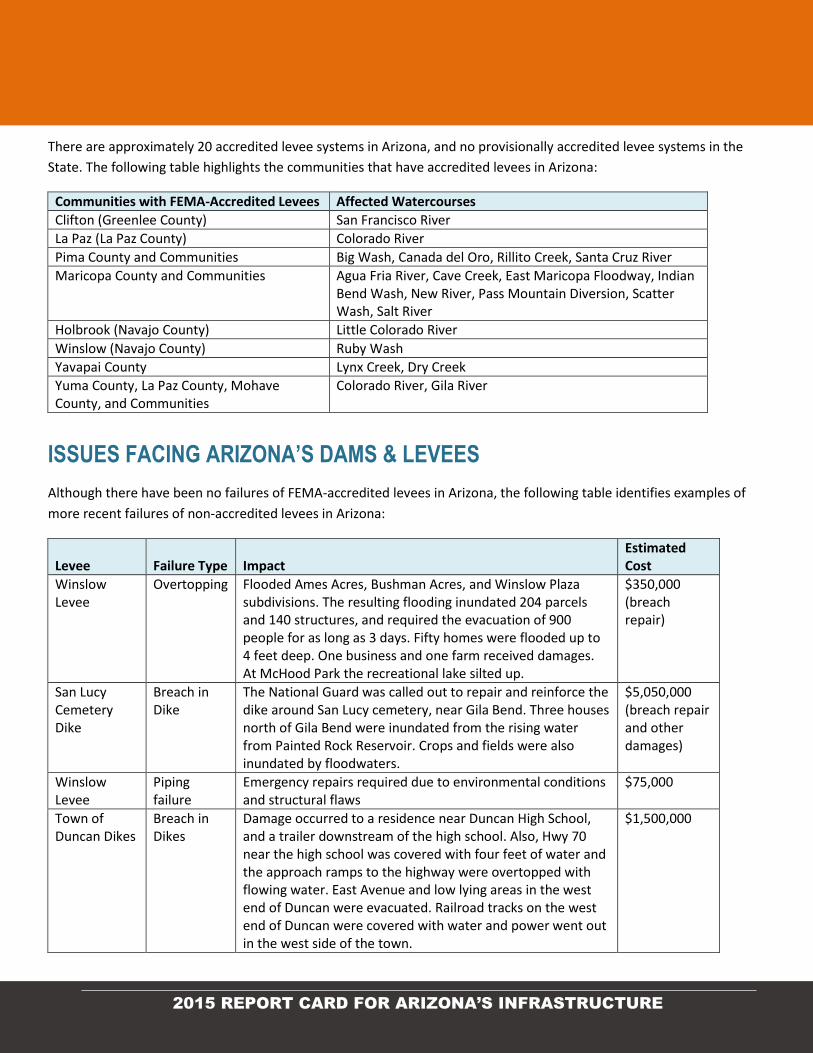
2015 REPORT CARD FOR ARIZONA’S INFRASTRUCTURE
There are approximately 20 accredited levee systems in Arizona, and no provisionally accredited levee systems in the
State. The following table highlights the communities that have accredited levees in Arizona:
Communities with FEMA-Accredited Levees Affected Watercourses
Clifton (Greenlee County) San Francisco River
La Paz (La Paz County) Colorado River
Pima County and Communities Big Wash, Canada del Oro, Rillito Creek, Santa Cruz River
Maricopa County and Communities Agua Fria River, Cave Creek, East Maricopa Floodway, Indian Bend Wash, New River, Pass Mountain Diversion, Scatter Wash, Salt River
Holbrook (Navajo County) Little Colorado River
Winslow (Navajo County) Ruby Wash
Yavapai County Lynx Creek, Dry Creek
Yuma County, La Paz County, Mohave County, and Communities
Colorado River, Gila River
ISSUES FACING ARIZONA’S DAMS & LEVEES
Although there have been no failures of FEMA-accredited levees in Arizona, the following table identifies examples of
more recent failures of non-accredited levees in Arizona:
Levee Failure Type Impact Estimated Cost
Winslow Levee
Overtopping Flooded Ames Acres, Bushman Acres, and Winslow Plaza subdivisions. The resulting flooding inundated 204 parcels and 140 structures, and required the evacuation of 900 people for as long as 3 days. Fifty homes were flooded up to 4 feet deep. One business and one farm received damages. At McHood Park the recreational lake silted up.
$350,000 (breach repair)
San Lucy Cemetery Dike
Breach in Dike
The National Guard was called out to repair and reinforce the dike around San Lucy cemetery, near Gila Bend. Three houses north of Gila Bend were inundated from the rising water from Painted Rock Reservoir. Crops and fields were also inundated by floodwaters.
$5,050,000 (breach repair and other damages)
Winslow Levee
Piping failure
Emergency repairs required due to environmental conditions and structural flaws
$75,000
Town of Duncan Dikes
Breach in Dikes
Damage occurred to a residence near Duncan High School, and a trailer downstream of the high school. Also, Hwy 70 near the high school was covered with four feet of water and the approach ramps to the highway were overtopped with flowing water. East Avenue and low lying areas in the west end of Duncan were evacuated. Railroad tracks on the west end of Duncan were covered with water and power went out in the west side of the town.
$1,500,000
2015 REPORT CARD FOR ARIZONA’S INFRASTRUCTURE
Source: 2013 State of Arizona Hazard Mitigation Plan Risk Assessment
As illustrated above, the impacts of levee or dike failure can be significant. These failures may affect local residents,
responders to the incidents, ability to deliver services, the environment, and public confidence in government. Another
significant consideration is the economic impact of failure. Data from Arizona county hazard mitigation plans indicates
that approximately $2.2 billion in locally identified critical and non-critical facilities are exposed to a “high” flood hazard,
with approximately $306 million in potential losses estimated.
LET’S RAISE ARIZONA’S LEVEES GRADE Arizona is committed to improving oversight and regulation of levees. A stronger federal program could provide some
guidance, but Arizona can start improving the situation today. Some solutions for improving levees in Arizona include:
Participate in and support the formation of a National Levee Safety Program
Work with federal and state regulators to establish a levee rehabilitation funding program
Advocate for better local levee safety regulations and oversight
Provide information about the risks and issues related to living behind levees
FIND OUT MORE FEMA, www.fema.gov/plan/prevent/fhm/lv_intro.shtm
Navajo County, Board of Supervisors, April 21, 2003 Board of Supervisor Meeting Minutes, www.navajocountyaz.gov/bos/minutes/2003/042103min.pdf
NCDC Storm Events Database, www.ncdc.noaa.gov/stormevents/ftp.jsp
U.S. Army Corps of Engineers, 1994, Flood Damage Report, State of Arizona, Floods of 1993
2013 State of Arizona Hazard Mitigation Plan Risk Assessment the State of Arizona, www.dem.azdema.gov/preparedness/docs/coop/mitplan/29_Levee_Failure.pdf
Maricopa County Multi-Jurisdictional Hazard Mitigation Plan, 2009; www.maricopa.gov/emerg_mgt/PDF/Hazard_Mitigation/Section%205.pdf
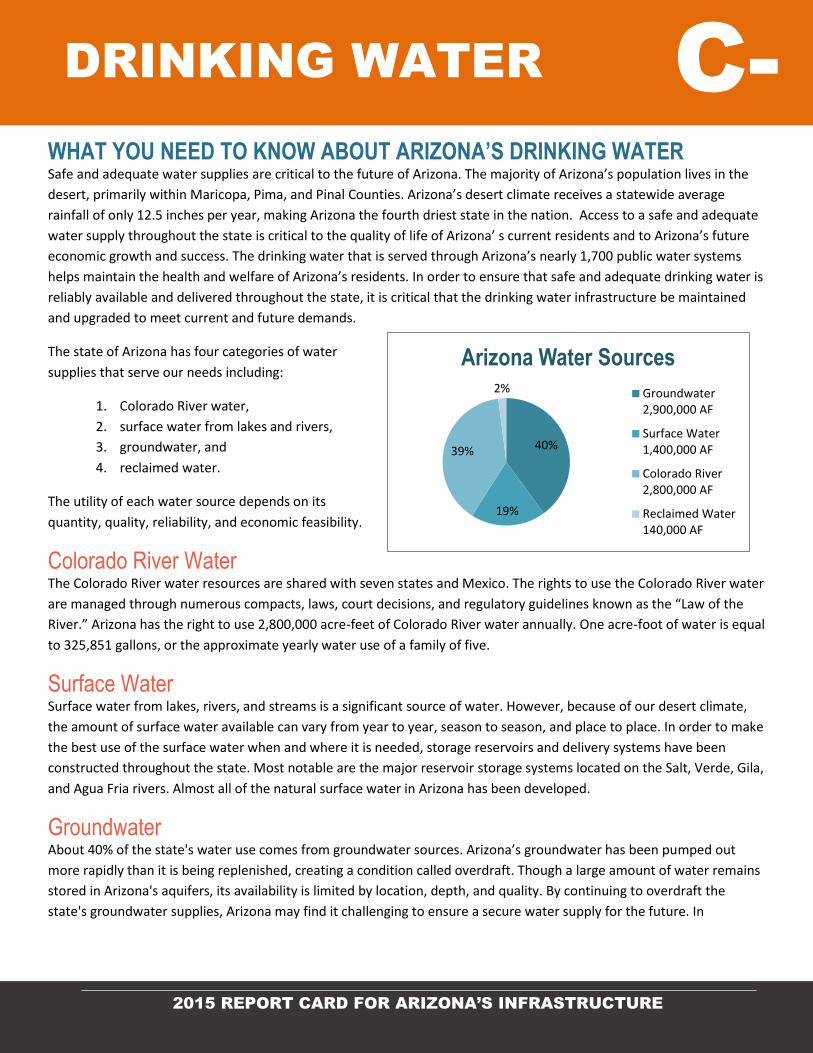
2015 REPORT CARD FOR ARIZONA’S INFRASTRUCTURE
WHAT YOU NEED TO KNOW ABOUT ARIZONA’S DRINKING WATER Safe and adequate water supplies are critical to the future of Arizona. The majority of Arizona’s population lives in the
desert, primarily within Maricopa, Pima, and Pinal Counties. Arizona’s desert climate receives a statewide average
rainfall of only 12.5 inches per year, making Arizona the fourth driest state in the nation. Access to a safe and adequate
water supply throughout the state is critical to the quality of life of Arizona’ s current residents and to Arizona’s future
economic growth and success. The drinking water that is served through Arizona’s nearly 1,700 public water systems
helps maintain the health and welfare of Arizona’s residents. In order to ensure that safe and adequate drinking water is
reliably available and delivered throughout the state, it is critical that the drinking water infrastructure be maintained
and upgraded to meet current and future demands.
The state of Arizona has four categories of water
supplies that serve our needs including:
1. Colorado River water,
2. surface water from lakes and rivers,
3. groundwater, and
4. reclaimed water.
The utility of each water source depends on its
quantity, quality, reliability, and economic feasibility.
Colorado River Water The Colorado River water resources are shared with seven states and Mexico. The rights to use the Colorado River water
are managed through numerous compacts, laws, court decisions, and regulatory guidelines known as the “Law of the
River.” Arizona has the right to use 2,800,000 acre-feet of Colorado River water annually. One acre-foot of water is equal
to 325,851 gallons, or the approximate yearly water use of a family of five.
Surface Water Surface water from lakes, rivers, and streams is a significant source of water. However, because of our desert climate,
the amount of surface water available can vary from year to year, season to season, and place to place. In order to make
the best use of the surface water when and where it is needed, storage reservoirs and delivery systems have been
constructed throughout the state. Most notable are the major reservoir storage systems located on the Salt, Verde, Gila,
and Agua Fria rivers. Almost all of the natural surface water in Arizona has been developed.
Groundwater About 40% of the state's water use comes from groundwater sources. Arizona’s groundwater has been pumped out
more rapidly than it is being replenished, creating a condition called overdraft. Though a large amount of water remains
stored in Arizona's aquifers, its availability is limited by location, depth, and quality. By continuing to overdraft the
state's groundwater supplies, Arizona may find it challenging to ensure a secure water supply for the future. In
40%
19%
39%
2%
Arizona Water Sources
Groundwater2,900,000 AF
Surface Water1,400,000 AF
Colorado River2,800,000 AF
Reclaimed Water140,000 AF
DRINKING WATER C-
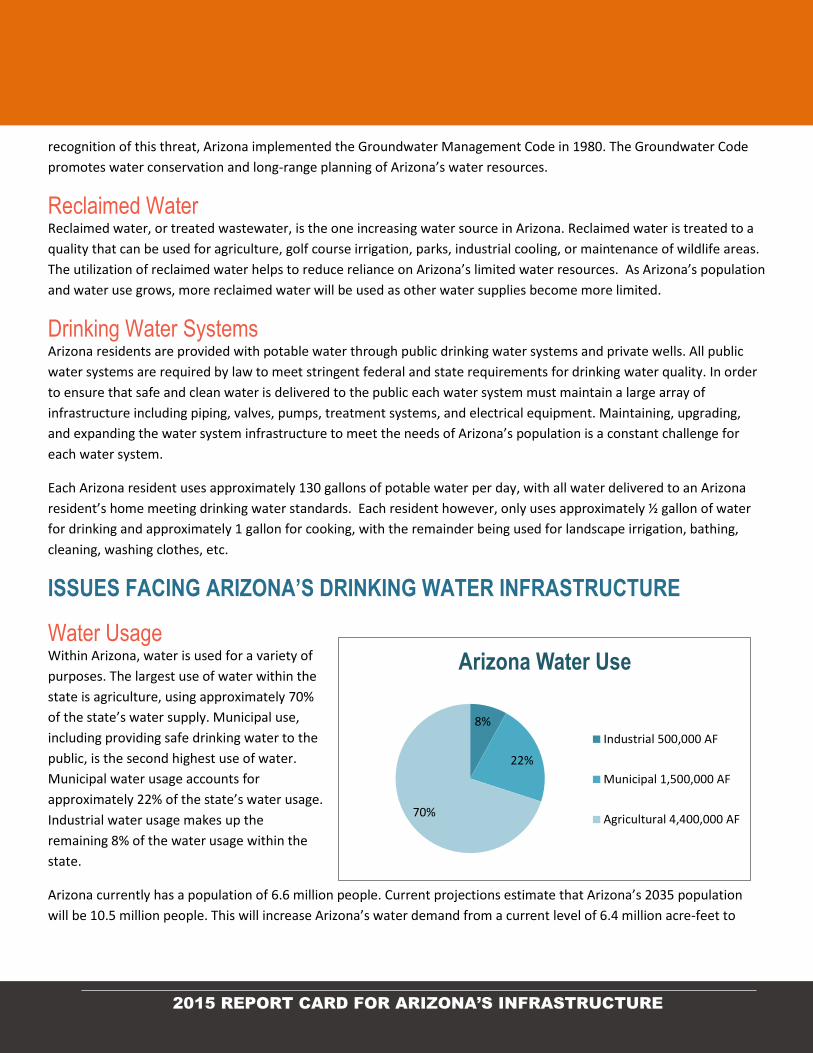
2015 REPORT CARD FOR ARIZONA’S INFRASTRUCTURE
recognition of this threat, Arizona implemented the Groundwater Management Code in 1980. The Groundwater Code
promotes water conservation and long-range planning of Arizona’s water resources.
Reclaimed Water Reclaimed water, or treated wastewater, is the one increasing water source in Arizona. Reclaimed water is treated to a
quality that can be used for agriculture, golf course irrigation, parks, industrial cooling, or maintenance of wildlife areas.
The utilization of reclaimed water helps to reduce reliance on Arizona’s limited water resources. As Arizona’s population
and water use grows, more reclaimed water will be used as other water supplies become more limited.
Drinking Water Systems Arizona residents are provided with potable water through public drinking water systems and private wells. All public
water systems are required by law to meet stringent federal and state requirements for drinking water quality. In order
to ensure that safe and clean water is delivered to the public each water system must maintain a large array of
infrastructure including piping, valves, pumps, treatment systems, and electrical equipment. Maintaining, upgrading,
and expanding the water system infrastructure to meet the needs of Arizona’s population is a constant challenge for
each water system.
Each Arizona resident uses approximately 130 gallons of potable water per day, with all water delivered to an Arizona
resident’s home meeting drinking water standards. Each resident however, only uses approximately ½ gallon of water
for drinking and approximately 1 gallon for cooking, with the remainder being used for landscape irrigation, bathing,
cleaning, washing clothes, etc.
ISSUES FACING ARIZONA’S DRINKING WATER INFRASTRUCTURE
Water Usage Within Arizona, water is used for a variety of
purposes. The largest use of water within the
state is agriculture, using approximately 70%
of the state’s water supply. Municipal use,
including providing safe drinking water to the
public, is the second highest use of water.
Municipal water usage accounts for
approximately 22% of the state’s water usage.
Industrial water usage makes up the
remaining 8% of the water usage within the
state.
Arizona currently has a population of 6.6 million people. Current projections estimate that Arizona’s 2035 population
will be 10.5 million people. This will increase Arizona’s water demand from a current level of 6.4 million acre-feet to
8%
22%
70%
Arizona Water Use
Industrial 500,000 AF
Municipal 1,500,000 AF
Agricultural 4,400,000 AF
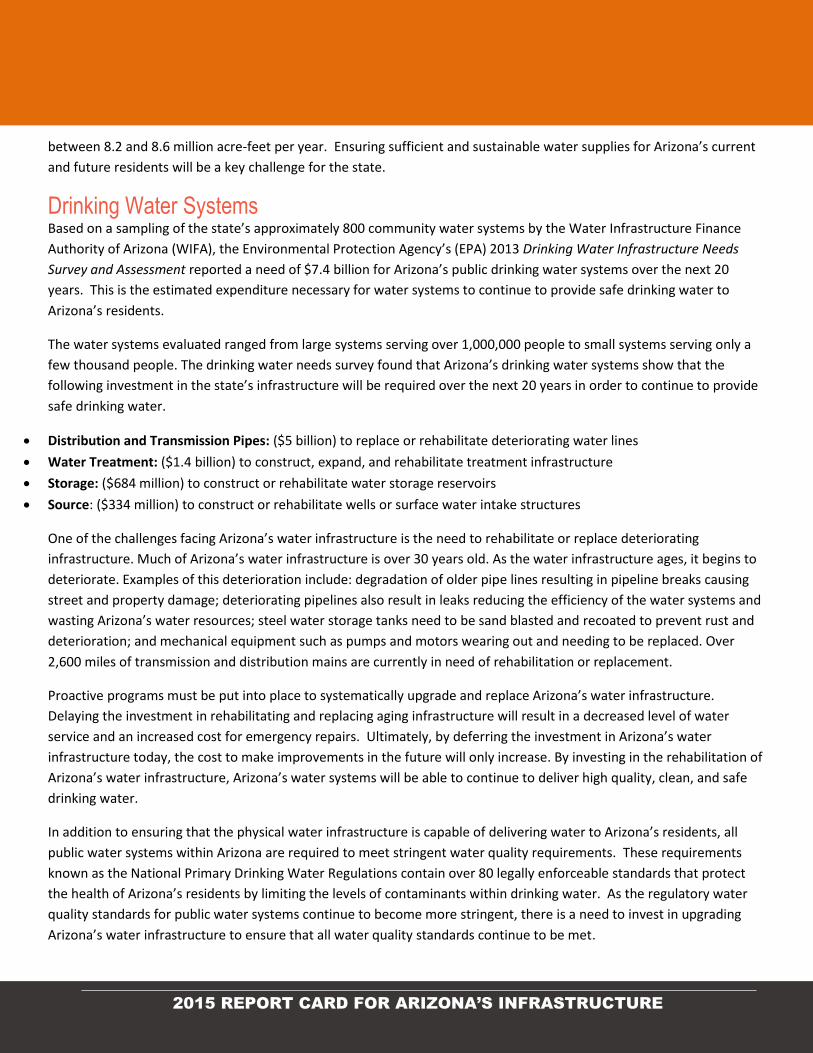
2015 REPORT CARD FOR ARIZONA’S INFRASTRUCTURE
between 8.2 and 8.6 million acre-feet per year. Ensuring sufficient and sustainable water supplies for Arizona’s current
and future residents will be a key challenge for the state.
Drinking Water Systems Based on a sampling of the state’s approximately 800 community water systems by the Water Infrastructure Finance
Authority of Arizona (WIFA), the Environmental Protection Agency’s (EPA) 2013 Drinking Water Infrastructure Needs
Survey and Assessment reported a need of $7.4 billion for Arizona’s public drinking water systems over the next 20
years. This is the estimated expenditure necessary for water systems to continue to provide safe drinking water to
Arizona’s residents.
The water systems evaluated ranged from large systems serving over 1,000,000 people to small systems serving only a
few thousand people. The drinking water needs survey found that Arizona’s drinking water systems show that the
following investment in the state’s infrastructure will be required over the next 20 years in order to continue to provide
safe drinking water.
Distribution and Transmission Pipes: ($5 billion) to replace or rehabilitate deteriorating water lines
Water Treatment: ($1.4 billion) to construct, expand, and rehabilitate treatment infrastructure
Storage: ($684 million) to construct or rehabilitate water storage reservoirs
Source: ($334 million) to construct or rehabilitate wells or surface water intake structures
One of the challenges facing Arizona’s water infrastructure is the need to rehabilitate or replace deteriorating
infrastructure. Much of Arizona’s water infrastructure is over 30 years old. As the water infrastructure ages, it begins to
deteriorate. Examples of this deterioration include: degradation of older pipe lines resulting in pipeline breaks causing
street and property damage; deteriorating pipelines also result in leaks reducing the efficiency of the water systems and
wasting Arizona’s water resources; steel water storage tanks need to be sand blasted and recoated to prevent rust and
deterioration; and mechanical equipment such as pumps and motors wearing out and needing to be replaced. Over
2,600 miles of transmission and distribution mains are currently in need of rehabilitation or replacement.
Proactive programs must be put into place to systematically upgrade and replace Arizona’s water infrastructure.
Delaying the investment in rehabilitating and replacing aging infrastructure will result in a decreased level of water
service and an increased cost for emergency repairs. Ultimately, by deferring the investment in Arizona’s water
infrastructure today, the cost to make improvements in the future will only increase. By investing in the rehabilitation of
Arizona’s water infrastructure, Arizona’s water systems will be able to continue to deliver high quality, clean, and safe
drinking water.
In addition to ensuring that the physical water infrastructure is capable of delivering water to Arizona’s residents, all
public water systems within Arizona are required to meet stringent water quality requirements. These requirements
known as the National Primary Drinking Water Regulations contain over 80 legally enforceable standards that protect
the health of Arizona’s residents by limiting the levels of contaminants within drinking water. As the regulatory water
quality standards for public water systems continue to become more stringent, there is a need to invest in upgrading
Arizona’s water infrastructure to ensure that all water quality standards continue to be met.
2015 REPORT CARD FOR ARIZONA’S INFRASTRUCTURE
LET’S RAISE ARIZONA’S DRINKING WATER INFRASTRUCTURE GRADE
Recommendations for improving Arizona’s drinking water infrastructure include:
Funding - Increase funding for the Water Infrastructure Financing Authority that assists Arizona communities with grants and low-interest loans to pay for water improvement projects.
Rehabilitation- Allocate the funds necessary to proactively rehabilitate and replace deteriorating water infrastructure.
Conservation- Arizona has been at the forefront of water conservation with a commitment to use all water supplies as efficiently as possible. Arizona should continue to focus on ensuring that Arizona’s water resources are conserved helping ensure that future needs can be met.
Water Rates- Communities should develop proper water rates to support their infrastructure needs, and work to educate their ratepayers on the necessary expenses that the water rates cover. These rates must support infrastructure needs whether a public water system is self-funding projects, going to the bond market, or financing projects through a bank or government agency.
FIND OUT MORE
Arizona Department of Environmental Quality, Water Quality Division: Safe Drinking Water Overview, www.azdeq.gov/environ/water/dw/overview.html
Arizona Department of Water Resources, Arizona Water Supplies and Water Demands, www.azwater.gov/AzDWR/PublicInformationOfficer/documents/supplydemand.pdf
Arizona Department of Water Resources, A Strategic Vision for Water Supply Sustainability, www.azwater.gov/AzDWR/Arizonas_Strategic_Vision/documents/ExecutiveSummary.pdf
Arizona Department of Water Resources, ABC’s of Water, www.azwater.gov/azdwr/publicinformationofficer/abcofwater.htm
Arizona’s Water: Uses and Sources, www.arizonaexperience.org/people/arizonas-water-uses-and-sources
Average Annual Precipitation by State, www.currentresults.com/Weather/US/average-annual-state-precipitation.php
Buried No Longer: Confronting America’s Water Infrastructure Challenge, www.awwa.org/Portals/0/files/legreg/documents/BuriedNoLonger.pdf
Central Arizona Project, History, www.cap-az.com/index.php/cap-history
University of Arizona, Arizona: Know Your Water, Janick Artiola, Kathryn Farrell-Poe, Jacqueline Moxley, 2006
United States Census Bureau, State & County Quickfacts, www.quickfacts.census.gov/qfd/states/04000.html
United States Environmental Protection Agency, Drinking Water Infrastructure Needs Survey and Assessment, Fifth Report to Congress
United States Environmental Protection Agency, Fiscal Year 2011 Drinking Water and Ground Water Statistics, www.water.epa.gov/scitech/datait/databases/drink/sdwisfed/upload/epa816r13003.pdf
United States Environmental Protection Agency, National Primary Drinking Water Regulations, www.water.epa.gov/drink/contaminants
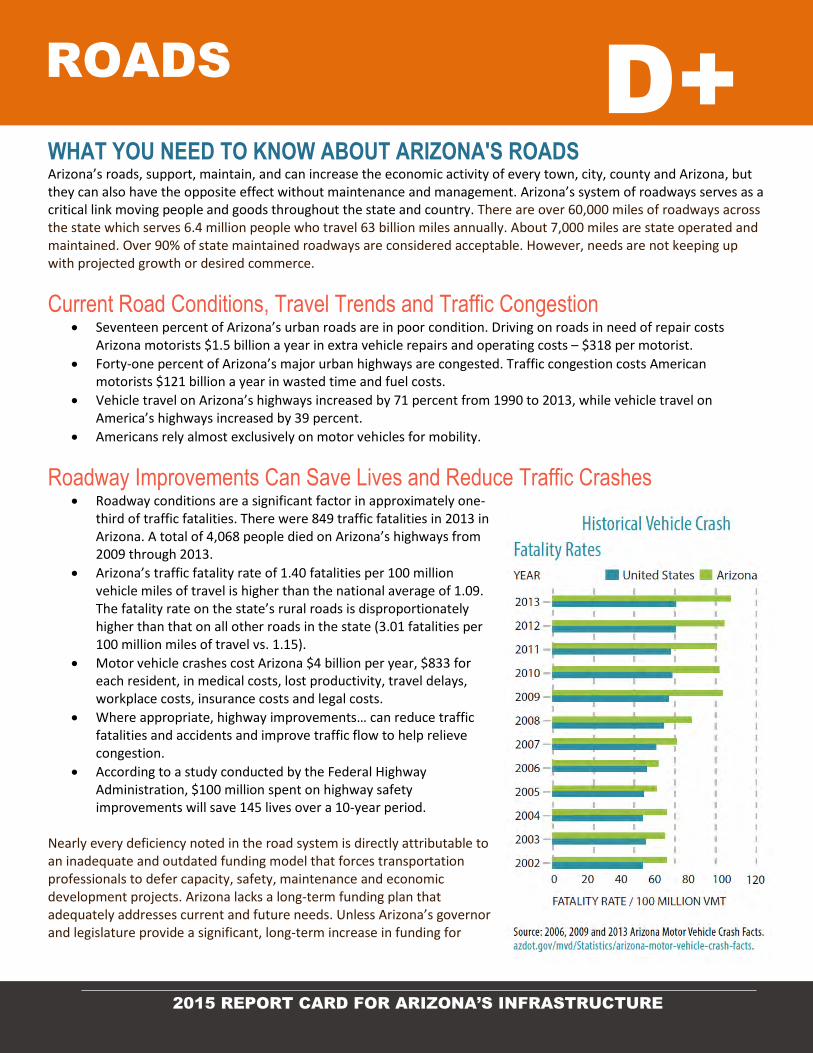
2015 REPORT CARD FOR ARIZONA’S INFRASTRUCTURE
WHAT YOU NEED TO KNOW ABOUT ARIZONA'S ROADS Arizona’s roads, support, maintain, and can increase the economic activity of every town, city, county and Arizona, but they can also have the opposite effect without maintenance and management. Arizona’s system of roadways serves as a critical link moving people and goods throughout the state and country. There are over 60,000 miles of roadways across the state which serves 6.4 million people who travel 63 billion miles annually. About 7,000 miles are state operated and maintained. Over 90% of state maintained roadways are considered acceptable. However, needs are not keeping up with projected growth or desired commerce.
Current Road Conditions, Travel Trends and Traffic Congestion Seventeen percent of Arizona’s urban roads are in poor condition. Driving on roads in need of repair costs
Arizona motorists $1.5 billion a year in extra vehicle repairs and operating costs – $318 per motorist.
Forty-one percent of Arizona’s major urban highways are congested. Traffic congestion costs American motorists $121 billion a year in wasted time and fuel costs.
Vehicle travel on Arizona’s highways increased by 71 percent from 1990 to 2013, while vehicle travel on America’s highways increased by 39 percent.
Americans rely almost exclusively on motor vehicles for mobility.
Roadway Improvements Can Save Lives and Reduce Traffic Crashes Roadway conditions are a significant factor in approximately one-
third of traffic fatalities. There were 849 traffic fatalities in 2013 in Arizona. A total of 4,068 people died on Arizona’s highways from 2009 through 2013.
Arizona’s traffic fatality rate of 1.40 fatalities per 100 million vehicle miles of travel is higher than the national average of 1.09. The fatality rate on the state’s rural roads is disproportionately higher than that on all other roads in the state (3.01 fatalities per 100 million miles of travel vs. 1.15).
Motor vehicle crashes cost Arizona $4 billion per year, $833 for each resident, in medical costs, lost productivity, travel delays, workplace costs, insurance costs and legal costs.
Where appropriate, highway improvements… can reduce traffic fatalities and accidents and improve traffic flow to help relieve congestion.
According to a study conducted by the Federal Highway Administration, $100 million spent on highway safety improvements will save 145 lives over a 10-year period.
Nearly every deficiency noted in the road system is directly attributable to an inadequate and outdated funding model that forces transportation professionals to defer capacity, safety, maintenance and economic development projects. Arizona lacks a long-term funding plan that adequately addresses current and future needs. Unless Arizona’s governor and legislature provide a significant, long-term increase in funding for
ROADS
D+
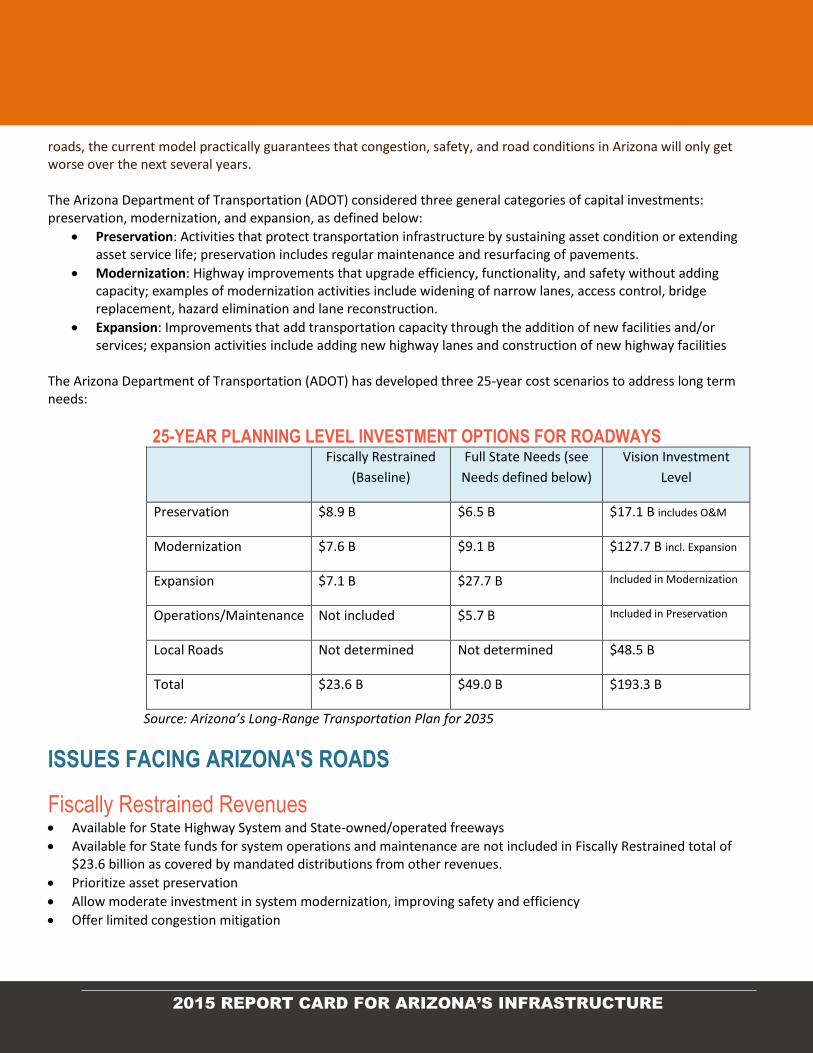
2015 REPORT CARD FOR ARIZONA’S INFRASTRUCTURE
roads, the current model practically guarantees that congestion, safety, and road conditions in Arizona will only get worse over the next several years. The Arizona Department of Transportation (ADOT) considered three general categories of capital investments: preservation, modernization, and expansion, as defined below:
Preservation: Activities that protect transportation infrastructure by sustaining asset condition or extending asset service life; preservation includes regular maintenance and resurfacing of pavements.
Modernization: Highway improvements that upgrade efficiency, functionality, and safety without adding capacity; examples of modernization activities include widening of narrow lanes, access control, bridge replacement, hazard elimination and lane reconstruction.
Expansion: Improvements that add transportation capacity through the addition of new facilities and/or services; expansion activities include adding new highway lanes and construction of new highway facilities
The Arizona Department of Transportation (ADOT) has developed three 25-year cost scenarios to address long term needs:
25-YEAR PLANNING LEVEL INVESTMENT OPTIONS FOR ROADWAYS Fiscally Restrained
(Baseline)
Full State Needs (see
Needs defined below)
Vision Investment
Level
Preservation $8.9 B $6.5 B $17.1 B includes O&M
Modernization $7.6 B $9.1 B $127.7 B incl. Expansion
Expansion $7.1 B $27.7 B Included in Modernization
Operations/Maintenance Not included $5.7 B Included in Preservation
Local Roads Not determined Not determined $48.5 B
Total $23.6 B $49.0 B $193.3 B
Source: Arizona’s Long-Range Transportation Plan for 2035
ISSUES FACING ARIZONA'S ROADS
Fiscally Restrained Revenues Available for State Highway System and State-owned/operated freeways
Available for State funds for system operations and maintenance are not included in Fiscally Restrained total of $23.6 billion as covered by mandated distributions from other revenues.
Prioritize asset preservation
Allow moderate investment in system modernization, improving safety and efficiency
Offer limited congestion mitigation
2015 REPORT CARD FOR ARIZONA’S INFRASTRUCTURE
Full State Needs Cover State Highway System and State-owned/operated freeways
Cover operations and maintenance for all State-owned/operated roads
Are performance-based
Brings the State Transportation System to acceptable performance standards as defined by ADOT criteria
Provide for job growth
Vision Investment Level Covers State Highway System and State-owned/operated freeways
Covers operations and maintenance for all State-owned/operated roads
Covers capital and operations needs for local roads and streets
Provides long-range land use and transportation scenario supports aggressive growth strategy for the State
Provides for job growth Needs are defined as the amount of spending required to achieve defined performance benchmarks. For the Plan, needs were developed consistent with current ADOT policies for system conditions and performance using “minimum tolerable (acceptable) conditions” to define a deficient (unacceptable) condition (like pavement condition, or congestion). Needs for the State Transportation System were aggregated 2010 to 2035. It is noted that fewer than 50% of Arizona’s roadway needs can be addressed with expected baseline revenues. Therefore, policies have been explored by considering the advancement of goals and objectives beyond the “Revenue Constrained” or Baseline option via specific activities or strategies. Strategies were developed to help ADOT look beyond the Baseline to advance broader goals and objectives across the State:
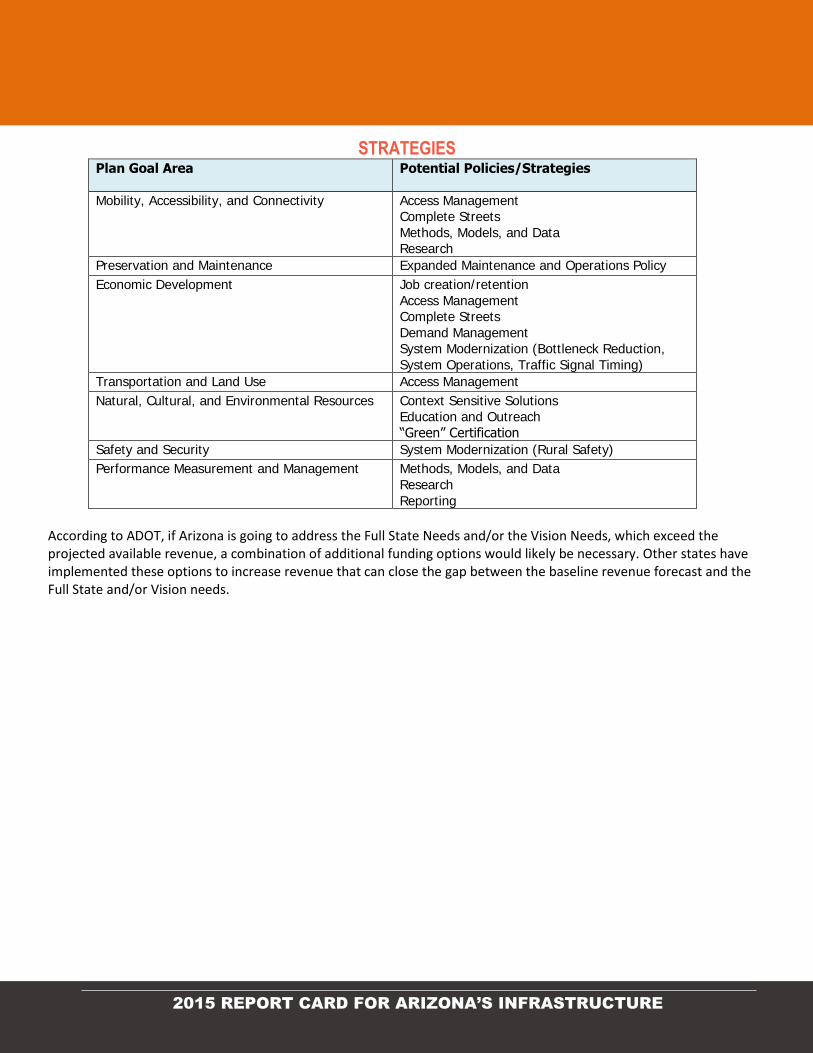
2015 REPORT CARD FOR ARIZONA’S INFRASTRUCTURE
STRATEGIES Plan Goal Area Potential Policies/Strategies
Mobility, Accessibility, and Connectivity Access Management Complete Streets
Methods, Models, and Data Research
Preservation and Maintenance Expanded Maintenance and Operations Policy
Economic Development Job creation/retention
Access Management Complete Streets
Demand Management System Modernization (Bottleneck Reduction,
System Operations, Traffic Signal Timing)
Transportation and Land Use Access Management
Natural, Cultural, and Environmental Resources Context Sensitive Solutions Education and Outreach
“Green” Certification
Safety and Security System Modernization (Rural Safety)
Performance Measurement and Management Methods, Models, and Data
Research
Reporting
According to ADOT, if Arizona is going to address the Full State Needs and/or the Vision Needs, which exceed the projected available revenue, a combination of additional funding options would likely be necessary. Other states have implemented these options to increase revenue that can close the gap between the baseline revenue forecast and the Full State and/or Vision needs.
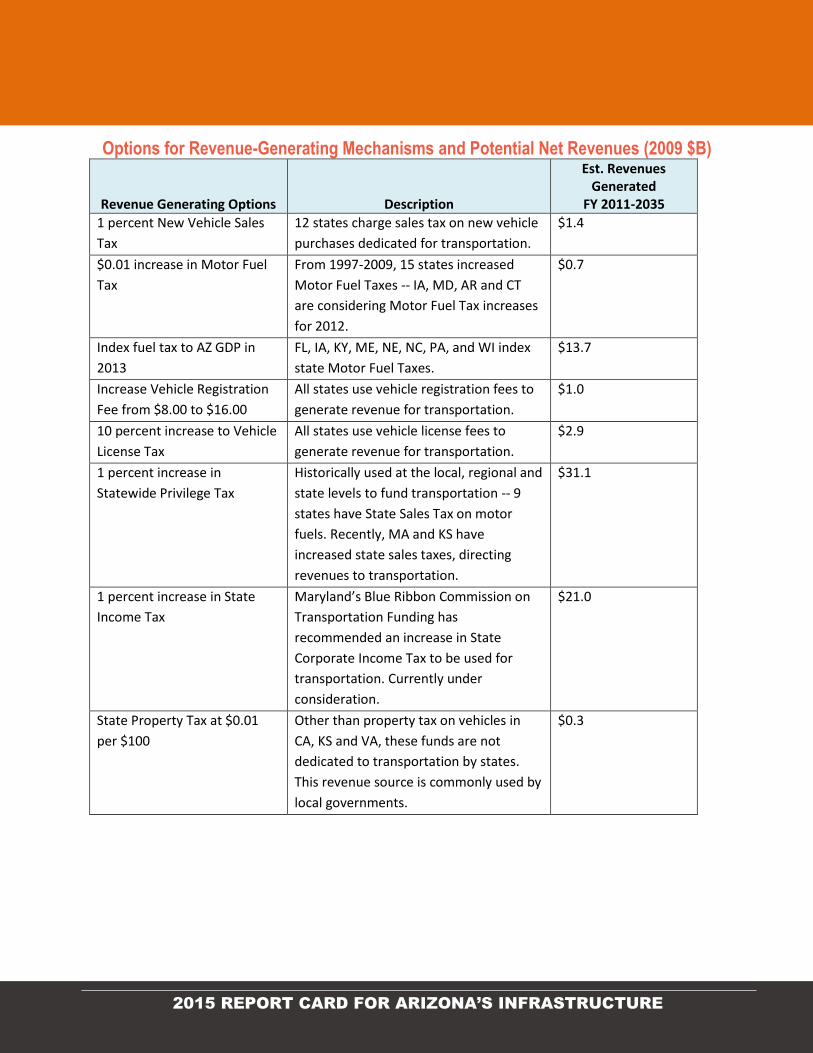
2015 REPORT CARD FOR ARIZONA’S INFRASTRUCTURE
Options for Revenue-Generating Mechanisms and Potential Net Revenues (2009 $B)
Revenue Generating Options Description
Est. Revenues Generated
FY 2011-2035
1 percent New Vehicle Sales
Tax
12 states charge sales tax on new vehicle
purchases dedicated for transportation.
$1.4
$0.01 increase in Motor Fuel
Tax
From 1997-2009, 15 states increased
Motor Fuel Taxes -- IA, MD, AR and CT
are considering Motor Fuel Tax increases
for 2012.
$0.7
Index fuel tax to AZ GDP in
2013
FL, IA, KY, ME, NE, NC, PA, and WI index
state Motor Fuel Taxes.
$13.7
Increase Vehicle Registration
Fee from $8.00 to $16.00
All states use vehicle registration fees to
generate revenue for transportation.
$1.0
10 percent increase to Vehicle
License Tax
All states use vehicle license fees to
generate revenue for transportation.
$2.9
1 percent increase in
Statewide Privilege Tax
Historically used at the local, regional and
state levels to fund transportation -- 9
states have State Sales Tax on motor
fuels. Recently, MA and KS have
increased state sales taxes, directing
revenues to transportation.
$31.1
1 percent increase in State
Income Tax
Maryland’s Blue Ribbon Commission on
Transportation Funding has
recommended an increase in State
Corporate Income Tax to be used for
transportation. Currently under
consideration.
$21.0
State Property Tax at $0.01
per $100
Other than property tax on vehicles in
CA, KS and VA, these funds are not
dedicated to transportation by states.
This revenue source is commonly used by
local governments.
$0.3
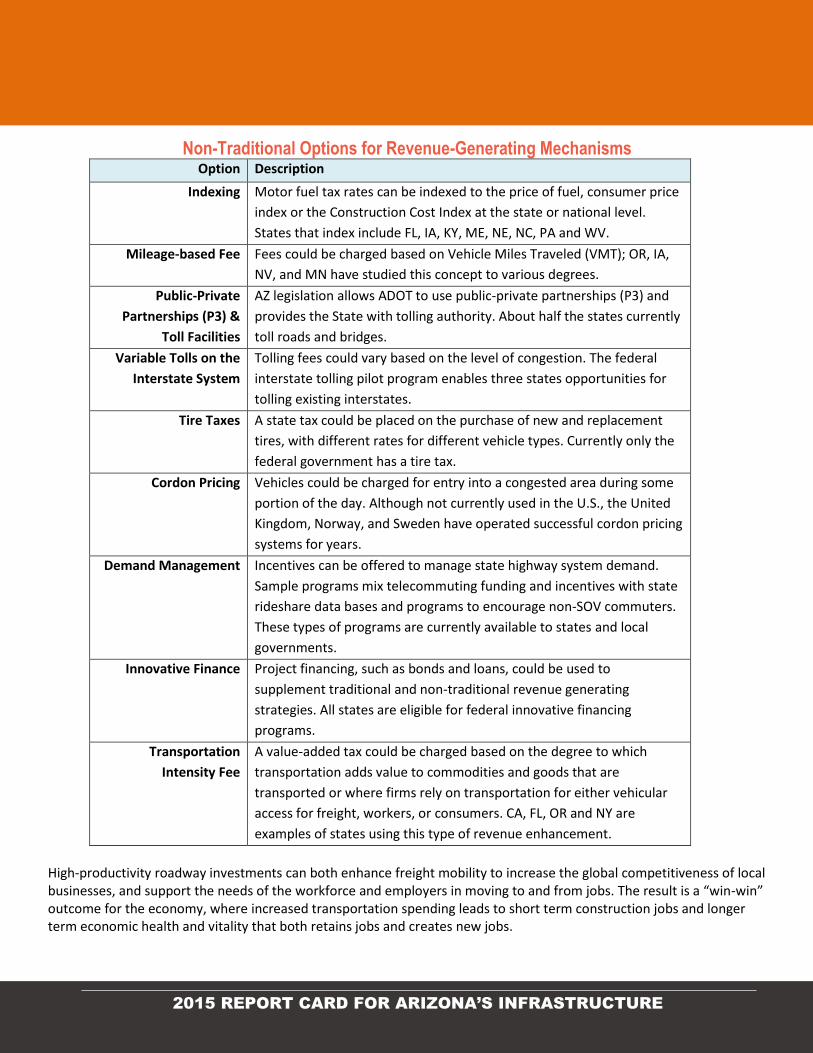
2015 REPORT CARD FOR ARIZONA’S INFRASTRUCTURE
Non-Traditional Options for Revenue-Generating Mechanisms Option Description
Indexing Motor fuel tax rates can be indexed to the price of fuel, consumer price
index or the Construction Cost Index at the state or national level.
States that index include FL, IA, KY, ME, NE, NC, PA and WV.
Mileage-based Fee Fees could be charged based on Vehicle Miles Traveled (VMT); OR, IA,
NV, and MN have studied this concept to various degrees.
Public-Private
Partnerships (P3) &
Toll Facilities
AZ legislation allows ADOT to use public-private partnerships (P3) and
provides the State with tolling authority. About half the states currently
toll roads and bridges.
Variable Tolls on the
Interstate System
Tolling fees could vary based on the level of congestion. The federal
interstate tolling pilot program enables three states opportunities for
tolling existing interstates.
Tire Taxes A state tax could be placed on the purchase of new and replacement
tires, with different rates for different vehicle types. Currently only the
federal government has a tire tax.
Cordon Pricing Vehicles could be charged for entry into a congested area during some
portion of the day. Although not currently used in the U.S., the United
Kingdom, Norway, and Sweden have operated successful cordon pricing
systems for years.
Demand Management Incentives can be offered to manage state highway system demand.
Sample programs mix telecommuting funding and incentives with state
rideshare data bases and programs to encourage non-SOV commuters.
These types of programs are currently available to states and local
governments.
Innovative Finance Project financing, such as bonds and loans, could be used to
supplement traditional and non-traditional revenue generating
strategies. All states are eligible for federal innovative financing
programs.
Transportation
Intensity Fee
A value-added tax could be charged based on the degree to which
transportation adds value to commodities and goods that are
transported or where firms rely on transportation for either vehicular
access for freight, workers, or consumers. CA, FL, OR and NY are
examples of states using this type of revenue enhancement.
High-productivity roadway investments can both enhance freight mobility to increase the global competitiveness of local businesses, and support the needs of the workforce and employers in moving to and from jobs. The result is a “win-win” outcome for the economy, where increased transportation spending leads to short term construction jobs and longer term economic health and vitality that both retains jobs and creates new jobs.
2015 REPORT CARD FOR ARIZONA’S INFRASTRUCTURE
LET’S RAISE ARIZONA'S ROADS GRADE
Develop performance-based investment strategies which will ensure that available resources are directed to those projects with the highest performance return on investment
Optimize usage of existing highway capacity to ensure the best use of available funding
Encourage the use of asset management programs to provide for the most efficient use of maintenance and repair investment
Invest in projects that will reduce injuries and fatalities
FIND OUT MORE
TRIP, www.tripnet.org/docs/Fact_Sheet_AZ.pdf
Arizona’s Long-Range Transportation Plan for 2035 by the Arizona Department of Transportation
Wilbur Smith Associates and ADOT for ADOT’s 2035 LRTP; www.transportation1.org/tif4report/state_local.html;
Transportation & Infrastructure Finance, Council of State Governments, 2008;
NCHRP Web-Only Report 102 Future Financing Options to Meet Highway and Transit Needs, 2006;
Transportation Governance and Finance – A 50-State Review of State Legislature and Departments of Transportation, AASHTO and NCSL, 2011;
How States Fund transportation and Territories Fund Transportation, NGA, 2009; Note: These options were quantified using estimates originally developed by ADOT.
2015 REPORT CARD FOR ARIZONA’S INFRASTRUCTURE
ASCE would like to acknowledge the vision and generosity of our sponsors which has led to the
completion of the Report Card for Arizona’s Infrastructure prepared. In addition to the companies list
below, we would also like to thank Robert Hughes for his personal contribution to this effort.
Tucson Chapter
ACKNOWLEDGEMENTS
2015 REPORT CARD FOR ARIZONA’S INFRASTRUCTURE
ASCE wishes to express our appreciation to the various organizations and agencies which have
supported the development of the Report Card for Arizona’s Infrastructure by providing information,
perspective, and resources including:
We thank the individuals and organizations who contributed to this report. We look forward to continuing to
work with all parties to educate and inform the public and our legislators about the role they play in supporting
the future of Arizona’s infrastructure.