vote 37 arts and culture - national treasury budget/2017... · vote 37 arts and culture ... •...
TRANSCRIPT

731
Vote 37 Arts and Culture Budget summary
2017/18 2018/19 2019/20
R million Total Current
payments Transfers and
subsidies Payments for capital assets Total Total
MTEF allocation Administration 266.5 258.8 – 7.7 291.3 309.8Institutional Governance 386.0 93.4 57.0 235.6 481.1 415.3Arts and Culture Promotion and Development 1 154.3 143.3 1 011.0 – 1 203.5 1 251.9Heritage Promotion and Preservation 2 643.1 136.0 2 507.1 – 2 515.7 2 775.3Total expenditure estimates 4 449.8 631.4 3 575.2 243.3 4 491.7 4 752.3Executive authority Minister of Arts and Culture Accounting officer Director General of Arts and Culture Website address www.dac.gov.za The Estimates of National Expenditure e-publications for individual votes are available on www.treasury.gov.za. These publications provide more comprehensive coverage of vote specific information, particularly about goods and services, transfers and subsidies, personnel, entities, donor funding, public private partnerships, conditional grants to provinces and municipalities, and expenditure information at the level of site service delivery, where appropriate.
Vote purpose Contribute to sustainable economic development and enhance job creation by preserving, protecting and developing South African arts, culture and heritage to sustain a socially cohesive and democratic nation.
Mandate The Department of Arts and Culture derives its mandate from the following legislation:
• the Heraldry Act (1962) • the Culture Promotion Act (1983) • the National Archives and Record Service of South Africa Act (1996) • the Legal Deposit Act (1997) • the South African Geographical Names Council Act (1998) • the Cultural Institutions Act (1998) • the National Council for Library and Information Act (2001) • the National Heritage Resources Act (1999) • the Use of Official Languages Act (2012). Broadly, this legislation mandates the department to:
• preserve, develop, protect and promote the cultural, heritage and linguistic diversity and legacy of South Africa
• lead nation building and social cohesion through societal transformation • enhance archives and records management structures and systems and promote access to information • provide leadership to the art and culture sector so as to accelerate its transformation.

2017 Estimates of National Expenditure
732
Selected performance indicators Table 37.1 Performance indicators by programme and related outcomeIndicator Programme Outcome Past Current Projections
2013/14 2014/15 2015/16 2016/17 2017/18 2018/19 2019/20 Number of community conversations on social cohesion and nation building conducted per year
Institutional Governance
Outcome 14: A diverse, socially cohesive society with a common national identity
–1 45 33 33 33 33 33
Number of flagship cultural events supported per year
Arts and Culture Promotion and Development
27 22 25 27 20 20 18
Number of community arts programmes activated per year
Arts and Culture Promotion and Development
–2 9 100 150 200 200 200
Number of language practice bursaries awarded per year
Arts and Culture Promotion and Development
280 284 463 320 320 300 300
Number of artists placed in schools per year
Arts and Culture Promotion and Development
Outcome 1: Quality basic education
200 240 352 340 340 380 420
Number of bursaries in heritage studies awarded per year
Heritage Promotion and Preservation
Outcome 14: A diverse, socially cohesive society with a common national identity
50 73 71 65 65 65 65
Number of flagpoles and flags installed at schools per year
Heritage Promotion and Preservation
2 192 14 415 3 532 500 500 1 000 1 000
Number of community libraries built per year
Heritage Promotion and Preservation
16 17 44 23 26 29 32
Number of community libraries upgraded per year
Heritage Promotion and Preservation
40 20 35 55 40 45 50
Percentage of schools that have booklets and posters (frames) of national symbols and orders per year
Heritage Promotion and Preservation
–2 22.3% (5 359/24 000)
27.2%(6 535/24 000)
25% (6 000/ 24 000)
26.8% (6 430/ 24 000)
–3 –3
1. No target was set, therefore no conversations were held. 2. These are new indicators to give effect to outcome 14 of government’s 2014-2019 medium term strategic framework. 3. Indicator discontinued from 2018/19.
Expenditure analysis The National Development Plan (NDP) emphasises the need for transforming society and uniting the country. These long-term objectives guide the department’s strategic plan and activities over the medium term, as do outcome 1 (quality basic education), outcome 4 (decent employment through inclusive growth) and outcome 14 (a diverse, socially cohesive society with a common national identity) of government’s 2014-2019 medium-term strategic framework. Over the medium term, the department will focus on developing arts, culture and heritage infrastructure; positioning the cultural and creative industries as drivers of economic growth and job creation; and contributing to social cohesion and nation building.
Developing arts, culture and heritage infrastructure The department’s infrastructure development initiatives in the Institutional Governance programme, the Arts and Culture Promotion and Development programme and the Heritage Promotion and Preservation programme aim to establish and maintain world-class heritage sites to boost tourism and create job opportunities. Plans to provide financial support to 74 infrastructure projects at various stages of completion are estimated to cost R1.5 billion over the MTEF period, after Cabinet-approved reductions of R108.4 million due to persistent underspending.
Construction of the liberation heritage route, which will consist of a series of sites that express the key aspects of the South African liberation experience, will be prioritised over the MTEF period. The department intends to focus on developing three key sites per province. Construction on these sites, including a Liberation Movements Museum, is set to begin in 2018/19 at a projected cost of R136 million over the medium term. An additional R100 000 over the medium term has been budgeted in the Heritage Promotion and Preservation programme for the National Heroes’ Acre, with more than 500 bronze statues of those who helped create a free South Africa. An advisory panel has been appointed to oversee a national architectural competition for the design of the acre by 2019/20. Spending on infrastructure in these programmes is to redress South Africa’s historical imbalances in the heritage sector and contribute to social transformation.
The community library services grant was established to support the building of community and dual purpose libraries to provide access to knowledge and information to improve the socioeconomic status of communities; and contribute to improved school performance, especially in areas where schools do not have libraries. Through this grant, the department plans to build 87 new libraries and upgrade 135 existing libraries, at an estimated cost of R4.5 billion over the medium term. The department will also prioritise the provision of 63 service points for dual purpose libraries, which serve both the general community and its surrounding schools, to enhance learning outcomes at schools. Slow spending on the community library services grant by some

Vote 37: Arts and Culture
733
provinces has led to the department reprioritising R71.2 million over the MTEF period to alleviate operational funding pressures at the Pan South African Language Board and museums in KwaZulu-Natal.
Positioning the cultural and creative industries as drivers of economic development An amount of R918.1 million has been earmarked in the Arts and Culture Promotion and Development programme for the implementation of the Mzansi golden economy strategy over the medium term. The primary objective of the strategy is to provide skills development and sustainable job creation opportunities for South African artists. The budget includes an estimated R364 million for 58 flagship festivals as well as large and small cultural events taking place across the country. Over the medium term, the department will provide support to fashion, animation, theatre, dance, craft, music and live events. The department also aims to support 120 touring ventures and 60 public art programmes over the period. Through the Mzansi golden economy strategy, the department aims to create an estimated 25 500 part-time jobs over the medium term.
An amount of R80 million from flagship cultural events has been reprioritised over the MTEF period to create a venture capital fund. The fund aims to support the development of small, medium and micro enterprises, and sustainable arts and culture projects administered by previously disadvantaged South Africans. A further R90 million in the Arts and Culture Promotion and Development programme is budgeted for interventions, such as incubators and master classes, over the MTEF period. Over the next three years, R17.5 million is earmarked in the National Language Services subprogramme to target 920 students for the language bursary programme. These initiatives aim to provide skills training, create jobs, and empower artists to participate in the economy.
Contributing to social cohesion and nation building Over the medium term, the department plans to host 99 community conversations to provide a platform for individuals and organisations to discuss their differences and form a common understanding of what it means to be South African. An estimated R12.3 million will be spent over the period in the Institutional Governance programme for this purpose. In addition, the department plans to host a national social cohesion summit in 2017/18 to gauge progress made in achieving the resolutions of the 2012 summit. The planned summit will provide an opportunity for government, business, labour, youth formations, media, and civil society organisations to sign a compact on working together to address social issues such as racism and xenophobia. An amount of R8 million in 2017/18 has been budgeted for the summit.
The Young Patriots programme has been established to prioritise youth development. The programme aims to encourage young people to participate actively in building the capacity of the arts, culture and heritage sectors, and to gain meaningful skills through service delivery improvement initiatives, moral regeneration initiatives and youth social cohesion advocates programmes. The department will also support moral regeneration initiatives that aim to promote social cohesion and nation building. An amount of R22.7 million is allocated towards these initiatives in the Social Cohesion and Nation Building subprogramme.
Expenditure trends Table 37.2 Vote expenditure trends by programme and economic classification Programmes 1. Administration 2. Institutional Governance 3. Arts and Culture Promotion and Development 4. Heritage Promotion and Preservation Programme
Ann
ual b
udge
t
Adj
uste
d
appr
opria
tion
Aud
ited
ou
tcom
e
Ann
ual b
udge
t
Adj
uste
d
appr
opria
tion
Aud
ited
ou
tcom
e
Ann
ual b
udge
t
Adj
uste
d
appr
opria
tion
Aud
ited
ou
tcom
e
Ann
ual b
udge
t
Adj
uste
d
appr
opria
tion
Rev
ised
es
timat
e
Aver
age:
Ou
tcom
e/Ann
ual
budg
et
(%)
Aver
age:
Ou
tcom
e/Adj
uste
d ap
prop
riatio
n (%
)
R million 2013/14 2014/15 2015/16 2016/17 2013/14 - 2016/17 Programme 1 214.5 214.1 242.7 228.3 234.4 253.2 244.0 242.4 253.9 283.5 264.9 267.2 104.8% 106.4%Programme 2 216.7 256.9 296.2 240.1 100.0 283.2 424.1 397.6 231.7 360.7 321.5 299.0 89.4% 103.2%Programme 3 1 025.6 898.1 888.4 1 032.9 1 031.5 995.0 1 076.2 1 076.2 973.0 1 094.7 1 068.3 1 056.3 92.5% 96.0%Programme 4 1 460.9 1 548.6 1 379.2 2 026.5 2 158.8 1 962.9 2 175.6 2 109.9 2 303.7 2 332.0 2 407.9 2 403.3 100.7% 97.9%Total 2 917.8 2 917.8 2 806.5 3 527.7 3 524.7 3 494.3 3 919.9 3 826.0 3 762.4 4 070.9 4 062.6 4 025.7 97.6% 98.3%Change to 2016 Budget estimate
(8.3)
2017 Estimates of National Expenditure
734
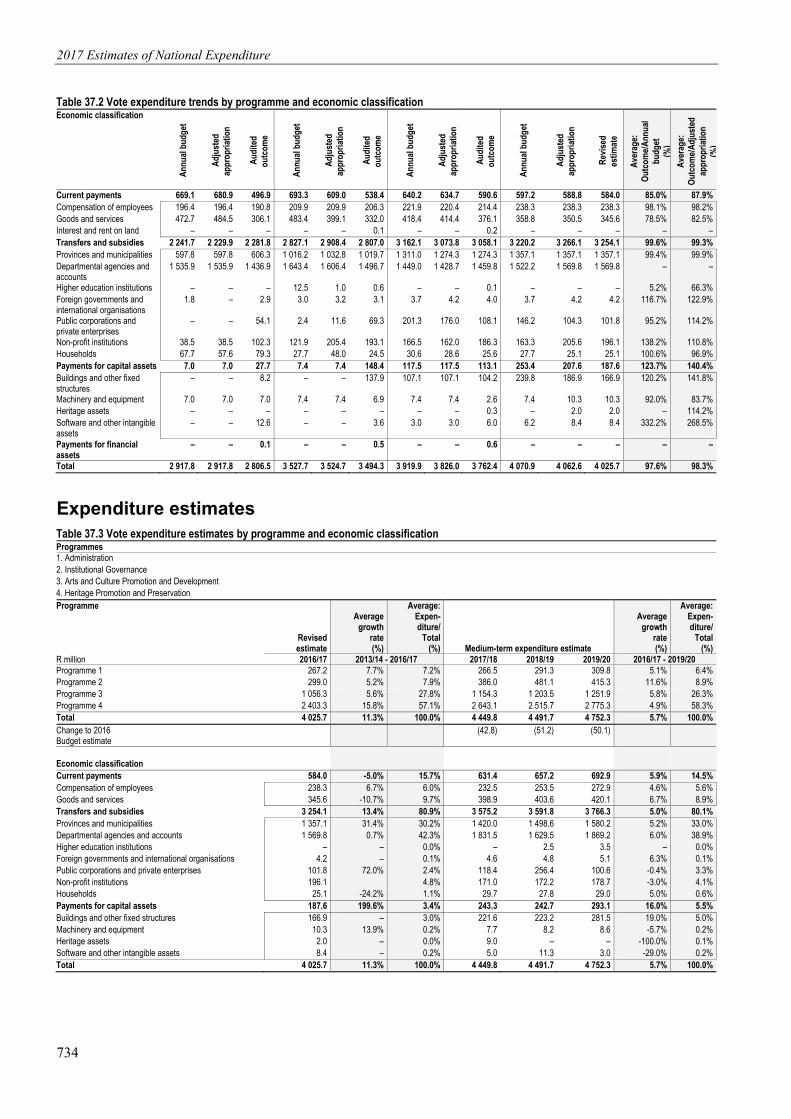
Table 37.2 Vote expenditure trends by programme and economic classification Economic classification
Ann
ual b
udge
t
Adj
uste
d
appr
opria
tion
Aud
ited
ou
tcom
e
Ann
ual b
udge
t
Adj
uste
d
appr
opria
tion
Aud
ited
ou
tcom
e
Ann
ual b
udge
t
Adj
uste
d
appr
opria
tion
Aud
ited
ou
tcom
e
Ann
ual b
udge
t
Adj
uste
d
appr
opria
tion
Rev
ised
es
timat
e
Aver
age:
Ou
tcom
e/Ann
ual
budg
et
(%)
Aver
age:
Ou
tcom
e/Adj
uste
d ap
prop
riatio
n (%
)
Current payments 669.1 680.9 496.9 693.3 609.0 538.4 640.2 634.7 590.6 597.2 588.8 584.0 85.0% 87.9%Compensation of employees 196.4 196.4 190.8 209.9 209.9 206.3 221.9 220.4 214.4 238.3 238.3 238.3 98.1% 98.2%Goods and services 472.7 484.5 306.1 483.4 399.1 332.0 418.4 414.4 376.1 358.8 350.5 345.6 78.5% 82.5%Interest and rent on land – – – – – 0.1 – – 0.2 – – – – –Transfers and subsidies 2 241.7 2 229.9 2 281.8 2 827.1 2 908.4 2 807.0 3 162.1 3 073.8 3 058.1 3 220.2 3 266.1 3 254.1 99.6% 99.3%Provinces and municipalities 597.8 597.8 606.3 1 016.2 1 032.8 1 019.7 1 311.0 1 274.3 1 274.3 1 357.1 1 357.1 1 357.1 99.4% 99.9%Departmental agencies and accounts
1 535.9 1 535.9 1 436.9 1 643.4 1 606.4 1 496.7 1 449.0 1 428.7 1 459.8 1 522.2 1 569.8 1 569.8 – –
Higher education institutions – – – 12.5 1.0 0.6 – – 0.1 – – – 5.2% 66.3%Foreign governments and international organisations
1.8 – 2.9 3.0 3.2 3.1 3.7 4.2 4.0 3.7 4.2 4.2 116.7% 122.9%
Public corporations and private enterprises
– – 54.1 2.4 11.6 69.3 201.3 176.0 108.1 146.2 104.3 101.8 95.2% 114.2%
Non-profit institutions 38.5 38.5 102.3 121.9 205.4 193.1 166.5 162.0 186.3 163.3 205.6 196.1 138.2% 110.8%Households 67.7 57.6 79.3 27.7 48.0 24.5 30.6 28.6 25.6 27.7 25.1 25.1 100.6% 96.9%Payments for capital assets 7.0 7.0 27.7 7.4 7.4 148.4 117.5 117.5 113.1 253.4 207.6 187.6 123.7% 140.4%Buildings and other fixed structures
– – 8.2 – – 137.9 107.1 107.1 104.2 239.8 186.9 166.9 120.2% 141.8%
Machinery and equipment 7.0 7.0 7.0 7.4 7.4 6.9 7.4 7.4 2.6 7.4 10.3 10.3 92.0% 83.7%Heritage assets – – – – – – – – 0.3 – 2.0 2.0 – 114.2%Software and other intangible assets
– – 12.6 – – 3.6 3.0 3.0 6.0 6.2 8.4 8.4 332.2% 268.5%
Payments for financial assets
– – 0.1 – – 0.5 – – 0.6 – – – – –
Total 2 917.8 2 917.8 2 806.5 3 527.7 3 524.7 3 494.3 3 919.9 3 826.0 3 762.4 4 070.9 4 062.6 4 025.7 97.6% 98.3%
Expenditure estimates Table 37.3 Vote expenditure estimates by programme and economic classificationProgrammes 1. Administration 2. Institutional Governance 3. Arts and Culture Promotion and Development 4. Heritage Promotion and Preservation Programme
Revised estimate
Averagegrowth
rate(%)
Average:Expen-diture/
Total(%) Medium-term expenditure estimate
Averagegrowth
rate(%)
Average:Expen-diture/
Total(%)
R million 2016/17 2013/14 - 2016/17 2017/18 2018/19 2019/20 2016/17 - 2019/20 Programme 1 267.2 7.7% 7.2% 266.5 291.3 309.8 5.1% 6.4%Programme 2 299.0 5.2% 7.9% 386.0 481.1 415.3 11.6% 8.9%Programme 3 1 056.3 5.6% 27.8% 1 154.3 1 203.5 1 251.9 5.8% 26.3%Programme 4 2 403.3 15.8% 57.1% 2 643.1 2 515.7 2 775.3 4.9% 58.3%Total 4 025.7 11.3% 100.0% 4 449.8 4 491.7 4 752.3 5.7% 100.0%Change to 2016 Budget estimate
(42.8) (51.2) (50.1)
Economic classification Current payments 584.0 -5.0% 15.7% 631.4 657.2 692.9 5.9% 14.5%Compensation of employees 238.3 6.7% 6.0% 232.5 253.5 272.9 4.6% 5.6%Goods and services 345.6 -10.7% 9.7% 398.9 403.6 420.1 6.7% 8.9%Transfers and subsidies 3 254.1 13.4% 80.9% 3 575.2 3 591.8 3 766.3 5.0% 80.1%Provinces and municipalities 1 357.1 31.4% 30.2% 1 420.0 1 498.6 1 580.2 5.2% 33.0%Departmental agencies and accounts 1 569.8 0.7% 42.3% 1 831.5 1 629.5 1 869.2 6.0% 38.9%Higher education institutions – – 0.0% – 2.5 3.5 – 0.0%Foreign governments and international organisations 4.2 – 0.1% 4.6 4.8 5.1 6.3% 0.1%Public corporations and private enterprises 101.8 72.0% 2.4% 118.4 256.4 100.6 -0.4% 3.3%Non-profit institutions 196.1 4.8% 171.0 172.2 178.7 -3.0% 4.1%Households 25.1 -24.2% 1.1% 29.7 27.8 29.0 5.0% 0.6%Payments for capital assets 187.6 199.6% 3.4% 243.3 242.7 293.1 16.0% 5.5%Buildings and other fixed structures 166.9 – 3.0% 221.6 223.2 281.5 19.0% 5.0%Machinery and equipment 10.3 13.9% 0.2% 7.7 8.2 8.6 -5.7% 0.2%Heritage assets 2.0 – 0.0% 9.0 – – -100.0% 0.1%Software and other intangible assets 8.4 – 0.2% 5.0 11.3 3.0 -29.0% 0.2%Total 4 025.7 11.3% 100.0% 4 449.8 4 491.7 4 752.3 5.7% 100.0%

Vote 37: Arts and Culture
735
Goods and services expenditure trends and estimates Table 37.4 Vote goods and services expenditure trends and estimates
Audited outcome Adjusted
appropriation
Averagegrowth
rate(%)
Average: Expen-diture/
Total(%)
Medium-term expenditure estimate
Averagegrowth
rate(%)
Average:Expen-diture/
Total(%)
R thousand 2013/14 2014/15 2015/16 2016/17 2013/14 - 2016/17 2017/18 2018/19 2019/20 2016/17 - 2019/20 Administrative fees 4 919 4 614 8 169 1 456 -33.4% 1.4% 2 171 2 345 2 517 20.0% 0.5%Advertising 4 301 14 385 7 807 3 556 -6.1% 2.2% 12 621 13 078 13 505 56.0% 2.7%Minor assets 132 212 204 730 76.8% 0.1% 319 350 375 -19.9% 0.1%Audit costs: External 4 776 8 223 12 442 7 028 13.7% 2.4% 9 266 9 971 10 727 15.1% 2.4%Bursaries: Employees 482 699 519 737 15.2% 0.2% 774 824 870 5.7% 0.2%Catering: Departmental activities 2 961 3 695 4 399 2 741 -2.5% 1.0% 3 811 4 013 4 318 16.4% 0.9%Communication 9 318 9 260 8 864 8 216 -4.1% 2.6% 8 828 9 436 9 972 6.7% 2.3%Computer services 5 979 12 567 11 428 14 510 34.4% 3.3% 11 457 12 122 12 804 -4.1% 3.2%Consultants: Business and advisory services
5 166 4 452 12 820 16 717 47.9% 2.9% 28 001 24 594 25 518 15.1% 6.0%
Legal services 569 – – 4 424 98.1% 0.4% 4 956 5 150 5 236 5.8% 1.3%Science and technological services 1 294 4 882 2 969 6 180 68.4% 1.1% 7 342 4 628 3 900 -14.2% 1.4%Contractors 40 771 81 392 89 269 80 307 25.4% 21.4% 83 367 67 822 72 357 -3.4% 19.3%Agency and support/outsourced services
105 190 51 925 20 930 15 094 -47.6% 14.2% 24 379 21 600 23 480 15.9% 5.4%
Entertainment 332 121 148 112 -30.4% 0.1% 264 276 289 37.2% 0.1%Fleet services (including government motor transport)
5 820 2 765 2 326 1 347 -38.6% 0.9% 2 793 2 859 2 925 29.5% 0.6%
Inventory: Fuel, oil and gas 25 – – – -100.0% – – – – – – Inventory: Other supplies – 46 118 12 194 4 492 – 4.6% – – – -100.0% 0.3%Consumable supplies 9 867 1 582 737 1 152 -51.1% 1.0% 7 321 7 565 7 882 89.8% 1.5%Consumables: Stationery, printing and office supplies
623 1 314 1 108 2 559 60.2% 0.4% 3 270 3 509 3 722 13.3% 0.8%
Operating leases 9 710 14 992 66 711 67 671 91.0% 11.7% 90 950 106 664 112 571 18.5% 24.0%Rental and hiring 629 44 53 9 000 142.8% 0.7% 100 120 130 -75.6% 0.6%Property payments 8 407 11 271 40 087 18 046 29.0% 5.7% 27 042 33 615 30 221 18.8% 6.9%Travel and subsistence 73 908 46 856 63 682 67 617 -2.9% 18.5% 58 674 61 289 64 076 -1.8% 16.0%Training and development 2 021 3 304 1 576 2 942 13.3% 0.7% 2 452 2 594 2 739 -2.4% 0.7%Operating payments 3 622 4 465 4 638 6 257 20.0% 1.4% 4 700 4 776 5 257 -5.6% 1.3%Venues and facilities 5 313 2 853 2 987 7 592 12.6% 1.4% 4 047 4 433 4 664 -15.0% 1.3%Total 306 135 331 991 376 067 350 483 4.6% 100.0% 398 905 403 633 420 055 6.2% 100.0%
Transfers and subsidies expenditure trends and estimates Table 37.5 Vote transfers and subsidies trends and estimates
Audited outcome Adjusted
appropriation
Averagegrowth
rate(%)
Average: Expen-diture/
Total(%)
Medium-term expenditure estimate
Averagegrowth
rate(%)
Average: Expen-diture/
Total(%)
R thousand 2013/14 2014/15 2015/16 2016/17 2013/14 - 2016/17 2017/18 2018/19 2019/20 2016/17 - 2019/20 Provinces and municipalities Provincial revenue funds Current 389 739 670 424 854 907 647 989 18.5% 22.5% 423 074 440 838 454 012 -11.2% 13.8%Community library services grant 389 739 670 424 854 907 647 989 18.5% 22.5% 423 074 440 838 454 012 -11.2% 13.8%Capital 205 047 345 786 419 407 709 143 51.2% 14.7% 996 886 1 057 777 1 126 198 16.7% 27.4%Community library services grant 205 047 345 786 419 407 709 143 51.2% 14.7% 996 886 1 057 777 1 126 198 16.7% 27.4%Provinces and municipalities Provincial agencies and funds Current 11 500 3 501 3 – -100.0% 0.1% – – – – – Vehicle licences – 1 3 – – – – – – – – Various Institutions: Mzansi golden economy (cultural events)
11 500 3 500 – – -100.0% 0.1% – – – – –
Provinces and municipalities Municipal agencies and funds Current – 2 – – – – – – – – – Vehicle licences – 2 – – – – – – – – – Departmental agencies and accounts Departmental agencies (non-business entities) Current 1 108 355 1 220 381 1 274 745 1 303 586 5.6% 43.0% 1 600 243 1 492 567 1 582 538 6.7% 42.1%Gifts and donations 144 – – – -100.0% – – – – – – Office accommodation 62 411 63 805 – – -100.0% 1.1% – – – – – Communication licences – 7 7 – – – – – – – – Public Sector Education and Training Authority – 632 – – – – – – – – – National Youth Development Agency – – – 6 200 – 0.1% 12 000 – – -100.0% 0.1%Pan South African Language Board 95 680 83 497 90 905 93 514 -0.8% 3.2% 108 634 116 355 125 203 10.2% 3.1%Artscape 47 821 50 755 53 090 55 904 5.3% 1.8% 58 699 62 107 65 585 5.5% 1.7%The Market Theatre 26 196 27 810 39 089 42 419 17.4% 1.2% 44 540 47 123 49 762 5.5% 1.3%National Arts Council 87 554 91 865 97 589 101 182 4.9% 3.3% 106 241 112 403 118 698 5.5% 3.1%

2017 Estimates of National Expenditure
736
Table 37.5 Vote transfers and subsidies trends and estimates
Audited outcome Adjusted
appropriation
Averagegrowth
rate(%)
Average: Expen-diture/
Total(%)
Medium-term expenditure estimate
Averagegrowth
rate(%)
Average: Expen-diture/
Total(%)
R thousand 2013/14 2014/15 2015/16 2016/17 2013/14 - 2016/17 2017/18 2018/19 2019/20 2016/17 - 2019/20 Performing Arts Centre of the Free State 35 487 37 690 39 424 41 513 5.4% 1.4% 47 589 46 117 48 700 5.5% 1.3%The Playhouse Company 40 570 43 085 48 632 41 165 0.5% 1.5% 49 838 52 729 55 682 10.6% 1.4%The South African State Theatre 42 393 45 028 47 099 49 595 5.4% 1.6% 52 075 55 095 58 180 5.5% 1.5%Windybrow Theatre 10 082 10 703 28 195 – -100.0% 0.4% – – – – – National Film and Video Foundation 105 223 147 588 116 721 122 907 5.3% 4.3% 129 052 136 537 144 183 5.5% 3.8%Mzansi golden economy: Art bank resources – 3 000 – 3 000 – 0.1% 6 000 7 500 10 000 49.4% 0.2%Mzansi golden economy: Public art 1 030 500 – – -100.0% – – – – – – Various institutions: Mzansi golden economy (cultural events)
– 5 500 3 900 4 500 – 0.1% 13 500 15 500 18 264 59.5% 0.4%
Various institutions: Mzansi golden economy (touring ventures)
– 3 733 – – – – – – – – –
Various institutions: Mzansi golden economy (artists in schools)
– 1 000 900 1 300 – – 1 300 2 600 2 746 28.3% 0.1%
Various institutions: Mzansi golden economy (export market development and promotion)
– – – 7 000 – 0.1% – – – -100.0% –
Various institutions: Mzansi golden economy (entrepreneur and local content development)
– – 9 700 20 000 – 0.3% 30 000 50 000 52 800 38.2% 1.1%
Performing arts institutions: Mzansi golden economy (incubators entrepreneur and local content development)
– – – 10 510 – 0.1% 8 000 9 000 9 504 -3.3% 0.3%
Die Afrikaanse Taalmuseum en Monument 4 963 5 308 6 521 7 413 14.3% 0.2% 8 711 8 156 8 616 5.1% 0.2%Freedom Park: Pretoria 66 372 70 470 71 158 65 548 -0.4% 2.4% 96 613 86 352 91 193 11.6% 2.4%Iziko Museums: Cape Town 61 515 65 331 80 768 78 773 8.6% 2.5% 95 644 86 380 91 230 5.0% 2.5%Luthuli Museum: Stanger 7 465 8 890 9 477 10 027 10.3% 0.3% 14 113 13 869 14 647 13.5% 0.4%KwaZulu-Natal Museum: Pietermaritzburg 16 359 17 376 21 663 23 152 12.3% 0.7% 36 686 34 038 35 955 15.8% 0.9%National Heritage Council 53 588 55 917 58 475 61 574 4.7% 2.0% 64 653 68 403 72 234 5.5% 1.9%National Museum: Bloemfontein 38 415 41 085 47 566 49 070 8.5% 1.5% 100 378 53 300 56 290 4.7% 1.8%Nelson Mandela Museum: Mthatha 18 900 20 124 21 612 25 029 9.8% 0.8% 26 779 26 745 28 247 4.1% 0.8%Robben Island Museum: Cape Town 61 586 66 805 95 662 72 054 5.4% 2.6% 89 438 80 872 85 403 5.8% 2.3%South African Heritage Resources Agency 43 666 46 417 48 552 56 125 8.7% 1.7% 57 861 56 985 60 176 2.4% 1.6%The National English Literary Museum: Grahamstown
8 148 8 657 9 545 15 585 24.1% 0.4% 12 155 10 745 11 347 -10.0% 0.4%
Voortrekker Museum: Pietermaritzburg 11 236 11 935 13 190 14 000 7.6% 0.4% 17 297 17 250 18 230 9.2% 0.5%War Museum of the Boer Republics: Bloemfontein
8 022 8 613 9 907 10 555 9.6% 0.3% 22 084 11 726 12 384 5.5% 0.4%
William Humphreys Art Gallery: Kimberley 5 613 5 960 7 546 8 151 13.2% 0.2% 9 967 9 487 10 022 7.1% 0.3%Ditsong Museums of South Africa: Pretoria 62 450 66 350 77 880 81 745 9.4% 2.5% 125 777 85 462 90 256 3.4% 2.7%National Library of South Africa 69 838 84 077 102 231 105 338 14.7% 3.2% 135 398 109 395 115 526 3.1% 3.3%South African Library for the Blind 15 626 16 612 17 741 18 738 6.2% 0.6% 19 221 20 336 21 475 4.6% 0.6%Radio and television licences 2 2 – – -100.0% – – – – – – Human languages technologies projects – 4 254 – – – – – – – – – Capital 328 576 276 326 185 064 266 229 -6.8% 9.3% 231 251 136 951 286 619 2.5% 6.5%Heritage legacy projects 151 596 43 103 – – -100.0% 1.7% – – – – – Gauteng Tourism Authority – – – 200 – – – – – -100.0% – Artscape: Capital works projects 45 650 – – 14 750 -31.4% 0.5% 30 000 15 000 1 000 -59.2% 0.4%The South African State Theatre: Capital works projects
9 774 20 052 – 7 300 -9.3% 0.3% 5 000 4 000 41 060 77.8% 0.4%
The Playhouse Company: Capital works projects 2 000 24 400 – 10 762 75.2% 0.3% 4 770 1 900 18 500 19.8% 0.3%Performing Arts Centre of the Free State: Capital works projects
4 362 5 000 – 30 000 90.2% 0.3% 21 000 10 500 1 000 -67.8% 0.4%
The Market Theatre: Capital works projects 22 464 15 000 – 12 001 -18.9% 0.4% 22 000 20 000 20 000 18.6% 0.5%National Film and Video Foundation: Capital works projects
– – – – – – 15 000 15 000 10 000 – 0.3%
Provincial Departmental Agencies – – – 570 – – – – – -100.0% – National Heritage Council – – – 21 150 – 0.2% – – – -100.0% 0.1%Iziko Museums: Cape Town (capital works projects)
26 371 51 690 40 206 62 046 33.0% 1.6% 68 537 – 19 939 -31.5% 1.1%
Nelson Mandela Museum: Mthatha (capital works projects)
13 718 10 230 1 303 6 750 -21.1% 0.3% 1 925 – 6 000 -3.9% 0.1%
South African Heritage Resources Agency: Capital works projects
– – 25 000 2 134 – 0.2% 2 000 – 30 000 141.3% 0.2%
KwaZulu-Natal Museum: Pietermaritzburg (capital works projects)
17 736 936 – – -100.0% 0.2% 1 000 – 33 542 – 0.2%
Luthuli Museum: Stanger (capital works projects 1 854 883 – 5 967 47.6% 0.1% 1 250 – – -100.0% 0.1%Voortrekker Museum: Pietermaritzburg (capital works projects)
5 046 1 279 11 428 – -100.0% 0.2% 1 000 – 3 250 – –
William Humphreys Art Gallery: Kimberley (capital works projects)
340 1 200 – 1 000 43.3% – 1 000 – – -100.0% –
War Museum of the Boer Republics: Bloemfontein (capital works projects)
1 803 620 1 347 1 148 -14.0% – 1 000 – 1 673 13.4% –

Vote 37: Arts and Culture
737
Table 37.5 Vote transfers and subsidies trends and estimates
Audited outcome Adjusted
appropriation
Averagegrowth
rate(%)
Average: Expen-diture/
Total(%)
Medium-term expenditure estimate
Averagegrowth
rate(%)
Average: Expen-diture/
Total(%)
R thousand 2013/14 2014/15 2015/16 2016/17 2013/14 - 2016/17 2017/18 2018/19 2019/20 2016/17 - 2019/20 Die Afrikaanse Taalmuseum en Monument: Paarl (capital works projects)
549 1 000 420 2 000 53.9% – 2 000 – 580 -33.8% –
Ditsong Museums of South Africa: Pretoria (capital works projects)
19 141 14 343 3 974 667 -67.3% 0.3% – – – -100.0% –
National Museum: Bloemfontein (capital works projects)
415 13 062 – 395 -1.6% 0.1% 2 000 – 10 000 193.6% 0.1%
The National English Literary Museum: Grahamstown (capital works projects)
3 36 514 63 218 42 673 2322.9% 1.2% 2 635 – 2 000 -63.9% 0.3%
Robben Island Museum: Cape Town (capital works projects)
5 754 17 530 27 621 26 816 67.0% 0.7% 10 454 48 000 65 000 34.3% 1.1%
Freedom Park: Pretoria (capital works projects) – 12 982 – – – 0.1% 2 000 – 10 224 – 0.1%National Library of South Africa: Capital works projects
– 4 353 10 547 16 864 – 0.3% 31 914 10 244 11 851 -11.1% 0.5%
South African Library for the Blind: Capital works projects
– 2 149 – 1 036 – – 4 766 12 307 1 000 -1.2% 0.1%
Higher education institutions Current – 570 80 – – – – 2 500 3 500 – – Mzansi golden economy: Public art – 480 – – – – – – – – – Various institutions: Mzansi golden economy (cultural events)
– – 80 – – – – – – – –
Various institutions: Mzansi golden economy (touring ventures)
– 90 – – – – – – – – –
Human languages technologies projects – – – – – – – 2 500 3 500 – – Foreign governments and international organisations Current 2 915 3 127 3 998 4 203 13.0% 0.1% 4 573 4 809 5 050 6.3% 0.1%Commonwealth Foundation 1 915 2 027 2 298 2 403 7.9% 0.1% 2 708 2 865 3 025 8.0% 0.1%African World Heritage Fund 1 000 1 100 1 700 1 800 21.6% – 1 865 1 944 2 025 4.0% 0.1%Public corporations and private enterprises Other transfers to public corporations Current – 3 409 1 505 1 290 – 0.1% 1 483 2 000 2 000 15.7% – Various institutions – 1 489 50 – – – – – – – – Various institutions: Mzansi golden economy (20 years of freedom)
– 400 – – – – – – – – –
Arts and culture industries: Entrepreneur and local content development
– 1 520 80 – – – – – – – –
Human languages technologies projects – – – – – – 1 183 2 000 2 000 – – Intsyst Labs cc – – 1 375 1 290 – – 300 – – -100.0% – Capital – – – – – – 12 000 37 410 – – 0.3%National Heritage Monument – – – – – – 12 000 17 410 – – 0.2%Polokwane Performing Arts Centre - Incubator – – – – – – – 20 000 – – 0.1%Public corporations and private enterprises Other transfers to private enterprises Current – 64 901 97 659 96 457 – 2.3% 75 000 79 686 82 000 -5.3% 2.3%Mzansi golden economy: Public art – 1 135 1 185 1 000 – – 1 000 1 000 1 056 1.8% – Various institutions: Mzansi golden economy (cultural events)
– 47 929 73 638 74 032 – 1.7% 40 000 41 000 40 572 -18.2% 1.4%
Various institutions: Mzansi golden economy (touring ventures)
– 9 381 5 490 6 000 – 0.2% 7 500 8 000 8 448 12.1% 0.2%
Various institutions: Mzansi golden economy (National Cultural Industries Skills Academy)
– – – – – – 9 000 10 000 10 560 – 0.2%
Various institutions: Mzansi golden economy (artists in schools)
– 2 200 1 800 1 300 – – 1 300 2 600 2 746 28.3% 0.1%
Various institutions: Mzansi golden economy (export market development and promotion)
– – – 2 800 – – 4 000 3 000 3 168 4.2% 0.1%
Various institutions: Mzansi golden economy (entrepreneur and local content development)
– – 9 000 5 000 – 0.1% 3 000 3 000 3 168 -14.1% 0.1%
Arts and culture industries: Local market development and promotion
– 4 256 3 528 5 200 – 0.1% 9 000 10 000 10 560 26.6% 0.2%
Human languages technologies projects – – – – – – – 1 086 1 722 – – Council for Scientific and Industrial Research – – 3 018 1 125 – – 200 – – -100.0% – Capital 54 112 1 000 8 895 6 549 -50.5% 0.6% 29 906 137 282 16 609 36.4% 1.3%Heritage legacy projects 54 112 – – – -100.0% 0.5% – – – – – National Heroes Acre – – – – – – – 100 000 – – 0.7%Capital works projects – 1 000 8 895 6 549 – 0.1% 27 906 37 282 16 609 36.4% 0.6%Afrivibe Entertainment: Incubator – – – – – – 2 000 – – – – Non-profit institutions Current 102 252 172 004 150 793 158 796 15.8% 5.1% 168 292 170 443 178 749 4.0% 4.8%Various institutions – 10 043 13 735 14 234 – 0.3% 17 241 18 372 19 609 11.3% 0.5%Gcwala-Ngamasiko Cultural Festival – 1 000 2 000 1 700 – – 2 360 2 497 2 637 15.8% 0.1%!Kauru African contemporary art touring exhibition – 2 000 – – – – – – – – – Voortrekker Monument – – 1 284 – – – – – – – – Moral Regeneration Movement – – 1 500 3 500 – – 3 500 3 500 3 500 – 0.1%

2017 Estimates of National Expenditure
738
Table 37.5 Vote transfers and subsidies trends and estimates
Audited outcome Adjusted
appropriation
Averagegrowth
rate(%)
Average: Expen-diture/
Total(%)
Medium-term expenditure estimate
Averagegrowth
rate(%)
Average: Expen-diture/
Total(%)
R thousand 2013/14 2014/15 2015/16 2016/17 2013/14 - 2016/17 2017/18 2018/19 2019/20 2016/17 - 2019/20 Business and Arts South Africa 6 898 7 312 7 648 11 053 17.0% 0.3% 8 456 8 946 9 447 -5.1% 0.3%Mzansi golden economy: Public art 6 520 6 990 1 756 3 000 -22.8% 0.2% 3 000 4 000 3 000 – 0.1%Various institutions: Mzansi golden economy (cultural events)
81 511 98 382 82 664 64 000 -7.7% 2.9% 53 200 52 400 52 610 -6.3% 1.6%
Various institutions: Mzansi golden economy (touring ventures)
640 10 097 11 313 13 500 176.3% 0.3% 11 000 11 000 13 008 -1.2% 0.3%
Various institutions: Mzansi golden economy (National Cultural Industries Skills Academy)
– – – 10 069 – 0.1% 16 599 17 300 18 269 22.0% 0.4%
Various institutions: Mzansi golden economy (artists in schools)
– 4 000 9 374 9 400 – 0.2% 12 400 12 800 13 517 12.9% 0.3%
Various institutions: Mzansi golden economy (community arts development)
– – – – – – 9 366 8 500 10 280 – 0.2%
Various institutions: Mzansi golden economy (export market development and promotion)
– – – 2 800 – – 4 000 2 500 2 640 -1.9% 0.1%
Various institutions: Mzansi golden economy (entrepreneur and local content development)
– – – 1 000 – – 1 000 1 000 1 056 1.8% –
Arts and culture industries: Local market development and promotion
– 15 247 8 228 6 937 – 0.3% 9 000 10 000 10 560 15.0% 0.3%
Arts and culture industries: Community arts development
– 3 672 – 8 000 – 0.1% 7 087 6 960 7 350 -2.8% 0.2%
Engelenburg House Art Collection: Pretoria 273 289 302 318 5.2% – 334 353 373 5.5% –Blind South Africa 6 410 6 795 7 108 7 485 5.3% 0.2% 7 859 8 315 8 781 5.5% 0.2%Library and Information Association of South Africa – 4 469 2 566 1 800 – 0.1% 1 890 2 000 2 112 5.5% 0.1%South African National Council for the Blind – – 982 – – – – – – – –African Renaissance Institute – – 333 – – – – – – – –Valoyi Traditional Authority Trust – 500 – – – – – – – – –Human languages technologies projects – 1 208 – – – – – – – – –Capital – 21 055 35 465 46 830 – 0.9% 2 739 1 750 – -100.0% 0.4%Adams College – 4 562 – 3 598 – 0.1% 489 – – -100.0% –Voortrekker Monument – 357 – 113 – – 250 1 750 – -100.0% –Liliesleaf Farm – 10 600 500 – – 0.1% – – – – –Valoyi Traditional Authority Trust – – 3 109 – – – – – – – –National Heritage Company – – 15 000 16 113 – 0.3% – – – -100.0% 0.1%The Sankofa Arts Charitable Trust – – – 3 000 – – – – – -100.0% –Steve Biko Foundation – – 996 – – – – – – – –The Trevor Huddleston CR Memorial Centre – – 900 – – – – – – – –Capital works projects – – 14 595 – – 0.1% – – – – –Kwazulu-Natal Arts and Culture Trust – – – 96 – – – – – -100.0% –Northern Cape Theatre – – – 2 000 – – – – – -100.0% –Non-profit organisations – – – 21 910 – 0.2% – – – -100.0% 0.2%Caiphus Katse Semenya Foundation: Incubator – – – – – – 2 000 – – – –Blind South Africa: Capital works projects – 1 345 365 – – – – – – – –Die Erfenisstigting – 4 191 – – – – – – – – –Households Social benefits Current 301 3 578 1 122 98 -31.2% – – – – -100.0% –Employee social benefits 301 3 578 1 122 – -100.0% – – – – – –Kenneth Arthur Bogosi Bolokwe – – – 98 – – – – – -100.0% –Households Other transfers to households Current 78 959 20 939 24 461 24 969 -31.9% 1.3% 29 704 27 798 29 019 5.1% 0.8%Employee social benefits – – 710 – – – – – – – –Arts and youth development 15 350 5 651 5 246 9 338 -15.3% 0.3% 9 806 10 375 10 956 5.5% 0.3%Visual and performing arts projects 24 805 – – – -100.0% 0.2% – – – – –Cultural industries 9 161 – – – -100.0% 0.1% – – – – –2014 African Nations Championship 7 000 – – – -100.0% 0.1% – – – – –Mzansi golden economy: Public art 830 830 225 500 -15.5% – 500 500 528 1.8% –Various institutions: Mzansi golden economy (cultural events)
– 710 2 166 1 000 – – 1 500 1 500 1 584 16.6% –
Various institutions: Mzansi golden economy (touring ventures)
– 1 214 1 397 2 000 – – 4 500 2 000 2 112 1.8% 0.1%
Various Institutions: Mzansi golden economy (export market development and promotion)
– – – – – – 1 500 1 500 1 584 – –
Arts and culture industries: Local market development and promotion
– 1 081 884 800 – – – – – -100.0% –
Heritage projects 8 458 2 550 4 974 5 331 -14.3% 0.2% 5 598 5 923 6 255 5.5% 0.2%Projects that conserve archival material 849 1 114 – – -100.0% – – – – – –Language development projects 12 506 7 789 8 859 6 000 -21.7% 0.3% 6 300 6 000 6 000 – 0.2%Total 2 281 756 2 807 003 3 058 104 3 266 139 12.7% 100.0% 3 575 151 3 591 811 3 766 294 4.9% 100.0%

Vote 37: Arts and Culture
739
Personnel information Table 37.6 Vote personnel numbers and cost by salary level and programme¹Programmes 1. Administration 2. Institutional Governance 3. Arts and Culture Promotion and Development 4. Heritage Promotion and Preservation
Number of posts estimated for
31 March 2017 Number and cost2 of personnel posts filled / planned for on funded establishment Number
Number of
funded posts
Number of posts
additional to the
establishment Actual Revised estimate Medium-term expenditure estimate
Average growth
rate(%)
Average: Salary
level/Total(%)
2015/16 2016/17 2017/18 2018/19 2019/20 2016/17 - 2019/20
Arts and Culture Number Cost Unit cost Number Cost
Unit cost Number Cost
Unit cost Number Cost
Unit cost Number Cost
Unit cost
Salary level 481 65 468 214.4 0.5 475 238.3 0.5 393 232.5 0.6 396 253.5 0.6 393 272.9 0.7 -6.1% 100.0%1 – 6 101 24 98 19.9 0.2 101 22.7 0.2 73 18.3 0.3 74 20.0 0.3 71 20.9 0.3 -11.1% 19.3%7 – 10 203 5 202 79.0 0.4 202 86.3 0.4 180 82.5 0.5 180 89.6 0.5 180 96.9 0.5 -3.8% 44.8%11 – 12 92 2 89 61.2 0.7 93 69.5 0.7 84 67.9 0.8 85 74.4 0.9 85 80.6 0.9 -3.0% 20.9%13 – 16 57 8 49 48.7 1.0 53 54.3 1.0 54 59.2 1.1 55 64.6 1.2 55 69.3 1.3 1.2% 13.1%Other 28 26 30 5.5 0.2 26 5.5 0.2 2 4.6 2.3 2 4.9 2.4 2 5.2 2.6 -57.5% 1.9%Programme 481 65 468 214.4 0.5 475 238.3 0.5 393 232.5 0.6 396 253.5 0.6 393 272.9 0.7 -6.1% 100.0%Programme 1 194 29 192 95.0 0.5 193 102.5 0.5 153 94.1 0.6 149 98.5 0.7 149 106.2 0.7 -8.3% 38.9%Programme 2 62 10 57 27.8 0.5 58 32.9 0.6 48 34.1 0.7 49 37.8 0.8 49 40.8 0.8 -5.5% 12.3%Programme 3 95 14 94 43.4 0.5 95 48.8 0.5 78 49.0 0.6 81 55.5 0.7 81 59.9 0.7 -5.2% 20.2%Programme 4 130 12 125 48.1 0.4 129 54.1 0.4 114 55.3 0.5 117 61.7 0.5 114 66.0 0.6 -4.0% 28.6%1. Data has been provided by the department and may not necessarily reconcile with official government personnel data.2. Rand million.
Departmental receipts Table 37.7 Departmental receipts by economic classification
Audited outcome Adjusted estimate
Revised estimate
Averagegrowth
rate (%)
Average: Receipt
item/Total
(%) Medium-term receipts estimate
Averagegrowth
rate (%)
Average: Receipt
item/Total
(%) R thousand 2013/14 2014/15 2015/16 2016/17 2013/14 - 2016/17 2017/18 2018/19 2019/20 2016/17 - 2019/20 Departmental receipts 544 3 301 2 970 2 342 2 342 62.7% 100.0% 1 940 2 095 2 238 -1.5% 100.0%Sales of goods and services produced by department
247 263 318 305 305 7.3% 12.4% 360 401 429 12.0% 17.4%
Sales by market establishments
16 15 15 20 20 7.7% 0.7% 15 17 19 -1.7% 0.8%
of which: Rental parking: Covered and open
16 15 15 20 20 7.7% 0.7% 15 17 19 -1.7% 0.8%
Administrative fees 4 5 5 6 6 14.5% 0.2% 6 10 10 18.6% 0.4%of which: Promotion of Access to Information Act (2005)
4 5 3 5 5 7.7% 0.2% 4 7 8 17.0% 0.3%
Duplicate certificates – – 2 1 1 – – 2 3 2 26.0% 0.1%Other sales 227 243 298 279 279 7.1% 11.4% 339 374 400 12.8% 16.2%of which: Coat of arms 106 108 151 150 150 12.3% 5.6% 200 220 240 17.0% 9.4%Photocopy and faxes 42 50 62 42 42 – 2.1% 50 60 70 18.6% 2.6%Commission on insurance and garnishee
77 78 80 80 80 1.3% 3.4% 82 85 78 -0.8% 3.8%
Departmental production 1 2 – 2 2 26.0% 0.1% – – – -100.0% – Transportation fees 1 5 5 5 5 71.0% 0.2% 7 9 12 33.9% 0.4%Sales of scrap, waste, arms and other used current goods
– – 4 – – – – 3 5 7 – 0.2%
of which: Waste paper – – 3 – – – – 1 2 3 – 0.1%Replacement of access cards – – 1 – – – – 2 3 4 – 0.1%Fines, penalties and forfeits 1 4 – – – -100.0% 0.1% – – – – – Interest, dividends and rent on land
17 12 8 11 11 -13.5% 0.5% 7 9 12 2.9% 0.5%
Interest 17 12 8 11 11 -13.5% 0.5% 7 9 12 2.9% 0.5%Sales of capital assets – 25 125 – – – 1.6% – – – – – Transactions in financial assets and liabilities
279 2 997 2 515 2 026 2 026 93.6% 85.4% 1 570 1 680 1 790 -4.0% 82.0%
Total 544 3 301 2 970 2 342 2 342 62.7% 100.0% 1 940 2 095 2 238 -1.5% 100.0%

2017 Estimates of National Expenditure
740
Programme 1: Administration Programme purpose Provide strategic leadership, management and support services to the department.
Expenditure trends and estimates Table 37.8 Administration expenditure trends and estimates by subprogramme and economic classificationSubprogramme
Audited outcome Adjusted
appropriation
Averagegrowth
rate(%)
Average: Expen-diture/
Total(%)
Medium-term expenditure estimate
Averagegrowth
rate(%)
Average:Expen-diture/
Total(%)
R million 2013/14 2014/15 2015/16 2016/17 2013/14 - 2016/17 2017/18 2018/19 2019/20 2016/17 - 2019/20 Ministry 3.8 4.2 4.2 4.3 4.2% 1.6% 4.6 4.9 5.2 5.9% 1.7%Management 68.9 53.6 61.0 50.5 -9.8% 23.1% 46.9 46.8 48.3 -1.5% 17.0%Corporate Services 74.6 87.9 85.1 95.4 8.5% 33.8% 82.0 88.1 94.9 -0.2% 31.8%Office of the CFO 21.6 27.5 30.8 29.2 10.6% 10.8% 27.2 29.2 32.4 3.5% 10.4%Office Accommodation 73.6 79.9 72.8 85.4 5.1% 30.7% 105.8 122.3 129.1 14.7% 39.1%Total 242.7 253.2 253.9 264.9 3.0% 100.0% 266.5 291.3 309.8 5.3% 100.0%Change to 2016 Budget estimate
(16.2) (35.2) (43.6) (46.1)
Economic classification Current payments 171.6 176.7 246.6 253.4 13.9% 83.6% 258.8 283.2 301.1 5.9% 96.8%Compensation of employees 80.5 89.5 95.0 102.8 8.5% 36.2% 94.1 98.5 106.2 1.1% 35.4%Goods and services1 91.1 87.2 151.4 150.6 18.2% 47.3% 164.7 184.7 195.0 9.0% 61.4%of which: Audit costs: External 4.8 8.1 9.8 6.9 13.2% 2.9% 7.7 8.2 8.7 7.7% 2.8%Communication 5.1 5.0 5.0 4.1 -7.1% 1.9% 4.9 5.2 5.5 10.7% 1.7%Computer services 4.7 8.4 11.1 14.5 45.9% 3.8% 6.5 6.9 7.3 -20.6% 3.1%Operating leases 9.6 14.6 65.8 66.5 90.8% 15.4% 88.3 103.9 109.6 18.2% 32.5%Property payments 5.8 11.3 18.0 18.0 45.9% 5.2% 26.9 28.5 30.1 18.6% 9.1%Travel and subsistence 27.5 16.9 23.7 15.3 -17.8% 8.2% 9.9 10.4 11.0 -10.3% 4.1%Interest and rent on land – 0.1 0.1 – – – – – – – – Transfers and subsidies1 62.8 67.6 1.1 – -100.0% 12.9% – – – – – Departmental agencies and accounts
62.5 64.4 0.0 – -100.0% 12.5% – – – – –
Households 0.3 3.1 1.1 – -100.0% 0.4% – – – – – Payments for capital assets 8.3 8.6 6.0 11.6 11.8% 3.4% 7.7 8.2 8.6 -9.4% 3.2%Machinery and equipment 7.0 4.9 2.5 10.3 13.9% 2.4% 7.7 8.2 8.6 -5.7% 3.1%Software and other intangible assets
1.3 3.6 3.6 1.3 -0.6% 1.0% – – – -100.0% 0.1%
Payments for financial assets 0.0 0.3 0.3 – -100.0% 0.1% – – – – – Total 242.7 253.2 253.9 264.9 3.0% 100.0% 266.5 291.3 309.8 5.3% 100.0%Proportion of total programme expenditure to vote expenditure
8.6% 7.2% 6.7% 6.5% – – 6.0% 6.5% 6.5% – –
Details of selected transfers and subsidies Departmental agencies and accounts
Departmental agencies (non-business entities)
Current 62.4 63.8 – – -100.0% 12.4% – – – – – Office accommodation 62.4 63.8 – – -100.0% 12.4% – – – – – 1. Estimates of National Expenditure data tables are available and can be downloaded from www.treasury.gov.za. These data tables contain detailed information by goods and services, and
transfers and subsidies item by programme.
Programme 2: Institutional Governance Programme purpose Coordinate and manage all cross-cutting functions of the department and its public entities. Provide support and oversight to these public entities.
Objectives • Develop a coherent policy and legislative environment for the arts, culture and heritage sector to ensure that
the sector achieves its developmental objectives by: - hosting a joint sector-wide strategic planning session annually - signing annual shareholder compacts with all the department’s public entities

Vote 37: Arts and Culture
741
- hosting 12 governance forums between the department and its public entities annually. • Lead, coordinate and implement social cohesion and nation building programmes together with stakeholders
and society through: - recruiting 300 youth volunteers as Young Patriots in 2017/18 - supporting 20 public platforms advocating social cohesion per year - hosting 33 community conversations annually.
• Build relationships and partnerships locally and internationally through the development of a positive image of South Africa’s rich arts, culture and heritage infrastructure sector by: - supporting 12 international programmes over the medium term - supporting 4 projects based in Africa annually.
• Develop, preserve, protect and promote heritage through the coordination and management of arts, culture and heritage infrastructure by supporting 12 arts, culture and heritage infrastructure projects by March 2018.
Subprogrammes • International Cooperation assists in building continental and international relations for the promotion and
development of South African arts, culture and heritage. • Social Cohesion and Nation Building is responsible for the implementation of the national social cohesion
strategy and the mainstreaming of arts, culture and heritage in targeted groups, which includes implementing arts and culture in schools. It is also responsible for the coordination of outcome 14 (a diverse, socially cohesive society with a common national identity) of government’s 2014-2019 medium-term strategic framework.
• Coordination, Monitoring, Evaluation and Good Governance provides sector-wide planning, monitoring and evaluation, and coordinates the institutional development and governance of arts and culture public entities.
• Capital Works funds and administers capital allocations for the construction and maintenance of heritage infrastructure, new commemorative structures under national legacy projects, and grants for maintenance and other capital projects annually.
Expenditure trends and estimates Table 37.9 Institutional Governance expenditure trends and estimates by subprogramme and economic classification Subprogramme
Audited outcome Adjusted
appropriation
Averagegrowth
rate(%)
Average: Expen-diture/
Total(%)
Medium-term expenditure estimate
Averagegrowth
rate(%)
Average:Expen-diture/
Total(%)
R million 2013/14 2014/15 2015/16 2016/17 2013/14 - 2016/17 2017/18 2018/19 2019/20 2016/17 - 2019/20 International Cooperation 37.4 33.5 31.3 35.7 -1.5% 12.2% 37.3 40.8 43.1 6.5% 9.8%Social Cohesion and Nation Building 35.3 38.7 33.4 45.7 9.0% 13.5% 62.3 53.5 56.7 7.4% 13.6%Coordination, Monitoring, Evaluation and Good Governance
9.7 9.4 13.9 20.3 28.1% 4.7% 38.1 33.2 31.0 15.1% 7.6%
Capital Works 213.9 201.6 153.2 219.7 0.9% 69.6% 248.3 353.7 284.5 9.0% 69.0%Total 296.2 283.2 231.7 321.5 2.8% 100.0% 386.0 481.1 415.3 8.9% 100.0%Change to 2016 Budget estimate
(42.9) (55.9) (41.9) (137.8)
Economic classification Current payments 65.1 63.6 84.1 78.7 6.5% 25.7% 93.4 93.4 94.9 6.4% 22.5%Compensation of employees 23.5 26.7 27.8 32.1 10.9% 9.7% 34.1 37.8 40.8 8.3% 9.0%Goods and services1 41.6 36.9 56.3 46.6 3.9% 16.0% 59.3 55.6 54.1 5.1% 13.4%of which: Catering: Departmental activities 0.9 0.6 0.9 1.2 9.5% 0.3% 1.6 1.7 1.9 14.8% 0.4%Communication 1.4 1.6 1.4 1.4 -0.3% 0.5% 1.7 1.9 2.0 13.3% 0.4%Contractors 9.7 10.3 6.4 9.6 -0.6% 3.2% 23.3 10.2 11.0 4.9% 3.4%Agency and support/outsourced services
10.7 8.2 5.7 7.5 -10.9% 2.8% 7.0 9.3 10.5 11.5% 2.1%
Property payments – – 21.1 – – 1.9% – 5.0 – – 0.3%Travel and subsistence 13.3 10.0 11.6 18.9 12.3% 4.7% 19.4 20.5 21.3 4.1% 5.0%

2017 Estimates of National Expenditure
742
Table 37.9 Institutional Governance expenditure trends and estimates by subprogramme and economic classification
Audited outcome Adjusted
appropriation
Averagegrowth
rate(%)
Average: Expen-diture/
Total(%)
Medium-term expenditure estimate
Averagegrowth
rate(%)
Average:Expen-diture/
Total(%)
R million 2013/14 2014/15 2015/16 2016/17 2013/14 - 2016/17 2017/18 2018/19 2019/20 2016/17 - 2019/20 Transfers and subsidies1 223.0 79.8 43.0 50.3 -39.1% 35.0% 57.0 153.2 36.0 -10.6% 18.5%Departmental agencies and accounts
151.6 43.1 – 0.2 -89.0% 17.2% 12.0 – – -100.0% 0.8%
Foreign governments and international organisations
1.9 2.0 2.3 2.4 7.9% 0.8% 2.7 2.9 3.0 8.0% 0.7%
Public corporations and private enterprises
54.1 1.5 0.1 – -100.0% 4.9% 12.0 117.4 – – 8.1%
Non-profit institutions – 27.6 35.2 38.3 – 8.9% 20.5 22.6 22.0 -16.9% 6.4%Households 15.4 5.7 5.5 9.4 -15.0% 3.2% 9.8 10.4 11.0 5.1% 2.5%Payments for capital assets 8.2 139.8 104.5 192.5 186.8% 39.3% 235.6 234.5 284.5 13.9% 59.0%Buildings and other fixed structures 8.2 137.8 104.2 186.9 184.0% 38.6% 221.6 223.2 281.5 14.6% 56.9%Machinery and equipment – 2.0 0.0 – – 0.2% – – – – – Heritage assets – – 0.3 2.0 – 0.2% 9.0 – – -100.0% 0.7%Software and other intangible assets
– – – 3.6 – 0.3% 5.0 11.3 3.0 -5.9% 1.4%
Payments for financial assets – 0.0 0.1 – – – – – – – – Total 296.2 283.2 231.7 321.5 2.8% 100.0% 386.0 481.1 415.3 8.9% 100.0%Proportion of total programme expenditure to vote expenditure
10.6% 8.1% 6.2% 7.9% – – 8.7% 10.7% 8.7% – –
Details of selected transfers and subsidies Departmental agencies and accounts
Departmental agencies (non-business entities)
Current – – – – – – 12.0 – – – 0.7%National Youth Development Agency
– – – – – – 12.0 – – – 0.7%
Capital 151.6 43.1 – – -100.0% 17.2% – – – – – Heritage legacy projects 151.6 43.1 – – -100.0% 17.2% – – – – – Foreign governments and international organisations Current 1.9 2.0 2.3 2.4 7.9% 0.8% 2.7 2.9 3.0 8.0% 0.7%Commonwealth Foundation 1.9 2.0 2.3 2.4 7.9% 0.8% 2.7 2.9 3.0 8.0% 0.7%Non-profit institutions Current – 12.4 14.6 15.4 – 3.8% 19.8 20.8 22.0 12.5% 4.9%Various institutions – 9.4 9.9 10.2 – 2.6% 13.9 14.8 15.8 15.7% 3.4%Gcwala-Ngamasiko Cultural Festival
– 1.0 2.0 1.7 – 0.4% 2.4 2.5 2.6 15.8% 0.6%
!Kauru African contemporary art touring exhibition
– 2.0 – – – 0.2% – – – – –
Voortrekker Monument – – 1.3 – – 0.1% – – – – – Moral Regeneration Movement – – 1.5 3.5 – 0.4% 3.5 3.5 3.5 – 0.9%Capital – 15.2 18.6 22.8 – 5.0% 0.7 1.8 – -100.0% 1.6%Adams College – 4.6 – 3.6 – 0.7% 0.5 – – -100.0% 0.3%Voortrekker Monument – – – 0.1 – – 0.3 1.8 – -100.0% 0.1%Liliesleaf Farm – 10.6 0.5 – – 1.0% – – – – – Valoyi Traditional Authority Trust – – 3.1 – – 0.3% – – – – – National Heritage Company – – 15.0 16.1 – 2.7% – – – -100.0% 1.0%The Sankofa Arts Charitable Trust – – – 3.0 – 0.3% – – – -100.0% 0.2%Households Other transfers to households Current 15.4 5.7 5.2 9.3 -15.3% 3.1% 9.8 10.4 11.0 5.5% 2.5%Arts and youth development 15.4 5.7 5.2 9.3 -15.3% 3.1% 9.8 10.4 11.0 5.5% 2.5%Public corporations and private enterprises Public corporations Other transfers to public corporations Capital – – – – – – 12.0 17.4 – – 1.8%National Heritage Monument – – – – – – 12.0 17.4 – – 1.8%Public corporations and private enterprises Private enterprises Other transfers to private enterprises Capital 54.1 – – – -100.0% 4.8% – 100.0 – – 6.2%Heritage legacy projects 54.1 – – – -100.0% 4.8% – – – – – National Heroes Acre – – – – – – – 100.0 – – 6.2%1. Estimates of National Expenditure data tables are available and can be downloaded from www.treasury.gov.za. These data tables contain detailed information by goods and services, and
transfers and subsidies item by programme.

Vote 37: Arts and Culture
743
Programme 3: Arts and Culture Promotion and Development
Programme purpose Promote and develop arts, culture and languages.
Objectives
• Develop, protect and promote the cultural and creative sector through interventions and initiatives that stimulate local content creation and attract large audiences by: - supporting 20 flagship cultural events, such as the Cape Town International Jazz Festival, National Arts
Festival and Macufe Mangaung African Cultural Festival by March 2018 - implementing 20 public art development programmes per year.
• Lead, coordinate and implement social cohesion programmes aimed at creating an integrated and inclusive society that contributes to economic growth by: - providing support to 200 community arts programmes or projects annually - supporting the refurbishment of 15 community arts centres annually - placing 340 artists in schools by March 2018.
• Build human resource capacity and promote excellence in the sector by: - providing 320 bursaries towards the development of qualified language practitioners by March 2018 - providing support to 14 incubators annually.
• Build relationships and partnerships locally and internationally to develop, preserve and promote arts and culture by: - supporting 40 key touring venture programmes per year - financially supporting 22 market access platforms over the medium term.
• Promote South African languages through the provision of access to information by translating and/or editing 100 per cent of documents, such as letters, pamphlets and posters received and accepted per year.
Subprogrammes • National Language Services promotes the use and equal status of all official languages. This entails the
development of language terminologies and human language technology, translation and publishing services in all official languages and the awarding of bursaries.
• Pan South African Language Board transfers funds to the Pan South African Language Board, which creates an environment that is conducive to developing, using and promoting all official languages, as well as the Khoi, Nama and San languages and South African sign language.
• Cultural and Creative Industries Development implements the majority of projects for the Mzansi golden economy strategy and supports the creative industries by developing strategies, implementing sector development programmes, supporting projects and providing training.
• Performing Arts Institutions transfers funds to performing arts institutions, which provide a platform for the artistic and cultural expression of artists and those interested in performing arts.
• National Film and Video Foundation transfers funds to the National Film and Video Foundation in support of skills, local content, and local marketing development in South Africa’s film and video industry.
• National Arts Council transfers funds to the National Arts Council, which develops and financially supports various disciplines of arts and culture, in accordance with the National Arts Council Act (1997).
• Capital Works of Performing Arts Institutions funds and administers capital grants to playhouses for maintenance and other capital projects.

2017 Estimates of National Expenditure
744
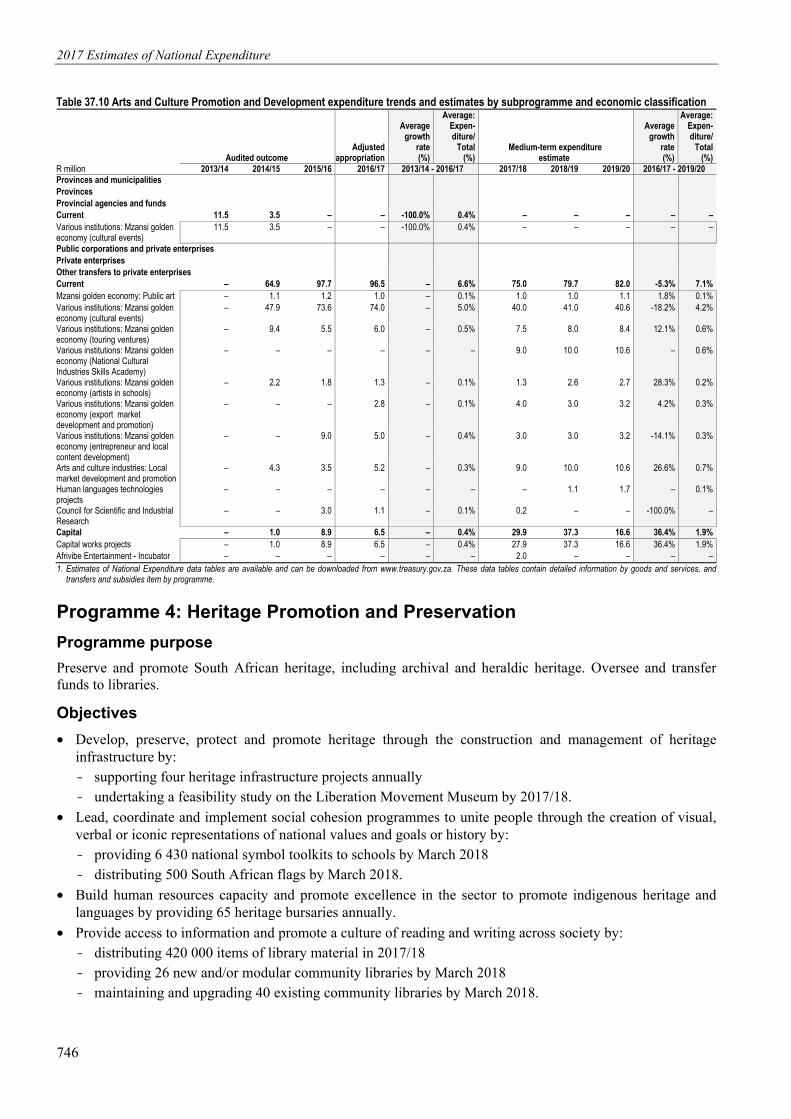
Expenditure trends and estimates Table 37.10 Arts and Culture Promotion and Development expenditure trends and estimates by subprogramme and economic classificationSubprogramme
Audited outcome Adjusted
appropriation
Averagegrowth
rate(%)
Average: Expen-diture/
Total(%)
Medium-term expenditure estimate
Averagegrowth
rate(%)
Average:Expen-diture/
Total(%)
R million 2013/14 2014/15 2015/16 2016/17 2013/14 - 2016/17 2017/18 2018/19 2019/20 2016/17 - 2019/20 National Language Services 38.9 43.5 43.0 49.9 8.7% 4.5% 50.9 54.1 57.8 5.0% 4.5%Pan South African Language Board 95.7 83.5 90.9 93.5 -0.8% 9.3% 108.6 116.4 125.2 10.2% 9.5%Cultural and Creative Industries Development
267.3 340.7 338.2 353.1 9.7% 33.1% 368.6 388.3 410.5 5.2% 32.5%
Performing Arts Institutions 293.7 286.8 263.2 316.5 2.5% 29.6% 344.0 323.5 368.9 5.2% 28.9%National Film and Video Foundation 105.2 147.6 116.7 122.9 5.3% 12.5% 129.1 136.5 144.2 5.5% 11.4%National Arts Council 87.6 91.9 97.6 101.2 4.9% 9.6% 106.2 112.4 118.7 5.5% 9.4%Capital Works of Performing Arts Institutions
– 1.0 23.5 31.1 – 1.4% 46.9 72.3 26.6 -5.1% 3.8%
Total 888.4 995.0 973.0 1 068.3 6.3% 100.0% 1 154.3 1 203.5 1 251.9 5.4% 100.0%Change to 2016 Budget estimate
(26.4) 13.8 12.7 (6.5)
Economic classification
Current payments 141.6 144.0 140.3 130.0 -2.8% 14.2% 143.3 135.6 143.4 3.3% 11.8%Compensation of employees 39.6 41.4 43.4 48.7 7.2% 4.4% 49.0 55.5 59.9 7.1% 4.6%Goods and services1 102.0 102.6 96.9 81.3 -7.3% 9.8% 94.3 80.1 83.5 0.9% 7.3%of which: Advertising 0.4 11.7 1.9 1.4 59.1% 0.4% 7.7 7.8 8.0 77.5% 0.5%Consultants: Business and advisory services
2.6 2.9 10.4 9.5 55.0% 0.6% 19.8 15.9 16.2 19.5% 1.3%
Science and technological services 0.2 2.2 1.8 6.2 232.6% 0.3% 7.3 4.6 3.9 -14.2% 0.5%Contractors 9.0 41.9 57.3 33.0 54.0% 3.6% 26.5 24.0 26.2 -7.4% 2.3%Agency and support/outsourced services
70.9 29.2 6.0 4.5 -60.1% 2.8% 13.4 7.8 8.3 22.7% 0.7%
Travel and subsistence 15.2 9.2 12.2 17.5 4.8% 1.4% 13.4 13.4 13.9 -7.5% 1.2%Transfers and subsidies1 737.7 850.9 832.6 938.3 8.3% 85.6% 1 011.0 1 067.8 1 108.5 5.7% 88.2%Provinces and municipalities 11.5 3.5 – – -100.0% 0.4% – – – – – Departmental agencies and accounts 576.4 620.5 575.2 669.9 5.1% 62.2% 753.2 779.5 850.9 8.3% 65.3%Higher education institutions – 0.6 0.1 – – – – 2.5 3.5 – 0.1%Public corporations and private enterprises
– 67.8 108.0 104.3 – 7.1% 106.4 139.0 100.6 -1.2% 9.6%
Non-profit institutions 95.6 146.9 135.6 153.8 17.2% 13.6% 137.1 135.4 141.7 -2.7% 12.1%Households 54.3 11.7 13.7 10.3 -42.5% 2.3% 14.3 11.5 11.8 4.7% 1.0%Payments for capital assets 9.1 0.1 0.1 – -100.0% 0.2% – – – – – Buildings and other fixed structures – 0.1 – – – – – – – – – Machinery and equipment – – 0.1 – – – – – – – – Software and other intangible assets 9.1 – – – -100.0% 0.2% – – – – – Total 888.4 995.0 973.0 1 068.3 6.3% 100.0% 1 154.3 1 203.5 1 251.9 5.4% 100.0%Proportion of total programme expenditure to vote expenditure
31.7% 28.5% 25.9% 26.3% – – 25.9% 26.8% 26.3% – –
Details of selected transfers and subsidies Departmental agencies and accounts
Departmental agencies (non-business entities)
Current 492.0 556.0 575.2 594.5 6.5% 56.5% 655.5 713.1 759.3 8.5% 58.2%Pan South African Language Board
95.7 83.5 90.9 93.5 -0.8% 9.3% 108.6 116.4 125.2 10.2% 9.5%
Artscape 47.8 50.8 53.1 55.9 5.3% 5.3% 58.7 62.1 65.6 5.5% 5.2%The Market Theatre 26.2 27.8 39.1 42.4 17.4% 3.5% 44.5 47.1 49.8 5.5% 3.9%National Arts Council 87.6 91.9 97.6 101.2 4.9% 9.6% 106.2 112.4 118.7 5.5% 9.4%Performing Arts Centre of the Free State
35.5 37.7 39.4 41.5 5.4% 3.9% 47.6 46.1 48.7 5.5% 3.9%
The Playhouse Company 40.6 43.1 48.6 41.2 0.5% 4.4% 49.8 52.7 55.7 10.6% 4.3%The South African State Theatre 42.4 45.0 47.1 49.6 5.4% 4.7% 52.1 55.1 58.2 5.5% 4.6%Windybrow Theatre 10.1 10.7 28.2 – -100.0% 1.2% – – – – – National Film and Video Foundation
105.2 147.6 116.7 122.9 5.3% 12.5% 129.1 136.5 144.2 5.5% 11.4%
Mzansi golden economy: Art bank resources
– 3.0 – 3.0 – 0.2% 6.0 7.5 10.0 49.4% 0.6%
Mzansi golden economy: Public art 1.0 0.5 – – -100.0% – – – – – – Various institutions: Mzansi golden economy (cultural events)
– 5.5 3.9 4.5 – 0.4% 13.5 15.5 18.3 59.5% 1.1%
Various institutions: Mzansi golden economy (touring ventures)
– 3.7 – – – 0.1% – – – – –
Various institutions: Mzansi golden economy (artists in schools )
– 1.0 0.9 1.3 – 0.1% 1.3 2.6 2.7 28.3% 0.2%

Vote 37: Arts and Culture
745
Table 37.10 Arts and Culture Promotion and Development expenditure trends and estimates by subprogramme and economic classificationSubprogramme
Audited outcome Adjusted
appropriation
Averagegrowth
rate(%)
Average: Expen-diture/
Total(%)
Medium-term expenditure estimate
Averagegrowth
rate(%)
Average:Expen-diture/
Total(%)
R million 2013/14 2014/15 2015/16 2016/17 2013/14 - 2016/17 2017/18 2018/19 2019/20 2016/17 - 2019/20 Various institutions: Mzansi golden economy: (export market development and promotion)
– – – 7.0 – 0.2% – – – -100.0% 0.1%
Various institutions: Mzansi golden economy (entrepreneur and local content development)
– – 9.7 20.0 – 0.8% 30.0 50.0 52.8 38.2% 3.3%
Performing arts institutions: Mzansi golden economy (incubators entrepreneur and local content development)
– – – 10.5 – 0.3% 8.0 9.0 9.5 -3.3% 0.8%
Human languages technologies projects – 4.3 – – – 0.1% – – – – – Capital 84.3 64.5 – 75.4 -3.6% 5.7% 97.8 66.4 91.6 6.7% 7.1%Artscape: Capital works projects 45.7 – – 14.8 -31.4% 1.5% 30.0 15.0 1.0 -59.2% 1.3%The South African State Theatre: Capital works projects
9.8 20.1 – 7.3 -9.3% 0.9% 5.0 4.0 41.1 77.8% 1.2%
The Playhouse Company: Capital works projects
2.0 24.4 – 10.8 75.2% 0.9% 4.8 1.9 18.5 19.8% 0.8%
Performing Arts Centre of the Free State: Capital works projects
4.4 5.0 – 30.0 90.2% 1.0% 21.0 10.5 1.0 -67.8% 1.3%
The Market Theatre: Capital works projects 22.5 15.0 – 12.0 -18.9% 1.3% 22.0 20.0 20.0 18.6% 1.6%National Film and Video Foundation: Capital works projects
– – – – – – 15.0 15.0 10.0 – 0.9%
Provincial departmental agencies – – – 0.6 – – – – – -100.0% – Non-profit institutions Current 95.6 146.9 121.0 129.8 10.7% 12.6% 135.1 135.4 141.7 3.0% 11.6%Business and Arts South Africa 6.9 7.3 7.6 11.1 17.0% 0.8% 8.5 8.9 9.4 -5.1% 0.8%Mzansi golden economy: Public art 6.5 7.0 1.8 3.0 -22.8% 0.5% 3.0 4.0 3.0 – 0.3%Various institutions: Mzansi golden economy (cultural events)
81.5 98.4 82.7 64.0 -7.7% 8.3% 53.2 52.4 52.6 -6.3% 4.8%
Various institutions: Mzansi golden economy (touring ventures)
0.6 10.1 11.3 13.5 176.3% 0.9% 11.0 11.0 13.0 -1.2% 1.0%
Various institutions: Mzansi golden economy (National Cultural Industries Skills Academy)
– – – 10.1 – 0.3% 16.6 17.3 18.3 22.0% 1.3%
Various institutions: Mzansi golden economy (artists in schools)
– 4.0 9.4 9.4 – 0.6% 12.4 12.8 13.5 12.9% 1.0%
Various institutions: Mzansi golden economy (community arts development)
– – – – – – 9.4 8.5 10.3 – 0.6%
Various institutions: Mzansi golden economy (export market development and promotion)
– – – 2.8 – 0.1% 4.0 2.5 2.6 -1.9% 0.3%
Various institutions: Mzansi golden economy (entrepreneur and local content development)
– – – 1.0 – – 1.0 1.0 1.1 1.8% 0.1%
Arts and culture industries: Local market development and promotion
– 15.2 8.2 6.9 – 0.8% 9.0 10.0 10.6 15.0% 0.8%
Arts and culture industries: Community arts development
– 3.7 – 8.0 – 0.3% 7.1 7.0 7.4 -2.8% 0.6%
Human languages technologies projects – 1.2 – – – – – – – – – Capital – – 14.6 23.9 – 1.0% 2.0 – – -100.0% 0.6%Capital works projects – – 14.6 – – 0.4% – – – – – Northern Cape Theatre – – – 2.0 – 0.1% – – – -100.0% – Non-profit organisations – – – 21.9 – 0.6% – – – -100.0% 0.5%Caiphus Katse Semenya Foundation: Incubator
– – – – – – 2.0 – – – –
Households Other transfers to households Current 54.3 11.6 13.5 10.3 -42.5% 2.3% 14.3 11.5 11.8 4.7% 1.0%Visual and performing arts projects 24.8 – – – -100.0% 0.6% – – – – – Cultural industries 9.2 – – – -100.0% 0.2% – – – – – 2014 African Nations Championship 7.0 – – – -100.0% 0.2% – – – – – Mzansi golden economy: Public art 0.8 0.8 0.2 0.5 -15.5% 0.1% 0.5 0.5 0.5 1.8% – Various institutions: Mzansi golden economy (cultural events)
– 0.7 2.2 1.0 – 0.1% 1.5 1.5 1.6 16.6% 0.1%
Various institutions: Mzansi golden economy (touring ventures)
– 1.2 1.4 2.0 – 0.1% 4.5 2.0 2.1 1.8% 0.2%
Various institutions: Mzansi golden economy (export market development and promotion)
– – – – – – 1.5 1.5 1.6 – 0.1%
Arts and culture industries: Local market development and promotion
– 1.1 0.9 0.8 – 0.1% – – – -100.0% –
Language development projects 12.5 7.8 8.9 6.0 -21.7% 0.9% 6.3 6.0 6.0 – 0.5%Public corporations and private enterprises Public corporations Other transfers to public corporations Capital – – – – – – – 20.0 – – 0.4%Polokwane Performing Arts Centre: Incubator – – – – – – – 20.0 – – 0.4%Higher education institutions Current – – – – – – – 2.5 3.5 – 0.1%Human languages technologies projects – – – – – – – 2.5 3.5 – 0.1%
2017 Estimates of National Expenditure
746
Table 37.10 Arts and Culture Promotion and Development expenditure trends and estimates by subprogramme and economic classification
Audited outcome Adjusted
appropriation
Averagegrowth
rate(%)
Average: Expen-diture/
Total(%)
Medium-term expenditure estimate
Averagegrowth
rate(%)
Average:Expen-diture/
Total(%)
R million 2013/14 2014/15 2015/16 2016/17 2013/14 - 2016/17 2017/18 2018/19 2019/20 2016/17 - 2019/20 Provinces and municipalities Provinces Provincial agencies and funds Current 11.5 3.5 – – -100.0% 0.4% – – – – – Various institutions: Mzansi golden economy (cultural events)
11.5 3.5 – – -100.0% 0.4% – – – – –
Public corporations and private enterprises Private enterprises Other transfers to private enterprises Current – 64.9 97.7 96.5 – 6.6% 75.0 79.7 82.0 -5.3% 7.1%Mzansi golden economy: Public art – 1.1 1.2 1.0 – 0.1% 1.0 1.0 1.1 1.8% 0.1%Various institutions: Mzansi golden economy (cultural events)
– 47.9 73.6 74.0 – 5.0% 40.0 41.0 40.6 -18.2% 4.2%
Various institutions: Mzansi golden economy (touring ventures)
– 9.4 5.5 6.0 – 0.5% 7.5 8.0 8.4 12.1% 0.6%
Various institutions: Mzansi golden economy (National Cultural Industries Skills Academy)
– – – – – – 9.0 10.0 10.6 – 0.6%
Various institutions: Mzansi golden economy (artists in schools)
– 2.2 1.8 1.3 – 0.1% 1.3 2.6 2.7 28.3% 0.2%
Various institutions: Mzansi golden economy (export market development and promotion)
– – – 2.8 – 0.1% 4.0 3.0 3.2 4.2% 0.3%
Various institutions: Mzansi golden economy (entrepreneur and local content development)
– – 9.0 5.0 – 0.4% 3.0 3.0 3.2 -14.1% 0.3%
Arts and culture industries: Local market development and promotion
– 4.3 3.5 5.2 – 0.3% 9.0 10.0 10.6 26.6% 0.7%
Human languages technologies projects
– – – – – – – 1.1 1.7 – 0.1%
Council for Scientific and Industrial Research
– – 3.0 1.1 – 0.1% 0.2 – – -100.0% –
Capital – 1.0 8.9 6.5 – 0.4% 29.9 37.3 16.6 36.4% 1.9%Capital works projects – 1.0 8.9 6.5 – 0.4% 27.9 37.3 16.6 36.4% 1.9%Afrivibe Entertainment - Incubator – – – – – – 2.0 – – – – 1. Estimates of National Expenditure data tables are available and can be downloaded from www.treasury.gov.za. These data tables contain detailed information by goods and services, and
transfers and subsidies item by programme.
Programme 4: Heritage Promotion and Preservation Programme purpose Preserve and promote South African heritage, including archival and heraldic heritage. Oversee and transfer funds to libraries.
Objectives • Develop, preserve, protect and promote heritage through the construction and management of heritage
infrastructure by: - supporting four heritage infrastructure projects annually - undertaking a feasibility study on the Liberation Movement Museum by 2017/18.
• Lead, coordinate and implement social cohesion programmes to unite people through the creation of visual, verbal or iconic representations of national values and goals or history by: - providing 6 430 national symbol toolkits to schools by March 2018 - distributing 500 South African flags by March 2018.
• Build human resources capacity and promote excellence in the sector to promote indigenous heritage and languages by providing 65 heritage bursaries annually.
• Provide access to information and promote a culture of reading and writing across society by: - distributing 420 000 items of library material in 2017/18 - providing 26 new and/or modular community libraries by March 2018 - maintaining and upgrading 40 existing community libraries by March 2018.
Vote 37: Arts and Culture
747
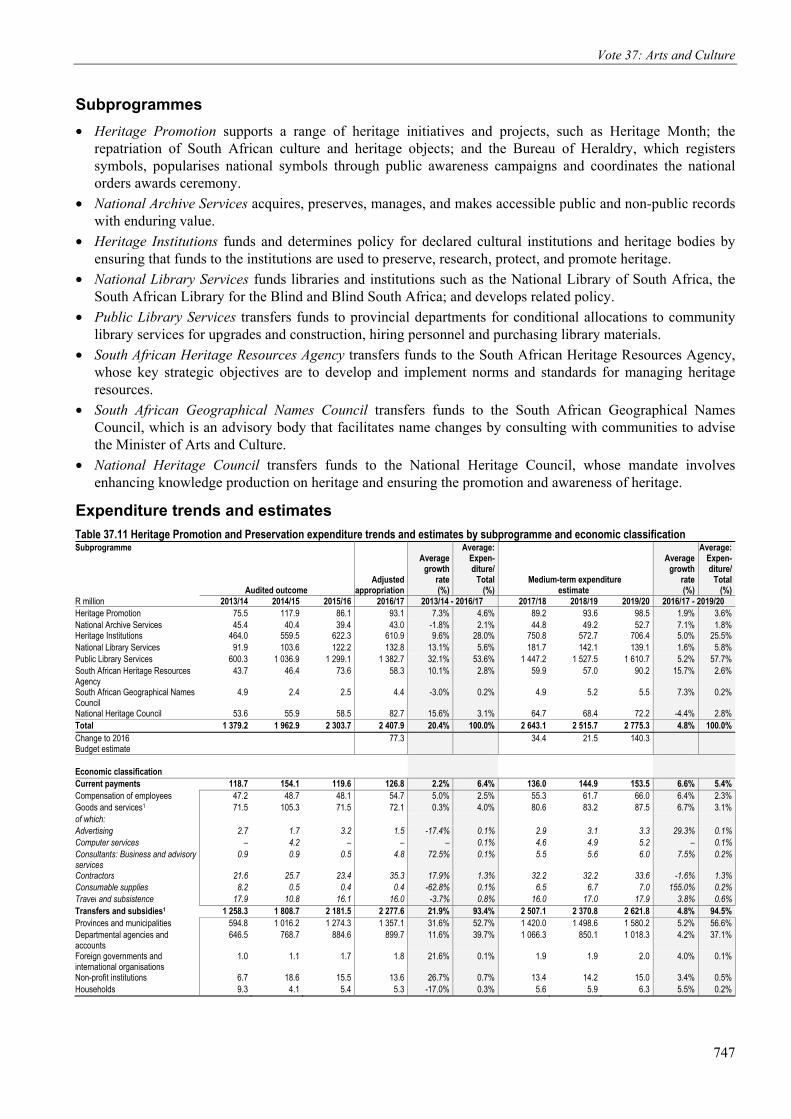
Subprogrammes • Heritage Promotion supports a range of heritage initiatives and projects, such as Heritage Month; the
repatriation of South African culture and heritage objects; and the Bureau of Heraldry, which registers symbols, popularises national symbols through public awareness campaigns and coordinates the national orders awards ceremony.
• National Archive Services acquires, preserves, manages, and makes accessible public and non-public records with enduring value.
• Heritage Institutions funds and determines policy for declared cultural institutions and heritage bodies by ensuring that funds to the institutions are used to preserve, research, protect, and promote heritage.
• National Library Services funds libraries and institutions such as the National Library of South Africa, the South African Library for the Blind and Blind South Africa; and develops related policy.
• Public Library Services transfers funds to provincial departments for conditional allocations to community library services for upgrades and construction, hiring personnel and purchasing library materials.
• South African Heritage Resources Agency transfers funds to the South African Heritage Resources Agency, whose key strategic objectives are to develop and implement norms and standards for managing heritage resources.
• South African Geographical Names Council transfers funds to the South African Geographical Names Council, which is an advisory body that facilitates name changes by consulting with communities to advise the Minister of Arts and Culture.
• National Heritage Council transfers funds to the National Heritage Council, whose mandate involves enhancing knowledge production on heritage and ensuring the promotion and awareness of heritage.
Expenditure trends and estimates Table 37.11 Heritage Promotion and Preservation expenditure trends and estimates by subprogramme and economic classificationSubprogramme
Audited outcome Adjusted
appropriation
Averagegrowth
rate(%)
Average: Expen-diture/
Total(%)
Medium-term expenditure estimate
Averagegrowth
rate(%)
Average:Expen-diture/
Total(%)
R million 2013/14 2014/15 2015/16 2016/17 2013/14 - 2016/17 2017/18 2018/19 2019/20 2016/17 - 2019/20 Heritage Promotion 75.5 117.9 86.1 93.1 7.3% 4.6% 89.2 93.6 98.5 1.9% 3.6%National Archive Services 45.4 40.4 39.4 43.0 -1.8% 2.1% 44.8 49.2 52.7 7.1% 1.8%Heritage Institutions 464.0 559.5 622.3 610.9 9.6% 28.0% 750.8 572.7 706.4 5.0% 25.5%National Library Services 91.9 103.6 122.2 132.8 13.1% 5.6% 181.7 142.1 139.1 1.6% 5.8%Public Library Services 600.3 1 036.9 1 299.1 1 382.7 32.1% 53.6% 1 447.2 1 527.5 1 610.7 5.2% 57.7%South African Heritage Resources Agency
43.7 46.4 73.6 58.3 10.1% 2.8% 59.9 57.0 90.2 15.7% 2.6%
South African Geographical Names Council
4.9 2.4 2.5 4.4 -3.0% 0.2% 4.9 5.2 5.5 7.3% 0.2%
National Heritage Council 53.6 55.9 58.5 82.7 15.6% 3.1% 64.7 68.4 72.2 -4.4% 2.8%Total 1 379.2 1 962.9 2 303.7 2 407.9 20.4% 100.0% 2 643.1 2 515.7 2 775.3 4.8% 100.0%Change to 2016 Budget estimate
77.3 34.4 21.5 140.3
Economic classification Current payments 118.7 154.1 119.6 126.8 2.2% 6.4% 136.0 144.9 153.5 6.6% 5.4%Compensation of employees 47.2 48.7 48.1 54.7 5.0% 2.5% 55.3 61.7 66.0 6.4% 2.3%Goods and services1 71.5 105.3 71.5 72.1 0.3% 4.0% 80.6 83.2 87.5 6.7% 3.1%of which: Advertising 2.7 1.7 3.2 1.5 -17.4% 0.1% 2.9 3.1 3.3 29.3% 0.1%Computer services – 4.2 – – – 0.1% 4.6 4.9 5.2 – 0.1%Consultants: Business and advisory services
0.9 0.9 0.5 4.8 72.5% 0.1% 5.5 5.6 6.0 7.5% 0.2%
Contractors 21.6 25.7 23.4 35.3 17.9% 1.3% 32.2 32.2 33.6 -1.6% 1.3%Consumable supplies 8.2 0.5 0.4 0.4 -62.8% 0.1% 6.5 6.7 7.0 155.0% 0.2%Travel and subsistence 17.9 10.8 16.1 16.0 -3.7% 0.8% 16.0 17.0 17.9 3.8% 0.6%Transfers and subsidies1 1 258.3 1 808.7 2 181.5 2 277.6 21.9% 93.4% 2 507.1 2 370.8 2 621.8 4.8% 94.5%Provinces and municipalities 594.8 1 016.2 1 274.3 1 357.1 31.6% 52.7% 1 420.0 1 498.6 1 580.2 5.2% 56.6%Departmental agencies and accounts
646.5 768.7 884.6 899.7 11.6% 39.7% 1 066.3 850.1 1 018.3 4.2% 37.1%
Foreign governments and international organisations
1.0 1.1 1.7 1.8 21.6% 0.1% 1.9 1.9 2.0 4.0% 0.1%
Non-profit institutions 6.7 18.6 15.5 13.6 26.7% 0.7% 13.4 14.2 15.0 3.4% 0.5%Households 9.3 4.1 5.4 5.3 -17.0% 0.3% 5.6 5.9 6.3 5.5% 0.2%

2017 Estimates of National Expenditure
748
Table 37.11 Arts and Culture Promotion and Development expenditure trends and estimates by subprogramme and economic classification
Audited outcome Adjusted
appropriation
Averagegrowth
rate(%)
Average: Expen-diture/
Total(%)
Medium-term expenditure estimate
Averagegrowth
rate(%)
Average:Expen-diture/
Total(%)
R million 2013/14 2014/15 2015/16 2016/17 2013/14 - 2016/17 2017/18 2018/19 2019/20 2016/17 - 2019/20 Payments for capital assets 2.2 – 2.4 3.5 17.0% 0.1% – – – -100.0% – Software and other intangible assets
2.2 – 2.4 3.5 17.0% 0.1% – – – -100.0% –
Payments for financial assets 0.0 0.1 0.2 – -100.0% – – – – – – Total 1 379.2 1 962.9 2 303.7 2 407.9 20.4% 100.0% 2 643.1 2 515.7 2 775.3 4.8% 100.0%Proportion of total programme expenditure to vote expenditure
49.1% 56.2% 61.2% 59.3% – – 59.4% 56.0% 58.4% – –
Details of selected transfers and subsidies Departmental agencies and accounts
Departmental agencies (non-business entities)
Current 553.8 599.9 699.5 709.1 8.6% 31.8% 932.8 779.5 823.2 5.1% 31.4%National Youth Development Agency
– – – 6.2 – 0.1% – – – -100.0% 0.1%
Die Afrikaanse Taalmuseum en Monument
5.0 5.3 6.5 7.4 14.3% 0.3% 8.7 8.2 8.6 5.1% 0.3%
Freedom Park: Pretoria 66.4 70.5 71.2 65.5 -0.4% 3.4% 96.6 86.4 91.2 11.6% 3.3%Iziko Museums: Cape Town 61.5 65.3 80.8 78.8 8.6% 3.6% 95.6 86.4 91.2 5.0% 3.4%Luthuli Museum: Stanger 7.5 8.9 9.5 10.0 10.3% 0.4% 14.1 13.9 14.6 13.5% 0.5%KwaZulu-Natal Museum: Pietermaritzburg
16.4 17.4 21.7 23.2 12.3% 1.0% 36.7 34.0 36.0 15.8% 1.3%
National Heritage Council 53.6 55.9 58.5 61.6 4.7% 2.9% 64.7 68.4 72.2 5.5% 2.6%National Museum: Bloemfontein 38.4 41.1 47.6 49.1 8.5% 2.2% 100.4 53.3 56.3 4.7% 2.5%Nelson Mandela Museum: Mthatha 18.9 20.1 21.6 25.0 9.8% 1.1% 26.8 26.7 28.2 4.1% 1.0%Robben Island Museum: Cape Town
61.6 66.8 95.7 72.1 5.4% 3.7% 89.4 80.9 85.4 5.8% 3.2%
South African Heritage Resources Agency
43.7 46.4 48.6 56.1 8.7% 2.4% 57.9 57.0 60.2 2.4% 2.2%
The National English Literary Museum: Grahamstown
8.1 8.7 9.5 15.6 24.1% 0.5% 12.2 10.7 11.3 -10.0% 0.5%
Voortrekker Museum: Pietermaritzburg
11.2 11.9 13.2 14.0 7.6% 0.6% 17.3 17.3 18.2 9.2% 0.6%
War Museum of the Boer Republics: Bloemfontein
8.0 8.6 9.9 10.6 9.6% 0.5% 22.1 11.7 12.4 5.5% 0.5%
William Humphreys Art Gallery: Kimberley
5.6 6.0 7.5 8.2 13.2% 0.3% 10.0 9.5 10.0 7.1% 0.4%
Ditsong Museums of South Africa: Pretoria
62.5 66.4 77.9 81.7 9.4% 3.6% 125.8 85.5 90.3 3.4% 3.7%
National Library of South Africa 69.8 84.1 102.2 105.3 14.7% 4.5% 135.4 109.4 115.5 3.1% 4.5%South African Library for the Blind 15.6 16.6 17.7 18.7 6.2% 0.9% 19.2 20.3 21.5 4.6% 0.8%Capital 92.7 168.8 185.1 190.6 27.2% 7.9% 133.5 70.6 195.1 0.8% 5.7%National Heritage Council – – – 21.2 – 0.3% – – – -100.0% 0.2%Iziko Museums: Cape Town (capital works projects)
26.4 51.7 40.2 62.0 33.0% 2.2% 68.5 – 19.9 -31.5% 1.5%
Nelson Mandela Museum: Mthatha (capital works projects)
13.7 10.2 1.3 6.8 -21.1% 0.4% 1.9 – 6.0 -3.9% 0.1%
South African Heritage Resources Agency: Capital works projects
– – 25.0 2.1 – 0.3% 2.0 – 30.0 141.3% 0.3%
KwaZulu-Natal Museum: Pietermaritzburg (capital works projects)
17.7 0.9 – – -100.0% 0.2% 1.0 – 33.5 – 0.3%
Luthuli Museum: Stanger (capital works projects)
1.9 0.9 – 6.0 47.6% 0.1% 1.3 – – -100.0% 0.1%
Voortrekker Museum: Pietermaritzburg (capital works projects)
5.0 1.3 11.4 – -100.0% 0.2% 1.0 – 3.3 – –
William Humphreys Art Gallery: Kimberley (capital works projects)
0.3 1.2 – 1.0 43.3% – 1.0 – – -100.0% –
War Museum of the Boer Republics: Bloemfontein (capital works projects)
1.8 0.6 1.3 1.1 -14.0% 0.1% 1.0 – 1.7 13.4% –
Die Afrikaanse Taalmuseum en Monument: Paarl (capital works projects)
0.5 1.0 0.4 2.0 53.9% – 2.0 – 0.6 -33.8% –
Ditsong Museums of South Africa: Pretoria (capital works projects)
19.1 14.3 4.0 0.7 -67.3% 0.5% – – – -100.0% –
National Museum: Bloemfontein (capital works projects)
0.4 13.1 – 0.4 -1.6% 0.2% 2.0 – 10.0 193.6% 0.1%
The National English Literary Museum: Grahamstown (capital works projects)
0.0 36.5 63.2 42.7 2322.9% 1.8% 2.6 – 2.0 -63.9% 0.5%
Robben Island Museum: Cape Town (capital works projects)
5.8 17.5 27.6 26.8 67.0% 1.0% 10.5 48.0 65.0 34.3% 1.5%

Vote 37: Arts and Culture
749
Table 37.11 Arts and Culture Promotion and Development expenditure trends and estimates by subprogramme and economic classification
Audited outcome Adjusted
appropriation
Averagegrowth
rate(%)
Average: Expen-diture/
Total(%)
Medium-term expenditure estimate
Averagegrowth
rate(%)
Average:Expen-diture/
Total(%)
R million 2013/14 2014/15 2015/16 2016/17 2013/14 - 2016/17 2017/18 2018/19 2019/20 2016/17 - 2019/20 Freedom Park: Pretoria (capital works projects)
– 13.0 – – – 0.2% 2.0 – 10.2 – 0.1%
National Library of South Africa: Capital works projects
– 4.4 10.5 16.9 – 0.4% 31.9 10.2 11.9 -11.1% 0.7%
South African Library for the Blind: Capital works projects
– 2.1 – 1.0 – – 4.8 12.3 1.0 -1.2% 0.2%
Non-profit institutions Current 6.7 12.2 13.8 13.6 26.7% 0.6% 13.4 14.2 15.0 3.4% 0.5%Various institutions – 0.7 3.9 4.0 – 0.1% 3.4 3.6 3.8 -1.9% 0.1%Engelenburg House Art Collection: Pretoria
0.3 0.3 0.3 0.3 5.2% – 0.3 0.4 0.4 5.5% –
Blind South Africa 6.4 6.8 7.1 7.5 5.3% 0.3% 7.9 8.3 8.8 5.5% 0.3%Library and Information Association of South Africa
– 4.5 2.6 1.8 – 0.1% 1.9 2.0 2.1 5.5% 0.1%
Capital – 5.5 0.4 – – 0.1% – – – – – Blind South Africa: Capital works projects
– 1.3 0.4 – – – – – – – –
Die Erfenisstigting – 4.2 – – – 0.1% – – – – – Households Other transfers to households Current 9.3 3.7 5.0 5.3 -17.0% 0.3% 5.6 5.9 6.3 5.5% 0.2%Heritage projects 8.5 2.6 5.0 5.3 -14.3% 0.3% 5.6 5.9 6.3 5.5% 0.2%Projects that conserve archival material
0.8 1.1 – – -100.0% – – – – – –
Provinces and municipalities Provinces Provincial revenue funds Current 389.7 670.4 854.9 648.0 18.5% 31.8% 423.1 440.8 454.0 -11.2% 19.0%Community library services grant 389.7 670.4 854.9 648.0 18.5% 31.8% 423.1 440.8 454.0 -11.2% 19.0%Capital 205.0 345.8 419.4 709.1 51.2% 20.9% 996.9 1 057.8 1 126.2 16.7% 37.6%Community library services grant 205.0 345.8 419.4 709.1 51.2% 20.9% 996.9 1 057.8 1 126.2 16.7% 37.6%1. Estimates of National Expenditure data tables are available and can be downloaded from www.treasury.gov.za. These data tables contain detailed information by goods and services, and
transfers and subsidies item by programme.
Entities Comprehensive coverage of the following public entities is provided with the more detailed information for the vote at www.treasury.gov.za under the budget information link.
• The following officially declared heritage institutions are dependent on annual transfers from the department: Die Afrikaanse Taalmuseum en –monument, Paarl; Ditsong Museums of South Africa, Pretoria; the Iziko Museums, Cape Town; the KwaZulu-Natal Museum, Pietermaritzburg; the National Museum, Bloemfontein; the National English Literary Museum, Grahamstown; the Robben Island Museum, Cape Town; the Voortrekker Museum, Pietermaritzburg; the War Museum of the Boer Republics, Bloemfontein; the William Humphreys Art Gallery, Kimberley; the Luthuli Museum, Stanger; the Nelson Mandela Museum, Mthatha; Freedom Park and the Engelenburg House art collection. The entity’s total budget for 2017/18 is R909 million, including capital works.
• The Department of Arts and Culture oversees various libraries, including the National Library of South Africa, a statutory body; the South African Library for the Blind; and Blind South Africa. The entity’s total budget for 2017/18 is R231 million, including capital works.
• The National Arts Council facilitates opportunities for people to practice and appreciate the arts. The council also promotes the general application of the arts in the community, fosters the expression of national identity by means of the arts, promotes freedom in the practice of the arts, and gives historically disadvantaged people greater access to the arts. The council’s total budget for 2017/18 is R106.2 million.
• The National Film and Video Foundation develops and promotes the film and video industry in South Africa. The foundation promotes local film and video products, supports the development of and access to the industry, and addresses historical imbalances in infrastructure, skills and resources in the industry. The foundation’s total budget for 2017/18 is R133.3 million.

2017 Estimates of National Expenditure
750
• The National Heritage Council engages heritage stakeholders in public and private institutions, including the various organs of civil society, mobilises debates and builds awareness about heritage. The council’s total budget for 2017/18 is R64.7 million.
• The Pan South African Language Board is a constitutional institution that promotes an awareness of multilingualism as a national resource and supports previously marginalised languages. It is mandated to investigate complaints about language rights and violations from any individual, organisation or institution. The board’s total budget for 2017/18 is R108.6 million.
• The following performing arts institutions receive annual transfers from the Department of Arts and Culture: The State Theatre, The Playhouse Company, Artscape Theatre, The Market Theatre and the Performing Arts Council of the Free State. In addition to the annual transfer from the department, these entities also generate their own revenue through entrance fees, donor assistance and sponsorships. Total budget for 2017/18 is R401.9 million, including capital works.
• The South African Heritage Resources Agency is the national administrative management body for the protection of South Africa’s cultural heritage. The agency’s main functions include managing the national estate through partnerships with other bodies to promote an integrated heritage resources management system. The agency’s total budget for 2017/18 is R68.8 million.

Vote 37: Arts and Culture
751
Additional table: Summary of expenditure on infrastructureProject name Service delivery
Outputs Current project stage
Totalproject cost Audited outcome
Adjustedappropriation Medium-term expenditure estimate
R million 2013/14 2014/15 2015/16 2016/17 2017/18 2018/19 2019/20 Departmental infrastructure Mega projects (total project cost of at least R1 billion over the project life cycle) Liberation heritage route Construction of heritage route Construction 1 001.7 – – – 29.2 40.8 40.2 55.0 Large projects (total project cost of at least R250 million but less than R1 billion over the project life cycle) Sarah Baartman Centre Construction of centre Construction 587.8 – 4.9 25.2 48.5 59.5 41.5 27.8 Small projects (total project cost of less than R250 million over the project life cycle) Isibhubhu Cultural Arena Construction of arena Construction 215.4 – 78.0 – 29.2 28.1 80.2 – Vlakplaas Renovation of existing monuments Construction 2.0 – – – 2.0 – – – Isandlawana Renovations of existing monuments Construction 17.0 – – – 6.0 5.0 2.0 – Nelson Mandela House Purchase of Nelson Mandela House Construction 6.0 – – – 2.0 – – – Drakenstein correctional facility Renovations of existing facility Construction 3.6 – – – – 0.5 – – Archie Gumede Place Development of monument Construction 5.9 – – – 2.9 3.0 – – Khoi and San heritage route Development of heritage route Design 15.5 – – – 3.5 2.0 7.0 – Gumtree Mill Construction of mill Construction 4.2 – – – 0.2 2.0 2.0 – Raymond Mhlaba statue Development of statue Construction 5.0 – – – 2.0 3.0 – – Delville Wood Renovations of existing monuments Construction 35.0 – – 25.0 10.0 – – – JL Dube House Upgrade of existing monument Various 134.2 – – – 6.0 10.0 8.0 6.0 OR Tambo Memorial Upgrade of existing monument Various 37.5 – – – 3.0 10.0 18.0 – Ingquza Hill Museum Upgrade of existing museum Various 156.4 – – – 7.0 7.0 12.0 7.0 Information Management System Implementation Project
Development of system Design 12.2 – – – 2.0 3.0 4.3 3.0
Isandlwana: Statue of King Cetshwayo Construction of statue Construction 3.0 – – – – 3.0 – – Winnie Mandela house and clinic Restoration and construction of existing
monument Construction 4.0 – – – – 1.0 3.0 –
Polokwane Performing Arts Centre: Incubator Construction of incubator Construction 25.0 – – – – – 20.0 – Caiphus Katse Semenya Foundation: Incubator
Construction of incubator Construction 10.0 – – 8.0 – 2.0 – –
Afrivibe Entertainment: Incubator Construction of incubator Construction 10.0 – – 8.0 – 2.0 – – Large projects (total project cost of at least R250 million but less than R1 billion over the project life cycle) The Playhouse Company Upgrade of existing building Various 295.7 2.0 24.4 9.1 10.8 4.8 1.9 18.5 Performing Arts Centre of the Free State Upgrade of existing building Various 252.0 4.4 5.0 – 30.0 21.0 10.5 1.0 Upgrading of community arts centres Upgrade of existing building Various 301.1 – – 6.0 24.0 24.4 34.3 15.0 National Heritage Monument Upgrade of existing building Various 503.9 – – 15.0 – 12.0 17.4 – Robben Island Museum Upgrade of existing building Various 561.1 5.8 17.5 27.6 26.8 10.5 48.0 65.0 National archives building: Pretoria Upgrade of existing building Various 445.6 0.1 45.0 12.8 94.0 52.9 3.1 48.8 Iziko Museums of Cape Town Upgrade of existing building Various 338.8 26.4 51.7 40.2 62.0 68.5 – 19.9 The South Africa State Theatre Upgrade of existing building Various 282.7 9.8 20.1 – 7.3 5.0 4.0 41.1 Small projects (total project cost of less than R250 million over the project life cycle) Department of Arts and Culture public entities and heritage projects
Upgrade of existing building Various 142.7 87.4 55.3 – – – – –
William Humphreys Art Gallery Upgrade of existing building Various 3.5 0.3 1.2 – 1.0 1.0 – – Die Afrikaanse Taal Museum en Monument Upgrade of existing building Various 147.8 0.6 1.0 0.4 – 2.0 – 0.6

2017 Estimates of National Expenditure
752 Additional table: Summary of expenditure on infrastructureProject name Service delivery
outputs Current project stage
Totalproject cost Audited outcome
Adjustedappropriation Medium-term expenditure estimate
R million 2013/14 2014/15 2015/16 2016/17 2017/18 2018/19 2019/20 Ditsong Museums Upgrade of existing building Various 201.2 19.1 14.3 4.0 0.7 – – – KwaZulu-Natal Museum Upgrade of existing building Various 85.9 17.3 0.9 – – 1.0 – 33.5 Luthuli Museum Upgrade of existing building Various 22.1 1.9 0.9 – 6.0 1.3 – – Voortrekker Museum Upgrade of existing building Various 22.0 5.0 1.3 11.4 – 1.0 – 3.3 National Museum: Bloemfontein Upgrade of existing building Various 114.3 0.8 13.1 – 0.4 2.0 – 10.0 National English Literary Museum Upgrade of existing building Various 153.1 0.0 36.5 63.2 42.7 2.6 – 2.0 Nelson Mandela Museum Upgrade of existing building Various 122.7 13.7 10.2 1.3 – 1.9 – 6.0 Anglo-Boer War Museum Upgrade of existing building Various 129.6 1.8 0.6 1.3 1.1 1.0 – 1.7 South African Heritage Resources Agency Upgrade of existing building Various 157.2 – – 25.0 2.1 2.0 – 30.0 National Library: Centre for the Book Upgrade of existing building Various 72.8 66.8 – – – – – – National Library: Pretoria Campus Upgrade of existing building Various 171.2 – 3.7 10.5 16.9 31.9 10.2 11.9 South African Library for the Blind Upgrade of existing building Various 89.4 19.0 2.1 – 1.0 4.8 12.3 – Artscape Upgrade of existing building Various 127.2 45.7 – – 14.8 30.0 15.0 1.0 The Market Theatre Upgrade of existing building Various 241.3 22.5 15.0 10.0 12.0 22.0 20.0 20.0 Windybrow Theatre Upgrade of existing building Various 17.0 – – 17.0 – – – – Performing Arts Projects Upgrade of existing building Various 40.1 – 1.0 – – – – – National Arts Council Upgrade of existing building Various 1.5 – – 1.5 – – – – National Film and Video Foundation Upgrade of existing building Various 45.0 – – – – 15.0 15.0 10.0 Freedom Park Upgrade of existing building Various 170.1 – – – – 2.0 – 10.2 Cultural precincts Upgrade of existing building Various 37.0 – – – – – – – Die Erfenisstigting Upgrade of existing building Various 4.2 – 4.2 – – – – – Adams College Upgrade of existing building Various 8.6 – 4.6 – 3.6 0.5 – – Voortrekker Monument Upgrade of existing building Various 3.8 – 0.4 1.3 0.1 0.3 1.8 – Blind South Africa Upgrade of existing building Various 1.7 – 1.3 0.4 – – – – Cultural precincts Upgrade of cultural precincts Various 32.5 – – – 12.5 – – – Upgrading of public spaces Upgrade of public spaces Various 17.8 – – 0.3 3.0 3.5 3.0 1.6 South African Roadies Association Construction of association building Various 15.0 – – – 5.0 – – – Bram Fischer House Upgrade of existing building Various 2.0 – – – – – – – Origins Centre Upgrade of existing building Various 3.0 – – – – – – – National Heritage Company Construction of company building Construction 16.1 – – – 16.1 – – – The Sankofa Arts Charitable Trust Construction of trust building Construction 3.0 – – – 3.0 – – – Gauteng Tourism Authority Construction of authority building Various 0.2 – – – 0.2 – – – KwaZulu-Natal Arts and Culture Trust: Incubator
Upgrade of existing building Various 1.0 – – 0.9 0.1 – – –
Northern Cape Theatre Upgrade of existing building Various 2.0 – – – 2.0 – – – Non Profit Organisations Upgrade of existing buildings Various 21.9 – – – 21.9 – – – Provincial Departmental Agencies Upgrade of existing buildings Various 0.6 – – – 0.6 – – – National Heritage Council Upgrade of existing building Various 21.2 – – – 21.2 – – – National Heroes Acre Upgrade of existing structure Various 100.0 – – – – – 100.0 – Total 7 841.6 350.3 414.2 325.4 596.2 506.7 534.6 449.8