volunteer activities survey - statistics south · pdf filestatistical release p0211.3...
TRANSCRIPT

Statistical release P0211.3
Volunteer Activities Survey
2014
Embargoed until:
10 September 2015
12:00
Enquiries: Forthcoming issue: Expected release date:
User Information Services Tel: 012 310 8600/4892/8390 2018 release March 2019

Statistics South Africa i P0211.3
Volunteer Activity Survey, 2014
Contents
List of tables .................................................................................................................................................................. ii
List of figures ................................................................................................................................................................. ii
Highlights ..................................................................................................................................................................... iii
Concepts and definitions ............................................................................................................................................. iv
1. Introduction ...................................................................................................................................................... 1
2. Purpose of the survey ...................................................................................................................................... 1
3. How was VAS conducted? ............................................................................................................................... 1
4. Data issues ...................................................................................................................................................... 2
5. Results ............................................................................................................................................................. 2
5.1 Profile of individuals who were volunteering .................................................................................................... 2
5.2 Volunteer rate ................................................................................................................................................... 4
5.3 Value of volunteer work ................................................................................................................................... 8
5.3.1 Volunteering through organisations ............................................................................................................... 10
6. Summary/Conclusion ..................................................................................................................................... 14
7. Technical notes .............................................................................................................................................. 15
7.1 Response details ............................................................................................................................................ 15
7.2 Survey requirements and design ................................................................................................................... 15
7.3 Weighting ....................................................................................................................................................... 15
7.4 Non-response adjustment .............................................................................................................................. 15

Statistics South Africa ii P0211.3
Volunteer Activity Survey, 2014
List of tables
Table 1: Distribution of volunteers by type of volunteering and number of volunteer activities, 2010 and 2014 ........ 2
Table 2: Number of volunteers and hours, 2010 and 2014 ......................................................................................... 3
Table 3: Number of volunteers and hours of volunteering by sex and type of volunteering, 2010 and 2014 ............. 3
Table 4: Reason for volunteering by employment status, 2014 .................................................................................. 8
Table 5: Number of volunteers, volunteer hours and value of volunteering by occupation, 2010 and 2014 .............. 9
Table 6: Number of volunteers, volunteer rate, volunteer hours and value of volunteering by labour market status, 2010 and 2014 ................................................................................................................................. 10
Table 7: Number of volunteers, volunteer hours and value of volunteering by industry, 2010 and 2014 ................. 11
Table 8: Number of volunteer hours and value of volunteering by type of organisation, 2010 and 2014 ................. 11
Table 9: Volunteer rate and average annual volunteer hours by volunteer characteristics for both sexes, 2010 and 2014 ............................................................................................................................................. 13
List of figures
Figure 1: Volunteer rate by sex, 2010 and 2014 ........................................................................................................ 4
Figure 2: Volunteer rate by population group and sex, 2010 and 2014 ..................................................................... 4
Figure 3: Volunteer rate by age group, 2010 and 2014 ............................................................................................. 5
Figure 4: Volunteer rate for youth and adults by labour market status, 2010 and 2014 ............................................ 5
Figure 5: Volunteer rate by marital status and sex, 2010 and 2014 .......................................................................... 5
Figure 6: Volunteer rate by education status, 2010 and 2014 ................................................................................... 6
Figure 7: Volunteer rate by province, 2010 and 2014 ................................................................................................ 6
Figure 8: Distribution of household heads who are volunteers by labour market status, 2010 and 2014 ................. 7
Figure 9: Volunteer rate of household heads by labour market status, 2010 and 2014 ............................................ 7
Figure 10: Distribution of what volunteers received/expected to receive, 2010 and 2014 .......................................... 7
Figure 11: Distribution of the reasons for volunteering by sex, 2014 ........................................................................... 8
Figure 12: Distribution of the number of volunteers and hours by type of organisation, 2014 .................................. 12

Statistics South Africa iii P0211.3
Volunteer Activity Survey, 2014
Highlights
This report is based on the results of the Volunteer Activities Survey (VAS). The VAS collects detailed information
on volunteer activities, and the survey covers three (3) of the main volunteer activities in which respondents were
involved. The volunteer activities could be conducted directly, through an organisation, or though both (direct and
organisation-based volunteering). In 2014, there were 2,2 million volunteers compared to 1,3 million in 2010,
constituting an increase of about 898 000 volunteers.
In 2014, over 90% of the volunteers performed one volunteer activity which is 2,2 percentage points higher than in
2010.
The country’s volunteer rate increased by 2,1 percentage points to 5,8% in 2014.
Women accounted for 60,7% of all volunteers in 2014. The rate of volunteering was higher among women than
among men during the reference period, with volunteer rates of 5,8% and 3,7% respectively for the year 2014.
The majority of volunteer respondents (65,4%) said they mainly volunteered directly, while the proportion of
organisation-based volunteering declined to 27,5% in the year 2014, which was a decrease of 10 percentage
points from 2010.
The volunteer rates of black Africans, coloureds and Indian/Asians population groups were lower than the national
average, while the white population group had a volunteer rate that was higher than the national average of 5,8%
in 2014, which is an indication that white persons were more likely to be involved in volunteer activities.
Among the industries, the Community and social services industry accounted for more than 90% of the
volunteering figures. The number of those who volunteered in this industry increased in 2014, but the hours
volunteered decreased.
In both 2010 and 2014, adult volunteers were more than the youth; the volunteer rate increased with age up to the
age of 45–54 years, after which it declined. In 2014, those aged 45–54 years had the highest volunteer rate at
9,1%.
Divorced/separated women (8,3%) and men (8,8%) were more likely to be involved in volunteer work, while
women who were never married (5,2%) and men who were never married (3,6%) were least likely to be involved in
volunteering activities, as shown by their volunteer rates for 2014.
Education level plays a role in volunteering activities. In 2014, respondents with a tertiary education reported
higher volunteer rates (10,6%) compared to those with lower levels of education.
Average annual hours volunteered declined from 321 000 to 277 000 in 2014, indicating that although the number
of volunteers had increased, less time was spent on volunteering activities.
Almost all the provinces reported increases in their volunteer rate, except for Western Cape and Northern Cape.
Eastern Cape reported the highest change of 4,7% in its volunteer rate.
Volunteers expected or received mainly cash (23,7%), food (19,2%) and skills (18,4%) for their volunteering
services in 2014.
Higher numbers of volunteers volunteered to help a cause in which they believe, irrespective of their employment
status. In addition, women who volunteered to help a cause in which they believe, and those who volunteered for
religious obligations recorded higher proportions compared to those of men.
In 2014, approximately 610,4 million volunteer hours contributed were equivalent to more than 293 000 full-time
jobs, and the average annual number of volunteer hours were 277 000.
The total volunteer hours were 610,4 million hours, valued at R9,8 billion. This is the total value that would have
been received by the volunteers if they had been rewarded for their volunteer work.
Statistics South Africa iv P0211.3
Volunteer Activity Survey, 2014
Concepts and definitions
Key labour market concepts
The working-age population comprises everyone aged 15–64 years who fall into each of the three
labour market components (employed, unemployed, not economically active).
A volunteer is a person aged 15 and over who did any unpaid non-compulsory work; that is, time
individuals give without pay to activities performed either through an organisation or directly for others
outside their own household in the four weeks preceding the survey interview.
Youth: In line with the national definition, youth are regarded as persons aged 15–34 years and adults
are aged 35–64 years.
The volunteer rate is a convenient expression of the extent to which the country’s population engages
in volunteer activities. It is computed by dividing the number of volunteers identified by the population
aged 15 years and older during the reference period.
In order to obtain a total value for volunteer work of both direct and organisation-based volunteering,
only median hourly earnings by occupation were considered. The median hourly earnings were
multiplied by the total hours volunteered to get the value for the reference period (four weeks prior the
interview), and this was converted to the value for 12 months.
The average number of hours is the number of hours that volunteers gave of their time in the 12
months preceding the survey. It is expressed as the total hours volunteered divided by the number of
the volunteers during the reference period.
PJ Lehohla Statistician-General

Statistics South Africa P0211.3
Volunteer Activity Survey, 2014
1
1. Introduction
Statistics South Africa conducted its second Volunteer Activities Survey (VAS) in the second quarter of 2014, after the
first one had been conducted in 2010. The survey is household-based and collected information on the volunteer
activities (a maximum of three activities) of individuals aged 15 years and older in South Africa. The respondents were
selected from the households enumerated during the Quarterly Labour Force Survey. It covers unpaid non-
compulsory work; that is, the time individuals give without pay to activities performed either through an organisation or
directly for others outside their own household in the four weeks preceding the survey interview. Defining volunteer
activities for cross-country comparisons could be challenging; very few countries measure volunteer activities, and the
methodologies used differ a great deal from one country to another.
Volunteering is crucial in that it can be a means of gaining knowledge, applying one’s skills and extending social
networks. This can lead to new or better employment opportunities as well as personal development. Furthermore,
volunteers are also motivated by a basic desire to help others, especially the more vulnerable. Volunteer work
activities deliver significant additional benefits to society and to volunteers themselves – it enhances social solidarity,
social capital and the quality of life in a society (ILO, 2011). In recognition of the value added by volunteer work, the
United Nations Statistics Division’s 2003 Handbook on Non-profit Institutions in the System of National Accounts
urges national statistical agencies to incorporate data on volunteer work into the satellite accounts of non-profit
institutions (NPIs) that countries are urged to produce (United Nations, 2003).
The report will examine the demographic profile of those who volunteered, focusing on sex, age, population group,
and marital status. It also includes an analysis of the amount of time devoted to volunteering among those who
participated in the past 4 weeks and the past 12 months of the time at the survey. Similarly, the value of volunteering
was computed for the past 4 weeks and 12 months. Lastly, the reasons underpinning the individual’s decision to
volunteer and expectations for volunteering will also be discussed.
2. Purpose of the survey
The main aim of this report is to provide information on the scale of volunteer work and bring into view the sizeable
part of the labour force that is invisible in existing labour statistics.
The specific objectives of this survey are:
• To collect reliable data about people who are involved in volunteer activities.
• To identify organisation-based and direct volunteering.
• To give a profile of those engaged in volunteer activities.
• To estimate the economic value of volunteer work.
3. How was VAS conducted?
The Volunteer Activities Survey (VAS) consisted of two stages. The first stage involved identifying individuals who
were involved in volunteer activities through the QLFS conducted in the second quarter of 2014 (Q2: 2014). The
second stage involved follow-up interviews with individuals who were involved in volunteer activities, to determine the
type of activities in which they were involved and whether the activities performed were organisation-based or direct
volunteering or both (organisation-based and direct volunteering).
In Q2: 2014, questions on volunteer activities were included in the QLFS questionnaire and were asked of all
household members aged 15 years and older. The screening process for VAS was performed to ensure that only
persons eligible for the VAS (persons who indicated that they were involved in some volunteer work during the QLFS)
were re-visited. Approximately 2 909 individuals eligible for VAS were followed up to conduct detailed interviews
about their volunteer activities during the reference period. The QLFS data were collected in the middle two weeks of
the month throughout the quarter, while VAS data collection was done in the last week of a month, throughout the
quarter.
Statistics South Africa P0211.3
Volunteer Activity Survey, 2014
2
4. Data issues
The 2010 VAS estimates that were previously published have been revised, based on new population benchmarks
from the 2011 Population Census. The VAS 2014 estimates were based on the 2013 master sample that uses
Census 2011 as a benchmark.
Caution is therefore required when interpreting the number of volunteers, as persons can be involved in more than
one activity. In certain instances, the figures do not add up to the totals.
5. Results
5.1 Profile of individuals involved in volunteer activities
This section focuses on the number of volunteers, number of volunteer activities, and their distribution by type of
organisation and sex, and the changes between 2010 and 2014. It analysis the total hours worked in the four weeks,
and 12 months in the reference period.
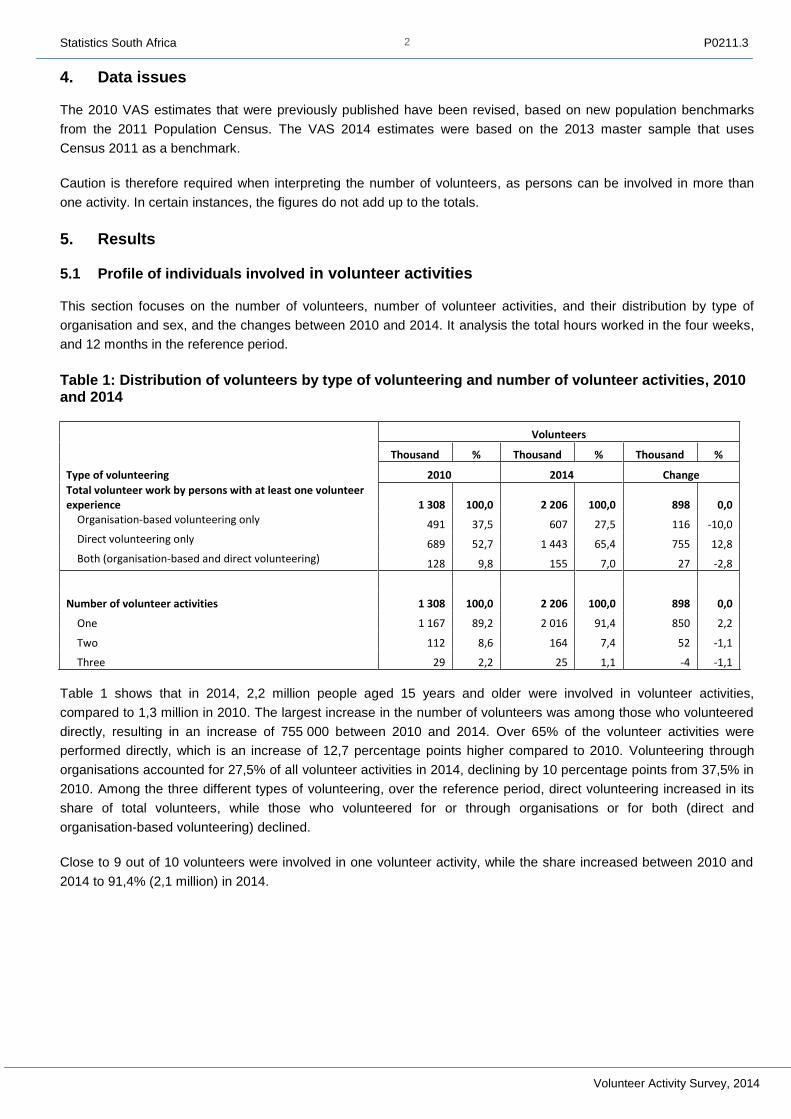
Table 1: Distribution of volunteers by type of volunteering and number of volunteer activities, 2010 and 2014
Type of volunteering
Volunteers
Thousand % Thousand % Thousand %
2010 2014 Change
Total volunteer work by persons with at least one volunteer experience 1 308 100,0 2 206 100,0 898 0,0 Organisation-based volunteering only 491 37,5 607 27,5 116 -10,0 Direct volunteering only 689 52,7 1 443 65,4 755 12,8 Both (organisation-based and direct volunteering) 128 9,8 155 7,0 27 -2,8
Number of volunteer activities 1 308 100,0 2 206 100,0 898 0,0
One 1 167 89,2 2 016 91,4 850 2,2
Two 112 8,6 164 7,4 52 -1,1
Three 29 2,2 25 1,1 -4 -1,1
Table 1 shows that in 2014, 2,2 million people aged 15 years and older were involved in volunteer activities,
compared to 1,3 million in 2010. The largest increase in the number of volunteers was among those who volunteered
directly, resulting in an increase of 755 000 between 2010 and 2014. Over 65% of the volunteer activities were
performed directly, which is an increase of 12,7 percentage points higher compared to 2010. Volunteering through
organisations accounted for 27,5% of all volunteer activities in 2014, declining by 10 percentage points from 37,5% in
2010. Among the three different types of volunteering, over the reference period, direct volunteering increased in its
share of total volunteers, while those who volunteered for or through organisations or for both (direct and
organisation-based volunteering) declined.
Close to 9 out of 10 volunteers were involved in one volunteer activity, while the share increased between 2010 and
2014 to 91,4% (2,1 million) in 2014.

Statistics South Africa P0211.3
Volunteer Activity Survey, 2014
3
Table 2: Number of volunteers and hours, 2010 and 2014
1 Assuming 40 hours of work per week for 52 weeks.
Table 2 shows that out of the population of 38 million people 15 years and above, only 5,8% were engaged in
volunteer activities in 2014. They contributed 610 million hours to the community during the 12 months period,
engaging in many different activities through organisations or as individuals. The 610 million hours worked in 2014 are
equivalent to 293 000 jobs, which is an increase of 91 000 full-time jobs compared with the 2010 volume of work,
which was equal to 202 000 full-time jobs. On average, 277 hours were volunteered in 2014, which is a decline of
44 hours from the 2010 figure of 321 hours.
Table 3: Number of volunteers and hours of volunteering by sex and type of volunteering, 2010 and 2014
Type of volunteering
Number of volunteers
Total hours volunteered, 4 weeks
Total hours volunteered, 12 months
Number of volunteers
Total hours volunteered, 4 weeks
Total hours volunteered, 12 months
Number of volunteers
Total hours volunteered, 4 weeks
Total hours volunteered, 12 months
2010 2014 Change
Thousand Thousand
Total volunteer work by persons with at least one volunteer experience 1 308 32 249 419 241 2 206 46 960 610 478 898 14 711 191 237
Men 480 10 256 133 333 866 19 687 255 925 386 9 430 122 592
Women 828 21 993 285 908 1 340 27 273 354 553 512 5 280 68 645 Organisation-based volunteering only 491 17 544 228 076 607 16 270 211 509 116 -1 274 -16 567
Men 195 5 423 70 496 257 7 170 93 213 62 1 747 22 717
Women 296 12 122 157 580 350 9 100 118 296 53 -3 022 -39 284 Direct volunteering only 689 12 502 162 531 1 443 28 592 371 696 755 16 090 209 166
Men 229 3 767 48 976 541 11 224 145 918 311 7 457 96 942
Women 459 8 735 113 555 903 17 368 225 778 443 8 633 112 223 Both (organisation-based and direct volunteering) 128 2 203 28 634 155 2 098 27 273 27 -105 -1 361
Men 56 1 066 13 861 68 1 292 16 794 12 226 2 933
Women 73 1 136 14 773 88 806 10 479 15 -330 -4 294
Volunteers 2010 2014
Total population ('000) 35 332 38 159
Number of volunteers ('000) 1 308 2 206
Volunteer rate (%) 3,7 5,8
Volunteer hours
Total annual volunteer hours ('000) 419 241 610 478
Full-time year-round job equivalent (jobs)1
('000 202 293
Average annual volunteer hours 321 277

Statistics South Africa P0211.3
Volunteer Activity Survey, 2014
4
Of the 2,2 million people who volunteered in 2014, 60,7% (1,3 million) were women while 39,3% (866 000) were men.
In both 2010 and 2014, women were more likely to volunteer. In addition, across all types of volunteer activities,
women dominated volunteering. Although more women volunteered compared to men, they devoted fewer hours to
volunteering during the reference period in 2014 compared with 2010, particularly with regards to organisation-based
volunteering. The number of hours volunteered for organisation-based volunteering only and both organisation-based
and direct volunteering declined, mainly because of a decline in the number of hours volunteered by women. In total,
men and women volunteered 46,9 million hours during the reference period (4 weeks), which is an increase of 14,7
million from the 32,2 million in 2010.
In 2014, over the 12-month period, 610,4 million hours were dedicated to volunteer activities, which is an increase of
191,2 million hours compared with 2010. More hours were spent through direct volunteering only (371,7 million) and
fewer hours were spent on both organisation-based and direct volunteering. The opposite was true in 2010, where
more hours were spent volunteering at an organisation compared to direct volunteering.
5.2 Volunteer rate
The volunteer rate is a convenient expression of the extent to which the country’s population engages in volunteer
activities. It is computed by dividing the number of volunteers identified by the population aged 15 years and older
during the reference period. In this section, the volunteer rate is computed and analysed for sex, population group,
marital status, age group, education level, province, and head of the household for the periods 2010 and 2014.
Figure 1: Volunteer rate by sex, 2010 and 2014 Figure 2: Volunteer rate by population group and sex, 2010 and 2014
Between 2010 and 2014, the volunteer rate increased by 2,1 percentage points from 3,7% to 5,8%. Volunteer rate
among women were higher than those among men in both years. The volunteer rate for women increased by 2,3
percentage points, while the change for men was 1,9 percentage points (Figure 1).
Figure 2 indicates that the white population was more likely to be involved in volunteer activities compared to other
population groups, with a volunteer rate of 6,4% and 7,6% respectively for 2010 and 2014. In 2010, the volunteer rate
was the lowest among black African men who had a volunteer rate of 2,5%. In 2014, the volunteer rate was the lowest
among coloured men at 3,4%. In both 2010 and 2014, white women had the highest volunteer rate (7,0% and 8,1%
respectively).
2010 2014 2010 2014 2010 2014 2010 2014
Black African Coloured Indian/Asian White
Men 2,5 4,6 3,8 3,4 3,9 4,5 5,8 7,0
Women 4,3 6,8 4,9 5,1 3,2 6,5 7,0 8,1
Both sexes 3,5 5,7 4,4 4,3 3,6 5,5 6,4 7,6
0,0
2,0
4,0
6,0
8,0
10,0
%

Statistics South Africa P0211.3
Volunteer Activity Survey, 2014
5
Figure 3: Volunteer rate by age group, 2010 and 2014
Figure 4: Volunteer rate for youth and adults by labour market status, 2010 and 2014
Figure 3 shows that between 2010 and 2014, the volunteer rate increased for all the age groups. The volunteer rate
among the age group 45–54 years increased from 6,4% to 9,1%. This group also recorded the highest volunteer rate.
Persons aged 15–24 years had the lowest volunteer rate in both 2010 and 2014. For both 2010 and 2014, persons in
the older age groups (45–54, 55–64 and 65+ years) were more likely to volunteer than those in the younger age
groups.
Over the period 2010 to 2014, the adult volunteer rate was higher than that of youth; in addition, the increase in the
rate was higher for adults compared to youth (2,2 percentage points as compared to 1,8 percentage points). Between
these two periods, the volunteer rate increased across all labour market statuses for both adults and youth, with the
highest increase among discouraged and other inactive adults (3,0 percentage points each). The volunteer rate
among discouraged adults was highest in both 2010 and 2014 (7,6% and 10,6% respectively) (Figure 4).
Figure 5: Volunteer rate by marital status and sex, 2010 and 2014
15-24 25-34 35-44 45-54 55-64 65+ Total
2010 1,2 3,3 5,2 6,4 5,7 3,4 3,7
2014 2,6 5,7 7,2 9,1 7,9 5,6 5,8
0,0
2,0
4,0
6,0
8,0
10,0
%
2010 2014

Statistics South Africa P0211.3
Volunteer Activity Survey, 2014
6
Between 2010 and 2014, the volunteer rate increased for both men and women across all the marital status
categories, as shown in Figure 5. In 2014, the volunteer rate was highest among divorced/separated women and men
(11,3% and 8,8% respectively), while the volunteer rate for both periods for never married men and women (3,6% and
5,2% respectively) was the lowest. In 2014, the volunteer rate of divorced/separated women (4,5 percentage points)
and widow/widower women (3,7 percentage points) recorded the highest changes compared to 2010, while the lowest
change was reported for widowed men at only 0,2 of a percentage point over the same period.
Figure 6: Volunteer rate by education status, 2010 and 2014
Higher levels of education are associated with higher volunteer rates. The volunteer rate increased among all
educational levels, with the highest volunteer rate was recorded among persons with a tertiary education in both 2010
(8,8%) and 2014 (10,6%). In 2014, the lowest volunteer rates were observed among those with primary completed
education (4,5%) in contrast to 2010, where the rate was lowest for those with no schooling (2,3%).
Figure 7: Volunteer rate by province, 2010 and 2014
8,2
7,5
7,3
6,2
5,5
5,3
5,1
4,8
4,3
5,8
7,2
2,8
6,5
6,4
1,8
1,4
3,8
5,4
2,0
3,7
1,0
4,7
0,8
-0,2
3,8
3,9
1,3
-0,6
2,3
2,1
0,0 2,0 4,0 6,0 8,0 10,0
FS
EC
LP
NC
KZN
NW
GP
WC
MP
RSA
%
2010 2014 Change

Statistics South Africa P0211.3
Volunteer Activity Survey, 2014
7
Nationally, between 2010 and 2014, the volunteer rate increased by 2,1 percentage points from 3,7% to 5,8%. Over
the same period, the volunteer rate increased in almost all the provinces with the exception of Western Cape (-0,6
percentage points) and Northern Cape (-0,2 percentage points). In 2014, the highest volunteer rates were reported in
the Free State (8,2%), Eastern Cape (7,5%) and Limpopo (7,3%), while the lowest volunteer rates were recorded in
Western Cape (4,8%) and Mpumalanga (4,3%). The largest increase in the rate of volunteering over the period was
observed in the Eastern Cape. This province had one of the lowest volunteer rates in 2010 (2,8%), but in 2014, its
rate was among the top three highest rates.
Figure 8: Distribution of household heads who are volunteers by labour market status, 2010 and 2014
Figure 9: Volunteer rate of household heads by labour market status, 2010 and 2014
Employed household heads accounted for more than 50% of volunteers in both 2010 and 2014. The proportion of
volunteers who were household heads increased for all labour market statuses, except the employed, where a
decrease of 6,1 percentage points was recorded in 2014 (Figure 8). Figure 9 shows that the volunteer rate of
household heads was 7,9% in 2014, which is a 2,8 percentage points increase from the 5,1% recorded in 2010.
Increases in volunteer rates were observed in all labour market statuses over the period, with the largest increase
recorded for discouraged work-seekers (5,9 percentage points). Discouraged household heads had the highest
volunteer rates for both 2010 and 2014 (8,5% and 14,4% respectively), indicating the likelihood of the discouraged to
be more involved in volunteer activities compared to the other labour market statuses.
Figure 10: Distribution of what volunteers received/expected to receive, 2010 and 2014
Cash 34,7%
Food 11,8%
Transport 2,9%
Clothes 2,0%
Shelter 3,3%
Skills 28,5
Other 16,9%
2010
Cash 23,7%
Food 19,2%
Transport 11,1%
Clothes 9,9%
Shelter 7,8%
Skills 18,4%
Other 9,8%
2014

Statistics South Africa P0211.3
Volunteer Activity Survey, 2014
8
Apart from the personal satisfaction that comes from helping people, respondents were asked whether they received
or expected to receive something in return for their volunteering. Those who indicated that they did receive or
expected to receive something in return were further asked what they received or expected to receive for their
volunteering. Figure 10 shows that in 2014, among those who expected or received something in return, 23,7%
received or expected to receive cash, while 19,2% received or expected to receive food, and 18,4% received or
expected to receive skills. A further combined 28,8% received or expected to receive transport, clothes and shelter.
The distribution is similar to that reported in 2010, where a third of the volunteers expected or received cash (34,7%),
while a smaller proportion expected or received shelter (3,3%), transport (2,9%) and clothes (2,0%).
Figure 11: Distribution of the reasons for volunteering by sex, 2014
Table 4: Reason for volunteering by employment status, 2014
Figure 11 shows the contribution that volunteering makes to social inclusion as most people volunteer because they
believe in a cause and also to fulfill religious obligations or beliefs. The reason for volunteering provided by more than
50% of men and women was to help a cause in which they believed. Less than 14% of men and women argued that
their reason for volunteering was to fulfil religious obligations or beliefs. The majority of women (57,8%) volunteered to
help a cause in which they believed and to fulfil religious obligations or beliefs (13,1%) compared to men. The
percentage of women who volunteered for other reasons was 3,7 percentage points lower as compared to men, who
accounted for 32,8%. Table 4 shows that a large number of people were involved in volunteer work to help a cause in
which they believed, irrespective of their labour market status.
5.3 Value of volunteer work
To establish the economic value of the work provided by volunteers, the report uses the “replacement cost” estimation
method, which establishes the replacement cost by assigning to the hours of volunteer work, what it would cost to hire
someone to do the work that the volunteer is doing for no pay. For example, if medical doctor volunteers as a teacher,
his work will be valued at the rate of what a teacher is paid.
For this report, the median hourly earnings by occupation have been used to assign value to the hours that a
volunteer has worked in that particular occupation. Stats SA prefer using median hourly earnings rather than mean
hourly earnings because of increased stability through time. The median hourly earnings were obtained from the
Quarterly Labour Force Survey (QLFS). This section will calculate the value of volunteer work for the occupation,
employment status, industry and the type of organisation.
Reason Employed Unemployed Discouraged Other Total
Help a cause which you personally believe 533 201 114 404 1 253
Friends volunteered 16 7 3 16 42
Improve job opportunities 17 23 10 12 62
Religious/beliefs 115 37 11 117 279
Explore own strength 24 2 3 16 44
Use of skills 76 22 6 49 153
Personally affected by the cause 82 35 22 76 215
Other 68 17 19 53 158
Total 931 344 187 743 2 206
Statistics South Africa P0211.3
Volunteer Activity Survey, 2014
9
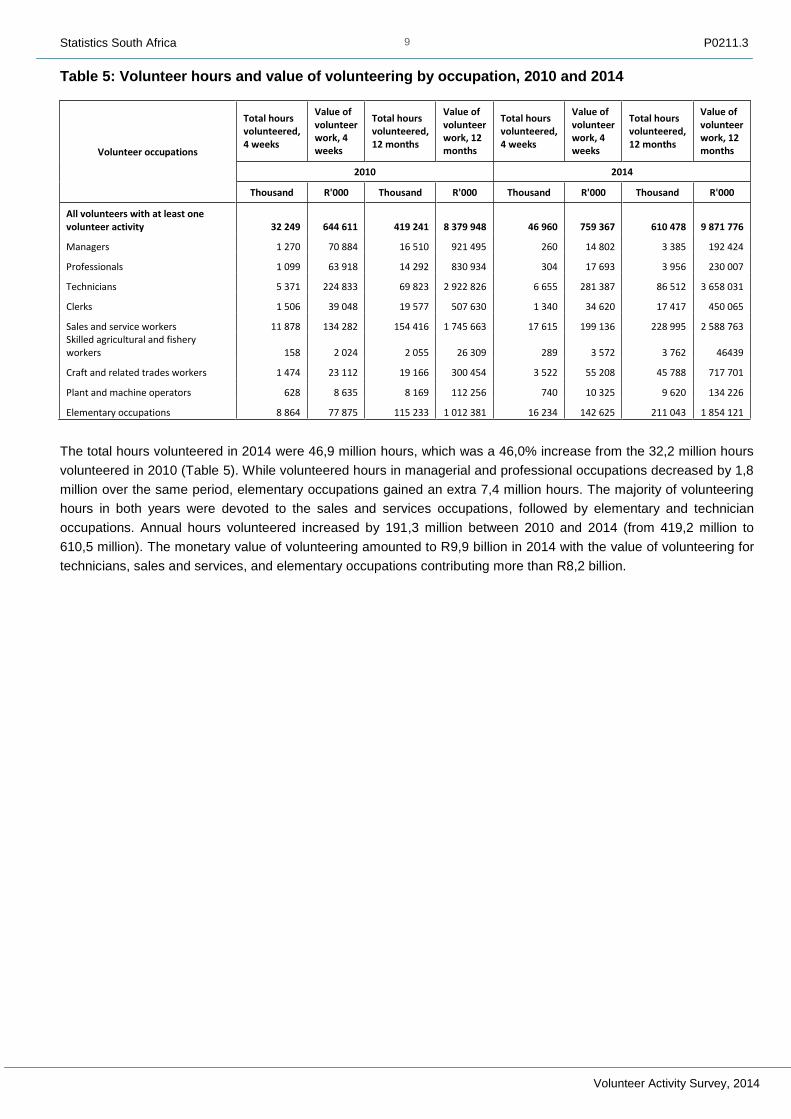
Table 5: Volunteer hours and value of volunteering by occupation, 2010 and 2014
Volunteer occupations
Total hours volunteered, 4 weeks
Value of volunteer work, 4 weeks
Total hours volunteered, 12 months
Value of volunteer work, 12 months
Total hours volunteered, 4 weeks
Value of volunteer work, 4 weeks
Total hours volunteered, 12 months
Value of volunteer work, 12 months
2010 2014
Thousand R'000 Thousand R'000 Thousand R'000 Thousand R'000
All volunteers with at least one volunteer activity 32 249 644 611 419 241 8 379 948 46 960 759 367 610 478 9 871 776
Managers 1 270 70 884 16 510 921 495 260 14 802 3 385 192 424
Professionals 1 099 63 918 14 292 830 934 304 17 693 3 956 230 007
Technicians 5 371 224 833 69 823 2 922 826 6 655 281 387 86 512 3 658 031
Clerks 1 506 39 048 19 577 507 630 1 340 34 620 17 417 450 065
Sales and service workers 11 878 134 282 154 416 1 745 663 17 615 199 136 228 995 2 588 763 Skilled agricultural and fishery workers 158 2 024 2 055 26 309 289 3 572 3 762 46439
Craft and related trades workers 1 474 23 112 19 166 300 454 3 522 55 208 45 788 717 701
Plant and machine operators 628 8 635 8 169 112 256 740 10 325 9 620 134 226
Elementary occupations 8 864 77 875 115 233 1 012 381 16 234 142 625 211 043 1 854 121
The total hours volunteered in 2014 were 46,9 million hours, which was a 46,0% increase from the 32,2 million hours
volunteered in 2010 (Table 5). While volunteered hours in managerial and professional occupations decreased by 1,8
million over the same period, elementary occupations gained an extra 7,4 million hours. The majority of volunteering
hours in both years were devoted to the sales and services occupations, followed by elementary and technician
occupations. Annual hours volunteered increased by 191,3 million between 2010 and 2014 (from 419,2 million to
610,5 million). The monetary value of volunteering amounted to R9,9 billion in 2014 with the value of volunteering for
technicians, sales and services, and elementary occupations contributing more than R8,2 billion.
Statistics South Africa P0211.3
Volunteer Activity Survey, 2014
10
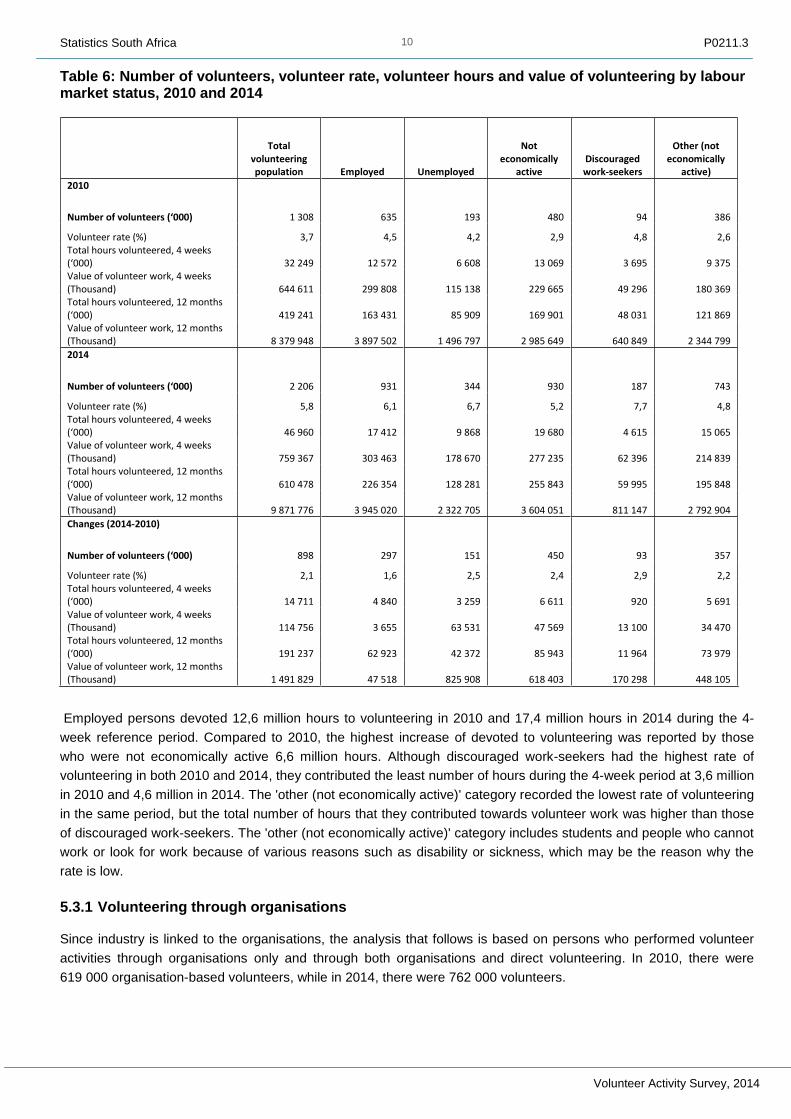
Table 6: Number of volunteers, volunteer rate, volunteer hours and value of volunteering by labour market status, 2010 and 2014
Total volunteering population Employed Unemployed
Not economically
active Discouraged work-seekers
Other (not economically
active)
2010
Number of volunteers (‘000) 1 308 635 193 480 94 386
Volunteer rate (%) 3,7 4,5 4,2 2,9 4,8 2,6 Total hours volunteered, 4 weeks (‘000) 32 249 12 572 6 608 13 069 3 695 9 375 Value of volunteer work, 4 weeks (Thousand) 644 611 299 808 115 138 229 665 49 296 180 369 Total hours volunteered, 12 months (‘000) 419 241 163 431 85 909 169 901 48 031 121 869 Value of volunteer work, 12 months (Thousand) 8 379 948 3 897 502 1 496 797 2 985 649 640 849 2 344 799
2014
Number of volunteers (‘000) 2 206 931 344 930 187 743
Volunteer rate (%) 5,8 6,1 6,7 5,2 7,7 4,8 Total hours volunteered, 4 weeks (‘000) 46 960 17 412 9 868 19 680 4 615 15 065 Value of volunteer work, 4 weeks (Thousand) 759 367 303 463 178 670 277 235 62 396 214 839 Total hours volunteered, 12 months (‘000) 610 478 226 354 128 281 255 843 59 995 195 848 Value of volunteer work, 12 months (Thousand) 9 871 776 3 945 020 2 322 705 3 604 051 811 147 2 792 904
Changes (2014-2010)
Number of volunteers (‘000) 898 297 151 450 93 357
Volunteer rate (%) 2,1 1,6 2,5 2,4 2,9 2,2 Total hours volunteered, 4 weeks (‘000) 14 711 4 840 3 259 6 611 920 5 691 Value of volunteer work, 4 weeks (Thousand) 114 756 3 655 63 531 47 569 13 100 34 470 Total hours volunteered, 12 months (‘000) 191 237 62 923 42 372 85 943 11 964 73 979 Value of volunteer work, 12 months (Thousand) 1 491 829 47 518 825 908 618 403 170 298 448 105
Employed persons devoted 12,6 million hours to volunteering in 2010 and 17,4 million hours in 2014 during the 4-
week reference period. Compared to 2010, the highest increase of devoted to volunteering was reported by those
who were not economically active 6,6 million hours. Although discouraged work-seekers had the highest rate of
volunteering in both 2010 and 2014, they contributed the least number of hours during the 4-week period at 3,6 million
in 2010 and 4,6 million in 2014. The 'other (not economically active)' category recorded the lowest rate of volunteering
in the same period, but the total number of hours that they contributed towards volunteer work was higher than those
of discouraged work-seekers. The 'other (not economically active)' category includes students and people who cannot
work or look for work because of various reasons such as disability or sickness, which may be the reason why the
rate is low.
5.3.1 Volunteering through organisations
Since industry is linked to the organisations, the analysis that follows is based on persons who performed volunteer
activities through organisations only and through both organisations and direct volunteering. In 2010, there were
619 000 organisation-based volunteers, while in 2014, there were 762 000 volunteers.

Statistics South Africa P0211.3
Volunteer Activity Survey, 2014
11
Table 7: Number of volunteers, volunteer hours and value of volunteering by industry, 2010 and 2014
Volunteer occupations
Number of volunteers
Total hours volunteered, 4 weeks
Value of volunteer work, 4 weeks
Total hours volunteered, 12 months
Value of volunteer work, 12 months
Number of volunteers
Total hours volunteered, 4 weeks
Value of volunteer work, 4 weeks
Total hours volunteered, 12 months
Value of volunteer work, 12 months
2010 2014
Thousand R'000 Thousand R'000 Thousand R'000 Thousand R'000
All volunteers 619 19 747 424 454 256 710 5 517 906 762 18 368 372 428 238 782 4 841 569 Community and social services 572 18 598 399 765 241 770 5 196 946 710 17 352 358 290 225 578 4 657 774
Other 47 1 149 24 689 14 940 320 960 52 1 016 14 138 13 204 183 796
Table 7 shows that in both 2010 and 2014, the majority of individuals who volunteered through organisations only or
through both organisations and directly, were volunteers in the Community and social services industry. The number
of those who volunteered in this industry increased from 572 000 in 2010 to 710 000 in 2014, which is an increase of
183 000 volunteers. The total hours devoted to volunteering and the value of volunteering work declined in 2014 as
compared to 2010 for organisation-based volunteering.
Table 8: Number of volunteer hours and value of volunteering by type of organisation, 2010 and 2014
Total hours volunteered, 4 weeks
Value of volunteer work, 4 weeks
Total hours volunteered, 12 months
Value of volunteer, 12 months
Total hours volunteered, 4 weeks
Value of volunteer work, 4 weeks
Total hours volunteered, 12 months
Value of volunteer, 12 months
Thousand R'000 Thousand R'000 Thousand R'000 Thousand R'000
2010 2014
Organisation-based volunteering only (at least one volunteer activity) 19 745 424 379 256 687 5 516 933 18 368 372 428 238 782 4 841 569
Charity/NGO/CBO/CSO 9 396 191 274 122 144 2 486 563 4 622 78 485 60 088 1 020 302
Religious 4 611 120 242 59 939 1 563 150 5 019 104 268 65 245 1 355 486
Political 462 10 946 6 011 142 302 1 625 51 961 21 125 675 487
Union/Business organisation 46 1 711 595 22 242 66 839 857 10 907
Private Business 817 22 522 10 627 292 788 818 15 281 10 638 198 653
Education institution 974 30 947 12 661 402 309 1 344 29 140 17 478 378 821
Health institution 667 10 120 8 672 131 566 550 6 297 7 145 81 865
Community development - - - - 1 629 40 541 21 178 527 038
Culture and recreation - - - - 274 10 100 3 562 131 300
Fund-raising organisation - - - - 136 1 196 1 769 15 544
Conservation and protection - - - - 105 921 1 362 11 970
Law enforcement - - - - 1 010 9 099 13 125 118 286
Other government entity 2 772 36 616 36 038 476 013 759 9 830 9 866 127 793
Other, specify - - - - 393 13 610 5 108 176 936
Don’t know - - - - 18 860 235 11 182

Statistics South Africa P0211.3
Volunteer Activity Survey, 2014
12
In 2010 and 2014, Charity/NGO/CBO/CSO and religious organisations accounted for the largest number of
volunteers; however, the total hours volunteered in the reference period or in the past 12 months for these
organisations declined between 2010 and 2014. As such, the value of volunteering for Charity/NGO/CBO/CSO and
religious organisations declined over the period. In 2014, five (Community development, Culture and recreation,
Fund-raising, Conservation and protection, as well as Law enforcement) activities were additional types of
organisation volunteer work introduced in the 2014 survey to capture the ever-changing landscape of volunteering.
Figure 12: Distribution of the number of volunteers and hours by type of organisation, 2014
Figure 12 above shows that in 2014, a higher proportion of volunteers volunteered through religious organisations
(48,3%) and their hours volunteered accounted for 26,7% of total hours volunteered. The second highest
organisations with most volunteers was charity/non-profit organisations/NGOs/CBOs, which accounted for 19,0% of
organisation-based volunteers, and whose hours contributed accounted for 27,5%. The smallest proportion of
volunteers were those involved in natural resource conservation and protection (0,6%); their hours of work accounted
for 0,6%.
0,1
1,6
4,6
6,0
0,6
0,4
1,6
9,1
3,0
6,8
3,0
0,4
8,6
26,7
27,5
0,4
3,0
1,6
4,3
0,6
0,7
2,3
4,8
1,4
5,8
4,0
0,9
8,1
48,3
19,0
0,0 10,0 20,0 30,0 40,0 50,0
don’t know
Other
Other government entity
Law enforcement
Natural resource conservation
Fund-raising organisation
Culture and recreation
Economic, social & community
Health institution
Education institution
Private business
Union
Political
Religious
Charity/NGO/CBO/CSO
%
Distribution of number of volunteers Distribution of total volunteer hours
Statistics South Africa P0211.3
Volunteer Activity Survey, 2014
13
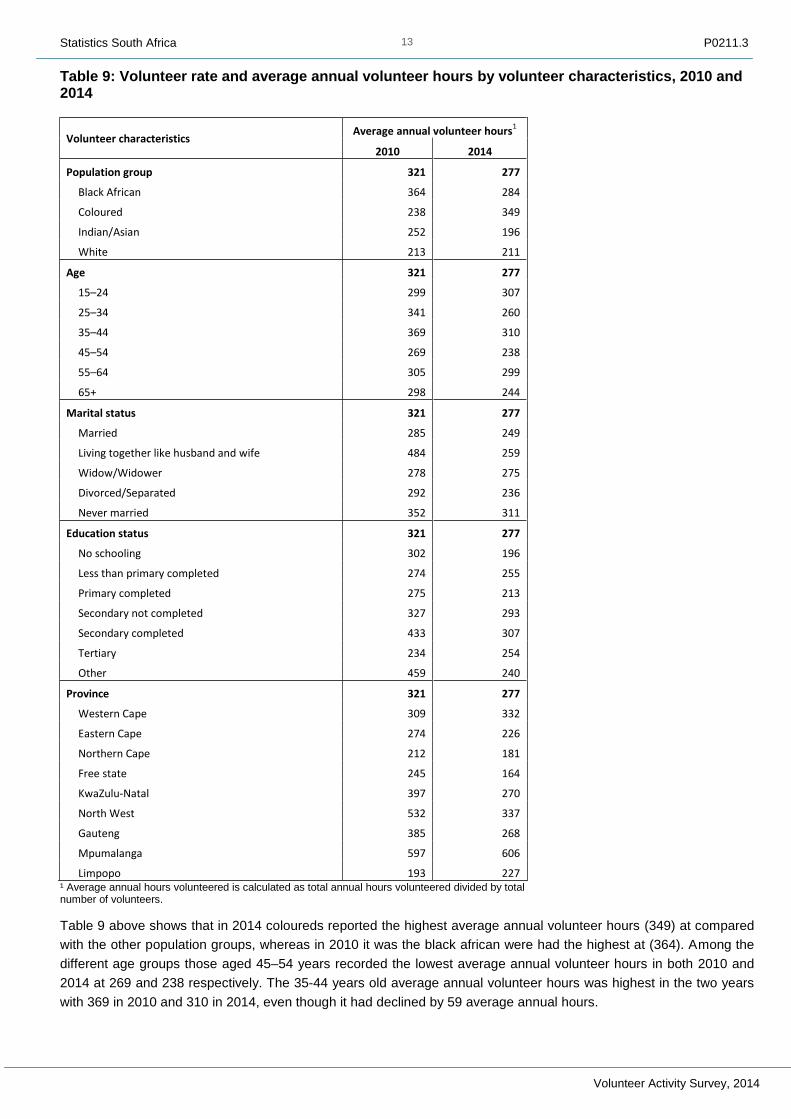
Table 9: Volunteer rate and average annual volunteer hours by volunteer characteristics, 2010 and 2014
¹ Average annual hours volunteered is calculated as total annual hours volunteered divided by total number of volunteers.
Table 9 above shows that in 2014 coloureds reported the highest average annual volunteer hours (349) at compared
with the other population groups, whereas in 2010 it was the black african were had the highest at (364). Among the
different age groups those aged 45–54 years recorded the lowest average annual volunteer hours in both 2010 and
2014 at 269 and 238 respectively. The 35-44 years old average annual volunteer hours was highest in the two years
with 369 in 2010 and 310 in 2014, even though it had declined by 59 average annual hours.
Volunteer characteristics Average annual volunteer hours
1
2010 2014
Population group 321 277
Black African 364 284
Coloured 238 349
Indian/Asian 252 196
White 213 211
Age 321 277
15–24 299 307
25–34 341 260
35–44 369 310
45–54 269 238
55–64 305 299
65+ 298 244
Marital status 321 277
Married 285 249
Living together like husband and wife 484 259
Widow/Widower 278 275
Divorced/Separated 292 236
Never married 352 311
Education status 321 277
No schooling 302 196
Less than primary completed 274 255
Primary completed 275 213
Secondary not completed 327 293
Secondary completed 433 307
Tertiary 234 254
Other 459 240
Province 321 277
Western Cape 309 332
Eastern Cape 274 226
Northern Cape 212 181
Free state 245 164
KwaZulu-Natal 397 270
North West 532 337
Gauteng 385 268
Mpumalanga 597 606
Limpopo 193 227

Statistics South Africa P0211.3
Volunteer Activity Survey, 2014
14
As far as the average annual volunteer hours by marital status was concerned, the highest average annual volunteer
hours were recorded in 2010 by those who were living together like husband and wife (484) and in 2014, the highest
annual average volunteer hours were recorded by those who had never been married (311). An increase in average
annual volunteer hours was only observed among those with Tertiary education (from 234 in 2010 to 254 in 2014), the
other education levels experienced declines in their average annual hours. The majority of provinces experienced
declines in their average annual volunteer hours, only Western Cape, Mpumalanga and Limpopo average annual
volunteer hours increased in 2014.
6. Summary
In 2014, the number of people who volunteered their time, energy and skills directly or through organisations
increased by 40 percentage points compared to the 2010. During the same period, about 28% of volunteers
volunteered through organisations only, while 7 percentage points volunteered both through organisations and
directly. Overall, there was a drop of 9% in the proportion of people who volunteered through organisations only when
comparing the two reference periods. The majority of volunteers (around 90%) were involved in only one activity in
both 2010 and 2014. The 610,4 million volunteered hours contributed in 2014 were equivalent to more than 293 000
full-time jobs. Women were more likely to volunteer than men, and in 2014, the rate for volunteering increased for
both men and women. Among the different population groups, the white population recorded the highest volunteering
rate, followed by the black African and Indian populations, while the coloured population had the lowest volunteer rate
in 2014.
The findings also suggest that adults were more likely to volunteer than the youth, and in 2014, both adult and youth
discouraged work-seekers were more likely to volunteer than persons in other labour market statuses. Education also
seems to play an important role in volunteer work, as it was observed that during the two periods, volunteers with a
tertiary education had higher volunteer rates compared to the other education levels. Mpumalanga reported the
lowest volunteer rate, while Free State and Eastern Cape reported the highest rates of volunteering. During the two
reference periods, more than 50% of the volunteers who were household heads reported that they were employed,
and among the volunteers who were household heads, those who were discouraged and unemployed were more
likely to be involved in volunteering activities than those employed or not economically active.
Volunteers expected or received mainly cash for their volunteer work, apart from the satisfaction they received from
helping others. The main reason for getting involved in volunteer work was to help a cause in which they personally
believed or because of religious or other beliefs. Volunteers in the Sales and service and Elementary industries
contributed a total of 33 849 hours in the 4-week reference period, and this accounted for more than 70% of hours
volunteered during the 4 weeks in the reference period in 2014. A similar picture was observed for the 12-month
period. Interestingly, the volunteer rate among those who were not economically active was the lowest, but the total
number of hours volunteered was higher when compared with other labour market statuses. In terms of industries, the
Community and social services industry had over 90% of volunteers who volunteered through an organisation and as
such, its hours and value of work contributed the most to organisation-based volunteering. Within the Community and
social services industry, the majority of volunteers (48,3%) volunteered for religious organisations, followed by those
who volunteered for NGOs at 19,0%. These two organisations combined contributed 54,2% to the total hours spent
on volunteer work.
The analysis shows a decrease in the average annual hours worked from 321 in 2010 to 277 hours in 2014. This
decline is reason for concern, given the importance that volunteer work has in the lives of people who benefit from
volunteer work, and given its economic importance to the country’s growth and development. In conclusion, the
measuring of volunteer work, which captures the part of informal labour that is not paid and that tends to be
overlooked as a consequence, is important, and it is in this regard that its measurement will enhance the coverage of
labour statistics as well as its quality and validity. Additionally, policies that are aimed at promoting volunteer work will
have a positive impact on the many lives of those who benefit from volunteering.

Statistics South Africa P0211.3
Volunteer Activity Survey, 2014
15
7. Technical notes
7.1 Response details
Response rates by province
Province
Apr – Jun 2014
Per cent
Western Cape 74,7
Eastern Cape 80,9
Northern Cape 66,3
Free State 85,3
KwaZulu-Natal 70,5
North West 71,9
Gauteng 58,4
Mpumalanga 81,3
Limpopo 84,4
RSA 75,5
7.2 Survey requirements and design
During the Quarterly Labour Force Survey (QLFS) of quarter two 2014, persons involved in volunteer activities were
screened and later interviewed for the Volunteer Activities Survey (VAS). The VAS interviews were not conducted at
the same time as the QLFS. This resulted in a reduction in the number of persons interviewed during VAS compared
to the number identified during QLFS screening, due to persons refusing to participate in the VAS, persons not at
home during VAS interviews, demolished structures, vacant dwellings, etc. If all qualifying VAS persons identified in
QLFS Q2: 2014 responded positively during VAS interviews, there would have been no need to adjust the VAS
weights. The final VAS weights would have been the same as the QLFS calibrated weights. The VAS weight
adjustment accounts for those persons who qualified for VAS, but refused to take part or who were not available for
interviews. Persons identified as ineligible for VAS were not accounted for during weight adjustment.
7.3 Weighting
The sampling weights for the data collected from the sampled households are constructed in such a manner that the
responses could be properly expanded to represent the entire population of South Africa aged 15 years and older.
The weights are the result of calculations involving several factors, including original selection probabilities,
adjustment for non-response, and benchmarking to known population estimates from the Demographic division of
Stats SA.
7.4 Non-response adjustment
The non-response adjustment is done through the creation of adjustment classes. The adjustment classes are
created using Response Homogeneity Groups (RHGs), where respondents have the same characteristics with non-
respondents in the group. The response rate (which is the ratio of responses to all eligible units in the sample) is
calculated within each class. The inverse of the response rate (adjustment factor) is calculated within each class, and
the result is multiplied by the person weight of the Q2: 2014 QLFS for the responding units to get the adjusted VAS
person weight for non-responding units. In essence, the weights of responding persons are inflated to account for
those that did not respond during VAS.

Statistics South Africa P0211.3
Volunteer Activity Survey, 2014
16
Appendix
Table 1: Volunteer rate, number of volunteers, volunteer hours for 12 months, value of volunteering for 12 months, by the type of volunteering and volunteer characteristics for both sexes
Volunteer characteristics
Total, both sexes
Total population, both sexes
Number of volunteers
Volunteer rate
Total hours volunteered
Value of volunteer
work
Total population, both sexes
Number of volunteers
Volunteer rate
Total hours volunteered
Value of volunteer
work
Total population, both sexes
Number of volunteers
Volunteer rate
Total hours volunteered
Value of volunteer
work
Thousand % Thousand R'000 Thousand % Thousand R'000 Thousand % Thousand R'000
2 010 2 014 Change
Population group 35 332 1 308 3,7 419 241 8 379 948 38 159 2 206 5,8 610 478 9 871 776 2 827 898 2,1 191 237 1 491 829
African/Black 27 257 897 3,3 327 005 6 051 459 29 814 1 711 5,7 485 928 7 859 950 2 557 813 2,4 158 923 1 808 491
Coloured 3 282 140 4,3 33 323 900 242 3 516 152 4,3 52 943 839 502 235 11 0,0 19 620 -60 741
Indian/Asian 987 35 3,6 8 903 265 177 1 056 58 5,5 11 385 163 277 69 23 1,9 2 483 -101 900
White 3 806 235 6,2 50 011 1 163 070 3 772 285 7,6 60 222 1 009 048 -34 50 1,4 10 211 -154 022
Age 35 332 1 308 3,7 419 241 8 379 948 38 159 2 206 5,8 610 478 9 871 776 2 827 898 2,1 191 237 1 491 829
15-24 9 926 123 1,2 36 709 679 341 10 253 267 2,6 81 910 1 318 780 327 144 1,4 45 201 639 439
25-34 8 733 292 3,3 99 420 1 875 129 9 306 527 5,7 137 283 2 126 734 573 236 2,3 37 863 251 605
35-44 6 620 346 5,2 127 384 2 582 266 7 406 532 7,2 164 733 2 912 143 785 186 2,0 37 349 329 877
45-54 4 658 296 6,4 79 515 1 528 582 5 009 457 9,1 108 857 1 671 933 351 161 2,8 29 342 143 351
55-64 2 944 168 5,7 51 316 1 027 185 3 358 265 7,9 79 283 1 324 681 414 97 2,2 27 968 297 497
65+ 2 450 84 3,4 24 897 687 444 2 827 158 5,6 38 412 517 504 377 74 2,2 13 515 -169 940
Marital Status 35 332 1 308 3,7 419 241 8 379 948 38 159 2 206 5,8 610 478 9 871 776 2 827 898 2,1 191 237 1 491 829
Married 10 514 645 6,1 183 965 4 035 569 10 979 826 7,5 205 497 3 477 820 464 181 1,4 21 532 -557 750
Living together like husband and wife
3 038 107 3,5 51 676 943 976 3 136 186 5,9 48 251 660 870 98 80 2,4 -3 425 -283 106
Widow/Widower 2 360 111 4,7 30 997 654 389 2 504 197 7,9 54 091 883 245 143 85 3,1 23 094 228 856
Divorced/Separated 934 66 7,1 19 392 348 215 938 98 10,4 23 115 313 510 4 31 3,3 3 722 -34 705
Never married 18 485 378 2,0 133 210 2 397 799 20 603 898 4,4 279 524 4 536 331 2 117 520 2,3 146 314 2 138 532

Statistics South Africa P0211.3
Volunteer Activity Survey, 2014
17
Table 1: Volunteer rate, number of volunteers, volunteer hours for 12 months, and value of volunteering for 12 months, by the type of volunteering and volunteer characteristics for both sexes (concluded)
Volunteer characteristics
Total, both sexes
Total population, both sexes
Number of volunteers
Volunteer rate
Total hours volunteered,12 Months
Value of volunteer work,
12 Months
Total population
, both sexes
Number of volunteers
Volunteer rate
Total hours volunteered
Value of volunteer
work
Total population
, both sexes
Number of volunteers
Volunteer rate
Total hours volunteered
Value of volunteer
work
Thousand % Thousand R'000 Thousand % Thousand R'000 Thousand % Thousand R'000
2 010 2 014 Change
Education status 35 332 1 308 3,7 419 241 8 379 948 38 159 2 206 5,8 610 478 9 871 776 2 827 898 2,1 191 237 1 491 829
No schooling 2 155 49 2,3 14 696 199 938 1 960 112 5,7 22 001 246 597 -194 63 3,5 7 305 46 659
Less than primary completed
4 005 129 3,2 35 278 547 499 3 700 207 5,6 52 917 651 690 -305 79 2,4 17 639 104 191
Primary completed 2 224 69 3,1 19 025 445 533 1 945 87 4,5 18 473 267 374 -279 18 1,4 -552 -178 159
Secondary not completed 14 672 452 3,1 147 714 2 354 472 16 070 797 5,0 233 900 3 740 511 1 398 345 1,9 86 185 1 386 039
Secondary completed 8 351 298 3,6 129 232 2 749 071 9 935 541 5,4 166 231 2 703 225 1 584 243 1,9 36 999 -45 847
Tertiary 3 500 307 8,8 71 850 2 063 229 4 158 442 10,6 112 378 2 205 587 658 134 1,8 40 528 142 358
Other 425 3 0,7 1 446 20 206 390 19 4,9 4 578 56 793 -35 16 4,1 3 132 36 587
Province 35 332 1 308 3,7 419 241 8 379 948 38 159 2 206 5,8 610 478 9 871 776 2 827 898 2,1 191 237 1 491 829
Western Cape 4 115 224 5,4 69 157 1 856 431 4 530 219 4,8 72 711 1 291 785 415 -5 -0,6 3 555 -564 646
Eastern Cape 4 298 118 2,8 32 417 772 055 4 480 334 7,5 75 609 1 059 474 182 216 4,7 43 192 287 419
Northern Cape 780 50 6,4 10 549 206 609 827 51 6,2 9 242 207 035 47 1 -0,2 -1 308 426
Free state 1 942 140 7,2 34 235 575 483 2 007 164 8,2 26 947 550 728 66 24 1,0 -7 288 -24 755
KwaZulu-Natal 6 680 117 1,8 46 496 855 915 7 136 393 5,5 106 221 1 565 124 456 276 3,8 59 725 709 210
North West 2 378 34 1,4 18 014 278 238 2 565 137 5,3 46 052 565 760 187 103 3,9 28 038 287 523
Gauteng 8 990 343 3,8 132 168 2 493 552 9 939 506 5,1 135 606 2 440 361 950 163 1,3 3 437 -53 192
Mpumalanga 2 649 54 2,0 32 117 640 325 2 883 125 4,3 75 508 1 310 500 234 71 2,3 43 391 670 175
Limpopo 3 500 228 6,5 44 086 701 340 3 791 276 7,3 62 582 881 009 291 48 0,8 18 496 179 668

Statistics South Africa P0211.3
Volunteer Activity Survey, 2014
18
Table 1: Volunteer rate, number of volunteers, volunteer hours, and value of volunteering, by type of volunteering and volunteer characteristics for men
Volunteer characteristics
Total, both sexes
Total
population,
both sexes
Number of
volunteers
Volunteer
rate
Total hours
volunteered
Value of
volunteer
work
Total
population
, both
sexes
Number of
volunteers
Volunteer
rate
Total hours
volunteered
Value of
volunteer
work
Total
population
, both
sexes
Number of
volunteers
Volunteer
rate
Total hours
volunteered
Value of
volunteer
work
Thousand % Thousand R'000 Thousand % Thousand R'000 Thousand % Thousand R'000
2 010 2 014 Change
Population group 16 917 480 2,8 133 333 3 286 924 18 389 866 4,7 255 925 5 058 354 1 472 386 1,9 122 592 1 771 430
African/Black 13 021 300 2,3 97 212 2 227 123 14 364 657 4,6 212 055 4 156 724 1 344 358 2,3 114 843 1 929 600
Coloured 1 564 58 3,7 12 496 398 996 1 677 57 3,4 14 525 315 821 113 -1 -0,3 2 029 -83 175
Indian/Asian 494 19 3,9 5 324 165 668 532 24 4,5 5 354 62 722 39 5 0,7 31 -102 947
White 1 839 103 5,6 18 301 495 136 1 815 127 7,0 23 990 523 087 -23 24 1,4 5 689 27 951
Age 16 917 480 2,8 133 333 3 286 924 18 389 866 4,7 255 925 5 058 354 1 472 386 1,9 122 592 1 771 430
15-24 4 994 47 0,9 15 071 252 022 5 150 125 2,4 40 571 670 351 156 78 1,5 25 499 418 329
25-34 4 361 102 2,3 30 887 761 783 4 713 225 4,8 57 011 1 053 179 351 124 2,5 26 124 291 395
35-44 3 192 124 3,9 32 459 794 246 3 660 200 5,5 78 331 1 748 120 468 76 1,6 45 872 953 874
45-54 2 170 105 4,8 24 614 533 807 2 340 161 6,9 37 799 707 079 170 56 2,1 13 185 173 272
55-64 1 327 67 5,0 17 531 499 146 1 519 98 6,4 26 628 647 018 193 31 1,4 9 096 147 872
65+ 872 36 4,1 12 771 445 920 1 007 57 5,6 15 586 232 608 135 21 1,5 2 815 -213 312
Marital Status 16 917 480 2,8 133 333 3 286 924 18 389 866 4,7 255 925 5 058 354 1 472 386 1,9 122 592 1 771 430
Married 5 159 276 5,4 66 629 1 952 939 5 452 350 6,4 88 529 1 867 082 292 74 1,1 21 901 -85 856
Living together like husband
and wife 1 500 38 2,5 12 815 185 706 1 561 83 5,3 21 543 329 583 61 45 2,8 8 728 143 877
Widow/Widower 401 18 4,6 3 734 119 738 422 20 4,8 13 956 369 201 22 2 0,2 10 221 249 463
Divorced/Separated 326 24 7,5 5 951 137 360 345 30 8,8 4 863 70 409 19 6 1,3 -1 089 -66 950
Never married 9 531 123 1,3 44 204 891 182 10 610 382 3,6 127 034 2 422 078 1 079 259 2,3 82 830 1 530 896

Statistics South Africa P0211.3
Volunteer Activity Survey, 2014
19
Table 1: Volunteer rate, number of volunteers, volunteer hours, and value of volunteering, by type of volunteering and volunteer characteristics for men (Concluded)
Volunteer characteristics
Total, both sexes
Total
population,
both sexes
Number of
volunteers Volunteer rate
Total hours
volunteered
Value of
volunteer
work
Total
population,
both sexes
Number of
volunteers
Volunteer
rate
Total hours
volunteered
Value of
volunteer
work
Total
population,
both sexes
Number of
volunteers
Volunteer
rate
Total hours
volunteered
Value of
volunteer
work
Thousand % Thousand R'000 Thousand % Thousand R'000 Thousand % Thousand R'000
2 010 2 014 Change
Education status 16 917 480 2,8 133 333 3 286 924 18 389 866 4,7 255 925 5 058 354 1 472 386 1,9 122 592 1 771 430
No schooling 773 11 1,5 3 026 44 682 722 30 4,2 4 993 62 367 -52 19 2,7 1 967 17 685
Less than primary
completed 1 940 41 2,1 10 796 232 984 1 780 84 4,7 22 394 310 816 -160 43 2,6 11 598 77 832
Primary completed 1 102 26 2,4 7 765 292 176 982 34 3,5 4 826 59 577 -119 8 1,1 -2 939 -232 599
Secondary not
completed 7 037 138 2,0 40 814 762 011 7 916 292 3,7 90 466 1 840 257 878 153 1,7 49 652 1 078 245
Secondary completed 4 142 113 2,7 36 556 825 328 4 768 212 4,5 79 334 1 461 128 626 100 1,7 42 778 635 800
Tertiary 1 674 148 8,9 33 048 1 110 570 2 019 211 10,5 53 021 1 308 884 345 63 1,6 19 974 198 314
Other 249 2 0,8 1 329 19 173 203 2 0,9 891 15 326 -46
0,0 -438 -3 847
Province 16 917 480 2,8 133 333 3 286 924 18 389 866 4,7 255 925 5 058 354 1 472 386 1,9 122 592 1 771 430
Western Cape 1 987 104 5,2 22 531 728 151 2 177 96 4,4 30 540 679 373 190 -8 -0,8 8 010 -48 778
Eastern Cape 1 942 38 1,9 10 109 335 308 2 059 131 6,4 31 757 438 783 117 94 4,4 21 649 103 475
Northern Cape 343 16 4,6 3 862 90 932 390 17 4,4 3 953 129 428 47 1 -0,2 92 38 495
Free state 921 44 4,8 12 150 236 333 982 62 6,3 12 443 323 749 61 18 1,5 294 87 417
KwaZulu-Natal 3 104 44 1,4 14 552 289 285 3 359 161 4,8 41 121 741 213 255 117 3,4 26 569 451 928
North West 1 164 9 0,8 3 600 80 252 1 236 63 5,1 15 453 211 502 72 54 4,3 11 853 131 250
Gauteng 4 619 131 2,8 45 947 1 102 461 4 999 213 4,3 61 882 1 370 726 380 81 1,4 15 934 268 265
Mpumalanga 1 234 17 1,4 7 720 173 005 1 418 39 2,8 37 279 800 216 184 23 1,4 29 559 627 210
Limpopo 1 603 77 4,8 12 863 251 196 1 769 83 4,7 21 497 363 364 166 6 -0,1 8 633 112 168

Statistics South Africa P0211.3
Volunteer Activity Survey, 2014
20
Table 1: Volunteer rate, number of volunteers, volunteer hours, and value of volunteering, by type of volunteering and volunteer characteristics for women
Volunteer
characteristics
Total, both sexes
Total
population
,both
sexes
Number of
volunteers
Volunteer
rate
Total
hours
volunteere
d
Value of
volunteer
work
Total
population
,both
sexes
Number of
volunteers
Volunteer
rate
Total hours
volunteered
Value of
volunteer
work
Total
population
,both
sexes
Number of
volunteers
Volunte
er rate
Total hours
volunteered
Value of
volunteer
work
Thousand % Thousand R'000 Thousand % Thousand R'000 Thousand % Thousand R'000
2 010 2 014 Change
Population group 18 415 828 4,5 285 908 5 093 024 19769 1340 6,8 354 553 4 813 422 1 354 512 2,3 68 645 -279 602
African/Black 14 236 598 4,2 229 793 3 824 336 15450 1053 6,8 273 873 3 703 227 1 213 455 2,6 44 080 -121 109
Coloured 1 718 82 4,8 20 826 501 246 1839 94 5,1 38 418 523 680 121 12 0,3 17 591 22 434
Indian/Asian 494 16 3,3 3 579 99 508 524 34 6,5 6 031 100 555 30 18 3,2 2 452 1 046
White 1 967 132 6,7 31 709 667 933 1957 159 8,1 36 232 485 961 -11 27 1,4 4 522 -181 973
Age 18 415 828 4,5 285 908 5 093 024 19769 1340 6,8 354 553 4 813 422 1 354 512 2,3 68 645 -279 602
15-24 4 931 76 1,5 21 638 427 319 5103 143 2,8 41 339 648 429 172 67 1,3 19 702 221 110
25-34 4 372 190 4,3 68 532 1 113 346 4593 302 6,6 80 272 1 073 556 221 112 2,2 11 739 -39 790
35-44 3 428 222 6,5 94 925 1 788 021 3746 332 8,9 86 402 1 164 023 318 110 2,4 -8 523 -623 998
45-54 2 488 191 7,7 54 901 994 776 2669 295 11,1 71 058 964 855 180 104 3,4 16 157 -29 921
55-64 1 617 102 6,3 33 785 528 038 1839 167 9,1 52 656 677 663 222 66 2,8 18 871 149 625
65+ 1 578 48 3,0 12 127 241 524 1819 101 5,6 22 826 284 896 242 53 2,5 10 699 43 372
Marital Status 18 415 828 4,5 285 908 5 093 024 19769 1340 6,8 354 553 4 813 422 1 354 512 2,3 68 645 -279 602
Married 5 355 369 6,9 117 337 2 082 631 5527 476 8,6 116 968 1 610 737 172 107 1,7 -369 -471 893
Living together like husband and
wife 1 538 69 4,5 38 861 758 270 1575 104 6,6 26 708 331 287 37 34 2,1 -12 153 -426 983
Widow/Widower 1 960 93 4,7 27 262 534 651 2081 176 8,5 40 135 514 044 122 84 3,7 12 872 -20 607
Divorced/Separated 609 42 6,9 13 441 210 855 593 67 11,3 18 252 243 101 -15 25 4,5 4 811 32 246
Never married 8 954 255 2,8 89 006 1 506 618 9993 516 5,2 152 490 2 114 253 1 039 261 2,3 63 483 607 635

Statistics South Africa P0211.3
Volunteer Activity Survey, 2014
21
Table 1: Volunteer rate, number of volunteers, volunteer hours, and value of volunteering, by type of volunteering and volunteer characteristics for women (concluded)
Volunteer characteristics
Total, both sexes
Total population, both sexes
Number of volunteers
Volunteer rate
Total hours volunteered
Value of volunteer work
Total population, both sexes
Number of volunteers
Volunteer rate
Total hours volunteered
Value of volunteer work
Total population, both sexes
Number of volunteers
Volunteer rate
Total hours volunteered
Value of volunteer work
Thousand % Thousand R'000 Thousand % Thousand R'000 Thousand % Thousand R'000
2 010
2 014
Change
Education status 18 415 828 4,5 285 908 5 093 024 19769 1340 6,8 354 553 4 813 422 1 354 512 2,3 68 645 -279 602
No schooling 1 381 37 2,7 11 670 155 256 1238 82 6,6 17 008 184 231 -143 45 3,9 5 339 28 975
Less than primary completed 2 066 88 4,3 24 482 314 515 1920 123 6,4 30 523 340 874 -145 35 2,2 6 041 26 359
Primary completed 1 122 43 3,8 11 260 153 357 962 53 5,5 13 647 207 797 -160 10 1,6 2 387 54 440
Secondary not completed 7 635 314 4,1 106 900 1 592 461 8155 506 6,2 143 433 1 900 255 520 192 2,1 36 533 307 794
Secondary completed 4 209 186 4,4 92 676 1 923 744 5167 329 6,4 86 897 1 242 097 958 143 1,9 -5 779 -681 647
Tertiary 1 826 159 8,7 38 802 952 659 2139 231 10,8 59 357 896 703 313 71 2,1 20 555 -55 957
Other 176 1 0,6 118 1 033 187 17 9,3 3 687 41 467 11 16 8,6 3 570 40 434
Province 18 415 828 4,5 285 908 5 093 024 19769 1340 6,8 354 553 4 813 422 1 354 512 2,3 68 645 -279 602
Western Cape 2 128 120 5,6 46 626 1 128 279 2353 123 5,2 42 171 612 411 225 3 -0,4 -4 455 -515 868
Eastern Cape 2 356 81 3,4 22 309 436 747 2420 203 8,4 43 852 620 691 65 123 5,0 21 543 183 944
Northern Cape 437 34 7,8 6 688 115 677 437 34 7,8 5 288 77 608 0,0 -1 399 -38 069
Free state 1 021 95 9,4 22 086 339 150 1025 102 9,9 14 504 226 979 4 6 0,6 -7 582 -112 171
KwaZulu-Natal 3 576 73 2,0 31 944 566 630 3777 232 6,2 65 100 823 912 201 159 4,1 33 156 257 282
North West 1 214 25 2,0 14 414 197 986 1329 74 5,5 30 599 354 258 114 49 3,5 16 185 156 273
Gauteng 4 371 212 4,9 86 221 1 391 092 4940 293 5,9 73 724 1 069 635 570 81 1,1 -12 497 -321 457
Mpumalanga 1 415 37 2,6 24 397 467 320 1465 86 5,8 38 229 510 284 50 48 3,2 13 832 42 965
Limpopo 1 897 151 8,0 31 223 450 144 2022 193 9,5 41 086 517 645 125 42 1,6 9 863 67 501

Statistics South Africa P0211.3
Volunteer Activity Survey, 2014
22
Table 2: Organisation-based volunteer work by sex and volunteer characteristics
Volunteer characteristics
Total, both sexes
Number of volunteers
Volunteer rate
Total hours volunteered
Value of volunteer
work
Number of volunteers
Volunteer rate
Total hours volunteered
Value of volunteer
work
Number of volunteers
Volunteer rate
Total hours volunteered
Value of volunteer
work
Thousand % Thousand R'000 Thousand % Thousand R'000 Thousand % Thousand R'000
2010 2014 Change
Population group 491 1,4 228 076 4 832 621 607 1,6 211 509 4 319 306 116 0,2 -16567 -513 315
African/Black 315 1,2 180 969 3 536 494 365 1,2 156 995 3 213 981 50 0,1 -23974 -322 513
Coloured 60 1,8 14 866 424 012 71 2,0 20 020 450 960 10 0,2 5154 26 948
Indian/Asian 14 1,4 4 403 168 866 21 2,0 3 958 70 820 7 0,5 -445 -98 046
White 101 2,7 27 839 703 249 150 4,0 30 536 583 546 49 1,3 2697 -119 704
Age 491 1,4 228 076 4 832 621 607 1,6 211 509 4 319 306 116 0,2 -16567 -513 315
15-24 50 0,5 20 687 405 412 79 0,8 28 836 624 815 29 0,3 8149 219 403
25-34 105 1,2 57 160 1 135 210 113 1,2 47 198 849 662 8 0,0 -9961 -285 547
35-44 142 2,1 75 981 1 577 693 132 1,8 58 391 1 186 221 -10 -0,4 -17589 -391 473
45-54 107 2,3 43 301 879 178 139 2,8 34 571 735 838 32 0,5 -8730 -143 341
55-64 52 1,8 19 484 440 712 82 2,4 33 068 757 252 30 0,7 13585 316 540
65+ 36 1,5 11 464 394 416 61 2,2 9 444 165 518 26 0,7 -2020 -228 897
Marital Status 491 1,4 228 076 4 832 621 607 1,6 211 509 4 319 306 116 0,2 -16567 -513 315
Married 252 2,4 92 728 2 221 489 304 2,8 84 679 1 807 789 52 0,4 -8049 -413 699
Living together like husband and wife 36 1,2 32 998 628 921 26 ,8 13 715 191 768 -10 -0,4 -19283 -437 153
Widow/Widower 43 1,8 17 745 351 239 48 1,9 14 794 442 767 4 0,1 -2951 91 528
Divorced/Separated 17 1,8 8 062 152 858 22 2,4 9 523 148 398 5 0,5 1461 -4 460
Never married 143 0,8 76 543 1 478 114 207 1,0 88 798 1 728 583 64 0,2 12255 250 469
Education status 491 1,4 228 076 4 832 621 607 1,6 211 509 4 319 306 116 0,2 -16567 -513 315
No schooling 9 0,4 3 696 79 109 9 0,5 1 985 32 187 0 0,1 -1712 -46 921
Less than primary completed 31 0,8 13 408 279 228 23 0,6 5 867 111 149 -8 -0,2 -7541 -168 078
Primary completed 24 1,1 8 932 202 016 11 0,6 5 446 103 230 -13 -0,5 -3486 -98 786
Secondary not completed 154 1,0 74 916 1 247 746 201 1,3 80 079 1 667 767 47 0,2 5164 420 021
Secondary completed 133 1,6 85 270 1 794 969 181 1,8 60 740 1 179 856 48 0,2 -24531 -615 114
Tertiary 138 4,0 41 687 1 228 086 171 4,1 54 206 1 182 727 33 0,2 12520 -45 359
Other 1 0,3 167 1 467 10 2,5 3 186 42 389 9 2,2 3019 40 923

Statistics South Africa P0211.3
Volunteer Activity Survey, 2014
23
Table 2: Organisation-based volunteer work by sex and volunteer characteristics (concluded)
Volunteer characteristics
Total, both sexes
Number of volunteers
Volunteer rate
Total hours volunteered
Value of volunteer
work
Number of volunteers
Volunteer rate
Total hours volunteered
Value of volunteer
work
Number of volunteers
Volunteer rate
Total hours volunteered
Value of volunteer
work
Thousand % Thousand R'000 Thousand % Thousand R'000 Thousand % Thousand R'000
2010 2014 Change
Province 491 1,4 228 076 4 832 621 607 1,6 211 509 4 319 306 116 0,2 -16 567 -51 3315
Western Cape 108 2,6 45 012 1 266 222 106 2,3 31 167 772 481 -1 -0,3 -13 845 -49 3741
Eastern Cape 65 1,5 17 252 384 004 51 1,1 15 308 385 292 -14 -0,4 -1 944 1 288
Northern Cape 9 1,2 4 597 117 563 14 1,7 3 054 100 798 5 0,6 -1 544 -16 764
Free State 27 1,4 14 479 298 127 26 1,3 6 722 205 600 -1 -0,1 -7 758 -92 526
KwaZulu-Natal 55 0,8 27 324 554 751 58 0,8 19 926 456 318 3 0,0 -7 398 -98 433
North West 12 0,5 7 588 137 042 25 1,0 23 492 304 326 13 0,5 15 905 167 285
Gauteng 124 1,4 69 992 1 308 380 211 2,1 67 903 1 339 569 87 0,7 -2 090 31 189
Mpumalanga 28 1,1 19 639 410 576 39 1,4 13 267 298 548 12 0,3 -6 372 -112 028
Limpopo 64 1,8 22 193 355 958 76 2,0 30 672 456 375 12 0,2 8 479 100 417
Note: Because a person may volunteer both for or through organisations and as help to other households, the volunteer rate and numbers of volunteers are not adding
Statistics South Africa P0211.3
Volunteer Activity Survey, 2014
24
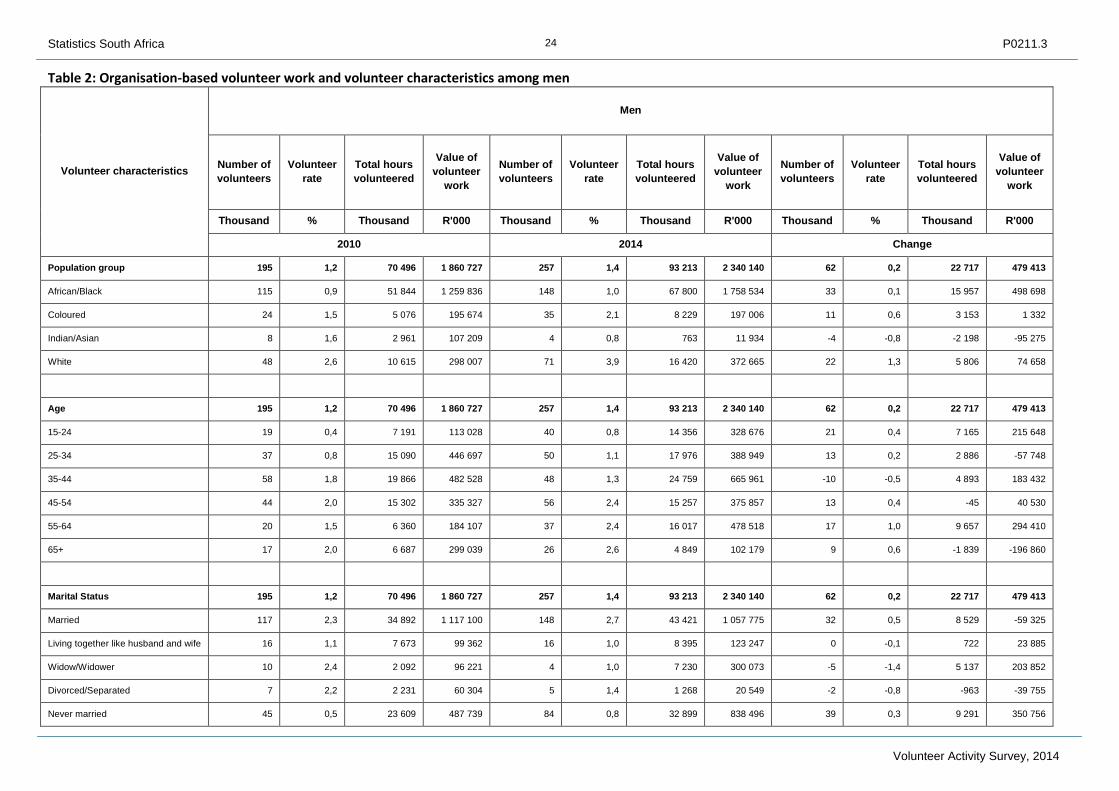
Table 2: Organisation-based volunteer work and volunteer characteristics among men
Volunteer characteristics
Men
Number of
volunteers
Volunteer
rate
Total hours
volunteered
Value of
volunteer
work
Number of
volunteers
Volunteer
rate
Total hours
volunteered
Value of
volunteer
work
Number of
volunteers
Volunteer
rate
Total hours
volunteered
Value of
volunteer
work
Thousand % Thousand R'000 Thousand % Thousand R'000 Thousand % Thousand R'000
2010 2014 Change
Population group 195 1,2 70 496 1 860 727 257 1,4 93 213 2 340 140 62 0,2 22 717 479 413
African/Black 115 0,9 51 844 1 259 836 148 1,0 67 800 1 758 534 33 0,1 15 957 498 698
Coloured 24 1,5 5 076 195 674 35 2,1 8 229 197 006 11 0,6 3 153 1 332
Indian/Asian 8 1,6 2 961 107 209 4 0,8 763 11 934 -4 -0,8 -2 198 -95 275
White 48 2,6 10 615 298 007 71 3,9 16 420 372 665 22 1,3 5 806 74 658
Age 195 1,2 70 496 1 860 727 257 1,4 93 213 2 340 140 62 0,2 22 717 479 413
15-24 19 0,4 7 191 113 028 40 0,8 14 356 328 676 21 0,4 7 165 215 648
25-34 37 0,8 15 090 446 697 50 1,1 17 976 388 949 13 0,2 2 886 -57 748
35-44 58 1,8 19 866 482 528 48 1,3 24 759 665 961 -10 -0,5 4 893 183 432
45-54 44 2,0 15 302 335 327 56 2,4 15 257 375 857 13 0,4 -45 40 530
55-64 20 1,5 6 360 184 107 37 2,4 16 017 478 518 17 1,0 9 657 294 410
65+ 17 2,0 6 687 299 039 26 2,6 4 849 102 179 9 0,6 -1 839 -196 860
Marital Status 195 1,2 70 496 1 860 727 257 1,4 93 213 2 340 140 62 0,2 22 717 479 413
Married 117 2,3 34 892 1 117 100 148 2,7 43 421 1 057 775 32 0,5 8 529 -59 325
Living together like husband and wife 16 1,1 7 673 99 362 16 1,0 8 395 123 247 0 -0,1 722 23 885
Widow/Widower 10 2,4 2 092 96 221 4 1,0 7 230 300 073 -5 -1,4 5 137 203 852
Divorced/Separated 7 2,2 2 231 60 304 5 1,4 1 268 20 549 -2 -0,8 -963 -39 755
Never married 45 0,5 23 609 487 739 84 0,8 32 899 838 496 39 0,3 9 291 350 756
Statistics South Africa P0211.3
Volunteer Activity Survey, 2014
25
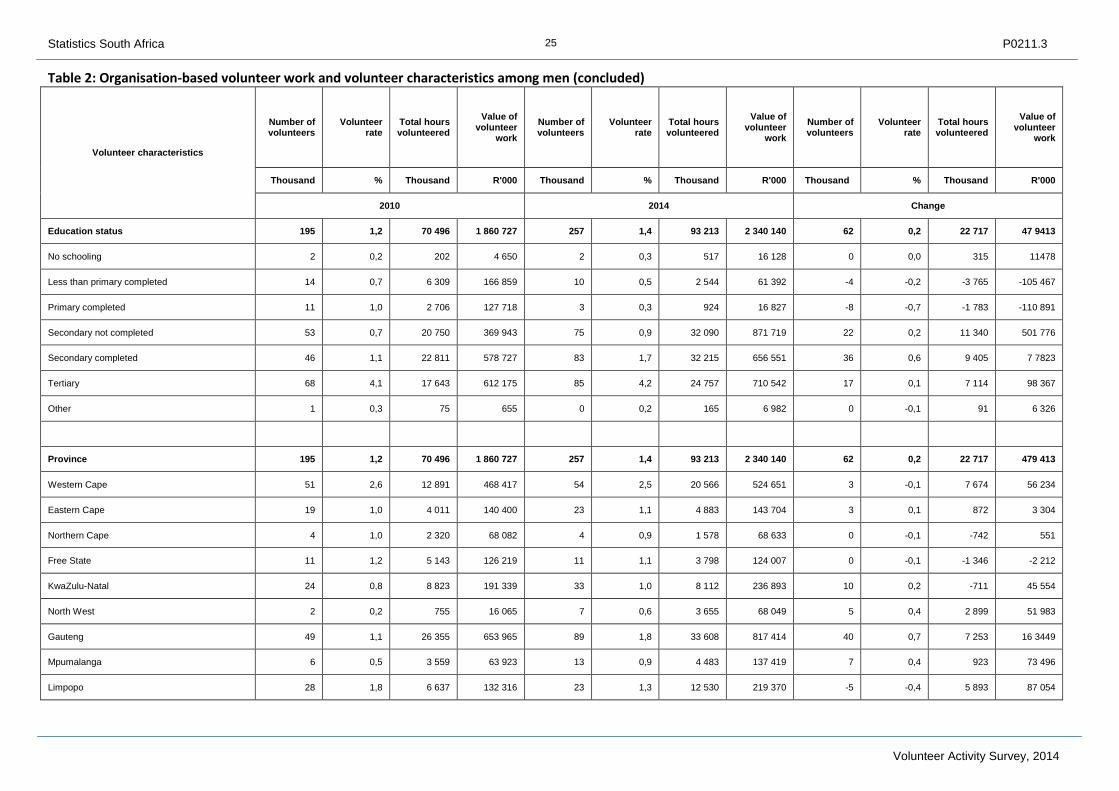
Table 2: Organisation-based volunteer work and volunteer characteristics among men (concluded)
Volunteer characteristics
Number of volunteers
Volunteer rate
Total hours volunteered
Value of volunteer
work
Number of volunteers
Volunteer rate
Total hours volunteered
Value of volunteer
work
Number of volunteers
Volunteer rate
Total hours volunteered
Value of volunteer
work
Thousand % Thousand R'000 Thousand % Thousand R'000 Thousand % Thousand R'000
2010 2014 Change
Education status 195 1,2 70 496 1 860 727 257 1,4 93 213 2 340 140 62 0,2 22 717 47 9413
No schooling 2 0,2 202 4 650 2 0,3 517 16 128 0 0,0 315 11478
Less than primary completed 14 0,7 6 309 166 859 10 0,5 2 544 61 392 -4 -0,2 -3 765 -105 467
Primary completed 11 1,0 2 706 127 718 3 0,3 924 16 827 -8 -0,7 -1 783 -110 891
Secondary not completed 53 0,7 20 750 369 943 75 0,9 32 090 871 719 22 0,2 11 340 501 776
Secondary completed 46 1,1 22 811 578 727 83 1,7 32 215 656 551 36 0,6 9 405 7 7823
Tertiary 68 4,1 17 643 612 175 85 4,2 24 757 710 542 17 0,1 7 114 98 367
Other 1 0,3 75 655 0 0,2 165 6 982 0 -0,1 91 6 326
Province 195 1,2 70 496 1 860 727 257 1,4 93 213 2 340 140 62 0,2 22 717 479 413
Western Cape 51 2,6 12 891 468 417 54 2,5 20 566 524 651 3 -0,1 7 674 56 234
Eastern Cape 19 1,0 4 011 140 400 23 1,1 4 883 143 704 3 0,1 872 3 304
Northern Cape 4 1,0 2 320 68 082 4 0,9 1 578 68 633 0 -0,1 -742 551
Free State 11 1,2 5 143 126 219 11 1,1 3 798 124 007 0 -0,1 -1 346 -2 212
KwaZulu-Natal 24 0,8 8 823 191 339 33 1,0 8 112 236 893 10 0,2 -711 45 554
North West 2 0,2 755 16 065 7 0,6 3 655 68 049 5 0,4 2 899 51 983
Gauteng 49 1,1 26 355 653 965 89 1,8 33 608 817 414 40 0,7 7 253 16 3449
Mpumalanga 6 0,5 3 559 63 923 13 0,9 4 483 137 419 7 0,4 923 73 496
Limpopo 28 1,8 6 637 132 316 23 1,3 12 530 219 370 -5 -0,4 5 893 87 054
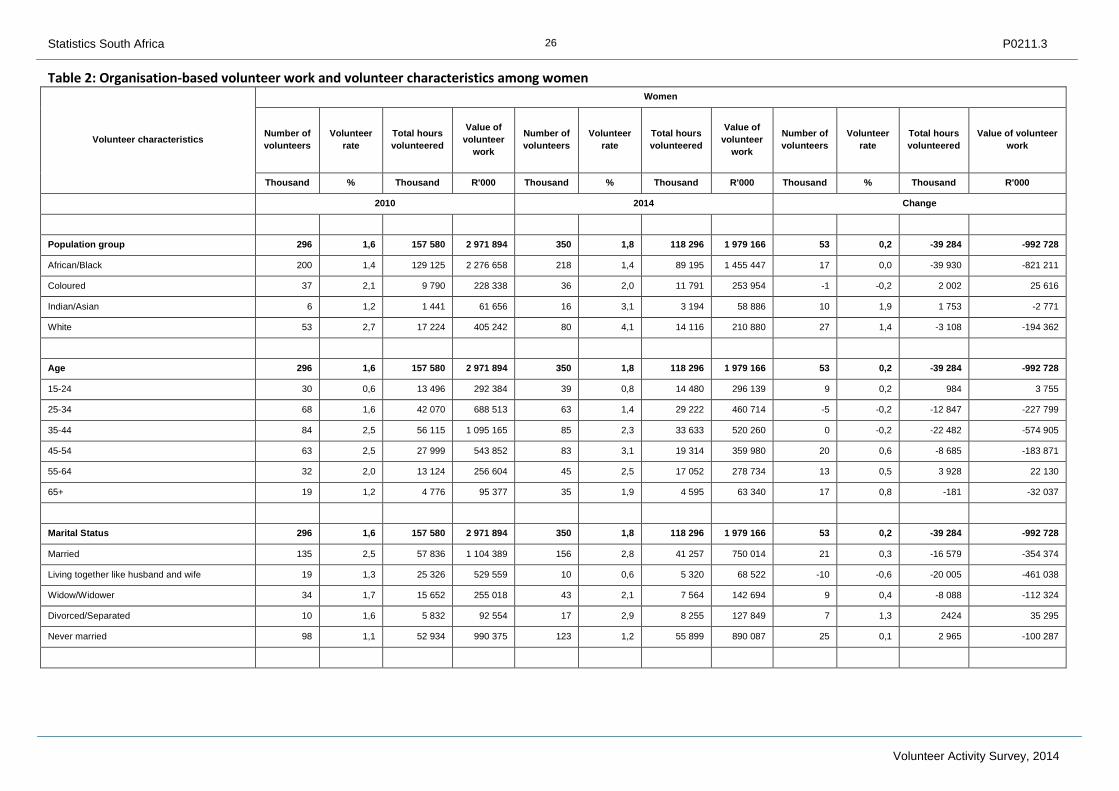
Statistics South Africa P0211.3
Volunteer Activity Survey, 2014
26
Table 2: Organisation-based volunteer work and volunteer characteristics among women
Volunteer characteristics
Women
Number of
volunteers
Volunteer
rate
Total hours
volunteered
Value of
volunteer
work
Number of
volunteers
Volunteer
rate
Total hours
volunteered
Value of
volunteer
work
Number of
volunteers
Volunteer
rate
Total hours
volunteered
Value of volunteer
work
Thousand % Thousand R'000 Thousand % Thousand R'000 Thousand % Thousand R'000
2010 2014 Change
Population group 296 1,6 157 580 2 971 894 350 1,8 118 296 1 979 166 53 0,2 -39 284 -992 728
African/Black 200 1,4 129 125 2 276 658 218 1,4 89 195 1 455 447 17 0,0 -39 930 -821 211
Coloured 37 2,1 9 790 228 338 36 2,0 11 791 253 954 -1 -0,2 2 002 25 616
Indian/Asian 6 1,2 1 441 61 656 16 3,1 3 194 58 886 10 1,9 1 753 -2 771
White 53 2,7 17 224 405 242 80 4,1 14 116 210 880 27 1,4 -3 108 -194 362
Age 296 1,6 157 580 2 971 894 350 1,8 118 296 1 979 166 53 0,2 -39 284 -992 728
15-24 30 0,6 13 496 292 384 39 0,8 14 480 296 139 9 0,2 984 3 755
25-34 68 1,6 42 070 688 513 63 1,4 29 222 460 714 -5 -0,2 -12 847 -227 799
35-44 84 2,5 56 115 1 095 165 85 2,3 33 633 520 260 0 -0,2 -22 482 -574 905
45-54 63 2,5 27 999 543 852 83 3,1 19 314 359 980 20 0,6 -8 685 -183 871
55-64 32 2,0 13 124 256 604 45 2,5 17 052 278 734 13 0,5 3 928 22 130
65+ 19 1,2 4 776 95 377 35 1,9 4 595 63 340 17 0,8 -181 -32 037
Marital Status 296 1,6 157 580 2 971 894 350 1,8 118 296 1 979 166 53 0,2 -39 284 -992 728
Married 135 2,5 57 836 1 104 389 156 2,8 41 257 750 014 21 0,3 -16 579 -354 374
Living together like husband and wife 19 1,3 25 326 529 559 10 0,6 5 320 68 522 -10 -0,6 -20 005 -461 038
Widow/Widower 34 1,7 15 652 255 018 43 2,1 7 564 142 694 9 0,4 -8 088 -112 324
Divorced/Separated 10 1,6 5 832 92 554 17 2,9 8 255 127 849 7 1,3 2424 35 295
Never married 98 1,1 52 934 990 375 123 1,2 55 899 890 087 25 0,1 2 965 -100 287

Statistics South Africa P0211.3
Volunteer Activity Survey, 2014
27
Table 2: Organisation-based volunteer work and volunteer characteristics among women (concluded)
Volunteer characteristics
Number of volunteers
Volunteer rate
Total hours volunteered
Value of volunteer
work
Number of volunteers
Volunteer rate
Total hours volunteered
Value of volunteer
work
Number of volunteers
Volunteer rate
Total hours volunteered
Value of volunteer
work
Thousand % Thousand R'000 Thousand % Thousand R'000 Thousand % Thousand R'000
2010 2014 Change
Education status 296 1,6 157 580 2 971 894 350 1,8 118 296 1 979 166 53 0,2 -39 284 -992 728
No schooling 7 0,5 3 494 74 459 7 0,6 1 468 16 059 0 0,1 -2 027 -58 400
Less than primary completed 18 0,8 7 099 112 369 13 0,7 3 323 49 757 -4 -0,2 -3 776 -62 612
Primary completed 12 1,1 6 225 74 298 8 0,8 4 522 86 403 -4 -0,3 -1 703 12 105
Secondary not completed 101 1,3 54 165 877 803 126 1,5 47 989 796 048 25 0,2 -6 176 -81 755
Secondary completed 87 2,1 62 460 1 216 242 98 1,9 28 524 523 305 12 -0,2 -33 936 -692 937
Tertiary 71 3,9 24 044 615 912 87 4,1 29 449 472 186 16 0,2 5 405 -143 726
Other 1 0,3 92 812 10 5,1 3 021 35 408 9 4,7 2 929 34 596
Province 296 1,6 157 580 2 971 894 350 1,8 118 296 1 979 166 53 0,2 -39 284 -992 728
Western Cape 57 2,7 32 120 797 804 52 2,2 10 601 247 829 -4 -0,4 -21 520 -549 975
Eastern Cape 45 1,9 13 241 243 604 28 1,2 10 424 241 588 -17 -0,8 -2 816 -2 016
Northern Cape 6 1,3 2 277 49 481 11 2,4 1 476 32 165 5 1,1 -801 -17 315
Free State 15 1,5 9 336 171 907 15 1,5 2 924 81 594 -1 -0,1 -6 412 -90 314
KwaZulu-Natal 31 0,9 18 501 363 412 25 0,7 11 814 219 425 -6 -0,2 -6 687 -143 987
North West 10 0,8 6 832 120 976 18 1,3 19 837 236 278 8 0,5 13 005 115 302
Gauteng 74 1,7 43 637 654 415 122 2,5 34 294 522 155 48 0,8 -9 343 -132 260
Mpumalanga 22 1,5 16 079 346 652 26 1,8 8 784 161 129 4 0,2 -7 296 -185 524
Limpopo 36 1,9 15 556 223 642 53 2,6 18 142 237 004 17 0,7 2 585 13 363

Statistics South Africa P0211.3
Volunteer Activity Survey, 2014
28
Table 3: Direct volunteer work by sex and selected demographic characteristics
Volunteer characteristics
Total, both sexes
Number of
volunteers
Volunteer
rate
Total hours
volunteered
Value of
volunteer
work
Number of
volunteers
Volunteer
rate
Total hours
volunteered
Value of
volunteer
work
Number of
volunteers
Volunteer
rate
Total hours
volunteered
Value of
volunteer
work
Thousand % Thousand R'000 Thousand % Thousand R'000 Thousand % Thousand R'000
2010 2014 Change
Population group 689 1,9 162 531 2 862 042 1 443 3,8 371 696 5 030 207 755 1,8 209 166 2 168 165
African/Black 516 1,9 124 462 2 016 660 1243 4,2 308 369 4 227 777 727 2,3 183 907 2 211 117
Coloured 67 2,0 15 543 381 355 72 2,0 32 242 368 389 5 0,0 16 699 -12 966
Indian/Asian 15 1,5 3 530 81 779 26 2,4 5 700 74 352 11 0,9 2 170 -7 427
White 91 2,4 18 996 382 248 103 2,7 25 385 359 690 13 0,4 6 389 -22 559
Age 689 1,9 162 531 2 862 042 1 443 3,8 371 696 5 030 207 755 1,8 209 166 2 168 165
15-24 69 0,7 14 907 235 241 164 1,6 44 540 536 454 95 0,9 29 633 301 213
25-34 157 1,8 33 638 579 731 375 4,0 83 485 1 087 208 217 2,2 49 848 507 477
35-44 171 2,6 46 178 869 978 357 4,8 102 593 1 679 791 185 2,2 56 415 809 813
45-54 162 3,5 31 598 544 839 292 5,8 69 936 861 720 130 2,4 3 8337 316 881
55-64 89 3,0 23 444 371 117 169 5,0 44 758 552 920 80 2,0 21 314 18 1803
65+ 41 1,7 12 766 261 136 87 3,1 26 385 312 114 46 1,4 13 619 50 978
Marital Status 689 1,9 162 531 2 862 042 1 443 3,8 371 696 5 030 207 755 1,8 209 166 2 168 165
Married 319 3,0 75 738 1 397 490 452 4,1 111 485 1 529 165 134 1,1 35 747 131 675
Living together like husband and wife 58 1,9 14 753 237 064 149 4,8 33 335 454 500 91 2,8 18 582 217 436
Widow/Widower 60 2,5 12 538 272 099 144 5,8 39 180 439 451 84 3,2 26 642 167 352
Divorced/Separated 40 4,3 10 311 178 146 65 6,9 13 228 158 161 24 2,6 2 917 -19 985
Never married 211 1,1 49 190 777 242 633 3,1 174 468 2 448 930 422 1,9 125 277 167 1688
Note: Because a person may volunteer both for or through organisations and as help to other households, the volunteer rate and number of volunteers are not adding

Statistics South Africa P0211.3
Volunteer Activity Survey, 2014
29
Table 3: Direct volunteer work by sex and selected demographic characteristics (concluded)
Volunteer characteristics
Total, both sexes
Number of volunteers
Volunteer rate
Total hours volunteered
Value of volunteer
work
Number of volunteers
Volunteer rate
Total hours volunteered
Value of volunteer
work
Number of volunteers
Volunteer rate
Total hours volunteered
Value of volunteer work
Thousand % Thousand R'000 Thousand % Thousand R'000 Thousand % Thousand R'000
2010 2014 Change
Education status 689 1,9 162 531 2 862 042 1 443 3,8 371 696 5 030 207 755 1,8 209 166 2 168 165
No schooling 39 1,8 10 999 120 829 98 5, 19 782 212 224 59 3,2 8 783 91 395
Less than primary completed 86 2,1 16 847 203 078 177 4,8 44 488 499 172 91 2,6 27641 296 093
Primary completed 40 1,8 6 567 101 739 74 3,8 12 887 160 642 34 2,0 6 320 58 904
Secondary not completed 266 1,8 65 142 944 094 545 3,4 142 379 1 860 617 279 1,6 77 237 916 523
Secondary completed 136 1,6 38 491 811 866 316 3,2 99 010 1 371 908 179 1,5 60 519 560 042
Tertiary 120 3,4 24 460 680 215 224 5,4 51 759 911 241 104 1,9 27 300 231 026
Other 0 0,1 25 221 9 2,4 1 392 14 403 9 2,2 1 367 14 182
Province 689 1,9 162 531 2 862 042 1 443 3,8 371 696 5 030 207 755 1,8 209 166 2 168 165
Western Cape 86 2,1 20 484 528 538 98 2,2 40 884 494 964 12 0,1 20 400 -33 574
Eastern Cape 39 0,9 11 856 311 988 269 6, 58 332 651 230 230 5,1 46476 339 242
Northern Cape 40 5,2 5 952 89 046 30 3,6 5 383 96 310 -10 -1,6 -570 7 264
Free State 108 5,5 19 199 270 545 124 6,2 17 606 253 178 16 0,6 -1593 -17 368
KwaZulu-Natal 54 0,8 15 966 263 227 317 4,4 80 510 1 045 684 262 3,6 64 544 782 457
North West 19 0,8 9 357 125 995 107 4,2 21 752 251 223 88 3,4 12 395 125 228
Gauteng 164 1,8 47 926 777 585 233 2,3 54 978 848 508 69 0,5 7 052 70 923
Mpumalanga 23 0,9 11 190 188 536 79 2,7 62 104 1 010 668 55 1,8 50 914 822 132
Limpopo 155 4,4 20 600 306 582 186 4,9 30 148 378 443 31 0,5 9 547 71 862
Note: Because a person may volunteer both for or through organisations and as help to other households, the volunteer rate and number of volunteers are not adding

Statistics South Africa P0211.3
Volunteer Activity Survey, 2014
30
Table 3: Direct volunteer work by sex and selected demographic characteristics among men
Volunteer characteristics
Men
Number of
volunteers
Volunteer
rate
Total hours
volunteered
Value of
volunteer
work
Number of
volunteers
Volunteer
rate
Total hours
volunteered
Value of
volunteer
work
Number of
volunteers
Volunteer
rate
Total hours
volunteered
Value of
volunteer work
Thousand % Thousand R'000 Thousand % Thousand R'000 Thousand % Thousand R'000
2010 2014 Change
Population group 229 1,4 48 976 1 051 256 541 2,9 145 918 2 391 433 311 1,6 96 942 1 340 178
African/Black 160 1,2 35 612 721 332 469 3,3 131 843 2 142 637 309 2,0 96 231 1 421 304
Coloured 25 1,6 5 283 122 205 21 1,3 6 084 109 859 -4 -0,3 802 -12 345
Indian/Asian 9 1,9 1 536 45 405 14 2,7 3 441 37 758 5 0,8 1 905 -7646
White 35 1,9 6 546 162 314 36 2,0 4 550 101 179 1 0,1 -1 996 -6 1135
Age 229 1,4 48 976 1 051 256 541 2,9 145 918 2 391 433 311 1,6 96 942 1 340 178
15-24 26 0,5 7 794 137 148 74 1,4 21 162 272 777 48 0,9 13 367 13 5629
25-34 53 1,2 12 132 244 921 159 3,4 34 113 507 056 106 2,2 21 982 262 135
35-44 52 1,6 9 857 222 105 134 3,6 51 162 1 052 531 82 2,0 41 305 830 426
45-54 50 2,3 7 413 170 025 90 3,9 20 288 291 602 40 1,5 12 875 121 577
55-64 31 2,4 5 957 138 785 57 3,7 9 869 161 985 25 1,4 3 912 23 200
65+ 17 1,9 5 824 138 271 27 2,6 9 324 105 481 10 0,7 3 501 -32 790
Marital Status 229 1,4 48 976 1 051 256 541 2,9 145 918 2 391 433 311 1,6 96 942 1 340 178
Married 122 2,4 23 088 554 666 168 3,1 39 530 729 165 46 0,7 16 442 174 499
Living together like husband and wife 18 1,2 3 527 64 489 58 3,7 12 313 194 946 41 2,6 8 786 130 457
Widow/Widower 9 2,1 1 627 22 689 16 3,7 6 726 69 128 7 1,5 5 099 46 439
Divorced/Separated 15 4,6 3 114 69 354 23 6,7 3 326 43 790 8 2,1 212 -25 564
Never married 66 0,7 17 620 340 057 276 2,6 84 022 1 354 404 210 1,9 66 403 101 4347
Note: Because a person may volunteer both for or through organisations and as help to other households, the volunteer rate and number of volunteers are not adding

Statistics South Africa P0211.3
Volunteer Activity Survey, 2014
31
Table 3: Direct volunteer work by sex and selected demographic characteristics among men (concluded)
Volunteer characteristics
Men
Number of
volunteers
Volunteer
rate
Total hours
volunteered
Value of
volunteer
work
Number of
volunteers
Volunteer
rate
Total hours
volunteered
Value of
volunteer
work
Number of
volunteers
Volunteer
rate
Total hours
volunteered
Value of
volunteer
work
Thousand % Thousand R'000 Thousand % Thousand R'000 Thousand % Thousand R'000
2010 2014 Change
Education status 229 1,4 48 976 1 051 256 541 2,9 145 918 2 391 433 311 1,6 96 942 13 40178
No schooling 10 1,3 2 824 40 032 27 3,8 4 424 45 656 18 2,6 1 600 5 624
Less than primary completed 25 1,3 4 013 55 782 73 4,1 19 385 229 969 48 2,8 15 372 174 187
Primary completed 12 1,1 1 643 27 341 31 3,1 3 903 42 750 19 2, 2 259 15 409
Secondary not completed 73 1,0 15 755 325 821 192 2,4 49 633 831 040 119 1,4 33 877 505 218
Secondary completed 53 1,3 12 220 206 793 114 2,4 42 831 673 222 61 1,1 30 611 466 429
Tertiary 56 3,4 12 520 395 486 103 5,1 25 017 560 452 47 1,7 12 497 164 967
Other 0,0 1 0,7 726 8 344 1 0,7 726 8 344
Province 229 1,4 48 976 1 051 256 541 2,9 145 918 2 391 433 311 1,6 96 942 1 340 178
Western Cape 39 2,0 7 403 223 074 36 1,6 9 731 145 490 -4 -0,3 2 329 -77 584
Eastern Cape 13 0,7 5 480 167 272 106 5,1 26 105 284 697 92 4,4 20 624 117 425
Northern Cape 12 3,6 1 542 22 850 11 2,9 1 928 54 901 -1 -0,7 386 32 051
Free State 30 3,3 6 639 105 086 44 4,5 6 684 123 189 14 1,2 45 18 103
KwaZulu-Natal 17 0,5 4 696 83 079 120 3,6 29 358 463 906 103 3,0 24 661 380 827
North West 6 0,5 2 777 60 313 53 4,3 11 019 133 493 47 3,8 8 242 73 181
Gauteng 57 1,2 10 958 182 026 90 1,8 20 090 401 491 32 0,6 9 132 219 466
Mpumalanga 9 0,7 4 010 107 377 25 1,7 32 686 661 832 16 1,0 28 677 554 455
Limpopo 45 2,8 5 471 100 178 57 3,2 8 316 122 433 12 0,4 2 845 22 255
Note: Because a person may volunteer both for or through organisations and as help to other households, the volunteer rate and number of volunteers are not adding

Statistics South Africa P0211.3
Volunteer Activity Survey, 2014
32
Table 3: Direct volunteer work by sex and selected demographic characteristics among women
Volunteer characteristics
Women
Number of
volunteers
Volunteer
rate
Total hours
volunteered
Value of
volunteer
work
Number of
volunteers
Volunteer
rate
Total hours
volunteered
Value of
volunteer
work
Number of
volunteers
Volunteer
rate
Total hours
volunteered
Value of
volunteer
work
Thousand % Thousand R'000 Thousand % Thousand R'000 Thousand % Thousand R'000
2010 2014 Change
Population group 459 2,5 113 555 1 810 786 903 4,6 225 778 2 638 774 443 2,1 11 2223 827 987
African/Black 356 2,5 88 850 1 295 328 774 5,0 176 526 2 085 140 418 2,5 87 676 789 813
Coloured 42 2,4 10 261 259 150 50 2,7 26 158 258 529 9 0,3 15 897 -621
Indian/Asian 6 1,2 1 994 36 374 11 2,2 2 259 36 594 6 1,0 265 220
White 56 2,8 12 450 219 934 67 3,4 20 835 258 511 11 0,6 8 385 38 576
Age 459 2,5 113 555 1 810 786 903 4,6 225 778 2 638 774 443 2,1 112 223 827 987
15-24 42 0,9 7 113 98 093 89 1,8 23 378 263 677 47 0,9 16 266 165 584
25-34 104 2,4 21 506 334 809 216 4,7 49 372 580 151 111 2,3 27 866 245 342
35-44 120 3,5 36 321 647 872 223 6,0 51 431 627 260 104 2,5 15 109 -20 612
45-54 111 4,5 24 186 374 814 201 7,5 49 648 570 118 90 3,1 25462 195 304
55-64 57 3,5 17 487 232 332 112 6,1 34 889 390 935 55 2,6 17 402 158 603
65+ 24 1,5 6 942 122 865 61 3,3 17 060 206 633 36 1,8 10 118 83 768
Marital Status 459 2,5 113 555 1 810 786 903 4,6 225 778 2 638 774 443 2,1 112 223 827 987
Married 196 3,7 52 650 842 824 284 5,1 71 954 800 000 88 1,5 19 304 -42 824
Living together like husband and wife 41 2,7 11 226 172 575 91 5,8 21 022 259 554 50 3,1 9 796 86 979
Widow/Widower 51 2,6 10 911 249 410 129 6,2 32 454 370 323 77 3,6 21 543 120 913
Divorced/Separated 25 4,2 7 197 108 792 42 7,0 9 902 114 371 16 2,8 2 706 5 579
Never married 145 1,6 31 571 437 185 357 3,6 90 446 1 094 525 212 2,0 58 875 657 341

Statistics South Africa P0211.3
Volunteer Activity Survey, 2014
33
Table 3: Direct volunteer work by sex and selected demographic characteristics among women (concluded)
Volunteer characteristics
Women
Number of volunteers
Volunteer rate
Total hours volunteered
Value of volunteer
work
Number of volunteers
Volunteer rate
Total hours volunteered
Value of volunteer
work
Number of volunteers
Volunteer rate
Total hours volunteered
Value of volunteer
work
Thousand % Thousand R'000 Thousand % Thousand R'000 Thousand % Thousand R'000
2010 2014 Change
Education status 459 2,5 113 555 1 810 786 903 4,6 225 778 2 638 774 443 2,1 1 122 23 827 987
No schooling 30 2,1 8 175 80 797 71 5,7 15 358 166 568 41 3,6 7 183 85 771
Less than primary completed 61 3,0 12 834 147 296 104 5,4 25 103 269 203 43 2,5 1 2269 121 907
Primary completed 28 2,5 4 924 74 397 44 4,5 8 984 117 892 15 2, 4 060 43 495
Secondary not completed 193 2,5 49 386 618 272 353 4,3 92 746 1 029 577 161 1,8 43 360 411 305
Secondary completed 83 2,0 26 270 605 073 202 3,9 56 178 698 686 119 1,9 29 908 93 613
Tertiary 64 3,5 11 940 284 729 121 5,7 26 742 350 789 57 2,2 14 803 66 060
Other 0 0,3 25 221 8 4,2 666 6 059 7 3,9 641 5 838
Province 459 2,5 113 555 1 810 786 903 4,6 225 778 2 638 774 443 2,1 112 223 827 987
Western Cape 47 2,2 13 081 305 464 63 2,7 31 153 349 474 16 0,5 18 072 44 010
Eastern Cape 26 1,1 6 376 144 715 163 6,7 32 228 366 532 137 5,6 25 852 221 817
Northern Cape 28 6,4 4 410 66 196 19 4,3 3 454 41 409 -9 -2,1 -956 -24 787
Free State 78 7,6 12 560 165 459 80 7,8 10 922 129 988 3 0,2 -1 638 -35 471
KwaZulu-Natal 37 1,0 11 270 180 148 197 5,2 51 153 581 778 159 4,2 39 883 401 630
North West 13 1,0 6 580 65 682 54 4,1 10 733 117 729 41 3,0 4 153 52 047
Gauteng 106 2,4 36 968 595 559 144 2,9 34 887 447 017 37 0,5 -2 081 -148 543
Mpumalanga 14 1,0 7 180 81 158 54 3,7 29 417 348 836 40 2,7 22 237 267 677
Limpopo 110 5,8 15 129 206 403 130 6,4 21 831 256 010 20 0,6 6 702 49 607
Note: Because a person may volunteer both for or through organisations and as help to other households, the volunteer rate and number of volunteers are not adding

Statistics South Africa P0211.3
Volunteer Activity Survey, 2014
34
Table 4: Volunteering directly and through organisations by both sexes combined and selected demographic characteristics
Volunteer characteristics
Number of
volunteers
Volunteer
rate
Total hours
volunteered, 12
months
Value of
volunteer
work, 12
months
Number of
volunteers
Volunteer
rate
Total hours
volunteered, 12
months
Value of
volunteer
work, 12
months
Number of
volunteers
Volunteer
rate
Total hours
volunteered,
12 months
Value of
volunteer
work, 12
months
2010 2014 Change
Thousand % Thousand R'000 Thousand % Thousand R'000 Thousand % Thousand R'000
Population group 128 0,4 28 634 685 285 155 0,4 27 273 522 263 27 0,0 -1 361 -163 021
African/Black 66 0,2 21 574 498 305 102 0,3 20 564 418 193 37 0,1 -1 010 -80 113
Coloured 13 0,4 2 914 94 875 9 0,3 680 20 153 -4 -0,1 -2 234 -74 722
Indian/Asian 7 0,7 970 14 532 12 1,1 1 727 18 105 5 0,5 757 3 572
White 43 1,1 3 176 77 572 32 0,8 4 301 65 813 -11 -0,3 1 125 -11 759
Age 128 0,4 28 634 685 285 155 0,4 27 273 522 263 27 0,0 -1 361 -163 021
15-24 5 0,0 1 114 38 688 24 0,2 8 533 157 511 20 0,2 7 419 118 822
25-34 30 0,3 8 623 160 189 40 0,4 6 599 189 864 10 0,1 -2 023 29 675
35-44 32 0,5 5 226 134 595 42 0,6 3 749 46 131 11 0,1 -1 477 -88 464
45-54 27 0,6 4 615 104 565 26 0,5 4 350 74 376 -2 -0,1 -265 -30 189
55-64 28 0,9 8 388 215 355 14 0,4 1 457 14 510 -14 -0,5 -6 931 -200 846
65+ 7 0,3 668 31 892 9 0,3 2 584 39 872 3 0,1 1 916 7 980
Marital Status 128 0,4 28 634 685 285 155 0,4 27 273 522 263 27 0,0 -1 361 -163 021
Married 75 0,7 15 499 416 591 70 0,6 9 334 140 865 -5 -0,1 -6 166 -275 725
Living together like husband and wife 13 0,4 3 924 77 991 11 0,4 1 201 14 602 -1 -0,1 -2 724 -63 389
Widow/Widower 8 0,3 714 31 050 5 0,2 117 1 027 -3 -0,1 -597 -30 023
Divorced/Separated 9 0,9 1 019 17 210 11 1,1 363 6 951 2 0,2 -656 -10 259
Never married 24 0,1 7 477 142 444 58 0,3 16 258 358 818 35 0,2 8 781 216 375

Statistics South Africa P0211.3
Volunteer Activity Survey, 2014
35
Table 4: Volunteering directly and through organisations by both sexes combined and selected demographic characteristics (concluded)
Volunteer characteristics
Number of volunteers
Volunteer rate
Total hours volunteered, 12
months
Value of volunteer work, 12 months
Number of volunteers
Volunteer rate
Total hours volunteered, 12
months
Value of volunteer work, 12 months
Number of volunteers
Volunteer rate
Total hours volunteered, 12 months
Value of volunteer work, 12 months
2010 2014 Change
Thousand % Thousand R'000 Thousand % Thousand R'000 Thousand % Thousand R'000
Education status 128 0,4 28 634 685 285 155 0,4 27 273 522 263 27 0,0 -1 361 -163 021
No schooling 1 0,0
5 0,2 234 2 186 4 0,2 234 2 186
Less than primary completed 12 0,3 5 023 65 193 8 0,2 2 563 41 369 -4 -0,1 -2 460 -23 824
Primary completed 5 0,2 3 527 141 778 1 0,1 141 3 502 -3 -0,1 -3 386 -138 276
Secondary not completed 32 0,2 7 657 162 633 51 0,3 11 441 212 128 18 0,1 3 784 49 495
Secondary completed 29 0,3 5 471 142 236 44 0,4 6 482 151 461 16 0,1 1 011 9 225
Tertiary 49 1,4 5 703 154 928 46 1,1 6 412 111 618 -2 -0,3 709 -43 309
Other 1 0,3 1 254 18 518
0,0 -1 -0,3 -1 254 -18 518
Province 128 0,4 28 634 685 285 155 0,4 27 273 522 263 27 0,0 -1 361 -163 021
Western Cape 30 0,7 3 661 61 671 15 0,3 661 24 340 -15 -0,4 -3 000 -37 331
Eastern Cape 14 0,3 3 309 76 063 15 0,3 1 969 22 952 0 0,0 -1 341 -53 110
Northern Cape 0 0,0
7 0,8 805 9 927 7 0,8 805 9 927
Free state 5 0,3 557 6 811 14 0,7 2 619 91 950 9 0,4 2 062 85 139
KwaZulu-Natal 8 0,1 3 206 37 937 19 0,3 5 785 63 123 10 0,1 2 578 25 186
North West 3 0,1 1 069 15 201 5 0,2 807 10 211 2 0,0 -262 -4 990
Gauteng 56 0,6 14 250 407 587 62 0,6 12 726 252 284 6 0,0 -1 525 -155 303
Mpumalanga 2 0,1 1 289 41 214 7 0,2 138 1 285 4 0,1 -1 151 -39 929
Limpopo 9 0,2 1 293 38 801 13 0,4 1 763 46 191 5 0,1 470 7 390

Statistics South Africa P0211.3
Volunteer Activity Survey, 2014
36
Table 4: Volunteering directly and through organisations by male combined and selected demographic characteristics
Volunteer characteristics
Number of
volunteers
Volunteer
rate
Total hours
volunteered,
12 months
Value of
volunteer work,
12 months
Number of
volunteers
Volunteer
rate
Total hours
volunteered, 12
months
Value of
volunteer work,
12 months
Number of
volunteers
Volunteer
rate
Total hours
volunteered,
12 months
Value of
volunteer
work, 12
months
2010 2014 Change
Thousand % Thousand R'000 Thousand % Thousand R'000 Thousand % Thousand R'000
Population group 56 0,3 13 861 374 941 68 0,4 16 794 326 781 12 0,0 2 933 -48 160
African/Black 24 0,2 9 756 245 955 40 0,3 12 412 255 553 16 0,1 2 656 9 599
Coloured 9 0,6 2 138 81 117 2 0,1 212 8 955 -8 -0,5 -1 926 -72 162
Indian/Asian 2 0,4 826 13 054 6 1,1 1 150 13 029 4 0,6 324 -25
White 20 1,1 1 141 34 815 20 1,1 3 020 49 243 0 0,0 1 879 14 428
Age 56 0,3 13 861 374 941 68 0,4 16 794 326 781 12 0,0 2 933 -48 160
15-24 1 0,0 86 1 846 10 0,2 5 053 68 897 9 0,2 4 967 67 051
25-34 12 0,3 3 666 70 165 17 0,4 4 922 157 174 5 0,1 1 256 87 009
35-44 14 0,4 2 736 89 612 18 0,5 2 410 29 628 5 0,1 -326 -59 984
45-54 11 0,5 1 899 28 455 15 0,6 2 254 39 619 4 0,1 355 11 164
55-64 16 1,2 5 214 176 254 4 0,3 742 6 515 -12 -0,9 -4 472 -169 738
65+ 2 0,2 260 8 610 4 0,4 1 413 24 948 2 0,2 1 153 16 338
Marital Status 56 0,3 13 861 374 941 68 0,4 16 794 326 781 12 0,0 2 933 -48 160
Married 37 0,7 8 649 281 172 34 0,6 5 577 80 142 -3 -0,1 -3 071 -201 030
Living together like husband and wife 4 0,3 1 615 21 855 8 0,5 835 11 391 4 0,3 -780 -10 465
Widow/Widower 0 0,1 15 827 1 0,1 0 0,0 -15 -827
Divorced/Separated 2 0,7 607 7 701 2 0,7 268 6 070 0 0,0 -338 -1 631
Never married 12 0,1 2 976 63 385 23 0,2 10 113 229 178 11 0,1 7 137 165 793

Statistics South Africa P0211.3
Volunteer Activity Survey, 2014
37
Table 4: Volunteering directly and through organisations by male combined and selected demographic characteristics (concluded)
Volunteer characteristics
Number of volunteers
Volunteer rate
Total hours volunteered, 12 months
Value of volunteer work, 12 months
Number of volunteers
Volunteer rate
Total hours volunteered, 12 months
Value of volunteer work, 12 months
Number of volunteer
s
Volunteer rate
Total hours volunteered, 12 months
Value of volunteer work, 12 months
2010 2014 Change
Thousand % Thousand R'000 Thousand % Thousand R'000 Thousand % Thousand R'000
Education status 56 0,3 13 861 374 941 68 0,4 16794 326 781 12 0,0 2933 -48 160
No schooling 0,0 1 0,1 52 583 1 0,1 52 583
Less than primary completed 2 0,1 473 10 343 2 0,1 465 19 455 0 0,0 -9 9 113
Primary completed 2 0,2 3 415 137 117 0 0,0 -2 -0,2 -3415 -137 117
Secondary not completed 12 0,2 4 309 66 247 25 0,3 8743 137 498 12 0,1 4435 71 251
Secondary completed 13 0,3 1 525 39 807 16 0,3 4287 131 355 3 0,0 2762 91 547
Tertiary 24 1,4 2 885 102 909 24 1,2 3247 37 891 0 -0,3 362 -65 019
Other 1 0,5 1 254 18 518 0,0 -1 -0,5 -1254 -18 518
Province 56 0,3 13 861 374 941 68 0,4 16794 326 781 12 0,0 2933 -48 160
Western Cape 13 0,7 2 237 36 660 7 0,3 243 9 232 -7 -0,4 -1993 -27 428
Eastern Cape 5 0,2 617 27 636 3 0,1 769 10 382 -2 -0,1 152 -17 254
Northern Cape 0,0 2 0,5 447 5 894 2 0,5 447 5 894
Free state 3 0,3 367 5 028 7 0,8 1962 76 553 5 0,4 1594 71 525
KwaZulu-Natal 4 0,1 1 033 14 867 8 0,2 3651 40 414 4 0,1 2619 25 547
North West 1 0,1 67 3 874 2 0,2 779 9 960 1 0,1 711 6 086
Gauteng 25 0,5 8 634 266 470 34 0,7 8183 151 821 9 0,1 -451 -114 649
Mpumalanga 1 0,1 151 1 705 1 0,1 110 965 0 0,0 -41 -740
Limpopo 4 0,2 755 18 702 4 0,2 650 21 561 0 0,0 -106 2 859

Statistics South Africa P0211.3
Volunteer Activity Survey, 2014
38
Table 4: Volunteering directly and through organisations (both) by female combined and selected demographic characteristics
Volunteer characteristics
Number of
volunteers
Volunteer
rate
Total hours
volunteered, 12
months
Value of
volunteer
work, 12
months
Number of
volunteers Volunteer rate
Total hours
volunteered, 12
months
Value of
volunteer
work, 12
months
Number of
volunteers
Volunteer
rate
Total hours
volunteered,
12 months
Value of
volunteer
work, 12
months
2010 2014 Change
Thousand % Thousand R'000 Thousand % Thousand R'000 Thousand % Thousand R'000
Population group 73 0,4 14 773 310 344 88 0,4 10 479 195 482 15 0,0 -4 294 -114 861
African/Black 41 0,3 11 818 252 350 62 0,4 8 152 162 639 21 0,1 -3 666 -89 711
Coloured 4 0,2 776 13 758 8 0,4 468 11 198 4 0,2 -308 -2 560
Indian/Asian 4 0,9 144 1 478 6 1,2 578 5 075 2 0,3 434 3 597
White 23 1,2 2 035 42 757 12 0,6 1 281 16 570 -11 -0,6 -754 -26 187
Age 73 0,4 14 773 310 344 88 0,4 10 479 195 482 15 0,0 -4 294 -114 861
15-24 3 0,1 1 028 36 843 14 0,3 3 481 88 614 11 0,2 2 452 51 771
25-34 18 0,4 4 957 90 024 23 0,5 1 677 32 691 5 0,1 -3 279 -57 333
35-44 18 0,5 2 489 44 983 24 0,6 1 339 16 504 6 0,1 -1 151 -28 480
45-54 17 0,7 2 716 76 110 11 0,4 2 096 34 756 -6 -0,3 -620 -41 353
55-64 12 0,7 3 174 39 102 10 0,6 715 7 994 -2 -0,2 -2 459 -31 108
65+ 5 0,3 408 23 282 5 0,3 1 171 14 924 1 0,0 763 -8 358
Marital Status 73 0,4 14 773 310 344 88 0,4 10 479 195 482 15 0,0 -4 294 -114 861
Married 38 0,7 6 851 135 418 36 0,7 3 756 60 723 -2 -0,1 -3 094 -74 695
Living together like husband and wife 9 0,6 2 309 56 135 3 0,2 366 3 211 -6 -0,4 -1 943 -52 924
Widow/Widower 8 0,4 699 30 223 4 0,2 117 1 027 -3 -0,2 -582 -29 195
Divorced/Separated 6 1,1 413 9 509 8 1,4 95 881 2 0,3 -318 -8 628
Never married 12 0,1 4 501 79 058 36 0,4 6 145 129 640 24 0,2 1 644 50 582

Statistics South Africa P0211.3
Volunteer Activity Survey, 2014
39
Table 4: Volunteering directly and through organisations (both) by female combined and selected demographic characteristics (concluded)
Volunteer characteristics
Number of volunteers
Volunteer rate
Total hours volunteered, 12 months
Value of volunteer work, 12 months
Number of volunteers
Volunteer rate
Total hours volunteered, 12 months
Value of volunteer work, 12 months
Number of volunteers
Volunteer rate
Total hours volunteered, 12 months
Value of volunteer work, 12 months
2010 2014 2014
Thousand % Thousand R'000 Thousand % Thousand R'000 Thousand % Thousand R'000
Education status 73 0,4 14 773 310 344 88 0,4 10 479 195 482 15 0,0 -4 294 -114 861
No schooling 1 0,1 4 0,3 183 1 603 3 0,3 183 1 603
Less than primary completed 9 0,5 4 550 54 850 6 0,3 2 098 21 914 -3 -0,1 -2 452 -32 936
Primary completed 2 0,2 111 4 661 1 0,1 141 3 502 -1 -0,1 29 -1 159
Secondary not completed 20 0,3 3 348 96 385 26 0,3 2 698 74 629 6 0,1 -650 -21 756
Secondary completed 16 0,4 3 946 102 429 28 0,6 2 195 20 106 13 0,2 -1 751 -82 323
Tertiary 24 1,3 2 818 52 018 22 1,0 3 165 73 728 -2 -0,3 347 21 709
Other 0,0
0,0 0 0,0
Province 73 0,4 14 773 310 344 88 0,4 10 479 195 482 15 0,0 -4 294 -114 861
Western Cape 17 0,8 1 424 25 011 8 0,3 418 15 108 -9 -0,4 -1 007 -9 903
Eastern Cape 10 0,4 2 692 48 427 12 0,5 1 200 12 570 2 0,1 -1 492 -35 857
Northern Cape 0 0,1 5 1,1 358 4 033 5 1,0 358 4 033
Free state 2 0,2 190 1 784 7 0,7 658 15 397 5 0,4 468 13 614
KwaZulu-Natal 5 0,1 2 174 23 070 11 0,3 2 133 22 709 6 0,2 -40 -361
North West 2 0,2 1 002 11 327 2 0,2 29 251 0 0,0 -973 -11 076
Gauteng 31 0,7 5 616 141 117 28 0,6 4 542 100 463 -3 -0,2 -1 074 -40 654
Mpumalanga 1 0,1 1 138 39 509 6 0,4 28 320 4 0,3 -1 110 -39 189
Limpopo 5 0,2 537 20 099 10 0,5 1 113 24 630 5 0,2 576 4 531
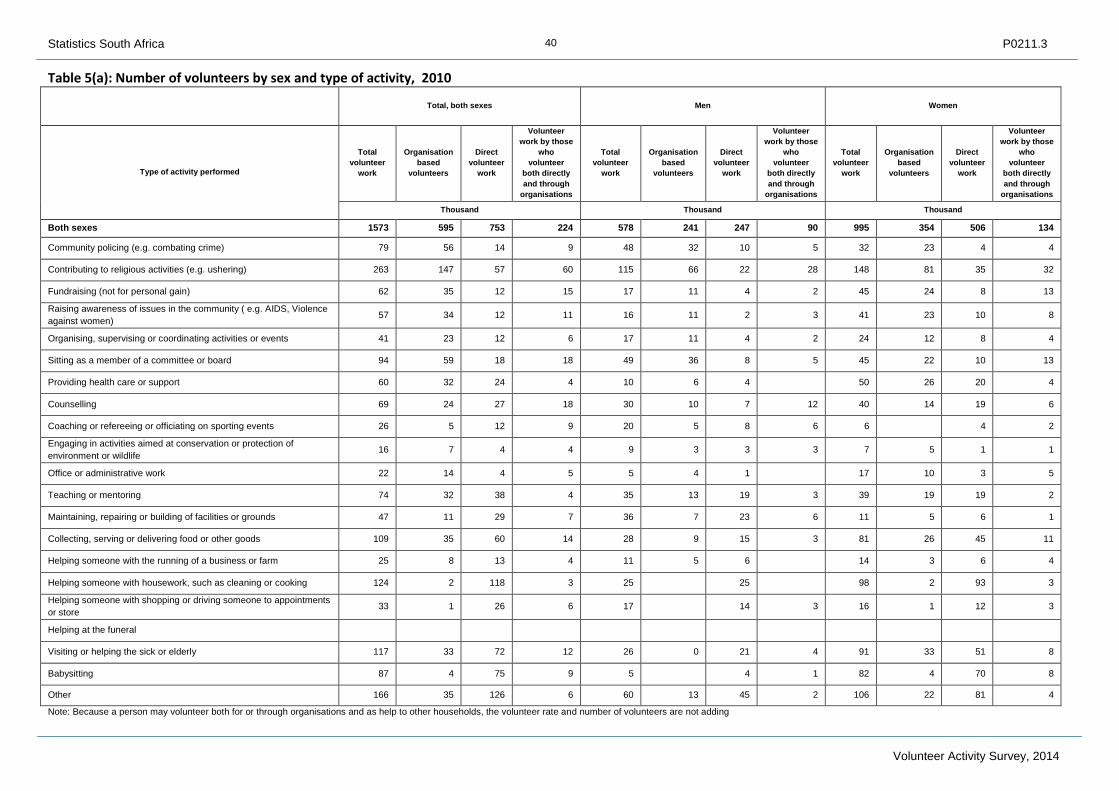
Statistics South Africa P0211.3
Volunteer Activity Survey, 2014
40
Table 5(a): Number of volunteers by sex and type of activity, 2010
Total, both sexes Men Women
Type of activity performed
Total
volunteer
work
Organisation
based
volunteers
Direct
volunteer
work
Volunteer
work by those
who
volunteer
both directly
and through
organisations
Total
volunteer
work
Organisation
based
volunteers
Direct
volunteer
work
Volunteer
work by those
who
volunteer
both directly
and through
organisations
Total
volunteer
work
Organisation
based
volunteers
Direct
volunteer
work
Volunteer
work by those
who
volunteer
both directly
and through
organisations
Thousand Thousand Thousand
Both sexes 1573 595 753 224 578 241 247 90 995 354 506 134
Community policing (e.g. combating crime) 79 56 14 9 48 32 10 5 32 23 4 4
Contributing to religious activities (e.g. ushering) 263 147 57 60 115 66 22 28 148 81 35 32
Fundraising (not for personal gain) 62 35 12 15 17 11 4 2 45 24 8 13
Raising awareness of issues in the community ( e.g. AIDS, Violence
against women) 57 34 12 11 16 11 2 3 41 23 10 8
Organising, supervising or coordinating activities or events 41 23 12 6 17 11 4 2 24 12 8 4
Sitting as a member of a committee or board 94 59 18 18 49 36 8 5 45 22 10 13
Providing health care or support 60 32 24 4 10 6 4 50 26 20 4
Counselling 69 24 27 18 30 10 7 12 40 14 19 6
Coaching or refereeing or officiating on sporting events 26 5 12 9 20 5 8 6 6 4 2
Engaging in activities aimed at conservation or protection of
environment or wildlife 16 7 4 4 9 3 3 3 7 5 1 1
Office or administrative work 22 14 4 5 5 4 1 17 10 3 5
Teaching or mentoring 74 32 38 4 35 13 19 3 39 19 19 2
Maintaining, repairing or building of facilities or grounds 47 11 29 7 36 7 23 6 11 5 6 1
Collecting, serving or delivering food or other goods 109 35 60 14 28 9 15 3 81 26 45 11
Helping someone with the running of a business or farm 25 8 13 4 11 5 6 14 3 6 4
Helping someone with housework, such as cleaning or cooking 124 2 118 3 25 25 98 2 93 3
Helping someone with shopping or driving someone to appointments
or store 33 1 26 6 17 14 3 16 1 12 3
Helping at the funeral
Visiting or helping the sick or elderly 117 33 72 12 26 0 21 4 91 33 51 8
Babysitting 87 4 75 9 5 4 1 82 4 70 8
Other 166 35 126 6 60 13 45 2 106 22 81 4
Note: Because a person may volunteer both for or through organisations and as help to other households, the volunteer rate and number of volunteers are not adding

Statistics South Africa P0211.3
Volunteer Activity Survey, 2014
41
Table 5(b): Number of volunteers by sex and type of activity, 2014
Total, both sexes Men Women
Total
volunteer
work
Organisation
based
volunteers
Direct
volunteer
work
Volunteer
work by those
who
volunteer
both directly
and through
organisations
Total
volunteer
work
Organisation
based
volunteers
Direct
volunteer
work
Volunteer
work by those
who
volunteer
both directly
and through
organisations
Total
volunteer
work
Organisation
based
volunteers
Direct
volunteer
work
Volunteer
work by those
who
volunteer
both directly
and through
organisations
Thousand Thousand Thousand
2014
Community policing (e.g. combating
crime) 71 38 22 11 51 25 17 9 20 13 6 2
Contributing to religious activities (e.g.
ushering) 328 215 69 45 120 86 23 11 208 128 46 34
Fundraising (not for personal gain) 71 27 20 25 17 5 4 9 54 22 17 16
Raising awareness of issues in the
community ( e.g. AIDS, Violence against
women)
55 31 13 11 13 8 2 3 42 23 11 7
Organising, supervising or coordinating
activities or events 51 18 19 14 29 8 11 10 22 10 8 4
Sitting as a member of a committee or
board 70 48 12 11 37 24 9 4 32 23 3 7
Providing health care or support 52 14 30 8 15 3 7 5 37 11 23 3
Counselling 57 27 18 11 21 14 4 3 35 13 14 8
Coaching or refereeing or officiating on
sporting events 47 24 21 3 39 17 19 3 9 7 2
Engaging in activities aimed at
conservation or protection of environment
or wildlife
10 7 2 1 4 2 1 1 6 5 1
Office or administrative work 29 15 6 9 10 7 2 1 19 8 4 8
Teaching or mentoring 77 37 31 8 34 17 16 2 43 21 16 7
Maintaining, repairing or building of
facilities or grounds 74 12 53 10 56 4 44 8 18 7 9 2
Collecting, serving or delivering food or
other goods 140 53 67 21 51 19 23 8 89 34 43 12
Helping someone with the running of a
business or farm 14 1 12 0 8 8 5 1 4 0
Helping someone with housework, such
as cleaning or cooking 94 6 82 6 17 2 15 77 4 67 6
Helping someone with shopping or
driving someone to appointments or store 47 1 40 6 27 22 5 20 1 18 1
Help at the funeral 846 19 799 28 301 11 280 10 545 8 519 18
Visiting or helping the sick or elderly 145 32 101 12 45 15 24 7 100 17 77 6
Babysitting 86 4 81 2 8 2 5 0 79 2 75 2
Other 127 56 53 18 63 22 29 13 64 34 24 5
Note: Because a person may volunteer both for or through organisations and as help to other households, the volunteer rate and number of volunteers are not adding

Statistics South Africa P0211.3
Volunteer Activity Survey, 2014
42
Table 5(c): Number of volunteers by sex and type of activity, 2014
Total volunteer
work
Organisation based
volunteers Direct volunteer work
Volunteer work by
those who
volunteer both
directly and
through
organisations
Changes (2014 and 2010)
Community policing (e.g. combating crime) -1501 -557 -731 -213
Contributing to religious activities (e.g.
ushering) 249 159 55 35
Fundraising (not for personal gain) -192 -120 -37 -35
Raising awareness of issues in the community
( e.g. AIDS, Violence against women) -7 -4 1 -4
Organising, supervising or coordinating
activities or events -6 -16 7 3
Sitting as a member of a committee or board 29 25 0 4
Providing health care or support -42 -44 12 -10
Counselling -4 -5 -6 7
Coaching or refereeing or officiating on
sporting events -22 0 -6 -16
Engaging in activities aimed at conservation or
protection of environment or wildlife -16 1 -9 -8
Office or administrative work 14 7 1 5
Teaching or mentoring 55 24 27 4
Maintaining, repairing or building of facilities or
grounds -1 -20 14 5
Collecting, serving or delivering food or other
goods 93 42 38 14
Helping someone with the running of a
business or farm -95 -33 -48 -14
Helping someone with housework, such as
cleaning or cooking 69 -2 70 2
Helping someone with shopping or driving
someone to appointments or store -76 -1 -78 3
Help at the funeral 813 17 773 22
Visiting or helping the sick or elderly 145 32 101 12
Babysitting -31 -29 9 -10
Other 40 52 -21 9

Statistics South Africa P0211.3
Volunteer Activity Survey, 2014
43
Table 6: Number of volunteers, volunteer hours and value of volunteering by sex, type of volunteering and occupation, 2010 and 2014
Volunteer Occupations
Total volunteer work by persons with
at least one volunteer experience
Total volunteer work by persons with at
least one volunteer experience
Total volunteer work by persons with
at least one volunteer experience
Number of
volunteers
Total hours
volunteered
Value of
volunteer
work
Number of
volunteers
Total hours
volunteered
Value of
volunteer
work
Number of
volunteers
Total hours
volunteered
Value of
volunteer
work
Thousand R'000 Thousand R'000 Thousand R'000
2010 2014 Change
Both sexes 1 308 419 241 8 379 948 2 206 610 478 9 871 776 898 191 237 1 491 829
Managers 70 16 510 921 495 13 3 385 192 424 -57 -13 125 -729 071
Professionals 61 14 292 830 934 24 3 956 230 007 -37 -10 336 -600 927
Technicians 260 69 823 2 922 826 292 86 512 3 658 031 32 16 689 735 205
Clerks 59 19 577 507 630 41 17 417 450 065 -18 -2 159 -57 566
Sales and service workers 411 154 416 1 745 663 917 228 995 2 588 763 506 74 578 843 100
Skilled agricultural and fishery workers 4 2 055 26 309 16 3 762 46 439 12 1 708 20 130
Craft and related trades workers 62 19 166 300 454 128 45 788 717 701 65 26 622 417 248
Plant and machine operators 33 8 169 112 256 60 9 620 134 226 27 1 451 21 970
Elementary occupation 468 115 233 1 012 381 865 211 043 1 854 121 397 95 810 841 741
Other
Men 480 133 333 3 286 924 866 255 925 5 058 354 386 122 592 1 771 430
Managers 32 7 078 395 034 4 2 167 123 189 -28 -4 911 -271 846
Professionals 38 8 803 511 791 14 2 676 155 579 -24 -6 127 -356 212
Technicians 118 32 434 1 357 690 166 62 967 2 662 449 48 30 533 1 304 760
Clerks 21 6 933 179 763 14 3 512 90 757 -7 -3 420 -89 006
Sales and service workers 84 25 813 291 814 208 58 435 660 597 123 32 622 368 784
Skilled agricultural and fishery workers 2 1 351 17 293 15 3 654 45 095 12 2 303 27 802
Craft and related trades workers 43 9 016 141 337 85 30 546 478 793 42 21 530 337 456
Plant and machine operators 21 4 847 66 614 40 6 560 91 530 20 1 712 24 916
Elementary occupation 164 37 059 325 587 371 85 409 750 364 207 48 350 424 777
Other

Statistics South Africa P0211.3
Volunteer Activity Survey, 2014
44
Table 6: Number of volunteers, volunteer hours and value of volunteering by sex, type of volunteering and occupation, 2010 and 2014 (concluded)
Volunteer Occupations
Total volunteer work by persons with at least one volunteer experience
Total volunteer work by persons with at least one volunteer experience
Total volunteer work by persons with at least one volunteer experience
Number of volunteers
Total hours volunteered
Value of volunteer
work
Number of volunteers
Total hours volunteered
Value of volunteer
work
Number of volunteers
Total hours volunteered
Value of volunteer
work
Thousand R'000 Thousand R'000 Thousand R'000
2010 2014 Change
Women 828 285 908 5 093 024 1 340 354 553 4 813 422 512 68 645 -279 602
Managers 39 9 432 526 461 10 1 218 69 235 -29 -8 215 -457 226
Professionals 24 5 489 319 143 10 1 280 74 428 -13 -4 209 -244 715
Technicians 142 37 389 1 565 136 126 23 546 995 582 -16 -13 844 -569 555
Clerks 38 12 644 327 867 27 13 905 359 307 -11 1 261 31 440
Sales and service workers 327 128 603 1 453 849 709 170 560 1 928 165 383 41 957 474 317
Skilled agricultural and fishery workers 2 704 9 015 1 109 1 343 -1 -595 -7 672
Craft and related trades workers 19 10 150 159 116 43 15 242 238 908 23 5 092 79 792
Plant and machine operators 12 3 321 45 642 19 3 060 42 696 7 -261 -2 946
Elementary occupation 304 78 173 686 794 493 125 634 1 103 758 190 47 460 416 964
Other
Note: Because a person may volunteer both for or through organisations and as help to other households, the volunteer rate and number of volunteers are not adding

Statistics South Africa P0211.3
Volunteer Activity Survey, 2014
45
Table 6: Number of volunteers, volunteer hours and value of volunteering by sex for organisation, type of volunteering and occupation, 2010 and 2014
Volunteer Occupations
Total volunteer work by persons with at
least one volunteer experience
Total volunteer work by persons with at
least one volunteer experience
Total volunteer work by persons with at least
one volunteer experience
Number of
volunteers
Total hours
volunteered
Value of
volunteer
work
Number of
volunteers
Total hours
volunteered
Value of
volunteer
work
Number of
volunteers
Total hours
volunteered
Value of
volunteer
work
Thousand R'000 Thousand R'000 Thousand R'000
2010 2014 Change
Both sexes 491 228 076 4 832 621 607 211 509 4 319 306 116 -16 567 -513 315
Managers 48 13 487 752 749 10 2 445 138 996 -38 -11 042 -613 754
Professionals 33 7 917 460 316 14 2 205 128 187 -19 -5 713 -332 128
Technicians 114 36 861 1 543 026 180 54 311 2 296 448 66 17 450 753 422
Clerks 37 15 436 400 248 23 12 169 314 457 -15 -3 266 -85 791
Sales and service workers 142 93 058 1 052 011 154 74 337 840 378 12 -18 720 -211 632
Skilled agricultural and fishery workers 2 1 958 25 076 -2 -1 958 -25 076
Craft and related trades workers 14 8 268 129 603 10 1 734 27 173 -4 -6 534 -102 430
Plant and machine operators 5 4 182 57 474 6 1 682 23 468 1 -2 500 -34 006
Elementary occupation 139 46 909 412 119 246 62 626 550 199 108 15 717 138 080
Other 0 0 0 3 3 0 0
Men 195 70 496 1 860 727 257 93 213 2 340 140 62 22 717 479 413
Managers 23 5 858 326 964 3 1 821 103 532 -21 -4 037 -223 432
Professionals 25 6 566 381 742 8 1 308 76 033 -17 -5 258 -305 708
Technicians 47 14 356 600 951 97 37 316 1 577 845 50 22 960 976 894
Clerks 15 6 449 167 221 7 3 109 80 326 -8 -3 340 -86 895
Sales and service workers 36 11 947 135 058 52 23 249 262 826 16 11 302 127 768
Skilled agricultural and fishery workers 1 1 254 16 061 0 -1 -1 254 -16 061
Craft and related trades workers 7 1 778 27 875 1 356 5 575 -5 -1 422 -22 300
Plant and machine operators 1 1 825 25 080 4 986 13 760 3 -839 -11 320
Elementary occupation 58 20 463 179 775 97 25 069 220 241 39 4 606 40 466
Other

Statistics South Africa P0211.3
Volunteer Activity Survey, 2014
46
Table 6: Number of volunteers, volunteer hours and value of volunteering for organisation by sex, type of volunteering and occupation, 2010 and 2014 (concluded)
Volunteer Occupations
Total volunteer work by persons with at least one volunteer experience
Total volunteer work by persons with at least one volunteer experience
Total volunteer work by persons with at least one volunteer experience
Number of volunteers
Total hours volunteered
Value of volunteer
work
Number of volunteers
Total hours volunteered
Value of volunteer
work
Number of volunteers
Total hours volunteered
Value of volunteer
work
Thousand R'000 Thousand R'000 Thousand R'000
2010 2014 Change
Women 296 157 580 2 971 894 350 118 296 1 979 166 53 -39 284 -992 728
Managers 25 7 629 425 785 7 624 35 463 -18 -7 005 -390 322
Professionals 8 1 351 78 574 6 897 52 154 -2 -454 -26 420
Technicians 67 22 505 942 075 83 16 995 718 603 16 -5 510 -223 472
Clerks 22 8 987 233 026 15 9 061 234 131 -7 74 1 104
Sales and service workers 106 81 111 916 952 102 51 089 577 552 -4 -30 022 -339 400
Skilled agricultural and fishery workers
2 704 9 015 0 -2 -704 -9 015
Craft and related trades workers 7 6 489 101 728 9 1 378 21 597 1 -5 111 -80 130
Plant and machine operators 3 2 357 32 394 2 696 9 708 -2 -1 662 -22 686
Elementary occupation 81 26 446 232 345 149 37 557 329 958 68 11 111 97 613
Other

Statistics South Africa P0211.3
Volunteer Activity Survey, 2014
47
Table 6: Number of volunteers, volunteer hours and value of volunteering directly by sex, type of volunteering and occupation, 2010 and 2014
Volunteer Occupations
Total volunteer work by persons with at
least one volunteer experience
Total volunteer work by persons with at
least one volunteer experience
Total volunteer work by persons with at
least one volunteer experience
Number of
volunteers
Total hours
volunteered
Value of
volunteer
work
Number of
volunteers
Total hours
volunteered
Value of
volunteer
work
Number of
volunteers
Total hours
volunteered
Value of
volunteer
work
Thousand R'000 Thousand R'000 Thousand R'000
2010 2014 Change
Both sexes 689 162 531 2 862 042 1 443 371 696 5 030 207 755 209 166 2 168 165
Managers 9 1 670 93 219 1 388 22 041 -8 -1 282 -71 178
Professionals 19 5 745 334 039 8 1 751 101 820 -10 -3 994 -232 219
Technicians 97 24 043 1 006 462 70 26 298 1 111 948 -27 2 254 105 486
Clerks 10 3 895 101 008 10 3 379 87 315 0 -516 -13 694
Sales and service workers 238 51 126 577 978 703 148 474 1 678 490 465 97 348 1 100 512
Skilled agricultural and fishery workers 2 96 1 233 16 3 762 46 439 14 3 666 45 206
Craft and related trades workers 43 9 464 148 353 108 43 174 676 728 65 33 710 528 375
Plant and machine operators 23 3 147 43 243 45 7 001 97 691 22 3 854 54 448
Elementary occupation 277 63 344 556 507 533 137 469 1 207 736 256 74 125 651 229
Other 0
Men 229 48 976 1 051 256 541 145 918 2 391 433 311 96 942 1 340 178
Managers 4 1 023 57 079 1 346 19 657 -4 -677 -37 422
Professionals 9 2 135 124 141 5 1 368 79 546 -4 -767 -44 596
Technicians 44 11 431 478 493 46 20 974 886 862 3 9 544 408 369
Clerks 3 442 11 450 6 404 10 431 3 -38 -1 019
Sales and service workers 43 12 034 136 039 136 30 381 343 452 93 18 347 207 413
Skilled agricultural and fishery workers 2 96 1 233 15 3 654 45 095 13 3 557 43 863
Craft and related trades workers 33 5 842 91 577 76 29 372 460 389 44 23 530 368 812
Plant and machine operators 17 2 199 30 222 31 4 637 64 703 14 2 438 34 481
Elementary occupation 84 13 775 121 021 239 54 783 481 298 156 41 008 360 277
Other 0
0 0

Statistics South Africa P0211.3
Volunteer Activity Survey, 2014
48
Table 6: Number of volunteers, volunteer hours and value of volunteering directly by sex, type of volunteering and occupation, 2010 and 2014 (concluded)
Volunteer Occupations
Total volunteer work by persons with at least one volunteer experience
Total volunteer work by persons with at least one volunteer experience
Total volunteer work by persons with at least one volunteer experience
Number of volunteers
Total hours volunteered
Value of volunteer
work
Number of volunteers
Total hours volunteered
Value of volunteer
work
Number of volunteers
Total hours volunteered
Value of volunteer
work
Thousand R'000 Thousand R'000 Thousand R'000
2010 2014 Change
Women 459 113 555 1 810 786 903 225 778 2 638 774 443 112 223 827 987
Managers 5 648 36 140 1 42 2 384 -4 -606 -33 756
Professionals 10 3 610 209 898 3 383 22 274 -7 -3 227 -187 624
Technicians 54 12 613 527 969 24 5 323 225 086 -30 -7 289 -302 883
Clerks 8 3 454 89 559 5 2 975 76 884 -3 -478 -12 675
Sales and service workers 195 39 093 441 939 567 118 094 1 335 038 372 79 001 893 099
Skilled agricultural and fishery workers
1 109 1 343 1 109 1 343
Craft and related trades workers 10 3 622 56 776 32 13 802 216 339 21 10 180 159 563
Plant and machine operators 6 948 13 021 14 2 364 32 988 8 1 417 19 967
Elementary occupation 193 49 568 435 485 293 82 686 726 437 100 33 117 290 952
Other
Note: Because a person may volunteer both for or through organisations and as help to other households, the volunteer rate and number of volunteers are not adding

Statistics South Africa P0211.3
Volunteer Activity Survey, 2014
49
Table 6: Number of volunteers, volunteer hours and value of volunteering for both (organisation and directly) by sex, type of volunteering and occupation, 2010 and 2014
Volunteer Occupations
Total volunteer work by persons with at
least one volunteer experience
Total volunteer work by persons with at
least one volunteer experience
Total volunteer work by persons with at
least one volunteer experience
Number of
volunteers
Total hours
volunteered
Value of
volunteer
work
Number of
volunteers
Total hours
volunteered
Value of
volunteer
work
Number of
volunteers
Total hours
volunteered
Value of
volunteer
work
Thousand R'000 Thousand R'000 Thousand R'000
2010 2014 Change
Both sexes 128 28 634 685 285 155 27 273 522 263 27 -1 361 -163 021
Managers 13 1 353 75 527 2 552 31 387 -11 -801 -44 139
Professionals 10 629 36 580 2 -8 -629 -36 580
Technicians 49 8 919 373 339 42 5 904 249 635 -7 -3 015 -123 703
Clerks 12 246 6 374 8 1 869 48 293 -4 1 623 41 919
Sales and service workers 31 10 232 115 674 60 6 183 69 894 29 -4 050 -45 780
Skilled agricultural and fishery workers
Craft and related trades workers 5 1 435 22 498 10 880 13 801 4 -555 -8 697
Plant and machine operators 5 840 11 539 9 936 13 067 4 97 1 528
Elementary occupation 52 4 980 43 754 86 10 948 96 186 34 5 968 52 432
Other
Men 56 13 861 374 941 68 16 794 326 781 12 2 933 -48 160
Managers 4 197 10 991 0 -4 -197 -10 991
Professionals 4 102 5 908 1 -3 -102 -5 908
Technicians 27 6 647 278 246 23 4 677 197 742 -4 -1 970 -80 504
Clerks 3 42 1 092 1 -2 -42 -1 092
Sales and service workers 5 1 833 20 716 20 4 805 54 319 14 2 972 33 603
Skilled agricultural and fishery workers 4 7 4 0 0
Craft and related trades workers 2 1 396 21 885 6 818 12 829 3 -578 -9 056
Plant and machine operators 22 823 11 312 35 936 13 067 12 113 1 755
Elementary occupation 2 822 24 791 5 557 48 824 0 2 736 24 033

Statistics South Africa P0211.3
Volunteer Activity Survey, 2014
50
Table 6: Number of volunteers, volunteer hours and value of volunteering for both (organisation and directly) by sex, type of volunteering and occupation, 2010 and 2014 (concluded)
Volunteer Occupations
Total volunteer work by persons with at least one volunteer experience
Total volunteer work by persons with at least one volunteer
experience
Total volunteer work by persons with at least one volunteer experience
Number of volunteers
Total hours volunteered
Value of volunteer
work
Number of volunteers
Total hours volunteered
Value of volunteer
work
Number of volunteers
Total hours volunteered
Value of volunteer
work
Thousand R'000 Thousand R'000 Thousand R'000
2010 2014 Change
Women 73 14 773 310 344 88 10 479 195 482 15 -4 294 -114 861
Managers 9 1 156 64 535 2 552 31 387 -7 -604 -33 148
Professionals 6 528 30 671 1 -4 -528 -30 671
Technicians 22 2 272 95 093 20 1 227 51 893 -2 -1 044 -43 200
Clerks 8 204 5 282 7 1 869 48 293 -1 1 665 43 011
Sales and service workers 26 8 400 94 958 41 1 378 15 575 15 -7 022 -79 383
Skilled agricultural and fishery workers 2 2 1 0 0
Craft and related trades workers 3 39 613 3 62 972 1 23 359
Plant and machine operators 30 17 228 51 21 -17 -228
Elementary occupation 2 159 18 964 5 391 47 362 0 3 232 28 398
Note: Because a person may volunteer both for or through organisations and as help to other households, the volunteer rate and number of volunteers are not adding

Statistics South Africa P0211.3
Volunteer Activity Survey, 2014
51
Table 7: Number of volunteers, volunteer hours and value of volunteering by sex, type of volunteering and industry, 2010 and 2014
Volunteer Industry
Number of
volunteers
Total hours
volunteered
Value of
volunteer
work
Number of
volunteers
Total hours
volunteered
Value of
volunteer
work
Number of
volunteers
Total hours
volunteered
Value of
volunteer
work
Thousand R'000 Thousand R'000 Thousand R'000
2010 2014 Change
Both sexes 619 256 710 5 517 906 762 238 782 4 841 569 143 -17 928 -676 336
Agriculture 6 3 268 39 811 4 2 404 21 251 -2 -864 -18 560
Mining
Manufacturing 4 754 20 049 3 900 12 743 -1 146 -7 305
Utilities 1 145 1 965 1 145 1 965
Construction 5 2 957 40 374 5 578 5 080 0 -2 379 -35 295
Trade 9 3 927 145 362 13 6 416 86 414 4 2 489 -58 948
Transport 4 558 5 504 7 1 319 40 540 3 761 35 036
Finance 15 3 452 69 653 9 1 442 15 802 -7 -2 010 -53 851
Services 584 241 770 5 196 946 730 225 578 4 657 774 146 -16 192 -539 172
Other 0 23 206 0 -23 -206
250 84 357 2 235 668 325 110 007 2 666 921 75 25 650 431 253
Men 3 1 730 24 648 2 674 6 049 -1 -1 056 -18 599
Agriculture 0 0 0
Mining 2 490 15 826 2 575 5 048 0 84 -10 777
Manufacturing
Utilities 3 1 504 21 586 1 241 2 118 -2 -1 263 -19 467
Construction 5 1 020 56 437 6 3 941 50 945 0 2 921 -5 492
Trade 4 558 5 504 6 623 21 890 2 65 16 386
Transport 9 1 277 28 858 -9 -1 277 -28 858
Finance 230 77 755 2 082 604 312 103 954 2 580 870 82 26 199 498 266
Services 0 23 206 0 -23 -206
Other 619 256 710 5 517 906 762 238 782 4 841 569 143 -17 928 -676 336

Statistics South Africa P0211.3
Volunteer Activity Survey, 2014
52
Table 7: Number of volunteers, volunteer hours and value of volunteering by sex, type of volunteering and industry, 2010 and 2014 (concluded)
Volunteer Industry
Number of volunteers
Total hours volunteered
Value of volunteer
work
Number of volunteers
Total hours volunteered
Value of volunteer
work
Number of volunteers
Total hours volunteered
Value of volunteer
work
Thousand R'000 Thousand R'000 Thousand R'000
2010 2014 Change
Women 369 172 353 3 282 238 437 128 775 2 174 649 69 -43 578 -1 107 589
Agriculture 3 1 538 15 164 2 1 730 15 202 0 192 38
Mining 0 0 0
Manufacturing 2 264 4 223 1 326 7 695 -1 62 3 472
Utilities 1 145 1 965 1 145 1 965
Construction 2 1 453 18 789 4 337 2 962 2 -1 116 -15 827
Trade 4 2 907 88 925 7 2 475 35 469 3 -432 -53 456
Transport 1 696 18 650 1 696 18 650
Finance 6 2 175 40 796 9 1 442 15 802 2 -733 -24 994
Services 354 164 015 3 114 342 418 121 624 2 076 903 64 -42 391 -1 037 438
Other 369 172 353 3 282 238 437 128 775 2 174 649 69 -43 578 -1 107 589
Note: Because a person may volunteer both for or through organisations and as help to other households, the volunteer rate and number of volunteers are not adding

Statistics South Africa P0211.3
Volunteer Activity Survey, 2014
53
Table 8: Organisation-based volunteer work by sex and type of organisation
Type of organisation
Number of
volunteers
Total hours
volunteered
Value of
volunteer
work
Number of
volunteers
Total hours
volunteered
Value of
volunteer
work
Number of
volunteers
Total hours
volunteered
Value of
volunteer
work
Thousand R'000 Thousand R'000 Thousand R'000
2010 2014 Change
Both sexes 608 256 687 5 516 933 762 238 782 4 841 569 143 -17 905 -675 364
Charity/Non-Profit
Organisation/NGO/CBO 210 122 144 2 486 563 142 60 088 1 020 302 -69 -62 056 -1 466 261
Religious 277 59 939 1 563 150 360 65 245 1 355 486 83 5 306 -207 665
Political 13 6 011 142 302 60 21 125 675 487 47 15 114 533 184
Union 3 595 22 242 7 857 10 907 3 262 -11 335
Private business 31 10 627 292 788 30 10 638 198 653 -1 11 -94 135
Education institution 36 12 661 402 309 43 17 478 378 821 7 4 817 -23 488
Health institution 12 8 672 131 566 11 7 145 81 865 -2 -1 527 -49 701
Economic, social and community
development - - - 36 21 178 527 038 36 21 178 527 038
Culture and recreation - - - 17 3 562 131 300 17 3 562 131 300
Fund-raising organisation - - - 6 1 769 15 544 6 1 769 15 544
Natural resource conservation and
protection - - - 5 1 362 11 970 5 1 362 11 970
Law enforcement - - - 32 13 125 118 286 32 13 125 118 286
Other government entity 61 36 038 476 013 12 9 866 127 793 -48 -26 172 -348 220
Other - - - 23 5 108 176 936 23 5 108 176 936
Don’t know - - - 3 235 11 182 3 235 11 182
Note: Because a person may volunteer both for or through organisations and as help to other households, the volunteer rate and number of volunteers are not adding

Statistics South Africa P0211.3
Volunteer Activity Survey, 2014
54
Table 8: Organisation-based volunteer work by sex and type of organisation (continued)
Type of organisation
Number of volunteers
Total hours volunteered
Value of volunteer
work
Number of volunteers
Total hours volunteered
Value of volunteer
work
Number of volunteers
Total hours volunteered
Value of volunteer
work
Thousand R'000 Thousand R'000 Thousand R'000
2010 2014 Change
Men 248 84 357 2 235 668 325 110 007 2 666 921 75 25 650 431 253
Charity/Non-Profit Organisation/NGO/CBO
91 38 899 978 785 62 22 623 482 209 -28 -16 275 -496 576
Religious 110 28 534 904 093 140 33 837 761 383 30 5 302 -142 710
Political 9 3 598 80 478 26 9 485 382 286 17 5 887 301 808
Union 1 291 8 160 2 46 522 1 -245 -7 639
Private business 14 2 666 72 542 17 6 960 136 796 4 4 295 64 254
Education institution 11 2 197 69 519 12 4 614 117 660 0 2 417 48 141
Health institution 1 453 8 385 4 2 761 34 479 3 2 308 26 095
Economic, social and community development
- - - 14 9 257 351 888 14 9 257 351 888
Culture and recreation - - - 13 2 803 101 699 13 2 803 101 699
Fund-raising organisation - - - 0
Natural resource conservation and protection
- - - 4 1 253 11 012 4 1 253 11 012
Law enforcement - - - 22 5 976 55 157 22 5 976 55 157
Other government entity 28 7 718 113 706 4 6 407 72 306 -24 -1 311 -41 401
Other - - - 15 3 938 159 126 15 3 938 159 126
Don’t know - - - 1 45 398 1 45 398
Note: Because a person may volunteer both for or through organisations and as help to other households, the volunteer rate and number of volunteers are not adding

Statistics South Africa P0211.3
Volunteer Activity Survey, 2014
55
Table 8: Organisation-based volunteer work by sex and type of organisation (concluded)
Type of organisation
Number of volunteers
Total hours volunteered
Value of volunteer
work
Number of volunteers
Total hours volunteered
Value of volunteer
work
Number of volunteers
Total hours volunteered
Value of volunteer
work
Thousand R'000 Thousand R'000 Thousand R'000
2010 2014 Change
Women 360 172 330 3 281 265 437 128 775 2 174 649 69 -43 555 -1 106 617
Charity/Non-Profit Organisation/NGO/CBO
119 83 245 1 507 778 79 37 465 538 093 -40 -45 781 -969 685
Religious 167 31 405 659 058 220 31 408 594 103 53 4 -64 954
Political 5 2 412 61 824 35 11 640 293 201 30 9 227 231 377
Union 2 304 14 082 5 811 10 385 3 507 -3 697
Private business 17 7 961 220 246 13 3 677 61 856 -5 -4 284 -158 389
Education institution 25 10 464 332 790 31 12 864 261 161 7 2 400 -71 629
Health institution 12 8 219 123 181 7 4 384 47 386 -5 -3 835 -75 795
Economic, social and community development
- - - 22 11 921 175 149 22 11 921 175 149
Culture and recreation - - - 5 760 29 601 5 760 29 601
Fund-raising organisation - - - 6 1 769 15 544 6 1 769 15 544
Natural resource conservation and protection
- - - 109 958 0 109 958
Law enforcement - - - 10 7 150 63 129 10 7 150 63 129
Other government entity 33 28 320 362 307 9 3 459 55 487 -24 -24 861 -306 820
Other - - - 8 1 170 17 810 8 1 170 17 810
Don’t know - - - 2 190 10 784 2 190 10 784
Note: Because a person may volunteer both for or through organisations and as help to other households, the volunteer rate and number of volunteers are not adding

Statistics South Africa P0211.3
Volunteer Activity Survey, 2014
56
Table 9: Number of volunteers, volunteer hours and value of volunteering by labour market status, sex and status in employment
Total volunteer work by persons with at
least one volunteer experience
Total volunteer work by persons with at
least one volunteer experience
Number of
volunteers
Total hours
volunteered
Value of
volunteer
work
Number of
volunteers
Total hours
volunteered
Value of
volunteer
work
Change-
number of
volunteers
% change
Thousand R'000 Thousand R'000 Thousand R'000
2010 2014 Change
Total volunteering population 1 308 419 241 8 379 948 2 206 610 478 9 871 776 898 68,6
Employed 635 163 431 3 897 502 931 226 354 3 945 020 297 46,8
Unemployed 193 85 909 1 496 797 344 128 281 2 322 705 151 78,1
Not economically active 480 169 901 2 985 649 930 255843 3604051 450 93,8
Discouraged work-seekers 94 48 031 640 849 187 59 995 811 147 93 99,3
Other (not economically active) 386 121 869 2 344 799 743 195 848 2 792 904 357 92,4
Both sexes 635 163 431 3 897 502 931 226 354 3 945 020 297 46,8
Employees 469 98 507 2 359 093 698 171 794 3 017 471 229 48,8
Employers 61 25 302 775 503 94 19 992 297 000 33 53,9
Own-account workers 99 36 734 726 652 136 33 856 622 488 37 37,6
Helping unpaid in a household business 6 2 888 36 255 4 713 8 061 - 2 -35,7
Men 301 71 114 1 912 200 449 119 913 2 433 347 148 49,0
Employees 218 48 693 1 284 094 322 92 834 1 924 573 104 47,9
Employers 44 10 455 286 549 73 14 922 214 332 29 65,2
Own-account workers 38 11 875 339 285 53 11 963 291 748 15 38,3
Helping unpaid in a household business 1 91 2 271 1 193 2 694 -11,3
Women 333 92 317 1 985 302 483 106 441 1 511 673 149 44,8
Employees 252 49 814 1 074 999 376 78 960 1 092 898 125 49,6
Employers 17 14 848 488 953 20 5 069 82 668 4 23,6
Own-account workers 61 24 859 387 366 83 21 892 330 740 23 37,1
Helping unpaid in a household business 4 2 797 33 983 3 520 5 367 - 2 -43,6
Note: Because a person may volunteer both for or through organisations and as help to other households, the volunteer rate and number of volunteers are not adding

Statistics South Africa P0211.3
Volunteer Activity Survey, 2014
57
Table 9: Number of volunteers, volunteer hours and value of volunteering by labour market status, sex and status in employment in the organisation based volunteering work Organisation based volunteers
Number of
volunteers
Total hours
volunteered
Value of
volunteer
work
Number of
volunteers
Total hours
volunteered
Value of
volunteer
work
Change %
change
Thousand R'000 Thousand R'000 Thousand
2010 2014
Total volunteering population 491 228 076 4 832 621 607 211 509 4 319 306 116 23,6
Employed 249 88 795 2 341 800 282 76 998 1 811 120 33 13,1
Unemployed 78 54 522 1 007 436 83 49 908 1 023 425 5 6,4
Not economically active 164 84 760 1 483 385 242 84602 1484761 78 47,8
Discouraged work-seekers 34 28 965 366 701 32 20 002 336 779 - 2 -5,3
Other (not economically active) 130 55 795 1 116 684 210 64 600 1 147 982 80 62
Both sexes 249 88 795 2 341 800 282 76 998 1 811 120 33 13,1
Employees 187 53 288 1 409 188 211 57 005 1 406 965 24 12,9
Employers 20 16 657 560 889 29 7 803 135 707 10 48,0
Own-account workers 42 18 282 360 773 41 12 107 267 712 - 1 -2,4
Helping unpaid in a household business 1 568 10 950 1 84 736 0,1
Men 130 36 085 1 031 527 148 44 994 1 198 159 18 13,8
Employees 97 27 469 755 768 107 37 418 1 033 260 10 10,0
Employers 16 5 202 165 177 23 4 819 84 230 6 39,1
Own-account workers 17 3 414 110 582 18 2 728 80 410 1 7,8
Helping unpaid in a household business
1 30 260 1
Women 120 52 709 1 310 273 134 32 005 612 960 15 12,3
Employees 90 25 820 653 420 104 19 587 373 706 14 16,0
Employers 4 11 455 395 712 7 2 984 51 477 3 87,1
Own-account workers 25 14 868 250 191 22 9 380 187 302 - 2 -9,4
Helping unpaid in a household business 1 568 10 950 1 54 476 - 1 -52,2
Note: Because a person may volunteer both for or through organisations and as help to other households, the volunteer rate and number of volunteers are not adding
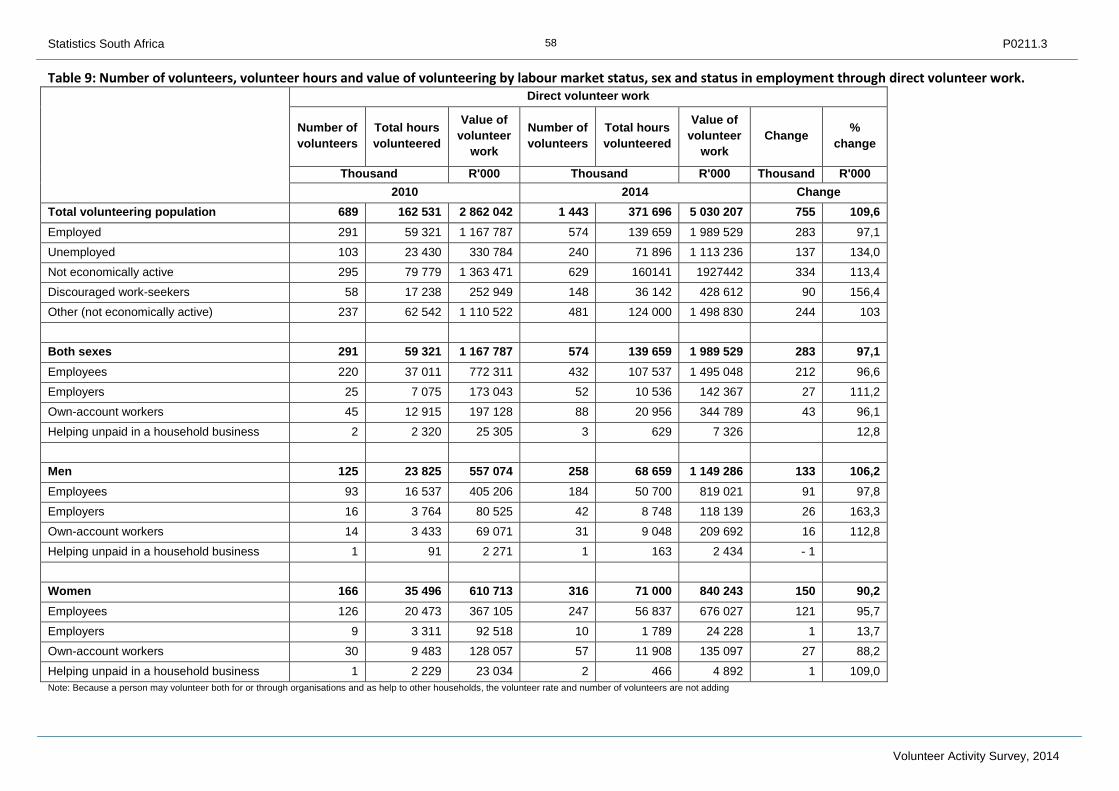
Statistics South Africa P0211.3
Volunteer Activity Survey, 2014
58
Table 9: Number of volunteers, volunteer hours and value of volunteering by labour market status, sex and status in employment through direct volunteer work. Direct volunteer work
Number of
volunteers
Total hours
volunteered
Value of
volunteer
work
Number of
volunteers
Total hours
volunteered
Value of
volunteer
work
Change %
change
Thousand R'000 Thousand R'000 Thousand R'000
2010 2014 Change
Total volunteering population 689 162 531 2 862 042 1 443 371 696 5 030 207 755 109,6
Employed 291 59 321 1 167 787 574 139 659 1 989 529 283 97,1
Unemployed 103 23 430 330 784 240 71 896 1 113 236 137 134,0
Not economically active 295 79 779 1 363 471 629 160141 1927442 334 113,4
Discouraged work-seekers 58 17 238 252 949 148 36 142 428 612 90 156,4
Other (not economically active) 237 62 542 1 110 522 481 124 000 1 498 830 244 103
Both sexes 291 59 321 1 167 787 574 139 659 1 989 529 283 97,1
Employees 220 37 011 772 311 432 107 537 1 495 048 212 96,6
Employers 25 7 075 173 043 52 10 536 142 367 27 111,2
Own-account workers 45 12 915 197 128 88 20 956 344 789 43 96,1
Helping unpaid in a household business 2 2 320 25 305 3 629 7 326 12,8
Men 125 23 825 557 074 258 68 659 1 149 286 133 106,2
Employees 93 16 537 405 206 184 50 700 819 021 91 97,8
Employers 16 3 764 80 525 42 8 748 118 139 26 163,3
Own-account workers 14 3 433 69 071 31 9 048 209 692 16 112,8
Helping unpaid in a household business 1 91 2 271 1 163 2 434 - 1
Women 166 35 496 610 713 316 71 000 840 243 150 90,2
Employees 126 20 473 367 105 247 56 837 676 027 121 95,7
Employers 9 3 311 92 518 10 1 789 24 228 1 13,7
Own-account workers 30 9 483 128 057 57 11 908 135 097 27 88,2
Helping unpaid in a household business 1 2 229 23 034 2 466 4 892 1 109,0
Note: Because a person may volunteer both for or through organisations and as help to other households, the volunteer rate and number of volunteers are not adding

Statistics South Africa P0211.3
Volunteer Activity Survey, 2014
59
Table 9: Number of volunteers, volunteer hours and value of volunteering by labour market status, sex and status in employment through both organisation and direct volunteering Both organisation and Direct Volunteering
Number of
volunteers
Total hours
volunteered
Value of
volunteer
work
Number of
volunteers
Total hours
volunteered
Value of
volunteer
work
Change %
change
Thousand R'000 Thousand R'000 Thousand %
2010 2014
Total volunteering population 128 28 634 685 285 155 27 273 522 263 27 21,3
Employed 94 15 316 387 915 76 9 697 144 371 - 18 -19,6
Unemployed 13 7 957 158 577 21 6 476 186 045 8 65,6
Not economically active 21 5 362 138 793 58 11100 191848 37 175,2
Discouraged work-seekers 2 1 829 21 199 7 3 851 45 757 5 197,5
Other (not economically active) 19 3 533 117 593 51 7 249 146 091 32 172
Both sexes 94 15 316 387 915 76 9 697 144 371 - 18 -19,6
Employees 63 8 208 177 594 55 7 252 115 458 - 7 -11,5
Employers 16 1 571 41 571 12 1 653 18 926 - 4 -24,6
Own-account workers 13 5 537 168 750 8 792 9 987 - 5 -37,7
Helping unpaid in a household business 2
- 2 -100,0
Men 46 11 204 323 599 43 6 260 85 901 - 3 -6,6
Employees 28 4 687 123 120 31 4 717 72 293 3 12,7
Employers 12 1 488 40 847 9 1 356 11 963 - 4 -29,2
Own-account workers 7 5 028 159 632 4 187 1 646 - 3 -45,5
Helping unpaid in a household business
Women 48 4 112 64 316 32 3 436 58 470 - 15 -32,2
Employees 35 3 520 54 474 24 2 535 43 166 - 11 -30,6
Employers 4 82 724 4 297 6 963 -11,5
Own-account workers 6 509 9 118 4 605 8 341 - 2 -29,0
Helping unpaid in a household business 2 - 2 -100,0 Note: Because a person may volunteer both for or through organisations and as help to other households, the volunteer rate and number of volunteers are not adding