voluntary remediation program - georgia & company, moultrie, ga may 29, 2016 voluntary...
TRANSCRIPT


Voluntary Remediation Program Semi-Annual Progress Report No. 2 Former Swift & Company Meat Processing Plant Moultrie, Colquitt County, Georgia HSI Site No. 10509 Submitted to:
Georgia Department of Natural Resources Environmental Protection Division Hazardous Sites Response and Remediation Program Suite 1054, East Tower 2 Martin Luther King Jr. Drive SE Atlanta, Georgia 30334
Prepared for:
ConAgra Foods, Inc. 1 ConAgra Drive, Omaha, Nebraska 68102
Date: May 29, 2016
Prepared by: Amec Foster Wheeler Environment & Infrastructure, Inc. 1075 Big Shanty Road NW, Suite 100, Kennesaw, Georgia 30144
Project No.: 6122140220.07.01


Swift & Company, Moultrie, GA May 29, 2016 Voluntary Remediation Program Progress Report No. 2 Amec Foster Wheeler Project 6122-14-0220
HSI Site No. 10509
i
TABLE OF CONTENTS
Page
1.0 PG CERTIFICATION ........................................................................................................ I
2.0 INTRODUCTION AND BACKGROUND ......................................................................2-1
3.0 WORK PERFORMED DURING REPORTING PERIOD ...............................................3-1
3.1 PROPERTY AFFIDAVITS UPDATE .................................................................3-1
3.2 RESPONSE TO COMMENTS – EPD LETTER DATED JANUARY 25, 2016 ....3-1
4.0 CONCLUSIONS AND RECOMMENDATIONS ............................................................4-1
5.0 NEXT SUBMITTAL ......................................................................................................5-1
FIGURES
Figure 1 Site Location Map Figure 2 Site Plan Figure 3 Proposed Monitoring Well Location
APPENDICES
Appendix A-1: September 21, 2015 Potentiometric Surface Maps Appendix A-2: Updated Fate and Transport Modeling Appendix B: Registered Professional Supporting Documentation


Swift & Company, Moultrie, GA May 29, 2016 Voluntary Remediation Program Progress Report No. 2 Amec Foster Wheeler Project 6122-14-0220
HSI Site No. 10509
2-1
2.0 INTRODUCTION AND BACKGROUND
This Voluntary Remediation Program Semi-Annual Status Report No. 1 (Status Report) was
prepared in accordance with the Voluntary Remediation Program (VRP) for the former Swift &
Company former meat processing facility site, Hazardous Site Inventory (HSI) No.10509. The
site is comprised of three qualifying properties located at 1189 North Main Street (U.S. Highway
319 Business, Georgia Highway 33) the northern part of Moultrie, Georgia, in Colquitt County.
A site location map is shown on Figure 1. The qualifying properties include:
• A 2.53 acre tract currently owned by the City of Moultrie (Tax ID Parcel M022A 005),
which represents the southernmost portion of the former 14-acre Swift & Company meat
processing facility property.
• A 2.52 acre parcel owned by the Rennie A. Tumlin Estate (Tax ID Parcel M022A 004).
• The easternmost portion of an adjoining 50.23 acre tract (Tax ID Parcel M022A 002)
which formerly contained the Former Boiler and Engine House. This tract is owned by
the Joint Development Authority (JDA) of Brooks, Colquitt, Grady, Mitchell, and Thomas
Counties
A site plan is provided in Figure 2. The western and southern boundaries of the site are
bordered by an active railroad right of way owned by Georgia & Florida RailNet, Inc. North Main
Street borders the subject properties on the east. The northern boundary of the subject
properties are bounded by property that was part of the former Swift facility. Railroad tracks and
retention ponds used by Farmland National Beef are located to the west.
While operational, the Swift & Company plant was a stockyard and meat-processing facility
where hogs, cattle, and sheep were slaughtered, butchered, and packaged for the consumer
market. The meat-processing plant was originally constructed in 1914, and operated until 1970.
After 1970, Swift & Company constructed a new facility to the west now referred to as Farmland
National Beef.
After meat processing operations ceased, the buildings remained on the property for about 30
years and were believed to have been used for storage by other property owners, among other
things. The buildings on the 2.53-acre City of Moultrie tract were demolished in 2001, and the
surface was subsequently graded and grassed. Information contained in a CSR prepared by
Advanced Environmental Technologies, LLC (AET), and information provided by City of Moultrie
representatives report the demolition debris was removed and properly disposed offsite. The
Former Boiler and Engine House were demolished in 2011. There are no activities currently
conducted on the subject properties, and the subject properties are currently located on an open
tract.
Previous investigations of the property detected volatile organic compounds (VOCs), and metals
in groundwater. A few of the constituents exceeded the Hazardous Site Response Act (HSRA)
notification concentrations. The environmental history of the site is summarized as follows:
• Assessments including soil and groundwater sampling were conducted in 1997.
• The site was listed on the Hazardous Site Inventory (HSI) on June 6, 1998 as Site No. 10509.

Swift & Company, Moultrie, GA May 29, 2016 Voluntary Remediation Program Progress Report No. 2 Amec Foster Wheeler Project 6122-14-0220
HSI Site No. 10509
2-2
• A a HSRA Compliance Status Report (CSR) Assessment was conducted in 2001-2002 that included soil and groundwater sampling and submittal of a CSR. Buildings on the property were demolished in 2001 before the HSRA CSR investigations.
• Further CSR assessment was performed in 2003 (including submittal of a Revised CSR).
• Additional field investigation was conducted in 2004-2005.
• The available 2004-2005 data were included in the September 30, 2008, Revised CSR, which also included details for the 2007 and 2008 investigations conducted by MACTEC.
• The January 29, 2010 Revised CSR responded to the subsequent EPD comments on the September 30, 2008, Revised CSR, and included information from 2009 field investigations by MACTEC.
• A Corrective Action Plan (CAP) was submitted on May 13, 2011. The proposed remedy in the CAP for the former Swift site was monitored natural attenuation (MNA).
• EPD gave Conditional Approval of the CAP In a letter dated December 12, 2011.
• The First Semiannual Corrective Action Effectiveness Report (CAER) was submitted to EPD on June 12, 2012.
• The Second Semiannual CAER was submitted to EPD on December 11, 2012.
• The Third Semiannual CAER was submitted to EPD on May 24, 2013.
• The Fourth Semiannual CAER was submitted to EPD on December 11, 2013.
• The First Annual CAER (ACAER) was submitted to EPD on February 27, 2015 as Appendix B to the Voluntary Remediation Program Application and Plan. Based on the results of the monitoring and the updated SourceDK models presented in the ACAER, and after discussions with EPD, Swift had made the decision to proceed with entering the site into the VRP.
• The EPD letter dated May 29, 2015 accepted the site into the VRP and requested submittal of semi-annual VRP status reports.
• The EPD letter dated June 4, 2015 provided comments that were addressed in a response letter dated August 31, 2015. EPD issued additional comments in a letter dated January 25, 2016 that addressed the August 31, 2015 response letter.
• The VRP Status Report No. 1 was submitted to EPD on December 8, 2015 as a semiannual progress report. The first Status Report covered the activities conducted subsequent to the EPD’s May 29, 2015 VRP acceptance letter. The first Status Report was submitted under a extension request communicated to EPD via telephone and electronic mail on November 17, 2015.

Swift & Company, Moultrie, GA May 29, 2016 Voluntary Remediation Program Progress Report No. 2 Amec Foster Wheeler Project 6122-14-0220
HSI Site No. 10509
3-1
3.0 WORK PERFORMED DURING REPORTING PERIOD
This section reports activities completed during the current six month reporting period
(December 2015 through May 2016). There were no field activities completed during this period
with the exception of removal of drummed purgewater from the sampling event conducted
during prior reporting period. Groundwater monitoring under the approved VRP is conducted on
an annual basis in the fall of each year, and groundwater sampling is planned for September
2016.
During this reporting period, ConAgra has continued working with property owners on finalizing
property affadavits required under the VRP approval. This work is described further in Section
3.1 of this Progress Report. Additionally, during this reporting period ConAgra addressed
comments contained in an EPD letter dated January 25, 2016, which was a response to to
ConAgra’s letter dated August 31, 2015. These responses are provided in Section 3.2 of this
Progress Report.
3.1 PROPERTY AFFIDAVITS UPDATE
ConAgra continues to work with site property owner’s to complete the property affidavits
required under the VRP approval. The site properties are owned by multiple parties (the City of
Moultrie, the Rennie A. Tumlin Estate and the JDA of Brooks, Colquitt, Grady, Mitchell, and
Thomas Counties). Draft Affidavits and Uniform Environmental Covenants have been circulated
and reviewed by all parties, and there is general agreement amongst the parties on the need to
deed restrict the property, but not a specific response from the land owner’s attorney on the
wording of affidavits. As soon as the affidavits are filed with the County, copies will be
submitted to EPD as required.
3.2 RESPONSE TO COMMENTS – EPD LETTER DATED JANUARY 25, 2016
Following are the EPD comments in bold, followed by ConAgra’s responses
1) Based upon historical potentiometric data, the direction of groundwater flow off site
is unclear. The topographically downgradient directions on site are to the north and
east, and impact to groundwater has historically been detected to both the north and
east of the source areas. Accordingly, EPD has determined that both the north and
east should be considered hydraulically downgradient directions:
• Potentiometric maps constructed from current groundwater-elevation data
should still be included in each semiannual report.
Response No. 1 (a) - Potentiometric maps were prepared using the September 21, 2015
groundwater elevation data and were provided in VRP Status Report No. 1. The September
21, 2015 data are still the most current groundwater elevation data. Historically, potentiometric
maps have been prepared for Shallow Zone A and Shallow Zone B. Shallow Zone A is a
perched water table zone and recharges directly to Shallow Zone B through a thin leaky
semiconfining sandy clay. Shallow Zone B has consistently displayed the same gradient flow
pattern, converging from the north and south and then transitioning to an eastward flow. The
September 21, 2015 potentiometric maps are provided for reference in Appendix A-1

Swift & Company, Moultrie, GA May 29, 2016 Voluntary Remediation Program Progress Report No. 2 Amec Foster Wheeler Project 6122-14-0220
HSI Site No. 10509
3-2
• A groundwater fate-and-transport model will have to be run in each direction
to determine that each point-of demonstration (POD) is protective of its
respective point-of exposure (POE).
Response No. 1 (b) – An update of the fate and transport modeling (BioScreen-AT) submitted in the VRP Application and Plan was prepared using the results of the September 2015 annual sampling event and provided in VRP Status Report No. 1. This updated model is provided for reference in Appendix A-2. Potentiometric data from the delineation wells proposed for installation (one replacement for MW-28 and on new) east of MW-9 and MW-15 (described below) will possibly clarify direction of groundwater flow, as mentioned in EPD’s Comment 5 of June 4, 2015. Based on this additional clarification, ConAgra will modify the groundwater fate-and-transport model to determine that each POD is protective of its respective POE. 2) Section 12-8-102(b)(11)(C) of the Act defines a point of exposure as "The hypothetical
point of drinking water exposure located at a distance of 1,000 feet downgradient
from the delineated site contamination under this part," if no existing potable wells
or likely future locations of potable wells are closer. Groundwater contamination has
not yet been delineated to the east, so no POE can be established in that direction.
Response No. 2 – ConAgra continues to pursue the installation of additional groundwater delineation wells east of MW-15, across U.S. Highway 319, as described in Status Report No. 1, and east of MW-9 (as described in EPD Comment 3 [below]). Contingent on receiving access permission from the property owners, the proposed wells will be installed and included in the groundwater monitoring plan. Additional details are also provided in the response to EPD Comment 3 (below). 3) At least two delineation wells will be required east of MW-9 and MW-15. Accordingly:
• A delineation well is needed at or east of the former location of MW-28 (east of
MW-9). EPD will not accept data from the 2004 and 2007 sampling events as
proof of delineation. Recent groundwater data will be required.
• If owners of properties immediately east of the site deny access, locations
should be sought farther to the east. Property owners who deny access may
be required to submit a Compliance Status Report, or to otherwise enter into
an environmental covenant restricting groundwater use on their properties.
Response No. 3 – On behalf of ConAgra, Amec Foster Wheeler is initiating contact with offsite
owners and will move ahead with obtaining access permission and performing installation of
two offsite monitoring wells as follows: 1) a replacement offsite well for former monitoring well
MW-28 (east of onsite well MW-9), and 2) a second offsite well east of MW-15. Contact with
the offsite property owners and/or other parties (e.g. DOT), if required, will be made to secure
appropriate access agreements. It is anticipated that these monitoring wells will be installed
prior to, and sampled during, the next annual monitoring event scheduled for September 2016.
The proposed locations of the monitoring wells are provided on Figure 3.

Swift & Company, Moultrie, GA May 29, 2016 Voluntary Remediation Program Progress Report No. 2 Amec Foster Wheeler Project 6122-14-0220
HSI Site No. 10509
3-3
A hypothetical POE was identified in Status Report No. 1 based on previous delineation data
from former monitoring well MW-28. Revision of this POE based on sampling of the two
proposed offsite wells will be addressed in Status Report No. 3 (November 29, 2016).
4) EPD questions the choice of MW-9 as a point-of-demonstration (POD) well, given that
the lead concentration in MW-9 has historically been above the Type 1 RRS for that
substance. The purpose of a POD well is to demonstrate that groundwater
concentrations are protective of the downgradient POE. One of the required
delineation wells east of MW-9 and MW-15 could possibly serve as a POD well, if
delineation is achieved.
Response No. 4 - ConAgra agrees that one of the proposed delineation wells east of MW-9 and
MW-15 could possibly serve as a POD well, if delineation is achieved.
5) Pursuant to Comment 1 above, please specify a POE in the northern downgradient
direction. A POD well will also be required in the northern downgradient direction.
Existing impacted wells on the northern portion of the site may be evaluated for
selection of a possible POD. If no existing well is deemed suitable for a POD to the
north, installation of one or more additional wells will be required.
Response No. 5 - Potentiometric data from the proposed delineation wells east of MW-9 and
MW-15 will possibly clarify direction of groundwater flow, as mentioned in EPD’s Comment 5 of
June 4, 2015. Based on this additional clarification, ConAgra will specify a POE and a POD well
in the northern downgradient direction, if required.
6) On the Monitoring Well Location Map provided with the response letter, the northern
boundary of the 2.52-acre Tumlin property is cut off. In future submittals, please
expand the depicted area on the ground to include the entirety of the City of Moultrie
and Tumlin parcels (those two parcels comprise the portion of the site currently
listed on the State of Georgia Hazardous Site Inventory).
Response No. 6 - A revised Figure showing the full extent of the Tumlin property is provided as
Figure 2. The full extent of the property has not been shown historically as the northermost
portion was outside the delineated area of impact. This figure will be utilized in future reports.

Swift & Company, Moultrie, GA May 29, 2016 Voluntary Remediation Program Progress Report No. 2 Amec Foster Wheeler Project 6122-14-0220
HSI Site No. 10509
4-1
4.0 CONCLUSIONS AND RECOMMENDATIONS
Annual groundwater sampling will continue (unless an alternative frequency is subsequently
approved by EPD) until the data demonstrate that human health and the environment are
adequately protected and EPD concurs. If the data demonstrates that a change in monitoring
frequency is warranted, modifications will be proposed in subsequent status reports. As stated
in Section 3.2 and 3.3, ConAgra will continue to to proceed with completing the property
affidavits required under the VRP approval, and will continue to pursue installation of the
additional proposed delineation wells east of MW-9 and MW-15.

Swift & Company, Moultrie, GA May 29, 2016 Voluntary Remediation Program Progress Report No. 2 Amec Foster Wheeler Project 6122-14-0220
HSI Site No. 10509
5-1
5.0 NEXT SUBMITTAL
As required by EPD’s letter dated May 29, 2015, semiannual progress reports are to submitted
to EPD November 29th and May 29th annually, beginning November 2015 and ending in 2020,
unless a CSR is submitted and approved prior to 2020. A report for the third semiannual period
is planned to be submitted by November 29th, 2016, and is planned to include discussion of the
following activities:
• Installation and sampling of two offsite monitoring wells
• Annual monitoring event (September 2016)
• Updated Source DK analysis and Bioscreen AT modeling
• Any additional activity, as required, related to pending EPD comments on Progress Report No. 1 (December 9, 2015).

Swift & Company, Moultrie, GA May 29, 2016 Voluntary Remediation Program Status Report No. 1 Amec Foster Wheeler Project 6122-14-0220
HSI Site No. 10509
FIGURES


FORMERTANK PIT
FORMER R.R.TRACKS (REMOVED)
5' SIDEWALK
SANITARY SEWER
MANHOLE (TYPICAL)
CONCRETE SLAB
STORM DRAIN (TYPICAL)
FORMER POND
STORM PIPE SANITARY SEWER
EDGE OF SIDEWALK R/WEDGE OF SIDEWALK R/W
STORM PIPESTORM PIPE
CONCRETE SLAB
(NORTH MAIN STREET)US HIGHWAY 319
8" PVC WATER
6" C.I. WATER
6" GAS
EDGE OF SIDEWALK R/W EDGE OF SIDEWALK R/W
(POSSIBLY OUT OF SERVICE)2" WATER
5' SIDEWALK
EDGE OF SIDEWALK R/W
STORM PIPE
EDGE OF SIDEWALK R/W
FORMERLARD STORAGE
FORMER CATCH BASIN
FORMER TANK HOUSE
FORMER SEWAGETREATMENT
PLANT
FORMER FERTILIZER &
STORAGE BLDG.
FORMER BOILER & ENGINE HOUSE
CISTERNPUMPSHOT
FORMER SULFURIC ACID AST
FORMER GREASE PIT
WELL
WT
WT
RAILROAD
FORMERCOOPER SHOP
RAILROADAPPROXIMATELOCATION OFMOTO - TRUCCHARGE ROOM
+
UNDERGROUND UTILITY
APPROXIMATE PROPERTY BOUNDARY
DEEP MONITORING WELL LOCATION
SOIL BORING LOCATION
SOURCES: SITE MAP PREPARED BY ADVANCED ENVIRONMENTALTECHNOLOGIES, LLC (AET) AND COLQUITT COUNTY TAX ASSESSORPARCEL MAPS
MONITORING WELL LOCATION
+ UNIDENTIFIED WELL
Amec Foster WheelerEnvironment & Infrastructure, Inc.
WELL CANNOT BE LOCATED,PRESUMED DESTROYED DURING SITEDEMOLITION/ GRADING ACTIVITIES


Swift & Company, Moultrie, GA May 29, 2016 Voluntary Remediation Program Progress Report No. 2 Amec Foster Wheeler Project 6122-14-0220
HSI Site No. 10509
APPENDIX A

Swift & Company, Moultrie, GA May 29, 2016 Voluntary Remediation Program Progress Report No. 2 Amec Foster Wheeler Project 6122-14-0220
HSI Site No. 10509
APPENDIX A-1 September 21, 2015 Potentiometric Surface Maps


Swift & Company, Moultrie, GA May 29, 2016 Voluntary Remediation Program Progress Report No. 2 Amec Foster Wheeler Project 6122-14-0220
HSI Site No. 10509
APPENDIX A-2 Updated Fate And Transport Modeling Results

Swift & Company, Moultrie, GA December 8, 2015 Voluntary Remediation Program Status Report No. 1 Amec Foster Wheeler Project 6122-14-0220
HIS Site No. 10509
BIOSCREEN-AT Model Results Former Swift Site, Moultrie, Georgia
Fate and Transport of Lead
This section presents the modeled fate and transport for lead at the former Swift site, which was
found above the screening level for groundwater in one or more wells. The screening level is
based on the Groundwater Protection Standard (GWPS) of 0.015 mg/L. This section will focus
on lead concentrations in groundwater since this form is subject to migration. The purpose of
the following assessment is to evaluate the potential for lead detected above the screening
levels to migrate beyond the current monitoring well network.
The maximum lead concentration detected in groundwater samples taken in September 2015 was at MW-18 (0.258 mg/L). Additonally, the lead concentration at MW-15 (0.243 mg/L), located on the eastern perimeter of the site, was also modeled using BIOSCREEN-AT. Lead Transport
The potential for lead in groundwater to migrate from current locations to beyond the current
monitoring well network was evaluated using the one-dimensional fate and transport model
BIOSCREEN-AT. BIOSCREEN-AT is an enhanced version of BIOSCREEN (Newell et al.,
1996) with an exact analytical solution for the transport of a contaminant (Karanovic et al.,
2007). This model is based on Microsoft Excel software that solves the widely-used analytical
Domenico equation (Karanovic et al, 2007). This equation describes transport of solute in
groundwater (inorganic or organic, decaying or non-decaying). Features within the model
designed to account for processes specific to natural attenuation of organic constituents were
not used. The model simulates advection, adsorption and three dimensional dispersion of any
dissolved constituent (inorganic or organic), and has the ability to simulate constant or decaying
sources, and contaminant degradation using degradation constants. The use of BIOSCREEN
AT was limited for this site-specific application to model only advection, dispersion, and
adsorption onto porous media since lead is an elemental contaminant that does not naturally
degrade. Processes such as degradation or other chemical/biological processes were not
included in this model. The use of this model as described above is consistent with USEPA
guidance (Ford et al, 2007), where the USEPA’s Center for Subsurface Modeling Support states
that the Domenico-basedmodels (such as BIOCHLOR, BIOSCREEN, FOOTPRINT, and
REMChlor) in their current forms are reasonable for screening level tools.
Lead is modeled as being transported from the source area with the following assumptions.
The modeled flow path is depicted from MW-18 through MW-09 and beyond.
The highest detected lead concentration in MW-18 is representative of lead concentrations in the source area and is constant in concentration.
An alternate scenario using MW-15 as a source area is also modeled.
The parameters selected for use in the model are presented in the following subsections.
Source Zone Width The source zone is defined as the two-dimensional cross sectional area that is perpendicular to
the direction of groundwater flow and of known constituent concentration. Downgradient of this

Swift & Company, Moultrie, GA December 8, 2015 Voluntary Remediation Program Status Report No. 1 Amec Foster Wheeler Project 6122-14-0220
HIS Site No. 10509
zone, the groundwater concentration is calculated by the model based on the dispersion, decay,
adsorption, etc. that would occur in the flow field based on the value of the parameters used in
the model. The modeled source is MW-18, with MW-15 also modeled as an alternate scenario.
The planar two-dimensional source is represented by the highest detected lead concentration
(MW-18 or MW-15). The cross section of the source is assumed to be approximately 100 feet
wide around MW-18, or MW-15 in the alternate scenario.
Source Zone Thickness The source zone thickness was assumed to be 50 feet based on the boring log and
potentiometric surface measurements of MW-26DDD (near the central portion of the site).
Seepage velocity There are two ways to input seepage velocity in this model – either as a final seepage velocity
or as hydraulic conductivity, groundwater gradient, and effective porosity. The final seepage
velocity method was used in this model exercise.
There are two water-bearing zones in the area of this model (Zone A and B). For this model,
they are considered as one unit. The seepage velocity in Zone A has been calculated to be 65
ft/yr based on a horizontal gradient of 0.0086 ft/ft. Seepage velocities in Zone B have been
calculated to be 32 – 91 ft/yr; based on a horizontal gradient of 0.0063 – 0.0178 ft/ft. Since the
model requires a single seepage velocity, 65 ft/y was used. This value is consistent with
reported values for both zones.
Dispersivity The dispersivities were calculated by the model based on an estimated plume length of 280
feet. The resulting values are longitudinal dispersivity (13.3 feet), the transverse dispersivity (1.3
feet), and vertical dispersivity of 0.13 feet. The model estimates these based on published
guidelines for dispersivity (Newell et al., 1996).
Partitioning Coefficient BIOSCREEN is designed to use an organic Kd partitioning coefficient. This value is dependent
on the fraction of organic carbon (foc) in the aquifer matrix, which is used to multiply the entered
organic carbon partitioning coefficient (Koc) to get the organic Kd. It can also be used to model
an inorganic metal constituent by entering a foc = 1.0 and an actual Kd for the Koc. With this
adjustment, the appropriate actual metal Kd value is used in the adsorption formula. The Kd
value for lead is dependent on pH. Both H+ (which determines pH) and Pb2+ are cations so
there can be competition between them for adsorption sites on grain surfaces. This means the
effective Kd depends on actual groundwater pH. Literature values report a range of Kd values
from 5 L/kg to 100,000 L/kg (USEPA, 1996). Because the groundwater pH is below neutral, the
median of literature values (15,849L/kg) was used as an initial input value and adjusted to
calibrate the model to historic plume length and actual groundwater concentrations. Final Kd
was dependent on length of time assumed since initial release.

Swift & Company, Moultrie, GA December 8, 2015 Voluntary Remediation Program Status Report No. 1 Amec Foster Wheeler Project 6122-14-0220
HIS Site No. 10509
Source Concentration and Strength For the initial calibration, the lead concentration used in the MW-18 area was 0.258 mg/L, based
on the September 2015 total metals sampling result at MW-18. At MW-18, both total and
dissolved metals samples were collected, as turbidity could not be reduced below 17.9 NTU.
The dissolved metals result at MW-18 was 0.176 mg/L. The source was assumed to be
constant over time. The lead concentration in the MW-15 area is 0.243 mg/L based on the
September 2015 sampling result.
Degradation and Chemical Transformations No degradation of lead or chemical reactions was assumed in the model.
Simulation Time For calibration, the estimated earliest and latest possible times of release (based on the years of
operation of the former Swift facility) were modeled. The actual first release date is unknown but
should lie somewhere between these endpoints. The estimated earliest possible release date
gives the plume 100 years to develop and results in a slower moving plume with a higher
retardation factor for the aquifer. Use of these parameters would lead to predictions of slower
future growth and more limited extent. The estimated latest possible release date gives the
plume 44 years to develop and results in a faster moving plume with a lower retardation factor
for the aquifer. Use of these parameters would lead to predictions of faster future growth and
more extensive plume development. Since neither of these scenarios takes into account source
area attenuation (both use a continuing source), both will generate very conservative (higher
concentrations and greater extent) estimates of future plume development.
Calibration Values The following September 2015 concentrations were used to calibrate the Kd values for the 100
and 44 year historic plume development:
Well Distance (Feet
from Source Area)
September 2015 Lead
Concentration (mg/L)
MW-18 0 0.258 (total)
MW-18 0 0.176
(dissolved)
MW-6 74 0.132
MW-13D 132 0.129
MW-9 194 0.0898
MW-20 224 0.00347
Screen captures of final input and output values for the 44 and 100 year historic plumes are
attached.

Swift & Company, Moultrie, GA December 8, 2015 Voluntary Remediation Program Status Report No. 1 Amec Foster Wheeler Project 6122-14-0220
HIS Site No. 10509
The calibration using the MW-18 total metals value of 0.258 mg/L yielded unsatisfactory
predicted values as compared to existing site values. Therefore, the calibration was performed
again using the MW-18 dissolved metals value of 0.176 mg/L, which yielded a more satisfactory
calibration when compared to site values. As mentioned above, the BIOSCREEN input pages
for both the MW-18 total and dissolved metals values, and associated model output pages
showing predicted values, are attached.
For the MW-15 scenario, the source used was the MW-15 September 2015 lead concentration
of 0.243 mg/L. Modeled travel times of 50 and 100 years were used for this scenario. The set-
up for the MW-18 scenario was otherwise used, as there are no downgradient wells from MW-
15 to use for calibration of the Kd values.
CONCLUSIONS Lead Model Results The results of this model of lead fate and transport from MW-18 toward MW-9 show that (for the
modeled travel time of 100 additional years) the lead concentration would not exceed the
GWPS of 0.015 mg/l between approximately 425 to 590 feet from MW-18 (44 year historic
plume or 100 year historic plume, respectively). This distance would extend beyond the eastern
property boundary approximately 220 to 380 feet for the two time periods. For the MW-15
source scenario, the lead concentration (for the modeled travel time of 100 additional years)
would not exceed the GWPS of 0.015 mg/l between approximately 450 to 620 feet from MW-15,
or approximately 270 to 320 feet beyond the eastern boundary along the prevalent groundwater
flow direction.
The models represent a very conservative estimate and actual conditions will be lower, as the
highest detected groundwater concentration was maintained as a constant source over the
entire model timeframe, and because the Kd values used are very low when compared to
guidance document values. Most importantly, as pH becomes more neutral over time and
distance from the source, the mobility of lead will be diminished and corresponding Kd values
would increase. Screen captures of model inputs and results are attached.

Swift & Company, Moultrie, GA December 8, 2015 Voluntary Remediation Program Status Report No. 1 Amec Foster Wheeler Project 6122-14-0220
HIS Site No. 10509
Initial Set-up and Calibration Using MW-18 Total Metals Value

BIOSCREEN Natural Attenuation Decision Support System Swift- Lead - total Pb Data Input Instructions:Air Force Center for Environmental Excellence Version 1.4 Moultrie, GA 115 1. Enter value directly....or
Run Name 2. Calculate by filling in grey 1. HYDROGEOLOGY 5. GENERAL 0.02 cells below. (To restore Seepage Velocity* Vs 65.0 (ft/yr) Modeled Area Length* 250 (ft) formulas, hit button below).
or Modeled Area Width* 200 (ft) Variable* Data used directly in model. Hydraulic Conductivity K 1.1E-02 (cm/sec) Simulation Time* 44 (yr) 20 Value calculated by model.Hydraulic Gradient i 0.003 (ft/ft) (Don't enter any data).Porosity n 0.3 (-) 6. SOURCE DATA
Source Thickness in Sat.Zone* 50 (ft)2. DISPERSION Source Zones:Longitudinal Dispersivity* alpha x 13.3 (ft) Width* (ft) Conc. (mg/L)*Transverse Dispersivity* alpha y 1.3 (ft) 10 0 1Vertical Dispersivity* alpha z 0.1 (ft) 20 0
or 100 0.258Estimated Plume Length Lp 280 (ft) 20 0
10 03. ADSORPTION Source Halflife (see Help):Retardation Factor* R 20.9 (-) 20 >1000 (yr) View of Plume Looking Down
or Inst. React. 1st OrderSoil Bulk Density rho 1.5 (kg/l) Soluble Mass 2000 (Kg) Observed Centerline Concentrations at Monitoring Wells Partition Coefficient Koc 3.98 (L/kg) In Source NAPL, Soil If No Data Leave Blank or Enter "0"FractionOrganicCarbon foc 1.0E+0 (-) 7. FIELD DATA FOR COMPARISON
Concentration (mg/L) .258 .132 .129 .09 .0034. BIODEGRADATION Dist. from Source (ft) 0 25 50 75 100 125 150 175 200 225 2501st Order Decay Coeff* lambda 0.0E+0 (per yr)
or 8. CHOOSE TYPE OF OUTPUT TO SEE:Solute Half-Life t-half 0.15 (year)or Instantaneous Reaction ModelDelta Oxygen* DO 1.65 (mg/L)Delta Nitrate* NO3 0.7 (mg/L)Observed Ferrous Iron* Fe2+ 16.6 (mg/L)Delta Sulfate* SO4 22.4 (mg/L)Observed Methane* CH4 6.6 (mg/L)
Vertical Plane Source: Look at Plume Cross-Section and Input Concentrations & Widthsfor Zones 1, 2, and 3
L
W
or
oror
or
12345
or
or
View OutputPaste Example Dataset
View OutputRestore Formulas for Vs,
RUN CENTERLINE RUN ARRAY Help Recalculate This

DISSOLVED HYDROCARBON CONCENTRATION ALONG PLUME CENTERLINE (mg/L at Z=0)
Distance from Source (ft)
TYPE OF MODEL 0 25 50 75 100 125 150 175 200 225 250
No Degradation 0.254 0.247 0.236 0.217 0.187 0.148 0.105 0.067 0.037 0.018 0.007
1st Order Decay 0.254 0.247 0.236 0.217 0.187 0.148 0.105 0.067 0.037 0.018 0.007
Inst. Reaction 0.000 0.000 0.000 0.000 0.000 0.000 0.000 0.000 0.000 0.000 0.000
Field Data from Site 0.258 0.132 0.129 0.090 0.003
Time:44 Years
0.000
0.050
0.100
0.150
0.200
0.250
0.300
0 50 100 150 200 250 300
Con
cent
ratio
n(m
g/L)
Distance From Source (ft)
1st Order Decay Instantaneous Reaction No Degradation Field Data from Site
Next Timestep
Prev Timestep
CalculateAnimation Recalculate This Return to

Swift & Company, Moultrie, GA December 8, 2015 Voluntary Remediation Program Status Report No. 1 Amec Foster Wheeler Project 6122-14-0220
HIS Site No. 10509
Final Set-up, Calibration and Predicted Values Using MW-18 Dissolved Metals Value

BIOSCREEN Natural Attenuation Decision Support System Swift- Lead Data Input Instructions:Air Force Center for Environmental Excellence Version 1.4 Moultrie, GA 115 1. Enter value directly....or
Run Name 2. Calculate by filling in grey 1. HYDROGEOLOGY 5. GENERAL 0.02 cells below. (To restore Seepage Velocity* Vs 65.0 (ft/yr) Modeled Area Length* 250 (ft) formulas, hit button below).
or Modeled Area Width* 200 (ft) Variable* Data used directly in model. Hydraulic Conductivity K 1.1E-02 (cm/sec) Simulation Time* 44 (yr) 20 Value calculated by model.Hydraulic Gradient i 0.003 (ft/ft) (Don't enter any data).Porosity n 0.3 (-) 6. SOURCE DATA
Source Thickness in Sat.Zone* 50 (ft)2. DISPERSION Source Zones:Longitudinal Dispersivity* alpha x 13.3 (ft) Width* (ft) Conc. (mg/L)*Transverse Dispersivity* alpha y 1.3 (ft) 10 0 1Vertical Dispersivity* alpha z 0.1 (ft) 20 0
or 100 0.176Estimated Plume Length Lp 280 (ft) 20 0
10 03. ADSORPTION Source Halflife (see Help):Retardation Factor* R 20.9 (-) 20 >1000 (yr) View of Plume Looking Down
or Inst. React. 1st OrderSoil Bulk Density rho 1.5 (kg/l) Soluble Mass 2000 (Kg) Observed Centerline Concentrations at Monitoring Wells Partition Coefficient Koc 3.98 (L/kg) In Source NAPL, Soil If No Data Leave Blank or Enter "0"FractionOrganicCarbon foc 1.0E+0 (-) 7. FIELD DATA FOR COMPARISON
Concentration (mg/L) .258 .132 .129 .09 .0034. BIODEGRADATION Dist. from Source (ft) 0 25 50 75 100 125 150 175 200 225 2501st Order Decay Coeff* lambda 0.0E+0 (per yr)
or 8. CHOOSE TYPE OF OUTPUT TO SEE:Solute Half-Life t-half 0.15 (year)or Instantaneous Reaction ModelDelta Oxygen* DO 1.65 (mg/L)Delta Nitrate* NO3 0.7 (mg/L)Observed Ferrous Iron* Fe2+ 16.6 (mg/L)Delta Sulfate* SO4 22.4 (mg/L)Observed Methane* CH4 6.6 (mg/L)
Vertical Plane Source: Look at Plume Cross-Section and Input Concentrations & Widthsfor Zones 1, 2, and 3
L
W
or
oror
or
12345
or
or
View OutputPaste Example Dataset
View OutputRestore Formulas for Vs,
RUN CENTERLINE RUN ARRAY Help Recalculate This

DISSOLVED HYDROCARBON CONCENTRATION ALONG PLUME CENTERLINE (mg/L at Z=0)
Distance from Source (ft)
TYPE OF MODEL 0 25 50 75 100 125 150 175 200 225 250
No Degradation 0.174 0.169 0.162 0.148 0.128 0.101 0.072 0.045 0.025 0.012 0.005
1st Order Decay 0.174 0.169 0.162 0.148 0.128 0.101 0.072 0.045 0.025 0.012 0.005
Inst. Reaction 0.000 0.000 0.000 0.000 0.000 0.000 0.000 0.000 0.000 0.000 0.000
Field Data from Site 0.258 0.132 0.129 0.090 0.003
Time:44 Years
0.000
0.050
0.100
0.150
0.200
0.250
0.300
0 50 100 150 200 250 300
Con
cent
ratio
n(m
g/L)
Distance From Source (ft)
1st Order Decay Instantaneous Reaction No Degradation Field Data from Site
Next Timestep
Prev Timestep
CalculateAnimation Recalculate This Return to

DISSOLVED HYDROCARBON CONCENTRATION ALONG PLUME CENTERLINE (mg/L at Z=0)
Distance from Source (ft)
TYPE OF MODEL 0 50 100 150 200 250 300 350 400 450 500
No Degradation 0.172 0.172 0.171 0.165 0.150 0.124 0.089 0.053 0.025 0.009 0.003
1st Order Decay 0.172 0.172 0.171 0.165 0.150 0.124 0.089 0.053 0.025 0.009 0.003
Inst. Reaction 0.000 0.000 0.000 0.000 0.000 0.000 0.000 0.000 0.000 0.000 0.000
Field Data from Site 0.258 0.132 0.129 0.090 0.003
Time:100 Years
0.000
0.050
0.100
0.150
0.200
0.250
0.300
0 100 200 300 400 500 600
Con
cent
ratio
n(m
g/L)
Distance From Source (ft)
1st Order Decay Instantaneous Reaction No Degradation Field Data from Site
Next Timestep
Prev Timestep
CalculateAnimation Recalculate This Return to

DISSOLVED HYDROCARBON CONCENTRATION ALONG PLUME CENTERLINE (mg/L at Z=0)
Distance from Source (ft)
TYPE OF MODEL 0 70 140 210 280 350 420 490 560 630 700
No Degradation 0.170 0.171 0.170 0.164 0.152 0.128 0.091 0.051 0.022 0.007 0.001
1st Order Decay 0.170 0.171 0.170 0.164 0.152 0.128 0.091 0.051 0.022 0.007 0.001
Inst. Reaction 0.000 0.000 0.000 0.000 0.000 0.000 0.000 0.000 0.000 0.000 0.000
Field Data from Site
Time:144 Years
0.0000.0200.0400.0600.0800.1000.1200.1400.1600.180
0 100 200 300 400 500 600 700 800
Con
cent
ratio
n(m
g/L)
Distance From Source (ft)
1st Order Decay Instantaneous Reaction No Degradation Field Data from Site
Next Timestep
Prev Timestep
CalculateAnimation Recalculate This Return to

Swift & Company, Moultrie, GA December 8, 2015 Voluntary Remediation Program Status Report No. 1 Amec Foster Wheeler Project 6122-14-0220
HIS Site No. 10509
Set-up and Predicted Values of MW-15 Scenario
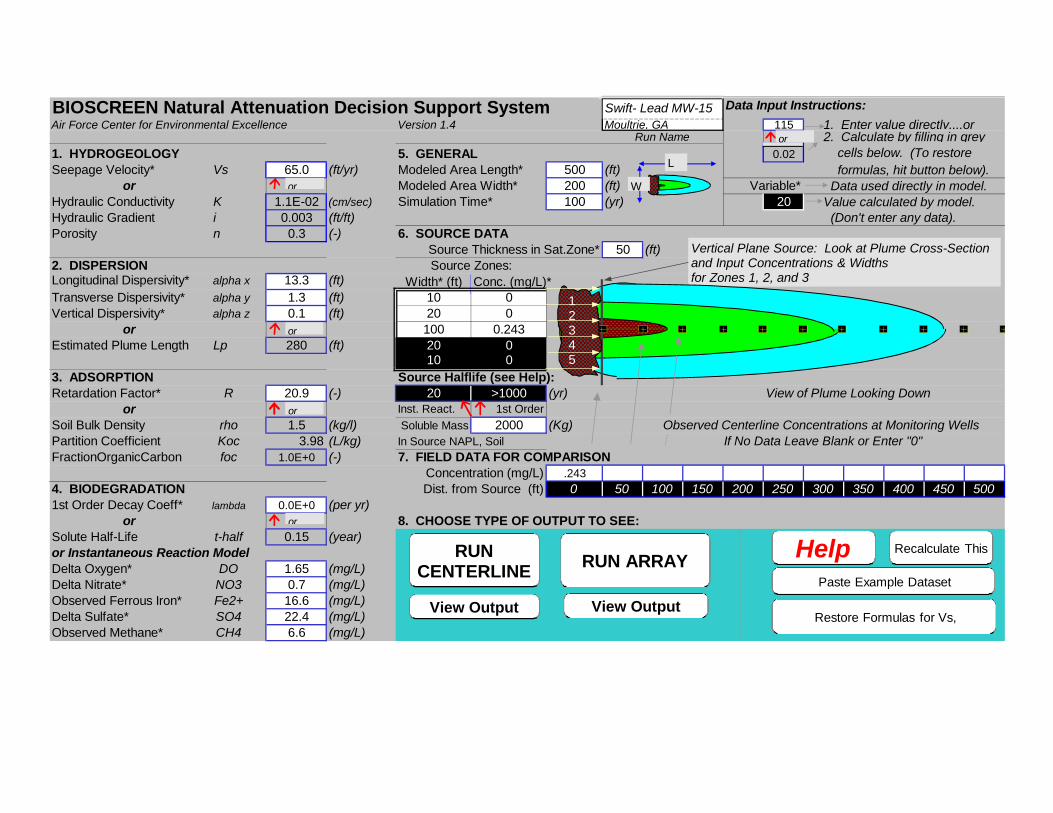
BIOSCREEN Natural Attenuation Decision Support System Swift- Lead MW-15 Data Input Instructions:Air Force Center for Environmental Excellence Version 1.4 Moultrie, GA 115 1. Enter value directly....or
Run Name 2. Calculate by filling in grey 1. HYDROGEOLOGY 5. GENERAL 0.02 cells below. (To restore Seepage Velocity* Vs 65.0 (ft/yr) Modeled Area Length* 500 (ft) formulas, hit button below).
or Modeled Area Width* 200 (ft) Variable* Data used directly in model. Hydraulic Conductivity K 1.1E-02 (cm/sec) Simulation Time* 100 (yr) 20 Value calculated by model.Hydraulic Gradient i 0.003 (ft/ft) (Don't enter any data).Porosity n 0.3 (-) 6. SOURCE DATA
Source Thickness in Sat.Zone* 50 (ft)2. DISPERSION Source Zones:Longitudinal Dispersivity* alpha x 13.3 (ft) Width* (ft) Conc. (mg/L)*Transverse Dispersivity* alpha y 1.3 (ft) 10 0 1Vertical Dispersivity* alpha z 0.1 (ft) 20 0
or 100 0.243Estimated Plume Length Lp 280 (ft) 20 0
10 03. ADSORPTION Source Halflife (see Help):Retardation Factor* R 20.9 (-) 20 >1000 (yr) View of Plume Looking Down
or Inst. React. 1st OrderSoil Bulk Density rho 1.5 (kg/l) Soluble Mass 2000 (Kg) Observed Centerline Concentrations at Monitoring Wells Partition Coefficient Koc 3.98 (L/kg) In Source NAPL, Soil If No Data Leave Blank or Enter "0"FractionOrganicCarbon foc 1.0E+0 (-) 7. FIELD DATA FOR COMPARISON
Concentration (mg/L) .243 4. BIODEGRADATION Dist. from Source (ft) 0 50 100 150 200 250 300 350 400 450 5001st Order Decay Coeff* lambda 0.0E+0 (per yr)
or 8. CHOOSE TYPE OF OUTPUT TO SEE:Solute Half-Life t-half 0.15 (year)or Instantaneous Reaction ModelDelta Oxygen* DO 1.65 (mg/L)Delta Nitrate* NO3 0.7 (mg/L)Observed Ferrous Iron* Fe2+ 16.6 (mg/L)Delta Sulfate* SO4 22.4 (mg/L)Observed Methane* CH4 6.6 (mg/L)
Vertical Plane Source: Look at Plume Cross-Section and Input Concentrations & Widthsfor Zones 1, 2, and 3
L
W
or
oror
or
12345
or
or
View OutputPaste Example Dataset
View OutputRestore Formulas for Vs,
RUN CENTERLINE RUN ARRAY Help Recalculate This

DISSOLVED HYDROCARBON CONCENTRATION ALONG PLUME CENTERLINE (mg/L at Z=0)
Distance from Source (ft)
TYPE OF MODEL 0 50 100 150 200 250 300 350 400 450 500
No Degradation 0.239 0.228 0.194 0.128 0.058 0.016 0.003 0.000 0.000 0.000 0.000
1st Order Decay 0.239 0.228 0.194 0.128 0.058 0.016 0.003 0.000 0.000 0.000 0.000
Inst. Reaction 0.000 0.000 0.000 0.000 0.000 0.000 0.000 0.000 0.000 0.000 0.000
Field Data from Site 0.243
Time:50 Years
0.0
0.1
0.1
0.2
0.2
0.3
0.3
0 100 200 300 400 500 600
Con
cent
ratio
n(m
g/L)
Distance From Source (ft)
1st Order Decay Instantaneous Reaction No Degradation Field Data from Site
Next Timestep
Prev Timestep
ReplayAnimation Recalculate This Return to

DISSOLVED HYDROCARBON CONCENTRATION ALONG PLUME CENTERLINE (mg/L at Z=0)
Distance from Source (ft)
TYPE OF MODEL 0 50 100 150 200 250 300 350 400 450 500
No Degradation 0.235 0.236 0.235 0.227 0.207 0.171 0.123 0.073 0.035 0.013 0.004
1st Order Decay 0.235 0.236 0.235 0.227 0.207 0.171 0.123 0.073 0.035 0.013 0.004
Inst. Reaction 0.000 0.000 0.000 0.000 0.000 0.000 0.000 0.000 0.000 0.000 0.000
Field Data from Site 0.243
Time:100 Years
0.000
0.050
0.100
0.150
0.200
0.250
0.300
0 100 200 300 400 500 600
Con
cent
ratio
n(m
g/L)
Distance From Source (ft)
1st Order Decay Instantaneous Reaction No Degradation Field Data from Site
Next Timestep
Prev Timestep
ReplayAnimation Recalculate This Return to

DISSOLVED HYDROCARBON CONCENTRATION ALONG PLUME CENTERLINE (mg/L at Z=0)
Distance from Source (ft)
TYPE OF MODEL 0 90 180 270 360 450 540 630 720 810 900
No Degradation 0.231 0.233 0.229 0.214 0.178 0.115 0.050 0.013 0.002 0.000 0.000
1st Order Decay 0.231 0.233 0.229 0.214 0.178 0.115 0.050 0.013 0.002 0.000 0.000
Inst. Reaction 0.000 0.000 0.000 0.000 0.000 0.000 0.000 0.000 0.000 0.000 0.000
Field Data from Site 0.243
Time:150 Years
0.000
0.050
0.100
0.150
0.200
0.250
0.300
0 100 200 300 400 500 600 700 800 900 1000
Con
cent
ratio
n(m
g/L)
Distance From Source (ft)
1st Order Decay Instantaneous Reaction No Degradation Field Data from Site
Next Timestep
Prev Timestep
CalculateAnimation Recalculate This Return to

´
MW-15
´
MW-18
Service Layer Credits: Source: Esri, DigitalGlobe,GeoEye, Earthstar Geographics, CNES/Airbus DS,USDA, USGS, AEX, Getmapping, Aerogrid, IGN, IGP,
¯
0 120 240Feet
Doc
umen
t Pat
h: G
:\For
mer
Sw
ift M
oultr
ie\m
xd\S
ite M
ap-r
1.m
xd
Prepared by: TG 12/08/2015 Figure
Number:C1
Checked by: DS 12/08/2015
Project Number: 6122-14-0220
Approximate Extent of Lead Impact Projected by BioScreen-AT
Former Swift & CompanyMeat Processing Plant
Moultrie, Georgia Colquitt County
Residual Source Area
N. M
ain St.
Area of potential offsiteencroachment
300 feet from Property Boundary
LegendGroundwater Flow
Residual Source Area

Swift & Company, Moultrie, GA May 29, 2016 Voluntary Remediation Program Progress Report No. 2 Amec Foster Wheeler Project 6122-14-0220
HSI Site No. 10509
APPENDIX B
REGISTERED PROFESSIONAL SUPPORTING DOCUMENTATION
Summary of Hours and Services
Former SWIFT & Company Meat Processing Plant HSI Site No. 10509
____________Amec Project No. 6122-14-0220_____________ Submittal to EPD dated May 29, 2016
David E. Smoak, P.G. Preparation of submittal and review 28 hours charged December 11 through May 29, 2016
John Quinn, P.G Preparation of submittal
22 hours charged December 11 through May 29, 2016