voluntary corporate disclosures by uk companiespeople.exeter.ac.uk/ipt201/research/final...
TRANSCRIPT

Voluntary Corporate Disclosures
by UK Companies
By
Santhosh Abraham [email protected]
And
Ian Tonks [email protected]
Xfi Centre for Finance and Investment University of Exeter, Exeter EX4 4PU
April 2006 An earlier version of this paper was presented at the Conference on “Corporate Disclosures and News Management”, at Xfi in September 2004, and the Financial Reporting Conference, Cardiff, June 2005. We are grateful for comments received by George Bulkley, Paul Draper, Martin Walker, Hyun Song Shin.

Voluntary corporate disclosure by UK companies
Abstract This paper models the arrival rate of voluntary news announcements of the FTSE All-Share firms. We test to see if the earnings environment affects the volume of news announcements that firms release to the stock market. We also examine whether the other factors such as the size of a firm and the external coverage a firm receives affects the pattern of news disclosures. Our results show that firms in a negative earnings environment have a positive and significant disclosure rate while the same is not noticed for firms in a positive earnings environment. We find this relationship to hold only in the post-FSA period as opposed to the pre-FSA period which provides evidence that the changes from the UK’s Financial Services Authority taking over responsibility for the United Kingdom Listing Authority has had an impact on disclosure practices of FTSE firms. Our results also show a positive relationship between the size of a firm and disclosure rate but we also find that firms that are receive the least coverage release more information.
Keywords: information releases, corporate disclosure, news management
JEL Classification: M40, G18

I Introduction
Financial reporting and disclosures by management are the primary methods of
keeping investors informed about corporate performance. Corporate disclosures of
financial information are a means of communicating a firm’s financial performance to
outside investors and capital markets. In this study we examine the determinants of
managerial disclosure decisions, and focus on whether the earnings environment in
which the firm operates affects voluntary corporate disclosures.
Financial markets regulation typically assumes that stock markets rely on a flow of
relevant and timely information to function efficiently. This is because information on
a listed company’s performance and its future is seen as the basis on which many
important investment decisions will be made by investors. We study regulatory news
announcement statements that companies release to the stock market and in particular
the outlook statements, which we consider to be the main voluntary section of
disclosures. The need for more transparency and clarity in the global capital markets
and the emergence of regulatory bodies such as the Financial Services Authority
(FSA) in the UK highlights the importance of corporate disclosure to investor
confidence. Our study also examines whether the FSA taking over responsibility for
the United Kingdom Listing Authority has had an impact on disclosure practices.
Our study is the first of its kind to use data for firms listed on the London Stock
Exchange and to develop a framework testing the effects of the earnings environment
and size on voluntary corporate disclosures and importantly adding to the literature on
managerial incentives to disclose information voluntarily. . The need for such a study
is important given the new regulatory regime provided by the FSA and the various
policy initiatives such as the Financial Services and Market Act (FSMA) and the
Market Code of Conduct that have been introduced to promote fair and transparent
capital markets in the UK given London’s role as one of the leading global financial
centres in the world
Corporations use a variety of different means to communicate information about their
operations to investors. Annual reports, which were once the main source of
information for investors, have been complemented with a wide variety of other
sources such as quarterly reports, press releases and conference calls. Annual reports

are not seen as being very timely by investors and to large extent information in the
annual report confirm what the market already is aware of through other news
sources. Hence we focus on regulatory news service announcements that companies
make to the stock market because of the wide audience that such press releases reach
and the timeliness of such announcements (Bamber and Cheon 1998).
Periodically companies make compulsory and voluntary news announcements to the
market. Compulsory news announcements follow from the requirements of company
law or the regulatory framework under which listed companies operate. These news
announcements include annual earnings statements and company reports, large
ownership blocks, and details of directors’ trading. On the other hand companies also
make voluntary news announcements providing information about future plans or the
trading environment. Two examples give a flavour of the range of information content
in these voluntary news announcements. On 15th October 1996 Barclays plc
announced the formation of Barclays Global Investors. On 5th May 1994 the
Chairman of Barclays released an outlook statement to the London Stock Exchange’s
Regulatory News Service in which he stated that, “I am looking forward to 1994 with
confidence”. It is not clear what the information content of such statements are, and
one approach would be in the form of a textual analysis of these disclosures, and the
subsequent stock market reaction to these disclosures, as for example in Bulkley and
Herrerias (2004). Instead this paper investigates the number of voluntary public
information releases by companies by counting up their occurrence, and examining
patterns in this data. We model the arrival rate of voluntary news announcements
issued by companies, by investigating the distribution of these news announcements
made through the Regulatory News Service for all the constituents of the FTSE all
share index on the London Stock Exchange over two time periods 1994-1997 and
2000-2002. These two time periods reflect the change in the regulatory environment
brought about by the announcement in 1997 of a new regulatory framework for
financial services with the formation of a single regulatory body (the Financial
Services Authority (FSA)) given its statutory powers by the Financial Services and
Markets Act 2000.
We distinguish between two kinds of earnings environment based on the change in
earnings per share for each firm from the previous to the current accounting years.

Firms that have a positive change in earnings are classified as being in a positive
earnings environment and firms that have a negative change are classified as being in
a negative earnings environment. Skinner (1994) argues that news management is
more important for bad news than for good news environments because US securities
law operate to impose an asymmetric loss function on managers announcing large
negative earnings surprises and that managers also do so in order to avoid negative
reputation costs with the investment community. We examine news management in a
different regulatory setting where the law does not impose an asymmetric function
and also in the context of the regulatory environment being tightened in the UK.
Our results show that the earnings environment does have an effect on voluntary
disclosure patterns with firms in a negative earnings environment showing a positive
and significant disclosure pattern while the same relation is not observed when firms
are in a positive earnings environment. However we find that this relationship holds
only in the post-FSA period rather than in the pre-FSA period suggesting that the FSA
taking responsibility for the United Kingdom Listing Authority (UKLA) has had an
impact on disclosure practices. We do not observe a relationship between size and
disclosure for our pooled sample but find a negative relationship between size and
disclosure in the post-FSA period.
Following up on our results that there is a positive association between being in a
negative earnings environment and voluntary disclosure, we examine the share price
reaction for companies in negative earnings environment in the post- FSA period and
observe that companies that release more information had lower average returns for
the event window examined and that the market over reacts to news announcements.
The rest of the paper is divided as follows: Section II describes the literature and
hypothesis development, Section III describes the data including some preliminary
results on stock returns around news announcements, Section IV describes the results
on modelling the arrival rate of information and Section V provides our conclusions.

II Information Transmission Literature and Hypothesis Development
There are a number of different approaches to modelling information transmission in
financial markets, taking into account the information differences and conflicting
incentives between the managers of firms and outside investors. Admati and
Pfleiderer (1986, 1988), assume that the sellers of information truthfully report their
private information, and their work is concerned with how the seller of the
information can maximize the returns to this private information. Other approaches
stress the incentives on the providers of information to truthfully reveal their
information classified by Verrechia (2001) as “discretionary-based disclosures”. For
example a manager, whose salary depends on the company’s share price performance,
has an incentive to provide favourable information to boost the company’s share
price.
Healey and Palepu (2001) in their survey of voluntary disclosure practices examine
various factors in relation to managerial incentives to disclose voluntary information.
They discuss hypotheses related to capital markets transactions, corporate control
contests, stock compensation, litigation costs, management talent signalling and the
proprietary cost that have been investigated as managerial motives for disclosing
voluntary information.
Our paper’s main focus is to examine whether the earnings environment influences
voluntary disclosure practices by managers. A company’s earnings per share is a very
important measure by which its performance is judged by the market and information
relating to the future earnings of the company can have important repercussions on
the stock price of the company.
Truman (1986) argues that managers release information voluntarily as a means to
signal their ability to anticipate future earnings changes. Ajiinkya and Gift (1984)
examined the hypothesis that managers dislike large earnings surprises of either
quality and would therefore disclose more information regardless of whether it is a
positive or a negative earnings surprise. Their study along with McNichols (1989),
Pownall, Wasley and Waymire (1993) show a stock market reaction close to zero
when voluntary news announcements were released suggesting no earnings bias in
voluntary disclosure. Other studies show that managers have a tendency to disclose

more good news forecasts than bad news forecasts (Patell 1976, Penman 1980,
Waymire 1984, Lev and Penman 1990).
More recent studies however show a bias in the opposite direction i.e. managers
disclosing more bad news forecasts than good news forecasts. Skinner (1994) argued
that managers are faced with an asymmetric loss function in their voluntary disclosure
practices. i.e. managers are faced with large costs when investors are surprised with
negative news but not when other earnings news is released, this is due to two factors.
The first one is related to legal liability costs as a result of the Securities and
Exchange Commission’s rule 10b-5 which makes it unlawful for managers to omit or
state a material fact, by pre-disclosing the information, managers reduced the risk of
being sued by investors for withholding information. Secondly Skinner argues that
managers pre-disclose negative earnings news in order to avoid reputation costs.
Managers who develop a history of earnings surprises tend to be followed less by the
money management community, which would adversely affect the price and liquidity
of the stock. Libby and Tan (1999) in their survey of financial analysts found that
analysts perceived managers who provided early warning signals as having more
integrity and that analysts tend to follow stocks of companies that were more
forthcoming with their disclosures.
Skinner and Sloan (2001) show that the absolute magnitude of the price response to
negative surprises exceeds the price response to positive earnings surprise. Payne and
Robb (2001) show that pre managed firms have greater abnormal returns. Brown at al
(1987) also shows that managers have strong incentives to avoid negative earnings
surprises because it would lead to negative price reactions. Matsumoto (2002) argues
that managers can broadly use two techniques to avoid a negative earnings surprise.
One would be to manage the actual earnings and the other would be to manage
expectations regarding earnings. Managing expectations of earnings would be easier
due to the presence of boards and auditors in a firm.
In summary there is no conclusive evidence on whether the earnings environment has
an impact on voluntary disclosure practices, and we propose the following null
hypothesis:

H1: There is no relation between the earnings environment and the volume of
voluntary news disclosures that companies release
We will test this hypothesis by examining the disclosure patterns of companies in
positive and negative earnings environments. Positive and negative earnings
environments are defined in relation to whether the change in earnings per share over
successive accounting years is positive or negative,
Firm size has been one of the key characteristics consistently noted in previous
research as being positively related to the volume of corporate disclosure. For
example, Ahmed and Courtis (1999) in their meta-analysis of corporate characteristics
and annual report disclosure levels between 1968 and 1997 analyzed 29 papers,
which included 2,473 annual reports. The studies had a sample size of between 26 to
200 companies and the dependent variable included between 11 and 224
informational items. The authors noted that the papers tested hypotheses developed
from theoretical bases including agency costs, proprietary costs, political costs,
corporate governance and monitoring, signaling and information asymmetry, capital
needs, litigation costs and audit firm reputation. The dependent variables relating to
disclosure levels had been measured in a three ways including voluntary, statutory
and a combination of the both and that a variety of economic theories including
corporate size, listing status, capital structure (leverage), profitability and size of the
reporting entity’s audit firm were commonly sited variables in these studies. The
Meta analysis concluded that evidence for links between the various economic
variables and disclosure were mixed with strong support only for size, listing status
and leverage (all of them positive). Larger firms release more information due to the
scale of their operations and the financial capability to do so.
On the other hand one could also argue that there would be a negative relationship
between the volume of voluntary news announcements and the size of a firm. This is
because firm size also proxies for the amount of pre-disclosure information available
about a company (Ataise 1985). Pre-disclosure information in this context is made
available by other agents who gather and distribute information about a company
other than the company itself. In the capital markets analysts play a major role in
information transmission. Bhushan (1989) proposes a model where analysts would
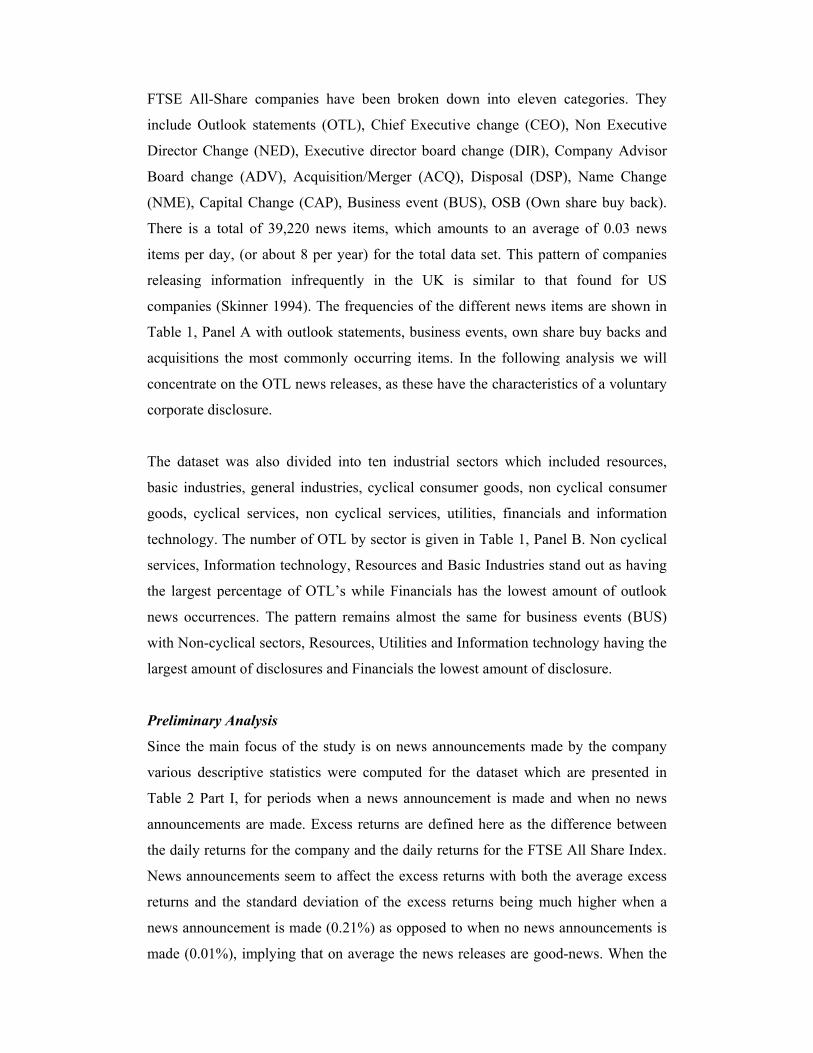
follow stocks as long as the benefits of doing so outweigh the costs involved. Size,
proportion of institutional investors and return variability were found to be positively
related to analyst following. Smaller companies are less likely to be owned by
institutional investors and therefore less likely to be followed by analysts. Richardson
et al (2003), Thomas (2002) and Lim (2001) show that greater attention is paid by
analysts to larger firms. Studies on directors trading, another information source in the
capital markets, show that abnormal returns around directors trading are concentrated
in smaller firms where information would be at a premium as the flow of news is less
continuous (Hiller and Marshall 2001).Therefore due to more coverage that is
received larger firms would have fewer incentives to disclose more information. We
therefore propose that the null hypothesis is
H2: There is no relationship between the size of a firm and the volume of voluntary
news announcements that the firm makes to the stock market
We examine the regulatory framework governing financial regulation in the United
Kingdom. The United Kingdom Listing Authority (UKLA) is responsible for
monitoring the flow of company information, and in particular price sensitive
information and is currently controlled by the Financial Services Authority (FSA).
The UKLA first published its guidance on the dissemination of price sensitive
information in 1994. Listed companies are under an obligation to ensure that any price
sensitive information which comes from itself, its advisors or agents with the listed
company’s authority, is given to the market as a whole and is sufficient and not
inaccurate or misleading as per the UKLA guidelines. The UKLA defines price
sensitive information as information which may or would likely lead to a substantial
movement in the price of the company’s listed securities. This definition will depend
on a variety of factors such as size, sector, and recent developments and so on. Certain
general factors such as dividend announcements, board appointments or departures,
profit warnings, share dealings by directors or substantial shareholders, acquisitions
and disposals above a certain size, annual and interim results, preliminary results,
rights issues and details of other issues of securities are examples of these
announcements. Directors of companies have the primary responsibility for the
dissemination of news announcements though it would be expected that they would
delegate such functions. Companies usually submit news announcements to a

regulatory news service. A Regulatory Information Service is a service that receives
regulatory information from listed companies (and other entities), processes that
information and disseminates it to Secondary Information Providers.
The FSA was created as part of the various new initiatives introduced by the new
Labour Government in 1997 in order to reform financial services regulation in the
United Kingdom. The first stage of the reforms was completed in June 1998 when
responsibility for banking supervision was transferred to the FSA from the Bank of
England. In May 2000 the FSA took over the role of the UKLA from the London
Stock Exchange. The FSA was given formal statutory powers by the Financial
Services and Market Act of 2000 (FSMA).
The FSMA required the FSA to publish a code to supplement the statutory provisions
defining market abuse providing more guidelines than was available before. The code
known as the Code of Market Conduct or the Code came into effect after various
consultations on the 1st of December 2001. Both the FSMA and the Code set out new
frameworks for tackling market abuse in prescribed markets expected to be those
operated by the seven UK recognized investment exchanges1. The three main
elements of the market abuse regime are misuse of information, false or misleading
impression and market distortion. Section 118 of the FSMA creates civil penalties for
market abuse, which run parallel to criminal offences and which requires a lower
burden of proof for a successful prosecution2. The criminal offences are making a
misleading statement and engaging in a misleading course of conduct for the purpose
of inducing another person to exercise or refrain from exercising rights in relation to
investments. Prior to the code the toughest penalty that could be imposed was a public
censure while currently an unlimited fine could potentially be imposed. For instance
in 2000/01 the enforcement division of the FSA imposed 79 penalties with a total
value of £5,847,748. For the year 2001/02 that number decreased to 76 but the value
1 For a more detailed description of the measures which the FSA has taken to prepare for taking on full responsibility as the single regulator of financial services see ‘The Financial Services Authority: A short guide to our preparations for the new regulatory regime’. http://www.fsa.gov.uk/pubs/policy/P28.pdf 2 See sections 118-123 of the FSMA 2000

of the penalties increased to £10,062,5973. Listing rules 9.1 and 9.2 imposes a general
obligation on companies to publish important information as soon as possible
We test whether the new regulatory regime created by the FSA has had an impact on
the pattern of voluntary news information that firms release. We divide our sample
into two time periods, the pre-FSA sample (1994-1997) and the post-FSA sample
(2000-2002). We propose the following null hypothesis:
H3: There is no relationship between the regulatory regime and the volume of
voluntary news announcements that firms release.
Limitations
One limitation of our study is that while we are measuring public disclosures that
companies make there might be other means of disclosure such as conference calls
that companies can make to the markets which is not captured in our model.
Considering the effects of institutional investors on disclosure policies would
probably also have improved the explanatory power of our model. Bushee and Noe
(2000) show the effect different types of institutional investors have on corporate
disclosure policies. Moreover our data set includes two years of data after the FSA
was given market powers, a longer time period would have given us the opportunity
to study the long term impact of the new regulatory policies on disclosure.
III Data
In this study, the dates and content of earnings announcement and regulatory news
announcements was obtained from HemScott for the FTSE All Share constituent
companies spanning two time periods 1994-1997 and 2000-2002 which constitute the
time periods pre and post the FSA being given regulatory authority. Information on
companies’ daily returns and market capitalization were obtained from DataStream.
The FTSE All Share dataset had a total of 1,349,876 company-day observations from
1994-2002, and an observation is defined as the daily recordings of each of the
companies in the dataset for the time period. Regulatory news statements made by the 3 More details on the FSA’s enforcement policies can be found at http://www.fsa.gov.uk/Pages/doing/regulated/law/focus/
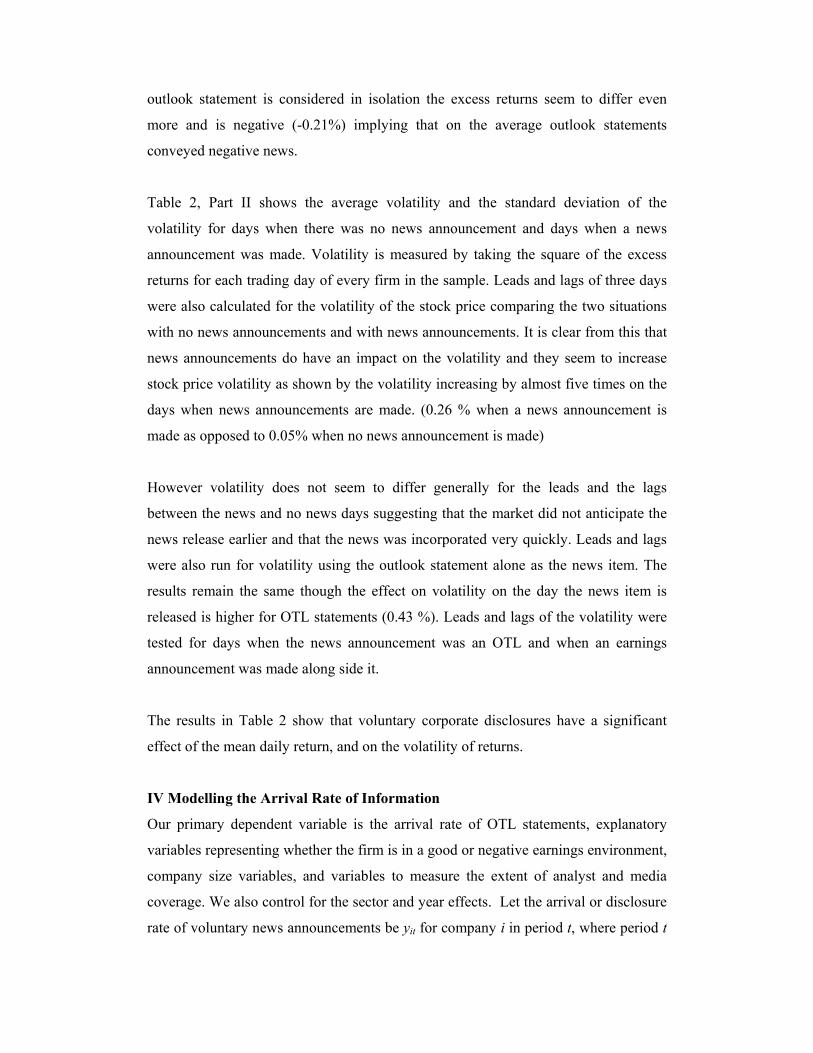
FTSE All-Share companies have been broken down into eleven categories. They
include Outlook statements (OTL), Chief Executive change (CEO), Non Executive
Director Change (NED), Executive director board change (DIR), Company Advisor
Board change (ADV), Acquisition/Merger (ACQ), Disposal (DSP), Name Change
(NME), Capital Change (CAP), Business event (BUS), OSB (Own share buy back).
There is a total of 39,220 news items, which amounts to an average of 0.03 news
items per day, (or about 8 per year) for the total data set. This pattern of companies
releasing information infrequently in the UK is similar to that found for US
companies (Skinner 1994). The frequencies of the different news items are shown in
Table 1, Panel A with outlook statements, business events, own share buy backs and
acquisitions the most commonly occurring items. In the following analysis we will
concentrate on the OTL news releases, as these have the characteristics of a voluntary
corporate disclosure.
The dataset was also divided into ten industrial sectors which included resources,
basic industries, general industries, cyclical consumer goods, non cyclical consumer
goods, cyclical services, non cyclical services, utilities, financials and information
technology. The number of OTL by sector is given in Table 1, Panel B. Non cyclical
services, Information technology, Resources and Basic Industries stand out as having
the largest percentage of OTL’s while Financials has the lowest amount of outlook
news occurrences. The pattern remains almost the same for business events (BUS)
with Non-cyclical sectors, Resources, Utilities and Information technology having the
largest amount of disclosures and Financials the lowest amount of disclosure.
Preliminary Analysis
Since the main focus of the study is on news announcements made by the company
various descriptive statistics were computed for the dataset which are presented in
Table 2 Part I, for periods when a news announcement is made and when no news
announcements are made. Excess returns are defined here as the difference between
the daily returns for the company and the daily returns for the FTSE All Share Index.
News announcements seem to affect the excess returns with both the average excess
returns and the standard deviation of the excess returns being much higher when a
news announcement is made (0.21%) as opposed to when no news announcements is
made (0.01%), implying that on average the news releases are good-news. When the
outlook statement is considered in isolation the excess returns seem to differ even
more and is negative (-0.21%) implying that on the average outlook statements
conveyed negative news.
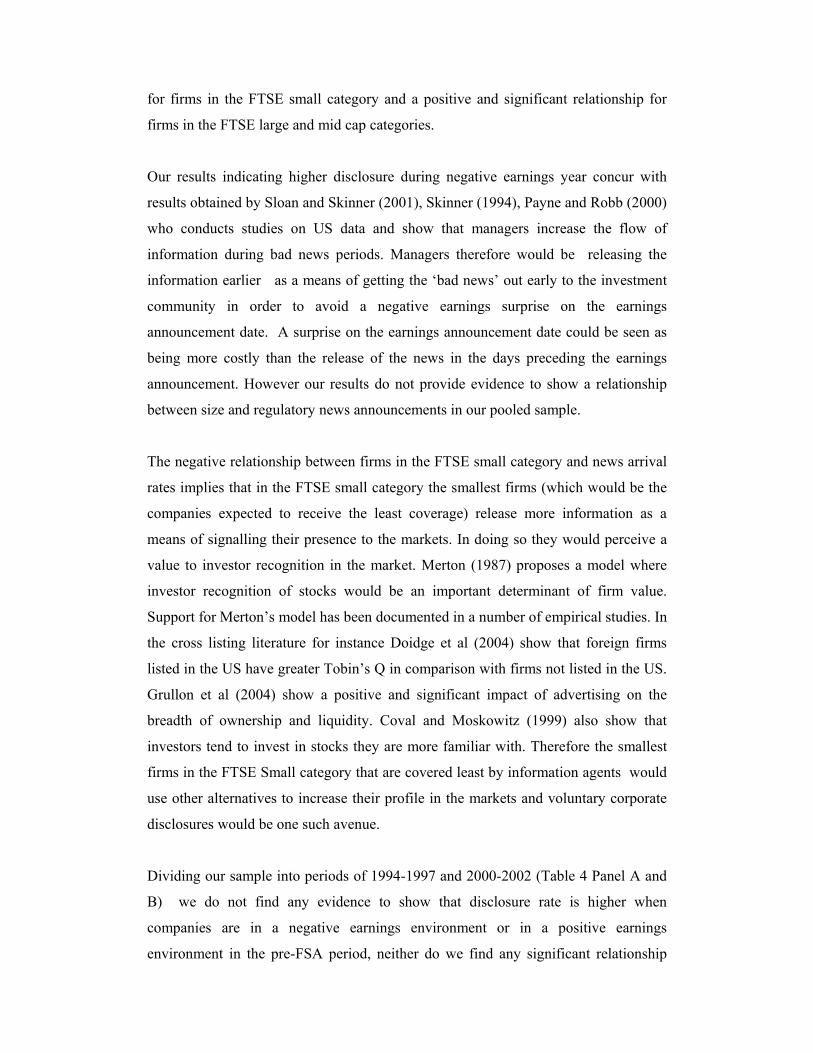
Table 2, Part II shows the average volatility and the standard deviation of the
volatility for days when there was no news announcement and days when a news
announcement was made. Volatility is measured by taking the square of the excess
returns for each trading day of every firm in the sample. Leads and lags of three days
were also calculated for the volatility of the stock price comparing the two situations
with no news announcements and with news announcements. It is clear from this that
news announcements do have an impact on the volatility and they seem to increase
stock price volatility as shown by the volatility increasing by almost five times on the
days when news announcements are made. (0.26 % when a news announcement is
made as opposed to 0.05% when no news announcement is made)
However volatility does not seem to differ generally for the leads and the lags
between the news and no news days suggesting that the market did not anticipate the
news release earlier and that the news was incorporated very quickly. Leads and lags
were also run for volatility using the outlook statement alone as the news item. The
results remain the same though the effect on volatility on the day the news item is
released is higher for OTL statements (0.43 %). Leads and lags of the volatility were
tested for days when the news announcement was an OTL and when an earnings
announcement was made along side it.
The results in Table 2 show that voluntary corporate disclosures have a significant
effect of the mean daily return, and on the volatility of returns.
IV Modelling the Arrival Rate of Information
Our primary dependent variable is the arrival rate of OTL statements, explanatory
variables representing whether the firm is in a good or negative earnings environment,
company size variables, and variables to measure the extent of analyst and media
coverage. We also control for the sector and year effects. Let the arrival or disclosure
rate of voluntary news announcements be yit for company i in period t, where period t

is the accounting year from the previous earnings-announcement to the next earnings-
announcement, then we model the disclosure rate as
yit = b0 + b1GNewsit + b2BNewsit + b3 Sizeit + b4Sectorit + b5Yearit + εit (1)
yit represents the arrival rate of OTL news statements per company per year. These
are computed by dividing the number of news statements released by each company
in each year by the number of trading days in the year
In order to classify company years into good and negative earnings environments we
initially compute the percentage change in earnings for each company in each year
relative to the previous accounting year. Changes in earnings per share that fall into
the top 25th percentile are classified as being in a positive earnings environment while
changes in earnings that fall into the lowest 25th4 percentile are classified as being in a
negative earnings environment. The rest are classified as being in a normal earnings
environment.
Gnewsit is a dummy variable equal to 1 if a firm year is in a positive earnings
environment and equal to zero otherwise
BNewsit is a dummy variable equal to 1 if a firm year is in a negative earnings
environment and equal to zero otherwise
SIZEit is the market capitalization of the firm at the beginning of each accounting
year.
SECTORit is a set of dummy variables for the FT sector to which the company
belongs (the ten sectors are Resources, Basic Industries, General Industries, Cyclical
consumer goods, Non cylical consumer goods, Cyclical services, Non Cyclical
services, Utilities, Financials, and Information technology).
4 Our results are robust to using the 10th and 5th change in earnings percentile.

YEARit is a set of dummy variables for the accounting year in which the disclosures
are made, and ranges from 1994 to 1997 and 2000 to 2002.5
We run a fixed effects panel regression6 model using the arrival rate of news (OTL’s)
as our dependent variable. Looking at the results of the first regression in Table 3
Panel A the coefficient on the negative earnings environment dummy is significant at
the 1% level while the dummy for the positive earnings environment is not significant
which provides evidence to reject the hypothesis that the earnings environment does
not have an effect on disclosure rate. Market capitalization is positively related to the
disclosure rate, so that larger firms are more likely to make disclosures (though only
significant at the 13% level).
We control for analyst and media coverage in our model by classifying firms into the
three FTSE index categories i.e. FTSE 100, FTSE 250 and the FTSE Small in order of
the external coverage that would be expected in these categories There is a larger
number of analyst following for firms that belong to a larger index (Denis et al. 2003)
We create a dummy variable for each of the three categories. This was then multiplied
with the total market capitalization to create an interaction effect. Equation (1) was re-
estimated as
yit = b0 + b1GNewsit + b2BNewsit + b4 Sizeit + b5Sectorit + b6Yearit
+ b7 SIZEit*Dummy(FT100) + b8 SIZEit*Dummy(FT250) + εit (2)
The results are shown in Table 3, Panel B. The results for the news environment are
the same as in the previous regression i.e. there is a significant positive relationship
between a negative earnings environment and news arrival rate at the 1 % level while
there is no significant relationship between being in a positive earnings environment
and news arrival rate. The panel regression results also show a U shape relationship
between firms in the three FTSE categories i.e. a negative and significant relationship
5 We also test the model using leverage as another control variable but do not find any significant relationship 6 A Hausman test determined that a random effects specification was inappropriate.
for firms in the FTSE small category and a positive and significant relationship for
firms in the FTSE large and mid cap categories.
Our results indicating higher disclosure during negative earnings year concur with
results obtained by Sloan and Skinner (2001), Skinner (1994), Payne and Robb (2000)
who conducts studies on US data and show that managers increase the flow of
information during bad news periods. Managers therefore would be releasing the
information earlier as a means of getting the ‘bad news’ out early to the investment
community in order to avoid a negative earnings surprise on the earnings
announcement date. A surprise on the earnings announcement date could be seen as
being more costly than the release of the news in the days preceding the earnings
announcement. However our results do not provide evidence to show a relationship
between size and regulatory news announcements in our pooled sample.
The negative relationship between firms in the FTSE small category and news arrival
rates implies that in the FTSE small category the smallest firms (which would be the
companies expected to receive the least coverage) release more information as a
means of signalling their presence to the markets. In doing so they would perceive a
value to investor recognition in the market. Merton (1987) proposes a model where
investor recognition of stocks would be an important determinant of firm value.
Support for Merton’s model has been documented in a number of empirical studies. In
the cross listing literature for instance Doidge et al (2004) show that foreign firms
listed in the US have greater Tobin’s Q in comparison with firms not listed in the US.
Grullon et al (2004) show a positive and significant impact of advertising on the
breadth of ownership and liquidity. Coval and Moskowitz (1999) also show that
investors tend to invest in stocks they are more familiar with. Therefore the smallest
firms in the FTSE Small category that are covered least by information agents would
use other alternatives to increase their profile in the markets and voluntary corporate
disclosures would be one such avenue.
Dividing our sample into periods of 1994-1997 and 2000-2002 (Table 4 Panel A and
B) we do not find any evidence to show that disclosure rate is higher when
companies are in a negative earnings environment or in a positive earnings
environment in the pre-FSA period, neither do we find any significant relationship

with the market capitalization variables. However in the second time period we notice
that we obtain the same results as our pooled regression i.e. firms release more
information when in a negative earnings environment. This suggests that the results in
Table 3 are mainly driven by the post-FSA period which provides evidence to show
that since the formation of the FSA, there has been a marked difference in the pattern
of news disclosure7. When we control for the FTSE category that a firm belongs to we
obtain the same results as in the pooled regression for the post-FSA period, i.e.
positive relation between being in a negative earnings environment and news arrival
rates and a U shape relationship between the three FTSE categories and voluntary
disclosure rates.
Whereas there is no significant pattern in either the good or negative earnings
environment in the pre-FSA period there is a significant increase in disclosure when
firms are in a negative earnings environment post FSA. Firms would prefer the bad
news to be known to the market over a period of time rather than as a surprise on the
earnings announcement date. Matsumoto (2002) suggests that managers have strong
incentives to avoid negative earnings surprises because such surprises generally lead
to negative price revisions and overall negative publicity for the firm. The
introduction of the FSA would also make firms more conscious of negative publicity
as this could also be the basis for litigation for non disclosure of price sensitive
information. Moreover the business press focuses more heavily on earnings surprises
than on intervening forecast revisions. The above argument assumes that firms would
not be too concerned about not releasing price sensitive information earlier when in a
positive earnings environment. Skinner (1994) argues that investors can be more
sensitive to negative price revisions than to positive price revisions Investors have a
higher chance of being successful in arguing that they suffered a loss which could
have been avoided if managers disclosed information on a timely basis. However
chances of success are slim in arguing that they suffered an opportunity cost in
foregoing a stock price increase that happened after a security was sold because of the
delay in good news (Kothari 2005).
7 In a separate regression we find that disclosure in general is higher in the post FSA period which provides evidence again to show that the new regulatory regime has had the impact of increasing corporate disclosure practices.

In summary our results show that firms release more news announcements in bad
news environments and that this effect is more pronounced in the post-FSA period.
An implication of this finding is that investors may use the information of increased
news announcements as an indicator that the firm is in a bad news environment. In an
efficient market this relationship will result in stock prices reflecting the value of this
information. In the next section we investigate how stock prices react to a high rate of
news disclosures.
Market Reaction
We examine the share price characteristics of firms classified as being in a negative
earnings environment in the second sample period (2000-2002). This period is chosen
because it has been shown to be the period where firms noticeably increase the flow
of news information in a negative earnings period. We divide firms in the negative
earnings environment into high and low disclosure categories. High disclosers are
firms whose rate of news arrivals falls into the top 50th percentile for a given year and
vice versa for low disclosure firms. Table 5 shows the average excess return over a
220 day time period before the earnings announcement and a 20 day time period after
the earnings announcement. The long window before the earnings announcement
reflects the current accounting year in which the managers of these firms discover that
they are in a negative earnings environment. Excess returns are computed as the daily
raw return less the daily return on the FTSE All-Shares index. Average excess returns
are also shown one day prior to the earnings announcement date, on the earnings
announcement date and one day after the earnings announcement date. The same
pattern is reported for OTL news announcement dates.
The first row of Panel A shows that firms in the negative earnings environment indeed
had negative average daily excess returns of 0.03 per cent, and this confirms our
definition of a negative earnings environment. There is a positive return on the date of
the earnings announcement which suggests that the market did not react negatively to
the earnings announcement and is consistent with companies having released the bad
news earlier and also that companies might have overstated the amount of bad news to
avoid a negative earnings surprise. This is also supported by the negative returns one
day prior to the earnings announcement date.
Average excess returns on a news announcement date is negative implying that on
average the news released was ‘bad’ news for this sample of firms in the negative
earnings environment8.
Panels B and C of Table 5 show the excess returns for companies classified into the
high and low disclosure categories. High disclosure companies on the average had
lower returns (more negative) than low disclosure companies and also had on average
lower returns on the news announcement dates. On the earnings announcement dates
however, high disclosure companies had positive excess returns, while low disclosure
companies had negative returns. We do not find any significant difference in the
change in earnings per share between the two categories of high and low disclosure
companies. This suggests that companies that had a higher flow of information
released ‘more’ bad news earlier which explains why they had a higher negative
return on the date of the news announcement and why the earnings per share was
positive as opposed to negative on the date of the earnings announcement. However
considering that the high and low disclosure categories did not have a significant
difference in their change in earnings per share (t value of -1.54). There is also
evidence to show that on the average the market over reacted to more news
announcements, as the average return over the time period is lower for firms that
released more information9.
Figure I depicts the cumulative excess returns for the two categories of high and low
disclosure firms over the period and reaffirms that high disclosers had more negative
average returns. The stock prices of high disclosers start to fall early in the accounting
year presumably because of the disclosure of bad news. The low disclosers’
cumulative excess returns are fairly constant throughout the first half of the
accounting year, and only start to decrease as the announcement date approaches. The
graph also shows that high disclosure companies had dips in stock prices ahead of the
earnings announcement period as a result of their news announcements, relative to
low disclosure companies. Around the earnings announcement the high disclosers
experience an increase in share prices, even though the earnings announcement, by 8 We also run a control sample for firms in a positive earnings environment , where we obtain opposite results. 9 Another explanation which has not been explored here is that the content of news of the high news companies related to periods beyond the current accounting year.

definition for this sample of companies in a negative earnings environment, is bad
news. The implication is that the news releases throughout the accounting year for the
high disclosers had conditioned the market to expect poor earnings figures, and
typically the market reacts positively when the actual earnings are released.
V Conclusions
This paper has modelled the arrival rate of voluntary news announcements, by
investigating the distribution of news announcements through the Regulatory News
Service for FTSE all share companies on the London Stock Exchange. Our primary
objective was to test whether there is an association between the earnings
environment in which the company operates and disclosure practices. We also
investigated whether the new regulatory regime of the FSA has had an impact on
news arrival rates.
We first established that the volatility of returns rises on the day of a news
announcement, suggesting that news disclosures have a real effect on capital markets.
Our results show that firms increase the flow of information when in a negative
earnings environment and that this relationship is observed in the post-FSA period as
opposed to the pre-FSA period. We however do not find evidence to show that
companies increase the flow of information when in a positive earnings environment
which reflects a bias in reporting news more often than when in a negative earnings
environment.
We also observed a positive relationship between disclosure rates and market
capitalisation. However we observed a U-shaped relationship between disclosure and
the FTSE index category to which a firm belongs, supporting our view that companies
in the FTSE small-sector category release information as a means of signalling their
presence to the capital markets.
Our tests on market reaction show that high disclosure firms in a negative earnings
environment had lower average returns over a 220 day return prior to earnings
announcement and 20 day return after the earnings announcement, relative to low
disclosers.

The results on the post-FSA period suggest that firms have been more conscious of
negative earnings surprises in the post-FSA period, which supports the view that the
effects of regulation has been to improve the flow of information to capital markets.
This paper adds to the debate on the effectiveness of financial regulation by showing
how the FSA taking over the UKLA has had an impact on corporate disclosure
practices.

References
Atiase, A. (1985). "Predisclosure information, firm capitalisation, and security price behavior around earnings announcements." Journal of Accounting Research 23, 21-36 Ajinkya, B.B., and M.J. Gift. (1984). “Corporate managers earnings forecasts and symmetrical adjustments of market expectations.” Journal of Accounting Research 22, 425-44 Bamber, L.S., and Y. Cheon. (1998). " Discretionary management earnings forecast disclosures: antecedents and outcomes associated with forecast venue and forecast specificity choices." Journal of Accounting Research 36, 167-190 Bhushan, R. (1980). "Firm characteristics and analyst following." Journal of Accounting and Economics 11, 255-274 Brown, L.D, P. Griffin, R. Hagerman, and M. Zmijewski. (1987) “An evaluation of alternative proxies for the market’s assessment of unexpected earnings.” Journal of Accounting and Economics 9, 159-194 Bulkley, I.G., and R. Herrerias. (2004). “Stock Returns Following Profit Warnings: Evidence for Behavioral Finance.”, forthcoming European Financial Management. Bushee, B.J, and C.F.Noe. (2000). “Corporate disclosure practices, institutional investors, and stock return volatility”, Journal of Accounting Research 38,171-202 Coval, J D., T.J. Moskowitz., (1999). “Home bias at home: local equity preference in domestic portfolios.” Journal of Finance 54, 2045-2073. Denis, K.D., J.J. McConnell, and A.V. Ovtchinnikov. (2003). “S&P 500 index additions and earnings expectations.” Journal of Finance 58, 1821-1840. Doidge, C., A. Karolyi and R. Stulz., (2004). “Why are foreign firms listed in the US worth more.” Journal of Financial Economics 71, 205-238. Grullon, G., G. Kanatas and J. Weston., (2004). “Advertising, breadth of ownership and liquidity.” Review of Financial Studies 17, 439-461. Healy, P.M., and P.M. Palepu. (2001). “Information asymmetry, corporate disclosure, and the capital markets: A Review of the Empirical Disclosure Literature.”, Journal of Accounting and Economics 31, 405-440. Hillier, D. and A. Marshall, (2002). “The market evaluation of the information in director’s trades.” Journal of Business Finance and Accounting 29, 77-110 Kothari, S.P. (2005). “Do Managers withhold bad news.” MIT Sloan School of Management , Working paper 4556-05 Lev, B., and S.H. Penman. (1990). “Voluntary Forecasts Disclosures, Nondisclosure and Stock Prices.” Journal of Accounting Research 28, 49-76

Libby, R. and H. Tan (1990). “Analysts reactions to warnings of negative earnings surprise.” Journal of Accounting Research 37, 415-435 Lim, T. (2001). “Rationality and analyst’s forecasts bias.” Journal of Finance 56, 369-385 Matsumoto. D.A. (2002). “Management’s incentives to avoid negative earnings surpises.” The Accounting Review 77, 483-514 McNichols, M. (1989). “Evidence of international asymmetries from management earnings forecasts and stock returns.” The Accounting Review 64, 1-27 Merton, R.C., (1987). “A simple model of capital market equilibrium with incomplete information”, Journal of Finance 42, 483-510 Payne, J.L., and S.W.G. Robb. (2000). “Earnings management: The effect of ex ante earnings expectations. Journal of Accounting, Auditing and Finance 15, 371 Patell, J.M. (1976). “Corporate forecasts of earnings per share and stock price behaviour: Empirical Tests.” Journal of Accounting Research 14, 246-76. Penman, S.H. (1980). “An Empirical Investigation of the voluntary disclosure of corporate earnings forecasts.” Journal of Accounting Research 18, 132-60. Pownall, G, C. Wasley and G. Waymire. (1993). “The stock price effects of alternative types of management earnings forecasts.” The Accounting Review 68, 896-912 Richardson, S., S.H. Teoh and P. Wysocki. (2003) “ The walkdown to beatable analyst forecasts the role of equity issuance and insider trading incentives.” forthcoming Contemporary Accounting Research Skinner, D.J. (1994). “Why firms voluntarily disclose bad news.” Journal of Accounting Research 32, 38-60 Skinner, D.J., and R.J. Sloan. (2002). “Earnings surprises, growth expectations and stock returns.” Review of Accounting Studies 7, 289 Thomas, S. (2002). “Firm diversification and asymmetric information evidence from analysts forecasts and earnings announcements.” Journal of Financial Economics 64, 373-396.
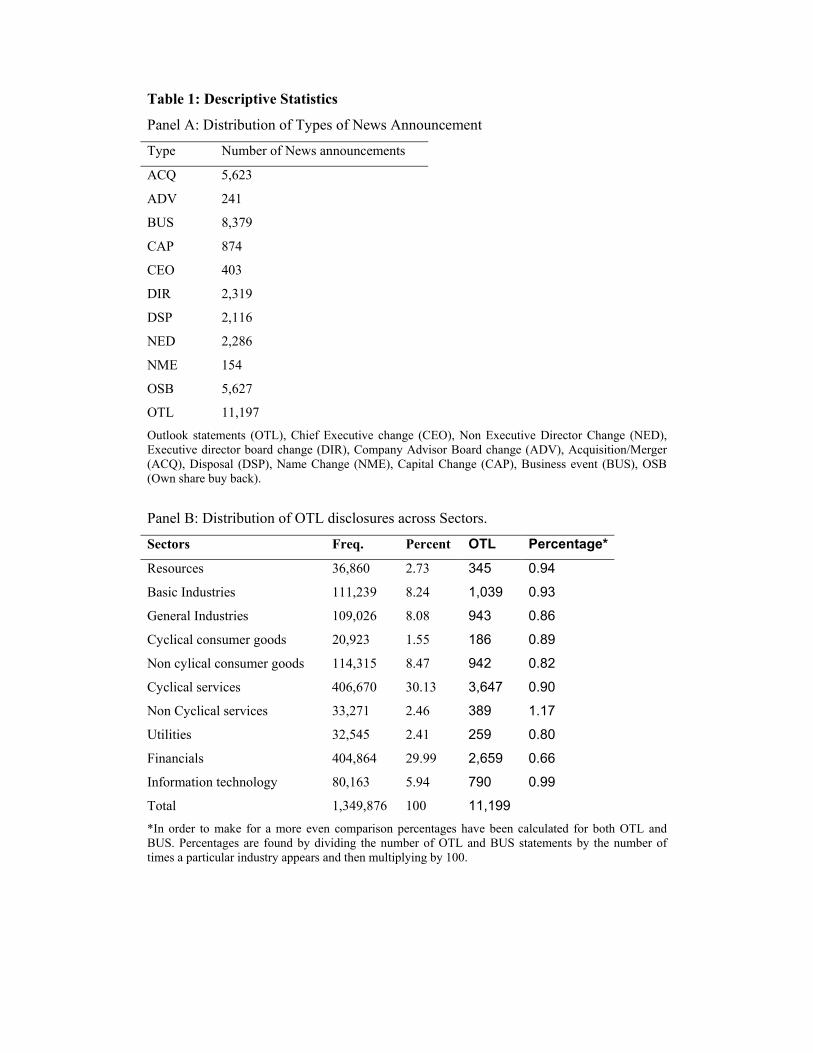
Table 1: Descriptive Statistics
Panel A: Distribution of Types of News Announcement
Type Number of News announcements
ACQ 5,623
ADV 241
BUS 8,379
CAP 874
CEO 403
DIR 2,319
DSP 2,116
NED 2,286
NME 154
OSB 5,627
OTL 11,197 Outlook statements (OTL), Chief Executive change (CEO), Non Executive Director Change (NED), Executive director board change (DIR), Company Advisor Board change (ADV), Acquisition/Merger (ACQ), Disposal (DSP), Name Change (NME), Capital Change (CAP), Business event (BUS), OSB (Own share buy back).
Panel B: Distribution of OTL disclosures across Sectors.
Sectors Freq. Percent OTL Percentage*
Resources 36,860 2.73 345 0.94
Basic Industries 111,239 8.24 1,039 0.93
General Industries 109,026 8.08 943 0.86
Cyclical consumer goods 20,923 1.55 186 0.89
Non cylical consumer goods 114,315 8.47 942 0.82
Cyclical services 406,670 30.13 3,647 0.90
Non Cyclical services 33,271 2.46 389 1.17
Utilities 32,545 2.41 259 0.80
Financials 404,864 29.99 2,659 0.66
Information technology 80,163 5.94 790 0.99
Total 1,349,876 100 11,199 *In order to make for a more even comparison percentages have been calculated for both OTL and BUS. Percentages are found by dividing the number of OTL and BUS statements by the number of times a particular industry appears and then multiplying by 100.

Table 2: Returns Around News Announcements
Part I: Security Daily Returns with and without news announcements
Variable Obs Mean (%) Std.Dev Std.Error Panel A: Days with no news announcements Raw Return 1,310,186 0.03*** 2.34 0.002
Excess Return 1,310,186 0.01*** 2.35 0.002
Panel B: Days with news announcements Raw Return 39,220 0.17*** 5.20 0.03
Excess Return 39,220 0.21*** 5.15 0.03
Excess Returns (Using OTL only) 11,197 -0.21*** 6.55 0.06
Excess returns are calculated as the daily return of a company less the return on the FTSE All Share index *** represents significance at the 1% level.

Table 2 (cont.)
Part II: Daily Volatility of Excess Returns Around News Announcements
Lag3 Lag2 Lag1 Day 0 Lead1 Lead2 Lead3
Panel A: With no news announcements
Obs 1310185 1310185 1310185 1310185 1310185 1310185 1310185
Mean 6.10*** 6.1*** 6.09*** 5.52*** 6.12*** 6.14*** 6.12***
Std.Dev. 373.74 373.74 373.35 372.12 373.48 373.90 373.84
Std Error 0.33 0.33 0.33 0.33 0.33 0.33 0.33
Panel B: With news announcements
Obs 39220 39220 39220 39220 39220 39220 39220
Mean 7.22*** 7.06*** 7.57*** 26.56*** 6.79*** 6.13*** 6.51***
Std.Dev. 79.4 80.47 126.43 214.93 112.62 46.64 61.7
Std Error 0.57 0.24 0.31
Panel C: when news announcements is OTL
Obs 11197 11197 11197 11197 11197 11197 11197
Mean 6.28*** 6.91*** 7.51*** 42.99*** 5.23*** 5.07*** 6.55***
Std.Dev. 61.23 87.02 123.03 217.57 33.33 33.49 90.77
Std Error 1.16 0.82 0.58 2.06 0.32 0.32 0.86
Panel D: when news announcement is OTL & there is an earnings announcement
Obs 5741 5741 5741 5741 5741 5741 5741
Mean 6.26*** 4.93*** 6.43*** 36.09*** 5.24*** 4.88*** 5.71***
Std.Dev. 57.24 23.96 51.22 181.28 34.40 25.21 51.76
Std Error 0.68 0.32 0.76 2.39 0.45 0.33 0.68
Panel E: When news announcement is OTL & there are no earnings announcement
Obs 5456 5456 5456 5456 5456 5456 5456
Mean 6.29*** 8.99*** 8.63*** 50.25*** 5.22*** 5.26*** 7.44***
Std.Dev. 65.16 122.19 168.23 249.94 32.17 40.41 118.7
Std Error 2.28 1.65 0.88 3.39 0.44 0.55 1.61
Lag 3,2 and 1 represents 3, 2 and 1 day before the event. Lead 1,2,3 represent 1,2 and 3 days after the event. *** Represents significance at the 1% level.
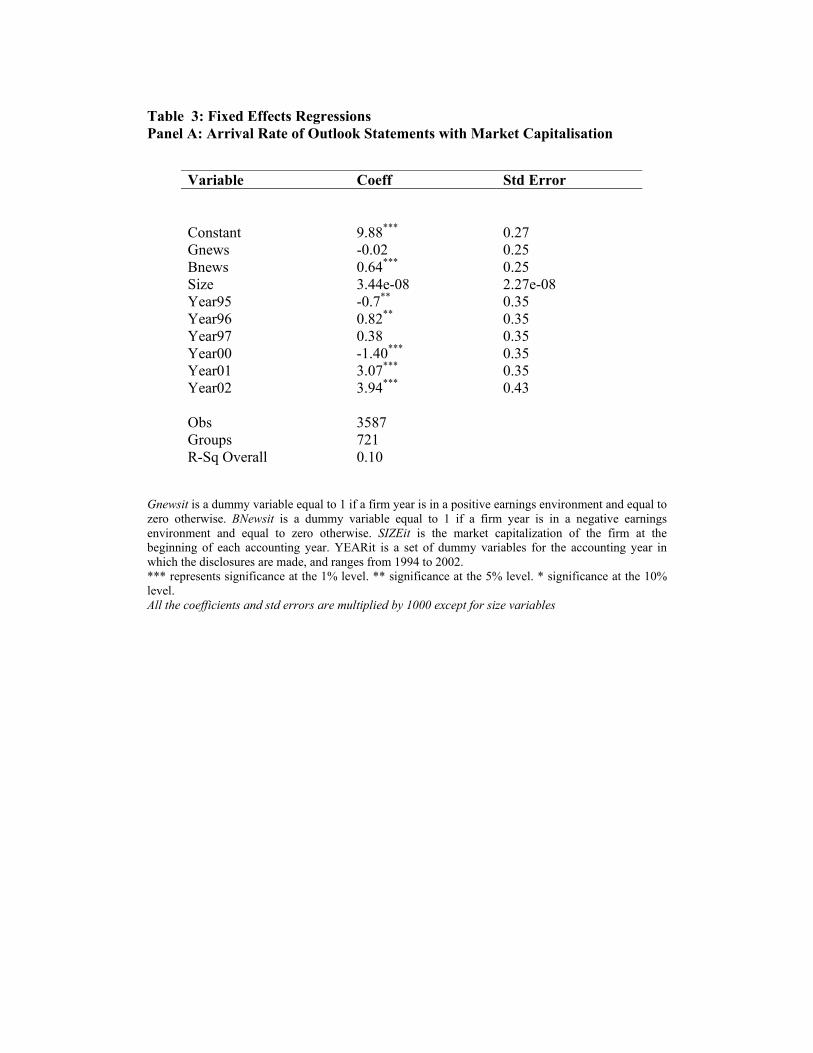
Table 3: Fixed Effects Regressions Panel A: Arrival Rate of Outlook Statements with Market Capitalisation
Variable Coeff Std Error
Constant 9.88*** 0.27 Gnews -0.02 0.25 Bnews 0.64*** 0.25 Size 3.44e-08 2.27e-08 Year95 -0.7** 0.35 Year96 0.82** 0.35 Year97 0.38 0.35 Year00 -1.40*** 0.35 Year01 3.07*** 0.35 Year02 3.94*** 0.43 Obs 3587 Groups 721 R-Sq Overall 0.10
Gnewsit is a dummy variable equal to 1 if a firm year is in a positive earnings environment and equal to zero otherwise. BNewsit is a dummy variable equal to 1 if a firm year is in a negative earnings environment and equal to zero otherwise. SIZEit is the market capitalization of the firm at the beginning of each accounting year. YEARit is a set of dummy variables for the accounting year in which the disclosures are made, and ranges from 1994 to 2002. *** represents significance at the 1% level. ** significance at the 5% level. * significance at the 10% level. All the coefficients and std errors are multiplied by 1000 except for size variables

Table 3 (cont.) Panel B: Fixed Effects Regression of Arrival Rate of Outlook Statements with market capitalisation broken down into component parts
Variable Coef Std Error
Constant 9.97*** 0.28 Gnews -0.23 0.24 Bnews 0.62*** 0.25 Large Cap 1.07e-06*** 3.14e-07 Mid Cap 1.12e-06*** 4.12e-07 Small Cap -1.03e-06*** 3.14e-07 Year95 -0.70** 0.35 Year96 0.83** 0.35 Year97 0.39 0.35 Year00 -1.35*** 0.35 Year01 3.06*** 0.35 Year02 3.87*** 0.43 Obs = 3587 Groups = 721 R-Sq Overall = 0.10
Gnewsit is a dummy variable equal to 1 if a firm year is in a positive earnings environment and equal to zero otherwise. BNewsit is a dummy variable equal to 1 if a firm year is in a negative earnings environment and equal to zero otherwise. Large Cap, Medium Cap and Small Cap represents market capitalisation for firms that fall into the large, medium and small cap categories. YEARit is a set of dummy variables for the accounting year in which the disclosures are made, and ranges from 1994 to 2002. *** represents significance at the 1% level. ** significance at the 5% level. * significance at the 10% level. We split the market capitalisation of our sample into large capitalization stocks, mid capitalization stocks and small capitalization stocks. We then create a dummy variable for each of the three types of market capitalization. This was then multiplied with the total market capitalization to create an interaction effect in the form of bSizeit + b SIZEit(DummyFT100)+ b SIZEit(DummyFT250), where bSizeit proxies for small cap companies All the coefficients and std errors are multiplied by 1000 except for size variables
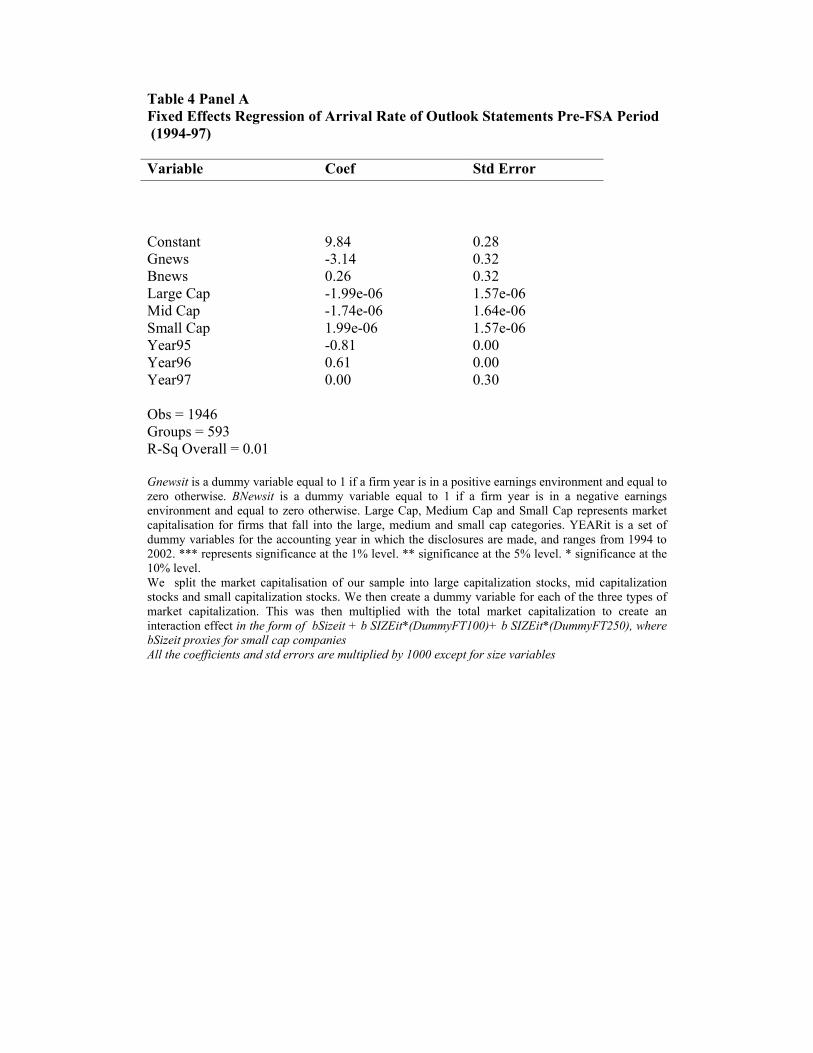
Table 4 Panel A Fixed Effects Regression of Arrival Rate of Outlook Statements Pre-FSA Period (1994-97) Variable Coef Std Error
Constant 9.84 0.28 Gnews -3.14 0.32 Bnews 0.26 0.32 Large Cap -1.99e-06 1.57e-06 Mid Cap -1.74e-06 1.64e-06 Small Cap 1.99e-06 1.57e-06 Year95 -0.81 0.00 Year96 0.61 0.00 Year97 0.00 0.30 Obs = 1946 Groups = 593 R-Sq Overall = 0.01 Gnewsit is a dummy variable equal to 1 if a firm year is in a positive earnings environment and equal to zero otherwise. BNewsit is a dummy variable equal to 1 if a firm year is in a negative earnings environment and equal to zero otherwise. Large Cap, Medium Cap and Small Cap represents market capitalisation for firms that fall into the large, medium and small cap categories. YEARit is a set of dummy variables for the accounting year in which the disclosures are made, and ranges from 1994 to 2002. *** represents significance at the 1% level. ** significance at the 5% level. * significance at the 10% level. We split the market capitalisation of our sample into large capitalization stocks, mid capitalization stocks and small capitalization stocks. We then create a dummy variable for each of the three types of market capitalization. This was then multiplied with the total market capitalization to create an interaction effect in the form of bSizeit + b SIZEit*(DummyFT100)+ b SIZEit*(DummyFT250), where bSizeit proxies for small cap companies All the coefficients and std errors are multiplied by 1000 except for size variables

Table 4 Panel B Fixed Effects Regression of Arrival Rate of Outlook Statements Post-FSA period (2000-02) Variable Coef Std Error
Constant 9.09 0.42 Gnews 0.26 0.54 Bnews 0.82 0.48 Large Cap 7.53e-07*** 3.91e-07 Mid Cap 1.19e-06*** 6.12e-07 Small Cap -1.05e-06*** 3.78e-07 Year01 4.46 0.32 Year02 6.21 0.47 Obs = 1641 Groups = 720 R-Sq Overall = 0.02 Gnewsit is a dummy variable equal to 1 if a firm year is in a positive earnings environment and equal to zero otherwise. BNewsit is a dummy variable equal to 1 if a firm year is in a negative earnings environment and equal to zero otherwise. Large Cap, Medium Cap and Small Cap represents market capitalisation for firms that fall into the large, medium and small cap categories. YEARit is a set of dummy variables for the accounting year in which the disclosures are made, and ranges from 1994 to 2002. *** represents significance at the 1% level. ** significance at the 5% level. * significance at the 10% level. We split the market capitalisation of our sample into large capitalization stocks, mid capitalization stocks and small capitalization stocks. We then create a dummy variable for each of the three types of market capitalization. This was then multiplied with the total market capitalization to create an interaction effect in the form of bSizeit + b SIZEit(DummyFT100)+ b SIZEit(DummyFT250), where bSizeit proxies for small cap companies All the coefficients and std errors are multiplied by 1000 except for size variables

Table 5: Excess Returns for firms in the negative earnings environment (2000-02) % Avg Rt Rteps-1 Rteps Rt Eps+1 RtNews-1 RtNews RtNews+1 Panel A: All firms in negative earnings environment (00-02) Obs 93,705 389 389 389 1192 1192 1192
Mean -0.03*** -0.21 0.16 0.41* -0.2* -2.23*** -0.01
Std Dev 3.31 3.43 8.81 4.48 4.03 10.64 5.6
Std Error 0.01 0.17 0.41 0.23 0.12 0.31 0.16 Panel B: High Disclosure Companies in negative earnings environment (00-02) 165 companies Obs 43366 180 180 180 789 789 789 Mean -0.08*** -0.12 0.39 0.58* -0.26* -2.74*** 0.019
Std Dev 3.71 3.78 8.11 4.54 4.49 11.6 6.12
Std Error 0.02 0.28 0.60 0.34 0.16 0.41 0.22 Panel C: Low Disclosure Companies in negative earnings environment (00-02) 164 companies Obs 43593 181 181 181 368 368 368 Mean -0.02 -0.3 -0.1 0.36 -0.14 -1.42*** -0.12 Std Dev 2.77 3.13 8.46 4.43 2.86 8.1 4.5 Std Error 0.01 0.23 0.63 0.33 0.15 0.42 0.23 Avg Rt is the average excess return over 220 days before an earnings announcement and 20 days after an earnings announcement. Rteps-1, Rteps, Rteps+1 represents the average excess return 1 day before the earnings annoucmenet, on the earnings announcement date and one day after the earnings annoucmenet. RtNews-1, RtNews and RtNews+1 represents the average excess return 1 day before the release of an outlook statement, on the day of a release of an outlook statement and one day after the release of an outlook statement. *** represents significance at the 1% level. ** significance at the 5% level. * significance at the 10% level.

Figure 1: Cumulative Excess Returns for High and Low Disclosers in a Negative Earnings Environment
Cumulative Excess Returns for high and low disclosers in negative earnings environment
-0.2500
-0.2000
-0.1500
-0.1000
-0.0500
0.0000
0.0500
-220
-212
-204
-196
-188
-180
-172
-164
-156
-148
-140
-132
-124
-116
-108
-100 -92 -84 -76 -68 -60 -52 -44 -36 -28 -20 -12 -4 4 12 20
Day
Cum
ulat
ive
exce
ss re
turn
s
High DisclosersLow Disclosers
High Disclosers are the cumulative excess returns for the companies in the high disclosure category. Low Disclosers are the cumulative excess returns for the companies in the low disclosure category. Excess returns are the difference between the cumulated daily raw returns and the cumulated daily FTSE all share index returns. Day 0 is the earnings announcement date at the end of the current year, and the chart starts from day -220 before the earnings announcement date and continues to day 20 after the earnings announcement.