the impact of voluntary disclosures on sell-side analyst
TRANSCRIPT
The Impact of Voluntary Disclosures on Sell-Side Analyst Stock Recommendations: Australian Evidence
By
Worrawan T. Laohapolwatana*, Malcolm Smith**, and Brian Howieson***
*School of Commerce, University of South Australia
*School of Accounting, Finance and Economics Edith Cowan University
** University of Adelaide Graduate Business School
School of Accounting, Finance and Economics & FIMARC Working Paper Series Edith Cowan University
November 2005 Working Paper 0511
Correspondence author: Professor Malcolm Smith School of Accounting, Finance & Economics Edith Cowan University 100 Joondalup Drive Joondalup WA 6027 Western Australia Phone: 61+ (8) 6304 5623 Fax: 61+ (8) 6304 5271 Email: [email protected]
Abstract
This paper investigates the impact of voluntary disclosures on sell-side analyst stock recommendations. It uses content analysis method to measure quality of information disclosures and emphasis on particular themes. The focus of this study is on changes in analyst recommendations and the new information disclosures that have been made public since the previous revision of recommendation. The proxies for voluntary disclosures are information released by firms via company announcements and associated media reports. The characteristics of these disclosures are examined to explore their impact on the changes in analysts’ stock recommendations. Based on a sample of over 200 recommendation revisions of 40 listed Australian companies, the results suggest that voluntary disclosures do contribute to analyst stock revisions. The findings reveal that the quantity of disclosures is positively associated with the number of recommendation revisions, and that disclosures with favourable signals or with price-sensitive contents are significantly related to the direction and type of analyst revisions. In addition, disclosure of specific themes (e.g., dividend and product) in company announcements and news are significantly associated with the recommendation change. This has implications for both the formulation of accounting policies and the regulation of financial disclosure.
Acknowledgements: The authors acknowledge the support of Thomson Financial in the conduct of this research through their provision of data from the Institutional Brokers Estimate System (I/B/E/S) service. This data has been provided as part of a broad academic program to encourage earnings expectation research. The authors acknowledge the helpful comments from participants at the BAA Annual Conference (2004), University of York.
1. Introduction
Changes in the business environment such as globalisation, financial deregulation, and
technological advances require that companies increasingly seek to communicate with outside
parties to keep up with rapid growth and competition. Healy and Palepu (2001) note that, in
the capital market economy, corporate disclosures play an important role in spreading
information to the relevant parties outside the companies. Accounting information is useful to
shareholders, suppliers, creditors, potential investors, analysts, and others because they can
use such information to assess a business, update subjective estimations, and make effective
decisions on investing their resources in a company. Healy and Palepu (1993) also assert that
information disclosure becomes a distinctive strategy as companies try to communicate
information to the financial markets in order to raise capital.
Apart from mandatory disclosures to disseminate company information, companies can
additionally present discretionary information to accompany the mandated requirements, and
many choose to do so. This view is in line with the report of the Business Research Project
by the Financial Accounting Standards Board (FASB 2001), which studies the voluntary
disclosure of business information. The report (FASB 2001, p. 3) concludes that voluntary
disclosure is useful to investors and indicates that “effective voluntary disclosure can provide
more transparency and understanding about the company to investors and creditors”. The
same report also finds that there are a variety of companies currently willing to disclose some
of their critical business information voluntarily and that voluntary disclosure appears to be
valuable in communicating information to investors and creditors.
The importance of company information is evident to users as they use such information
for their decision-making process. Therefore users are persons who perceive and make
judgements as to what information is important and useful. This corresponds to the view
noted by Wallman (1995, p. 83) in that the value and worth of financial reporting lie in its
usefulness to users. The AICPA Special Committee (1994, Chapter 1-2), which studied
users’ information needs, simply grouped users into two categories, namely professionals and
non-professionals. This grouping is based on skills, resources, and purposes to make
decisions using accounting information. However, professional users - including analysts,
brokers, and others - are the focus of the AICPA’ report. Professional users, especially
2
financial analysts, generally base their decisions on superior models; they control a significant
proportion of capital in the market; and more non-professional users tend to rely on the advice
of professionals as the market place is constantly changing and becomes much more complex
(AICPA 1994, Chapter 2).
In this regard, Schipper (1991, p.105) notes that “it makes sense to study analyst
decision processes because analysts are among the primary users of financial accounting
information”. Analysts are important in the sense that they are intermediaries who receive and
process financial information for investors. Healy and Palepu (2001) lend support to this idea
and conclude from their evidence that analysts create value in the capital market through their
provision of an analysis of company information to investors. Schipper (1991, p.112)
summarise the major tasks of analysts as to collect company information from various sources,
analyse company performance, make earnings forecasts, and arrive at buy/hold/sell
recommendations. These activities result in two kinds of analysts’ work, namely analysts’
earnings forecasts and analysts’ stock recommendations. Healy and Palepu (2001, p.416)
note that analysts’ forecasts and recommendation reports are the principal focus of academic
research relevant to the assessment of information intermediaries. Analysts intensely use
financial information to reach their decisions, thus the quality of their work is influenced by
the quality of the information they use. Analysts, as the key users of corporate information,
are sophisticated users who can realistically be regarded as representatives of prime user
groups and can be assumed to be able to use information effectively. Hence, a study of
analysts’ work should enable us to examine the decision usefulness of corporate information.
The primary purpose of this study is to contribute to the existing knowledge on how
company voluntary disclosures are decision useful to investment analysts as major users of
corporate information. It aims to assess the decision usefulness of voluntary accounting
disclosures by examining the nature of analysts’ stock recommendations. The study examines
the relationship between the characteristics of voluntary disclosures and the properties of
analysts’ recommendations by observing whether voluntary disclosures are useful and
relevant to analysts’ decision-making process given that analysts use corporate voluntary
information to reach conclusions in their work. It then seeks to determine the impact of the
extent of voluntary information disclosure on the attributes of analysts’ recommendations.
3
In doing so, this study investigates the analysts’ recommendation revisions (the changed
rating) for company stocks. The analysts’ recommendation revisions are central to this paper
in measuring the decision usefulness of corporate voluntary disclosure. After the
recommendation revisions (revised ratings) have been gathered, the period between the old
and new ratings can be determined, and the voluntary disclosures during the change period are
identified and matched with the corresponding recommendation revisions. The characteristics
of voluntary disclosures over the same period of change are later examined to determine
whether they can explain the properties of recommendation revision.
Based on a sample of over 200 recommendation revisions of 40 listed Australian
companies, the results suggest that voluntary disclosures1 help to explain the variations in
analyst recommendation revisions. The results reveal that the quantity of disclosures is
positively associated with the number of recommendation revisions, and that disclosures with
favourable signals or with price-sensitive contents are significantly related to the direction and
type of recommendation revisions. In addition, disclosure of specific themes (e.g., dividend
and product) in company announcements and news are significantly associated with the
recommendation change.
The remainder of this paper is organised into four further sections. Section two
provides a review of the literature and develops hypotheses. Section three explains the
sample and data collected, and discusses the research method employed. Section four reports
the results. Finally, Section five provides conclusions, implications, limitations and possible
extensions of the study.
2. Literature Review, Related research and development of hypotheses
2.1 Related Research
The motivation for this study arises from an extensive review of the voluntary
disclosure literature, most notably the contribution of Healy and Palepu (2001). The literature
shows that the benefits of voluntary disclosures have long been recognised and investigated
from many different perspectives. The studies on the benefits of voluntary disclosures are
important for the current initiatives to improve the quality of business reporting process and

4
firm disclosure strategy. The FASB Steering Committee Report (FASB 2001) states
that many leading companies are voluntarily disclosing an extensive amount of information to
investors and predicts that the importance of voluntary disclosures is expected to increase in
the future because of the fast pace of change in the business environment.
Voluntary disclosures themselves have also been proved to have importance to capital
markets as evidenced from a number of empirical studies in this area. Benefits of disclosures
to the company are well-documented in the literature. Companies making voluntary
disclosures can gain perceived market benefits in the form of improved stock liquidity,
reduced cost of capital, and increased information intermediation (Healy & Palepu 2001) and
increased stock liquidity and investor attractiveness (Diamond & Verrechia 1991). A number
of empirical studies support these assertions: Welker (1995) finds that firms with a well-
regarded disclosure policy have lower bid-ask spreads, which are a proxy for the information
asymmetry component of the cost of capital; Healy, Hutton, and Palepu (1999) find that firms
with increased disclosures have lower bid-ask spreads and conclude that expanded disclosures
lead to increases in stock liquidity and attract more institutional investors. Leuz and
Verrecchia (2000) also find that firms with a higher disclosure level have lower bid-ask
spreads and higher trading volumes, thus lowering the cost of issuing capital. Botosan (1997)
directly observes firms’ cost of capital, and documents a relationship between firms’
disclosure levels and the cost of capital, finding that, for firms with a low analyst following,
there is an association between greater disclosure and the lower cost of capital. Botosan and
Plumlee (2002) extend this study to include firms with high analyst following, noting the
same negative association between the extent of disclosures observed from annual reports and
cost of capital.
The extent of voluntary disclosure varies according to firm characteristics, including
firm size, listing status, industry environment, and firm performance (profitability and return
variability). In order to measure the extent of disclosure levels, the elements that could
potentially affect the level of disclosures must be considered. Several prior studies examine
the determinants of cross-sectional variations in voluntary disclosure levels. Lang and
Lundholm (1993) use analyst ratings of firms’ disclosures as a proxy for disclosure quality,
and examine the cross-sectional variations in analysts’ published ratings of firms’ disclosure
practices. They find significant evidence of a positive relation between disclosure ratings and
firm size, current performance, and new security issuance. They find that disclosure scores
5
increase as firm size increases, which is consistent with much of the existing research on
voluntary disclosure. Also, disclosure ratings are higher for firms that perform well, firms
with a weaker relationship between annual stock returns and earnings, and firms that issue
securities. The relationship between the disclosure scores and firm characteristics also varies
across sources of disclosures, with investor relations the most responsive to firm
characteristics in their study. This is consistent with the fact that disclosures in annual reports
and other publications are infrequently varied, while investor relations are the most flexible
channels over short time periods.
In an investigation of factors influencing voluntary annual report disclosures by
multinational companies, Meek, Roberts and Gray (1995) identify a number of variables (firm
size, industry, leverage, profitability, country, and international listing status) that might be
associated with disclosure levels, and present evidence to support a relationship with company
size, country, and listing status. Similarly, Robb, Single and Zarzeski (2001) find that large
companies tend to provide more disclosures. In addition, they observe some industry effects
on the level of disclosures, with, firms in the chemicals and construction industries providing
higher levels of disclosure content. Ahmed and Courtis (1999) conduct a meta-analysis
reviewing past literature studying the association between annual report disclosure level and
firm characteristics, and find three variables (firm size, exchange listing status, and leverage)
to have statistically significant positive associations with firms’ disclosure levels.
Beattie, McInnes and Fearnley (2002, 2004) note that information disclosed by a
company could be part of a very large topic area; this necessitates disclosure studies having a
narrower focus on to specific areas or subsets of information disclosure (e.g., forward-looking,
historical, or background information; financial or nonfinancial information; environmental
disclosures; accounting figures or narratives). Although, all the information is essential to
users’ decision making collectively, it is likely that the decision-relevance of information
varies by information types. Several studies (e.g., Eccles & Mavrinac 1995; Meek et al. 1995;
Robb et al. 2001; Grant, Fogarty, Bricker & Previts 2000) show that different types of
particular information items do not create equal value-relevance to users’ decision-making
processes.
There have been two approaches to the examination of the information content of
disclosures. The study of market reactions is one such method. An inference is made,
6
implying that the content of disclosures is useful, when it has an effect on stock performance
(share prices and/or returns). Studies including Brookfield and Morris (1992), Rippington
and Taffler (1995), Amir and Lev (1996), Lev and Zarowin (1999), Ely and Waymire (1999),
Francis and Schipper (1999), Francis, Schipper and Vincent (2002) have shown that corporate
information disclosures have an impact on stock performance, providing evidence of an effect
which implies that the disclosure is useful and has information content. The other method,
content analysis, investigates the information contained in disclosures and attempts to observe
the intrinsic value (such as predictive ability) of information. The content analysis method
has been mainly applied to examine narrative information contained in the
chairman/president’s letter and MD&A of firms’ operations. Past research on thematic
studies (e.g., Ingram & Frazier 1983; Frazier, Ingram & Tennyson 1984; Bryan 1997; Smith
& Taffler 2000; Uang, Citron & Taffler 2001) demonstrates that the content of disclosures are
investigated and categorised into other variables such as words, paragraphs, or themes.
Specifically, such variables are analysed and examined with other variables of interest such as
firm performance or accounting numbers. Considering the syntactic aspects of the narratives,
the study of readability also gives rise to an exploration of a possible association between
readability level and other variables of interest. In all, content analysis enables researchers to
draw conclusions from the content itself, not from reactions from the stock market.
Until now, much of the extant research in voluntary disclosures relies upon the use of
annual reports as the main or only source of information. Annual reports are important
because they are the most comprehensive presentation of financial reporting a company
provides to its stockholders, and would be among the most available and easily accessible
sources of voluntary disclosures (Holland 1998; Grant et al. 2000). However, the usefulness
of annual reports has come under criticism for years, especially that they no longer capture
and communicate material developments in a timely manner to meet market information
needs (Wallman 1995).
In fact, a great deal of disclosure occurs outside of the annual report as firms
communicate information using other media, for instance, press releases, conference calls, or
web sites. Publicly available sources of information such as Stock Exchange and newspaper
databases are able to provide additional information including firm-specific news as well as
comments on companies. In this regard, a number of studies have found an evidence of the
usefulness of information disclosures derived from sources other than annual reports. For
7
example, Brown, Taylor and Walter (1999), Lang and Lundholm (2000), and Ryan and
Taffler (2004) all find that information from the news databases or Stock Exchange do
contain considerable value, i.e., having an impact on share prices.
In the disclosure process, financial analysts have critical roles in disseminating
corporate related information to investors, as analysts are middle agents who process
information from companies, add value, and send out further information to investors. There
is increasing demand from users of company information, financial analysts in particular, for
greater voluntary disclosures by firms. This view is echoed by the recommendations made in
regulatory reports (e.g., AICPA 1994; FASB 2001) to encourage firms to enhance their
voluntary disclosures. As part of the effort to improve the quality of business communication,
there is a need to examine how voluntary disclosures influence analysts’ decision making
processes and how analysts use corporate information to facilitate better decision making.
Schipper (1991) states that it is reasonable to study analysts and their activities because
they have a significant role as information intermediaries who receive and process financial
information for investors. This paper focuses on the activities of sell-side analysts. The role
and importance of sell-side analysts are echoed by Orlow (1999) as he states that sell-side
analysts serve a very important role in the capital raising process within securities markets
and provide insights into industry trends. A survey by Brown (1997) shows that analysts
greatly rely on corporate financial information, i.e., information found in annual and interim
filings, in their decision-making processes. Several studies (e.g., Previts, Bricker, Robinson &
Young 1994; Brown 1997; Rogers & Grant 1997; Breton & Taffler 2001) investigate
analysts’ information usage by examining analysts’ research reports. These studies have
emphasised the information needs of users, particularly financial analysts, and shown that
company information is useful to these users as it helps them make decisions about the
investments or make projections about the future value of the company.
Analysts have an important role in gathering company-related information and in
communicating that information to the market through their outputs. Healy and Palepu (2001)
note that academic studies usually focus on information produced by analysts, especially their
earnings forecasts and stock recommendations. Analysts’ stock recommendations are derived
as the outcomes of a process in which analysts have gathered and used all available sources of
industry and firm-specific information for their decision. Numerous studies (e.g., Bauman,
8
Datta and Iskandar-Datta 1995; Stickel 1995; Womack 1996; Francis & Soffer 1997; Ho &
Harris 1998, 2000; Ryan & Taffler 2001) provide evidence of the impact of analyst
recommendations on stock prices and returns.
Nevertheless, it has been found that these recommendations can be more informative
and yield more powerful impacts when they have been revised and the recommendations
changed. Stickel (1995), Womack (1996), and Ryan and Taffler (2001) use changes in
recommendations to examine the informativeness of revisions in analysts’ existing
recommendations and measure the average price reactions to such changes in individual
analysts’ recommendations. They all find that recommendation changes are likely to draw
more attention from investors, more value relevant and have higher market impact than the
reiterations of existing recommendations.
However, the use of analyst recommendations as the proxy for the quality of analysts’
work is of concern because of the potential for analyst bias in the formulation of forecasts and
recommendations. Brown (1993) provides evidence showing that analysts’ earnings forecasts
are typically optimistic, and concludes that a positive bias exists in analyst earnings forecasts;
in particular, analysts whose firms provide underwriting or investment banking services are
likely to produce more optimistic forecasts for their customer companies. Analyst stock
recommendations might be expected to be positively biased since they are predominantly
“buys”. Ryan and Taffler (2001), Ho and Harris (1998), and Womack (1996) all observe that
buy recommendations are more frequent than sell recommendations. This is probably due to
the conventional understanding that the issuance of sell recommendations is unfavourable to
both companies and analysts, making them infrequent (Womack 1996).
Analysts are actively involved and create value for capital markets. Healy and Palepu
(2001) assert that one consequence for capital markets of a firm making voluntary disclosure
is increased information intermediation. There is evidence that information disclosures
benefit analysts’ activities. Lang and Lundholm (1996) find that firms making more
informative disclosures are likely to have a larger analyst following, more accurate analyst
earnings forecasts, less dispersion among individual analysts, and less volatility in forecast
revisions. Walker and Tsalta (2001) looks at the relation between the quality of corporate
disclosure in annual reports and the number of analyst forecast revisions as a measurement of
analyst following. Their results provide evidence that there is a relationship between the

9
quality of information disclosed in the annual report and analyst following activity. Using
management forecasts as a proxy for voluntary disclosures, Baginski and Hassell (1990),
Waymire (1986) Hassell, Jennings and Lasser (1988), and Williams (1996) all find that
management earnings forecasts lead analysts to revise their forecasts and hence improve the
accuracy of analysts’ forecasts. Increased analyst activities can also result from more
frequent disclosures. Botosan and Harris (2000) find that one of the consequences of making
quarterly segment disclosures is that firms are likely to have an increase in analyst following
after the period of releasing such disclosures. This is due to analysts gaining opportunities to
get more updated and useful information. Increased analyst following is then consistent with
their assertion that shifting disclosure frequency can enhance both the content and timeliness
of information to analysts.
With a number of disclosure studies, there is clearly an important issue relating to the
measurement of voluntary disclosure levels. Commentary on disclosure measurements from
the observation of the existing disclosure literature (e.g., Marston & Shrives 1991; Healy &
Palepu 2001; Beattie et al. 2004) point out that the disclosure index is a common measure of
disclosure levels. The utilisation of a disclosure index mainly involves the process of self-
construction of the index. The self-developed indices may be appropriate for the purposes of
a researcher in his/her own work, but the development and application of a disclosure index
requires subjective assessment and involves several tasks. For example, in the work by
Botosan (1997), the disclosure index was developed based on an observation of only one
industry and derived from annual reports as the only source. Thus it is too restricted to
generalise.
The potential limitation of the measurement of disclosures is recognised in this paper; as
a result, an alternative measurement tool, content analysis, is employed. Content analysis is
applied to measure the degree and quality of disclosures made in company announcements
and news releases. In particular, this method is prevalently employed with narrative
accounting information (Jones & Shoemaker 1994). This instrument is considered directly
applicable to the aims of this paper and so would be useful in facilitating an examination of
the content of disclosures.
In conclusion, this review of the current literature suggests that there are a number of
studies relating to analysts’ recommendations and voluntary disclosures. However, these two
10
areas are almost always considered separately; the two concepts are rarely explored together.
There is no study directly examining how the extent or characteristics of disclosures affect the
changes in analyst recommendations. As the literature lacks sufficient descriptive work
providing detailed information in this specific area, there is an opportunity to develop a more
integrated approach to the study of the decision usefulness of voluntary accounting disclosure.
This paper therefore undertakes the investigation of whether and how voluntary disclosures
affect analyst recommendations.
This paper differs from most of the prior studies on voluntary disclosures in three
important ways. Firstly, the aspects of voluntary disclosures are treated as independent
variables rather than being a dependent variable as in studies that investigate determinants of
voluntary disclosures. Secondly, voluntary disclosures are examined against analysts’
recommendations rather than the properties of analysts’ forecasts. Thirdly, this paper makes
an effort to improve on previous research by applying content analysis to examine the content
of information disclosures from both internal and external sources that might affect changes in
analyst recommendations. It is expected that the changes in analyst recommendations may be
a significant surrogate for the measurement of the informativeness of corporate disclosure and
that results derived from this paper would then significantly extend the knowledge gained and
augment the existing voluntary disclosure studies.
2.2 Hypothesis Development
Relevant prior studies are Lang and Lundholm (1996) and Walker and Tsalta (2001).
Both empirically investigate the association between corporate disclosures and analyst
behaviour. Specifically, they examine whether the extent of voluntary information
disclosures affects the number of analysts following firms, the number of analysts’ earnings
forecasts, and properties of earnings forecasts. While neither study investigates the
relationship between voluntary disclosures and analyst recommendation revisions, the concept
of an expected association between disclosures and properties of earnings forecasts is
applicable to the scope of analyst recommendations in this study. This is because both
earnings forecasts and analyst recommendations are the output of the analysts’ decision-
making process.
11
The broad research problem of this study concerns how characteristics of voluntary
disclosures are associated with analysts’ recommendation revisions and the extent of that
association. This study captures evidence to draw conclusions on the impact of voluntary
disclosures on the changes in analysts’ recommendation. The decision usefulness of
voluntary accounting disclosures made by companies is to be reflected by the analysts’ use of
such information items to reach conclusions in their analysis and in making stock
recommendations.
This study proposes a model in which a change or revision of investment analysts’
recommendations for firms is a function of firms’ voluntary information disclosures. The
relationship between the extent of accounting disclosures and the outcome of analysts’ work
has been established in that the dependent variable is the revisions or changes of analyst
recommendations and its variance is to be reflected by the variation in corporate voluntary
disclosures.
The proposition above leads to the formulation of a basic hypothesis, expressed in the
null form:
Ho: There is no relationship between analyst recommendation changes and the
characteristics of voluntary disclosures.
The characteristics of analyst recommendation revisions are investigated to determine any
association with the extent of voluntary disclosure. The characteristics of recommendation
revisions are observed in two different manners, i.e., quantity and attributes of revisions.
Similarly, the extent and nature of voluntary disclosures involves both quantity and quality
aspects, which are represented by separate measurements of disclosures in announcements
and news.
Meanwhile, the relationship between the characteristics of the analyst recommendation
revisions and the extent of voluntary disclosures as proposed are based on the assumption that
all other factors remain unchanged or are held constant. However, other variables (e.g.,
behavioural factors) may account for variations in analyst recommendation revisions, and
may change and affect such a relationship. This study, based on existing literature, takes
12
account of two other variables that can possibly affect the recommendation revision including
company size and industry type.
Company size has consistently been found to be significantly and positively associated
with disclosures in several prior studies (e.g., Meek et al. 1995; Ahmed & Courtis 1999; Robb
et al. 2001). Company size has also been evidenced to be a determinant of analyst following
activity, i.e., large firms are more heavily followed by analysts (Bhushan 1989). Information
about larger companies may be of interest to more investors than information about smaller
companies. Consequently, analysts are more likely to monitor larger companies so that they
can advise investors on the prospects of the company. Hence larger companies may increase
their disclosures, enabling analysts to enhance their analysis and revise the recommendations
on that company. Similarly, type of industry might influence the extent of disclosure and
hence the number of analysts' recommendation revisions. Meek et al. (1995) and Robb et al.
(2001) find that type of industry appears to be influential in the variations in disclosures.
More specifically, Cooke (1989, 1991 and 1992) finds that manufacturing companies disclose
more information than non-manufacturing firms. O’Brien and Bhushan (1990) evidence a
link between industry characteristics and analyst following activity. In general, there is
evidence that industry type is related to the extent of disclosures as well as the degree of
analyst following; as such industry type is included as another control variable to be tested in
this paper.
In all, these arguments allow for the formulation of a number of subsidiary hypotheses
for testing. The first two hypotheses are related to the number of recommendation revisions
and quantitative characteristics of voluntary disclosures. It is expected that increased
disclosure leads to an increase in the number of recommendation revisions. This is because
the greater the volume of voluntary disclosures, the higher the probability that the disclosures
are decision-useful, facilitating a change or revision of analyst recommendations. The
quantitative characteristics of disclosures are assessed by two components: the number of
sentences in announcements and the number of sentences in news items. Thus for each
component, the following hypotheses can be developed and presented in the null form:
Ho1: There is no relationship between the number of analyst recommendation changes
and total number of sentences in announcements.
13
Ho2: There is no relationship between the number of analyst recommendation changes
and total number of sentences in news items.
The possible influence of company size or industry type to the number of analyst
recommendation changes is considered and tested with the following two additional
hypotheses, expressed in the null form:
Ho3: There is no relationship between the number of analyst recommendation changes
and company size.
Ho4: There is no relationship between the number of analyst recommendation changes
and industry type.
Apart from observing the number of recommendation revisions, further hypotheses postulate
an association between the attributes of recommendation changes and the qualitative
characteristics of disclosures. The differing sources or proxies for disclosures dictate the
separate hypotheses. The expectation is that the different types of information carry different
levels of importance, thus having a variable impact on the analyst’s decision process in
revising recommendations. The relevant null hypotheses are:
Ho5: There is no relationship between attributes of analyst recommendation changes
and qualitative characteristics of disclosures from announcements.
Ho6: There is no relationship between attributes of analyst recommendation changes
and qualitative characteristics of disclosures from news items.
The existence of company size and industry type can possibly be investigated with the
attributes of analyst recommendation changes. As a result, two additional null hypotheses are
formulated:
Ho7: There is no relationship between attributes of analyst recommendation changes
and company size.
14
Ho8: There is no relationship between attributes of analyst recommendation changes
and industry type.
3. Research Method
3.1 Sample Selection
The population for sampling is that of listed Australian companies, which constitute the
Australian Stock Exchange (ASX) All Ordinaries Index 5002 as of March 2003. The reason
for choosing firms in the top 500 is because there is a high probability that the data required
(recommendation revisions, company announcement, and news) for such large businesses
would be frequent and readily available for analysis. On this basis, the sample is biased
towards large capitalisation firms.
There are restrictions on sample selection criteria due to the availability of related data
of interest in this study. Specifically, firms are included in the final sample on the basis that:
a. A firm is not in an industry that is highly regulated (for example, banking, insurance,
securities, and utilities) or specialised (for example, mining, construction, real estate and
certain types of transportation). The remaining industries would then represent a cross-
section of firms from relatively homogeneous manufacturing-related and service-related
(services, wholesale, and retail) industries. This is because regulated and specialised
industries have a distinctive nature and hence firms in such industries operate in a
different disclosure environment from manufacturing and/or service firms (Hossain &
Adams 1995);
b. A firm is covered in the I/B/E/S recommendation history database and there must be a
match of at least one analyst recommendation revision during the period of 1998-1999
in this database; and
c. A firm has to be accessible through the ASX database; it must be currently active, not
delisted, and its company name or ASX code must not have changed after 1998, since
the ASX database offers information only on companies with a current name and ASX
code.
15
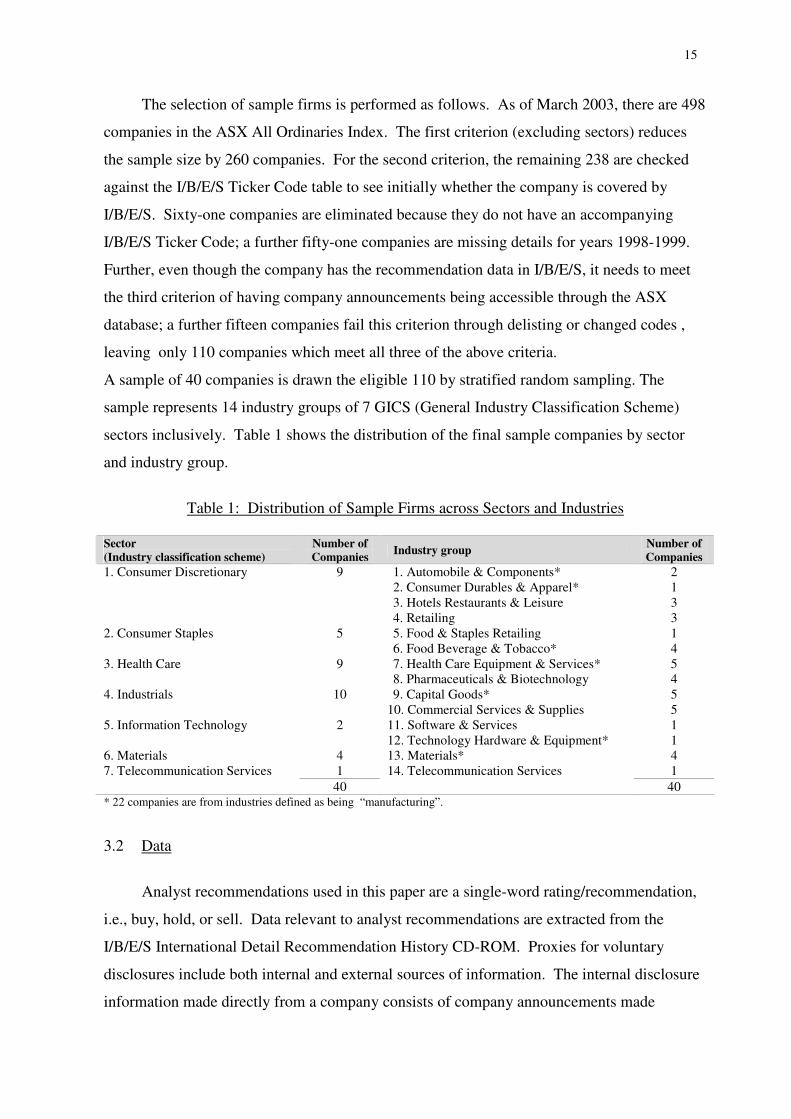
The selection of sample firms is performed as follows. As of March 2003, there are 498
companies in the ASX All Ordinaries Index. The first criterion (excluding sectors) reduces
the sample size by 260 companies. For the second criterion, the remaining 238 are checked
against the I/B/E/S Ticker Code table to see initially whether the company is covered by
I/B/E/S. Sixty-one companies are eliminated because they do not have an accompanying
I/B/E/S Ticker Code; a further fifty-one companies are missing details for years 1998-1999.
Further, even though the company has the recommendation data in I/B/E/S, it needs to meet
the third criterion of having company announcements being accessible through the ASX
database; a further fifteen companies fail this criterion through delisting or changed codes ,
leaving only 110 companies which meet all three of the above criteria.
A sample of 40 companies is drawn the eligible 110 by stratified random sampling. The
sample represents 14 industry groups of 7 GICS (General Industry Classification Scheme)
sectors inclusively. Table 1 shows the distribution of the final sample companies by sector
and industry group.
Table 1: Distribution of Sample Firms across Sectors and Industries
Sector (Industry classification scheme)
Number of Companies Industry group Number of
Companies 1. Consumer Discretionary 9 1. Automobile & Components* 2 2. Consumer Durables & Apparel* 1 3. Hotels Restaurants & Leisure 3 4. Retailing 3 2. Consumer Staples 5 5. Food & Staples Retailing 1 6. Food Beverage & Tobacco* 4 3. Health Care 9 7. Health Care Equipment & Services* 5 8. Pharmaceuticals & Biotechnology 4 4. Industrials 10 9. Capital Goods* 5 10. Commercial Services & Supplies 5 5. Information Technology 2 11. Software & Services 1 12. Technology Hardware & Equipment* 1 6. Materials 4 13. Materials* 4 7. Telecommunication Services 1 14. Telecommunication Services 1 40 40 * 22 companies are from industries defined as being “manufacturing”.
3.2 Data
Analyst recommendations used in this paper are a single-word rating/recommendation,
i.e., buy, hold, or sell. Data relevant to analyst recommendations are extracted from the
I/B/E/S International Detail Recommendation History CD-ROM. Proxies for voluntary
disclosures include both internal and external sources of information. The internal disclosure
information made directly from a company consists of company announcements made
16
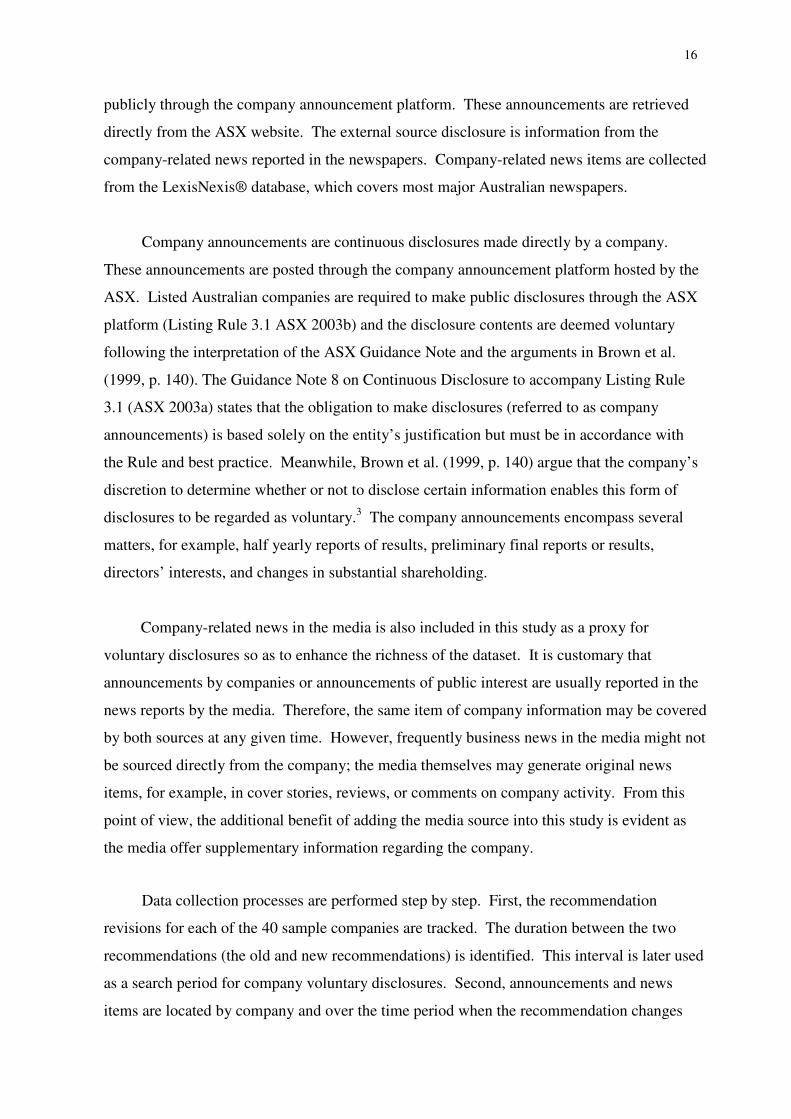
publicly through the company announcement platform. These announcements are retrieved
directly from the ASX website. The external source disclosure is information from the
company-related news reported in the newspapers. Company-related news items are collected
from the LexisNexis® database, which covers most major Australian newspapers.
Company announcements are continuous disclosures made directly by a company.
These announcements are posted through the company announcement platform hosted by the
ASX. Listed Australian companies are required to make public disclosures through the ASX
platform (Listing Rule 3.1 ASX 2003b) and the disclosure contents are deemed voluntary
following the interpretation of the ASX Guidance Note and the arguments in Brown et al.
(1999, p. 140). The Guidance Note 8 on Continuous Disclosure to accompany Listing Rule
3.1 (ASX 2003a) states that the obligation to make disclosures (referred to as company
announcements) is based solely on the entity’s justification but must be in accordance with
the Rule and best practice. Meanwhile, Brown et al. (1999, p. 140) argue that the company’s
discretion to determine whether or not to disclose certain information enables this form of
disclosures to be regarded as voluntary.3 The company announcements encompass several
matters, for example, half yearly reports of results, preliminary final reports or results,
directors’ interests, and changes in substantial shareholding.
Company-related news in the media is also included in this study as a proxy for
voluntary disclosures so as to enhance the richness of the dataset. It is customary that
announcements by companies or announcements of public interest are usually reported in the
news reports by the media. Therefore, the same item of company information may be covered
by both sources at any given time. However, frequently business news in the media might not
be sourced directly from the company; the media themselves may generate original news
items, for example, in cover stories, reviews, or comments on company activity. From this
point of view, the additional benefit of adding the media source into this study is evident as
the media offer supplementary information regarding the company.
Data collection processes are performed step by step. First, the recommendation
revisions for each of the 40 sample companies are tracked. The duration between the two
recommendations (the old and new recommendations) is identified. This interval is later used
as a search period for company voluntary disclosures. Second, announcements and news
items are located by company and over the time period when the recommendation changes
17
occurred. Finally, the recommendation revisions are matched with the presence of voluntary
disclosures during the change period.
The sample of 40 companies yields 267 recommendation revisions over the two-year
period of 1998-1999. Regarding the amount of disclosures, there are respectively 2,149 and
4,186 items of announcements and news collected. Separately, all announcement items
produce 30,287 sentences and all news items produce 36,632 sentences
3.3 Measurement of Analyst recommendation changes (Dependent variable)
The focus of attention is on the revision or change of a recommendation. In particular,
the selection criteria are that there must be at least a pair of consecutive recommendations
issued by the same analyst in the same brokerage company, and the new rating or following
recommendation must be a revised rating not a reiterated one. Also, in order to limit the
duration of the time period between events, the time between these two consecutive
recommendations must not exceed 12 months. The time period between the two
recommendations is noted by recording the issue date of each recommendation.
Recommendation changes are recorded in two different manners. Separate analysis is
performed for each of the following:
(1) Direction of recommendation change
This measure classifies recommendation revisions into two main groups according to
the direction of change: upgrade and downgrade.
(2) Type of new recommendation
The second measure is referred to as the rating to which the revision is designated, i.e.,
whether the revision is “buy” or “non-buy”. This classification is justified on the grounds of
prior research (e.g., Francis & Soffer 1997) which indicates that “buy” is the most influential
recommendation rating in terms of its value to investors. Analysts rarely issue “sell”
recommendation; they are optimistically biased towards the issuing of favourable stock
recommendation, i.e., a “buy” rating (Womack 1996). Bradshaw (2002, 2004) further notes
that the market appears to interpret “hold” recommendations as essentially “sell”
recommendations. In the context of this study, the “buy” and “non-buy” categories can be
18
determined by transforming the original I/B/E/S five-level rating.4 The “buy” group includes
strong buy and buy; anything else other than buy, i.e., hold, underperform, and sell, are
classified as “non-buy”.
3.4 Methodology and Measurement of Voluntary Disclosures (Independent Variable)
3.4.1 Content Analysis
Content analysis is a set of procedures for collecting and organising information in a
standardised format that allows researchers to make or draw inferences about the
characteristics and meaning of written and other recorded material. Holsti (1969, p. 14)
defines content analysis as “any technique for making inferences by objectively and
systematically identifying specified characteristics of messages”. Krippendorff (1980, p. 21)
adds that content analysis involves specialised procedures for “making replicable and valid
inferences from data to their context”. In making such valid inferences, content analysis as a
research method utilises a set of procedures to compress many words of text into fewer
content categories based on explicit rules of coding (Weber 1990). Weber (1990) states that
the content analysis method enables researchers to combine both qualitative and quantitative
analysis of texts.
Jones and Shoemaker (1994) state that the content analysis method was first used within
non-accounting areas but it is now widely used by accounting researchers. In their survey of
accounting narrative studies, Jones and Shoemaker (1994) identify two types of content
analysis method in accounting areas: thematic and syntactic studies. Thematic studies extract
and analyse themes5 inherent within the narratives and draw inferences from those texts.
Syntactic studies aim to analyse the readability and understandability of the narrative content.
In another view, Smith and Taffler (2000) and Uang et al. (2001) use two alternative
generic approaches of content analysis: form-oriented (objective) analysis and meaning-
oriented (subjective) analysis. The routine counting of points, words, sentences, lines,
concrete references, or paragraphs can be performed in word-based form oriented analysis
whereas the analysis of the underlying themes in the texts under investigation is the focus of
meaning-oriented analysis. The form-oriented (word-based) approach is a more direct
measure and more reliable in terms of the coding process. Empirically, it is noted that word-
19
based content analysis is subject to the assumption that frequency of word occurrence directly
reflects the degree of emphasis (Smith & Taffler 2000; Uang et al. 2001).
Accounting narratives, such as company messages or disclosures, have been widely
analysed using content analysis. Mostly, this has been to investigate the characteristics and/or
value of information contained in the message. For example, content analysis has been
mainly applied to examine narrative information contained in the chairman/president’s letter
and management discussion and analysis (MD&A) of firms’ operations (e.g., Ingram &
Frazier 1983; Frazier et al. 1984; Tennyson, Ingram & Dugan 1990; Abrahamson & Amir
1996; Bryan 1997, Smith & Taffler 2000; Uang et al. 2001). The messages of such
disclosures are content analysed according to the “explicit rules” that researchers have made
clear prior to analysis. In brief, narratives are coded and grouped into predefined and
meaningful categories. Variables such as frequency of words, paragraphs, or themes are
derived after all texts are completely coded. In the end, such variables can be examined with
other variables of interest to draw inferences from the content of the information.
Content analysis is also used to gain an understanding of the decision process of the
author of the messages. For example, the content of analyst research reports can be analysed
to explore the importance of company financial reporting to analysts, how analysts process
such information, and how analysts use financial/accounting information in analysing stocks
(e.g., Previts et al. 1994; Rogers & Grant 1997; Breton & Taffler 2001). Following the
content analysis procedure, the texts in analyst reports are scanned and grouped into the
researcher’s defined categories. Variables are obtained such as frequencies of words or
counts within categories. Later, those variables are further analysed using statistical tools and
the inferences of the content of messages can be drawn from the process.
It is appropriate to use the content analysis method in this paper since it is unobtrusive,
there being no need to study or directly contact the subjects (companies or analysts). Content
analysis provides a method for converting the narrative format of disclosures into a
quantitative measure that can be statistically related to other variables in the study. In this
paper content analysis is used in identifying content categories from voluntary disclosure
messages and examining the patterns or intentions of the messages. Statistical analysis
facilitates an examination of the nature of the relationship between voluntary disclosure
content and analyst recommendation changes.

20
3.4.2 Measurement of Voluntary disclosures (Independent variable)
The requirement for collecting company announcements and news items, as stated, is to
select those voluntary disclosures made during the time period of the recommendation
changes. The analyses of announcement and news items are performed separately but
processed with the same method of content analysis. Procedures to conduct content analysis
for these items are described as follows:
Step 1: Determine the Sample Units (Material Analysed)
Company announcements and news documents are the texts to be examined. These
documents are scoped to be only those issued or announced during the period of
recommendation changes. Announcements within a specified period are all valid for analysis,
but news items need some preliminary scanning. The company name is used as a keyword
search in the newspaper database. As a result, every news item containing the company name
is retrieved. In most cases, a news item superficially relevant to the company could be
excluded, for example, a news item just mentioning the company name but containing no
material content or related activity of that company.
Step 2: Select the Unit of Analysis
The unit of analysis is the sentence and an analysis based on a meaning-oriented
approach is undertaken.6 Each sentence in a document is read to find out the keyword or
theme that conveys specific meaning enabling the determination and classification of the
sentence into an event category (to be discussed in the next step). Coding on sentences is
appropriate because the conflict of messages within paragraphs and the problem of having
paragraphs of wildly varying size can be avoided. Milne and Adler (1999, p. 243) provide the
supporting comment as to the unit of analysis that “as a basis for coding, sentences are far
more reliable than any other unit of analysis”.
Step 3: Define the Categories
There are three classification schemes or categories used for coding a sentence read
from announcements and news items. They are (1) theme category, (2) signal category and,

21
(3) price-sensitivity category. The three categories are isolated; they are not affiliated with
one another. All elements (members of a category) are also mutually exclusive. The
advantage is to facilitate the separate quantitative analysis for each set of category in the later
stage.
For the first classification scheme, the theme category, the classification schemes in
Meek et al. 1995, Robb et al. 2001, and Beattie et al. 2002 are initially consulted. The
categories in these studies are relatively comprehensive; however, they are based solely on
information items disclosed through annual reports. Accordingly, these categories cover only
company self-released information as it appears in annual reports, and do not encompass
information releases from outside the company, e.g., reviews by analysts or newspapers,
which are also of interest in this study.
The definitive theme category set is primarily based on the revision of classification
schemes in prior studies relating to the categorisation of company news releases (Morse 1982;
Foster 1986; Thompson, Olsen & Dietrich 1987; Brookfield & Morris 1992; Pritamani &
Singal 2001; Ryan & Taffler 2004). A final list of the theme category is established; it
consists of 14 mutually exclusive theme elements (Appendix A). The list covers all possible
types of company announcements and news, as well as being easier to sort out themes derived
from a sentence. In examining the preliminary reliability of the theme category, the definitive
theme category list is also verified independently by two senior accounting academics to seek
the clearest understanding of the category set.
The second scheme, the signal category, is divided into three dimensions, i.e.,
favourable (F), neutral (N), or unfavourable (U). The third scheme, price-sensitivity, is sorted
into two events; simply whether the sentence carries price-sensitive information (PS) or not
(NS).
Step 4: Generate the Coding Scheme
The content analysis of company announcements and news items is performed entirely
by manual reading and coding, while computer analysis is used principally to collect
frequency data. The complexity of wording in announcements, and especially in news items,
is normally beyond the settings of a computer program, so a human coding method is

22
preferred to the use of computer coding. Obviously, the coding here relies on human decision
processes, for example, there is additional judgement required when deciding on contexts
(around the keyword) in the sentence. Whilst human coding may require extensive time and
effort, reliability is believed to be dependable. With the concern over the reliability issue, a
control to reduce the arbitrariness is set. Two independent academics reviewed the scheme
and took part in the coding process. This is to confirm the validity and reliability of the entire
coding method applied by human coding in this study. This matter is discussed more in the
next step.
Company announcements and news items are analysed one by one. The term “item” is
used to refer to one announcement or news item extracted from the associated database. For
each single item, the coding scheme includes:
a. reading sentence by sentence,
b. identifying an event or dimension of each category (theme, signal, and price-sensitivity)
from the meaning or topic discussed in the sentence,
c. assigning an appropriate event code (theme, signal, and price-sensitivity) for that
sentence, and
d. recording one count of the sentence to each event of that category being assigned.
These steps are repeatedly performed for every sentence in the document and for every item
of the same time period to classify the theme of each sentence into one of the dimensions of
the theme category; the definition of each theme is used as criteria for making the decision.
Based on the understanding of the theme description, the coder then decides which theme is to
be assigned to that sentence.
Sentence by sentence reading helps to avoid possible bias from selective categorising,
especially when there is a long paragraph or document. In most cases, the classification of
information is self-explanatory, e.g., it contains a word or group of words being simply
referred to in the definition of any theme. For example, the release of a preliminary final
report usually discusses annual profits, allowing it to be sorted into the theme of “earnings-
related”.
23
For the determination of signals, each sentence is coded according to its conveyed
signals as favourable (F), neutral (N), or unfavourable (U). In order to decide either signal (F,
N, or U) for the theme in the sentence, the meaning of a whole sentence is considered. For
each sentence, labels are assigned corresponding to the sense of content that the disclosure
might represent – “good news”, “neutral”, or “bad news”. The rule is that the sentence is
labelled as “favourable” if it might have a positive effect (good news) on earnings; as
“unfavourable” if it might have a negative effect (bad news) on earnings; and as “neutral” if
no effect on earnings is likely. Practically, a single word in a sentence such as “profit” or
“loss” (that most likely indicates the clear message of the whole sentence) is scanned first.
Simply put, the keyword with optimistic or positive meaning such as “profitable” is treated as
“favourable”, while “loss” is “unfavourable. However, a phrase or context would be very
much critical in deciding a proper judgment for a confused set of words like “reduced profit”
or “reduced loss”.
Finally, a sentence is flagged as to whether it is price-sensitive information (PS) or non
price-sensitive (NS). This determination is in accordance with the judgment of the ASX.7
Normally, the ASX would label an announcement as price-sensitive when information
contained in that announcement is considered to have a material effect on company stock
prices. For the purpose of this study, all sentences in a price-sensitive announcement are
assigned a price-sensitive flag according to the ASX judgement.
The classification of price-sensitiveness (for announcements) is also assumed to apply
to news items. The rule is simply that the news discussing the same contents as those of
price-sensitive announcements is flagged as price-sensitive as well. By this means, any
sentences of news items on the same content of price-sensitive announcements are treated as
being price-sensitive. It is noted that news items are usually disclosed on or just a few days
following the date of company announcements, but there are many cases that the same news
content appears to be repeatedly reported several days later. In this case, only fresh news
after the price-sensitive announcement is considered price-sensitive.
Following the design of the category sets noted in the previous step, one of the coding
rules adopted is to specify that any sentence be assigned to only one element or event in a
given category, the one where it fits best. All three classification schemes are independent
from one another and the coding to each element in a category is not conditional upon any

24
other events and categories.8 All coding rules are strictly followed for the coding of every
sentence from announcements and news items of the dataset. Appendix B illustrates how the
announcements and news items are coded. The use of a coding scheme can be verified by
employing more than one coder to perform the coding and check the agreement of the coding
results. The next step reports on the reliability tests and results.
Step 5: Assess Validity and Reliability
The validity of assigning disclosures to any events of the three categories is initially
secured by ensuring that the content analysis in this study employs well-specified decision
categories with well-specified decision rules. Later, the inter-coder reliability is also observed
to confirm the level of agreement among the three coders.
The validity and reliability of the category set, especially the theme category, is
considered first. Two academics, as noted above, initially verify the final theme category list.
This is to see if the modified or added themes and its accompanying definition are clearly
understood by persons other than the one who actually revises the category list. After the
theme category is settled, these academics perform the reading and coding on a small subset
of announcements and news items so as to ensure the level of validity and reliability of the
coding process.
The reliability of the coding process itself also needs to be estimated to ensure accurate
and unbiased classification of sentences in items to categories. Four reliability measures, i.e.,
“Percent agreement”, “Scott’s pi (π)”, “Cohen’s kappa (κ)”, and “Krippendorff”s alpha (α)”,
are calculated to express the extent of agreement achieved among coders regarding the
assignment of a sentence to an event of the theme and signal categories. Table 2 shows the
measures derived from the four different reliability measures.
Table 2: The Levels of Inter-Coder Reliability
Reliability measures Results Percent agreement 91% Scott’s pi (π) 88% Cohen’s kappa (κ) 89% Krippendorff”s alpha (α) 83%
25
Wimmer and Dominick (2003) state that there is no universally acceptable level of
reliability to apply to every research context but they suggest 0.75 or above when using pi or
alpha (2003, p. 158-159). Boyatzis (1998, p. 156) suggests the acceptable level for percent
agreement is typically 70% or better. In several surveys discussing the reliability of the
measurement of corporate social disclosures, Guthrie and Mathews (1985), Hackston and
Milne (1996) and Milne and Adler (1999) all generally recommend the agreement of over
0.80. Neuendorf (2002, p. 143) proposes, based on the review of prior work, that a reliability
coefficient of 0.90 or greater would be acceptable to all, and 0.80 or greater would be
acceptable in most situations. According to these points of reference, the level of agreement
achieved here is therefore highly satisfactory.
Step 6: Define the Quantification Levels for Coded Data
For all coded sentences, the aggregation method is to count the sentences. Primarily, it
is easy to perform as the coding is done based on the reading of each sentence. Milne and
Adler (1999, p. 243) state that using sentences for both coding and measurement seems likely
to provide complete, reliable, and meaningful data for further analysis. In addition, counting
sentences is adopted according to assumptions based on the principle of content analysis, in
that repetition of a theme/category is equated to the importance weighting for that
theme/category. According to Weber (1990, p. 56), “counting [category frequency] assumes
that higher relative counts (proportion, percentage, or ranks) reflect higher concern with [that]
category”. As a result, the frequency, or here the sentence counts by category, reflects the
degree of emphasis of that category.
The data is coded and quantified for each individual time period. For each time period,
the frequency of each event in the category (event counts) is aggregated. Event counts are
obtained by adding up the number of sentences recorded for the same event. Each event of
the three isolated set of categories (theme, signal and price-sensitivity) is totalled separately,
i.e., there is an individual sum of each event of the theme, signal, and price-sensitivity
categories.
26
3.5 Other Variables
Two other variables, i.e., company size and industry type, are included in the analysis of
the impact on recommendation revision. Company size is measured by the natural logarithm
of total sales (average total sales of 1998-1999).9 The industry type is represented by the type
of industry in which a firm operates. Industry type, divided into two groups, is measured by
denoting whether the company is a manufacturing or non-manufacturing company based on
the industry classification group used by the stock exchange (refer to Table 1). Initially, the
industry group was to be used as the measure of industry characteristics. However, the
segregation of only 40 sample companies into specific industry groups leads to a very uneven
distribution or too few numbers of companies and number of recommendation revisions for
some industry groups. This would have caused statistical problems (e.g., too few instances or
very unequal sub-samples). The broad grouping (2 categories) is thus used instead.
3.6 Statistical Tests and Empirical Models
The hypotheses are examined by conducting a correlation analysis and a regression
analysis of the properties of recommendation revisions on the extent of voluntary disclosures.
The hypotheses stated earlier are tested with the following general empirical models:
Based on the hypotheses, three models are developed. These models are tested
separately for the disclosure data of company announcements and news items. The
specifications are as follows:
a. Number of recommendation changes and the amount of voluntary disclosures
Number of recommendation revisions = f (the amount of voluntary disclosures|control
variables)
b. The direction of change and the characteristics of voluntary disclosures
Direction of change = f (the characteristics of voluntary disclosures|control variables);
where DIR = 1 for upward revision; 0 for downward revision
c. The type of new recommendation and the characteristics of voluntary disclosures
Type of new recommendation = f (the characteristics of voluntary disclosures|control
variables); where RECTYPE = 1 if new recommendation is buy; 0 otherwise (non-buy)
27
4. Results and Discussion
4.1 Characteristics of Recommendation Changes
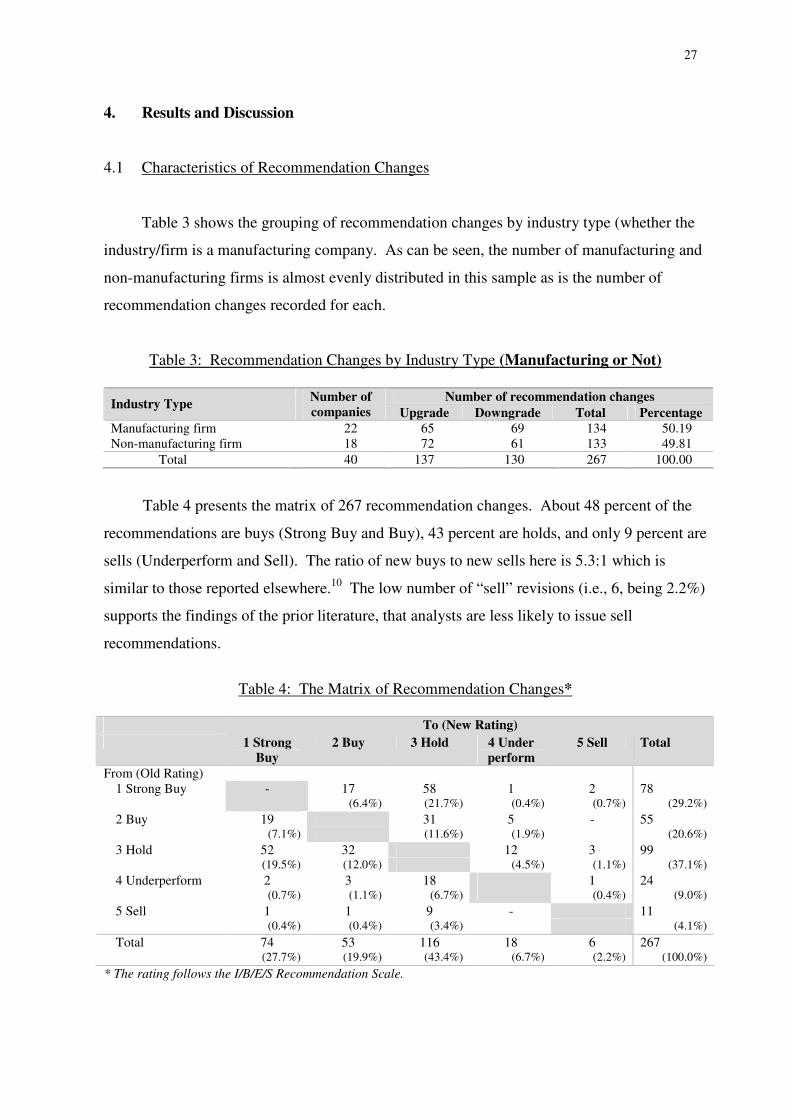
Table 3 shows the grouping of recommendation changes by industry type (whether the
industry/firm is a manufacturing company. As can be seen, the number of manufacturing and
non-manufacturing firms is almost evenly distributed in this sample as is the number of
recommendation changes recorded for each.
Table 3: Recommendation Changes by Industry Type (Manufacturing or Not)
Number of recommendation changes Industry Type Number of companies Upgrade Downgrade Total Percentage
Manufacturing firm 22 65 69 134 50.19 Non-manufacturing firm 18 72 61 133 49.81
Total 40 137 130 267 100.00
Table 4 presents the matrix of 267 recommendation changes. About 48 percent of the
recommendations are buys (Strong Buy and Buy), 43 percent are holds, and only 9 percent are
sells (Underperform and Sell). The ratio of new buys to new sells here is 5.3:1 which is
similar to those reported elsewhere.10 The low number of “sell” revisions (i.e., 6, being 2.2%)
supports the findings of the prior literature, that analysts are less likely to issue sell
recommendations.
Table 4: The Matrix of Recommendation Changes*
To (New Rating)
1 Strong Buy
2 Buy 3 Hold 4 Under perform
5 Sell Total
From (Old Rating) 1 Strong Buy - 17 58 1 2 78
(6.4%) (21.7%) (0.4%) (0.7%) (29.2%) 2 Buy 19 31 5 - 55
(7.1%) (11.6%) (1.9%) (20.6%) 3 Hold 52 32 12 3 99
(19.5%) (12.0%) (4.5%) (1.1%) (37.1%) 4 Underperform 2 3 18 1 24
(0.7%) (1.1%) (6.7%) (0.4%) (9.0%) 5 Sell 1 1 9 - 11
(0.4%) (0.4%) (3.4%) (4.1%) Total 74 53 116 18 6 267
(27.7%) (19.9%) (43.4%) (6.7%) (2.2%) (100.0%) * The rating follows the I/B/E/S Recommendation Scale.
28
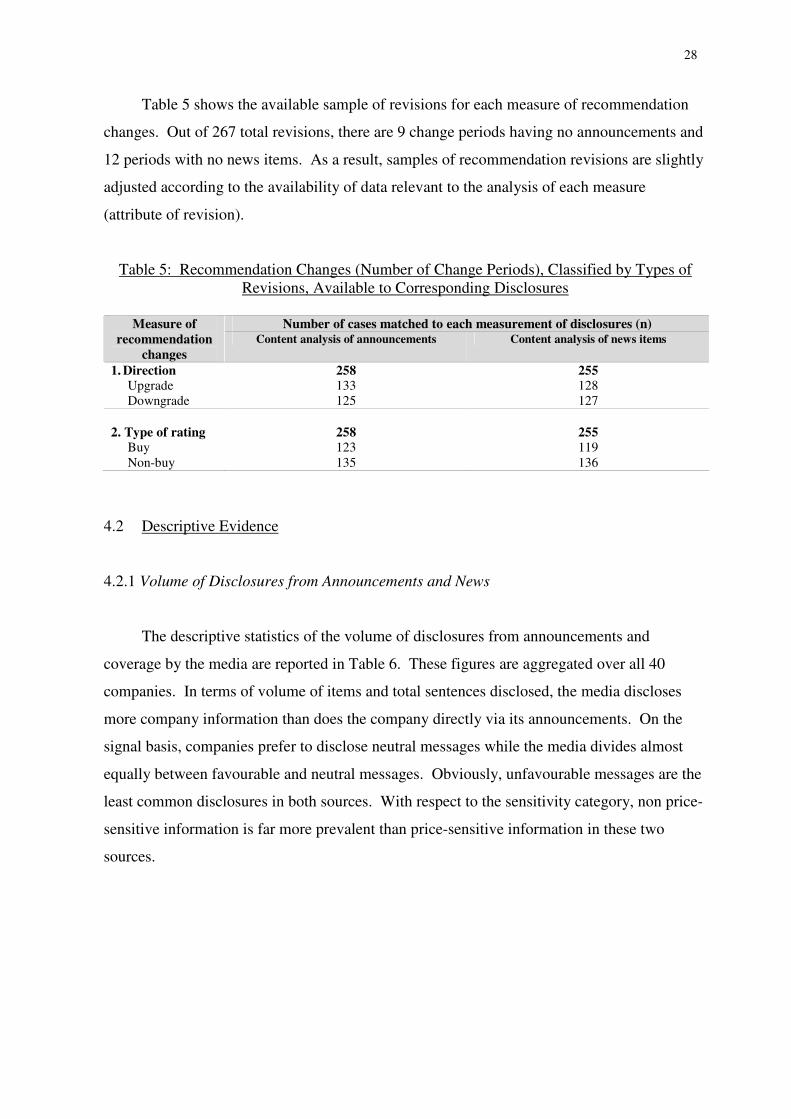
Table 5 shows the available sample of revisions for each measure of recommendation
changes. Out of 267 total revisions, there are 9 change periods having no announcements and
12 periods with no news items. As a result, samples of recommendation revisions are slightly
adjusted according to the availability of data relevant to the analysis of each measure
(attribute of revision).
Table 5: Recommendation Changes (Number of Change Periods), Classified by Types of Revisions, Available to Corresponding Disclosures
Number of cases matched to each measurement of disclosures (n) Measure of
recommendation changes
Content analysis of announcements Content analysis of news items
1. Direction 258 255 Upgrade 133 128 Downgrade 125 127
2. Type of rating 258 255
Buy 123 119 Non-buy 135 136
4.2 Descriptive Evidence
4.2.1 Volume of Disclosures from Announcements and News
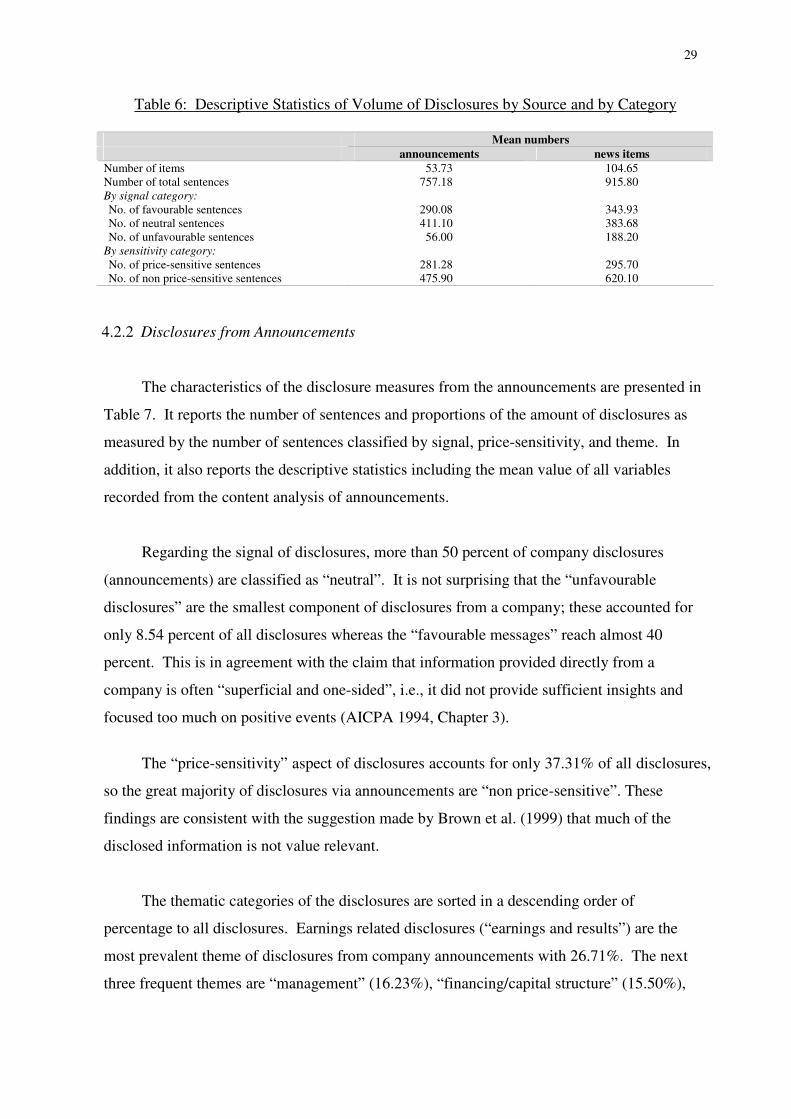
The descriptive statistics of the volume of disclosures from announcements and
coverage by the media are reported in Table 6. These figures are aggregated over all 40
companies. In terms of volume of items and total sentences disclosed, the media discloses
more company information than does the company directly via its announcements. On the
signal basis, companies prefer to disclose neutral messages while the media divides almost
equally between favourable and neutral messages. Obviously, unfavourable messages are the
least common disclosures in both sources. With respect to the sensitivity category, non price-
sensitive information is far more prevalent than price-sensitive information in these two
sources.
29
Table 6: Descriptive Statistics of Volume of Disclosures by Source and by Category Mean numbers announcements news items Number of items 53.73 104.65 Number of total sentences 757.18 915.80 By signal category: No. of favourable sentences 290.08 343.93 No. of neutral sentences 411.10 383.68 No. of unfavourable sentences 56.00 188.20
By sensitivity category: No. of price-sensitive sentences 281.28 295.70 No. of non price-sensitive sentences 475.90 620.10
4.2.2 Disclosures from Announcements
The characteristics of the disclosure measures from the announcements are presented in
Table 7. It reports the number of sentences and proportions of the amount of disclosures as
measured by the number of sentences classified by signal, price-sensitivity, and theme. In
addition, it also reports the descriptive statistics including the mean value of all variables
recorded from the content analysis of announcements.
Regarding the signal of disclosures, more than 50 percent of company disclosures
(announcements) are classified as “neutral”. It is not surprising that the “unfavourable
disclosures” are the smallest component of disclosures from a company; these accounted for
only 8.54 percent of all disclosures whereas the “favourable messages” reach almost 40
percent. This is in agreement with the claim that information provided directly from a
company is often “superficial and one-sided”, i.e., it did not provide sufficient insights and
focused too much on positive events (AICPA 1994, Chapter 3).
The “price-sensitivity” aspect of disclosures accounts for only 37.31% of all disclosures,
so the great majority of disclosures via announcements are “non price-sensitive”. These
findings are consistent with the suggestion made by Brown et al. (1999) that much of the
disclosed information is not value relevant.
The thematic categories of the disclosures are sorted in a descending order of
percentage to all disclosures. Earnings related disclosures (“earnings and results”) are the
most prevalent theme of disclosures from company announcements with 26.71%. The next
three frequent themes are “management” (16.23%), “financing/capital structure” (15.50%),
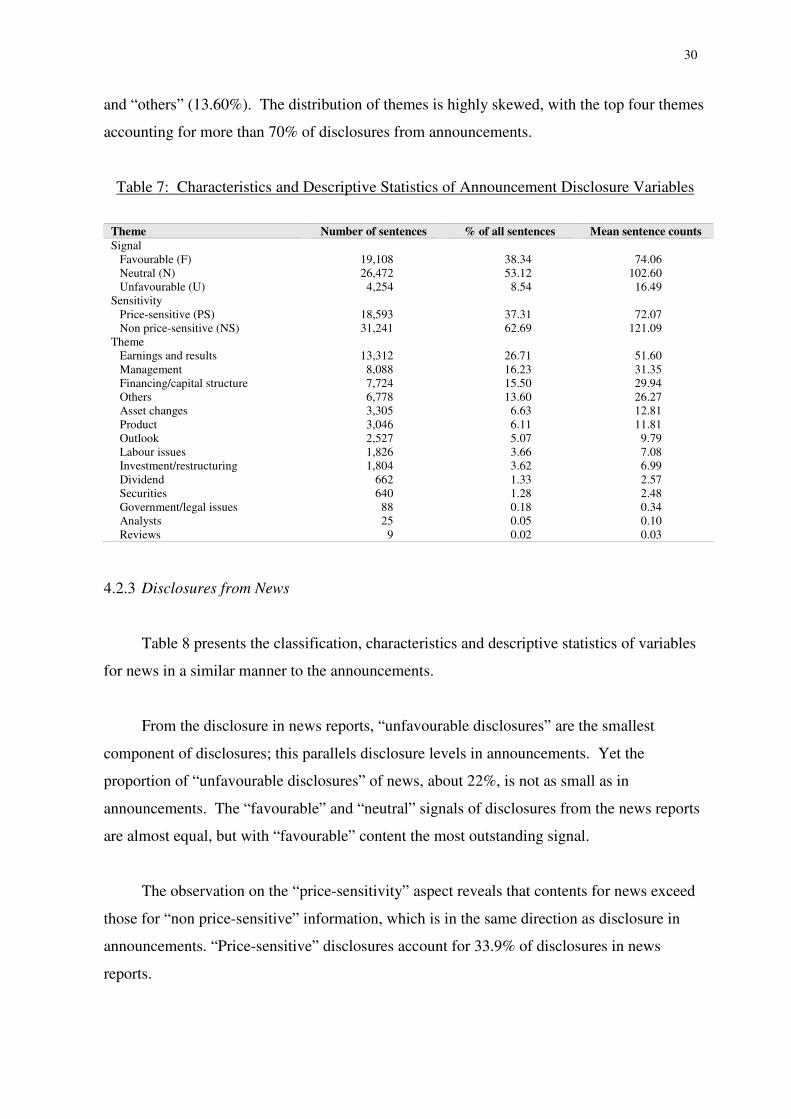
30
and “others” (13.60%). The distribution of themes is highly skewed, with the top four themes
accounting for more than 70% of disclosures from announcements.
Table 7: Characteristics and Descriptive Statistics of Announcement Disclosure Variables
Theme Number of sentences % of all sentences Mean sentence counts Signal
Favourable (F) 19,108 38.34 74.06 Neutral (N) 26,472 53.12 102.60 Unfavourable (U) 4,254 8.54 16.49
Sensitivity Price-sensitive (PS) 18,593 37.31 72.07 Non price-sensitive (NS) 31,241 62.69 121.09
Theme Earnings and results 13,312 26.71 51.60 Management 8,088 16.23 31.35 Financing/capital structure 7,724 15.50 29.94 Others 6,778 13.60 26.27 Asset changes 3,305 6.63 12.81 Product 3,046 6.11 11.81 Outlook 2,527 5.07 9.79 Labour issues 1,826 3.66 7.08 Investment/restructuring 1,804 3.62 6.99 Dividend 662 1.33 2.57 Securities 640 1.28 2.48 Government/legal issues 88 0.18 0.34 Analysts 25 0.05 0.10 Reviews 9 0.02 0.03
4.2.3 Disclosures from News
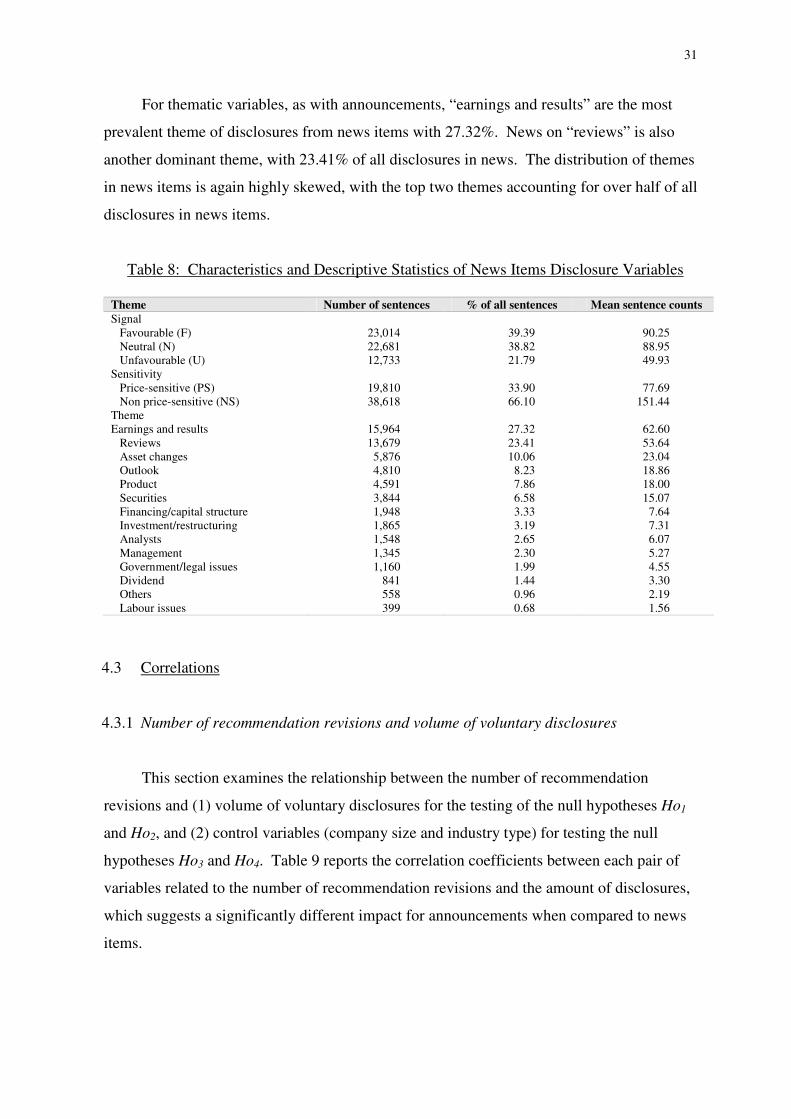
Table 8 presents the classification, characteristics and descriptive statistics of variables
for news in a similar manner to the announcements.
From the disclosure in news reports, “unfavourable disclosures” are the smallest
component of disclosures; this parallels disclosure levels in announcements. Yet the
proportion of “unfavourable disclosures” of news, about 22%, is not as small as in
announcements. The “favourable” and “neutral” signals of disclosures from the news reports
are almost equal, but with “favourable” content the most outstanding signal.
The observation on the “price-sensitivity” aspect reveals that contents for news exceed
those for “non price-sensitive” information, which is in the same direction as disclosure in
announcements. “Price-sensitive” disclosures account for 33.9% of disclosures in news
reports.
31
For thematic variables, as with announcements, “earnings and results” are the most
prevalent theme of disclosures from news items with 27.32%. News on “reviews” is also
another dominant theme, with 23.41% of all disclosures in news. The distribution of themes
in news items is again highly skewed, with the top two themes accounting for over half of all
disclosures in news items.
Table 8: Characteristics and Descriptive Statistics of News Items Disclosure Variables
Theme Number of sentences % of all sentences Mean sentence counts Signal
Favourable (F) 23,014 39.39 90.25 Neutral (N) 22,681 38.82 88.95 Unfavourable (U) 12,733 21.79 49.93
Sensitivity Price-sensitive (PS) 19,810 33.90 77.69 Non price-sensitive (NS) 38,618 66.10 151.44
Theme Earnings and results 15,964 27.32 62.60
Reviews 13,679 23.41 53.64 Asset changes 5,876 10.06 23.04 Outlook 4,810 8.23 18.86 Product 4,591 7.86 18.00 Securities 3,844 6.58 15.07 Financing/capital structure 1,948 3.33 7.64 Investment/restructuring 1,865 3.19 7.31 Analysts 1,548 2.65 6.07 Management 1,345 2.30 5.27 Government/legal issues 1,160 1.99 4.55 Dividend 841 1.44 3.30 Others 558 0.96 2.19 Labour issues 399 0.68 1.56
4.3 Correlations
4.3.1 Number of recommendation revisions and volume of voluntary disclosures
This section examines the relationship between the number of recommendation
revisions and (1) volume of voluntary disclosures for the testing of the null hypotheses Ho1
and Ho2, and (2) control variables (company size and industry type) for testing the null
hypotheses Ho3 and Ho4. Table 9 reports the correlation coefficients between each pair of
variables related to the number of recommendation revisions and the amount of disclosures,
which suggests a significantly different impact for announcements when compared to news
items.
32
The “number of revisions” is positively correlated with the “total sentences of
disclosure in company announcements”; showing a correlation coefficient (r) of .555, being
significant at a 1 percent level. Further, by observing the number of revision with sentences
by signal, it shows the “number of revisions” is significantly correlated to all types of signal,
i.e., the “number of favourable sentences” (r = .280, p-value = .080), the “number of neutral
sentences” (r = .529, p-value = .000), and the “number of unfavourable sentences” (r = .555,
p-value = .000). Finally, the “number of revisions” is significantly correlated with both
“price-sensitive” (r = .415) and “non price-sensitive” (r = .454) sentence counts at a 1 percent
level. The null hypothesis Ho1 ( that there is no relationship between the number of analyst
recommendation changes and total number of sentences in announcements) must therefore be
rejected as the relationship between the number of recommendation changes is significantly
associated with volume of disclosures in company announcements.
On the company news reports in the media, the “number of recommendation revisions”
is positively correlated to the “total sentences of news items”; with a correlation coefficient
of .271, significant at the 10 percent level. By observing sentence counts by classification, the
“number of favourable sentences” is correlated with the “number of revisions” (r = .359)
being significant at a 5 percent level. The “number of unfavourable sentence counts” is
significantly correlated to the “number of revisions” (r = .362, p-value = .022). Moreover, the
“number of revisions” is significantly related to the “price-sensitive sentence counts” (r = .398,
p-value = .011). As such, the null hypothesis Ho2 ( that there is no relationship between the
number of analyst recommendation changes and total number of sentences in news items)
must be rejected since a significant relationship exists between the number of
recommendation changes and the volume of disclosures in news reports.
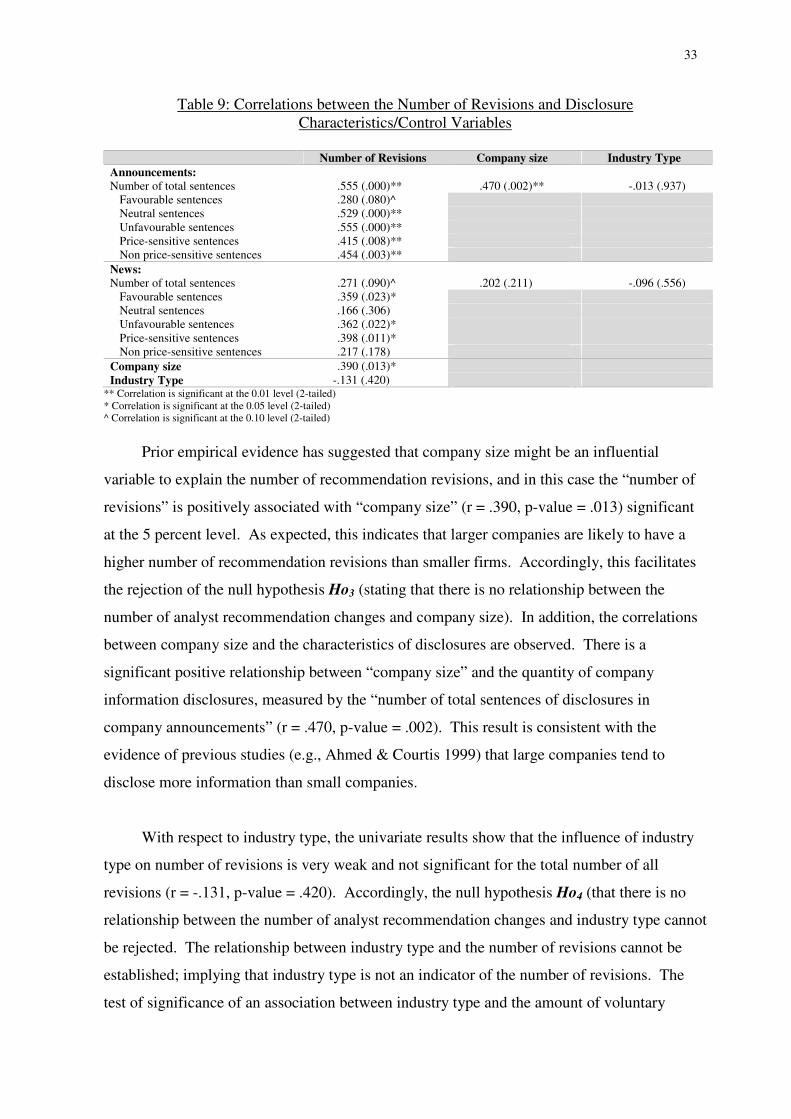
33
Table 9: Correlations between the Number of Revisions and Disclosure Characteristics/Control Variables
Number of Revisions Company size Industry Type Announcements: Number of total sentences .555 (.000)** .470 (.002)** -.013 (.937)
Favourable sentences .280 (.080)^ Neutral sentences .529 (.000)** Unfavourable sentences .555 (.000)** Price-sensitive sentences .415 (.008)** Non price-sensitive sentences .454 (.003)**
News: Number of total sentences .271 (.090)^ .202 (.211) -.096 (.556)
Favourable sentences .359 (.023)* Neutral sentences .166 (.306) Unfavourable sentences .362 (.022)* Price-sensitive sentences .398 (.011)* Non price-sensitive sentences .217 (.178)
Company size .390 (.013)* Industry Type -.131 (.420)
** Correlation is significant at the 0.01 level (2-tailed) * Correlation is significant at the 0.05 level (2-tailed) ^ Correlation is significant at the 0.10 level (2-tailed)
Prior empirical evidence has suggested that company size might be an influential
variable to explain the number of recommendation revisions, and in this case the “number of
revisions” is positively associated with “company size” (r = .390, p-value = .013) significant
at the 5 percent level. As expected, this indicates that larger companies are likely to have a
higher number of recommendation revisions than smaller firms. Accordingly, this facilitates
the rejection of the null hypothesis Ho3 (stating that there is no relationship between the
number of analyst recommendation changes and company size). In addition, the correlations
between company size and the characteristics of disclosures are observed. There is a
significant positive relationship between “company size” and the quantity of company
information disclosures, measured by the “number of total sentences of disclosures in
company announcements” (r = .470, p-value = .002). This result is consistent with the
evidence of previous studies (e.g., Ahmed & Courtis 1999) that large companies tend to
disclose more information than small companies.
With respect to industry type, the univariate results show that the influence of industry
type on number of revisions is very weak and not significant for the total number of all
revisions (r = -.131, p-value = .420). Accordingly, the null hypothesis Ho4 (that there is no
relationship between the number of analyst recommendation changes and industry type cannot
be rejected. The relationship between industry type and the number of revisions cannot be
established; implying that industry type is not an indicator of the number of revisions. The
test of significance of an association between industry type and the amount of voluntary

34
disclosures is also observed, and it reveals that the manufacturing and non-manufacturing
firms are not differentiated in terms of number of sentences disclosed in company
announcements and news items.
4.3.2 Attributes of recommendation revisions and characteristics of voluntary disclosures
This section reports on an investigation of the relationship between attributes of
recommendation revisions (rather than the number of revisions in the previous part) and (1)
the characteristics of disclosure for the testing of the null hypotheses Ho5 and Ho6, and (2)
company size/industry type for testing the null hypotheses Ho7 and Ho8.
a. Recommendation Revisions and Disclosures in Announcements
The correlation figures are reported for the relationship between recommendation
revisions and the frequency variables of announcements. The correlation matrix reveals
only a very weak to weak relationship between either “direction of change” or “type of
new recommendation, and the characteristics of disclosures for company
announcements. The most significant relationships are listed here in Table 10:
Table 10: Correlations: Recommendation Revision Attributes and Characteristics of Disclosure in Announcements
Measures of recommendation revision Disclosure variables Direction of change Type of change
Favourable disclosure -.105 (.094)* -.113 (.070)* Differences of favourable and unfavourable -.114 (.069)* -.116 (.062)* Ratio of favourable over unfavourable -.123 (.077)* -.119 (.087)* Non price-sensitive disclosure -.078 (.209) -.103 (.099)* Dividend -.157 (.012)** -.104 (.095)* Product -.087 (.164) -.130 (.037)** * Correlation is significant at the 0.10 level (2-tailed) ** Correlation is significant at the 0.05 level (2-tailed)
Three variables in Table 10 reveal a favourable signal disclosure (“favourable
disclosure”, “differences of favourable and unfavourable”, and “ratio of favourable over
unfavourable”) are found to be significantly negatively associated with both attributes
of recommendation change at a 10 percent level. “Non price-sensitive disclosure” is
significantly associated with “type of change” (r = -.103 significant at a 10 percent
level). For thematic features of disclosures, only two out of 14 themes are found to be
significantly associated with recommendation changes. Disclosures on “dividend” are
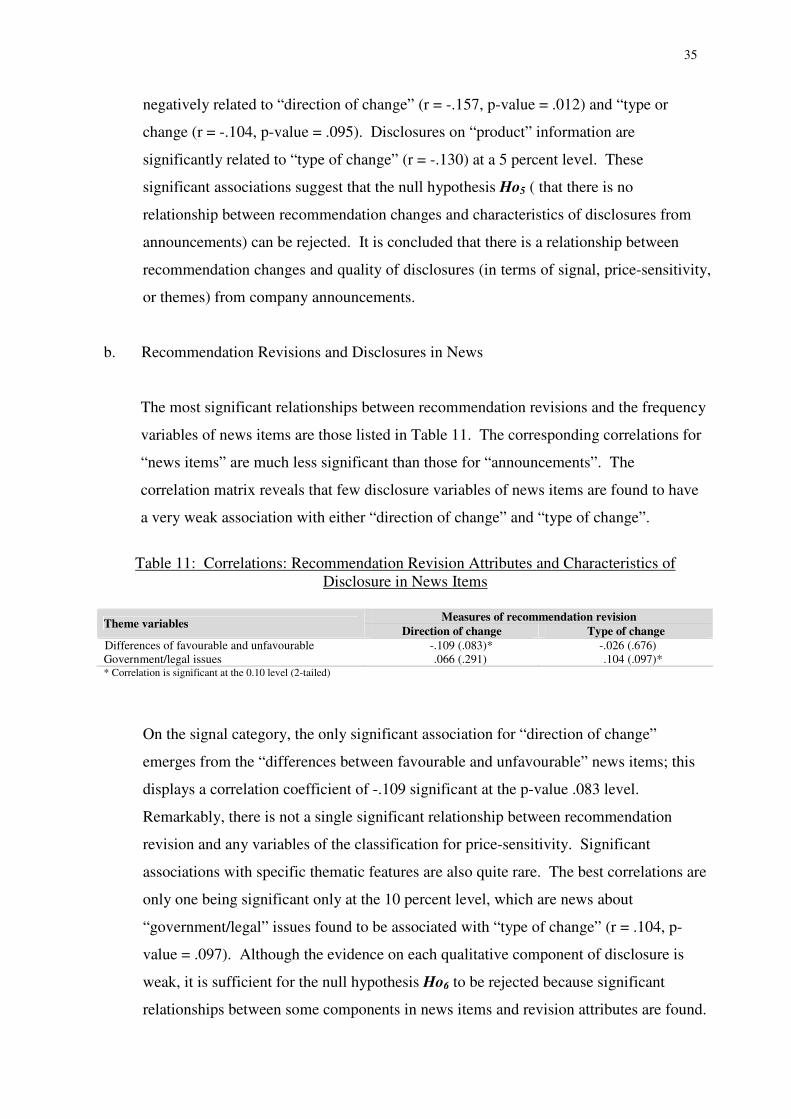
35
negatively related to “direction of change” (r = -.157, p-value = .012) and “type or
change (r = -.104, p-value = .095). Disclosures on “product” information are
significantly related to “type of change” (r = -.130) at a 5 percent level. These
significant associations suggest that the null hypothesis Ho5 ( that there is no
relationship between recommendation changes and characteristics of disclosures from
announcements) can be rejected. It is concluded that there is a relationship between
recommendation changes and quality of disclosures (in terms of signal, price-sensitivity,
or themes) from company announcements.
b. Recommendation Revisions and Disclosures in News
The most significant relationships between recommendation revisions and the frequency
variables of news items are those listed in Table 11. The corresponding correlations for
“news items” are much less significant than those for “announcements”. The
correlation matrix reveals that few disclosure variables of news items are found to have
a very weak association with either “direction of change” and “type of change”.
Table 11: Correlations: Recommendation Revision Attributes and Characteristics of
Disclosure in News Items
Measures of recommendation revision Theme variables Direction of change Type of change Differences of favourable and unfavourable -.109 (.083)* -.026 (.676) Government/legal issues .066 (.291) .104 (.097)* * Correlation is significant at the 0.10 level (2-tailed)
On the signal category, the only significant association for “direction of change”
emerges from the “differences between favourable and unfavourable” news items; this
displays a correlation coefficient of -.109 significant at the p-value .083 level.
Remarkably, there is not a single significant relationship between recommendation
revision and any variables of the classification for price-sensitivity. Significant
associations with specific thematic features are also quite rare. The best correlations are
only one being significant only at the 10 percent level, which are news about
“government/legal” issues found to be associated with “type of change” (r = .104, p-
value = .097). Although the evidence on each qualitative component of disclosure is
weak, it is sufficient for the null hypothesis Ho6 to be rejected because significant
relationships between some components in news items and revision attributes are found.
36
c. Recommendation Revisions and Control Variables
The univariate analysis between the attributes of recommendation revisions and
company size/industry type has also been conducted. In the absence of conventionally
significant relationships between any measures of recommendation revisions and
company size/industry type, the null hypothesis Ho7 (that there is no relationship
between attributes of recommendation changes and company size) and Ho8 (that there is
no relationship between attributes of recommendation changes and industry type)
cannot be rejected.
4.3.3 Concluding remarks on correlation analysis
Overall, the univariate results suggest that voluntary disclosures do have an impact on
the direction and type of analyst recommendation changes, but that it is difficult to pinpoint
more precise sources of influence. These univariate test results also indicate the need to
perform multivariate analysis in order to be able to further refine the findings. Multivariate
data analysis combining several independent variables is reported in the next section, with the
exception that more meaningful relationships may be revealed.
4.4 Regression analysis
The regression analysis focuses only on an examination of the relationship between each
individual attribute of recommendation revisions and the characteristics of disclosure. Both
attributes of recommendation revisions (“direction of change” and “type of change”) are
measured on a dichotomous scale; as a result the binary logistic regression is applied.
4.4.1 Announcements
The correlations between all independent variables are checked to detect possible
collinearity between any pair of independent variables. The correlation matrix (not reported
here) shows no correlation between independent variables exceeding 0.80. For
comprehensive detection, the VIF values of independent variables in both models are
observed. There are no variables with a VIF value exceeding 10, suggesting that there no
significant presence of multicollinearity.
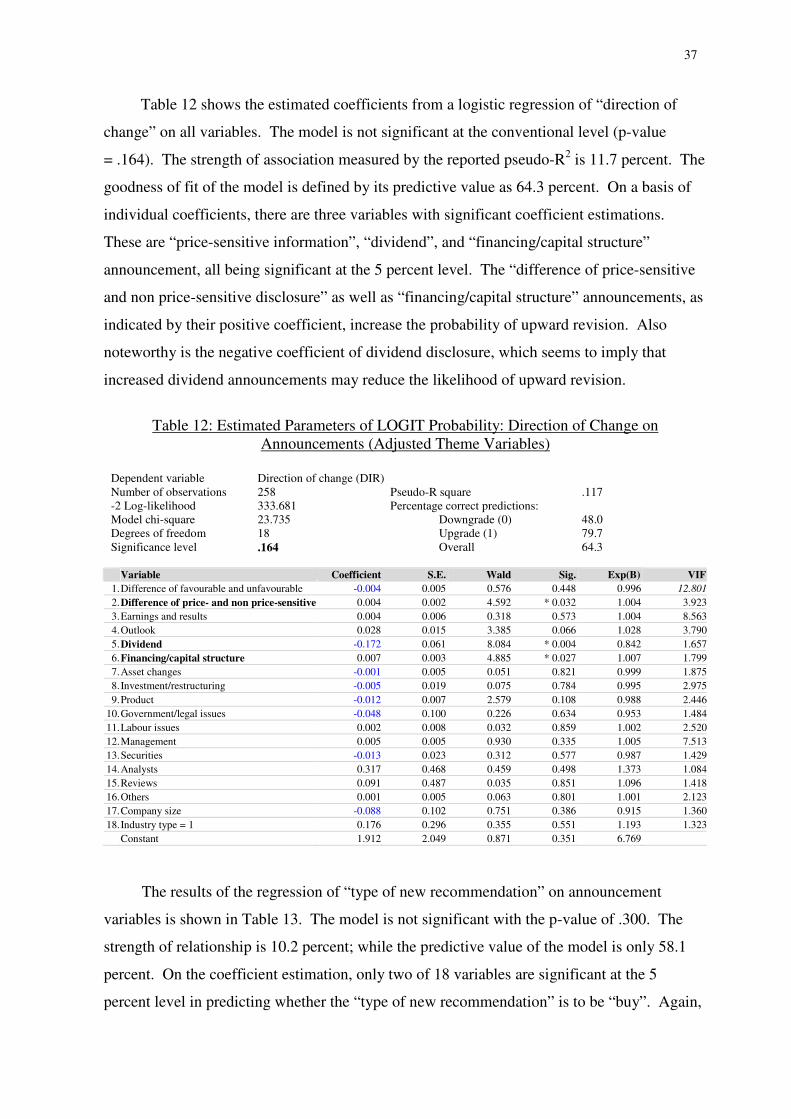
37
Table 12 shows the estimated coefficients from a logistic regression of “direction of
change” on all variables. The model is not significant at the conventional level (p-value
= .164). The strength of association measured by the reported pseudo-R2 is 11.7 percent. The
goodness of fit of the model is defined by its predictive value as 64.3 percent. On a basis of
individual coefficients, there are three variables with significant coefficient estimations.
These are “price-sensitive information”, “dividend”, and “financing/capital structure”
announcement, all being significant at the 5 percent level. The “difference of price-sensitive
and non price-sensitive disclosure” as well as “financing/capital structure” announcements, as
indicated by their positive coefficient, increase the probability of upward revision. Also
noteworthy is the negative coefficient of dividend disclosure, which seems to imply that
increased dividend announcements may reduce the likelihood of upward revision.
Table 12: Estimated Parameters of LOGIT Probability: Direction of Change on
Announcements (Adjusted Theme Variables)
Dependent variable Direction of change (DIR) Number of observations 258 Pseudo-R square .117 -2 Log-likelihood 333.681 Percentage correct predictions: Model chi-square 23.735 Downgrade (0) 48.0 Degrees of freedom 18 Upgrade (1) 79.7 Significance level .164 Overall 64.3
Variable Coefficient S.E. Wald Sig. Exp(B) VIF
1.Difference of favourable and unfavourable -0.004 0.005 0.576 0.448 0.996 12.801 2.Difference of price- and non price-sensitive 0.004 0.002 4.592 * 0.032 1.004 3.923 3.Earnings and results 0.004 0.006 0.318 0.573 1.004 8.563 4.Outlook 0.028 0.015 3.385 0.066 1.028 3.790 5.Dividend -0.172 0.061 8.084 * 0.004 0.842 1.657 6.Financing/capital structure 0.007 0.003 4.885 * 0.027 1.007 1.799 7.Asset changes -0.001 0.005 0.051 0.821 0.999 1.875 8.Investment/restructuring -0.005 0.019 0.075 0.784 0.995 2.975 9.Product -0.012 0.007 2.579 0.108 0.988 2.446
10.Government/legal issues -0.048 0.100 0.226 0.634 0.953 1.484 11.Labour issues 0.002 0.008 0.032 0.859 1.002 2.520 12.Management 0.005 0.005 0.930 0.335 1.005 7.513 13.Securities -0.013 0.023 0.312 0.577 0.987 1.429 14.Analysts 0.317 0.468 0.459 0.498 1.373 1.084 15.Reviews 0.091 0.487 0.035 0.851 1.096 1.418 16.Others 0.001 0.005 0.063 0.801 1.001 2.123 17.Company size -0.088 0.102 0.751 0.386 0.915 1.360 18.Industry type = 1 0.176 0.296 0.355 0.551 1.193 1.323
Constant 1.912 2.049 0.871 0.351 6.769
The results of the regression of “type of new recommendation” on announcement
variables is shown in Table 13. The model is not significant with the p-value of .300. The
strength of relationship is 10.2 percent; while the predictive value of the model is only 58.1
percent. On the coefficient estimation, only two of 18 variables are significant at the 5
percent level in predicting whether the “type of new recommendation” is to be “buy”. Again,
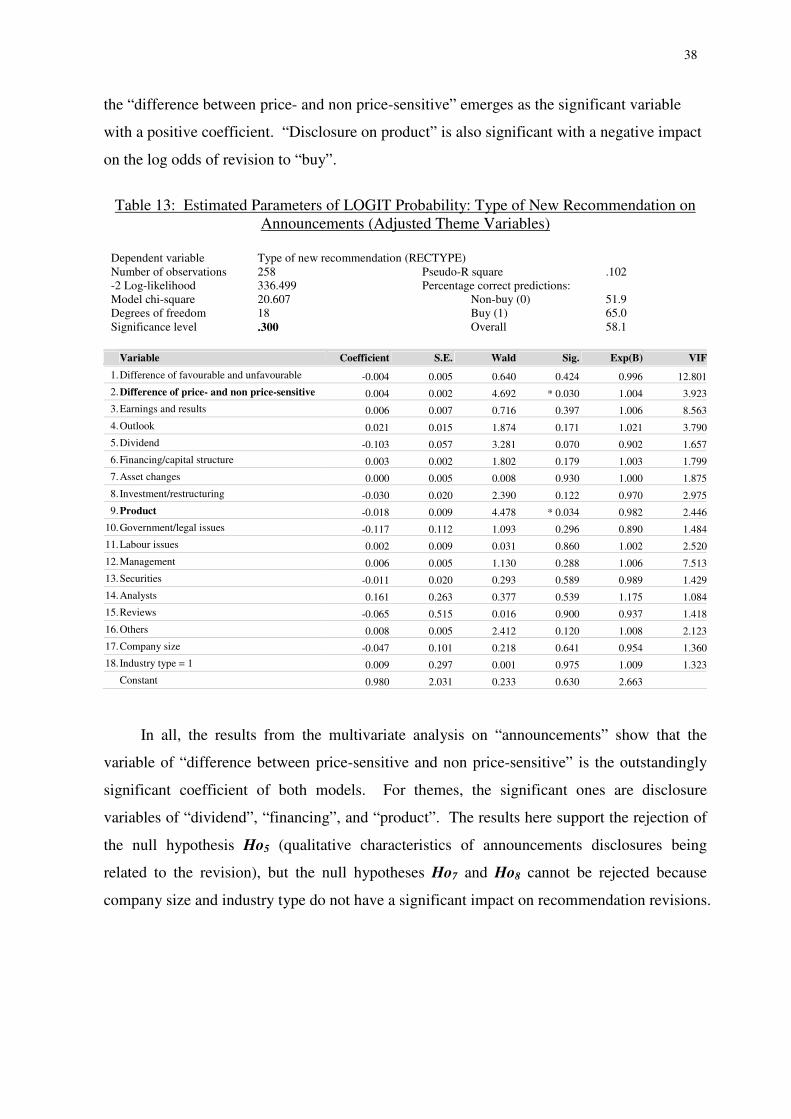
38
the “difference between price- and non price-sensitive” emerges as the significant variable
with a positive coefficient. “Disclosure on product” is also significant with a negative impact
on the log odds of revision to “buy”.
Table 13: Estimated Parameters of LOGIT Probability: Type of New Recommendation on
Announcements (Adjusted Theme Variables)
Dependent variable Type of new recommendation (RECTYPE) Number of observations 258 Pseudo-R square .102 -2 Log-likelihood 336.499 Percentage correct predictions: Model chi-square 20.607 Non-buy (0) 51.9 Degrees of freedom 18 Buy (1) 65.0 Significance level .300 Overall 58.1
Variable Coefficient S.E. Wald Sig. Exp(B) VIF
1.Difference of favourable and unfavourable -0.004 0.005 0.640 0.424 0.996 12.8012.Difference of price- and non price-sensitive 0.004 0.002 4.692 * 0.030 1.004 3.9233.Earnings and results 0.006 0.007 0.716 0.397 1.006 8.5634.Outlook 0.021 0.015 1.874 0.171 1.021 3.7905.Dividend -0.103 0.057 3.281 0.070 0.902 1.6576.Financing/capital structure 0.003 0.002 1.802 0.179 1.003 1.7997.Asset changes 0.000 0.005 0.008 0.930 1.000 1.8758. Investment/restructuring -0.030 0.020 2.390 0.122 0.970 2.9759.Product -0.018 0.009 4.478 * 0.034 0.982 2.446
10.Government/legal issues -0.117 0.112 1.093 0.296 0.890 1.48411.Labour issues 0.002 0.009 0.031 0.860 1.002 2.52012.Management 0.006 0.005 1.130 0.288 1.006 7.51313.Securities -0.011 0.020 0.293 0.589 0.989 1.42914.Analysts 0.161 0.263 0.377 0.539 1.175 1.08415.Reviews -0.065 0.515 0.016 0.900 0.937 1.41816.Others 0.008 0.005 2.412 0.120 1.008 2.12317.Company size -0.047 0.101 0.218 0.641 0.954 1.36018. Industry type = 1 0.009 0.297 0.001 0.975 1.009 1.323
Constant 0.980 2.031 0.233 0.630 2.663
In all, the results from the multivariate analysis on “announcements” show that the
variable of “difference between price-sensitive and non price-sensitive” is the outstandingly
significant coefficient of both models. For themes, the significant ones are disclosure
variables of “dividend”, “financing”, and “product”. The results here support the rejection of
the null hypothesis Ho5 (qualitative characteristics of announcements disclosures being
related to the revision), but the null hypotheses Ho7 and Ho8 cannot be rejected because
company size and industry type do not have a significant impact on recommendation revisions.
39
4.4.2 News Items
The correlation coefficient matrix (not reported) between the independent variables
from news items are all well below 0.80, indicating that collinearity among these variables is
not a problem. On the more comprehensive VIF measure, no variable has a value above 10,
diagnostic statistics which suggest that there are no multicollinearity-related problems with
the regression model, and that the results of the regression can be interpreted with a degree of
confidence.
Table 14 reports the results of regression on “direction of change”. The model based on
news variables is significantly inferior to that for announcements. The overall model is
statistically insignificant with the p-value at 0.827. The strength of association is reported at
only 6.3 percent whereas the predictive value of the equation is about 58.8 percent. When all
18 explanatory variables are entered in the equation, none of them is statistically significant at
the conventional level of 5 percent. The variables with the significant value closest to the
acceptable level appear to be “difference of favourable and unfavourable” and “dividend”
with the p-value of .123 and .117 respectively.

40
Table 14: Estimated Parameters of LOGIT Probability: Direction of Change on News Items (Adjusted Theme Variables)
Dependent variable Direction of change (DIR) Number of observations 255 Pseudo-R square .063 -2 Log-likelihood 341.112 Percentage correct predictions: Model chi-square 12.389 Downgrade (0) 55.1 Degrees of freedom 18 Upgrade (1) 62.5 Significance level .827 Overall 58.8
Variable Coefficient S.E. Wald Sig. Exp (B) VIF
1.Difference of favourable and unfavourable -0.004 0.003 2.374 0.123 0.996 2.672
2.Difference of price- and non price-sensitive 0.001 0.002 0.077 0.781 1.001 7.451
3.Earnings and results 0.004 0.004 0.967 0.325 1.004 6.191
4.Outlook 0.003 0.010 0.082 0.775 1.003 4.666
5.Dividend -0.076 0.048 2.461 0.117 0.927 2.090
6.Financing/capital structure 0.002 0.012 0.031 0.859 1.002 2.004
7.Asset changes 0.002 0.002 0.533 0.465 1.002 1.987
8.Investment/restructuring 0.004 0.013 0.074 0.785 1.004 1.662
9.Product -0.001 0.005 0.061 0.804 0.999 3.286
10.Government/legal issues 0.011 0.011 1.010 0.315 1.011 1.965
11.Labour issues 0.011 0.033 0.107 0.744 1.011 1.371
12.Management 0.003 0.015 0.039 0.843 1.003 2.479
13.Securities -0.002 0.011 0.034 0.853 0.998 3.835
14.Analysts 0.017 0.020 0.673 0.412 1.017 2.317
15.Reviews -0.001 0.003 0.132 0.717 0.999 7.642
16.Others -0.034 0.034 0.975 0.323 0.967 1.658
17.Company size -0.090 0.111 0.661 0.416 0.914 1.680
18.Industry type = 1 0.258 0.305 0.715 0.398 1.294 1.410
Constant 1.756 2.234 0.618 0.432 5.789
Table 15 shows the regression result on “type of new recommendation”. Again, the
model is statistically insignificant, with the significance level of .507. The goodness of fit of
the model is defined by its predictive value as 56.9 percent. Only one variable is statistically
significant at the conventional level of 5 percent; “dividend” (p-value = .047). The news on
“dividend” tends to decrease the chance of revision to “buy” as implied by its negative
coefficient.
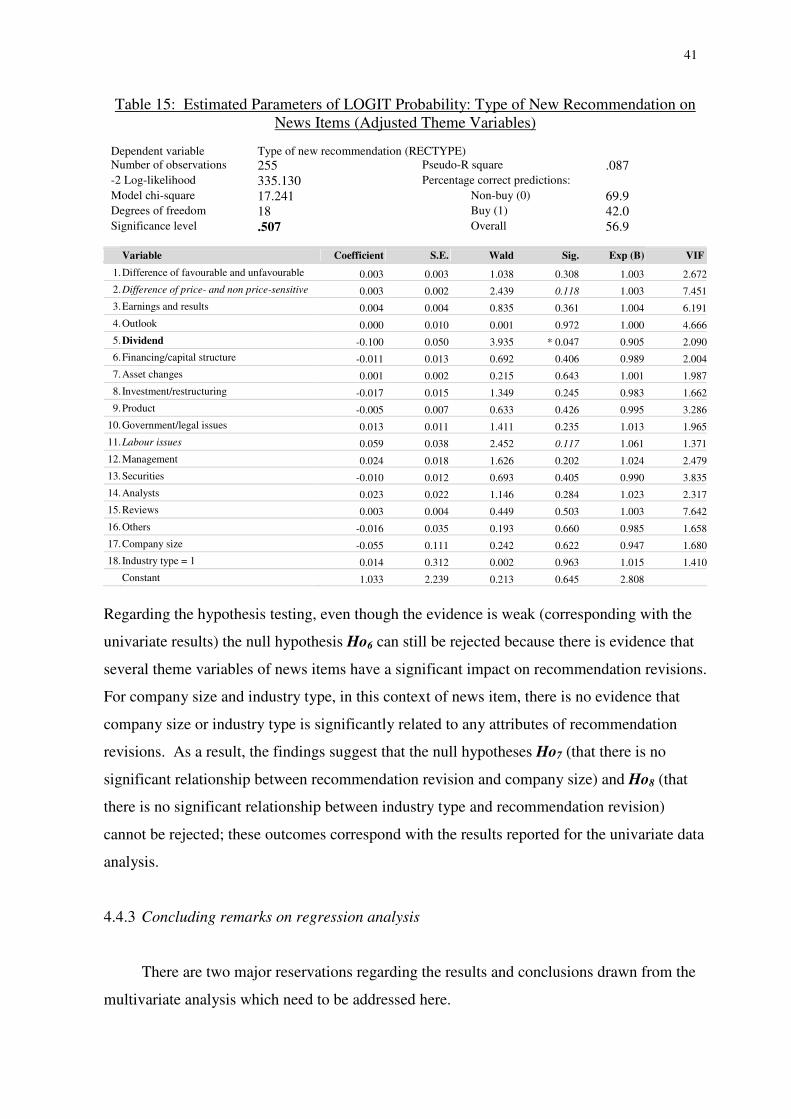
41
Table 15: Estimated Parameters of LOGIT Probability: Type of New Recommendation on News Items (Adjusted Theme Variables)
Dependent variable Type of new recommendation (RECTYPE) Number of observations 255 Pseudo-R square .087 -2 Log-likelihood 335.130 Percentage correct predictions: Model chi-square 17.241 Non-buy (0) 69.9 Degrees of freedom 18 Buy (1) 42.0 Significance level .507 Overall 56.9
Variable Coefficient S.E. Wald Sig. Exp (B) VIF
1.Difference of favourable and unfavourable 0.003 0.003 1.038 0.308 1.003 2.6722.Difference of price- and non price-sensitive 0.003 0.002 2.439 0.118 1.003 7.4513.Earnings and results 0.004 0.004 0.835 0.361 1.004 6.1914.Outlook 0.000 0.010 0.001 0.972 1.000 4.6665.Dividend -0.100 0.050 3.935 * 0.047 0.905 2.0906.Financing/capital structure -0.011 0.013 0.692 0.406 0.989 2.0047.Asset changes 0.001 0.002 0.215 0.643 1.001 1.9878. Investment/restructuring -0.017 0.015 1.349 0.245 0.983 1.6629.Product -0.005 0.007 0.633 0.426 0.995 3.286
10.Government/legal issues 0.013 0.011 1.411 0.235 1.013 1.96511.Labour issues 0.059 0.038 2.452 0.117 1.061 1.37112.Management 0.024 0.018 1.626 0.202 1.024 2.47913.Securities -0.010 0.012 0.693 0.405 0.990 3.83514.Analysts 0.023 0.022 1.146 0.284 1.023 2.31715.Reviews 0.003 0.004 0.449 0.503 1.003 7.64216.Others -0.016 0.035 0.193 0.660 0.985 1.65817.Company size -0.055 0.111 0.242 0.622 0.947 1.68018. Industry type = 1 0.014 0.312 0.002 0.963 1.015 1.410
Constant 1.033 2.239 0.213 0.645 2.808
Regarding the hypothesis testing, even though the evidence is weak (corresponding with the
univariate results) the null hypothesis Ho6 can still be rejected because there is evidence that
several theme variables of news items have a significant impact on recommendation revisions.
For company size and industry type, in this context of news item, there is no evidence that
company size or industry type is significantly related to any attributes of recommendation
revisions. As a result, the findings suggest that the null hypotheses Ho7 (that there is no
significant relationship between recommendation revision and company size) and Ho8 (that
there is no significant relationship between industry type and recommendation revision)
cannot be rejected; these outcomes correspond with the results reported for the univariate data
analysis.
4.4.3 Concluding remarks on regression analysis
There are two major reservations regarding the results and conclusions drawn from the
multivariate analysis which need to be addressed here.

42
First, the direction of some significant relationships is somewhat paradoxical, especially
the direction of relationships between recommendation revisions and disclosure on “dividend”
and “product”, which both report a “negative” relationship. However, the evidence of these
relationships, as found for both the correlations in the univariate analysis and the direction of
coefficient in the multivariate analysis, is not random but consistent throughout the main
analysis of both announcements and news items. One possible explanation for these results is
that “dividend” and “product” disclosures have a positive impact on price changes shortly
after their announcement (e.g., Morse 1982; Thompson et al. 1987) and so analysts have
already upgraded their stock recommendations (the old or previous rating) since the time of
the announcements. As these disclosures may have already been positively reflected in the
share price by the market, further recommendation revisions (the new or following rating)
might be to downgrade, since there is no further basis for analysts to issue more of an upgrade
revision for the company’s shares.
Second, the rejection of the null hypotheses (especially the null hypotheses Ho5 and Ho6
concerning the recommendation revisions and the characteristics of disclosures from
announcements and news items) is made on the basis of statistical models which are overall
not statistically significant but which include some variables that are significant. The
conclusions drawn are tentative, since the evidence of significant relationships is thin, and
scarcely sufficient to enable the rejection of the null hypothesis. The circumstances are
acknowledged and reserved here.
5. Conclusions
This paper examines the impact of voluntary disclosures on sell-side analyst stock
recommendation revisions. Voluntary disclosures include company continuous
announcements and news reports in the media. The characteristics of voluntary disclosures
over the same period of change are examined to determine whether they can explain the
properties of recommendation revision. Content analysis is used as a method for the
measurement of both announcements and news items.
The distribution of sentences in announcements and news (by signal, price-sensitiveness,
or themes) facilitates comparison of disclosures between these two sources. Disclosures in

43
“announcements” are far more positive than in “news”. There is also a larger number of
occurrences of non price-sensitive, rather than price-sensitive, disclosures in both sources.
For the thematic aspect of disclosures, both announcements and news items have some
themes in common; it can be interpreted that these themes are the types of information that a
company is apparently keen to disclose and such information is deemed noteworthy to the
market. Most of the news in the media is generated directly from company sources, which
suggests that announcements and news items represent similar content thus giving the
impression that, to some extent, content in news is only repeating the message from corporate
announcements.
In order to test the hypotheses, both univariate (correlation) and multivariate (regression)
analyses are conducted. The results reject the benchmark null hypothesis and support the
position that there are relationships between analyst recommendation changes and the
characteristics of voluntary disclosures. Ultimately, the main research questions have been
answered in two ways. Firstly, there is evidence of a relationship between the number of
recommendation revisions and volume of voluntary disclosures (sentence counts in company
announcements and the media. It explains that the characteristics of disclosures as measured
by the amount of disclosures are positively associated with the number of recommendation
revisions. This suggests that greater disclosure does lead to more accessible and available
information and hence higher numbers of recommendation revisions for companies.
Secondly, further evidence in terms of an impact on the nature or attributes of
recommendation revisions suggests that qualitative characteristics of disclosures (signal,
price-sensitivity, and theme) do have an impact on the direction and type of new
recommendation. The results from both announcements and news items conclusively indicate
that “favourable” information, “dividend-related” and “product-related” information are the
most important types of information having an impact on analysts’ recommendation revisions.
The control variables, company size and industry type, are moderately significantly associated
with the extent of disclosures, but not significant in relation to the attributes of
recommendation revisions.
It is noted that the findings of news items in this study consistently report weak
evidence of relationship between characteristics of disclosures and attributes of
recommendation revisions compared to those of company announcements. The evidence is

44
consistent throughout the analysis in this study. It can therefore be concluded that the scope
and level of disclosures in news are of an inferior quality to those in company announcements.
Taken as a whole, the findings can be viewed as providing some fairly clear evidence
regarding the research question investigated in this paper. However, there are two
circumstances on which this study has provided a logical comment. First, the direction of
association for “favourable”, “dividend”, or “product” information and attributes of
recommendation revisions being negative, which implies that the higher incidence of these
types of messages tends to decrease the chance of an upgrade revision and/or a revision to buy.
The way that the direction of significant relationships is counter-intuitive could be explained
by the timing of recommendation revision. Disclosures relevant to these types of information
may have triggered positive market reactions as well as positive recommendation revisions
after the disclosures of such information. As a result, subsequent revisions might be
downward. Second, the extent to which conclusions about rejecting some of the null
hypotheses (regarding the relationship between recommendation revisions and the
characteristics of disclosures in announcements and news items) are being made is based on
some, not all, variables that are significant.
The investigation of the extent of voluntarily disclosed information from company
announcements and news, as in this study, is expected to yield better measurement of
voluntary disclosures when compared to previous studies (mostly annual reports).
Nevertheless, some other sources of disclosures such as conference calls, analyst meetings,
and private contacts are notably difficult to gain access to. As a result, the number of
communication channels is restricted to keep the study manageable. Future research could
examine other channels of voluntary disclosures that are not included in this paper. The data
collection process has likely compromised the size of the studied sample. Although the study
examined in excess of 200 observations of recommendation revisions these were drawn from
only 40 companies because of the constraints imposed by the hand-collection and human
coding of data. In addition, the time period of the study covers only two years (1998-1999) as
such disclosures in all sources of this study are restricted to this two-year period, also due to
time constraints. These limitations may restrict the generalisability of the findings. It then
suggests that an expansion of sample size could improve the overall statistical characteristics
of data and improve the generalisation of the results. In addition, a further attempt to secure

45
direct access to analyst research reports could also be a beneficial aspect of additional work in
this area.
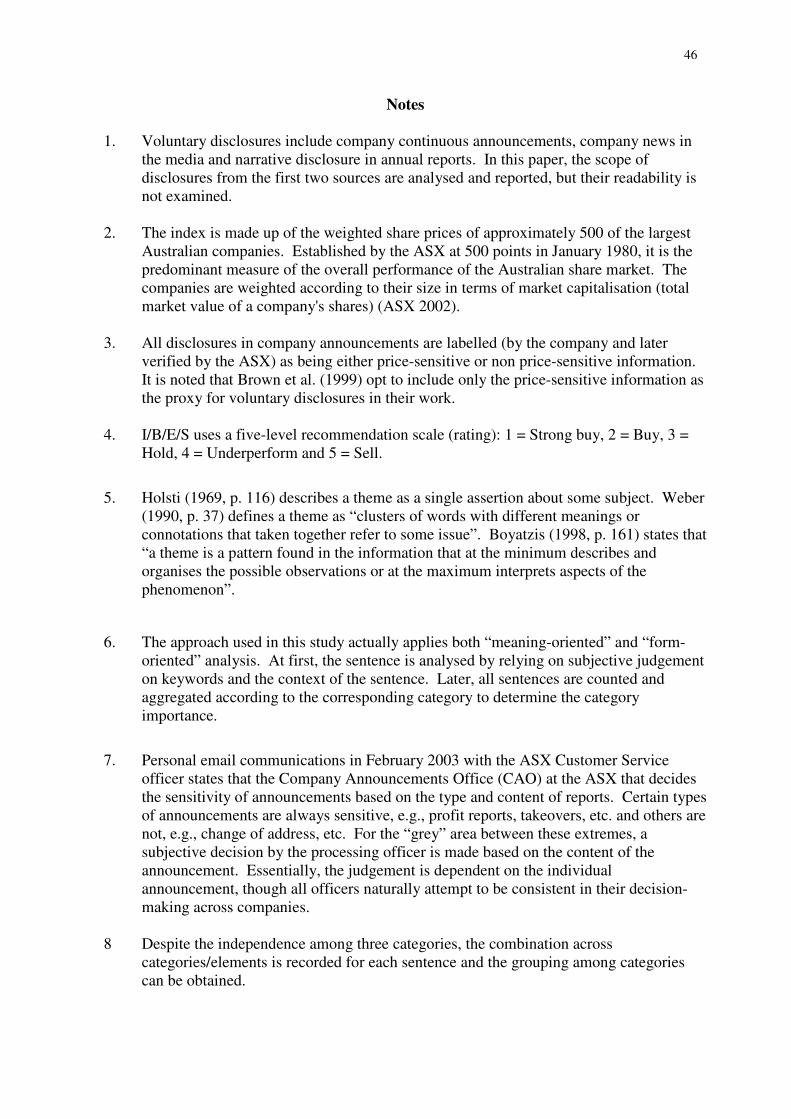
46
Notes 1. Voluntary disclosures include company continuous announcements, company news in
the media and narrative disclosure in annual reports. In this paper, the scope of disclosures from the first two sources are analysed and reported, but their readability is not examined.
2. The index is made up of the weighted share prices of approximately 500 of the largest
Australian companies. Established by the ASX at 500 points in January 1980, it is the predominant measure of the overall performance of the Australian share market. The companies are weighted according to their size in terms of market capitalisation (total market value of a company's shares) (ASX 2002).
3. All disclosures in company announcements are labelled (by the company and later
verified by the ASX) as being either price-sensitive or non price-sensitive information. It is noted that Brown et al. (1999) opt to include only the price-sensitive information as the proxy for voluntary disclosures in their work.
4. I/B/E/S uses a five-level recommendation scale (rating): 1 = Strong buy, 2 = Buy, 3 =
Hold, 4 = Underperform and 5 = Sell.
5. Holsti (1969, p. 116) describes a theme as a single assertion about some subject. Weber (1990, p. 37) defines a theme as “clusters of words with different meanings or connotations that taken together refer to some issue”. Boyatzis (1998, p. 161) states that “a theme is a pattern found in the information that at the minimum describes and organises the possible observations or at the maximum interprets aspects of the phenomenon”.
6. The approach used in this study actually applies both “meaning-oriented” and “form-oriented” analysis. At first, the sentence is analysed by relying on subjective judgement on keywords and the context of the sentence. Later, all sentences are counted and aggregated according to the corresponding category to determine the category importance.
7. Personal email communications in February 2003 with the ASX Customer Service officer states that the Company Announcements Office (CAO) at the ASX that decides the sensitivity of announcements based on the type and content of reports. Certain types of announcements are always sensitive, e.g., profit reports, takeovers, etc. and others are not, e.g., change of address, etc. For the “grey” area between these extremes, a subjective decision by the processing officer is made based on the content of the announcement. Essentially, the judgement is dependent on the individual announcement, though all officers naturally attempt to be consistent in their decision-making across companies.
8 Despite the independence among three categories, the combination across
categories/elements is recorded for each sentence and the grouping among categories can be obtained.

47
9. In previous research (e.g., Ahmed & Courtis 1999), company size has been measured in a number of ways including total assets, total sales, and market capitalisation. All these three size measures are examined in the preliminary analysis. The correlation between each size measure and the level of disclosures are comparable. In addition, these measures are highly correlated to each other; therefore only one measure, “total sales”, is selected as a reported proxy for company size in this study.
10. The comparable ratio for Stickel (1995) is 4.6:1, Womack (1996) is 6.3:1, and Ho and
Harris (1998) is 5.2:1.

48
References Abrahamson, E. and Amir, E. 1996, ‘The information content of the president’s letter to
shareholders’, Journal of Business Finance & Accounting, vol. 23, no. 8, pp. 1157-1182. Ahmed, K. and Courtis, J. K. 1999, ‘Associations between corporate characteristics and
disclosure levels in annual reports: A meta-analysis’, British Accounting Review, vol. 31, no. 1, pp. 35-61.
American Institute of Certified Public Accountants (AICPA) Special Committee on Financial
Reporting 1994, Improving Business Reporting - A Customer Focus: Meeting the Information Needs of Investors and Creditors, AICPA, New York.
Amir, E. and Lev, B. 1996, ‘Value-relevance of nonfinancial information: The wireless
communications industry’, Journal of Accounting and Economics, vol. 22, no. 1-3, pp. 3-30.
Australian Stock Exchange (ASX) 2002, Glossary of sharemarket terms, [Online, accessed 12
December 2002]. URL: http://www.asx.com.au/glossary/Glossary.shtm Australian Stock Exchange (ASX) 2003a, Guidance Note 8 - Continuous Disclosure: Listing
Rule 3.1, ASX, Sydney. Australian Stock Exchange (ASX) 2003b, Listing Rule Chapter 3: Continuous Disclosure,
ASX, Sydney. Baginski, S. P. and Hassell, J. M. 1990, ‘The market interpretation of management earnings
forecasts as a predictor of subsequent financial analyst forecast revision’, The Accounting Review, vol. 65, no. 1, pp. 175-190.
Bauman, W. S., Datta, S. and Iskandar-Datta, M. E. 1995, ‘Investment analyst
recommendations: A test of ‘the announcement effect’ and ‘the valuable information effect”, Journal of Business Finance & Accounting, vol. 22, no. 5, pp. 659-670.
Beattie, V., McInnes, B. and Fearnley, S. 2002, ‘Narrative reporting by listed UK companies:
A comparative within-sector topic analysis’, Working paper, University of Stirling, Scotland, UK.
Beattie, V., McInnes, B. and Fearnley, S. 2004, ‘A methodology for analysing and evaluating
narratives in annual reports: A comprehensive descriptive profile and metrics for disclosure quality attributes’, Accounting Forum, vol. 28, no. 3, pp. 205-236.
Bhushan, R. 1989, ‘Firm characteristics and analyst following’, Journal of Accounting and
Economics, vol. 11, no. 2-3, pp. 255-274. Botosan, C. A. 1997, ‘Disclosure level and the cost of equity capital’, The Accounting
Review, vol. 72, no. 3, pp. 323-349.
49
Botosan, C. A. and Harris, M. S. 2000, ‘Motivations for a change in disclosure frequency and its consequences: An examination of voluntary quarterly segment disclosures’, Journal of Accounting Research, vol. 38, no. 2, pp. 329-353.
Botosan, C. A. and Plumlee, M. A. 2002, ‘A re-examination of disclosure level and the
expected cost of equity capital’, Journal of Accounting Research, vol. 40, no. 1, pp. 21-40.
Boyatzis, R. E. 1998, Transforming qualitative information: Thematic analysis and code
development, Sage Publications, Thousand Oaks, California. Bradshaw, M. T. 2002, ‘The use of target prices to justify sell-side analysts’ stock
recommendations’, Accounting Horizons, vol. 16, no. 1, pp. 27-41. Bradshaw, M. T. 2004, ‘How do analysts use their earnings forecasts in generating stock
recommendation?’ The Accounting Review, vol. 79, no. 1, pp. 25-50. Breton, G. and Taffler, R. J. 2001, ‘Accounting information and analyst stock
recommendation decisions: a content analysis approach’, Accounting & Business Research, vol. 31, no. 2, pp. 91-101.
Brookfield, D. and Morris, R. 1992, ‘The market impact of UK company news
announcements’, Journal of Business Finance & Accounting, vol. 19, no. 4, pp. 585-602. Brown, L. D. 1993, ‘Earnings forecasting research: Its implications for capital markets
research’, International Journal of Forecasting, vol. 9, no. 3, pp. 295-320. Brown, P. R. 1997, ‘Financial data and decision-making by sell-side analysts’, The Journal of
Financial Statement Analysis, vol. 2, no. 3, pp. 43-48. Brown, P., Taylor, S. L. and Walter, T. S. 1999, ‘The impact of statutory sanctions on the
level and information content of voluntary corporate disclosure’, Abacus, vol. 35, no. 2, pp. 138-162.
Bryan, S. H. 1997, ‘Incremental information content of required disclosures contained in
management discussion and analysis’, The Accounting Review, vol. 72, no. 2, pp. 285-301.
Cooke, T. E. 1989, ‘Voluntary corporate disclosure by Swedish Companies’, Journal of
International Financial Management and Accounting, vol. 1, no. 2, pp. 171-195. Cooke, T. E. 1991, ‘An assessment of voluntary disclosure in the annual reports of Japanese
corporations’, International Journal of Accounting, vol. 26, no. 3, pp. 174-189. Cooke, T. E. 1992, ‘The impact of size, stock market listing and industry type on disclosure in
the annual reports of Japanese listed corporations’, Accounting & Business Research, vol. 22, no. 87, pp. 229-237.
Diamond, D. W. and Verrecchia, R. E. 1991, ‘Disclosure, liquidity, and the cost of capital’,
The Journal of Finance, vol. 46, no. 4, pp. 1325-1359.
50
Eccles, R. G. and Mavrinac, S. C. 1995, ‘Improving the corporate disclosure process’, Sloan Management Review, vol. 36, no. 4, pp. 11-25.
Ely, K. and Waymire, G. 1999, ‘Accounting standard-setting organizations and earnings
relevance: Longitudinal evidence from NYSE common stocks, 1927-93’, Journal of Accounting Research, vol. 37, no. 2, pp. 293-317.
Financial Accounting Standards Board (FASB) 2001, Improving Business Reporting: Insights
into enhancing voluntary disclosures, FASB, New York. Foster, G. 1986, Financial Statement Analysis, 2nd edn, Prentice-Hall, Englewood Cliffs,
New Jersey. Francis, J. and Schipper, K. 1999, ‘Have financial statements lost their relevance?’ Journal of
Accounting Research, vol. 37, no. 2, pp. 319-352. Francis, J., Schipper, K. and Vincent, L. 2002, ‘Expanded disclosures and the increased
usefulness of earnings announcements’, The Accounting Review, vol. 77, no. 3, pp. 515-546.
Francis, J. and Soffer, L. 1997, ‘The relative informativeness of analysts’ stock
recommendations and earnings forecasts revisions’, Journal of Accounting Research, vol. 35, no. 2, pp. 193-211.
Frazier, K. B., Ingram, R. W. and Tennyson, B. M. 1984, ‘A methodology for the analysis of
narrative accounting disclosures’, Journal of Accounting Research, vol. 22, no. 1, pp. 318-331.
Grant, J., Fogarty, T. J., Bricker, R. J. and Previts, G. J. 2000, Corporate reporting of
nonfinancial performance indicators and operating measures, Financial Executives Research Foundation, Morristown, New Jersey.
Guthrie, J. and Mathews, M. R. 1985, ‘Corporate social accounting in Australasia’, in
Research in corporate social performance and policy, vol. 7, ed. Preston, L. E., JAI Press, Greenwich, Connecticut, pp. 251-277.
Hackston, D. and Milne, M. J. 1996, ‘Some determinants of social and environmental
disclosures in New Zealand companies’, Accounting, Auditing & Accountability Journal, vol. 9, no. 1, pp. 77-108.
Hassell, J. M., Jennings, R. H. and Lasser, D. J. 1988, ‘Management earnings forecasts: Their
usefulness as a source of firm-specific information to security analysts’, The Journal of Financial Research, vol. 11, no. 4, pp. 303-319.
Healy, P. M., Hutton, A. P. and Palepu, K. G. 1999, ‘Stock performance and intermediation
changes surrounding sustained increases in disclosure’, Contemporary Accounting Research, vol. 16, no. 3, pp. 485-520.
Healy, P. M. and Palepu, K. G. 1993, ‘The effect of firms’ financial disclosure strategies on
stock prices’, Accounting Horizons, vol. 7, no. 1, pp. 1-11.
51
Healy, P. M. and Palepu, K. G. 2001, ‘Information asymmetry, corporate disclosure, and the capital markets: A review of the empirical disclosure literature’, Journal of Accounting and Economics, vol. 31, no. 1-3, pp. 405-440.
Ho, M. J. and Harris, R. S. 1998, ‘Market reactions to messages from brokerage ratings
systems’, Financial Analysts Journal, vol. 54, no. 1, pp. 49-57. Ho, M. J. and Harris, R. S. 2000, ‘Brokerage analysts’ rationale for investment
recommendations: Market responses to different types of information’, The Journal of Financial Research, vol. 23, no. 4, pp. 449-468.
Holland, J. B. 1998, ‘Private disclosure and financial reporting’, Accounting & Business
Research, vol. 28, no. 4, pp. 255-269. Holsti, O. R. 1969, Content analysis for the social sciences and humanities, Addison-Wesley
Publishing, Reading, Massachusetts. Hossain, M. and Adams, M. 1995, ‘Voluntary financial disclosure by Australian listed
companies’, Australian Accounting Review, vol. 5, no. 2, pp. 45-55. Ingram, R. W. and Frazier, K. B. 1983, ‘Narrative disclosures in annual reports’, Journal of
Business Research, vol. 11, no. 1, pp. 49-60. Jones, M. J. and Shoemaker, P. A. 1994, ‘Accounting narratives: A review of empirical
studies of content and readability’, Journal of Accounting Literature, vol. 13, pp. 142-184.
Krippendorff, K. 1980, Content analysis: An introduction to its methodology, Sage commtext
series vol. 5, Sage Publications, Beverly Hills. Lang, M. H. and Lundholm, R. J. 1993, ‘Cross-sectional determinants of analyst ratings of
corporate disclosures’, Journal of Accounting Research, vol. 31, no. 2, pp. 246-271. Lang, M. H. and Lundholm, R. J. 1996, ‘Corporate disclosure policy and analyst behavior’,
The Accounting Review, vol. 71, no. 4, pp. 467-496. Lang, M. H. and Lundholm, R. J. 2000, ‘Voluntary disclosure and equity offerings: Reducing
information asymmetry or hyping the stock?’ Contemporary Accounting Research, vol. 17, no. 4, pp. 625-662.
Leuz, C. and Verrecchia, R. E. 2000, ‘The economic consequences of increased disclosure’,
Journal of Accounting Research, vol. 38 Supplement, pp. 91-124. Lev, B. and Zarowin, P. 1999, ‘The boundaries of financial reporting and how to extend
them’, Journal of Accounting Research, vol. 37, no. 2, pp. 353-385. Marston, C. L. and Shrives, P. J. 1991, ‘The use of disclosure indices in accounting research:
A review article’, British Accounting Review, vol. 23, no. 3.
52
Meek, G. K., Roberts, C. B. and Gray, S. J. 1995, ‘Factors influencing voluntary annual reports disclosures by US, UK and Continental European multinational corporations’, Journal of International Business Studies, vol. 26, no. 3, pp. 555-572.
Milne, M. J. and Adler, R. W. 1999, ‘Exploring the reliability of social and environmental
disclosures content analysis’, Accounting, Auditing & Accountability Journal, vol. 12, no. 2, pp. 237-256.
Morse, D. 1982, ‘Wall Street Journal announcements and the securities markets’, Financial
Analysts Journal, vol. 38, no. 2, pp. 69-76. Neuendorf, K. A. 2002, The Content Analysis Guidebook, Sage Publications, Thousand Oaks,
California. O’Brien, P. C. and Bhushan, R. 1990, ‘Analyst following and institutional ownership’,
Journal of Accounting Research, vol. 28 Supplement, pp. 55-82. Orlow, D. K. 1999, ‘Market structure: How “Wall Street” works’, Journal of Retail Banking
Services, vol. 21, no. 1, pp. 57-59. Previts, G. J., Bricker, R. J., Robinson, T. R. and Young, S. J. 1994, ‘A content analysis of
sell-side financial analyst company reports’, Accounting Horizons, vol. 8, no. 2, pp. 55-70.
Pritamani, M. and Singal, V. 2001, ‘Return predictability following large price changes and
information releases’, Journal of Banking & Finance, vol. 25, no. 4, pp. 631-656. Rippington, F. A. and Taffler, R. J. 1995, ‘The information content of firm financial
disclosures’, Journal of Business Finance & Accounting, vol. 22, no. 3, pp. 345-362. Robb, S. W. G., Single, L. E. and Zarzeski, M. T. 2001, ‘Nonfinancial disclosures across
Anglo-American countries’, Journal of International Accounting, Auditing & Taxation, vol. 10, no. 1, pp. 71-83.
Rogers, R. K. and Grant, J. 1997, ‘Content analysis of information cited in reports of sell-side
financial analysts’, The Journal of Financial Statement Analysis, vol. 3, no. 1, pp. 17-31. Ryan, P. and Taffler, R. J. 2001, ‘Do brokerage houses add value? The market impact of sell-
side analyst recommendation changes’, Working paper, Cranfield School of Management, UK.
Ryan, P. and Taffler, R. J. 2004, ‘Are economically significant stock returns and trading
volumes driven by firm-specific news releases?’, Journal of Business Finance & Accounting, vol. 31, no. 1-2, pp. 49-82.
Schipper, K. 1991, ‘Analysts’ forecasts’, Accounting Horizons, vol. 5, no. 4, pp. 105-121. Smith, M. and Taffler, R. J. 2000, ‘The chairman’s statement - A content analysis of
discretionary narrative disclosures’, Accounting, Auditing & Accountability Journal, vol. 13, no. 5, pp. 624-647.
53
Stickel, S. E. 1995, ‘The anatomy of the performance of buy and sell recommendations’, Financial Analysts Journal, vol. 5, no. 5, pp. 25-39.
Tennyson, B. M., Ingram, R. W. and Dugan, M. T. 1990, ‘Assessing the information content
of narrative disclosures in explaining bankruptcy’, Journal of Business Finance & Accounting, vol. 17, no. 3, pp. 391-410.
Thompson, R. B., Olsen, C. and Dietrich, J. R. 1987, ‘Attributes of news about firms: An
analysis of firm-specific news reported in the Wall Street Journal Index’, Journal of Accounting Research, vol. 25, no. 2, pp. 245-274.
Uang, J. Y., Citron, D. B. and Taffler, R. J. 2001, ‘The information content of going-concern
uncertainty disclosures’, paper presented at the Lunchtime Research Seminar, Cranfield School of Management, UK, 13 September.
Walker, M. and Tsalta, A. 2001, Corporate financial disclosure and analyst forecasting
activity: Preliminary evidence for the UK, Research report no. 67, The Certified Accountants Educational Trust, London.
Wallman, S. M. H. 1995, ‘The future of accounting and disclosure in an evolving world: The
need for dramatic change’, Accounting Horizons, vol. 9, no. 3, pp. 81-91. Waymire, G. 1986, ‘Additional evidence on the accuracy of analyst forecasts before and after
voluntary management earnings forecasts’, The Accounting Review, vol. 61, no. 1, pp. 129-142.
Weber, R. P. 1990, Basic content analysis, 2nd edn, Sage university papers series on
quantitative applications in the social sciences no. 07-049, Sage Publications, Newbury Park, California.
Welker, M. 1995, ‘Disclosure policy, information asymmetry, and liquidity in equity markets’,
Contemporary Accounting Research, vol. 11, no. 2, pp. 801-827. Williams, P. A. 1996, ‘The relation between a prior earnings forecast by management and
analyst response to a current management forecast’, The Accounting Review, vol. 71, no. 1, pp. 103-115.
Wimmer, R. D. and Dominick, J. R. 2003, Mass media research: An introduction, 7th edn,
Wadsworth/Thomson Learning, Belmont, California. Womack, K. L. 1996, ‘Do brokerage analysts’ recommendations have investment value?’ The
Journal of Finance, vol. 51, no. 1, pp. 137-167.
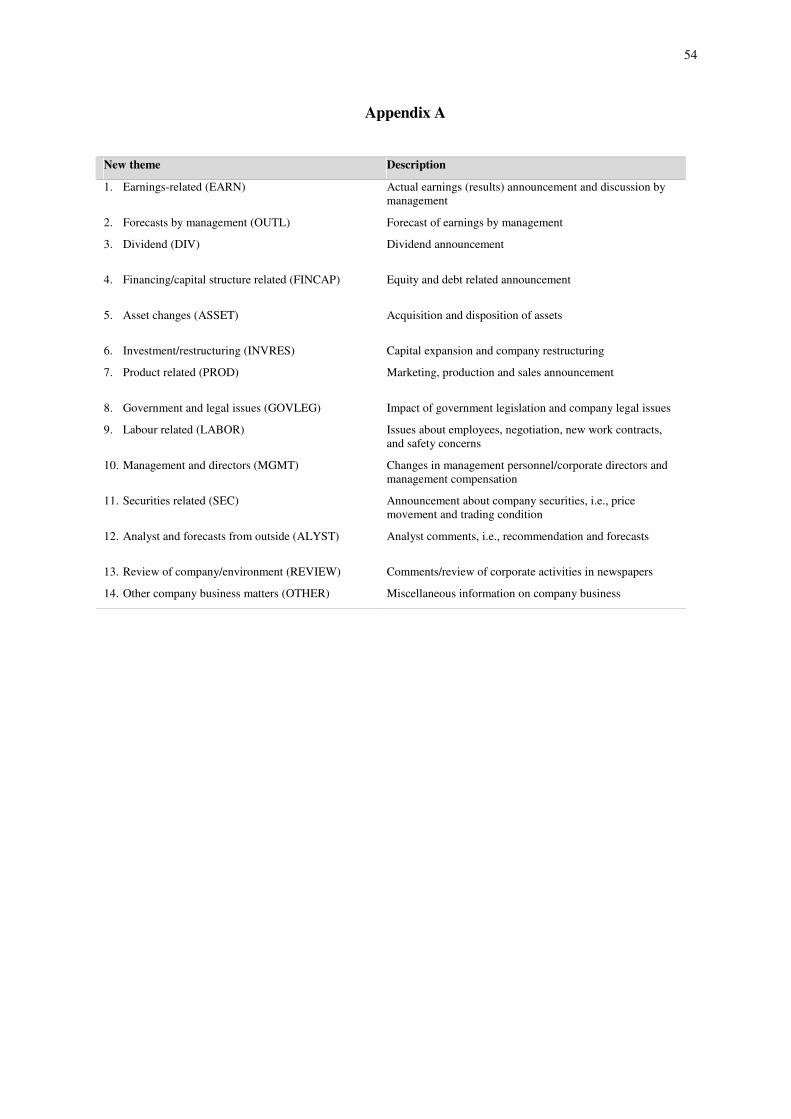
54
Appendix A
New theme Description
1. Earnings-related (EARN) Actual earnings (results) announcement and discussion by management
2. Forecasts by management (OUTL) Forecast of earnings by management
3. Dividend (DIV)
Dividend announcement
4. Financing/capital structure related (FINCAP)
Equity and debt related announcement
5. Asset changes (ASSET)
Acquisition and disposition of assets
6. Investment/restructuring (INVRES) Capital expansion and company restructuring
7. Product related (PROD)
Marketing, production and sales announcement
8. Government and legal issues (GOVLEG) Impact of government legislation and company legal issues
9. Labour related (LABOR) Issues about employees, negotiation, new work contracts, and safety concerns
10. Management and directors (MGMT) Changes in management personnel/corporate directors and management compensation
11. Securities related (SEC)
Announcement about company securities, i.e., price movement and trading condition
12. Analyst and forecasts from outside (ALYST)
Analyst comments, i.e., recommendation and forecasts
13. Review of company/environment (REVIEW) Comments/review of corporate activities in newspapers
14. Other company business matters (OTHER) Miscellaneous information on company business

55
Appendix B: Illustration of the coding of announcements and news items
Announcement from “Pacifica Group Limited” (PBB): 13 sentences The square bracket [ ] with a number after the sentence indicates the sentence number. ������������� ��� ���������� ����� �������������� �
������������� ������������������������� �������������������������
��������������������� ���������������� ��!�����"��#��$�����%���������&' ()�*� ��������������������������������������������������������������� �������������������������%����"��+��"����������������������!�������� ����(��,�����%����-�����.���������������������/����0������+��������� ��������$�����1�..$�2����34�5�6������%����+������������7��������������/����0�����,�����"������8���������+���������������+4�5�6������%���9��������1���:�������������������������������,�.���+���;����1,������1���������������������� ����(���+������������%%����������*�����������������������"�����%��������<��������������������4�5=6� >����� ��� �� ��/��� ��������� ��� ��� ��0��� ��"�������"� ��� ����������� ��������� ��� ��� �����1� .���+���;����19���"���%������?���������(������,>���������%���9�� ���"��"��������,� ��@���1�A��!���4�5�6��
> ��� ���� (��� ��� ��� �8����",� "��+�� ���!�� +��� ���1� ���"�� ���/���� ��� ��� ����*� ��������� �����%�������������������+���������+����������� �������������"�4�5�6�B�� �����8������������������������������������������������"�������0��+�����/����0������������������%����������"������������������,>����� �4�A��!���4�5C6��>�����%�������,����/����0������+�����������%������������������������%���������������"��%��������������������� %���� ��� ?;4� 5D6� ����������� ������ ��������� ��� ��*����� ��,� ��� �� ������ ��"�,� +�� +�������"�����0��1� �8���� �� %���� ����%������"� ������14� 5�6� B�� +���� ��� �������"� "����"�� ���� ��� ���������%������",����%����,�����+�1�������+������"���%�����������������4�5�6� �������������������8����������������"��������������,>�������4�5��6��.���+���;����1��8��������������������������������"�������������(�����4�����%���9��$�������������������0����������%�������%����������������������4�5��6�E����������������������B��%��"����� ��+���4�5��6��E����������$����������������,�����%��������%�������������!���������0����������������������������4�5�=6�
The above 13 sentences were coded as followed:
Sentence Theme* Signal^ Price-sensitive# Note 1 IP F PS establish a joint venture 2 IP N PS joint venture 3 AO N PS recent acquisition 4 BC N PS company 5 BC F PS market 6 CO F PS outlook 7 IP F PS Joint venture to build plant 8 PD N PS product 9 PD N PS product
10 PD N PS product 11 BC N PS company 12 BC N PS company background 13 PD N PS product
* Theme code referred to Appendix A
^ Signal: F = favourable, N = neutral, U = unfavourable # Price-sensitivity: PS = price-sensitive, NS = non price-sensitive