volumetric survey of grapevine lake - twdb.texas.gov · positioning system (dgps) equipment. data...
TRANSCRIPT
Volumetric Survey of
GRAPEVINE LAKE September 2011 Survey
November 2012
Texas Water Development Board
Billy R. Bradford Jr., Chairman Joe M. Crutcher, Vice ChairmanEdward G. Vaughan, Member F.A. "Rick" Rylander, MemberLewis H. McMahan, Member Monte Cluck, Member
Melanie Callahan, Executive Administrator
Prepared for:
Dallas County Park Cities Municipal Utility District
With Support Provided by:
U.S. Army Corps of Engineers, Fort Worth District
uthorizationfor use or reproduction ofany original material contained in this publication, i.e. not obtainedrom othersources, isfreely granted. TheBoard would appreciate acknowledgement.
This report was prepared by staff of the Surface Water Resources Division:
Ruben S. Solis, Ph.D., P.E.Jason J. Kemp, Team Leader
Tony ConnellHolly Holmquist
Tyler McEwen, E.I.T., C.F.MNathan Brock
Af
Published and distributed by the
TexasWater (^Development Board
P.O. Box 13231, Austin, TX 78711-3231

Executive summary
In September, 2011, the Texas Water Development Board entered into agreement with
Dallas County Park Cities Municipal Utility District and the U.S. Army Corps of Engineers,
Fort Worth District, to perform a volumetric survey of Grapevine Lake. Dallas County Park
Cities Municipal Utility District provided 50% of the funding for this survey, while the U.S.
Army Corps of Engineers, Fort Worth District provided the remaining 50% of the funding
through their Texas Water Allocation Assessments Program. Surveying was performed using a
multi-frequency (200 kHz, 50 kHz, and 24 kHz), sub-bottom profiling depth sounder; although,
only the 200 kHz frequency was analyzed for this report.
Grapevine Dam and Grapevine Lake are located on Denton Creek in Tarrant and
Denton Counties, adjacent to the northwestern city limits of Grapevine, Texas. The
conservation pool elevation of Grapevine Lake t is 535.0 feet above mean sea level (NGVD29).
TWDB collected bathymetric data for Grapevine Lake between September 22, 2011, and
September 30, 2011. The daily average water surface elevations during that time ranged
between 530.76 and 531.07 feet above mean sea level (NGVD29).
The 2011 TWDB volumetric survey indicates that Grapevine Lake has a total
reservoir capacity of 163,064 acre-feet and encompasses 6,707 acres at conservation pool
elevation (535.0 feet above mean sea level, NGVD29). Previous capacity estimates based on
multiple surveys conducted by the U.S. Army Corps of Engineers in 1946, 1952, 1961, and
1966 indicated Grapevine Lake’s total capacity was 188,550, 187,551, 183,639, and 181,109
acre-feet, respectively. A TWDB volumetric survey conducted in 2002 was re-evaluated using
current processing procedures that resulted in an updated capacity estimate of 166,802 acre-
feet.
TWDB recommends that a similar methodology be used to resurvey Grapevine Lake in
10 years or after a major flood event. To further improve estimates of capacity loss, TWDB
recommends a volumetric and sedimentation survey. Sedimentation surveys include additional
analysis of the multi-frequency data for post-impoundment sediment by correlation with
sediment core samples and a map identifying the spatial distribution of sediment throughout the
reservoir.

Table of Contents
Introduction ........................................................................................................................... 1 Grapevine Lake general information .................................................................................. 1 Volumetric and sedimentation survey of Grapevine Lake ............................................... 3
Datum .................................................................................................................................. 3 TWDB bathymetric data collection ..................................................................................... 4
Data processing ..................................................................................................................... 5 Model boundaries ................................................................................................................ 5 Triangulated Irregular Network model ............................................................................... 5 Area, volume, and contour calculations .............................................................................. 6 Spatial interpolation of reservoir bathymetry ...................................................................... 9
Survey results ...................................................................................................................... 11 Volumetric survey ............................................................................................................. 11
Recommendations ............................................................................................................... 13 TWDB contact information ............................................................................................... 13 References ............................................................................................................................ 14
List of Tables
Table 1. Pertinent data for Grapevine Dam and Grapevine Lake Table 2. Current and previous survey capacity and surface area data Table 3. Capacity loss comparisons for Grapevine Lake
List of Figures
Figure 1. Location of Grapevine Lake Figure 2. Data collected during 2011 TWDB Grapevine Lake survey Figure 3. Elevation relief map Figure 4. Depth ranges map Figure 5. 5-foot contour map Figure 6. Anisotropic spatial interpolation of Grapevine Lake
Appendices
Appendix A: Grapevine Lake 2011 capacity table Appendix B: Grapevine Lake 2011 area table Appendix C: Grapevine Lake 2011 area and capacity curves
Note: References to brand names throughout this report do not imply endorsement by the Texas Water Development Board

1
Introduction
The Hydrographic Survey Program of the Texas Water Development Board
(TWDB) was authorized by the 72nd Texas State Legislature in 1991. The Texas Water
Code authorizes TWDB to perform surveys to determine reservoir storage capacity,
sedimentation levels, rates of sedimentation, and projected water supply availability.
In September, 2011, TWDB entered into agreement with Dallas County Park Cities
Municipal Utility District and the U.S. Army Corps of Engineers, Fort Worth District, to
perform a volumetric survey of Grapevine Lake (TWDB, 2011a, TWDB, 2011b). Dallas
County Park Cities Municipal Utility District provided 50% of the funding for this survey,
while the U.S. Army Corps of Engineers, Fort Worth District provided the remaining 50%
of the funding through their Texas Water Allocation Assessments Program. This report
describes the methods used to conduct the volumetric survey, including data collection and
processing techniques. This report serves as the final contract deliverable from TWDB to
the Dallas County Park Cities Municipal Utility District and U.S. Army Corps of Engineers,
Fort Worth District and contains as deliverables: (1) an elevation-area-capacity table of the
reservoir acceptable to the Texas Commission on Environmental Quality [Appendix A, B],
(2) a bottom contour map [Figure 5], and (3) a shaded relief plot of the reservoir bottom
[Figure 3].
Grapevine Lake general information
Grapevine Dam and Grapevine Lake are located on Denton Creek, a tributary of
Elm Fork Trinity River (Trinity River Basin), in Tarrant and Denton Counties, adjacent to
the northwestern city limits of Grapevine, Texas (Figure 1). Grapevine Dam and Grapevine
Lake are owned and operated by the U.S. Army Corps of Engineers, Fort Worth District.
Grapevine Lake was built primarily for water supply and flood control (TWDB, 2002).
Construction on Grapevine Dam began in January, 1948, and was completed on June 6,
1952. Deliberate impoundment began on July 3, 1952 (TWDB, 1973). Additional pertinent
data about Grapevine Dam and Grapevine Lake can be found in Table 1.
Water rights for Grapevine Lake have been appropriated to Dallas County Park
Cities Municipal Utility District through Certificate of Adjudication and amendment Nos.
08-2363 and 08-2363A; the City of Dallas through Certificate of Adjudication and
amendment Nos. 08-2458, 08-2458A, 08-2458B, and 08-2458C; and the City of Grapevine
through Certificate of Adjudication and amendment Nos. 08-2362 and 08-2362A. The

2
complete certificates are on file in the Information Resources Division of the Texas
Commission on Environmental Quality.
Figure 1. Location of Grapevine Lake

3
Table 1. Pertinent data for Grapevine Dam and Grapevine Lake
Owner The U.S. Government. Operated by the U.S. Army Corps of Engineers, Fort Worth District
Engineer (Design) U.S. Army Corps of Engineers
Location of Dam On Denton Creek in Tarrant County, 2 miles northeast of Grapevine
Drainage area 695 square miles
Dam
Type Earthfill
Length 12,850 feet including the spillway
Maximum height 137 feet
Top width 28 feet
Spillway
Type Ogee
Length 500 feet
Crest elevation 560.0 feet above mean sea level
Control None
Outlet works
Type 1 conduit
Size 13 feet diameter with two inlets
Control 2 gates, each 6.5 by 13 feet
Invert elevation 475.0 feet above mean sea level
Low flow outlets
Type 2 steel pipes
Size Each 30 inches in diameter
Lowest invert elevation 500.5 feet above mean sea level
Reservoir data (based on 2011 TWDB survey)
Feature
Elevation (feet NGVD29a)
Capacity (acre-feet)
Area (acres)
Top of dam 588.0 N/A N/A
Maximum design water surface 581.0 N/A N/A
Top flood control storage space 560.0 N/A N/A
Top conservation storage space 535.0 163,064 6,707
Invert of lowest outlet 475.0 0 0
Streambed 451.0 0 0
Usable conservation storage space - 163,064 -
Volumetric and sedimentation survey of Grapevine Lake
Datum
The vertical datum used during this survey is the National Geodetic Vertical Datum
1929 (NGVD29). This datum is also utilized by the United States Geological Survey
(USGS) for the reservoir elevation gage USGS 08054500 Grapevine Lk nr Grapevine, TX
(USGS, 2011). Elevations herein are reported in feet above mean sea level relative to the
NGVD29 datum. Volume and area calculations in this report are referenced to water levels
provided by the USGS gage. The horizontal datum used for this report is North American
4
Datum 1983 (NAD83), and the horizontal coordinate system is State Plane Texas North
Central Zone (feet).
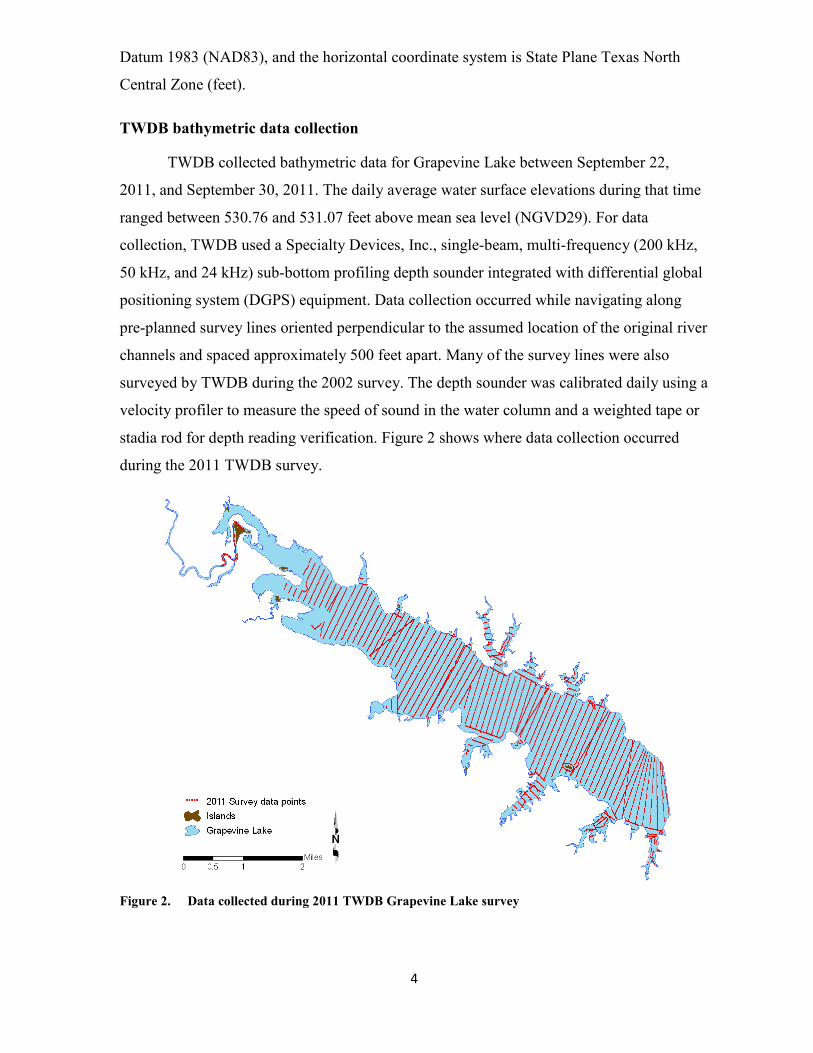
TWDB bathymetric data collection
TWDB collected bathymetric data for Grapevine Lake between September 22,
2011, and September 30, 2011. The daily average water surface elevations during that time
ranged between 530.76 and 531.07 feet above mean sea level (NGVD29). For data
collection, TWDB used a Specialty Devices, Inc., single-beam, multi-frequency (200 kHz,
50 kHz, and 24 kHz) sub-bottom profiling depth sounder integrated with differential global
positioning system (DGPS) equipment. Data collection occurred while navigating along
pre-planned survey lines oriented perpendicular to the assumed location of the original river
channels and spaced approximately 500 feet apart. Many of the survey lines were also
surveyed by TWDB during the 2002 survey. The depth sounder was calibrated daily using a
velocity profiler to measure the speed of sound in the water column and a weighted tape or
stadia rod for depth reading verification. Figure 2 shows where data collection occurred
during the 2011 TWDB survey.
Figure 2. Data collected during 2011 TWDB Grapevine Lake survey

5
Data processing
Model boundaries
The reservoir boundary was digitized from aerial photographs, also known as digital
orthophoto quarter-quadrangle images (DOQQs), obtained from the Texas Natural
Resources Information System (TNIRIS, 2009) using Environmental Systems Research
Institute’s ArcGIS 9.3.1 software. The quarter-quadrangles that cover Grapevine Lake are
Grapevine (NW, NE), Argyle (SW, SE), Colleyville (NE), and Lewisville West (SW). The
DOQQs were photographed on July 17, 2010, while the daily average water surface
elevation measured 535.02 feet above mean sea level. According to the associated
metadata, the 2010 DOQQS have a resolution of 1.0-meters and a horizontal accuracy
within + / - 6 meters to absolute ground control (USDA, 2011, TNRIS, 2010). For this
analysis, the boundary digitized at the land-water interface in the 2010 photographs is
assumed to be a good approximation of the reservoir boundary at conservation pool
elevation. Therefore, the delineated boundary was given an elevation of 535.0 feet above
mean sea level to facilitate calculating the area-capacity tables up to the conservation pool
elevation.
Triangulated Irregular Network model
Following completion of data collection, the raw data was edited using DepthPic.
DepthPic is used to display, interpret, and edit the multi-frequency data and to manually
identify the current reservoir-bottom surface from the 200 kHz signal returns. Following the
identification of this surface, a TWDB software package HydroTools, is used for further
processing (McEwen et al., 2011a or b). The software calculates the current reservoir–
bottom surface and outputs the data into a single file (McEwen et al., 2011a). The water
surface elevation at the time of each sounding is used to convert each sounding depth to a
corresponding reservoir-bottom elevation. This survey point dataset is then preconditioned
by inserting a uniform grid of artificial survey points between the actual survey lines.
Bathymetric elevations at these artificial points are determined using an anisotropic spatial
interpolation algorithm described in the spatial interpolation of reservoir bathymetry section
below. This technique creates a high resolution, uniform grid of interpolated bathymetric
elevation points throughout a majority of the reservoir (McEwen et al., 2011a or b). Finally,
the point file resulting from spatial interpolation is used in conjunction with sounding and
boundary data to create volumetric and sediment Triangulated Irregular Network (TIN)

6
models utilizing the 3D Analyst Extension of ArcGIS. The 3D Analyst algorithm uses
Delaunay’s criteria for triangulation to create a grid composed of triangles from non-
uniformly spaced points, including the boundary vertices (ESRI, 1995).
Area, volume, and contour calculations
Using ArcInfo software and the TIN model, volumes and areas were calculated for
the entire reservoir at 0.1 feet intervals, from elevation 475.9 to 535.0 feet. The elevation-
capacity table and elevation-area table, updated for 2011, are presented in Appendices A
and B, respectively. The area-capacity curves are presented in Appendix C.
The TIN model was converted to a raster representation using a cell size of 2 feet by
2 feet. The raster data was then used to produce an elevation relief map (Figure 3),
representing the topography of the reservoir bottom; a depth range map (Figure 4), showing
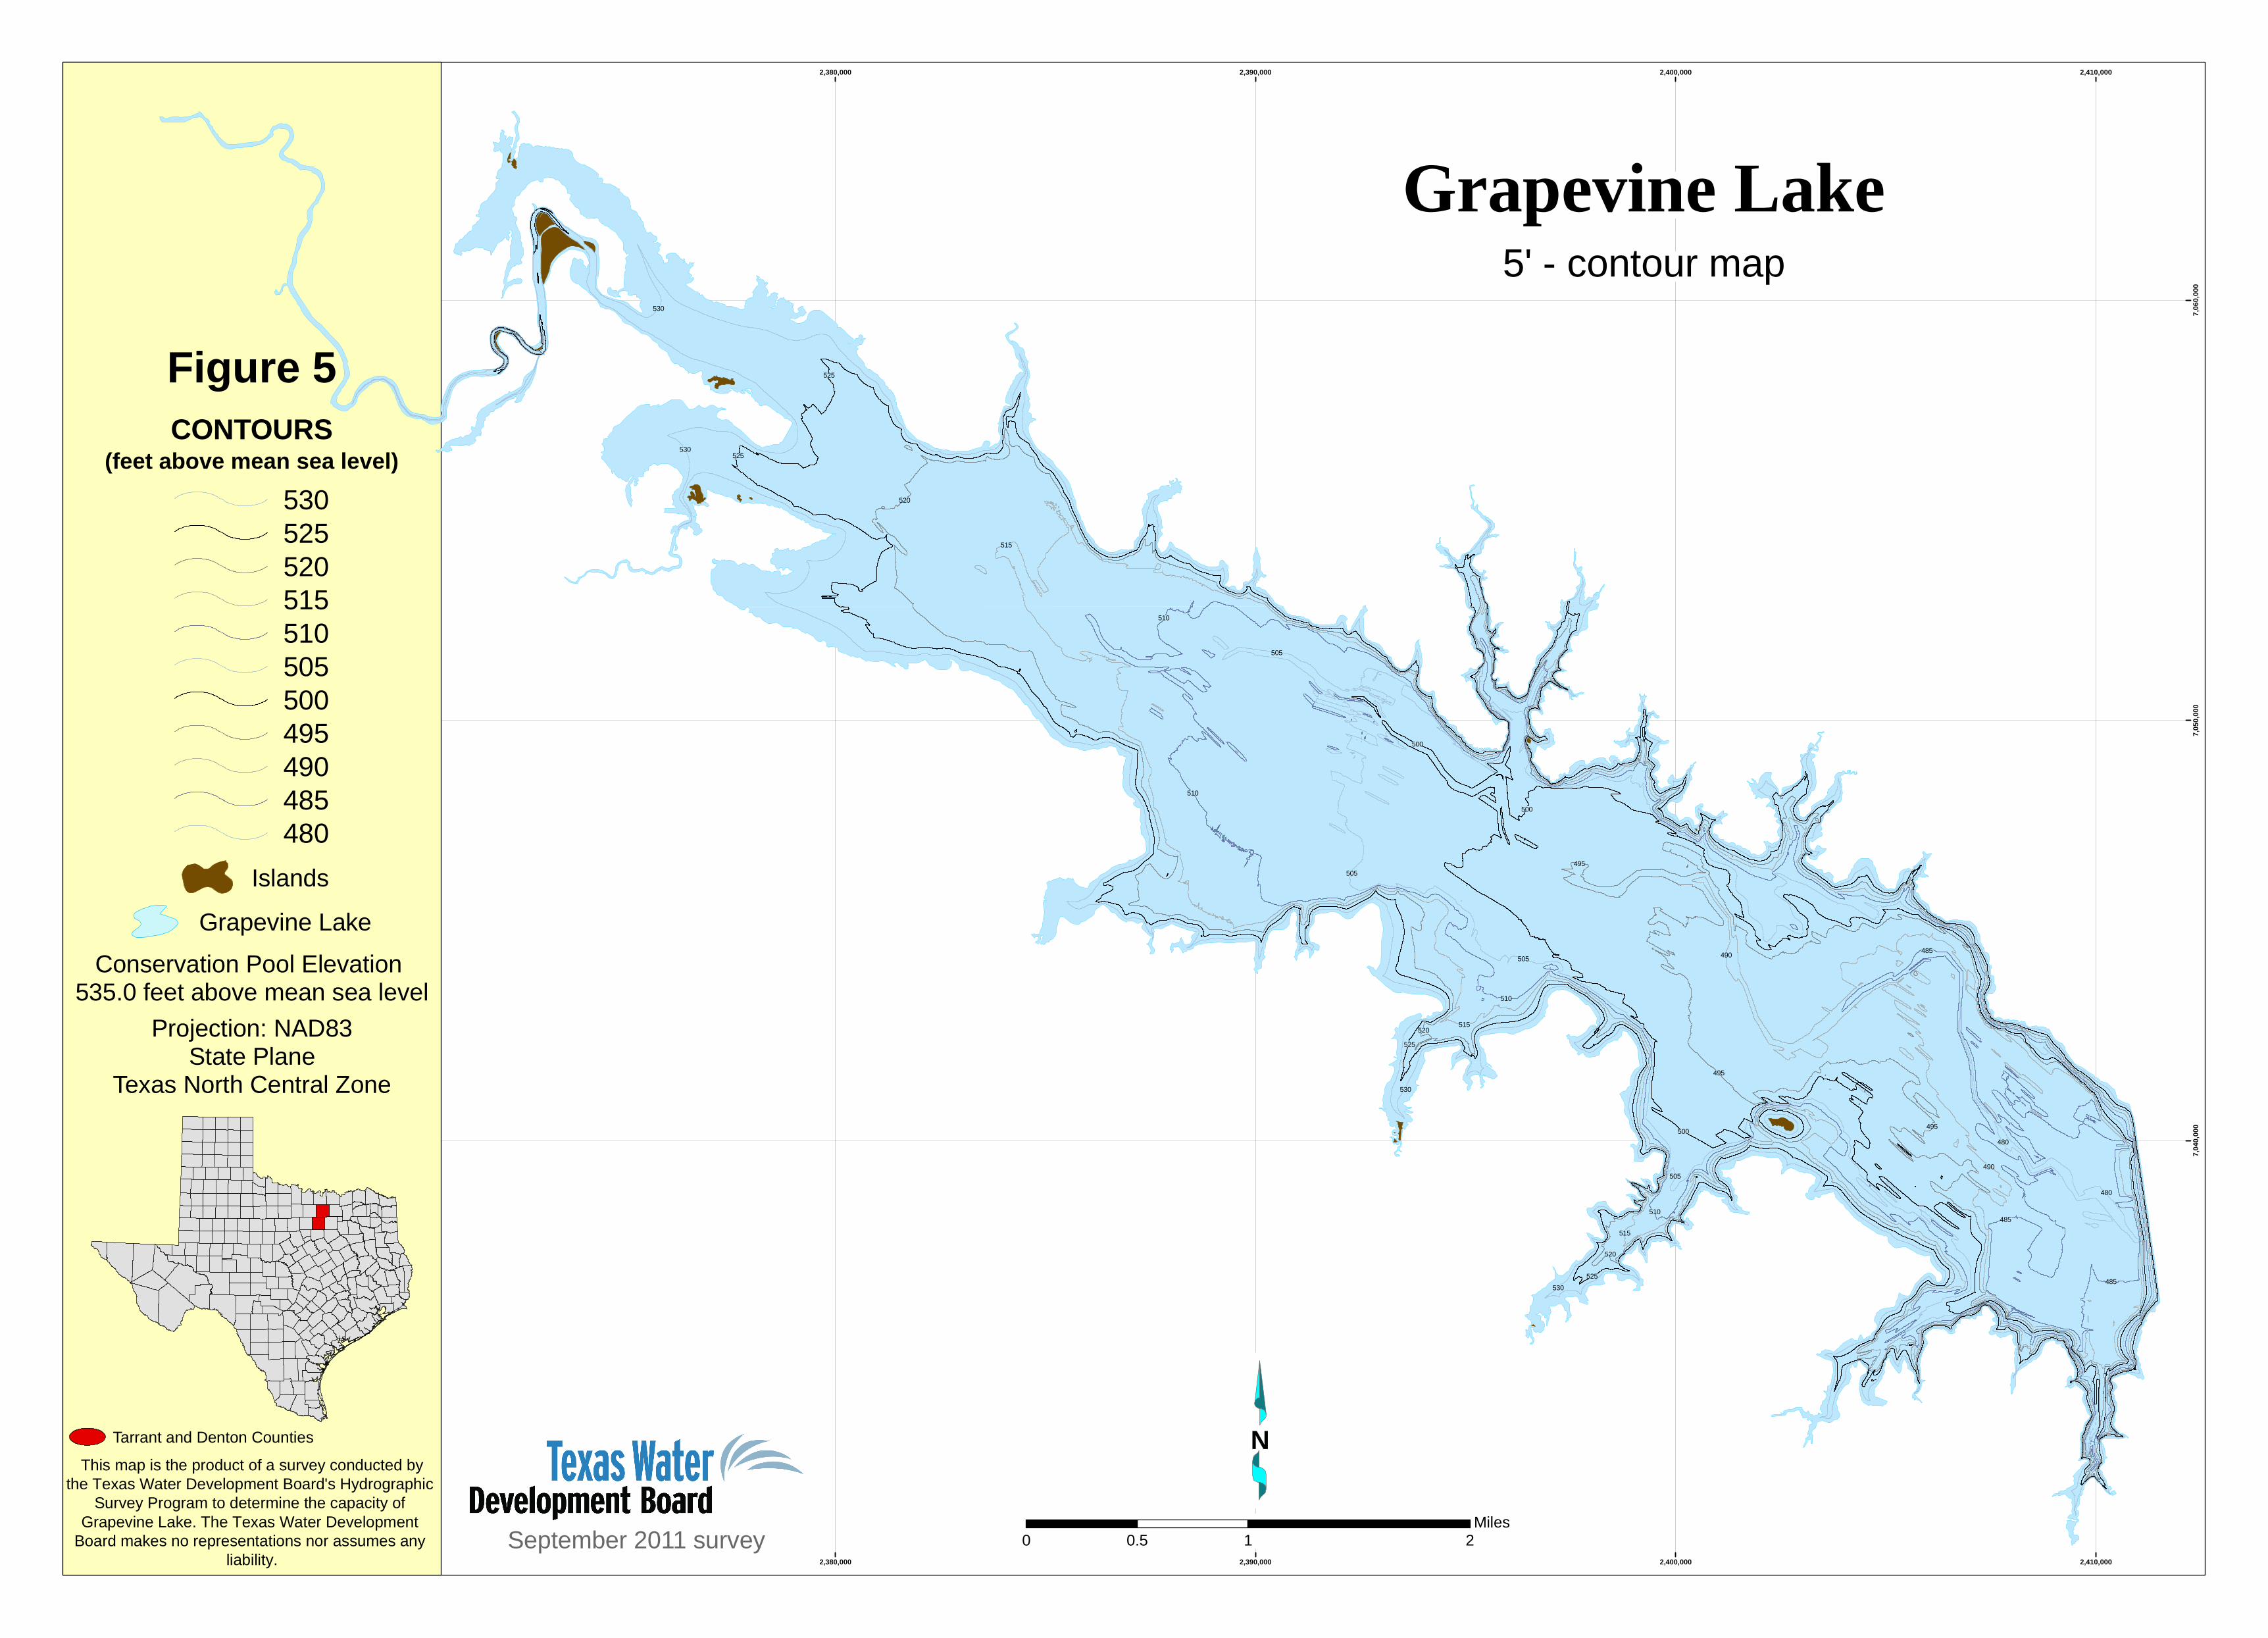
shaded depth ranges for Grapevine Lake; and a 5-foot contour map (Figure 5 - attached).

2,520,000
2,520,000
2,540,000
2,540,000
2,560,000
2,560,000
15,00
0,000
15,00
0,000
15,02
0,000
15,02
0,000
Figure 3Grapevine Lake
Elevation relief map
0 1 20.5Miles
September 2011 Survey
Elevations(feet above mean sea level)
534.1 - 536532.1 - 534530.1 - 532528.1 - 530526.1 - 528524.1 - 526522.1 - 524520.1 - 522518.1 - 520516.1 - 518514.1 - 516512.1 - 514510.1 - 512508.1 - 510506.1 - 508504.1 - 506502.1 - 504500.1 - 502498.1 - 500496.1 - 498494.1 - 496492.1 - 494490.1 - 492488.1 - 490486.1 - 488484.1 - 486482.1 - 484480.1 - 482478.1 - 480476.1 - 478475.9 - 476
N
10' contoursIslands
Conservation Pool Elevation: 535.0 feet above mean sea level
Projection: NAD83State Plane
Texas North Central Zone (feet)

2,520,000
2,520,000
2,540,000
2,540,000
2,560,000
2,560,000
15,00
0,000
15,00
0,000
15,02
0,000
15,02
0,000
Figure 4Grapevine Lake
Depth ranges map
0 1 20.5Miles
September 2011 Survey
Depth ranges(feet)
0 - 5'5 - 10'10 - 15'15 - 20'20 - 25'25 - 30'30 - 35'35 - 40'40 - 45'45 - 50'50 - 55'> 55'
N
IslandsConservation Pool Elevation:
535.0 feet above mean sea levelProjection: NAD83
State PlaneTexas North Central Zone (feet)

9
Spatial interpolation of reservoir bathymetry
Isotropic spatial interpolation techniques such as the Delaunay triangulation used by
the 3D Analyst extension of ArcGIS, are in many instances, unable to suitably interpolate
bathymetries between survey lines common to reservoir surveys. Reservoirs and stream
channels are anisotropic morphological features where bathymetry at any particular location
is more similar to upstream and downstream locations than to transverse locations.
Interpolation schemes that do not consider this anisotropy lead to the creation of several
types of artifacts in the final representation of the reservoir bottom surface and hence to
errors in volume. These include: artificially-curved contour lines extending into the
reservoir where the reservoir walls are steep or the reservoir is relatively narrow;
intermittent representation of submerged stream channel connectivity; and oscillations of
contour lines between survey lines. These artifacts reduce the accuracy of the resulting
volumetric and sediment TIN models in areas between actual survey data.
To improve the accuracy of bathymetric representation between survey lines,
TWDB developed various anisotropic spatial interpolation techniques. Generally, the
directionality of interpolation at different locations of a reservoir can be determined from
external data sources. A basic assumption is that the reservoir profile in the vicinity of a
particular location has upstream and downstream similarity. No known external data
sources were available for Grapevine Lake.
Using the survey data, polygons are created to partition the reservoir into segments
with centerlines defining directionality of interpolation within each segment. These
interpolation definition files are independent of survey data and can be applied to past and
future data of the same reservoir. Using the interpolation definition files and survey data the
current reservoir-bottom elevation, pre-impoundment elevation and sediment thickness are
calculated for each point in the high resolution uniform grid of artificial survey points. The
reservoir boundary, artificial survey points grid and survey data points are used to create
volumetric and sediment TIN models representing the reservoir bathymetry and sediment
accumulation throughout the reservoir. Specific details of this interpolation technique can
be found in the HydroTools manual (McEwen et al, 2011a or b).
In areas inaccessible to survey data collection such as small coves and shallow
upstream areas of the reservoir, linear extrapolation is used for volumetric estimations. The
linear extrapolation follows a linear definition file linking the survey points file to the
reservoir boundary file (McEwen et al, 2011a). Figure 6 illustrates typical results from

10
application of the anisotropic interpolation and line extrapolation techniques to Grapevine
Lake. The bathymetry shown in Figure 6C was used in computing reservoir capacity and
area tables (Appendix A, B).
In Figure 6B, deeper channels indicated by surveyed cross sections are not
continuously represented in areas between survey cross sections. This is an artifact of the
TIN generation routine rather than an accurate representation of the physical bathymetric
surface. Inclusion of interpolation points, represented in Figure 6C, in creation of the
volumetric TIN model directs Delaunay triangulation to better represent the reservoir
bathymetry between survey cross-sections.
Figure 6. Anisotropic spatial interpolation and line extrapolation of Grapevine Lake sounding
data – A) bathymetric contours without interpolated points, B) sounding points (black) and interpolated points (red), C) bathymetric contours with the interpolated points

11
Survey results
Volumetric survey
The results of the 2011 TWDB volumetric survey indicate Grapevine Lake has
a total reservoir capacity of 163,064 acre-feet and encompasses 6,707 acres at
conservation pool elevation (535.0 feet above mean sea level, NGVD29). Previous
capacity estimates include multiple surveys conducted by the U.S. Army Corps of
Engineers in 1946, 1952, 1961, and 1966, and a re-analysis of the 2002 TWDB volumetric
survey data using current processing procedures (Table 2). Differences in past and present
survey methodologies make direct comparison of volumetric surveys difficult and
potentially unreliable.
To properly compare results from TWDB surveys of Grapevine Lake, TWDB
applied the 2012 data processing techniques to the survey data collected in 2002.
Specifically, TWDB applied anisotropic spatial interpolation to the 2002 survey dataset
using the same interpolation definition file as was used for the 2011 survey. A revised TIN
model was created using the original 2002 survey boundary. The 2002 survey model
boundary was created from the 540 feet contour from the USGS 7.5 minute quadrangle
maps, with additional boundary information from DOQQs. The DOQQs were photographed
on January 19, and 31, 1995, and January 11, 1996, while the daily average water surface
elevation of Grapevine Lake measured 534.65, 534.86, and 530.24 feet above mean sea
level, respectively. USGS 7.5 minute quadrangle maps have a stated accuracy of ± 1/2 the
contour interval (USBB, 1947). According to the associated metadata, the 1995-1996
DOQQs have a resolution of 1-meter, with a horizontal positional accuracy that meets the
National Map Accuracy Standards (NMAS) for 1:12,000-scale products. Revision of the
2002 survey using current TWDB data processing methods resulted in a 2,099 acre-feet
(1.3%) increase in reservoir capacity.

12
Table 2. Current and previous survey capacity and surface area data Survey Surface area (acres) Capacity (acre-feet)
USACE 1946a 7,380 188,550
USACE 1952b 7,377 188,543
USACE 1952 revisedb 7,414 187,551
USACE 1961b 7,302 183,639
USACE 1966b 7,276 181,109
TWDB 2002 6,893 164,703
TWDB 2002 revised 6,905 166,802
TWDB 2010 6,707 163,064 a Source: (TWDB, 1973) b Source: (TWDB, 2002)
In principle, comparing reservoir volumes from multiple reservoir surveys allows
for calculation of capacity loss rates. If all lost capacity is due to sediment accumulation,
then comparisons of reservoir volumetric surveys would yield sediment accumulation rates.
In practice, however, the differences in methodologies used in each reservoir survey may
yield greater differences in computed reservoir volumes than the true volume differences.
In addition, because volumetric surveys are not exact, small losses or gains in sediment may
be masked by the imprecision of the computed volumes. For this reason, TWDB prefers to
estimate sediment accumulation rates through sedimentation surveys, which directly
measure the sediment layer thicknesses throughout the reservoir. The sediment
accumulation rates derived from such surveys reflect the average rate of sediment accrual
since the time of impoundment.
For informational purposes only, a capacity loss rate, i.e. sedimentation rate, was
calculated for the difference between the current volumetric survey and the 1946 estimate;
the current volumetric survey and the 1952 revised estimate; the current volumetric survey
and the 1961 estimate; the current volumetric survey and the 1966 estimate; as well as the
current volumetric capacity estimation and the revised 2002 volumetric capacity estimation
(Table 3). The comparison of the current volumetric survey to the 2002 revised volumetric
survey suggests the current rate of sedimentation in Grapevine Lake is approximately 426
acre-feet per year. Comparison of capacity estimates of Grapevine Lake derived using
differing methodologies are provided in Table 3 for sedimentation rate calculation.

13
Table 3. Capacity loss comparisons for Grapevine Lake Survey Volume comparisons @ CPE (acre-feet)
USACE 1946a 188,550 <> <> <> <> USACE 1952
(revised)b <> 187,551 <> <> <>
USACE 1961b <> <> 183,639 <> <> USACE 1966b <> <> <> 181,109 <> TWDB 2002
(revised) <> <> <> <> 166,802
TWDB 2011 163,064 163,064 163,064 163,064 163,064 Volume difference
(acre-feet) 25,486
(13.5%) 24,487 (13.0%)
20,575 (11.2%)
18,045 (10.0%) 3,838 (2.2%)
Number of years 65 59 50 45 9 Capacity loss rate (acre-feet/year) 392 415 412 401 426
a Source: (TWDB, 1973), note: Grapevine Dam was completed on June 6, 1952, and deliberate impoundment began on July 3, 1952. b Source: (USACE, 1971)
Recommendations
To improve estimates of capacity loss rates, TWDB recommends resurveying
Grapevine Lake in approximately 10 years or after a major flood event. To further improve
estimates of capacity loss, TWDB recommends a volumetric and sedimentation survey.
Sedimentation surveys include additional analysis of the multi-frequency data for post-
impoundment sediment by correlation with sediment core samples and a map identifying
the spatial distribution of sediment throughout the reservoir.
TWDB contact information
More information about the Hydrographic Survey Program can be found at:
http://www.twdb.texas.gov/assistance/lakesurveys/volumetricindex.asp
Any questions regarding the TWDB Hydrographic Survey Program may be addressed to:
Jason J. Kemp Team Leader, TWDB Hydrographic Survey Program Phone: (512) 463-2456 Email: [email protected]
Or
Ruben S. Solis, Ph.D., P.E. Director, Surface Water Resources Division Phone: (512) 936-0820 Email: [email protected]

14
References
Environmental Systems Research Institute, 1995, ARC/INFO Surface Modeling and Display, TIN Users Guide, ESRI, 380 New York Street, Redlands, CA 92373.
McEwen, T., Brock, N., Kemp, J., Pothina, D. & Weyant, H., 2011a, HydroTools User’s Manual, Texas Water Development Board.
McEwen, T., Pothina, D. & Negusse, S., 2011b, Improving efficiency and repeatability of lake volume estimates using Python, submitted, Proceedings of the 10th Python for Scientific Computing Conference (SciPy 2011).
TNRIS (Texas Natural Resources Information System), 2009, http://www.tnris.org/, accessed April 2012.
TNRIS (Texas Natural Resources Information System), 2010, https://www.tnris.org/node/39, accessed April 2012.
TWDB (Texas Water Development Board), 2011a, Contract No. R1148011343 with Dallas County Park Cities Municipal Utility District.
TWDB (Texas Water Development Board), 2011b, Contract No. R1148011344 with U.S. Army Corps of Engineers, Fort Worth District.
TWDB (Texas Water Development Board), 1973, Grapevine Dam and Grapevine Lake, Report 126, Engineering Data on Dams and Reservoirs in Texas, Part II.
TWDB (Texas Water Development Board), December 2002, Volumetric Survey of
Grapevine Lake, http://www.twdb.texas.gov/hydro_survey/Grapevine2002/ Grapevine%20%20Report.pdf.
USACE (U.S. Army Corps of Engineers), 1971, Report on Sedimentation, Grapevine Lake, Denton Creek Trinity River Basin, Texas, Resurveys of November 1961 and November 1966.
USBB (United States Bureau of the Budget), 1947, United States National Map Accuracy Standards, http://rockyweb.cr.usgs.gov/nmpstds/acrodocs/nmas/NMAS647.PDF.
USDA (US Department of Agriculture), 2011, National Agricultural Imagery Program (NAIP) Information Sheet, http://www.fsa.usda.gov/Internet/FSA_File/naip_2010_infosheet.pdf.
USGS (United States Geological Survey), 2007, USGS – National Geospatial Data Standards – Digital Line Graph Standards, http://rockyweb.cr.usgs.gov/nmpstds/dlgstds.html
USGS (United States Geological Survey), 2011, U.S. Geological Survey National Water Information System: Web Interface, USGS Real-Time Water Data for USGS 08054500 Grapevine Lk nr Grapevine, TX, http://waterdata.usgs.gov/tx/nwis/uv/?site_no=08054500&PARAmeter_cd=00062,72020,00054, accessed August 2011.

15
Van Metre, P.C., Wilson, J.T., Fuller, C.C., Callender, Edward, and Mahler, B.J., 2004, Collection, analysis, and age-dating of sediment cores from 56 U.S. lakes and reservoirs sampled by the U.S. Geological Survey, 1992-2001: U.S. Geological Survey Scientific Investigations Report 2004-5184, United States Geological Survey, 180p.

ELEVATION in Feet 0.0 0.1 0.2 0.3 0.4 0.5 0.6 0.7 0.8 0.9
475 0 0 0 0 0 0 0 0 0 0476 0 0 0 0 1 1 1 2 2 3477 3 4 5 5 6 7 8 9 10 11478 12 13 14 15 16 18 19 20 22 23479 25 26 28 29 31 33 35 37 39 41480 43 46 48 51 54 56 59 62 65 68481 71 75 78 81 85 89 93 98 102 108482 113 119 126 133 141 149 158 168 178 189483 201 214 227 241 256 272 289 307 326 346484 367 388 410 433 457 481 507 533 561 590485 620 651 683 716 750 785 821 858 895 934486 974 1,014 1,056 1,099 1,143 1,188 1,233 1,280 1,327 1,375487 1,423 1,473 1,522 1,573 1,624 1,675 1,727 1,780 1,834 1,888488 1,943 1,999 2,055 2,112 2,169 2,228 2,287 2,347 2,407 2,468489 2,530 2,593 2,656 2,719 2,783 2,848 2,914 2,980 3,047 3,114490 3,183 3,252 3,322 3,392 3,463 3,535 3,607 3,680 3,753 3,827491 3,902 3,978 4,054 4,131 4,209 4,287 4,367 4,447 4,528 4,610492 4,693 4,776 4,861 4,946 5,032 5,120 5,208 5,298 5,389 5,481493 5,574 5,668 5,764 5,861 5,959 6,058 6,158 6,260 6,363 6,466494 6,571 6,677 6,785 6,893 7,003 7,115 7,228 7,342 7,458 7,576495 7,695 7,816 7,939 8,063 8,189 8,316 8,445 8,577 8,709 8,844496 8,980 9,118 9,258 9,398 9,541 9,684 9,830 9,976 10,124 10,273497 10,423 10,575 10,728 10,882 11,037 11,193 11,351 11,510 11,670 11,832498 11,995 12,159 12,325 12,493 12,662 12,833 13,004 13,178 13,353 13,529499 13,708 13,888 14,070 14,254 14,439 14,627 14,816 15,006 15,198 15,392500 15,587 15,783 15,981 16,180 16,380 16,581 16,784 16,988 17,193 17,400501 17,608 17,816 18,026 18,237 18,449 18,662 18,876 19,091 19,306 19,523502 19,741 19,960 20,180 20,401 20,623 20,847 21,072 21,297 21,524 21,751503 21,980 22,210 22,442 22,675 22,909 23,144 23,380 23,617 23,855 24,094504 24,334 24,575 24,817 25,060 25,304 25,549 25,795 26,043 26,292 26,542505 26,794 27,048 27,303 27,558 27,816 28,074 28,334 28,594 28,856 29,119506 29,384 29,650 29,917 30,186 30,456 30,728 31,002 31,278 31,555 31,834507 32,115 32,398 32,682 32,968 33,255 33,545 33,836 34,128 34,422 34,718508 35,016 35,316 35,617 35,920 36,224 36,529 36,836 37,145 37,455 37,768509 38,081 38,396 38,713 39,031 39,351 39,673 39,996 40,320 40,646 40,974510 41,305 41,637 41,971 42,307 42,644 42,984 43,325 43,668 44,012 44,357511 44,703 45,051 45,400 45,751 46,103 46,456 46,810 47,166 47,523 47,881512 48,241 48,602 48,964 49,327 49,692 50,057 50,424 50,792 51,161 51,531513 51,902 52,274 52,647 53,021 53,396 53,772 54,149 54,527 54,906 55,286514 55,667 56,048 56,431 56,815 57,199 57,585 57,972 58,360 58,749 59,139515 59,529 59,921 60,314 60,708 61,104 61,502 61,901 62,302 62,703 63,106516 63,509 63,915 64,321 64,729 65,138 65,548 65,960 66,374 66,789 67,206517 67,625 68,045 68,467 68,891 69,315 69,741 70,168 70,597 71,026 71,457518 71,889 72,322 72,757 73,192 73,629 74,068 74,507 74,948 75,390 75,834519 76,280 76,726 77,174 77,623 78,074 78,527 78,980 79,435 79,890 80,347520 80,804 81,263 81,722 82,184 82,646 83,109 83,573 84,039 84,505 84,972521 85,440 85,908 86,378 86,849 87,321 87,795 88,269 88,745 89,221 89,699522 90,178 90,659 91,141 91,624 92,108 92,593 93,079 93,567 94,056 94,547523 95,038 95,530 96,024 96,519 97,016 97,513 98,011 98,511 99,012 99,514524 100,017 100,521 101,026 101,533 102,041 102,550 103,060 103,571 104,083 104,597525 105,111 105,627 106,144 106,662 107,181 107,702 108,223 108,746 109,271 109,797526 110,325 110,854 111,385 111,918 112,453 112,989 113,527 114,066 114,606 115,148527 115,690 116,234 116,779 117,326 117,873 118,422 118,972 119,523 120,074 120,627528 121,181 121,736 122,292 122,849 123,407 123,965 124,525 125,086 125,648 126,211
CAPACITY IN ACRE-FEET Conservation Pool Elevation 535.0 feet NGVD29ELEVATION INCREMENT IS ONE TENTH FOOT
Appendix AGrapevine Lake
RESERVOIR CAPACITY TABLETEXAS WATER DEVELOPMENT BOARD September 2011 Survey

ELEVATION in Feet 0.0 0.1 0.2 0.3 0.4 0.5 0.6 0.7 0.8 0.9
529 126,775 127,340 127,906 128,473 129,042 129,611 130,181 130,753 131,325 131,899530 132,474 133,050 133,627 134,205 134,785 135,366 135,947 136,531 137,115 137,701531 138,288 138,876 139,466 140,057 140,649 141,243 141,838 142,435 143,032 143,632532 144,232 144,834 145,438 146,044 146,651 147,259 147,869 148,480 149,093 149,708533 150,325 150,943 151,563 152,185 152,809 153,434 154,061 154,690 155,321 155,954534 156,589 157,226 157,866 158,507 159,151 159,796 160,445 161,096 161,749 162,405535 163,064
Appendix A (Continued)Grapevine Lake
RESERVOIR CAPACITY TABLETEXAS WATER DEVELOPMENT BOARD September 2011 Survey
Conservation Pool Elevation 535.0 feet NGVD29CAPACITY IN ACRE-FEETELEVATION INCREMENT IS ONE TENTH FOOT

ELEVATION in Feet 0.0 0.1 0.2 0.3 0.4 0.5 0.6 0.7 0.8 0.9
475 0 0 0 0 0 0 0 0 0 0476 1 1 1 2 3 3 4 5 5 6477 6 6 7 7 8 9 9 10 10 10478 11 11 11 12 12 13 13 13 14 15479 15 16 16 17 18 18 19 20 21 23480 24 25 26 26 27 28 29 30 30 31481 32 33 34 35 37 41 43 47 50 53482 58 63 69 75 80 86 93 101 108 115483 122 129 138 147 155 163 175 185 193 203484 211 218 225 233 241 251 261 272 282 294485 304 315 325 336 346 354 363 372 382 392486 402 412 423 434 444 453 462 468 475 482487 488 495 501 506 512 518 525 532 540 546488 553 559 566 573 580 587 595 602 609 614489 620 627 633 640 646 652 658 664 671 680490 687 694 701 707 713 719 725 732 739 746491 752 759 766 773 781 790 798 807 815 823492 831 840 849 858 868 879 890 902 915 926493 938 951 963 976 986 996 1,009 1,021 1,032 1,044494 1,055 1,066 1,080 1,094 1,107 1,121 1,136 1,152 1,169 1,185495 1,202 1,218 1,234 1,249 1,266 1,284 1,302 1,320 1,338 1,353496 1,370 1,387 1,403 1,416 1,430 1,445 1,458 1,471 1,484 1,497497 1,510 1,523 1,535 1,546 1,556 1,568 1,583 1,598 1,611 1,624498 1,636 1,652 1,669 1,684 1,697 1,710 1,726 1,742 1,758 1,774499 1,792 1,810 1,828 1,846 1,865 1,882 1,898 1,913 1,928 1,943500 1,956 1,970 1,984 1,996 2,007 2,020 2,034 2,048 2,060 2,072501 2,083 2,093 2,103 2,114 2,124 2,133 2,143 2,154 2,164 2,174502 2,184 2,194 2,206 2,217 2,229 2,241 2,251 2,260 2,271 2,283503 2,295 2,308 2,321 2,334 2,346 2,357 2,367 2,376 2,385 2,394504 2,404 2,414 2,424 2,435 2,445 2,456 2,471 2,483 2,498 2,512505 2,526 2,540 2,555 2,566 2,577 2,590 2,601 2,613 2,625 2,639506 2,653 2,666 2,680 2,695 2,711 2,729 2,747 2,765 2,783 2,799507 2,818 2,835 2,851 2,868 2,884 2,901 2,917 2,934 2,952 2,970508 2,988 3,004 3,019 3,033 3,047 3,062 3,079 3,096 3,112 3,128509 3,144 3,160 3,175 3,190 3,207 3,222 3,238 3,254 3,271 3,291510 3,311 3,331 3,350 3,369 3,388 3,405 3,419 3,432 3,445 3,457511 3,471 3,486 3,499 3,513 3,525 3,537 3,551 3,565 3,577 3,588512 3,601 3,616 3,629 3,640 3,650 3,661 3,674 3,685 3,695 3,706513 3,716 3,725 3,736 3,745 3,755 3,764 3,774 3,784 3,794 3,803514 3,812 3,822 3,831 3,842 3,853 3,865 3,874 3,883 3,892 3,901515 3,912 3,924 3,937 3,951 3,970 3,984 3,998 4,009 4,019 4,032516 4,046 4,059 4,071 4,082 4,098 4,112 4,126 4,148 4,163 4,178517 4,196 4,212 4,227 4,239 4,252 4,264 4,277 4,290 4,302 4,314518 4,326 4,339 4,351 4,364 4,376 4,390 4,403 4,416 4,430 4,445519 4,459 4,472 4,487 4,502 4,516 4,528 4,540 4,552 4,561 4,570520 4,580 4,589 4,604 4,619 4,629 4,638 4,647 4,656 4,665 4,674521 4,682 4,691 4,703 4,718 4,729 4,739 4,750 4,761 4,773 4,784522 4,799 4,812 4,824 4,836 4,847 4,859 4,871 4,883 4,896 4,908523 4,919 4,932 4,945 4,957 4,968 4,979 4,990 5,002 5,014 5,024524 5,036 5,047 5,059 5,072 5,085 5,096 5,107 5,118 5,129 5,140525 5,152 5,162 5,173 5,186 5,198 5,209 5,223 5,238 5,254 5,271526 5,285 5,301 5,322 5,339 5,356 5,371 5,383 5,395 5,407 5,419527 5,431 5,446 5,459 5,470 5,481 5,492 5,503 5,513 5,523 5,534528 5,544 5,554 5,564 5,574 5,584 5,594 5,604 5,614 5,624 5,634
Appendix BGrapevine Lake
RESERVOIR AREA TABLESeptember 2011 Survey
ELEVATION INCREMENT IS ONE TENTH FOOTConservation Pool Elevation 535.0 feet NGVD29
TEXAS WATER DEVELOPMENT BOARDAREA IN ACRES

ELEVATION in Feet 0.0 0.1 0.2 0.3 0.4 0.5 0.6 0.7 0.8 0.9
529 5,645 5,655 5,666 5,676 5,687 5,698 5,709 5,720 5,731 5,743530 5,754 5,766 5,778 5,790 5,802 5,814 5,826 5,839 5,851 5,864531 5,877 5,890 5,903 5,916 5,930 5,944 5,958 5,972 5,986 6,000532 6,015 6,030 6,045 6,060 6,076 6,091 6,107 6,124 6,140 6,157533 6,174 6,191 6,209 6,227 6,245 6,263 6,282 6,300 6,320 6,340534 6,360 6,381 6,403 6,425 6,447 6,471 6,495 6,521 6,547 6,575535 6,707
Appendix B (Continued)Grapevine Lake
RESERVOIR AREA TABLE
ELEVATION INCREMENT IS ONE TENTH FOOT
TEXAS WATER DEVELOPMENT BOARD September 2011 SurveyAREA IN ACRES Conservation Pool Elevation 535.0 feet NGVD29

470.0
480.0
490.0
500.0
510.0
520.0
530.0
540.001,0002,0003,0004,0005,0006,0007,000
470.0
480.0
490.0
500.0
510.0
520.0
530.0
540.0
0 25,000 50,000 75,000 100,000 125,000 150,000
Elev
atio
n (fe
et a
bove
msl
)
Area (acres)
Elev
atio
n (fe
et a
bove
msl
)
Storage Capacity (acre-feet)
Total Capacity 2011 Conservation Pool Elevation 535.0 feet Total Area 2011
Grapevine Lake September 2011 Survey
Prepared by: TWDB
Appendix C: Area and Capacity Curves
Conservation Pool Elevation 535.0 feet NGVD29
2,370,000
2,370,000
2,380,000
2,380,000
2,390,000
2,390,000
2,400,000
2,400,000
2,410,000
2,410,000
7,040
,000
7,040
,000
7,050
,000
7,050
,000
7,060
,000
7,060
,000
485
485
490
490
495
495
500
500
505
505
510
510
515
520
525
525
530
530
530
525520 515
510
505
530525
520
515
510
505
500
495
485
480
480
Figure 5
Grapevine Lake5' - contour map
This map is the product of a survey conducted bythe Texas Water Development Board's Hydrographic
Survey Program to determine the capacity of Grapevine Lake. The Texas Water Development
Board makes no representations nor assumes any liability.
Conservation Pool Elevation 535.0 feet above mean sea level
Projection: NAD83State Plane
Texas North Central Zone
(feet above mean sea level)CONTOURS
Tarrant and Denton Counties
IslandsGrapevine Lake
September 2011 survey 0 1 20.5Miles
N
530525520515510505500495490485480