volume - 02 issue no. - 04 october december 2016 shodh … · 2017-10-05 · 1 shodh-chetana issn:...
TRANSCRIPT
Published By
Chetana’s Hazarimal Somani College of Commerce and Economics,
Smt. Kusumtai Chaudhari College of Arts.
S.No. 341, Chetana Mahavidyalay Marg, Near Govt. Colony,
Bandra (E), Mumbai – 51
SHODH-CHETANA CHETANA
Volume - 02 Issue No. - 04 October – December 2016
ISSN: 2454 - 1877
ISSN : 2454-1877
SHODH-CHETANA October– December, 2016. Issue 04
CHIEF EDITOR
Dr. Maheshchandra Joshi
EXECUTIVE EDITOR
Dr. Prashant Bhagat
VOLUME 02
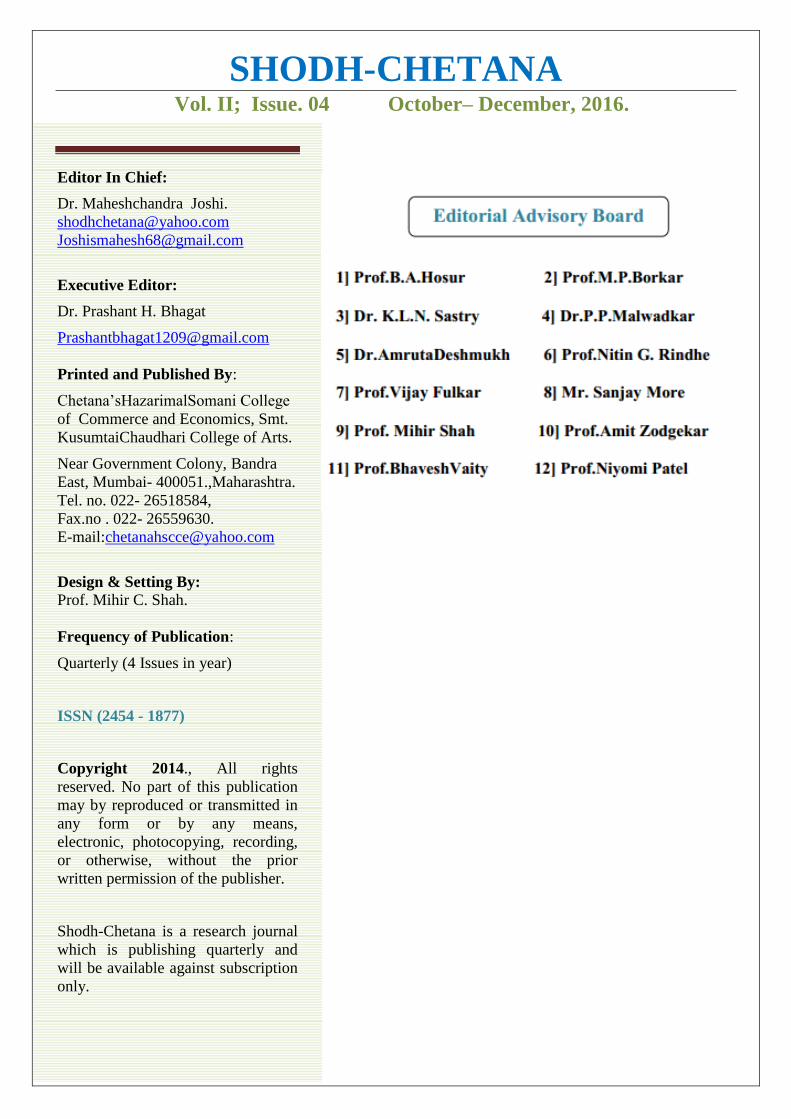
SHODH-CHETANA Vol. II; Issue. 04 October– December, 2016.
Editor In Chief:
Dr. Maheshchandra Joshi.
Executive Editor:
Dr. Prashant H. Bhagat
Printed and Published By:
Chetana’sHazarimalSomani College
of Commerce and Economics, Smt.
KusumtaiChaudhari College of Arts.
Near Government Colony, Bandra
East, Mumbai- 400051.,Maharashtra.
Tel. no. 022- 26518584,
Fax.no . 022- 26559630.
E-mail:[email protected]
Design & Setting By:
Prof. Mihir C. Shah.
Frequency of Publication:
Quarterly (4 Issues in year)
ISSN (2454 - 1877)
Copyright 2014., All rights
reserved. No part of this publication
may by reproduced or transmitted in
any form or by any means,
electronic, photocopying, recording,
or otherwise, without the prior
written permission of the publisher.
Shodh-Chetana is a research journal
which is publishing quarterly and
will be available against subscription
only.
.

SHODH-CHETANA
VOLUME: 2 NUMBER: 4 October– December, 2016
CONTENTS
Sr.
No.
Research Title Author Page No.
01 India-China Economic Relations: Trands, Challenges And
Policy
Prof. Kamalesh Atmaram
Raut
001 – 008
02 “Recent trends of India’s E-Commerce Habits” Prof. Mihir Shah 009 – 016
03 Vocational Education In India Prof. Amit Sunil Zodgekar 017 – 021
04 “A Descriptive Study On Pradhan Manthri Mudra Yojana
(PMMY)”
Prof. Kaustubha K.
Sawant
022 - 027

1
Shodh-Chetana ISSN: 2454 – 1877 October –December , 2016 1
Abstract
Specialization is the order of the day, be it
Abstract
The study of India-China economic
relations and an assessment of the
countries’ future ties come with the
additional task of engaging with a
historicity marked both by centuries of
peaceful coexistence and interchange of
ideas, and war (1962). It is customary in
the post-2008 financial crisis period to
stress on the impressive economic
achievements of both India and China in
withstanding the downturn that began in
the United States. China is currently the
world’s largest exporter and manufacturer
with 73 of the Global Fortune 500
companies and six of the world’s top 10
container ports; it has witnessed a 9.9 per
cent annual gross domestic product (GDP)
growth since 2001.India, albeit slower,
grew at a healthy average of 7.8 per cent
over the last decade. Modern India and
China face by similar conditions, namely,
low incomes, large rural populations,
decades of self-imposed economic
isolation and a high degree of central
control. China is India’s largest trading
partner with total trade grossing US$75
billion for 2011–12. China was the fourth
largest recipient of Indian goods in 2011
accounting for 5.5 per cent of India’s
exports in 2011. Further, both China and
India are seen as success stories in terms
of changing employment patterns which
are seen as heralding a major shift in the
international division of labor. Thus China
is typically described as becoming the
“workshop” or “factory” of the world
through the expansion of manufacturing
production, and India as becoming the
“office” of the world, in particular because
of its ability to take advantage of IT-
enabled service sector off-shoring.
The research exercise focused on the
bilateral trade between India and China,
Investment, Recent employment trends,
GDP of Chindia and various challenges
face by both countries.
(Key Words- Bilateral Trade, Investment,
Employment and GDP)
INTRODUCTION
Introduction
The study of India-China economic
relations and an assessment of the
countries’ future ties come with the
additional task of engaging with a
historicity marked both by centuries of
peaceful coexistence and interchange of
ideas, and war (1962). It is customary in
the post-2008 financial crisis period to
stress on the impressive economic
achievements of both India and China in
withstanding the downturn that began in
the United States. China is currently the
world’s largest exporter and manufacturer
with 73 of the Global Fortune 500
“INDIA-CHINA ECONOMIC RELATIONS: TRANDS, CHALLENGES AND
POLICY”
PROF. KAMALESH ATMARAM RAUT
Assistant professor,
Chetana’s College, E-MAIL: [email protected]
CONTACT NO: 9892367812/9619737938
2
Shodh-Chetana ISSN: 2454 – 1877 October –December , 2016 2
companies and six of the world’s top 10
container ports; it has witnessed a 9.9 per
cent annual gross domestic product (GDP)
growth since 2001.India, albeit slower,
grew at a healthy average of 7.8 per cent
over the last decade. The prospects of
future growth are promising and Chindia is
projected to have a 10.5 per cent share of
Global Domestic Product by the year 2020
(JP Morgan Chase 2007). China is forecast
to grow at an average pace of 6.6 per cent
until 2030, thereafter slowing to 2.3 per
cent till 2060, even as India is expected to
grow at 6.7 per cent and 4 per cent,
respectively for the two phases (Chua
2012). The combined GDP of Chindia
(China’s 27.8 per cent and India’s18.2 per
cent; Mead 2012) is projected to be larger
than that of the entire OECD area (based
on today's membership) in 2060 (Chua
2012). Modern India and China face by
similar conditions, namely, low incomes,
large rural populations, decades of self-
imposed economic isolation and a high
degree of central control. What
differentiated the two was that China’s
agrarian reforms (through rising
productivity) freed up labor as a vital low-
cost input for the industrial sector; India
was unable to achieve this synergy
between agriculture and industry (half of
India’s workers and one-sixth of its output
are still dependent on agriculture). Thus,
while China was able to execute the classic
pattern of moving from the primary to the
manufacturing sector, India has seen
growth mainly from its transition from
agriculture to services The development
pathways for the two economies depended
on infrastructure investment, exports and
FDI in the case of China, while India’s
standout growth was spurred by strong
domestic demand and growth in services
trade. Services such as information
technology rely on advanced technologies
and satellite transmission than on the
availability of utilities and good roads;
therefore, India was able to execute the
transition from agriculture to the service
sector despite inadequate basic
infrastructure.
China is India’s largest trading
partner with total trade grossing US$75
billion for 2011–12. China was the fourth
largest recipient of Indian goods in 2011
accounting for 5.5 per cent of India’s
exports in 2011. Further, both China and
India are seen as success stories in terms
of changing employment patterns which
are seen as heralding a major shift in the
international division of labor. Thus China
is typically described as becoming the
“workshop” or “factory” of the world
through the expansion of manufacturing
production, and India as becoming the
“office” of the world, in particular because
of its ability to take advantage of IT-
enabled service sector off-shoring.
The research exercise focused on the
bilateral trade between India and China,
Investment, Recent employment trends,
GDP of Chindia and various challenges
face by both countries.
Bilateral Trade
China is India’s largest trading
partner with total trade grossing US$75
billion for 2011–12. China was the fourth
largest recipient of Indian goods in 2011
accounting for 5.5 per cent of India’s
exports in 2011; it remained the largest
Source of imports for India accounting for
12 per cent of the import value in 2011.
In the year 2013-2014, India’s total
export of agricultural commodities to
China was of the order of US $ 2803.2
3
Shodh-Chetana ISSN: 2454 – 1877 October –December , 2016 3
million. India’s principal agricultural
exports during this period were frozen fish
including hilsa, mucilage and thickeners,
castor oil and cotton. During the same
period, the agricultural import from China
was of the order of US $ 304.31 million.
India’s main items of import were kidney
beans, fresh apples, preserved tomatoes
and preparations for animal feed. The
other potential items of trade between
India and China are marine products, oil
seeds, salt, inorganic chemicals, plastic,
rubber, optical and medical equipment,
and dairy products. Great potential also
exists in areas like biotechnology, IT and
ITES, health, education, tourism, and
financial sector. Chinese exports to India
are fairly diversified and includes
resource-based products, manufactured
items, and low and medium technology
products.
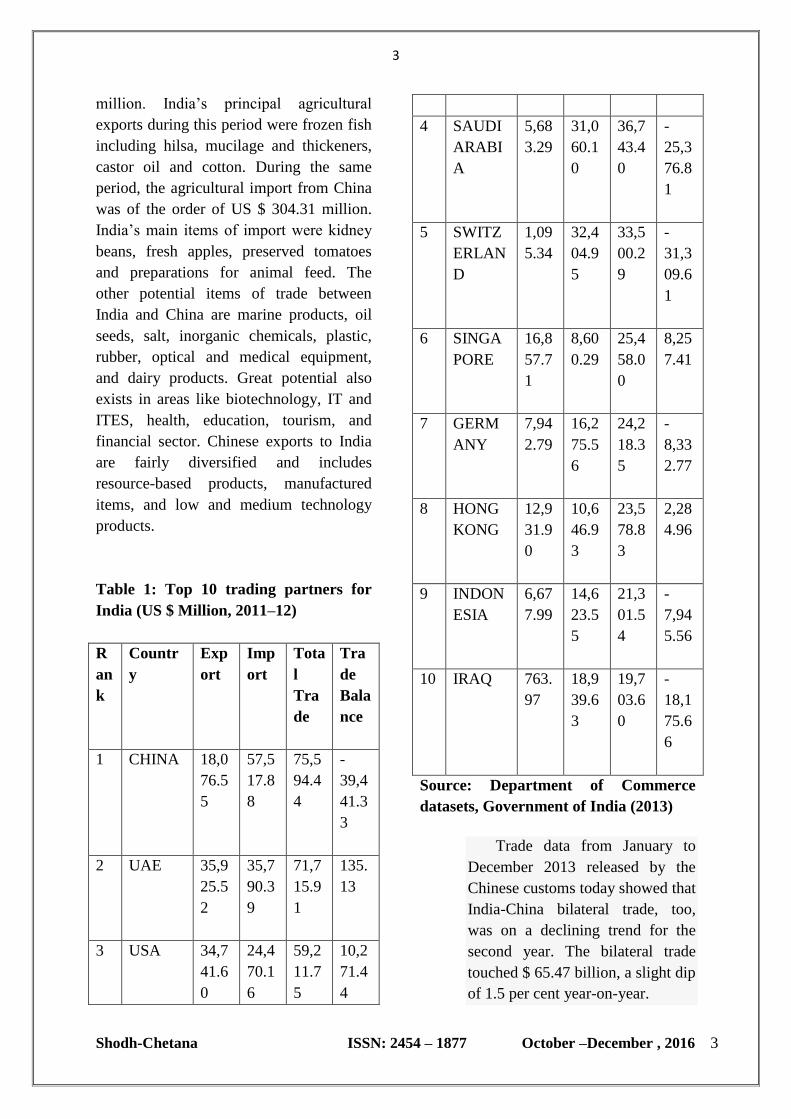
Table 1: Top 10 trading partners for
India (US $ Million, 2011–12)
R
an
k
Countr
y
Exp
ort
Imp
ort
Tota
l
Tra
de
Tra
de
Bala
nce
1 CHINA 18,0
76.5
5
57,5
17.8
8
75,5
94.4
4
-
39,4
41.3
3
2 UAE 35,9
25.5
2
35,7
90.3
9
71,7
15.9
1
135.
13
3 USA 34,7
41.6
0
24,4
70.1
6
59,2
11.7
5
10,2
71.4
4
4 SAUDI
ARABI
A
5,68
3.29
31,0
60.1
0
36,7
43.4
0
-
25,3
76.8
1
5 SWITZ
ERLAN
D
1,09
5.34
32,4
04.9
5
33,5
00.2
9
-
31,3
09.6
1
6 SINGA
PORE
16,8
57.7
1
8,60
0.29
25,4
58.0
0
8,25
7.41
7 GERM
ANY
7,94
2.79
16,2
75.5
6
24,2
18.3
5
-
8,33
2.77
8 HONG
KONG
12,9
31.9
0
10,6
46.9
3
23,5
78.8
3
2,28
4.96
9 INDON
ESIA
6,67
7.99
14,6
23.5
5
21,3
01.5
4
-
7,94
5.56
10 IRAQ 763.
97
18,9
39.6
3
19,7
03.6
0
-
18,1
75.6
6
Source: Department of Commerce
datasets, Government of India (2013)
Trade data from January to
December 2013 released by the
Chinese customs today showed that
India-China bilateral trade, too,
was on a declining trend for the
second year. The bilateral trade
touched $ 65.47 billion, a slight dip
of 1.5 per cent year-on-year.
4
Shodh-Chetana ISSN: 2454 – 1877 October –December , 2016 4
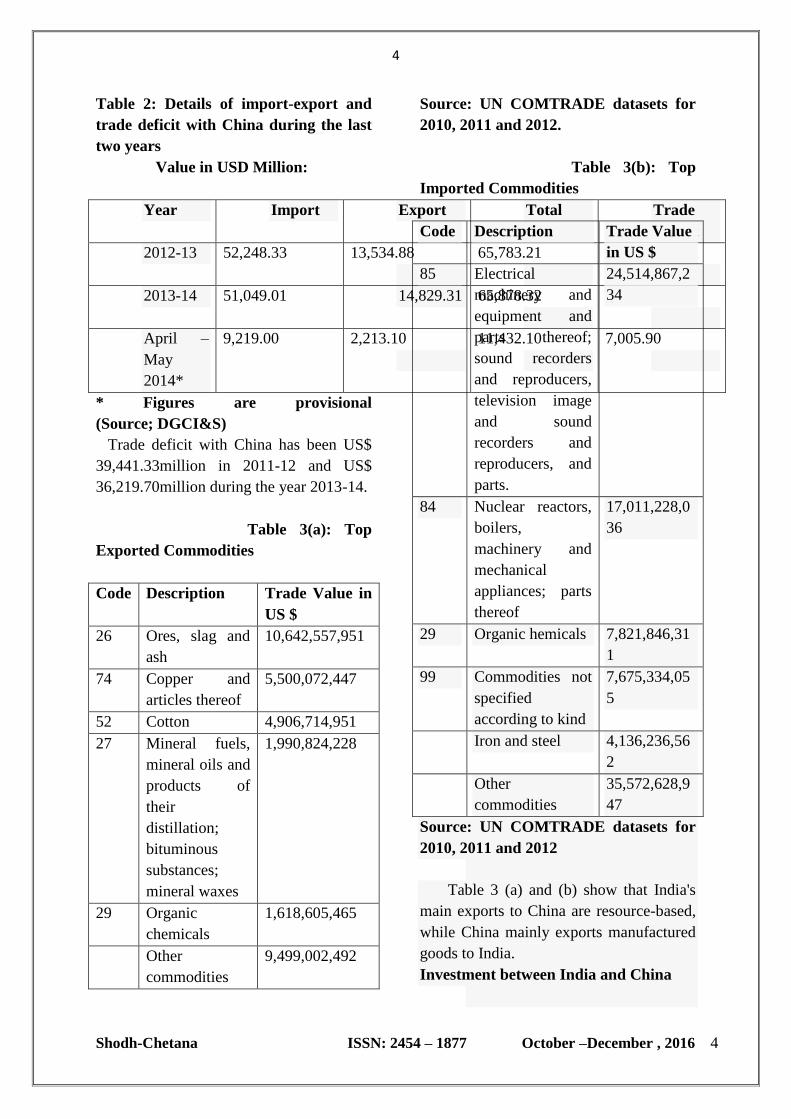
Table 2: Details of import-export and
trade deficit with China during the last
two years
Value in USD Million:
Year Import Export Total
trade
Trade
Deficit
2012-13 52,248.33
13,534.88
65,783.21
38,713.45
2013-14 51,049.01 14,829.31 65,878.32
36,219.70
April –
May
2014*
9,219.00
2,213.10
11,432.10
7,005.90
* Figures are provisional
(Source; DGCI&S)
Trade deficit with China has been US$
39,441.33million in 2011-12 and US$
36,219.70million during the year 2013-14.
Table 3(a): Top
Exported Commodities
Code Description Trade Value in
US $
26 Ores, slag and
ash
10,642,557,951
74 Copper and
articles thereof
5,500,072,447
52 Cotton 4,906,714,951
27 Mineral fuels,
mineral oils and
products of
their
distillation;
bituminous
substances;
mineral waxes
1,990,824,228
29 Organic
chemicals
1,618,605,465
Other
commodities
9,499,002,492
Source: UN COMTRADE datasets for
2010, 2011 and 2012.
Table 3(b): Top
Imported Commodities
Code Description Trade Value
in US $
85 Electrical
machinery and
equipment and
parts thereof;
sound recorders
and reproducers,
television image
and sound
recorders and
reproducers, and
parts.
24,514,867,2
34
84 Nuclear reactors,
boilers,
machinery and
mechanical
appliances; parts
thereof
17,011,228,0
36
29 Organic hemicals 7,821,846,31
1
99 Commodities not
specified
according to kind
7,675,334,05
5
7
2
Iron and steel 4,136,236,56
2
Other
commodities
35,572,628,9
47
Source: UN COMTRADE datasets for
2010, 2011 and 2012
Table 3 (a) and (b) show that India's
main exports to China are resource-based,
while China mainly exports manufactured
goods to India.
Investment between India and China

5
Shodh-Chetana ISSN: 2454 – 1877 October –December , 2016 5
China invest in India so may sector,
besides FDI equity inflows, Chinese
companies (majors such as Huawei, TCL
and Haier) have invested capital in India,
and are also taking up projects under
contracts where they are important
suppliers for infrastructure projects such as
for power generation, for instance, by
supplying machinery and setting up
plants), while some have even set up R&D
centers here. Indian investments in China
are predominantly by the private sector
(mostly located in Guangzhou, Shanghai
and Beijing with a major presence in high-
tech industries, especially in IT/software,
and pharmaceuticals). IT majors such as
Infosys Technologies, HCL Technologies,
Zansar Technologies, BirlaSoft, KPIT
Cummins, TCS, Tech Mahindra, Mahindra
Satyam, NIIT, Infotech, Nucleus Software,
Wipro, Mind Tree Consulting and Genpact
all have presence in China. There are over
100 Indian companies in China even as the
Indian Embassy (Beijing) website suggests
“close to 100 Chinese companies” as
having established operations in India
(2012).
Table 4: Share of top sectors in India
attracting FDI equity inflows from
China
(April 2000 to November 2010):
Ran
k
Sector Amount of
FDI equity
inflows
% of
FDI
equit
y
inflo
ws
from
Chin
a
In
Rs.Cro
re
In
US$
milli
on
1 Metallurg
ical
industries
197.66 40.76 76.83
2 Chemical
s (other
than
fertilizers)
17.86 3.75 7.06
3 Trading 8.06 1.80 3.40
4 Industrial
machiner
y
8.06 1.73 3.26
5 Computer
software
and
Hardware
2.36 0.59 1.12
Total 234.01 48.63 91.67
Source: Based on statistics supplied by
Department of Industrial Policy and
Promotion
(DIPP), Government of India.
Table 4 shows that share of FDI from
China in major sector in India from period
April 2000 to November 2010. The key
problem areas for India and China in
expanding the sphere of economic
interaction can be nailed to the twin
dimensions of limited market access for
India in China (proxy for protectionism),
and barriers to investment in India
(attributed to security concerns and
allegations of “dumping” against China).
The former is evident in a knowledge
intensive industry such as pharmaceuticals
where, despite being ranked fourth in
terms of volume and 14th in terms of value
in the global pharmaceutical market,
Indian companies run into market access
problems in the form of lengthy and
cumbersome regulatory processes in
China, where it takes over 3 years for an
Indian drug company to gain approval for
a drug, while a similar clearance takes
6
Shodh-Chetana ISSN: 2454 – 1877 October –December , 2016 6
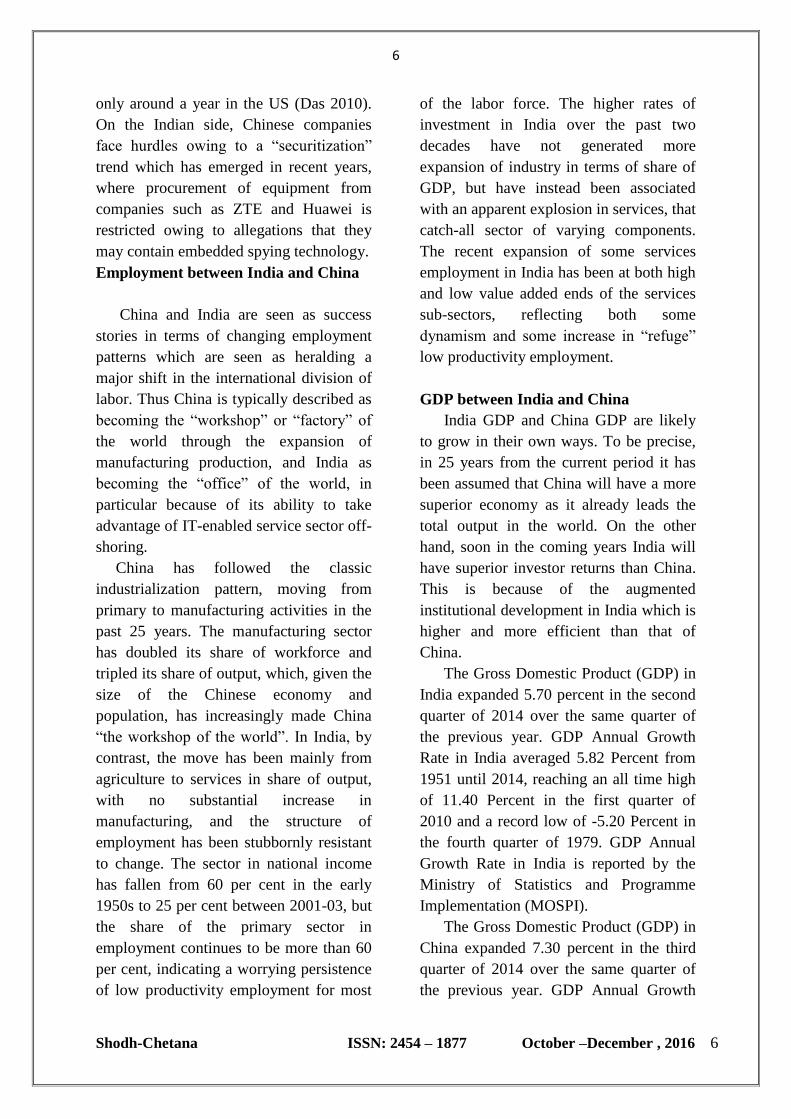
only around a year in the US (Das 2010).
On the Indian side, Chinese companies
face hurdles owing to a “securitization”
trend which has emerged in recent years,
where procurement of equipment from
companies such as ZTE and Huawei is
restricted owing to allegations that they
may contain embedded spying technology.
Employment between India and China
China and India are seen as success
stories in terms of changing employment
patterns which are seen as heralding a
major shift in the international division of
labor. Thus China is typically described as
becoming the “workshop” or “factory” of
the world through the expansion of
manufacturing production, and India as
becoming the “office” of the world, in
particular because of its ability to take
advantage of IT-enabled service sector off-
shoring.
China has followed the classic
industrialization pattern, moving from
primary to manufacturing activities in the
past 25 years. The manufacturing sector
has doubled its share of workforce and
tripled its share of output, which, given the
size of the Chinese economy and
population, has increasingly made China
“the workshop of the world”. In India, by
contrast, the move has been mainly from
agriculture to services in share of output,
with no substantial increase in
manufacturing, and the structure of
employment has been stubbornly resistant
to change. The sector in national income
has fallen from 60 per cent in the early
1950s to 25 per cent between 2001-03, but
the share of the primary sector in
employment continues to be more than 60
per cent, indicating a worrying persistence
of low productivity employment for most
of the labor force. The higher rates of
investment in India over the past two
decades have not generated more
expansion of industry in terms of share of
GDP, but have instead been associated
with an apparent explosion in services, that
catch-all sector of varying components.
The recent expansion of some services
employment in India has been at both high
and low value added ends of the services
sub-sectors, reflecting both some
dynamism and some increase in “refuge”
low productivity employment.
GDP between India and China
India GDP and China GDP are likely
to grow in their own ways. To be precise,
in 25 years from the current period it has
been assumed that China will have a more
superior economy as it already leads the
total output in the world. On the other
hand, soon in the coming years India will
have superior investor returns than China.
This is because of the augmented
institutional development in India which is
higher and more efficient than that of
China.
The Gross Domestic Product (GDP) in
India expanded 5.70 percent in the second
quarter of 2014 over the same quarter of
the previous year. GDP Annual Growth
Rate in India averaged 5.82 Percent from
1951 until 2014, reaching an all time high
of 11.40 Percent in the first quarter of
2010 and a record low of -5.20 Percent in
the fourth quarter of 1979. GDP Annual
Growth Rate in India is reported by the
Ministry of Statistics and Programme
Implementation (MOSPI).
The Gross Domestic Product (GDP) in
China expanded 7.30 percent in the third
quarter of 2014 over the same quarter of
the previous year. GDP Annual Growth
7
Shodh-Chetana ISSN: 2454 – 1877 October –December , 2016 7
Rate in China averaged 9.10 Percent from
1989 until 2014, reaching an all time high
of 14.20 Percent in the fourth quarter of
1992 and a record low of 3.80 Percent in
the fourth quarter of 1990. GDP Annual
Growth Rate in China is reported by the
National Bureau of Statistics of China.
Challenges for India and China
For Indian growth to be sustainable, it
must be inclusive to cover issues related to
inequalities between castes (including
tribal children and elderly people living in
remote areas), colour (dark and fair),
disability, gender, regions (rural-urban as
well as differences between states), and
more. While the gender gap in
employment and political participation has
been narrowing, there is much more to be
done for the health and safety of girls and
women. India needs to do more to ensure
inclusive growth, particularly by
improving social protection policies. The
issue of high inflation is one of the most
important challenges for India. Indian
cities are growing at an unprecedented
rate—the country’s urban population is
expected to grow to 590 million people by
2030. This rapid urbanization is also
expected to drive economic growth cities
could generate up to 70 per cent of new
jobs created until 2030 and produce 70 per
cent of Indian GDP. To reap the economic
advantages of urbanization, the Indian
government must develop better policies to
meet urban infrastructure needs through
sustainable means and address growing
urban poverty and inequality. So many
other challenges face by India. The major
challenge between India and China is
mostly related the trade between India and
China, employment, investment like FDI
and maintain GDP rate.
Conclusion
The most fundamental question that
has been posed by the recent experience of
both India and China – that of the apparent
disjunction between economic growth and
employment generation and both country
this is major challenge. Indian economy
move toward the service sector while
China economies move toward the
manufacturing sector. The relationship
between technological progress and
employment generation obviously cannot
be forgotten. The promotion of more
employment clearly should not involve a
glorification of drudgery, especially when
newer technological developments open
up possibilities for less arduous and
tedious ways of working. Trade between
two countries also play important role for
economic development for both country.
References
1. Annual report 2012-13 Ministry of
commerce government of India.
2. Aggarwal, Aradhna.2002.
‘Antidumping Law and Practice: An
Indian Perspective’, Working Paper
85
3. Ahya, Chetan and Tanvee Gupta.
2010. ‘India and China: New Tigers
of Asia, Part III: India to Outpace
China's Growth by 2013–15’
(Special Economic Analysis),
August.Singapore: Morgan Stanley.
4. Bloomberg News. 2012. ‘Iron Ore
Heads For Bear Market:
Commodities :4 October,
5. Chandrasekhar, CP and
JayatiGhosh.2007. ‘Recent
Employment Trends in India and
China.
8
Shodh-Chetana ISSN: 2454 – 1877 October –December , 2016 8
6. China Business Insight.2012.
‘Indian Investment in China’.
7. Embassy of India, Beijing. 2012.
‘Trade and Commercial Relations’.
8. Guo, Yan. 2010. ‘Wider fields to be
explored between China and India’,
China’s Foreign Trade, Vol 4, 53–
54.
9
Shodh-Chetana ISSN: 2454 – 1877 October –December , 2016 9
ABSTRACT
E-Commerce industry is growing at
an astounding rate in India and is
expected to account for 1.61% of the
global GDP by 2018. While China
continues to lead the race, the Indian
E-Commerce Industry isn’t far
behind. According to a report by
Forrester, India is set to become the
fastest growing market in the Asia-
Pacific region with an expected
growth rate of over 57% between
2012-2016.The Indian E-Commerce
industry has witnessed relentless,
expansive growth over the past year.
It is expected to evolve and grow in
worth to $79.4B by 2020, according
to E-Marketer. This is to be
supplemented by the fact that the
Indian digital population is
estimated to grow by a staggering 50
million annually by 2020. . This
article an attempt has been made put
light on recent e-commerce habit
inculcated in India which can be
useful in future decision making for
the organisation while preparing
strategy.
Keywords: E-Commerce ,Online,
trends,India ,.
I. INTRODUCTION
E-Commerce industry is growing at an
astounding rate in India and is expected to
account for 1.61% of the global GDP by
2018. The Asia-Pacific region is currently
the largest E-Commerce market in the
world, surpassing Europe. While China
continues to lead the race, the Indian E-
Commerce Industry isn’t far behind.
According to a report by Forrester, India is
set to become the fastest growing market
in the Asia-Pacific region with an expected
growth rate of over 57% between 2012-
2016.
The Indian E-Commerce industry has
witnessed relentless, expansive growth
over the past year. It is expected to evolve
and grow in worth to $79.4B by 2020,
according to E-Marketer. This is to be
supplemented by the fact that the Indian
digital population is estimated to grow by
a staggering 50 million annually by 2020.
Beyond the obviously popular categories
responsible for this growth like apparel,
electronics and cosmetics, we see
significant traction on product lines that
drove several skeptics earlier, including
“Recent trends of India’s E-Commerce Habits”
PROF. MIHIR. C. SHAH
Assistant professor,
Chetana College, Bandra, Mumbai-51. E-MAIL: [email protected]
CONTACT NO: 9969502166

10
Shodh-Chetana ISSN: 2454 – 1877 October –December , 2016 10
furniture, jewellery and even gourmet
food. With the user experience being
provided getting richer by the day, with
given conveniences like price comparison,
hassle-free returns and cash or card-on-
delivery, online purchasing has become
the primary mode of shopping for millions
of Indian shoppers already. This article an
attempt has been made put light on recent
e-commerce habit inculcated in India.
II. OBJECTIVES OF PAPER
The objectives of the study are:
• To analysis the E-commerce habits in
India since 2016.
• To study recent trends in Indian E-
commerce habits in India since 2016.
• To provide possible findings.
III. RESEARCH METHODOLOGY
This study is purely based on secondary
data. The secondary data has been
collected from books, journals, newspaper,
published and unpublished thesis, internet,
and an online survey was made by
SOKRATI, Founded by ex-Amazonians
which survey 100+ Indian Retailers , 1.5+
Billion User Events ,1.3+ Million
Purchasers ,1.9+ Million Transactions .
IV. RESULTS & ANALYSIS
1. Indian Men Shop Online 2.7x More
Often Than Indian Women
Contrary to popular belief that women
spend more time shopping, the reality is
that men don’t shy away from shopping
online.
Intuitively, men do spend more time online
than women - whether it’s at work or at
home. Also, they tend to probably take the
final call on high ticket items - especially
in categories like Electronics and
Furniture.
Indian Men outweigh Women 1:2.7
when it comes to online purchases.
Also, Indian Men convert 57%
better with about 17% higher
Average Order Value (AOV).
2. Delhi-NCR Consumes 1/3rd of
Online Purchases, Followed by a
Distant Mumbai
Tier-I cities massively dominate the online
purchase scene in India with 8 out of every

11
Shodh-Chetana ISSN: 2454 – 1877 October –December , 2016 11
10 orders coming from them. Even the
Average Order Values (AOVs) are a
staggering 38% higher than other Tiers.
While Tier II and Tier III promises an
exciting future for Online Retailers, data
clearly suggests that Tier I is where the
most significant volumes and revenues
currently come from.
Given higher disposable incomes,
proportionately better access to large
screen devices and high speed internet, and
overall better delivery logistics, Shoppers
from Tier I cities seem to be savvier to
shop online, including for bigger ticket-
sized items
Tier-I cities include Delhi, Mumbai, Kolkata,
Chennai, Pune, Hyderabad, Ahmedabad,
Bangalore according to the revised HRA
classification by the Government Of India
While Tier II and Tier III promises an
exciting future for Online Retailers, data
clearly suggests that Tier I is where the
most significant volumes and revenues
currently come from.
Given higher disposable incomes,
proportionately better access to large
screen devices and high speed internet, and
overall better delivery logistics, Shoppers
from Tier I cities seem to be savvier to
shop online, including for bigger ticket-
sized items.
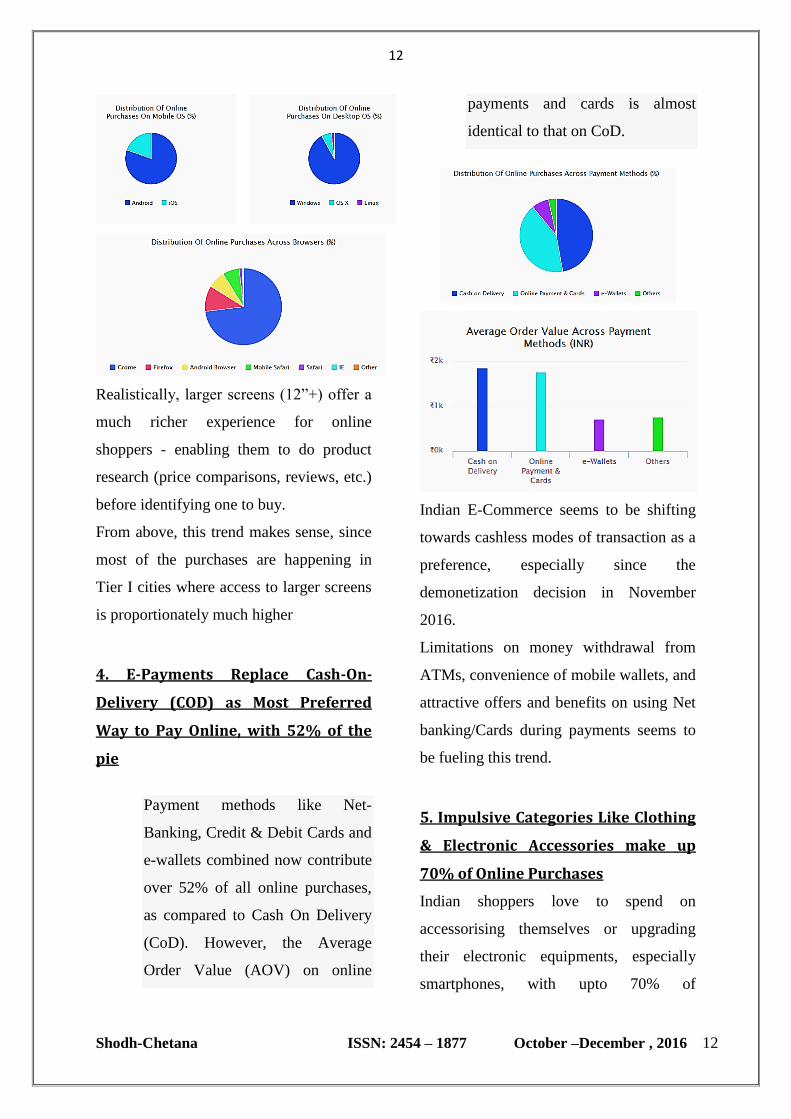
3. Web Shoppers Prefer Larger
Screens to Their Smaller
Counterparts by 2:1
When it comes to ‘Web’ based purchases,
Personal Computers (PCs) are still the
preferred devices with more than 64% of
the online purchases coming from them.
They also have a 25% higher Average
Order Value (AOV) compared to
smartphones. Interestingly, while Android
commands a higher share of Mobile Web
purchases, iOS based Shoppers have 31%
higher AOVs!
12
Shodh-Chetana ISSN: 2454 – 1877 October –December , 2016 12
Realistically, larger screens (12”+) offer a
much richer experience for online
shoppers - enabling them to do product
research (price comparisons, reviews, etc.)
before identifying one to buy.
From above, this trend makes sense, since
most of the purchases are happening in
Tier I cities where access to larger screens
is proportionately much higher
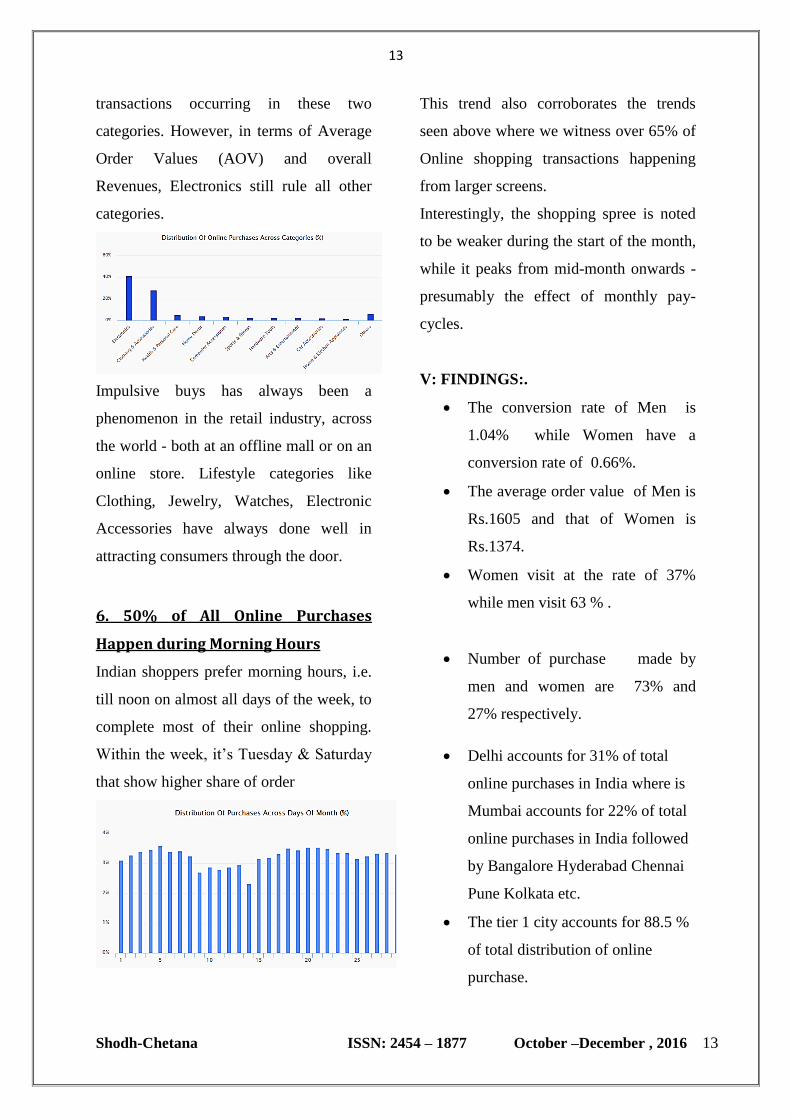
4. E-Payments Replace Cash-On-
Delivery (COD) as Most Preferred
Way to Pay Online, with 52% of the
pie
Payment methods like Net-
Banking, Credit & Debit Cards and
e-wallets combined now contribute
over 52% of all online purchases,
as compared to Cash On Delivery
(CoD). However, the Average
Order Value (AOV) on online
payments and cards is almost
identical to that on CoD.
Indian E-Commerce seems to be shifting
towards cashless modes of transaction as a
preference, especially since the
demonetization decision in November
2016.
Limitations on money withdrawal from
ATMs, convenience of mobile wallets, and
attractive offers and benefits on using Net
banking/Cards during payments seems to
be fueling this trend.
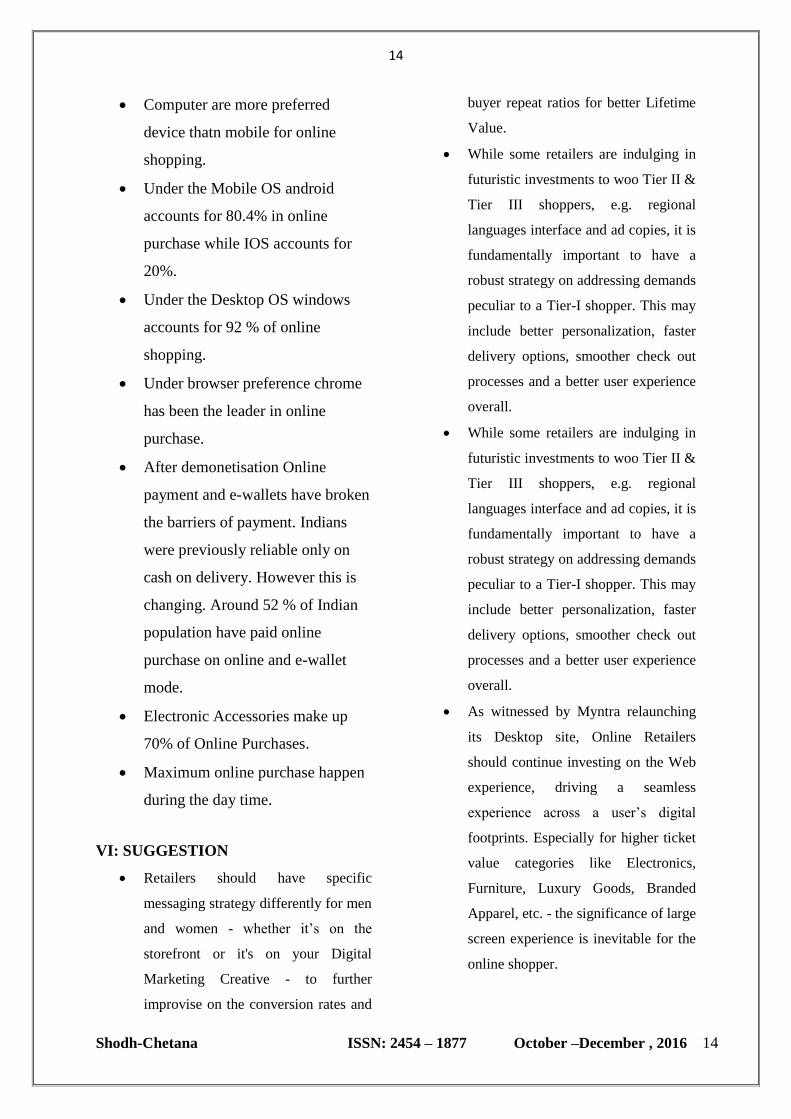
5. Impulsive Categories Like Clothing
& Electronic Accessories make up
70% of Online Purchases
Indian shoppers love to spend on
accessorising themselves or upgrading
their electronic equipments, especially
smartphones, with upto 70% of
13
Shodh-Chetana ISSN: 2454 – 1877 October –December , 2016 13
transactions occurring in these two
categories. However, in terms of Average
Order Values (AOV) and overall
Revenues, Electronics still rule all other
categories.
Impulsive buys has always been a
phenomenon in the retail industry, across
the world - both at an offline mall or on an
online store. Lifestyle categories like
Clothing, Jewelry, Watches, Electronic
Accessories have always done well in
attracting consumers through the door.
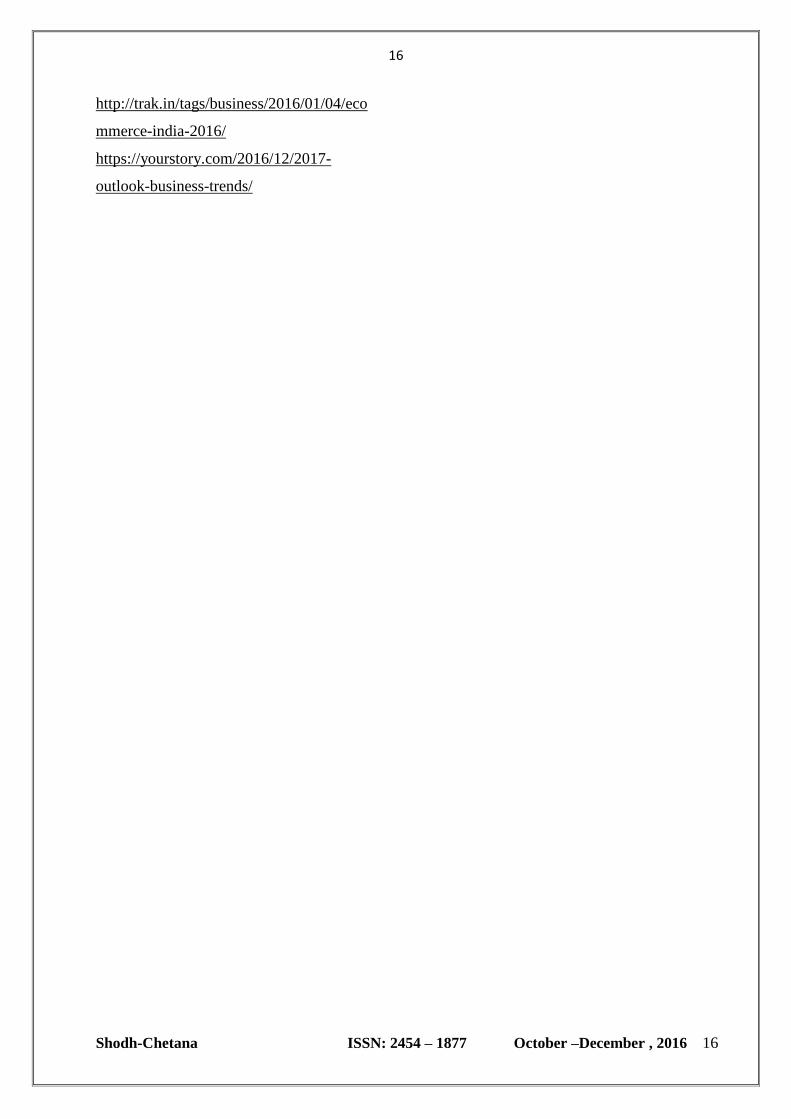
6. 50% of All Online Purchases
Happen during Morning Hours
Indian shoppers prefer morning hours, i.e.
till noon on almost all days of the week, to
complete most of their online shopping.
Within the week, it’s Tuesday & Saturday
that show higher share of order
This trend also corroborates the trends
seen above where we witness over 65% of
Online shopping transactions happening
from larger screens.
Interestingly, the shopping spree is noted
to be weaker during the start of the month,
while it peaks from mid-month onwards -
presumably the effect of monthly pay-
cycles.
V: FINDINGS:.
The conversion rate of Men is
1.04% while Women have a
conversion rate of 0.66%.
The average order value of Men is
Rs.1605 and that of Women is
Rs.1374.
Women visit at the rate of 37%
while men visit 63 % .
Number of purchase made by
men and women are 73% and
27% respectively.
Delhi accounts for 31% of total
online purchases in India where is
Mumbai accounts for 22% of total
online purchases in India followed
by Bangalore Hyderabad Chennai
Pune Kolkata etc.
The tier 1 city accounts for 88.5 %
of total distribution of online
purchase.
14
Shodh-Chetana ISSN: 2454 – 1877 October –December , 2016 14
Computer are more preferred
device thatn mobile for online
shopping.
Under the Mobile OS android
accounts for 80.4% in online
purchase while IOS accounts for
20%.
Under the Desktop OS windows
accounts for 92 % of online
shopping.
Under browser preference chrome
has been the leader in online
purchase.
After demonetisation Online
payment and e-wallets have broken
the barriers of payment. Indians
were previously reliable only on
cash on delivery. However this is
changing. Around 52 % of Indian
population have paid online
purchase on online and e-wallet
mode.
Electronic Accessories make up
70% of Online Purchases.
Maximum online purchase happen
during the day time.
VI: SUGGESTION
Retailers should have specific
messaging strategy differently for men
and women - whether it’s on the
storefront or it's on your Digital
Marketing Creative - to further
improvise on the conversion rates and
buyer repeat ratios for better Lifetime
Value.
While some retailers are indulging in
futuristic investments to woo Tier II &
Tier III shoppers, e.g. regional
languages interface and ad copies, it is
fundamentally important to have a
robust strategy on addressing demands
peculiar to a Tier-I shopper. This may
include better personalization, faster
delivery options, smoother check out
processes and a better user experience
overall.
As witnessed by Myntra relaunching
its Desktop site, Online Retailers
should continue investing on the Web
experience, driving a seamless
experience across a user’s digital
footprints. Especially for higher ticket
value categories like Electronics,
Furniture, Luxury Goods, Branded
Apparel, etc. - the significance of large
screen experience is inevitable for the
online shopper.

15
Shodh-Chetana ISSN: 2454 – 1877 October –December , 2016 15
For most retailers, CoD is a necessary
evil for expanding business to newer
avenues. But a government-driven
move towards a cashless economy has
caused a significant dent for almost all
of them. To ensure this move doesn’t
impact the bottom-lines even further,
many online retailers have started
integrating with mobile wallet
platforms, while also giving attractive
offers on Netbanking and card
payments. Some retailers have already
pushed up the ‘minimum order value’
for CoD eligibility, or have started
charging a ‘convenience fee’ for this
mode of payment.
Retailers should invest in enhancing
the user experience when it comes to
‘trying-out’ lifestyle items. This
includes multiple product views,
product videos, truer colours, size
guides and comparisons, and
essentially show each product in the
environment in which they would be
used. A ‘try-it-on-yourself’ option
would also be rewarding. The final
results expected would be lesser
returns, improved customer stickiness,
and a higher LifeTime Value (LTV).
Retailers should invest in handling
website traffic and ad delivery during
these preferred buying periods. They
should also incorporate day parting in
their online campaign management
activities for optimum returns on their
ad spends (RoAS).
VII: CONCLUSION
This detailed analysis of E-Commerce
trends and opportunities, is very helpful
for online retailers. They can plan their
marketing trend based on the above
analysis. Also Digital marketing is a
moving target. Platforms change and
evolve. New algorithms are launched,
tweaked, and improved. Some features are
discontinued, new ones are developed.
Keeping up with these trends is no mean
feat, but by analysing existing data on
current trends and techniques used by
early adopters combined with expert
analysis, we’ve predicted a series of key
trends in digital marketing, Ecommerce
and web design for the coming years.
VIII: BIBLOGRAPHY
https://apps.sokrati.com/indian-
ecommerce-trends-q3-
2016?utm_source=blog&utm_campaign=o
nd_irr&utm_medium=website
http://www.gadgetsnow.com/slideshows/7
-key-trends-for-indian-e-commerce-
industry-in-2016/photolist/50578854.cms
http://www.pcquest.com/upcoming-trends-
indian-commerce-domain/
http://www.fibre2fashion.com/industry-
article/1349/emerging-trend-of-e-
commerce-in-india
https://www.zepo.in/blog/category/ecomm
erce-trends-india/
16
Shodh-Chetana ISSN: 2454 – 1877 October –December , 2016 16
http://trak.in/tags/business/2016/01/04/eco
mmerce-india-2016/
https://yourstory.com/2016/12/2017-
outlook-business-trends/
17
Shodh-Chetana ISSN: 2454 – 1877 October –December , 2016 17
ABSTRACT:
Vocational Education is based on
profession and employment and it is the
need of the hour for every state to have
strong vocational education system. It can
be defined as skilled based education.
Vocational Education helps in Economic
growth. The Indian education system
recognizes the role of education and
particularly Vocational Education.
National Council for Vocational Training,
an advisory body, was set up by the
Government of India plays its important
role in implementation of Vocational
Education in India. Although there are lots
many areas in which India is facing
problems in Vocational Education
Implementation. This article throws light
upon scope, problem areas and
government role in Vocational Education
Implementation.
Keywords – Vocational Education,
profession, skilled, economic growth, etc.
Introduction Vocational Education can be defined as
the education that is based on occupation
and employment. Vocational Education is
also known as career and technical
education (CTE) or technical and
vocational education and training (TVET).
It prepares people for specific trades, crafts
and careers at various levels in all spheres
of life. It involves various practical
activities. It is sometimes referred as
technical education because the trainee
directly develops expertise in a particular
group of techniques. Vocational education
is related to the age-old apprenticeship
system of learning. In other words
Vocational Education may be classified as
teaching procedural knowledge.
Vocational education consists basically of
practical courses through which one gains
skills and experience directly linked to a
career in future. It helps students to be
skilled and in turn, offers better
employment opportunities.
Origin of Vocational Education in
India The interest in vocational and technical
education in India originated from the
Wood's Despatch of 1854. Several
education commissions and committees
had stressed the need for a diversified
curricula. Based on the Abbot-Wood
Advisory Committee recommendations, a
chain of polytechnics were then
established in 1937. These committees had
however restricted themselves specifically
in the development of vocational education
or in technical education functioning
outside the school system. A report of
education commission headed by Dr.
Kothari in the year 1964-1966 was the first
attempt in India to formulate progressive
vocational education in Higher Secondary
School Level which was implemented only
in the year 1976-1977 by several states of
India. In the year 1986 the National Policy
on Education (NPE) gives a new way to
overcome the various aspects which causes
the obstacles in success of first attempt of
Vocationalisation in Higher Secondary
Schools. Since then various improvements
like introduction Centrally Sponsored
Scheme (CSS) in the policies related to the
Vocationalisation of education in Higher
Secondary Schools was made by central
and state level. These efforts was taken to
provide diversification of educational
opportunities so as to develop individual
employability in terms of job opportunity
and self-employment and also to made
“VOCATIONAL EDUCATION IN INDIA”
AMIT SUNIL ZODGEKAR
Assistant professor,
Chetana’s College, E-MAIL: [email protected]
Contact No.:8956796529
18
Shodh-Chetana ISSN: 2454 – 1877 October –December , 2016 18
available vertical mobility to vocational
pass outs.
Need of Vocational Education Vocational, or skills-based, education is
becoming more and more important today,
with many employers expecting new
employees to have all the practical skills
they need to start work and also for those
who have to support their families
immediately after senior secondary
education. Vocational courses are typically
more practical and skills-based than
academic degrees, but they are often
taught at universities as well as colleges
and technical institutes. Vocational
Education and Training (VET) is an
important element of the nation’s
education initiative. Vocational education
has to be viewed from different multi-
layered practices. One is of course the
hands on training component. The other is
employment generation and sustainability.
If you know exactly what you want to do
in your career and it requires practical
skills, then vocational learning is
important. It could be hospitality and
tourism, retail management, software
development or interior design. There are
literally thousands of skills based training
options out there. In today’s technical
world, even an engineering graduate is
supposed to have
some technical skills apart from the degree
possessed by him or her i.e. in the form of
certification etc.
Vocational Training in India In India, we believe that education is the
key to the task of nation-building. It is also
a well-accepted fact that providing the
right knowledge and skills to the youth can
ensure the overall national progress and
economic growth. The Indian education
system recognizes the role of education
and particularly Vocational Education.
Vocational training in India is provided on
a full-time as well as part-time basis. Full-
time programs are generally offered
through I.T.I.s Industrial training
institutes. The nodal agency for granting
the recognition to the I.T.I.s is NCVT,
which is under the Ministry of Labour,
Govt. of India. Part-time programs are
offered through state technical education
boards or universities who also offer full-
time courses. The technical and vocational
education and training system (TVET) in
India develops human resource through a
three-tier system:
Graduate and post-graduate level
specialists (e.g. IITs, NITs, and
engineering colleges) trained as
engineers and technologists.
Diploma-level graduates who are
trained at Polytechnics as
technicians and supervisors.
Certificate-level for higher
secondary students in the
vocational stream and craft people
trained in ITIs as well as through
formal apprenticeships as
semiskilled and skilled workers.
National Council for Vocational
Training (NCVT) National Council for Vocational Training,
an advisory body, was set up by the
Government of India in the year 1956. The
National Council is chaired by the
Minister of Labour, with members from
different Central and State Government
Departments, Employers and Workers
organizations, Professional and Learned
Bodies, All India Council for Technical
Education, Scheduled castes and
Scheduled tribes, All India Women’s
Organization, etc. And State Councils for
Vocational Training at the State level and
Trade Committees have been established
to assist the NCVT. Main mandate of the
NCVT, according to DGE&T, is to
establish and award National Trade
Certificates in engineering, non-
engineering, building, textile, leather
trades and such other trades which are
brought within its scope by the
19
Shodh-Chetana ISSN: 2454 – 1877 October –December , 2016 19
Government of India. It also prescribes
standards in respect of syllabi, equipment,
scales of accommodation, duration of
courses and methods of training. It also
conducts tests in various trade courses and
lays down standards of proficiency
required for passing the examination
leading to the award of National Trade
Certificate etc. A new direction has been
given to Vocational Education by NCVT.
Vocational Education and
Economic Development After the Independence of India, there was
a growing concern for economic
development and this strengthened the
interest for the need of more skilled and
trained man power to meet the increasing
demand of the fast growing economy. The
emergence of new technologies and
specially the demands in rural industries
will require specialized skills to promote
the productivity of an enterprise and also
to enhance the employment security of an
individual. This makes the role of
technical and vocational education more
and more vital in today's time.
The Report of the Working Group for the
Revision of CSS of Vocationalisation of
Secondary Education (NCERT, 1998)
states that "the national goal of vocational
education is to fulfil the manpower
requirement for sustainable national
development and social requirement for
employment. It is the vocationally
competent persons prepared through a
need-based, appropriate and adequate
education and professionally sound
training programme that can ensure
production of goods and services of the
highest quality and standards to maintain
economic viability in a globalised market
economy. The Vocational Education
Programme (VEP) must take into account
the on-going and emerging social,
economic, political and environmental
implications of rapid scientific and
technological changes as well as other
global trends to keep pace with the
requirements of the changing vocational
scenario. It should have in-built provisions
to make timely mid-course corrections to
ensure developmental and environmental
sustainability of the VEP. Educationalists
had believed that, besides other institutions
imparting technical education in the
country, vocational education would also
help a long way in improving the
economic situation in the country. This
work oriented education, would not only
help in meeting the middle and
supervisory level jobs in the industry, but
would help in a greater way to solve the
problem of increasing unemployment
faced by the country, caused by the huge
number of students that usually drop out
after high school education and also by the
large number of educated youth that
remain unemployed because they have
higher
education without any professional skills
to meet the rapidly changing demands of
the industry. Vocational education would
help in making them employable because
of the practical training and OJT they
receive during the course. The two broad
goals of the scheme of Vocationalisation
of education as conceived at the national
level were:
To reduce the load on the higher
education by ensuring that a
significant share of students
taking admission at the plus two
level shift in favour of vocational
courses as against the general
stream.
To develop and train HSS
students who can get absorbed in
the growing job market either as
skilled workers or organize their
own enterprise through self-
employment.
20
Shodh-Chetana ISSN: 2454 – 1877 October –December , 2016 20
Problems for Vocational
Education Implementation Vocational training has been successful in
India only in industrial training institutes
and that too in engineering trades. There
are many private institutes in India which
offer courses in vocational training and
finishing, but most of them have not been
recognized by the Government. Firstly
required steps should be taken to recognize
appropriate institutes those fulfil the
underlined criteria. Vocational Higher
Secondary schools are under MHRD in
India. This need to be made strong as this
is the base of Vocational Education.
Through, the study of the prevalent
Vocational Education System in India the
following problem areas have been
identified -:
There is a high drop-out rate at
Secondary level.
Private and Industry participation
is lacking.
Not adequate number of trained
faculty.
Vocationalisation at all levels has
not been successful.
Lacking of new sectors of
vocational education and skills
training.
Lack of opportunities for
continuous skill up-gradation.
Current education system is non-
responsive to the skill demands of
the existing and future industry,
leading to a supply-demand gap on
various counts.
Outside the school system, relevant
vocational training centres are ill-
equipped to handle the demand and
are accessible to only a selected
number of students who have
passed at least level 10 and 10+.
Huge demand-supply skill gap.
Most of the Vocational Education
Training Institutes are
characterized by structurally rigid
and outdated centralized syllabi
that do not have much sync with
the prevailing market conditions.
Absence of monitoring committee.
Apart from that However there is a lot of
variation among the various programs in
terms of duration, target group, entry
qualifications, testing and certification,
curriculum, etc. which has resulted in
problems related to recognition of
qualifications, equivalence and vertical
mobility.
Government Role In order for Vocational Education to play
its part effectively in the changing national
context and for India to enjoy the fruits of
the technical fields, there is an urgent need
to redefine the critical elements of
imparting vocational education and
training to make them flexible,
contemporary, relevant, inclusive and
creative. The Government is well aware of
the important role of Vocational education
and has already taken a number of
important initiatives in this area. To
stimulate and support reforms in skills
development and to facilitate nationally
standardized and acceptable, international
comparability of qualifications, a
“National Vocational Qualifications
Framework” is being established by the
Central Government. Central Advisory
Board of Education (CABE) has resolved
to set up an inter-ministerial group which
would also include representatives of State
Governments to develop guidelines for
such a National Framework.
Conclusion
Vocational Education strengthens any
country’s employment and same way its
economy. India being a developing world
has come a long way to enhance and
implement Vocational Education.
References Web Sites
21
Shodh-Chetana ISSN: 2454 – 1877 October –December , 2016 21
1. Ministry Of Human Resource
Development
(http://mhrd.gov.in)
2. Maharashtra Centre for
Entrepreneurship Development
(http://www.mced.nic.in)
3. Wikipedia.Org
(http://en.wikipedia.org)
4. Apeejay Stya Education
Research Foundation
(www.aserf.org.in)
5. Directorate Of Vocational
Education & Training, Mumbai
(http://www.dvet.gov.in/)
6. The Vocational Education And
Training, Regional Office,
Nashik (http://www.dvet-
ronashik.org/)
7. Maharashtra State Board of
Secondary and Higher
Secondary Education
(www.msbshse.ac.in/newsite/n
ewhome.html)
8. Maharashtra State Board Of
Vocational Examination
(http://www.msbve.gov.in/)
Reports
1. Educational Development
Index, Maharashtra 2011-12
2. 11th
Five Year Plan, Volume II
2007-2012 Social Sector
3. Revised centrally sponsored
scheme of “Vocationalisation
Of Higher Secondary
Education”
Articles 1. http://www.indianexpress.com/
news/focus-will-be-on-
vocational-education-
framework-sibal/700525/
2. http://www.thehindu.com/new
s/cities/bangalore/vocational-
training-to-plug-the-hole-in-
formal-
education/article5000352.ece
22
Shodh-Chetana ISSN: 2454 – 1877 October –December , 2016 22
Abstract-
In India most of the people are
depending upon small scale businesses
as their source of livelihood. Most of
the individuals depend on Unorganised
sectors for loans and other credit
facilities which have high rate of
interest along with unbearable terms
and conditions. Ultimately it will lead
these poor people to fall in debts. A
vast part of the non- corporate sector
operates as unregistered enterprises.
They do not maintain proper Books
of Accounts and are not formally
covered under taxation areas.
Therefore, the banks find it difficult to
lend to them. Majority of this sector
does not access outside sources of
finance. After identifying the
importance of self-employment people
and small business units, government
of India launched the Mudra Bank
Scheme under Pradhan Manthri Mudra
Yojana to provide financial assistance
to MSMEs who provide employment
to a large number of people targeted
towards mainstreaming young,
educated or skilled workers and
entrepreneurs including women
entrepreneurs. This paper is an attempt
to know about the MUDRA Yojana
and its key objectives. For analyzing
such facts secondary sources of data
has been collected. It is not very much
correct time to evaluate the PMMY
scheme which is only in its infant
stage. But an attempt has been made in
this paper to analyze the product
offerings and performance so far of the
scheme.
Keywords –MFIs, PMMY, MSMEs,
Mudra Bank, Self-Employment
I. INTRODUCTION
Micro Small and Medium Enterprises
(MSME) contributes around 8% to GDP.
Small businesses are not in a position to
play their role effectively due to various
constraints. Raising finance is one of the
biggest problems for this sector.
The major constraints faced by the myriad
of the MSMEs along the length and
breadth of the country include :
• Access to Finance
• Skill Development Gaps
• Knowledge Gaps
• Infrastructure Gaps
• Policy Advocacy Needs
• Information Asymmetry
• Lack of growth orientation
• Lack of Market Development /
Market Making
• Entry Level Technologies
A vast part of the non-corporate sector
operates as unregistered enterprises. They
do not maintain proper Books of Accounts
and are not formally covered under
taxation areas. Therefore, the banks find it
difficult to lend to them. Majority of this
sector does not access outside sources of
finance. PMMY aims to bank the
unbanked. The objective of PMMY is to
support the entrepreneurs of the above
mentioned
class via Micro Units Development and
Refinance Agency (MUDRA) Bank.
II. OBJECTIVES OF THE STUDY
• To know the Objectives of
MUDRA BANK
“A DESCRIPTIVE STUDY ON PRADHAN MANTHRI MUDRA YOJANA (PMMY)”
KAUSTUBHA K. SAWANT
Assistant professor,
Chetana’s College, E-MAIL: [email protected].
Contact no.:9850628305

23
Shodh-Chetana ISSN: 2454 – 1877 October –December , 2016 23
• To understand the Product
offerings of MUDRA BANK.
• To analyse the performance of
MUDRA BANK in state of
Maharashtra
III. METHODOLOGY
The data and information for the study
is gathered from secondary sources
like newspapers, magazines, various
websites including website of
MUDRA Yojana.
IV. LIMITATIONS OF THE
STUDY
Time constraints while collecting
the secondary data.
All the data cannot be generalized.
V. PRADHAN MANTHRI MUDRA
YOJANA
PMMY aims to bank the unbanked.
The objective of PMMY is to support
the entrepreneurs of the above
mentioned class via Micro Units
Development and Refinance Agency
(MUDRA) Bank. To remove the
financial difficulties faced by micro
and small business units the GOI
launched a scheme on 8th April 2015
called Micro Unit Development and
Refinance Agency, or MUDRA to
‘fund the unfunded’ under the scheme
of Pradhan Mantri MUDRA Yojana
(PMMY).
Micro Units Development &
Refinance Agency Ltd (MUDRA) was
set up by the Government of India
(GoI). MUDRA has been initially
formed as a wholly owned subsidiary
of Small Industries Development bank
of India (SIDBI) with 100% capital
being contributed by it. Presently, the
authorized capital of MUDRA is 1000
crores and paid up capital is 750 crore,
fully subscribed by SIDBI. More
capital is expected to enhance the
functioning of MUDRA. This Agency
would be responsible for developing
and refinancing all Micro-enterprises
sector by supporting the finance
Institutions which are in the business
of lending to micro / small business
entities engaged in manufacturing,
trading and service activities.
MUDRA would partner with Banks,
MFIs and other lending institutions at
state level / regional level to provide
micro finance support to the micro
enterprise sector in the country.
VI. KEY OBJECTIVES OF
MUDRA YOJANA
Pradhan Mantri Mudra Yojana has
come as a boon for MSME (Micro,
small and medium Enterprises) sector
and is widely hailed as a robust
measure to achieve inclusive growth.
The Principal Objectives of the
MUDRA Bank under Mudra Yojana :
• Regulate the lender and the
borrower of microfinance and bring
stability to the microfinance system
through regulation and inclusive
participation.
• Extend finance and credit support
to Microfinance Institutions (MFI) and
agencies that lend money to small
businesses, retailers, self-help groups
and individuals.
• Register all MFIs and introduce a
system of performance rating and
accreditation for the first time. This
will help last-mile borrowers of
finance to evaluate and approach the
MFI that meets their requirement best
and whose past record is most
satisfactory. This will also introduce
an element of competitiveness among
the MFIs. The ultimate beneficiary
will be the borrower.
24
Shodh-Chetana ISSN: 2454 – 1877 October –December , 2016 24
• Provide structured guidelines for
the borrowers to follow to avoid
failure of business or take corrective
steps in time. MUDRA will help in
laying down guidelines or acceptable
procedures to be followed by the
lenders to recover money in cases of
default.
• Develop the standardised
covenants that will form the backbone
of the last-mile business in future.
• Offer a Credit Guarantee scheme
for providing guarantees to loans
being offered to micro businesses.
• Introduce appropriate technologies
to assist in the process of efficient
lending, borrowing and monitoring of
distributed capital.
• Build a suitable framework
under the Pradhan Mantri MUDRA
Yojana for developing an efficient
last-mile credit delivery system to
small and micro businesses.
VII. MAJOR PRODUCT
OFFERINGS
Under the scheme of PMMY,
MUDRA Bank has rightly classified
the borrowers into three segments: the
starters, the mid-stage finance seekers
and the next level growth seekers.
To address the three segments,
MUDRA Bank has launched three
loan instruments:
Shishu: covers loans upto Rs50,000/-
Kishor: covers loans above Rs
50,000/-and upto Rs 5 lakh
Tarun: covers loans above Rs 5 lakh
and upto Rs 10 lakh
Rate of Interest Charged:
Shishu: The rate of interest charged
under this scheme by the banks is
around 10% to 12%. And public
sectors banks are charging at lower
rate.
Kishor: The rate of interest
isfrom14%to 17% depends on bank to
bank.
Tarun: The rate of interest starts at
16%
It should be noted that at least 60% of
the credit flows to Shishu Category
Units and the balance to Kishor and
Tarun Categories are ensured.
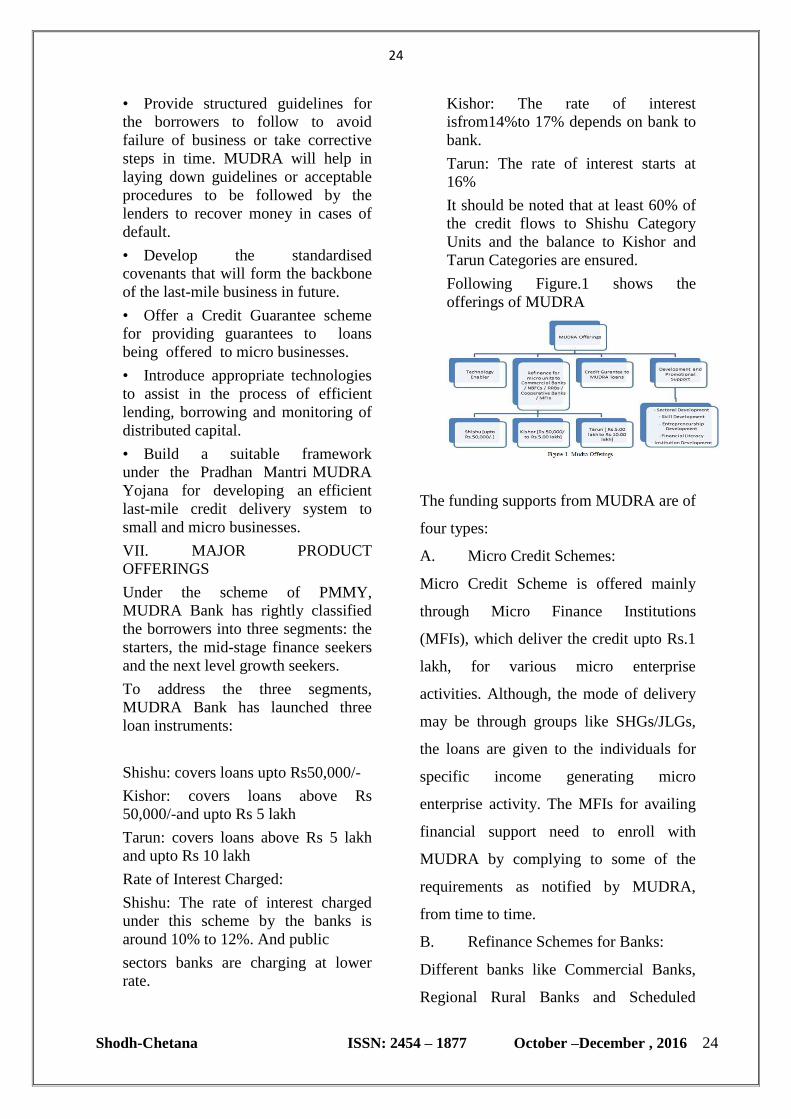
Following Figure.1 shows the
offerings of MUDRA
The funding supports from MUDRA are of
four types:
A. Micro Credit Schemes:
Micro Credit Scheme is offered mainly
through Micro Finance Institutions
(MFIs), which deliver the credit upto Rs.1
lakh, for various micro enterprise
activities. Although, the mode of delivery
may be through groups like SHGs/JLGs,
the loans are given to the individuals for
specific income generating micro
enterprise activity. The MFIs for availing
financial support need to enroll with
MUDRA by complying to some of the
requirements as notified by MUDRA,
from time to time.
B. Refinance Schemes for Banks:
Different banks like Commercial Banks,
Regional Rural Banks and Scheduled
25
Shodh-Chetana ISSN: 2454 – 1877 October –December , 2016 25
Cooperative Banks are eligible to avail of
refinance support from MUDRA for
financing micro enterprise activities. The
refinance is available for term loan and
working capital loans, upto an amount of
10 lakh per unit. The
eligible banks, which have enrolled with
MUDRA by complying with the
requirements as notified, can avail of
refinance from MUDRA for the loan
issued under Shishu, Kishor and Tarun
categories.
C. Women Enterprise Programmes:
In order to encourage women
entrepreneurs the financing banks / MFIs
may consider extending additional
facilities, including interest reduction on
their loan. At present, MUDRA extends a
reduction of 25bps in its interest rates to
MFIs / NBFCs, who are providing loans to
women entrepreneurs.
D. Securitization of Loan Portfolio:
MUDRA also supports Banks / NBFCs /
MFIs for raising funds for financing micro
enterprises by participating in
securitization of their loan assets against
micro enterprise portfolio, by providing
second loss default guarantee, for credit
enhancement and also participating in
investment of Pass Through Certificate
(PTCs) either as Senior or Junior investor.
VIII. PROGRESS OF MUDRA BANK
YOJANA
The idea of MUDRA Bank is not just
based on meeting the credit and financial
needs of small enterprises. Rather than just
providing credit, it is based on the “Credit
Plus” approach under which access to
credit will be combined with various
enterprises development and welfare
related services. MUDRA Bank is
providing much needed financial access to
NCSBSs, promote growth of small
businesses, help boost the country’s GDP
and create job in the coming times.
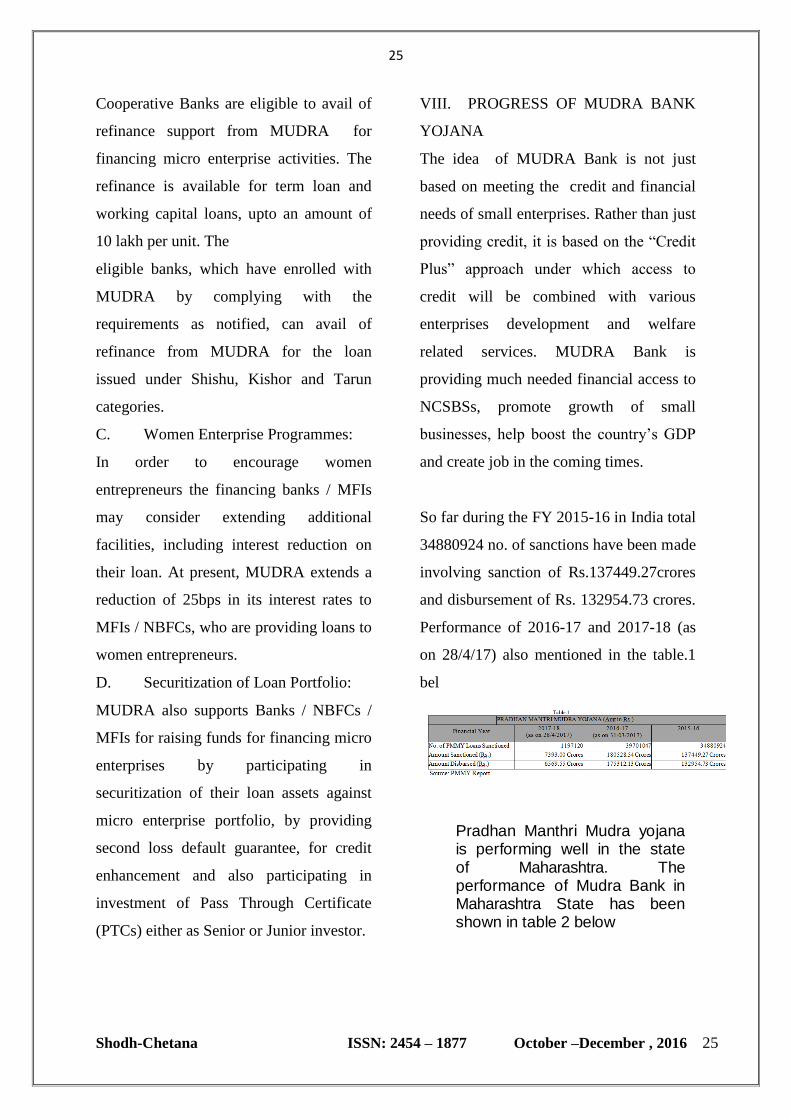
So far during the FY 2015-16 in India total
34880924 no. of sanctions have been made
involving sanction of Rs.137449.27crores
and disbursement of Rs. 132954.73 crores.
Performance of 2016-17 and 2017-18 (as
on 28/4/17) also mentioned in the table.1
bel
Pradhan Manthri Mudra yojana is performing well in the state of Maharashtra. The performance of Mudra Bank in Maharashtra State has been shown in table 2 below

26
Shodh-Chetana ISSN: 2454 – 1877 October –December , 2016 26
We can see the progress in the Mudra
yojana by comparing both FY 2015-16 and
2016-17. Above tables 2.1, 2.2, and 2.3
reveals product wise progress of mudra
yojana in Maharashtra
IX. CONCLUSION
Growth of MSMEs will contribute to the
development of ‘Make in India’ initiative.
Launching bank like MUDRA will hugely
benefit to small manufacturing units and
self-employed individuals in rural and
urban areas. PMMY scheme will
contribute to the well-being of the
individuals engaged in small scale
industries which will positively affect the
progress of the economy as a whole.
MUDRA creates a vision of formalizing
the informal and thereby funding the
unfunded. Its role as an apex refinancer,
providing low-cost finance is likely to be
its USP, thereby hoping to fill a yawning
gap in India’s microfinance space. These
measures will greatly increase the
confidence of our young educated and
skilled workers who are able to become
the first generation enterprises, and
existing small businesses will be able to
expand their activities. Just as banking the
unbanked, MUDRA banks main aim is
funding the unfunded.
REFERENCES
[1]
http://www.mudra.org.in/AboutUs/
Genesis
[2] Seema (2015). “MUDRA: Micro
Units Development & Refinance Agency”,
International Journal in Commerce, IT &
Social Sciences, Vol.2, Issue 10, pp. 23-
27.
[3] Roy, Anup Kumar(2016). “Mudra
Yojana- A Strategic tool for Small
Business Financing”, International
Jopurnal of Advance Research in
Computer Science and Management
Studies, Vol.4, Issue 1, pp 68-72.
[4] T, Avani (2016). “How the
MUDRA Bank Helps SME’s to Grow”,
International Journal of Research in
Applied, Natural and Social Sciences,
Vol.4, Issue 8, pp. 113-118.
27
Shodh-Chetana ISSN: 2454 – 1877 October –December , 2016 27
[5] http://www.mudra.org.in/Offerings
[6] Jain, Vineeth (2016). “Mudra
Bank: A Step Towards Financiail
Inclusion”, Review of Research
International Multidisciplinary Journal,
Vol.5, Issue 4, pp. 1-4
[7]
http://www.mudra.org.in/PMMYR
eport

28
Shodh-Chetana ISSN: 2454 – 1877 October –December , 2016 28
“SHODH-CHETANA”
Membership Application Form
Full Name: _________________________________________________
Address:____________________________________________________
___________________________________________________________
___________________________________________________________
E-mail ID: ______________________________ ___________________
Qualification & Designation:___________________________________
Name of the College/Institution:_________________________________
___________________________________________________________
Total Experience:_____________________________________________
Contact Mob.____________________ Land Line.__________________
D.D.No._________________ Bank: _____________________________
Date: / /
Place:_________________
Signature & Name
PHOTO
29
Shodh-Chetana ISSN: 2454 – 1877 October –December , 2016 29
Details for Research Paper / Article
1. The Paper / Article can be in English / Hindi / or any Regional Language.
2. The Paper/ Article font should be in “Times New Roman” for English and the paper
in regional language should be in pdf form.
3. The Paper / Article should be sent in CD and in Hard Copy.
4. The Research Paper / Article should be sent on the following address.
The Editor,
Shodh-Chetana,
Chetana’sHazarimalSomani College of Commerce and Economics,And
Smt. KusumtaiChaudhari College of Arts.
S.No. 341, ChetanaMahavidyalayMarg,
Near Govt. Colony,
Bandra (E), Mumbai – 400051.
5. The decision of the committee will be final and the Research Paper / Article will not
be returned.
6. All the responsibility related to the Research Paper / Article will be on the writer
alone.
7. Copyright :The author is legally responsible for complying with the copyright laws
and the laws
of privacy and libel. What follow is an outline of the relevant tasks you need to
complete before
you submit your article manuscript for production.
8. Disclaimer: The views and opinions presented in the research papers/ articles
published in Shodh-
Chetana are solely attributable to the authors of the respective contributions. If these
are
contradictory to any particular person or entity, Shodh-Chetana shall not be liable for
the present
opinions, inadequacy of the information, any mistakes or inaccuracies.
9. The Journal will be published quarterly in year.
30
Shodh-Chetana ISSN: 2454 – 1877 October –December , 2016 30
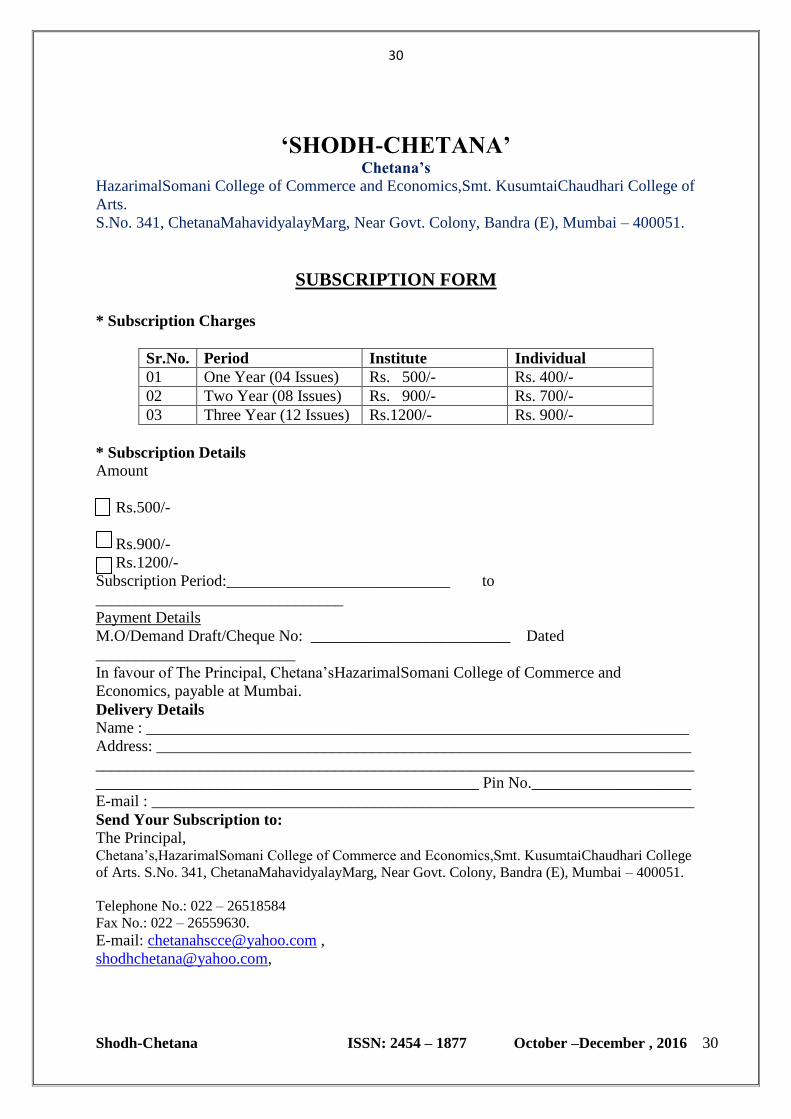
‘SHODH-CHETANA’ Chetana’s
HazarimalSomani College of Commerce and Economics,Smt. KusumtaiChaudhari College of
Arts.
S.No. 341, ChetanaMahavidyalayMarg, Near Govt. Colony, Bandra (E), Mumbai – 400051.
SUBSCRIPTION FORM
* Subscription Charges
Sr.No. Period Institute Individual
01 One Year (04 Issues) Rs. 500/- Rs. 400/-
02 Two Year (08 Issues) Rs. 900/- Rs. 700/-
03 Three Year (12 Issues) Rs.1200/- Rs. 900/-
* Subscription Details
Amount
Rs.500/-
Rs.900/-
Rs.1200/-
Subscription Period:____________________________ to
_______________________________
Payment Details
M.O/Demand Draft/Cheque No: _________________________ Dated
_________________________
In favour of The Principal, Chetana’sHazarimalSomani College of Commerce and
Economics, payable at Mumbai.
Delivery Details
Name : ____________________________________________________________________
Address: ___________________________________________________________________
___________________________________________________________________________
________________________________________________ Pin No.____________________
E-mail : ____________________________________________________________________
Send Your Subscription to:
The Principal, Chetana’s,HazarimalSomani College of Commerce and Economics,Smt. KusumtaiChaudhari College
of Arts. S.No. 341, ChetanaMahavidyalayMarg, Near Govt. Colony, Bandra (E), Mumbai – 400051.
Telephone No.: 022 – 26518584
Fax No.: 022 – 26559630.
E-mail: [email protected] ,
31
Shodh-Chetana ISSN: 2454 – 1877 October –December , 2016 31
CHETANA’S
Research Centre in Commerce and Management