vol.30 o.4 december 2015 616643 mahinda siriwardana...
TRANSCRIPT

jei Vol.30 No.4, December 2015, 616~643 Mahinda Siriwardana
http://dx.doi.org/10.11130/jei.2015.30.4.616
616
Abstract
This paper examines both the economic and environmental impacts of the two Free Trade Agreements that Australia has recently negotiated with Japan and South Korea using the Global Trade Analysis Project-Environmental general equilibrium model. We analyse two trade policy scenarios: first a Free trade scenario where bilateral tariffs are eliminated between Australia and Japan, and Australia and South Korea; second a Green trade scenario where the Free trade scenario is complemented by an environmental policy using an Emissions Trading Scheme. The results indicate that the two trade agreements enhance Australia’s trade at a modest expense to the environment. This paper illustrates that an Emissions Trading Scheme between Australia, Japan, and South Korea is an expensive policy to mitigate emissions arising from Free Trade Agreements.
JEL Classifications: F13, F15, F18, Q56Keywords: Free Trade Agreement, Australia, GTAP-E Model, Emissions, Emissions Trading Scheme
Australia’s new Free Trade Agreements with Japan and South Korea: Potential Economic and Environmental Impacts
jei Journal of Economic Integration
* Corresponding Author: Mahinda Siriwardana; UNE Business School, University of New England, Armidale, NSW 2351, Australia; Tel: +61 267732501, E-mail: [email protected].
Acknowledgements: The author acknowledges the funding under UNE seed grants program (2014) for this research. Wasanthi Thenuwara provided excellent research assistance. An earlier version of this paper was presented to the New Zealand Agricultural and Resource Economics Society (NZARE) conference held in Nelson, New Zealand, 28-29 August 2014.
ⓒ 2015-Center for Economic Integration, Sejong Institution, Sejong University, All Rights Reserved. pISSN: 1225-651X eISSN: 1976-5525
Vol.30 No.4, December 2015, 616~643http://dx.doi.org/10.11130/jei.2015.30.4.616
Mahinda Siriwardana UNE Business School, University of New England, Armidale, Australia

jeiAustralia’s new Free Trade Agreements with Japan and South Korea: Potential Economic and Environmental Impacts
617
I. Introduction
Australia has a relatively small open economy that has heavily based its economic growth on increasing exports, mostly natural resources and agricultural commodities, and foreign capital. During the last decade, the mining boom and China’s rapid economic growth rendered an unprecedented economic boost to Australia’s economic prosperity and high living standards. At the same time, Australia pursued trade policies integrating multilateral, regional, and bilateral approaches to gain market access opportunities for its exporters. Successive governments have favoured trade policies that are open to negotiating regional or bilateral trade agreements that deliver substantial benefits. Consequently, Australia has implemented World Trade Organization (WTO)-consistent Free Trade Agreements (FTAs) with many important trading partners: New Zealand, the USA, Singapore, Thailand, Chile, Association of South-East Asian Nations (ASEAN)-New Zealand, and Malaysia. The recent additions are FTAs with South Korea and Japan. FTAs, which improve market access and strengthen trade flows, are an important vehicle to improve bilateral trade relationships and enhance domestic welfare (Dixon and Rimmer 2010, p.143). These bilateral and regional trade agreements deliver substantial benefits when the parties are prepared to move faster and undertake more profound liberalisation than what is currently achievable by the WTO multilateral trading system (Lloyd and Maclaren 2004, Lloyd 2010).
The Abbott government secured the two latest free trade agreements in 2014 with Australia’s second and fourth largest trading partners-Japan and South Korea. Both Japan and South Korea are significant destinations for Australia’s national resource exports such as coal, iron ores, and copper ores in addition to a range of agricultural goods. In return, Australia receives a significant proportion of its manufactured imports from both countries. Given the obvious trade complementarities, trade economists and policy makers envisage significant gains to Australia from these FTAs.
While economic returns from such trade treaties could be quantified to justify their efficacy and viability, there are perhaps important environmental considerations that need to be addressed. One such issue is increased trade in emissions-intensive goods resulting in elevated levels of greenhouse gas emissions due to these preferential trade agreements. Despite the apparent relationship between trade liberalisation and environmental degradation, there has been limited analysis to address the environmental impact of FTAs generally at global level and particularly in Australia. Cebon (2003) has
jei Vol.30 No.4, December 2015, 616~643 Mahinda Siriwardana
http://dx.doi.org/10.11130/jei.2015.30.4.616
618
examined the ways in which the environment can be affected by policies that increase exports in agricultural commodities. He asserts that the bulk of Australia’s environmental problems such as salinity, water overuse, land clearing and biodiversity loss, water and soil pollution, and greenhouse gas emissions are due to the overexploitation of land and extreme agricultural practices. Extra pressure placed on demand for energy sources to meet export targets also contributes to Australia’s energy-related emissions. Cebon (2003) criticises the apparent lack of environmental considerations in economic modelling carried out by different commissioned agencies prior to implementing previous FTAs such as the Australia-US agreement.
In this paper we examine both economic and environmental impacts of the two new Australian FTAs (with South Korea and Japan) using the multi-sector, multi-country Computable General Equilibrium (CGE) modelling approach. In particular we use the Global Trade Analysis Project-Environmental (GTAP-E) model which has a detailed specification of energy substitution possibilities and explicit carbon emissions accounting in addition to detailed trade flows. The analysis reported in the paper is based on the GTAP-E version 8.1 database. We consider two trade policy scenarios: the first is the free trade scenario where bilateral tariffs are eliminated between Australia and Japan and Australia and South Korea; the second is the green trade scenario where the free trade scenario is in place, but complements it by adding an environmental policy through an Emissions Trading Scheme (ETS) between Australia, Japan, and South Korea to reduce the environmental impact. The results indicate that the two trade agreements enhance Australia’s trade at a modest expense to the environment. The paper illustrates that FTAs complemented by an ETS could mitigate emissions arising from increased economic activity due to increased trade. However, it is achieved with a substantial economic cost to all parties.
The paper is organised as follows. Section II gives an overview of Australia’s approach to preferential trade agreements. In Section III, bilateral trade between Australia and Japan, and South Korea are analysed in the context of Australia’s world trade. The section also emphasises trade in emissions-intensive goods with these two trading partners. In Section IV, we outline the GTAP-E model used in the analysis. Policy designs for simulations are in Section V. Section VI presents the results of two policy simulations. Finally, Section VII concludes.
jeiAustralia’s new Free Trade Agreements with Japan and South Korea: Potential Economic and Environmental Impacts
619
II. Australian Trade Policy on Free Trade Agreements
During the last two decades, there has been a world-wide proliferation of Regional Trading Arrangements (RTAs) which has resulted in numerous trade agreements. It is estimated that more than half of the world trade now takes place within RTAs. Australia’s commitments to a liberalised trade policy have been closely aligned with the non-discriminatory global trading system promoted by the WTO. Similar to its Asia-Pacific neighbours, Australia also undertook its own unilateral reforms after the 1980s and supported the creation of Asia-Pacific Economic Cooperation (APEC) and its initiatives. However, slow progress in the multilateral system especially after the WTO meetings in Seattle and Doha, the lack of consensus amongst APEC members, and the rapid progress of RTAs in Asia prompted Australia to move in the direction of bilateralism as it did in the recent past.
Australia’s involvement in bilateral trade agreements goes back to 1983 when the Australia-New Zealand Closer Economic Relations Agreement (CERA) was negotiated. The CERA has become one of the most successful FTAs and it has contributed to a phenomenal growth in trade between the two countries since its inception. The agreement is also regarded as perhaps the only preferential trade treaty which included trade in all goods and services except a very narrow negative list (Armstrong 2012). Consequently, Australia has become New Zealand’s number one trading partner while New Zealand is now Australia’s sixth most important trading partner.
After a period of strong support for multilateralism, Australia’s trade policy took a significant turn towards bilateral FTAs. This resulted in a series of preferential trade agreements between Australia and some of its most important trading partners. Australia successfully negotiated an FTA with Singapore in 2003 (Sen 2004). It came into effect in the second half of that year. Australia also signed an FTA with Thailand which became operational in January 2005 (CIE 2004, Siriwardana 2006).
Australia’s commitments to bilateralism became rather prominent with the negotiation of the Australia-United States FTA which came into effect in 2005. At the time of signing the agreement, the US was Australia’s second largest trading partner. Under the FTA, 86% of bilateral trade was supposed to be traded tax-free and it was envisaged that every bilaterally-traded commodity would achieve tax-free status except sugar and dairy products by 2022 (Siriwardana 2007). While Australia gained access to the wider US agricultural market under the FTA, the most significant breakthrough

jei Vol.30 No.4, December 2015, 616~643 Mahinda Siriwardana
http://dx.doi.org/10.11130/jei.2015.30.4.616
620
was the market for Australian lamb, reducing the market share enjoyed by New Zealand (Armstrong 2012). The most recent FTAs that Australia has implemented are with Chile (2009), with ASEAN and New Zealand (2010), with Malaysia (2012) with South Korea (2014), and with Japan (2015). The nine agreements thus far under operation account for 42% of Australia’s total trade (DFAT 2014).
Table 1. Australia’s top 10 trading partners (2013 A$ million)
Goods ServicesTotal Share
(%) Exports Imports Exports Imports
China 94,709 47,250 6,881 2,079 150,919 23.3
Japan 47,541 18,914 1,991 2,307 70,753 10.9
United States 9,582 26,751 5,951 12,430 54,714 8.4
South Korea 19,599 10,167 1,675 646 32,087 5.0
Singapore 5,660 12,935 3,549 4,943 27,087 4.2
New Zealand 7,396 7,401 3,626 3,131 21,554 3.3
United Kingdom 3,859 6,196 3,982 5,848 19,885 3.1
Thailand 4,910 11,393 804 2,439 19,546 3.0
Malaysia 5,281 9,480 1,664 1,464 17,889 2.8
Germany 1,929 11,434 1,094 1,665 16,122 2.5
Total two-way trade (with top 10) 200,466 161,921 31,217 36,952 430,556 66.5
Total two-way trade (with all economies) 261,993 241,156 56,546 88,128 647,823
(Source) Australian Government, Department of Foreign Affairs and Trade (DFAT).
Australia’s most recently implemented two FTAs with Japan and South Korea will account for 11 and 5% of Australia’s total trade, respectively. Once these two agreements come into effect, Australia will have 42% of its total trade covered by regional trading arrangements. After prolonged negotiations Australia also signed its tenth FTA with China in June 2015 and though its implementation date yet to be determined. In addition Australia is currently pursuing six more FTAs-two bilateral FTA negotiations with India and Indonesia; and four plurilateral FTA negotiations under the Trans-Pacific Partnership Agreement (TPP), the Gulf Cooperation Council (GCC), the Pacific Trade
jeiAustralia’s new Free Trade Agreements with Japan and South Korea: Potential Economic and Environmental Impacts
621
and Economic Agreement (PACER Plus), and the Regional Comprehensive Economic Partnership Agreement (RCEP). The countries included in these new FTA initiatives account for a further 6% of Australia’s total trade (DFAT 2014).
III. Australia’s Trade with the World
Australia is relatively a small player in terms of its contribution to world trade as it accounts for 1.5% of world exports and 1.3% of imports. Nevertheless, Australia’s integration with the world economy is growing and remains strong. Table 1 shows Australia’s ten largest trading partners and China ranks number one among them. These countries account for 66.5% of Australia’s total trade. Japan, which occupied the top position for decades, has slipped to second followed by the US. It is important to note that Asian trading partners that are within the top ten account for nearly 50% of Australia’s trade and five of them (Singapore, Thailand, Malaysia, South Korea, and Japan) have implemented FTAs with Australia successfully over the last decade. Since Australia has now FTAs with Japan and South Korea in operation, China remains the next largest trading partner in Asia that Australia will implement its tenth FTA in the near future.
Figure 1 shows the bilateral trade between Australia and Japan from 1980 to 2013. Over this 33-year period, a substantial growth in trade appears to have taken place due to the following trends. Exports of merchandise to Japan have increased rapidly from 2000 onwards whereas imports of merchandise from Japan have shown a gradual growth. Consequently, Australia’s merchandise trade balance with Japan has experienced a significant surplus since 2000 and it has shown a sharp upward trend in recent years.

jei Vol.30 No.4, December 2015, 616~643 Mahinda Siriwardana
http://dx.doi.org/10.11130/jei.2015.30.4.616
622
Figure 1. Merchandize trade with Japan
0
10000
20000
1980
~198
1
1982
~198
3
1984
~198
5
1986
~198
7
1988
~198
9
1990
~199
1
1992
~199
3
1994
~199
5
1996
~199
7
1998
~199
9
2000
~200
1
2002
~200
3
2004
~200
5
2006
~200
7
2008
~200
9
2010
~201
1
2012
~201
3
30000
40000
50000
60000
A$
mill
ion
Financial year
Exports Imports Trade Balance
(Note) Excludes exports of selected confidential commodity items from June 2013.(Source) Australian Government, Department of Foreign Affairs and Trade.
The importance of South Korea as a trading partner to Australia has also accelerated since 2000 according to Figure 2. Exports grew rapidly over the period under consideration while imports display a gradual upward trend. Australia has maintained a steady trade surplus with South Korea throughout the period, 1980~2013, which shows a sudden increase since 2006. This is a clear evidence of a growing bilateral trade relationship between these two countries that provides a promising foundation for an FTA.

jeiAustralia’s new Free Trade Agreements with Japan and South Korea: Potential Economic and Environmental Impacts
623
Figure 2. Merchandize trade with South Korea
1980
~198
1
1982
~198
3
1984
~198
5
1986
~198
7
1988
~198
9
1990
~199
1
1992
~199
3
1994
~199
5
1996
~199
7
1998
~199
9
2000
~200
1
2002
~200
3
2004
~200
5
2006
~200
7
2008
~200
9
2010
~201
1
2012
~201
3
Exports Imports Trade Balance
0
5000
10000
15000
20000
25000
30000
A$
mill
ion
Financial year
(Note) Excludes exports of selected confidential commodity items from June 2013.
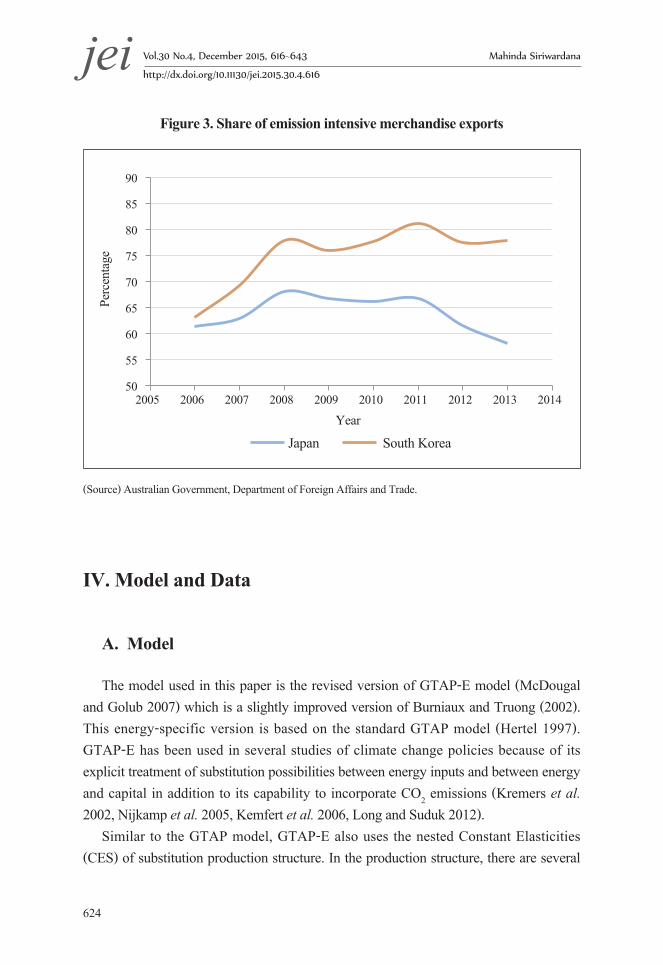
Figure 3 displays the trend in Australian exports of emissions-intensive goods to Japan and South Korea. How much new emissions would be created by the two new FTAs largely depend on the composition of current exports. Figure 3 indicates that South Korea imports more emissions-intensive goods from Australia than Japan. It appears that nearly 80% of the exports that go to South Korea are emissions intensive whereas to Japan it is about 65% until 2011 and the share is falling.
jei Vol.30 No.4, December 2015, 616~643 Mahinda Siriwardana
http://dx.doi.org/10.11130/jei.2015.30.4.616
624
Figure 3. Share of emission intensive merchandise exports
50
55
60
65
70
75
80
85
90
2005 2006 2007 2008 2009 2010 2011 2012 2013 2014
Perc
enta
ge
Year
Japan South Korea
(Source) Australian Government, Department of Foreign Affairs and Trade.
IV. Model and Data
A. Model
The model used in this paper is the revised version of GTAP-E model (McDougal and Golub 2007) which is a slightly improved version of Burniaux and Truong (2002). This energy-specific version is based on the standard GTAP model (Hertel 1997). GTAP-E has been used in several studies of climate change policies because of its explicit treatment of substitution possibilities between energy inputs and between energy and capital in addition to its capability to incorporate CO2 emissions (Kremers et al. 2002, Nijkamp et al. 2005, Kemfert et al. 2006, Long and Suduk 2012).
Similar to the GTAP model, GTAP-E also uses the nested Constant Elasticities (CES) of substitution production structure. In the production structure, there are several

jeiAustralia’s new Free Trade Agreements with Japan and South Korea: Potential Economic and Environmental Impacts
625
sub-nests and each of them allows the potential for substitution between individual or composite inputs. Each composite input is a combination of commodities (inputs) at the next lower level in the tree structure, as shown in Figure 4. At the top level of the production structure, firms produce outputs by combining non-energy intermediate inputs and primary factor composite or value added. The elasticity of substitution is assumed to be equal to zero (Leontief assumption) at this level of substitution between value-added composite and non-energy intermediates. The primary factor composite is a combination of skilled labour, unskilled labour, land, natural resources, and capita-energy composite with a CES substitution between them.
Figure 4. Structure of production in GTAP-E
Output Value Added Intermediate Inputs
(non-energy) Land Skilled Unskilled Natural Capital -Energy Labour Labour Resources Composite Energy Capital
Non-Electricity Electricity Non-Coal Coal Oil Gas Petroleum Products
jei Vol.30 No.4, December 2015, 616~643 Mahinda Siriwardana
http://dx.doi.org/10.11130/jei.2015.30.4.616
626
Unlike in the standard GTAP specification, the production (input) structure further branches out within the capital-energy composite giving three inter-fuel substitution possibilities. They are (i) electricity versus non-electricity composite; (ii) coal versus non-coal composite; and (iii) between oil, gas, and petroleum products. All three are modelled with CES substitution possibilities. This structure allows us to capture relative price effects when one input becomes more expensive relative to the other. For example, producers can substitute coal for non-coal energy (a composite of oil, gas, and petroleum products), when coal becomes more expensive than non-coal energy. Similarly, if the capital rental price rises relative to the aggregate energy price, firms may substitute energy composite for capital.
B. Data
The database for the simulations is taken from GTAP-E version 8.1. It also contains most up to date emissions data disaggregated by fuel types. The base year for GTAP-E database is 2007 and we have adopted the parameter files that come with the model database. Given the purpose of our analysis, we have aggregated 57 sectors in the database into 20 sectors. Similarly, 134 regions are aggregated into 11 regions, with special reference to Australia’s major trading partners. Table A1 in the appendix shows the sectoral and regional aggregation used in the paper.
V. Policy Simulation Scenarios
A. Free trade scenario
When the two FTAs with Japan and South Korea are implemented, a number of changes are expected to occur in all three economies as bilateral tariffs on imports from each other are abolished. With the elimination of tariffs, prices of imports sourced from Japan and South Korea are expected to fall in Australia by approximately the amount of such import duties currently in place. Similarly, Japan and South Korea will experience lower prices for goods imported from Australia. These changes in prices will result in

jeiAustralia’s new Free Trade Agreements with Japan and South Korea: Potential Economic and Environmental Impacts
627
relative price shifts that may induce resource reallocations. In the free trade scenario simulated with GTAP-E, Australia, Japan, and South Korea are supposed to cut bilateral tariffs to zero while tariffs imposed on imports sourced from all other trading partners to Australia as well as to Japan and South Korea remain unchanged. This implies preferential trading arrangements occur under FTAs and discrimination against non-FTA countries exists.
Table 2 contains the bilateral tariff rates on merchandise trade of Australia, Japan, and South Korea that are estimated from the GTAP-E database. Australia already has below 5% tariffs on most of the commodities imported from Japan and South Korea except for textile & leather, metal products, and motor vehicles & parts. Japan and South Korea also maintain fairly liberalised trade regimes with Australia except in agricultural goods according to the tariff data in Table 2. In both countries food, and agriculture, forestry & fishing are highly protected. Moreover, South Korea seems to have maintained somewhat higher tariffs than Japan on mineral products, metal products, motor vehicles & parts, and other manufacturing.
In order to analyse the impact of tariff-free merchandise trade under FTAs, tariff rates in Table 2 are reduced to zero in the GTAP-E simulation. The model also allows different closures about factor markets and the macroeconomic environment. The tariff simulations are conducted within the long-run framework of GTAP-E. Rates of returns are equalised across regions, while capital mobility takes place. Investment occurs in each region during the tariff removal with the effect that regional investment matches changes in global savings. The aggregate employment is fixed and the real wage adjusts in response to tariff cuts.

jei Vol.30 No.4, December 2015, 616~643 Mahinda Siriwardana
http://dx.doi.org/10.11130/jei.2015.30.4.616
628
Table 2. Barriers to bilateral merchandise trade (%)
Australian tariffs on imports from
Japanese tariffs on imports from
Australia
South Korean tariffs on imports
from AustraliaJapan South KoreaAgriculture, forestry & fishing 0.4 2.1 13.9 8.3Coal 0.0 0.0 0.0 0.0Crude oil 0.0 0.0 0.0 3.0Natural gas 0.0 0.0 0.0 2.9Other minerals 0.2 0.0 0.0 0.1Food 1.5 2.0 34.4 39.9Textile & leather 6.0 6.2 5.2 4.9Wood, paper products 4.1 3.7 0.1 2.3Oil products 0.0 0.0 0.1 3.4Chemical, rubber, plastics 4.1 3.8 1.8 4.3Mineral products 3.2 5.0 1.1 7.3Ferrous metals 4.5 2.9 4.1 0.3Metals not elsewhere counted 0.2 1.4 0.2 2.1Metal products 5.9 5.5 0.6 6.5Motor vehicles & parts 12.5 14.4 0.1 7.0Electronic equipment 1.5 1.4 0.0 2.1Other manufacturing 3.1 4.2 0.5 5.8Electricity 0.0 0.0 0.0 0.0Transport services 0.0 0.0 0.0 0.0Other services 0.0 0.0 0.0 0.0
(Source) GTAP-E database.
B. Green trade scenario
When there are no explicit policy measures to safeguard the environment from negative externalities such as greenhouse gases arising from preferential trade treaties, economic returns alone do not provide the true impact of such trade agreements. The externality, i.e., greenhouse gas emissions, is a social cost that needs to be taken into

jeiAustralia’s new Free Trade Agreements with Japan and South Korea: Potential Economic and Environmental Impacts
629
consideration in examining the true effects of FTAs. Hence it is necessary to consider an environmental policy along with trade policy that may mitigate emissions arising from the expansion of economic activity caused by the trade policy. The GTAP-E model has the capacity to handle such environmental policies using a carbon tax or an ETS. Hence we define our green trade scenario where the free trade scenario in place, but is complemented by adding an environmental policy through an ETS between Australia, Japan, and South Korea. In setting the emissions targets for three countries, we use Cancun agreement of emissions reductions for Australia and Japan, and the South Korean government policy announcements for South Korea to reduce emissions along with GTAP-E emissions data (2007). The emissions constraints imposed on the model simulations are shown in Table 3.
Table 3. Reductions in CO2 emissions (from 2007 levels)
Region Cancun CO2 Targets for 2020 relative to 2000
Required Change in CO2 from 2007 levels(ii)
Australia -5% -14.5%
United States -16% -13.6%
EU15 -12% -7.9%
EU12 -12% -11.8%
Japan -33% -30.6%
RoA1 -10% -9.7%
South Korea(i) -30% -30.0%
(Notes) (i) South Korea does not belong to Annex 1. Hence the target is based on South Korean government policy.
(ii) Author’s own estimates based on GTAP-E emissions data.

jei Vol.30 No.4, December 2015, 616~643 Mahinda Siriwardana
http://dx.doi.org/10.11130/jei.2015.30.4.616
630
VI. Results
As outlined in the previous section, two trade policy scenarios were simulated using the GTAP-E model and its database. On the basis of the results, this section assesses the potential outcomes of Australia’s two new FTAs with Japan and South Korea in terms of their economic and the environmental impacts. When bilateral tariffs are eliminated, relative prices change and in response, trade flows between countries change which eventually impact the resource allocations in the economy. It is expected that different sectors in the economy adjust their outputs according to relative price shifts which may spur changes in greenhouse gas emissions levels. Reported in this section are the important environmental and macroeconomic effects, welfare outcomes, and industry output effects.

jeiAustralia’s new Free Trade Agreements with Japan and South Korea: Potential Economic and Environmental Impacts
631
Table 4. Macroeconomic impacts of trade scenarios
(percentage change)
Free Trade Scenario (FTAs Only)
Green Trade Scenario(FTAs + ETS)
Real GDPAustralia 0.24 -3.69
Japan 0.09 -2.43South Korea 0.25 -3.52
Real ExportsAustralia 2.65 -1.00
Japan 0.65 -0.02South Korea 0.72 -0.01
Real Imports Australia 3.75 -1.04
Japan 0.79 0.05South Korea 0.71 0.04
Consumer Price Index Australia 1.02 1.68
Japan -0.00 1.32South Korea -0.21 1.40
Terms of Trade Australia 1.19 1.88
Japan 0.05 1.19South Korea -0.07 1.16
A. Free trade scenario
We can first consider the macroeconomic projections reported in Table 4. According to the projections shown in column 2, all three countries experience an increase in real GDP; Australia and South Korea improve their real GDP in similar magnitudes whereas the relatively larger Japanese economy grows by a modest margin (0.09%). A reduction in import prices due to tariff elimination induces demand for imports in all three countries; however, Australia records the highest growth in imports. The cheaper imports
jei Vol.30 No.4, December 2015, 616~643 Mahinda Siriwardana
http://dx.doi.org/10.11130/jei.2015.30.4.616
632
serve to lower the prices of intermediate inputs causing higher profits to producers. This in turn stimulates the economy which results in a real growth in GDP.
Free access to Japanese and South Korean markets, especially for agricultural goods and food, gives Australia’s exports a considerable boost amounting to 3.75%. The reduction in costs arising from the tariff elimination for imports sourced from Australia to Japan and South Korea are quite significant and its impact is reflected in a decline of Consumer Price Index (CPI) in both countries. This in turn stimulates their overall exports where Japan’s exports grow by 0.79% and South Korea’s by 0.71%. However in the case of Australia, the story is different. Australia is already a low-tariff economy and hence tariff cuts do not bring its CPI down. Instead it shows a 1% rise in the CPI, which is counter-intuitive in the face of tariff elimination. The increase in price level in Australia is explained by rising real wages and rent on land as it can be seen from Table 5. Australia also reports a significant gain in the terms of trade, which in turn strengthens its import capacity under these two FTAs.
Table 5 includes a number of measures to gauge the welfare impact of the two trade agreements. The most important measures are Equivalent Variation (EV) and real household consumption. Australia is reported to have the highest welfare gain in terms of both; EV is projected to be 3,652 US dollar millions accompanied by 0.42% growth in real household consumption. These measures show equally good outcomes in the welfare for Japan and South Korea relative to the size of these two economies, shown in column 2 in Table 5. The gain in welfare for all three countries is an indication that the benefits from trade creation outweigh the cost arising from trade diversion.
The welfare outcomes of the three economies can also be seen through what happens to real wages and land rent. Real wages for skilled and unskilled labour increase in all three countries as shown by the projections in column 2 of Table 5; however, Japan falls behind Australia and South Korea in terms of percentage growth in wages. It is worth highlighting that unskilled labour in Australia reports the highest wage growth among the three countries. This is explained by the phenomenal growth projected in the agricultural and food industries in Australia when Japan and South Korea give free market access to agricultural and food imports. The growth potential for the agricultural sector is further highlighted by a substantial increase in land rent, mainly agricultural land, in Australia. Contrary to what happens in Australia, the cheaper agricultural and food imports to Japan and Korea drive down the land rent in those two economies. This is a quite natural outcome when both countries allow Australian exporters to access their markets without any tariff barriers. This is in fact one of the key reasons why Japan resisted an FTA with

jeiAustralia’s new Free Trade Agreements with Japan and South Korea: Potential Economic and Environmental Impacts
633
Australia for such a long period of time with prolonged negotiations.
Table 5. Impact on welfare of trade scenarios (percentage change)
Free Trade Scenario (FTAs Only)
Green Trade Scenario(FTAs + ETS)
Real Household ConsumptionAustralia 0.42 -2.16
Japan 0.10 -1.16South Korea 0.30 -1.13
Real Wage (Skilled Labour)Australia 0.36 -0.56
Japan 0.20 0.02South Korea 0.45 0.03
Real Wage (Unskilled Labour)Australia 0.60 -0.49
Japan 0.19 0.02South Korea 0.45 0.03
Land Rent Australia 31.90 1.23
Japan -2.80 0.00South Korea -2.58 0.02
Welfare–Equivalent Variation (US$ million) Australia 3,652 -1,789
Japan 3,175 737South Korea 1,580 249
We now turn to the environmental impact of the two trade treaties under the free trade scenario. As noted earlier, we assume in this simulation that there is no policy to safeguard the environment. In other words, improved economic activity with bilateral free trade may have a negative impact on the environment. GTAP-E allows us to quantify this impact via growth in the emissions of respective trading partners. Column 2 of Table 6 reports the projections of CO2 emissions in absolute terms as well as in growth rates. The two FTAs tend to increase global emissions by nearly three Million

jei Vol.30 No.4, December 2015, 616~643 Mahinda Siriwardana
http://dx.doi.org/10.11130/jei.2015.30.4.616
634
Tonnes; the highest contribution comes from South Korea (1.48 Mt.) followed by Japan (1.29 Mt.) and Australia (0.15 Mt.). The respective growth rates of CO2 are relative to the 2007 emissions base in GTAP-E and both South Korea and Japan show higher growth than Australia.
Surprisingly, the increase in emissions in Australia is quite modest, 0.15 Mt. or 0.04% growth. There are two reasons for this low increase in emissions in Australia. First, the highly emissions-intensive exports such as coal which account for the bulk of exports from Australia to Japan and South Korea already have free market access, i.e., the import tax is zero. Hence a sudden surge of coal exports to Japan and South Korea once the FTAs are in operation is unlikely. Second, potentially high growth exports of agricultural and food products are not emissions intensive and may not add an undue burden.

jeiAustralia’s new Free Trade Agreements with Japan and South Korea: Potential Economic and Environmental Impacts
635
Table 6. Environmental impacts of trade scenarios (percentage change)
Free Trade Scenario (FTAs Only)
Green Trade Scenario(FTAs + ETS)
Target Emissions Cut (%)Australia - -14.50
Japan - -30.60South Korea - -30.00
Target Emissions Cut (Mt.)Australia - -55.27
Japan - -327.85South Korea - -126.87
Change in total CO2 (Mt.)Australia 0.15 -151.61
Japan 1.29 -238.60South Korea 1.48 -119.76
Percentage Change in total CO2 Australia 0.04 -39.77
Japan 0.12 -22.27South Korea 0.35 -28.32
CO2 Permit Price (US$ per ton.)Australia - 59.90
Japan - 59.90South Korea - 59.90
Net Seller (NS) or Net Buyer (NB) of permits (Mt.)
Australia - 96.36 (NS)Japan - 89.25 (NB)
South Korea - 7.11 (NB)
(Note) Mt. is an abbreviation of million tonnes.
The sectoral output changes arising from bilateral free trade between Australia and Japan, and Australia and South Korea are reported in Table 7. For Australia, a phenomenal growth in the food, and agriculture, forestry & fishing sectors are projected.

jei Vol.30 No.4, December 2015, 616~643 Mahinda Siriwardana
http://dx.doi.org/10.11130/jei.2015.30.4.616
636
These sectors receive duty-free access into Japanese and South Korean markets with the elimination of existing high tariffs. Moderate output gains to the crude oil and oil products sectors are also attributable to the zero import duties they enjoy under free trade. Except in the two services, the reaming sectors in Australia appear to have lost outputs; the highest loss in output is projected to be in the motor vehicles & parts sector. While the intensified import competition, particularly in manufactured goods, in the domestic market is responsible for a decline in many sectors, competition for resources from the agricultural, food, and resource sectors possibly plays a part in this structural adjustment within the Australian economy.
In contrast, food and agriculture, forestry & fishing are the significant losers in Japan and South Korea. With protection against imports from Australia for these goods now abolished, producers in these sectors face severe import competition domestically. It is also clear that an FTA with Australia brings a mild negative impact on the Japanese natural gas sector. Almost all other sectors in Japan appear to be winners from the free trade deal even though the gains for some sectors are quite small. Overall, South Korea emerges as a significant winner from bilateral free trade since all sectors but agricultural and food are reported to experience positive output gains.
B. Green trade scenario
The free trade scenario examined in the previous section reveals that the two trade agreements, when fully implemented, may have a negative impact on the environment as the model projections show an increase in emissions in all three countries as it can be seen from Table 6. Japan and South Korea contribute more to these trade-induced emissions as they are fossil fuel dependent for energy and Australia is a major supplier of coal and other resources to both. It is therefore appropriate to consider policies to safeguard the environment when the FTAs are fully implemented.

jeiAustralia’s new Free Trade Agreements with Japan and South Korea: Potential Economic and Environmental Impacts
637
Table 7. Output changes under Free Trade Agreements and Emissions Trading Scheme
(percentage change)
Australia Japan South KoreaFTAs FTAs
+ETS FTAs FTAs
+ETS FTAs FTAs
+ETS Agriculture, forestry & fishing 5.64 4.53 -0.59 -2.31 -0.42 -1.90
Coal -1.74 -28.42 1.08 -36.09 0.73 -37.56
Crude oil 0.33 -4.87 0.99 -5.55 1.04 -12.45
Natural gas -3.81 -24.91 -0.08 -14.66 0.44 -65.67
Other minerals -2.23 -16.48 0.13 -3.94 0.40 -6.70
Food 16.37 14.30 -1.09 -3.06 -1.68 -4.11
Textile & leather -3.34 -3.19 0.08 -2.06 0.94 -7.95
Wood, paper products -0.54 -3.22 -0.01 -3.54 0.31 -5.16
Oil products 0.34 -15.48 0.13 -9.18 0.34 -7.66
Chemical, rubber, plastics -1.95 -5.59 0.06 -5.22 0.43 -6.32
Mineral products -0.31 -5.12 0.09 -4.76 0.36 -7.20
Ferrous metals -3.95 -9.70 0.41 -6.19 0.54 -8.86
Metals not elsewhere counted -4.92 -42.39 0.09 -4.41 0.55 -2.67
Metal products -1.14 -4.46 0.11 -3.46 0.40 -5.34
Motor vehicles & parts -6.66 -7.58 0.97 -2.57 0.92 -4.75
Electronic equipment -3.63 -4.00 -0.13 -3.96 0.23 -3.54
Other manufacturing -1.41 -4.02 0.01 -3.53 0.35 -4.23
Electricity -0.55 -32.33 0.16 -11.94 0.47 -18.32
Transport services 0.07 -4.79 0.05 -3.01 0.16 -4.73
Other services 0.15 -2.70 0.08 -2.41 0.21 -3.31
The current debate on emissions reduction policies in Japan and South Korea has promoted emissions trading domestically as well as internationally. Sooner or later, Australia may be inclined to follow suit. In view of this, we introduced an ETS between Australia, Japan, and South Korea to complement the free trade policy. Table 3 displays the emissions reduction targets (cap) imposed on the basis of 2007 emissions levels of all Annex 1 countries shown in column 3. South Korea does not belong to the Annex 1 group and its target of emissions cut was chosen according to its proposed government

jei Vol.30 No.4, December 2015, 616~643 Mahinda Siriwardana
http://dx.doi.org/10.11130/jei.2015.30.4.616
638
policy. Macroeconomic projections of the Green Trade Scenario are reported in column 3
of Table 4. It is apparent from the results that the ETS has a significant negative impact on real GDP in all three countries. The scheme is inflationary as indicated by the CPI projections and there is a loss of competitiveness which reduces Australia’s exports and imports by one percent. In Japan and South Korea, exports are also likely to be reduced; however imports appear to experience a rather modest increase with the environmental policy in place. The reduced exports result in an improvement in the terms of trade for all.
Column 3 of Table 5 shows welfare-related projections. For Australia, projections for both EV and real household consumption reveal a larger negative impact on welfare. Japan and South Korea experience lower EV levels along with reduced real household consumption compared to the free trade scenario. While the real wages for skilled and unskilled labour, and rent on land in Australia are severely affected by the emissions reduction through an ETS, Japan and South Korea experience hardly any change in these factor prices. This outcome can be explained by looking at the reduction in exports in all three countries. Australian exports that gained momentum under free trade, mainly in agricultural and food products, are retarded to a greater extent with the introduction of an ETS with its two of the main trading partners who now find importing from Australia rather expensive. All in all, the alternative welfare projections reported in Table 5 indicate that Australia is more negatively affected by the ETS than Japan and South Korea.
Column 3 of Table 6 summarises the environmental implications of the joint impact of the ETS and FTAs. To meet the targeted emissions cuts (emissions cap), the three countries are expected to engage in emissions trading according to their relative strengths in demand for and supply of permits. Naturally, potential to supply permits to the market depends on the ability of a given country to reduce their own emissions below the cap. As it can be seen from the table, the ETS is highly effective but expensive to all the participants. Australia exceeds the targeted cut of 55.27 Mt. and reaches 96.36 Mt. excess cuts, becoming a net seller of permits. On the other hand, Japan and South Korea turn out to be net buyers of permits as they are unable to reduce emissions by the targeted 327.85 Mt. and 126.87 Mt, respectively. This means that Japan ends up buying 89.25 Mt. worth of permits and Korea 7.11 Mt. worth of permits from Australian suppliers. By looking at the permit equilibrium price, 59.90 US dollars per tonne, we can shed some light on the likelihood of cost effectiveness of an ETS. At first glance, it appears that the
jeiAustralia’s new Free Trade Agreements with Japan and South Korea: Potential Economic and Environmental Impacts
639
permit price is rather high and all three countries need to bear the underlined economic cost of the scheme. For example, trade-induced GDP growth from the FTA strategy is eroded with the introduction of an ETS.
Finally, we compare the sectoral output projections in Table 7 with and without emissions trading. For Australia, as it turns out, an ETS has a severe negative impact on all the resource based sectors. Most notable are coal, natural gas, other minerals, oil products, metals, and electricity. With the exception of emissions-intensive electricity, all these sectors are both trade exposed and bear high emissions intensity generally. The carbon permit price emerging from the ETS raises the cost of production in these sectors which affects their international competitiveness. The less emissions-intensive agriculture, forestry & fishing and food sectors experience only a mild reduction in their outputs compared to the FTAs scenario. The rest of the sectors react with reduced outputs to the environmental policy in varying proportions.
Both Japan and South Korea also respond to the high permit price and all sectors show a decline in their outputs. Apparently, this is a distinct contrast to what happens under free trade. In Japan, the worst affected are coal, natural gas, oil products, ferrous metals, and electricity. A further deterioration in agriculture, forestry & fishing and food sectors is also projected. The remaining sectors decline evenly in response to the ETS proposal.
South Korea’s output response to the ETS is even more severe. Coal, crude oil, natural gas, and electricity are the hardest hit sectors in South Korea. The production of virtually every sector contracts which highlights South Korea’s reaction to the high permit price arising from participation in an ETS with Australia and Japan.
VII. Conclusion
This paper examines the impact of two free trade agreements that Australia has implemented recently with Japan and South Korea. We simulate the GTAP-E global general equilibrium model with two different scenarios, the free trade scenario and green trade scenario, to gain better understanding of to what extent bilateral tariff elimination is effective and how far the environmental impacts can be mitigated by adopting an ETS. The results indicate that all three countries will gain by removing bilateral protection of
jei Vol.30 No.4, December 2015, 616~643 Mahinda Siriwardana
http://dx.doi.org/10.11130/jei.2015.30.4.616
640
trade. The two FTAs tend to increase real Gross Domestic Product (GDP) and welfare in Australia, Japan, and South Korea at a modest cost to the environment.
For Australia, real gains are accrued through improved market access to Japan and South Korea to export more of its agricultural and food products. Some of the resource-based industries are also winners in Australia from the free trade deal. Moreover, Australia benefits from increased manufactured goods available to domestic consumers at lower prices from both countries. However, this occurs at the expense of domestic industries that experience contraction in the face of import competition. Even though free trade treaties can trigger displacement of manufacturing workers in sectors such as motor vehicles & parts, electronic equipment, and textile and leather with the competition from cheaper imports from Japan and South Korea, the benefits to the Australian economy appear far greater and may compensate sufficiently to mitigate adverse effects of such structural adjustments arising from import penetration.
Removal of bilateral tariffs is also beneficial to both Japan and South Korea as demonstrated by increased real GDP and welfare. In the absence of domestic protection, cheaper agricultural and food products from Australia make consumers better off in both markets and many industries which use raw material imported from Australia can improve their competitiveness due to reduced production cost. At the sectoral level, South Korea appears to gain more than Japan as its pre-tariff structure is more unfavourable to Australian exports than what exists in Japan.
Benefits from free trade come at a slight environmental cost to all three countries. In other words, there is a tendency to experience increased global emissions when these two free trade agreements are fully operational. Japan and South Korea appear to be contributing more to it than Australia. As promoted by Japan and South Korea recently, an ETS was implemented in our green trade scenario as a complementary environmental policy to the free trade policy. Our findings suggest that an ETS between Australia, Japan, and South Korea is an expensive solution to the problem because the permit price turns out to be fairly high. All three countries appear to lose competitive advantage due to the high permit cost and hence the ETS is not an economically viable policy proposition to mitigate increased emissions in this case.
Received 16 January 2015, Revised 16 May 2015, Accepted 13 October 2015

jeiAustralia’s new Free Trade Agreements with Japan and South Korea: Potential Economic and Environmental Impacts
641
References
Amstrong, Shiro. “Australian Trade Policy Strategy Contradictions.” The World Economy 35 (2012): 1633-1644.
Burniaux, Jean-Mark, and Truong Truong. “GTAP-E An Energy-Environmental Version of the GTAP Model.” Centre for Global Trade Analysis, Purdue University, West Lafayette, Indiana, USA GTAP Technical Paper, No.16 (2002).
Cebon, Micheal. “The Australia-US Free Trade Agreement: An Environmental Impact Assessment.” (2003) Accessed 20 July, 2014. OzProspect, www.ozprospect.org.
Centre for International Economics (CIE). “The Australia Thailand Free Trade Agreement: Economic Effects.” Centre for International Economics (CIE), Canberra (2004).
Department of Foreign Affairs and Trade (DFAT), Accessed 4 July 2014. http://www.dfat.gov.au/fta/.
Dixon, Peter B. and Maurine T. Rimmer. “Optimal Tariffs: Should Australia Cut Automotive Tariffs Unillaterally?.” Economic Record 86 (2010): 143-161.
Dong, Yang, and John Whalley. “Carbon, Trade Policy and Carbon Free Trade Areas.” The World Economy 33 (2010): 1073-1094.
Hertel, Tom W. Global Trade Analysis: Modeling and Applications. Cambridge: Cambridge University Press, 1997.
Kemfert, Claudia, Micheal Kohlhaas, , Truong Truong, and Artem Protsenko. “The Environmental and Economic Effects of Europian Emissions Trading.” Climate Policy 6 (2006): 441-455.
Kremers, Hans, Peter Nijkamp and Shunli Wang. “A Comparison of Computable General Equilibrium Models for Analizing Climate Change Policies.” Journal of Environmental Systems 28 (2002): 41-65.
Lloyd, Peter, and Donald Maclaren. “Gains and Losses from Regional Trading Arrangements: A Survey.” Economic Record 80 (2004): 445-467.
Lloyd, Peter. “Global Economic Integration.” Pacific Economic Review 15 (2010): 71-86.

jei Vol.30 No.4, December 2015, 616~643 Mahinda Siriwardana
http://dx.doi.org/10.11130/jei.2015.30.4.616
642
Long, Dinh, and Kim Suduk. “A General Equilibrium Model for Energy Policy Evaluation using GTAP-E for Vietnam” Paper presented to the 3rd IAEE Asian Conference, Kyoto, Japan, February 20-22, 2012.
McDougall, Robert, and Alla Golub. “GTAP-E: A Revised Energy Environmental Version of the GTAP Model”, GTAP Research Memorandum, No. 15 (2007).
Nijkamp, Peter, Shunli Wang and Hans Kremers. “Modeling the Impacts of International Climate Change Policies in a CGE context: The use of the GTAP-E Model.” Economic Modelling 22 (2005): 955-974.
O’Ryan, Raul, Carlos J. De Miguel, Sebastian Miller and Mauricio Pereira. “The Socioeconomic and environmental effects of free trade agreements: a dynamic CGE analysis for Chile.” Environmental and Development Economics 16 (2001): 305-327.
Sen, Rahul. Free Trade Agreements in Southeast Asia, Singapore: ISEAS, 2004.
Siriwardana, Mahinda. “Australia’s Involvement in Free Trade Agreements: An Economic Evaluation.” Global Economic Review, 35 (2006): 3-20.
Siriwardana, Mahinda. “The Australia-United States free trade agreement: An economic evaluation.” North American Journal of Economics and Finance 18 (2007): 117-133.

jeiAustralia’s new Free Trade Agreements with Japan and South Korea: Potential Economic and Environmental Impacts
643
Appendix
Table A1. Regional and commodity aggregation
Aggregated Region GTAP Region Aggregated Commodity GTAP Commodity
1. Australia (AUS)2. United States (USA)3. European Union 15 (EU15)
4. European Union 12 (EU12)
5. Japan (JPN)6. Rest of Annex 1 (RoA1)
7. Oil Exporting (EEx)
8. China (CHN)9. Korea (KOR)10. India (IND)11. Rest of World (ROW)
AustraliaUnited StatesAustria; Belgium; Denmark; Finland; France; Germany; Greece; Ireland; Italy; Luxembourg; Netherlands; Portugal; Spain; Sweden; United Kingdom
Cyprus; Czech Republic; Estonia; Hungary; Latvia; Lithuania; Malta; Poland; Slovakia; Slovenia; Bulgaria; Romania
JapanNew Zealand; Canada; Switzerland; Norway; Rest of EFTA; Croatia; Russian Federation; Rest of Former Soviet Union
Indonesia; Malaysia; Viet Nam; Mexico; Argentina; Bolivia; Colombia; Ecuador; Venezuela; Iran; Kuwait; Oman; Qatar; Saudi Arabia; United Aran Emirates; Egypt; Rest of North Africa; Nigeria; Central AfricaChinaKoreaIndiaAll other regions
1. Agriculture, forestry & fishing (AG-F-F)
2. Coal (COAL)3. Crude oil (OIL)4. Natural gas (GAS)
5. Other minerals (OMN)6. Food (FOOD)
7. Textile & leather (TEX)
8. Wood, paper products (WPP)
9. Oil products (OIL-P)10. Chemical, rubber, plastic (CRP)
11. Mineral products (NMM)12. Ferrous metals (I-S)13. Metals nec (NFM)14. Metal products (FMP)15. Motor vehicles & parts (MVN)16. Electronic equipment (ELE)17. Other manufacturing (OMF)18. Electricity (ELY)19. Transport services (TRP)
20. Other services (SER)
Paddy rice; wheat; cereal grainsnec; vegetables, fruit, nuts; oilseeds; sugar cane, sugar beet;plat-based fibers; crops nec;bovine cattle; sheep and goats,horses; animal products nec;raw milk; wool silk-warm cocoons; forestry; fishingCoalOilGas; gas manufacture and distributionMinerals necBovine cattle, sheep and goatmeat products; meat products; vegetable oils and fats; dairy products; processed rice; sugar; other food products nec; bever-ages and tobacco productsTextiles; wearing apparels; leather productsWood products; paper products, publishingPetroleum, coal productsChemical, rubber, plastic prod-uctsMineral products necFerrous metalsMetals necMetal productsMachinery and equipment necElectronic equipmentManufactures necElectricityTransport nec; water transport; air transportWater; Construction; trade; fi-nancial services nec; insurance; business nec; recreational and other services; public admin., defence, education, health; ownership of dwellings
(Source) GTAP-E version 8.1 database.