vol. xxxxiv, no. 04, october 2011 - the institution of ... and jurnal/iesl journals...vol.: xxxxiv,...
TRANSCRIPT

Printed by Karunaratne & Sons (Pvt) Ltd, Sri Lanka.
Vol. XXXXIV, No. 04, October 2011
ENGINEER JOURNAL OF THE INSTITUTION OF ENGINEERS, SRI LANKA
EDITORIAL BOARD Eng. (Prof.) A. K. W. Jayawardane Eng. Priyal De Silva Eng. W. T. R. De Silva Eng. (Prof.) K. P. P. Pathirana - Editor Transactions Eng. (Prof.) T. M. Pallewatta - Editor “ENGINEER” Eng. (Dr.) D. A. R. Dolage Eng. (Miss.) Arundathi Wimalasuriya Eng. M. L. Weerasinghe - Editor “SLEN” Eng. (Dr.) K. S. Wanniarachchi Eng. (Prof.) S. S. L. Hettiarachchi The Institution of Engineers, Sri Lanka 120/15, Wijerama Mawatha, Colombo - 00700 Sri Lanka. Telephone: 94-11-2698426, 2685490, 2699210 Fax: 94-11-2699202 E-mail: [email protected] E-mail (Publications): [email protected] Website: http://www.iesl.lk
COVER PAGE
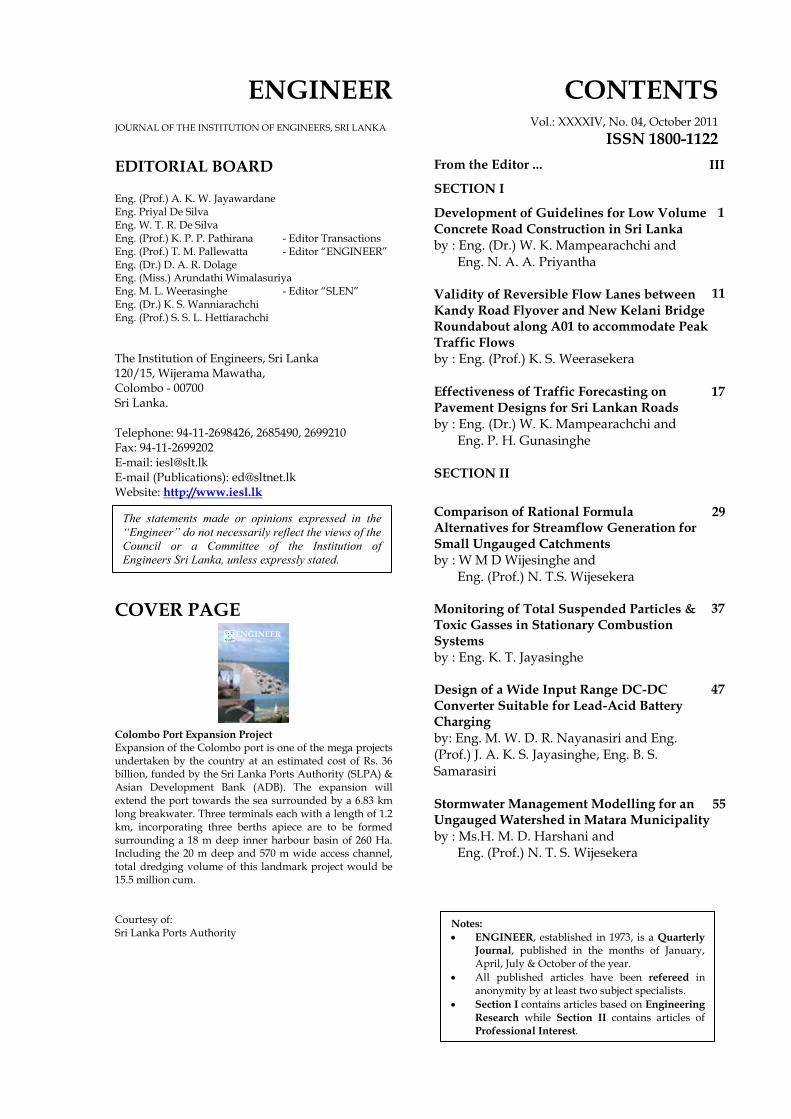
Colombo Port Expansion Project Expansion of the Colombo port is one of the mega projects undertaken by the country at an estimated cost of Rs. 36 billion, funded by the Sri Lanka Ports Authority (SLPA) & Asian Development Bank (ADB). The expansion will extend the port towards the sea surrounded by a 6.83 km long breakwater. Three terminals each with a length of 1.2 km, incorporating three berths apiece are to be formed surrounding a 18 m deep inner harbour basin of 260 Ha. Including the 20 m deep and 570 m wide access channel, total dredging volume of this landmark project would be 15.5 million cum. Courtesy of: Sri Lanka Ports Authority
CONTENTS
Vol.: XXXXIV, No. 04, October 2011 ISSN 1800-1122
From the Editor ...
SECTION I
Development of Guidelines for Low Volume Concrete Road Construction in Sri Lanka by : Eng. (Dr.) W. K. Mampearachchi and Eng. N. A. A. Priyantha
Validity of Reversible Flow Lanes between Kandy Road Flyover and New Kelani Bridge Roundabout along A01 to accommodate Peak Traffic Flows by : Eng. (Prof.) K. S. Weerasekera Effectiveness of Traffic Forecasting on Pavement Designs for Sri Lankan Roads by : Eng. (Dr.) W. K. Mampearachchi and Eng. P. H. Gunasinghe
SECTION II
Comparison of Rational Formula Alternatives for Streamflow Generation for Small Ungauged Catchments by : W M D Wijesinghe and Eng. (Prof.) N. T.S. Wijesekera Monitoring of Total Suspended Particles & Toxic Gasses in Stationary Combustion Systems by : Eng. K. T. Jayasinghe Design of a Wide Input Range DC-DC Converter Suitable for Lead-Acid Battery Charging by: Eng. M. W. D. R. Nayanasiri and Eng. (Prof.) J. A. K. S. Jayasinghe, Eng. B. S. Samarasiri Stormwater Management Modelling for an Ungauged Watershed in Matara Municipality by : Ms.H. M. D. Harshani and Eng. (Prof.) N. T. S. Wijesekera
The statements made or opinions expressed in the “Engineer” do not necessarily reflect the views of the Council or a Committee of the Institution of Engineers Sri Lanka, unless expressly stated.
Notes: ENGINEER, established in 1973, is a Quarterly
Journal, published in the months of January, April, July & October of the year.
All published articles have been refereed in anonymity by at least two subject specialists.
Section I contains articles based on Engineering Research while Section II contains articles of Professional Interest.
1
11
17
29
37
47
55
III

III
FROM THE EDITOR………….. Colombo, before becoming the capital and then the financial capital of Sri Lanka was well known throughout most part of our long history as a port, “Kolomthota”. Natural setting and geographical considerations would have prompted our ancestors in selecting this location for the said purpose. Today, Colombo is an internationally known and highly trafficked port, strategically located in close proximity to major economic sea routes. Development and expansion of the Colombo port therefore would be an imperative for the future economic development of Sri Lanka, if no other port of that stature is available to the country. With the commissioning of the vast Hambanthota port, which is situated even more closely to international sea routes, it may seem superfluous to expand Colombo port at such a trouble and cost. However, as timing is of essence in the economic race, making Colombo port with expansions fully functional, targeted for completion in April 2012 could be the expeditious path to follow. Eng. (Prof.) T. M. Pallewatta, Int. PEng (SL), C. Eng, FIE(SL), FIAE(SL) Editor, ‘ENGINEER’, Journal of The Institution of Engineers.
III III
FROM THE EDITOR………….. Colombo, before becoming the capital and then the financial capital of Sri Lanka was well known throughout most part of our long history as a port, “Kolomthota”. Natural setting and geographical considerations would have prompted our ancestors in selecting this location for the said purpose. Today, Colombo is an internationally known and highly trafficked port, strategically located in close proximity to major economic sea routes. Development and expansion of the Colombo port therefore would be an imperative for the future economic development of Sri Lanka, if no other port of that stature is available to the country. With the commissioning of the vast Hambanthota port, which is situated even more closely to international sea routes, it may seem superfluous to expand Colombo port at such a trouble and cost. However, as timing is of essence in the economic race, making Colombo port with expansions fully functional, targeted for completion in April 2012 could be the expeditious path to follow. Eng. (Prof.) T. M. Pallewatta, Int. PEng (SL), C. Eng, FIE(SL), FIAE(SL) Editor, ‘ENGINEER’, Journal of The Institution of Engineers.


section i


1 ENGINEER
ENGINEER - Vol. XXXXIV, No. 04, pp. [1-9], 2011 © The Institution of Engineers, Sri Lanka
1 ENGINEER
Development of Guidelines for Low Volume Concrete Road Construction in Sri Lanka
W. K. Mampearachchi and N. A. A. Priyantha
Abstract: The purpose of the study was to develop guidelines for construction of low volume concrete roads in Sri Lanka. A survey was carried out to study current concrete road construction practices and knowledge of the contractors involved in concrete road construction. Survey results show that good practices have not been adopted in low volume road construction in Sri Lanka. The authors have introduced best practices which can be easily adopted by the local road construction industry. Incorrect joints construction was observed in concrete roads during the site visit and the Authors have introduced a new device for contraction joint construction. A modification to the available method was proposed to measure surface undulation on local concrete pavements and allowable undulation was determined through field investigation. A comparison of various kinds of concrete producing and curing methods and their performance were studied. The authors have evaluated the effectiveness of rebound hammer method which has been used for quality control by some consultants. Rebound hammer reading was compared with compressive strength which was found out from core cutter samples. Double beam vibrator with inbuilt camber was introduced to consolidate and form the camber of the surface layer.
Check lists for subgrade /subbase, shoulder, formwork and concrete placing and finishing have been introduced to address weakness and enhance the quality of the pavement construction. Quality and Cost control techniques in the field of low volume concrete road construction in Sri Lanka are also described. Further, the proposed guideline describes the most appropriate methods for preparation of subgrade, subbase and shoulder, and mixing, placing and finishing of concrete.
1. Introduction Concrete has been used for road construction at special locations in the past in Sri Lanka. One of the oldest roads is Chaitya road (marine drive) at Colombo port which used pre tensioned, post tensioned and conventional concrete [5]. Concrete paving has been widely used for low volume roads in Sri Lanka since 2007 as the government allocated funding for local government agencies to construct concrete roads. Low volume roads are normally considered as roads with relatively low traffic volume, an Average Daily Traffic (ADT) of less than 400 vehicles per day. These roads are the tertiary links to the road network and provide access to land and properties
Concrete surfacing is considered as a cost effective road construction technique for low volume roads since concrete roads have less
maintenance cost. Currently, few roads managed by the Road Development Authority (RDA), have been constructed using concrete.
2. Cost Effectiveness of Concrete Roads
Past research and findings reveal that concrete has added advantages than the asphalt pavements. Some of the early findings have shown that concrete has been a cost effective solution.
Life Cycle Cost Analysis (LCCA) is a forward-looking decision framework that helps assess
Eng (Dr.) W. K. Mampearachchi, B.Sc. Eng. (Hons) (Moratuwa), MSCE(south Florida), PhD(Florida), CMILT (UK)., MIE(Sri Lanka), Senior Lecturer, Department of Civil Engineering, University of Moratuwa, Sri Lanka. Eng. N. A. A. Priyantha, B.Sc Eng. (Moratuwa), M.Eng(Highway and Traffic, Moratuwa), MIE(Sri Lanka), Site Engineer, Kumagai Gumi Company, STDP.
enGineeR - Vol. XXXXiV, no. 04, pp, [1-9], 2011© the institution of engineers, sri Lanka

ENGINEER 2ENGINEER 2
the lifetime costs of a roadway, rather than merely considering the initial construction costs. When LCCA is applied, concrete pavement is, in many cases, less expensive than an asphalt surface of equivalent design [1]. Concrete highways have an excellent track record as a cost-effective investment in the United States. Rigid concrete pavement outperforms flexible asphalt pavement impact on the environment. Nearly 30 percent of U.S. interstate highways are built with concrete [11].
Data from the American Concrete Pavement Association confirms that American states are truly committed to building concrete highways and create competition between the concrete and asphalt paving industries resulting in lower unit costs for both concrete and asphalt highways [8]. This results in more roads being paved for the same cost.
Extensive studies by the National Research Council of Canada[12] confirm previous findings of fuel efficiency of vehicles on concrete roads [13] showing that fully loaded tractor-trailers consume less fuel traveling on concrete pavements than on asphalt pavements over a wide temperature range.
3. Problem Statement ICTAD Standard Specifications for Construction and Maintenance of Roads and Bridges Sri Lanka [9, 10] specify some guidelines for concrete road construction. However, most of the details in the specification are related to concrete pavements which are supposed to be constructed using pavers. Still, we have not used pavers for concrete road construction in Sri Lanka and it would not be feasible for low volume roads due to poor road alignments. In the literature review, the Authors have not found any guidelines for low volume concrete road construction. We have identified the following major issues in the questionnaire survey. Neither pavement thickness nor compressive strength is measured before payments are released to contractors. One of the qualitative parameters
of a concrete pavement is roughness. Roughness or surface undulations are measured by standard straight edge and it should be modified to measure surface undulation of local concrete roads. Full depth joints have been seen in local roads and no load transfer between panels. Ineffective curing methods have been used for curing concrete. Concrete transit trucks have been used for concrete mixing. Concrete has not been compacted in certain projects. The study is focused on development of guidelines for construction of shoulders, subbase, formwork and concrete surfacing based on the condition survey on newly constructed low volume roads in the rural sector. 4. Concrete Road Condition
Survey Distressed locations and wrong construction practices have been observed during the site visits.. A survey was done on 24 roads which are located in the Southern Province, to collect concrete road condition data (post construction) and the Authors met the contractors and stakeholders of the surveyed roads to gather their knowledge and experience on concrete road construction. The Authors made a few site visits to concrete road construction sites to observe construction practices. According to the survey, contraction joint spacing is less than 5m in 45% of the roads and these joints are not straight in 41% of the roads. Wooden planks have been used to provide contraction joint in 45% of the roads and these have not been removed in 98% of such roads. According to the survey results, no camber has been provided in 92% of the roads. Curing had been done on 70% of the roads while curing material had been provided for only 4% of the roads. According to the specifications, instructions had been given to provide a separation membrane between the concrete layer and the sub-base layer, but according to the survey, polythene sheets had been used as a separation membrane only in 25% of the roads.

3 ENGINEER
3 ENGINEER
5. Pavement Strength and Thickness
Three concrete core samples were taken from roads as shown in Table 01, using a core cutter machine, and the specified mix proportion of the concrete was 1:2:4 (cement : sand : aggregate) . Thickness and strength of the samples are shown in Table 01. Design strength of 1:2:4 concrete is 15N/mm2 and according to Table 01 specified design strength was achieved only at Wadihitiniwasa road. Specified pavement thickness was 150 mm and that has not been maintained even in a single case. Core samples were tested from sites where concrete mixing had been done by concrete transit trucks. It has been observed, during site visits that the concrete discharged from transit trucks was not properly mixed as transit trucks are designed for concrete transportation only. Arrangement of blades inside the rotating drum of a concrete transit truck and a concrete mixer was studied. Visual observations have also proved that concrete transit trucks are not suitable for mixing concrete. Furthermore, rebound hammer tests were also carried out on some roads. In addition to that, a few rebound hammer tests were carried out on concrete roads which have been constructed using concrete mixers. Standard deviation of pavement strength was calculated in both cases and a comparatively high standard deviation on roads constructed by using concrete transit was not trucks. All these facts prove that concrete transit trucks are not suitable for mixing concrete. The paving thickness was less than that specified. The core sample which satisfied the strength requirement has the lowest thickness. It was found that the payment was released based on the hammer reading and the strength was compensated by the thickness to get approval from the authorities.
Table 1 - Core sample strength.
No Location Thickness
Strength N/mm2
01 Beligaswatta Kohilawala Para
140mm 9.96
02 Wadihitiniwasa Para, Beliatta
95mm 16.45
03 Dewana Piwisum Para, Ihalabeligalla
140mm 10.76
Figure 1- Concrete core samples
Rebound hammer can be used to measure surface hardness of concrete pavements where surface hardness correlates with strength of the pavement. However, surface hardness depends on various factors such as moisture condition of surface, aggregate size etc (BS 4408:PART 4) [6] It is advisable to use hammer test as a field test for quality control since it is possible to test the overall pavement. However, core sample testing should be conducted for quality assurance to verify the hammer results (strength) and the pavement thickness. 6. Effectiveness of Curing
Material Low rich concrete is being used for local road concrete pavements and according to Sammir et..al, curing should be done for at least 7 days for such concrete.[7] Saw dust was used as water retaining material at Napekanda road while coir dust was used at Beligaswatta road since these materials were

ENGINEER 4ENGINEER 4
freely available. Sandy soil can also be used as a water retaining material. Effectiveness of curing depends on water retaining ability of such materials, and in order to compare the effectiveness of different materials, an experiment was conducted on a dry sunny day (maximum temp of 35°C). One meter by one meter rectangles were marked on the selected pavement.. After that 27000cm3 of measured coir dust was spread evenly on the first block and the same volume of sandy soil was spread on the second block while keeping the third block as a control surface. Water was spread on the coir dust, sandy soil and control section to saturated conditions at 6:30 am. Intervals at which water was spread on the control section (without a curing material) to keep it in a wet condition are given in Table 2. It was found that coir dust and sandy soil sections remained in a wet condition during the study period. Results show that water spraying is required in 1 hour intervals in morning and evenings and in 30 minute intervals during mid day for curing concrete without a water retaining material. It can be concluded that it is essential to use a water retaining material for effective curing of road sections. Table 2- Water retaining material testing data.
Time Time
deference (Minutes)
Slab without material
Coir dust
Sandy soil
6:30 √ √ √ 7:30 60 √ × × 8:50 80 √ × × 9:55 65 √ × ×
10:45 50 √ × × 11:20 35 √ × × 11:55 35 √ × × 12:50 55 √ × × 13:42 52 √ × × 14:33 51 √ × × 15:30 57 √ × × 16:30 60 √ × ×
Note: - (√) Water spread (×) water not spread
7. Measuring Surface Undulation With reference to the available specification, surface undulation of a concrete pavement shall be evaluated by a standard 3 m straight edge, but if there is a camber, this length cannot be used to measure undulations of concrete roads, because the average width of local roads is about 3 m. In this case, the standard straight edge was modified to evaluate undulations in low volume concrete pavements in Sri Lanka. An aluminum rectangular hollow box of 1.5 m length, 50 mm height and 25mm width was used as the modified straight edge. The length of the selected straight edge was 1.5 m since half width of most concrete roads is about 1.5 m. Two supports of height 20 mm were fixed at the ends of the straight edge. A wedge which is used to measure the space between the concrete surface and straight edge was prepared from a steel plate with a handle. The length of the wedge was 350 mm and height 50 mm as shown in figure 02. Surface undulations were measured in selected roads in the Galle district after the field survey. Table 3 shows the data collected from Kahaduwa Milidduwa road in Galle. This road has been rated as a good surfaced road in the survey. It can be seen that undulations exceeded 10 mm only at three locations. This study shows that 10 mm of undulation can be allowed for rural road construction and it can be achieved with available resources.
Figure 2 - Modified straight edge

5 ENGINEER
5 ENGINEER
8. Construction of Joints Shrinkage stresses are induced in concrete pavement with the hydration of cement and shrinkage continues for a long period. As a result of these stresses irregular cracks can be induced in concrete. These cracks can be avoided by providing partial depth joints at 4-5 m intervals so that cracks due to stress are developed under the formed joint. The joint requires only a saw cut upto 1/3 of the pavement thickness. All the joints observed during the survey were full depth joints (wooden plank placed to separate slabs). Full depth contraction joints are weak in load transfer between slabs and an experiment was carried out to construct half depth contraction joints at Napekanda road by adopting special procedures. The location for a contraction joint was identified and a 14 mm wide groove was prepared on both sides of the formwork upto half of its depth as shown in figure 03. Thereafter, the plywood was covered with a polythene sheet, as shown, and was inserted into the groove. The objective of covering the plywood with a polythene sheet was to prevent concrete sticking to the plywood. Concrete was then poured into both sides of the joint. The plywood plank was then removed, slowly, about 4 hours after pouring of concrete leaving the polythene sheet with the concrete. This joint construction method has been further developed by limiting the joint width to 6mm using a perspex sheet instead of the plywood plank. Mould oil can be used instead of a polythene sheet to prevent sticking of concrete to the Perspex sheet. Figure 4 shows the contraction joint construction mechanism developed by the University of Moratuwa. Table 3 - Reading of surface undulations
Cha
inag
e
Max
. LH
S Re
adin
g (m
m) ,
A
Und
ulat
ion
(mm
) [A
-20]
Max
. RH
S Re
adin
g (m
m),
A
Und
ulat
ion
(mm
), [A
-20]
+000 22 2 25 5 +020 27 7 25 5
+040 30 10 30 10 +060 40 20 15 -5 +080 30 10 20 0 +100 20 0 22 2 +120 20 0 26 6 +140 27 7 32 12 +160 28 8 33 13 +180 30 10 24 4
Average 7.4 5.2 SD 5.37 5.2
Figure 3 -Construction of half depth contraction joint
Figure 4 -Contraction joint making device developed by University of Moratuwa Furthermore, a few half depth contraction joints were constructed at Aduranwila Ehalagedara Para, Poddala, Galle by the Authors. The construction process of the half depth joints was different from that of Napekanda because a Styrofoam sheet of 50mm width was used while total thickness of the pavement was 100mm. The Styrofoam sheet was removed on the day following concreting.. If concrete paving is done without providing joints, cracks will form naturally [3] and this was observed during the condition survey. Also. it was found that natural cracks had
Polythene sheet
14mm wide grove in formwork
6mm Perspex strip fixed between two wooden strips
Formwork
ENGINEER 6ENGINEER 6
developed on 7 roads out of 24 which have not been provided with contraction joints. The average spacing of these natural cracks was 12 m.
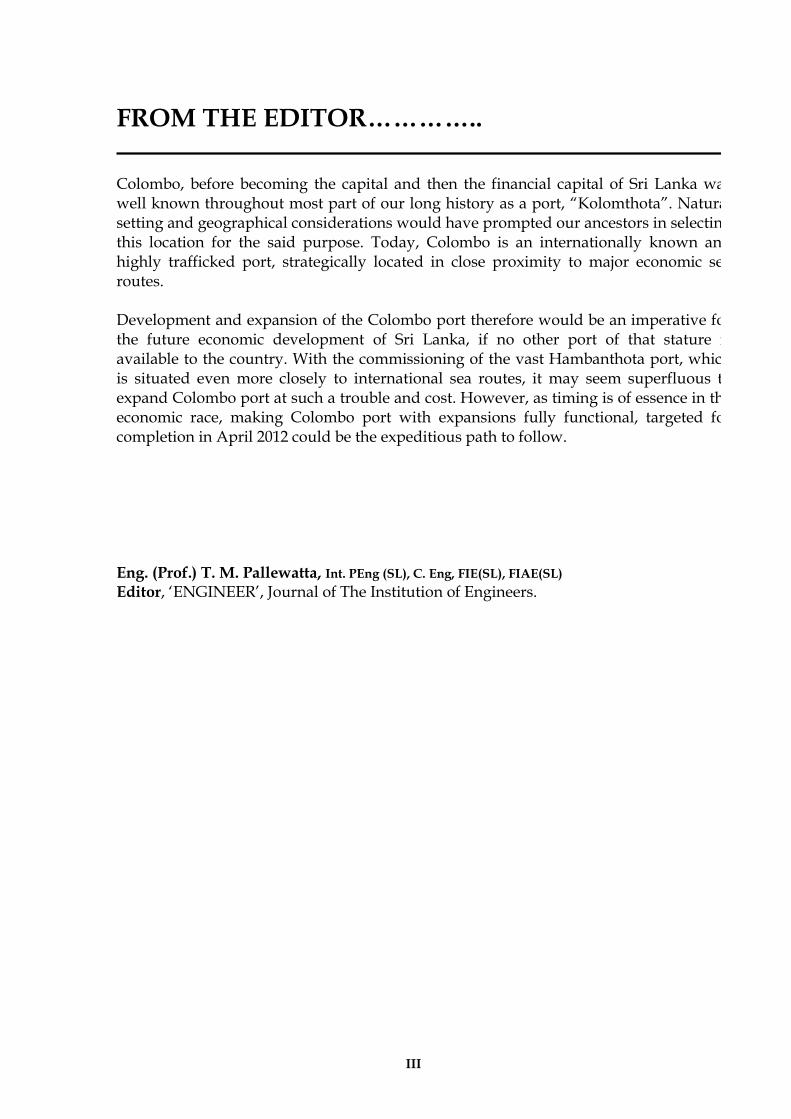
9. Camber / Transverse Slope. According to Vazirani et..al[14], camber for concrete pavements should be kept between 1.7% and 2%. According to guidelines provided to contractors, requirement of a camber or transverse slope has not been mentioned. As a result, camber was not provided on 92% of the concrete roads. Construction of camber is not difficult and 2% camber was achieved at Napekanda road without much effort. It is essential to have a camber in the road surface for surface water runoff and also for each layer below (drain out infiltrated water to side drains) and should be included in the guidelines. 10. Compaction of Concrete It was found, in the survey, that concrete was not compacted using a vibrator when placed. It is not advisable to use a poker vibrator for compaction of thin concrete layers. The Authors have developed a double beam surface vibrator with an inbuilt camber (2%) to compact thin concrete layers used in low volume road construction. Vibration was created by placing a 1 hp motor with an eccentric weight at the center. Figure 5 shows the double beam vibrator for compaction of concrete. It is made of hollow aluminum sections with a steel channel for the camber. Two handles located at the ends can be used to move the vibrator forward over the formwork. Forward speed is critical in the correct use of the vibrating beam and should be limited to between 0.5 and 1.0 m/min. The lower speed should be used for thicker slabs. A second pass at a faster speed may be made for better finishing.
Figure 5 -Double beam surface vibrators
11. Other Considerations The recommended slump for concrete pavements, in India, is 25mm to 50mm, if paving is done by pavers [14]. The slump was measured during construction of Aduranwila Ehalagedara road and it was between 75mm and 125mm. Literature shows that a slump of 50- 100 mm is sufficient for placing concrete. However, excessive slump should not be allowed since it will lead to using more free water for concrete preparation. Close supervision is required at the paving site to ensure quality of concrete. Permanent marks on the pavements were observed on 50% of roads due to their premature use. Access to pedestrians, vehicles or animals should not be allowed before concrete has gained sufficient strength in order to avoid permanent marks. Barricades are suggested as a solution for this purpose. During the site visit at Agunukolapalassa, structural damage of the pavement was observed due to heavy vehicle movements before gaining sufficient strength and these damages are more critical than permanent marks.
Motor with eccentric load
Handle
Formwork
2% Camber

7 ENGINEER
7 ENGINEER
The shoulder provides space for pedestrians and additional space for traffic. Shoulders can be constructed either before or after placing concrete. Construction of shoulder before placing concrete is the better practice. Shoulder construction should be delayed until the concrete gains sufficient strength in the event of construction of the shoulder after placing concrete. Side drains for disposal of storm water should be constructed and maintained to increase the lifespan of the pavement. It was observed that proper drainage has not been constructed in the roads selected for the survey.
12. Conclusions and
Recommendations Design weaknesses and poor construction practices were observed during the condition survey. Summary of good practices to overcome design and construction weaknesses are given below.
1. One third to half depth contraction joint should be provided at 4-5m intervals using 6 mm to 12 mm wide plywood planks. A device developed by the University of Moratuwa with a 6mm perspex sheet is recommended to make the contraction joints.
2. According to the survey, concrete was cured on 70% of the roads and effectiveness of curing can be enhanced with coir dust, saw dust or sandy soil as water retaining material.
3. The use of concrete transit trucks which are designed for transporting concrete, for mixing of concrete should be discouraged. As a result of poor mixing of concrete, in transit trucks, concrete strength is lowered and leads to a low quality product.
4. Roughness or surface undulation affects travel comfort of vehicle occupants. A straight edge of 1.5m long, is specified for controlling undulations of concrete surface and test results show that undulations of 10mm or less for 1.5m straight edge provide a good surface for low volume concrete roads.
5. Compaction of concrete using surface
vibrators has not been done in low volume concrete road construction. It is recommended to use double beam vibrators developed by the University of Moratuwa to consolidate and form the surface cross fall of concrete roads.
6. Load bearing capacity of a concrete pavement is related to its thickness and compressive strength. Thickness of the pavement after construction is not easily obtained and core cutter should be used to extract samples. Extracted samples can be used to measure concrete thickness and test for compressive strength. Compressive strength and the thickness of the random samples should be evaluated before releasing payments to the contractor.
Weaknesses in current construction practices were identified during site visits and through interviews with personnel involved in construction, maintenance and administration of concrete roads. Check lists were developed to include the good practices and to enhance quality of low volume concrete roads as given in the Appendix. Contractors should use the check list, and work under each item should be certified by the consultant or the project management unit of the project before moving to the next item. References
1. American Concrete Pavement Association,
Life Cycle Cost Analysis: A Guide for Comparing Alternate Pavement Analysis, EB 2002, 220P.
2. Design and Construction of Joints for
Concrete Streets, Concrete Information, American Concrete Pavement Association, IS061.01P.(ACPA 1992), 1992.
3. Guruchandran, Singh & Jagdish Singh, Highway Engineering, Standard Publication Distributors Delhi, Fifth Edition, 2008.

ENGINEER 8ENGINEER 8
4. Kadyali, L. R., & Lal, N. B., Principles and Practice of Highway Engineering, Khanna Publishers, Delhi -6 fifth edition, 2008.
5. Kulasinghe, A.N.S., Construction of
Marine Drive in Colombo including Sea Walls, New Lighthouse and Concrete Roadway in Prestressed concrete.1951, http://kulasinghe.com/shells.htm
6. WSDOT, Rebound Hammer Determination of Compressive Strength of Herded Concrete, WSDOT Material Manual, M46-01.03, January 2009.
7. Samir, H, AL Ani and Mokdad, A. K. AL
Zaiwary(1988) The Effect of Curing Period and Curing Delays on Concrete inHhot Weather, Building Material Development, Building Research Center Bagdad, Iraq 2005-212.
8. Southeast Chapter American Concrete
Pavement Association, “Who says...”Concrete Pavement Costs Too Much?” Count on Concrete Pavement, 2005.
9. Standard Specifications for Construction
and Maintenance of Roads and Bridges, Institute for Construction Training and Development, Sri Lanka, Revised Draft Document 2005.(SSCM 2005).
10. Southern Transport Development Project,
Highway Section Kurudugahahetekma to Matara. Volume 3-Technical specification 2001(STDP 2001)
11. US Department of Transportation Federal
Highways Administration web site, Office of Highway Policy Information, Highway Statistics 2005. http://www.fhwa.dot.gov/policy/ohim/hs05/xls/hm12.xls
12. Taylor, G.W., Patten, J.D., Effects of
Pavement Structure on Vehicle Fuel Consumption – Phase III, prepared for Natural Resources Canada Action Plan
2000 on Climate Change and Cement Association of Canada, January 2006.
13. Taylor, G.W., Dr. Farrell, P., and Woodside
A., Additional Analysis of the Effect of Pavement Structure on Truck Fuel Consumption, prepared for Government of Canada Action Plan 2000 on Climate Change, Concrete Roads Advisory Committee, August 2002.
14. Vazirani, V. N., & Chandola, S. P., Concise
handbook of Civil Engineering, S Chand and Company LTD, New Delhi, revised edition 2008.

9 ENGINEER
9 ENGINEER
Appendix Road name:- Chainage:- Checked By:- Designation:- Date:- (All items to be checked in 'Done' column. NA if not applicable) A. Check List for Sub Base/ Shoulders
No Description Done 1 Is available soil, Granular material, borrow material approved 2 Is material free from debris or any other ingredient that may deteriorate 3 Is the sub base on stable firm ground? 4 Is borrow material from approved borrow areas ? 5 Is plant adequate for on site operations 6 Is the area of work set out? 7 Is previous layer approved? 8 Is each layer parallel to the final sub base layer 9 Is compaction plant approved
10 Has a compaction trial been undertaken B.Check List for Form Work
No Description Done Is vertical alignment as specified? Is horizontal alignment as specified? Are dimensions as per specification? Are Supports as per requirement? Are Quality and thickness of shutters as per specification? Are Quality and location of supports as per requirement?
C. Check List for Concrete Placing No Description Done 1
Before concreting
Has the method of construction been approved 2 Is formwork alignment, dimensions, rigidness & surface cleanliness
sufficient?
3 Are Joints between formwork closed (no gaps) ? 4 Are extraneous material removed from the forms immediately before
placing concrete?
5 Are Forms treated with approved oil? 6 Is sub base surface with the required moisture content? 7 Is the sub base surface undulation at approved level? 8 Mixing and compaction machines as required and in good condition? 9 Are sand, metal and cement at required specification? 10 Is material measuring method at acceptable level? 11 Is concrete hauling method at acceptable level? 12 Are surface leveling tool and booming tool available? 13 Are covering sheets available if it rains? 14 Is slump cone and test mould available? 15
During concreting
Is concrete placed without segregation? 16 Is concrete compacted well? 17 Are the final surface level, thickness and undulation at acceptable
levels?
18 After concreting
Does the road close for traffic satisfactorily ? 19 Is Water retaining material (core dust) available at site ? 20 Is concrete being curing satisfactorily for minimum of 7 days? Remarks ………………………….. ………………………… Date Signature

ENGINEER - Vol. XXXXIV, No. 04, pp. [10-15], 2011 © The Institution of Engineers, Sri Lanka
ENGINEER 1
Validity of Reversible Flow Lanes between Kandy Road Flyover and New Kelani Bridge Roundabout
along A01 to Accommodate Peak Traffic Flows
K. S. Weerasekera Abstract: This paper examines ways of enhancing road capacity by improving lane efficiency along Colombo-Kandy Road (A01) at Colombo city entrance by introducing reversible traffic flow lanes between Kandy road flyover at Pattiya junction and New Kelani Bridge roundabout, to cater for peak traffic flows. A traffic study was conducted between Pattiya junction and New Kelani Bridge roundabout to find out the benefits and any losses, if reversible traffic flow lanes are introduced along this stretch of road during peak traffic flows in mornings and evenings. Two options of lane assignment were considered for the heavy flow direction during peak hours. Option ( i ) by adding one extra mixed traffic lane towards the heavy flow direction while reducing a lane from the opposite direction, and option ( ii ) adding an additional lane exclusively for buses towards the heavy flow direction while reducing a lane in the opposite direction. These two options were considered for both morning and evening peak traffic flows. By using Davidson’s model the benefits or any losses in travel time was computed for the two options separately for both directional peak traffic flows. The study proved that by the introduction of reversible flow lanes along the considered section, during morning and evening peak traffic flows, the benefits obtained by far outweigh the losses due to minor reduction in road capacity in the opposite directional traffic flows. It was also found that introduction of designated lanes for ‘buses only’ further improves the overall efficiency of the system with higher benefits. If ‘buses only’ lanes are introduced it is of the utmost importance to implement these lanes only for buses, as expected. Keywords: Reversible Flow Lanes, Contra Flow, Tidal Flow, Bus Lanes 1. Introduction Colombo – Kandy road (A01), is one of the main arterial roads of Sri Lanka radiating from Colombo, which carries traffic travelling towards the central hills as well as northern and north central areas of the country. Hence, this is one of the busiest roads in Sri Lanka which links Colombo with other major areas of the island. The inbound traffic towards Colombo is very heavy during the morning peak hours near the city entry, and severe congestion of traffic is experienced during the week days (Figure 1). Similar conditions are observed during evening peak hours on weekdays in the outbound direction. This traffic congestion costs the state dearly by means of increased travel time, fuel wastage, vehicle wear and tear, loss of safety, pollution of air and noise etc.
Figure 1 – Inbound Traffic towards Colombo
A newly built flyover above the main railway line at Pattiya junction is of four lanes with two lanes in either direction (Figure 2). The distance from the flyover to the New Kelani Bridge roundabout is 2 km. This stretch of 2 km road consists of six lanes in an undivided
Eng. (Prof.) K. S. Weerasekera, BSc Eng (Moratuwa), MEngSc (UNSW), PhD (UNSW), FIE (Sri Lanka), CEng, IntPE(SL), MIE (Aust), CPEng, MIHT (UK), MASCE, Professor in Civil Engineering, Department of Civil Engineering, The Open University of Sri Lanka.

11 ENGINEER
ENGINEER - Vol. XXXXIV, No. 04, pp. [10-15], 2011 © The Institution of Engineers, Sri Lanka
ENGINEER 1
Validity of Reversible Flow Lanes between Kandy Road Flyover and New Kelani Bridge Roundabout
along A01 to Accommodate Peak Traffic Flows
K. S. Weerasekera Abstract: This paper examines ways of enhancing road capacity by improving lane efficiency along Colombo-Kandy Road (A01) at Colombo city entrance by introducing reversible traffic flow lanes between Kandy road flyover at Pattiya junction and New Kelani Bridge roundabout, to cater for peak traffic flows. A traffic study was conducted between Pattiya junction and New Kelani Bridge roundabout to find out the benefits and any losses, if reversible traffic flow lanes are introduced along this stretch of road during peak traffic flows in mornings and evenings. Two options of lane assignment were considered for the heavy flow direction during peak hours. Option ( i ) by adding one extra mixed traffic lane towards the heavy flow direction while reducing a lane from the opposite direction, and option ( ii ) adding an additional lane exclusively for buses towards the heavy flow direction while reducing a lane in the opposite direction. These two options were considered for both morning and evening peak traffic flows. By using Davidson’s model the benefits or any losses in travel time was computed for the two options separately for both directional peak traffic flows. The study proved that by the introduction of reversible flow lanes along the considered section, during morning and evening peak traffic flows, the benefits obtained by far outweigh the losses due to minor reduction in road capacity in the opposite directional traffic flows. It was also found that introduction of designated lanes for ‘buses only’ further improves the overall efficiency of the system with higher benefits. If ‘buses only’ lanes are introduced it is of the utmost importance to implement these lanes only for buses, as expected. Keywords: Reversible Flow Lanes, Contra Flow, Tidal Flow, Bus Lanes 1. Introduction Colombo – Kandy road (A01), is one of the main arterial roads of Sri Lanka radiating from Colombo, which carries traffic travelling towards the central hills as well as northern and north central areas of the country. Hence, this is one of the busiest roads in Sri Lanka which links Colombo with other major areas of the island. The inbound traffic towards Colombo is very heavy during the morning peak hours near the city entry, and severe congestion of traffic is experienced during the week days (Figure 1). Similar conditions are observed during evening peak hours on weekdays in the outbound direction. This traffic congestion costs the state dearly by means of increased travel time, fuel wastage, vehicle wear and tear, loss of safety, pollution of air and noise etc.
Figure 1 – Inbound Traffic towards Colombo
A newly built flyover above the main railway line at Pattiya junction is of four lanes with two lanes in either direction (Figure 2). The distance from the flyover to the New Kelani Bridge roundabout is 2 km. This stretch of 2 km road consists of six lanes in an undivided
Eng. (Prof.) K. S. Weerasekera, BSc Eng (Moratuwa), MEngSc (UNSW), PhD (UNSW), FIE (Sri Lanka), CEng, IntPE(SL), MIE (Aust), CPEng, MIHT (UK), MASCE, Professor in Civil Engineering, Department of Civil Engineering, The Open University of Sri Lanka.
enGineeR - Vol. XXXXiV, no. 04, pp, [11-16], 2011© the institution of engineers, sri Lanka

ENGINEER 12
ENGINEER 2
carriageway with 3 lanes in either direction. With the introduction of the new flyover at Pattiya junction the interruption to A01 traffic arising from frequent rail gate closures of the main railway line has been eliminated, but the congestion between Pattiya junction and the New Kelani Bridge roundabout has not reduced.
Figure 2 – Pattiya Junction Flyover along A01 It is observed that during peak flows, the traffic towards the heavy direction is extremely heavy, but in the opposite direction the road space is not utilised effectively (see Figure 1). Hence, this study intends to investigate the benefits that could be reaped by introducing reversible or contra flow traffic flow lanes. 2. Reversible Traffic Flow Lanes
or Contra Flow Lanes In busy arterial roads, when the movement of traffic is very heavy in one direction during a certain period of the day, and also becomes very heavy in the opposite direction during another time of the day, this phenomenon is commonly termed as ‘tidal flow’. As a solution to address the tidal flows reversible lanes can be introduced. A reversible lane is one, where the direction of traffic movement is changed according to the intensity of traffic flow in a particular direction (Kadiyali [1]; Salter & Hounsell [2]). 3. Traffic Data Collection A manual classified traffic count was performed for 16 hours at a location at 1 km south of Pattiya junction flyover (i.e. towards Colombo) on a normal working day from 6:00AM to 10:00PM. Two-directional traffic was recorded separately at 15 minute intervals at
the counting location for 7 different categories of vehicles. The seven broad categories of vehicles were; three-wheelers, cars & SUVs, all vans, all types of buses, goods carrying vehicles, all vehicles with 3 axles, and vehicle with 4 axles or more as indicated in Tables 1 & 2. The Passenger Car Unit (PCU) factors based on RDA records, for these separate categories of vehicles on flat terrain roads with multiple lanes are indicated in Table 3.
Table 1 – Hourly Traffic Volume (To Colombo) at Peliyagoda on A01
Time TWL CAR VAN BUS GV 3A ≥4 Total
6 - 7 284 946 423 414 129 17 6 2218 7 - 8 644 1481 399 352 167 2 8 3052 8 - 9 503 1076 195 217 220 7 7 2224 9 - 10 411 863 162 184 245 2 21 1890 10- 11 333 694 146 155 219 14 10 1572 11- 12 502 468 189 197 195 11 28 1589 12- 13 421 541 230 233 169 13 31 1639 13- 14 428 407 233 210 176 22 20 1495 14- 15 321 562 175 197 160 10 17 1441 15- 16 354 571 170 225 163 12 20 1515 16- 17 294 504 226 209 188 18 14 1453 17- 18 224 485 266 256 97 14 21 1363 18- 19 305 484 204 309 118 13 26 1459 19- 20 303 478 161 225 101 17 17 1301 20- 21 165 311 166 186 91 24 15 958
21- 22 135 265 149 148 66 15 9 788
6 - 22 5627 10136 3493 3717 2504 211 267 25955
Table 2 – Hourly Traffic Volume (To Kandy) at Peliyagoda on A01
Time TWL CAR VAN BUS GV 3AV ≥4A Total 6 - 7 118 196 112 189 90 2 3 710 7 - 8 304 328 152 216 100 21 25 1146 8 - 9 251 309 114 226 171 3 10 1084 9 - 10 250 287 119 188 234 17 20 1114 10- 11 330 400 173 184 295 14 18 1414 11- 12 337 402 175 237 307 11 15 1484 12- 13 327 352 169 267 272 11 21 1419 13- 14 367 423 264 270 286 7 24 1641 14- 15 234 439 349 284 245 13 19 1584 15- 16 380 450 216 230 310 12 22 1620 16- 17 245 517 240 282 343 20 20 1668 17- 18 250 928 311 290 254 12 23 2068 18- 19 403 1024 323 300 211 21 14 2296 19- 20 433 1252 377 340 210 22 19 2653 20- 21 334 649 242 260 209 19 29 1741
21- 22 279 515 210 220 156 12 26 1419
6- 22 4841 8471 3548 3983 3694 217 308 25061

13 ENGINEER
ENGINEER 2
carriageway with 3 lanes in either direction. With the introduction of the new flyover at Pattiya junction the interruption to A01 traffic arising from frequent rail gate closures of the main railway line has been eliminated, but the congestion between Pattiya junction and the New Kelani Bridge roundabout has not reduced.
Figure 2 – Pattiya Junction Flyover along A01 It is observed that during peak flows, the traffic towards the heavy direction is extremely heavy, but in the opposite direction the road space is not utilised effectively (see Figure 1). Hence, this study intends to investigate the benefits that could be reaped by introducing reversible or contra flow traffic flow lanes. 2. Reversible Traffic Flow Lanes
or Contra Flow Lanes In busy arterial roads, when the movement of traffic is very heavy in one direction during a certain period of the day, and also becomes very heavy in the opposite direction during another time of the day, this phenomenon is commonly termed as ‘tidal flow’. As a solution to address the tidal flows reversible lanes can be introduced. A reversible lane is one, where the direction of traffic movement is changed according to the intensity of traffic flow in a particular direction (Kadiyali [1]; Salter & Hounsell [2]). 3. Traffic Data Collection A manual classified traffic count was performed for 16 hours at a location at 1 km south of Pattiya junction flyover (i.e. towards Colombo) on a normal working day from 6:00AM to 10:00PM. Two-directional traffic was recorded separately at 15 minute intervals at
the counting location for 7 different categories of vehicles. The seven broad categories of vehicles were; three-wheelers, cars & SUVs, all vans, all types of buses, goods carrying vehicles, all vehicles with 3 axles, and vehicle with 4 axles or more as indicated in Tables 1 & 2. The Passenger Car Unit (PCU) factors based on RDA records, for these separate categories of vehicles on flat terrain roads with multiple lanes are indicated in Table 3.
Table 1 – Hourly Traffic Volume (To Colombo) at Peliyagoda on A01
Time TWL CAR VAN BUS GV 3A ≥4 Total
6 - 7 284 946 423 414 129 17 6 2218 7 - 8 644 1481 399 352 167 2 8 3052 8 - 9 503 1076 195 217 220 7 7 2224 9 - 10 411 863 162 184 245 2 21 1890 10- 11 333 694 146 155 219 14 10 1572 11- 12 502 468 189 197 195 11 28 1589 12- 13 421 541 230 233 169 13 31 1639 13- 14 428 407 233 210 176 22 20 1495 14- 15 321 562 175 197 160 10 17 1441 15- 16 354 571 170 225 163 12 20 1515 16- 17 294 504 226 209 188 18 14 1453 17- 18 224 485 266 256 97 14 21 1363 18- 19 305 484 204 309 118 13 26 1459 19- 20 303 478 161 225 101 17 17 1301 20- 21 165 311 166 186 91 24 15 958
21- 22 135 265 149 148 66 15 9 788
6 - 22 5627 10136 3493 3717 2504 211 267 25955
Table 2 – Hourly Traffic Volume (To Kandy) at Peliyagoda on A01
Time TWL CAR VAN BUS GV 3AV ≥4A Total 6 - 7 118 196 112 189 90 2 3 710 7 - 8 304 328 152 216 100 21 25 1146 8 - 9 251 309 114 226 171 3 10 1084 9 - 10 250 287 119 188 234 17 20 1114 10- 11 330 400 173 184 295 14 18 1414 11- 12 337 402 175 237 307 11 15 1484 12- 13 327 352 169 267 272 11 21 1419 13- 14 367 423 264 270 286 7 24 1641 14- 15 234 439 349 284 245 13 19 1584 15- 16 380 450 216 230 310 12 22 1620 16- 17 245 517 240 282 343 20 20 1668 17- 18 250 928 311 290 254 12 23 2068 18- 19 403 1024 323 300 211 21 14 2296 19- 20 433 1252 377 340 210 22 19 2653 20- 21 334 649 242 260 209 19 29 1741
21- 22 279 515 210 220 156 12 26 1419
6- 22 4841 8471 3548 3983 3694 217 308 25061
ENGINEER 3
Table 3 – Equivalent Passenger Car Units (PCU) for Flat Terrain Multiple Lane Roads
TWL CAR VAN BUS GV 3A ≥4A 0.8 1.0 1.5 2.0 1.7 2.8 3.5
A separate short duration vehicle occupancy count was conducted during peak hours to observe the average number of passengers carried by different categories of vehicles. Peak hour average passenger count indicated that, the average occupancy of a bus is around 40 passengers and all other vehicles considered as a mix is around 3.25 passengers per vehicle. These values were used for computing vehicle occupancy in the study. Figure 3 shows two-directional hourly traffic flows separately, and also the total hourly traffic flow along the considered road section over the counting period from 6:00AM to 10:00PM.
Traffic Flow on A1 at Peliyagoda
0
500
1000
1500
2000
2500
3000
3500
4000
4500
6:00
- 7:
00
7:00
- 8:
00
8:00
- 9:
00
9:00
- 10
:00
10:0
0 - 1
1:00
11:0
0 - 1
2:00
12:0
0 - 1
3:00
13:0
0 - 1
4:00
14:0
0 - 1
5:00
15:0
0 - 1
6:00
16:0
0 - 1
7:00
17:0
0 - 1
8:00
18:0
0 - 1
9:00
19:0
0 - 2
0:00
20:0
0 - 2
1:00
21:0
0 - 2
2:00
Time (hours)
Traf
fic F
low
(veh
/hr)
To ColomboFrom ColomboTotal
Figure 3 – Hourly Traffic Flows on A01 at Peliyagoda 4. Methodology & Analysis From the traffic survey results it was identified that the morning peak is from 7:00AM to 8:00AM and the total vehicle volume towards Colombo is around 3050 vph. During the morning peak the total vehicle volume travelling out of Colombo was around 1150 vph (see Figure 3). The total two directional flow was around 4200 vph. Similarly, the out-bound traffic reaches its peak in the evening between 7:00PM to 8:00PM and the volume is around 2650 vph. During the evening peak the total vehicle volume towards Colombo is around 1300 vph (see Figure 3). The total two directional flow was around 3950 vph,
which was less than the morning peak flow. This can clearly be seen in Figure 3. There are several models available to compute the travel time [3]. (i) The Bureau of Public Roads (BRP) model used in the UK, (ii) Greenshields model, and (iii) Davidson’s model are few models that could be used in computing the travel time benefits or losses. It was decided to use Davidson’s model [4], to compute the travel time benefits or losses since it suited better with local parameters and for better relative accuracy. Davidson’s model considers parameters such as type of road, road width, frequency of signals, pedestrian crossings, and parked vehicles etc. Davidson [4] successfully used the following model to compute travel time differences for varying lane options for urban arterial roads as well as freeways.
)1()1(1
0 yyjtt
Where, t - travel time at traffic flow q
0t - time taken to travel with no other traffic (i.e., zero flow travel time)
q – traffic flow (veh/hr/lane) s - saturation flow (veh/hr/lane) y = q/s j - level of service parameter j is the Level of Service (LOS) parameter which is related to the type of road, road width, frequency of signals, pedestrian crossings, and parked vehicles. Blunden and Black [5] suggest following values for j. j = 0 to 0.2 for freeways j = 0.4 to 0.6 for urban arterials j = 1 to 1.5 for collector roads Hence it is reasonable to assume j = 0.5 for Colombo – Kandy road.
ENGINEER 14
ENGINEER 4
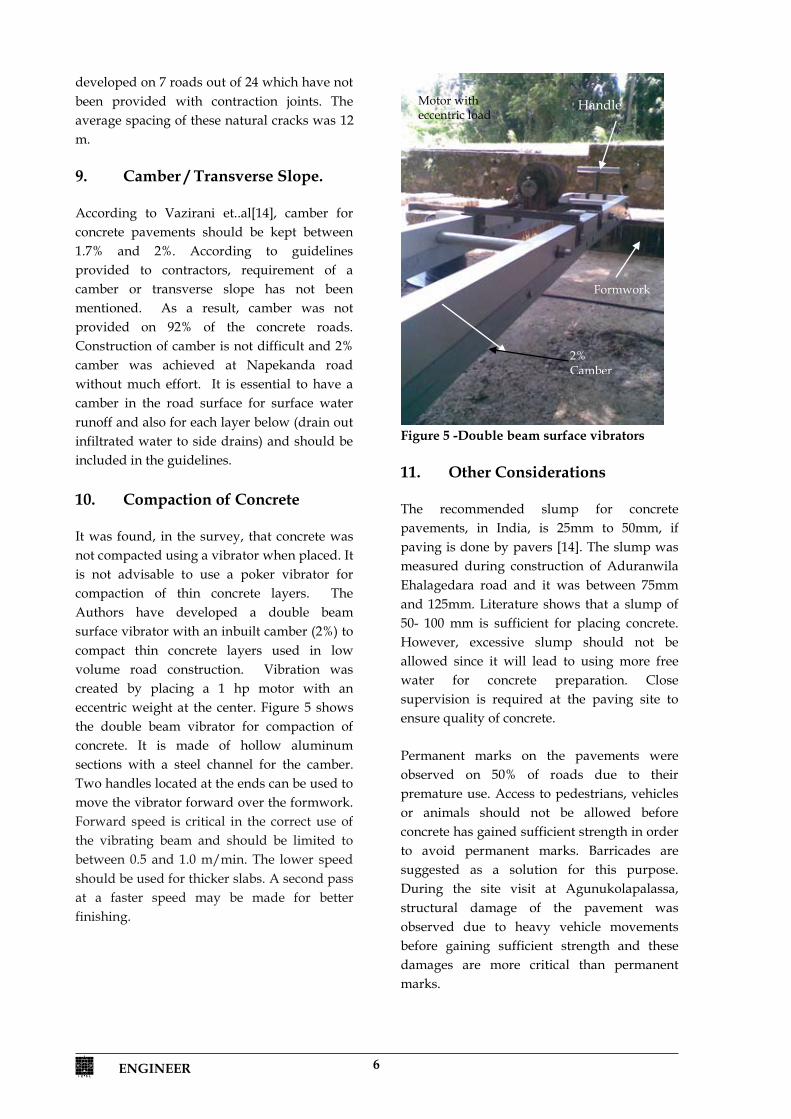
Zero flow travel time ( 0t ) was taken as 2 minutes assuming a desired speed of 60 km/h over the study distance of 2 km with no other traffic. This study intends to consider several options of lane operations between Pattiya junction and New Kelani Bridge roundabout. This road stretch of 2 km in length (Figure 4) consists of 3 lanes in each direction.
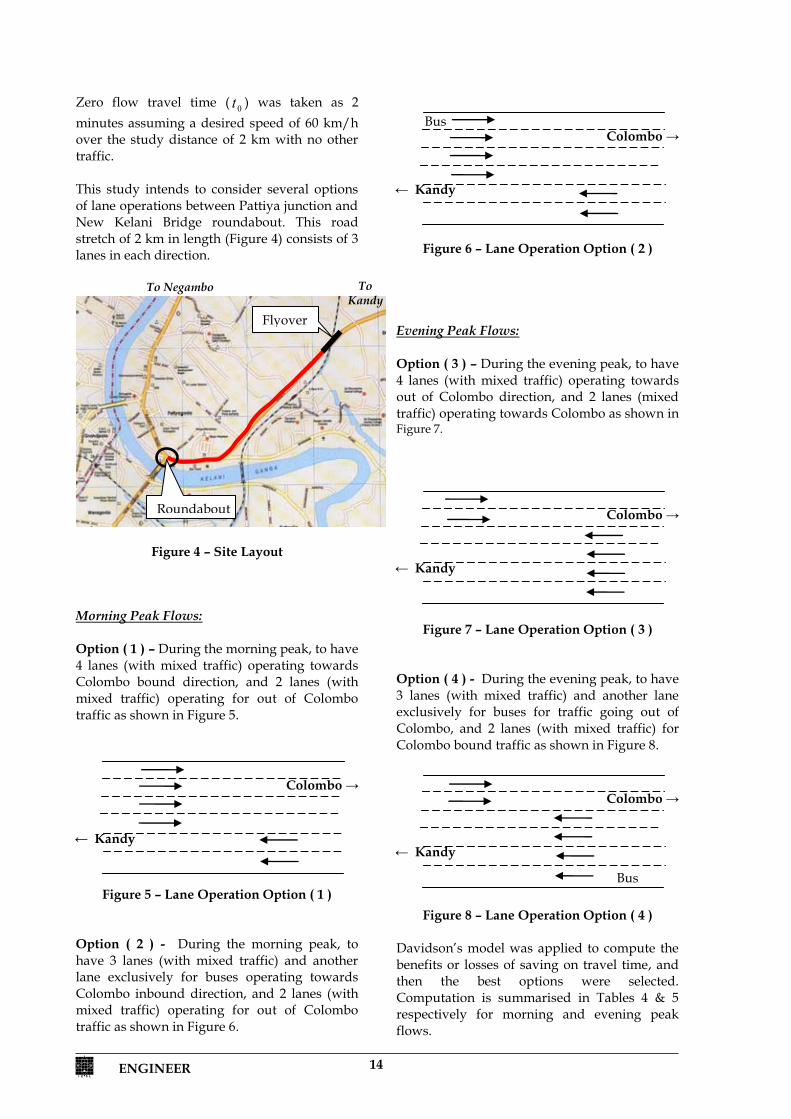
Figure 4 – Site Layout Morning Peak Flows: Option ( 1 ) – During the morning peak, to have 4 lanes (with mixed traffic) operating towards Colombo bound direction, and 2 lanes (with mixed traffic) operating for out of Colombo traffic as shown in Figure 5.
Figure 5 – Lane Operation Option ( 1 )
Option ( 2 ) - During the morning peak, to have 3 lanes (with mixed traffic) and another lane exclusively for buses operating towards Colombo inbound direction, and 2 lanes (with mixed traffic) operating for out of Colombo traffic as shown in Figure 6.
Figure 6 – Lane Operation Option ( 2 )
Evening Peak Flows: Option ( 3 ) – During the evening peak, to have 4 lanes (with mixed traffic) operating towards out of Colombo direction, and 2 lanes (mixed traffic) operating towards Colombo as shown in Figure 7.
Figure 7 – Lane Operation Option ( 3 )
Option ( 4 ) - During the evening peak, to have 3 lanes (with mixed traffic) and another lane exclusively for buses for traffic going out of Colombo, and 2 lanes (with mixed traffic) for Colombo bound traffic as shown in Figure 8.
Figure 8 – Lane Operation Option ( 4 )
Davidson’s model was applied to compute the benefits or losses of saving on travel time, and then the best options were selected. Computation is summarised in Tables 4 & 5 respectively for morning and evening peak flows.
Bus
Bus
← Kandy
Colombo →
← Kandy
Colombo →
← Kandy
Colombo →
← Kandy
Colombo →
Flyover
Roundabout
To Negambo To Kandy

15 ENGINEER
ENGINEER 4
Zero flow travel time ( 0t ) was taken as 2 minutes assuming a desired speed of 60 km/h over the study distance of 2 km with no other traffic. This study intends to consider several options of lane operations between Pattiya junction and New Kelani Bridge roundabout. This road stretch of 2 km in length (Figure 4) consists of 3 lanes in each direction.
Figure 4 – Site Layout Morning Peak Flows: Option ( 1 ) – During the morning peak, to have 4 lanes (with mixed traffic) operating towards Colombo bound direction, and 2 lanes (with mixed traffic) operating for out of Colombo traffic as shown in Figure 5.
Figure 5 – Lane Operation Option ( 1 )
Option ( 2 ) - During the morning peak, to have 3 lanes (with mixed traffic) and another lane exclusively for buses operating towards Colombo inbound direction, and 2 lanes (with mixed traffic) operating for out of Colombo traffic as shown in Figure 6.
Figure 6 – Lane Operation Option ( 2 )
Evening Peak Flows: Option ( 3 ) – During the evening peak, to have 4 lanes (with mixed traffic) operating towards out of Colombo direction, and 2 lanes (mixed traffic) operating towards Colombo as shown in Figure 7.
Figure 7 – Lane Operation Option ( 3 )
Option ( 4 ) - During the evening peak, to have 3 lanes (with mixed traffic) and another lane exclusively for buses for traffic going out of Colombo, and 2 lanes (with mixed traffic) for Colombo bound traffic as shown in Figure 8.
Figure 8 – Lane Operation Option ( 4 )
Davidson’s model was applied to compute the benefits or losses of saving on travel time, and then the best options were selected. Computation is summarised in Tables 4 & 5 respectively for morning and evening peak flows.
Bus
Bus
← Kandy
Colombo →
← Kandy
Colombo →
← Kandy
Colombo →
← Kandy
Colombo →
Flyover
Roundabout
To Negambo To Kandy
ENGINEER 5
Table 4 – Application of Davidson’s Model for Two Directional Traffic in the Morning Peak
To Colombo Direction (PHF 7:00AM to 8:00AM) ---------> Existing Option ( 1 ) Option ( 2 ) Mixed Mixed Mixed Mixed Bus Mixed Mixed ----> <---- ----> <---- ----> ----> <---- ----> <---- ----> <---- ----> <---- ----> <---- ----> ----> ---->
vph 3050 1150 3050 1150 350 2700 1150 (Bus/hr) 350 220 350 220 350 - 220
pcu 3615 1550 3615 1550 700 2910 1550 Lanes 3 3 4 2 1 3 2
q 1205 517 904 775 700 970 775 s 2000 2000 2000 2000 2000 2000 2000
y = q / s 0.603 0.259 0.452 0.388 0.350 0.485 0.388 j 0.5 0.5 0.5 0.5 0.5 0.5 0.5 T 2 2 2 2 2 2 2
t = travel time 3.516 2.349 2.825 2.633 2.538 2.942 2.633 Occupancy - M 3.25 3.25 3.25 3.25 50 3.25 3.25 Occupancy - B 50 50 50 50 50
Persons 26275 14022.5 26275 14022.5 17500 8775 14022.5 Passenger minutes 92375.63 32933.49 74222.08 36916.38 44423.08 25813.83 36916.38
Benefit / Loss - - 18153.55 -3982.89 22138.72 -3982.89 B L B L
Net Benefit / Loss 14170.66 18155.83
Table 5 – Application of Davidson’s Model for Two Directional Traffic in the Evening Peak
To Kandy Direction (PHF 7:00AM to 8:00PM) <----------- Existing Option ( 3 ) Option ( 4 ) Mixed Mixed Mixed Mixed Mixed Mixed Bus ----> <---- ----> <---- ----> <---- <---- ----> <---- ----> <---- ----> <---- ----> <---- <---- <---- <----
vph 1300 2650 1300 2650 1300 2310 340 (Bus/hr) 225 340 225 340 225 - 340
pcu 1690 3330 1690 3330 1690 2650 680 Lanes 3 3 2 4 2 3 1
q 565 1110 845 835 845 885 680 s 2000 2000 2000 2000 2000 2000 2000
y = q / s 0.283 0.555 0.423 0.418 0.423 0.443 0.340 j 0.5 0.5 0.5 0.5 0.5 0.5 0.5 T 2 2 2 2 2 2 2
t = travel time 2.394 3.247 2.732 2.717 2.732 2.794 2.515 Occupancy - M 3.25 3.25 3.25 3.25 3.25 3.25 50 Occupancy - B 50 50 50 50 50
Persons 14744 24508 14744 24508 14744 7507.5 17000 Passenger minutes 35292.53 79580.53 40274.05 66580.46 40274.05 20973.87 42757.58
Benefit / Loss - - -4981.52 13000.07 -4981.52 15849.09 L B L B
Net Benefit / Loss 8018.55 10867.57

ENGINEER 16
ENGINEER 6
5. Findings of the Study From Table 4 it could be seen that the introduction of a new mixed lane towards Colombo during the morning peak will have a net reduction in travel time by 14,170 passenger minutes during the peak hour. If one of the in-bound lanes is designated to buses only, there will be a reduction in travel time by 18,155 passenger minutes. Hence converting a lane towards Colombo direction is advantageous, and if this lane is designated to buses only the advantage is higher. Similarly from Table 5 it could be seen that the introduction of a new mixed lane for vehicles travelling out of Colombo in the evening peak will have a net reduction in travel time by 8,018 passenger minutes during the peak hour. If one of the out-bound lanes is designated to buses only, there will be a reduction in travel time by 10,867 passenger minutes. It was found that introduction of a reversible lane (mix or buses only) towards Colombo bound traffic was advantageous from 6:00AM to 9:00AM, since during this period Colombo bound traffic volume increases above 2000 vph (see Figure 3). Therefore, a 4th lane towards Colombo during this period is found to be beneficial to the system. Similarly, introduction of a 4th lane for out-bound traffic which is above 2000 vph from 5:30PM to 8:30PM (see Figure 3) is also beneficial. 6. Conclusions From options (1) & (3), it is observed that benefits can be obtained by introduction of reversible lanes during morning and evening peaks for mixed traffic, to enhance the road efficiency during peak flows. From options (2) & (4) results it is clear that introduction of designated lanes ‘only for buses’ will further improve the overall efficiency of the system. If ‘buses only’ lanes are introduced it is of the utmost importance to reserve these lanes only for buses as expected. To obtain the maximum benefits it should be ensured that buses will not enter the mixed traffic lanes. If this
enforcement is neglected it can end up as a failure as shown in [6]. When implementing the reversible flow lanes, careful attention should be paid to the intersection at the turn-off to Biyagama road, and also to the terminal at New Kelani Bridge roundabout to ensure smooth flow of traffic at these critical points. If the proposed scheme is implemented, one operational advantage is that, since this road stretch is located adjoining the Peliyagoda Police Station, strict implementation is possible with close supervision from the Peliyagoda traffic police division. It is important that when flow direction is changed in reversible flow lanes, to pay the utmost care by the implementers towards the safety of the drivers during the transition. It is also important that strict lane discipline be maintained by all drivers for obtaining maximum benefits while ensuring safety of all the road users. References 1. Kadiyali, L. R., ‘Traffic Engineering and
Transport Planning’, Khanna Publishers, 2-B, Nath Market, Nai Sarak, Delhi, India, 1997.
2. Salter, R. J. and Hounsell, N. B., ‘Highway
Traffic Analysis and Design’, MACMILLAN Press Ltd., London, 1996.
3. Khisty, C. J. and Kent Lall, B.,
‘Transportation Engineering – An Introduction’ 2nd Ed. Prentice-Hall International, Inc., New Jersey, 1998.
4. Davidson, K. B., ‘A Flow Travel time
Relationship for Use in Transport Planning’, Proceedings, Australian Road Research Board 3, 1966.
5. Blunden, W. R. and Black, J. A., ‘The Land
Use / Transportation System, 2nd Ed. Pergamon Press, Elmsford, NY, 1984.
6. Weerasekera, K. S., ‘Trial Introduction of a
Bus Lane on A02: A Post-mortem’, ENGINEER Journal of The Institution of Engineers, Sri Lanka, Vol. 43, No. 03, pp. 53-56, The Institution of Engineers, Sri Lanka, July 2010.

17 ENGINEER
ENGINEER 6
5. Findings of the Study From Table 4 it could be seen that the introduction of a new mixed lane towards Colombo during the morning peak will have a net reduction in travel time by 14,170 passenger minutes during the peak hour. If one of the in-bound lanes is designated to buses only, there will be a reduction in travel time by 18,155 passenger minutes. Hence converting a lane towards Colombo direction is advantageous, and if this lane is designated to buses only the advantage is higher. Similarly from Table 5 it could be seen that the introduction of a new mixed lane for vehicles travelling out of Colombo in the evening peak will have a net reduction in travel time by 8,018 passenger minutes during the peak hour. If one of the out-bound lanes is designated to buses only, there will be a reduction in travel time by 10,867 passenger minutes. It was found that introduction of a reversible lane (mix or buses only) towards Colombo bound traffic was advantageous from 6:00AM to 9:00AM, since during this period Colombo bound traffic volume increases above 2000 vph (see Figure 3). Therefore, a 4th lane towards Colombo during this period is found to be beneficial to the system. Similarly, introduction of a 4th lane for out-bound traffic which is above 2000 vph from 5:30PM to 8:30PM (see Figure 3) is also beneficial. 6. Conclusions From options (1) & (3), it is observed that benefits can be obtained by introduction of reversible lanes during morning and evening peaks for mixed traffic, to enhance the road efficiency during peak flows. From options (2) & (4) results it is clear that introduction of designated lanes ‘only for buses’ will further improve the overall efficiency of the system. If ‘buses only’ lanes are introduced it is of the utmost importance to reserve these lanes only for buses as expected. To obtain the maximum benefits it should be ensured that buses will not enter the mixed traffic lanes. If this
enforcement is neglected it can end up as a failure as shown in [6]. When implementing the reversible flow lanes, careful attention should be paid to the intersection at the turn-off to Biyagama road, and also to the terminal at New Kelani Bridge roundabout to ensure smooth flow of traffic at these critical points. If the proposed scheme is implemented, one operational advantage is that, since this road stretch is located adjoining the Peliyagoda Police Station, strict implementation is possible with close supervision from the Peliyagoda traffic police division. It is important that when flow direction is changed in reversible flow lanes, to pay the utmost care by the implementers towards the safety of the drivers during the transition. It is also important that strict lane discipline be maintained by all drivers for obtaining maximum benefits while ensuring safety of all the road users. References 1. Kadiyali, L. R., ‘Traffic Engineering and
Transport Planning’, Khanna Publishers, 2-B, Nath Market, Nai Sarak, Delhi, India, 1997.
2. Salter, R. J. and Hounsell, N. B., ‘Highway
Traffic Analysis and Design’, MACMILLAN Press Ltd., London, 1996.
3. Khisty, C. J. and Kent Lall, B.,
‘Transportation Engineering – An Introduction’ 2nd Ed. Prentice-Hall International, Inc., New Jersey, 1998.
4. Davidson, K. B., ‘A Flow Travel time
Relationship for Use in Transport Planning’, Proceedings, Australian Road Research Board 3, 1966.
5. Blunden, W. R. and Black, J. A., ‘The Land
Use / Transportation System, 2nd Ed. Pergamon Press, Elmsford, NY, 1984.
6. Weerasekera, K. S., ‘Trial Introduction of a
Bus Lane on A02: A Post-mortem’, ENGINEER Journal of The Institution of Engineers, Sri Lanka, Vol. 43, No. 03, pp. 53-56, The Institution of Engineers, Sri Lanka, July 2010.
ENGINEER - Vol. XXXXIV, No. 04, pp. [16-28], 2011 © The Institution of Engineers, Sri Lanka
ENGINEER 1
Effectiveness of Traffic Forecasting on Pavement Designs for Sri Lankan Roads W. K. Mampearachchi and P. H. Gunasinghe
Abstract: Pavement design plays an important role in any improvement or rehabilitation. It is a responsibility of the road design Engineer to ensure that he has come up with an effective design, so that it will last for the design life. This effectiveness or the optimization is very important as otherwise it could lead to financial implications.
The method adopted for the design of flexible pavements is the TRL, Road Note 31. The two main parameters considered in the design of the pavements under Road Note 31 are Cumulative Number of Standard Axles (CNSA) (i.e. Traffic Class) and the sub-grade strength (i.e. California Bearing Ratio (CBR)% class).
In this research study, flexible pavement designs of recently rehabilitated or improved set of roads were analyzed to check the effectiveness of the traffic forecasting on pavement design. As the sub-grade strength of the pavements is a fixed parameter in all the cases, the only possible variable is the Traffic Class relevant to predicted CNSA.
It was found in the study that the actual traffic growth rates of different modes of traffic which travels along the selected roads is different to the predicted rates at the time of design. It has also been shown and statistically proved that the Equivalent Standard Axles (ESA) values actually applied on these pavements by large trucks / heavy goods vehicles are significantly high, compared to the ESA values recorded at the design stage. The authors have proposed a methodology to evaluate the effectiveness of traffic forecasting on pavement designs, and improvements to the present practice of pavement designs carried out by the Road Development Authority (RDA) and its presentation. Keywords: Pavement Designs, Sri Lankan roads
1. Introduction
The damage that vehicles cause to a road depends very strongly on the axle loads of the vehicles. For pavement design purposes the damaging power of axles is related to a ‘standard’ axle of 8.16 tonnes using equivalence factors which have been derived from empirical studies [1,2] The method adopted for the design of flexible pavements is similar to the Transport Research Laboratory (TRL), Road Note 31,[3]. The two main parameters considered in the design of the pavements under Road Note 31 are Cumulative Number of Standard Axles (CNSA) and the sub-grade strength [3]. The design of rigid pavements is carried out as [4]. The deterioration of paved roads caused by traffic is due to both the magnitude of the individual wheel loads and the number of times these loads are applied. For pavement design purposes, it is therefore necessary to consider not only the total number of vehicles that will use the road, but also the vehicle wheel or axle loads. Hence, both traffic count
and axle load information are essential for pavement design purposes.
In many countries, road traffic is growing rapidly in volume and in the size and weight of the vehicles using the roads. As a consequence, highway engineers concerned with designing new roads or the strengthening of existing roads require reliable information about the distribution of axle loads for existing traffic as well as information on National or regional axle load trends. This information is required, so that accurate forecasts can be made of the axle loads that a road will have to carry over its design life.
Eng. (Dr.) W. K. Mampearachchi, BSc. Eng.(Hons)(Moratuwa), MIE (Sri Lanka), MSCE (South Florida), PhD (Florida), CMILT (UK), Senior Lecturer, Department of Civil Engineering, University Moratuwa, Katubedda, Moratuwa, Sri Lanka. Eng. P. H. Gunasinghe., B.Sc. Eng. (Moratuwa), M.Eng. (Highway & Traffic, Moratuwa), MIE(Sri Lanka), Chief Engineer, Road Development Authority.
enGineeR - Vol. XXXXiV, no. 04, pp, [17-28], 2011© the institution of engineers, sri Lanka

ENGINEER 18
ENGINEER 2
Since the pavement design plays an important role in any improvement or rehabilitation, it is a responsibility of the road design Engineer to ensure that he has come up with an effective design, so that it will last for the design life. This effectiveness or the optimization is very important as otherwise it could lead to financial implications. If it is under designed, it will not last till the end of its design life, thereby incurring huge sums of money for the early rehabilitation and maintenance. If it is over designed, that would also be an undesirable fact, as the cost over run on this could have been utilized to improve another few kilometers of road.
2. Significance of the Problem
If pavements are to be designed adequately, the importance of accurate knowledge about the magnitude and frequency of the axle loads being carried on the roads is self-evident. When any road project is being designed, or appraised at the feasibility stage, it is recommended that a classified traffic count and an axle load survey of commercial vehicles are undertaken. Ideally, such surveys should be carried out several times during the year to reflect seasonal changes [5] in the numbers of vehicles and the magnitude of the loads.
In the Sri Lankan context, it expends a large sum of money on the improvements and the maintenance of the existing road network. Every year, a substantial percent of GDP is allocated for the road sector. As far as the present economic situation of the country is concerned, this allocation is inadequate to meet the expenditure required for the rehabilitation and improvements of the present road network. Hence, the country has to depend on foreign investments, grants and loans for the further improvements and the development of the road sector. The situation has further worsened , as the country is facing an economic crisis. The allocated funds sometimes do not meet even the urgent rehabilitation and maintenance of the entire road network.
In view of the above, there is a need to utilize the limited allocated funds in an effective manner. It is therefore, necessary to make sure that there are well disciplined procedures in
the planning, design, construction, monitoring and maintenance of the entire road network.
3. Present Practice of Pavement Design/Traffic Forecasting
Generally, for the rehabilitation or the road improvement projects funded by the Government of Sri Lanka, the pavement designs are done by the Road Development Authority (RDA). The present method of design is based on the Transport Research Laboratory method [3], but modified to suit local conditions. The method covers roads carrying traffic up to 30 million standard axles during the design period [6]. Also, the specifications for the materials to be used in the various pavement layers are as specified in the standard specifications of RDA.[7] It was found that in most of the occasions the ESA values have been assumed or else typical values for ESA in designs for RDA roads have been used. Sometimes ADT/MCC data used for the designs were out dated. It was also noted that there is no standard or consistency in the design reports. These depend on the design Engineer.
Despite, some improvements have been done for the pavement designs by RDA; it is normally assumed the year of construction (two to three years assumed from the design year) and also uses ESA values recorded elsewhere due to the unavailability of ESA values on the particular road section.
1995 1997 2007
Assumed Design life(10 yrs)
Operation year(Assumed)
Design year
4. Calculation of Actual Traffic Growth Rates
For each road section, the classified quantities of the traffic (Manual Classified Counts, i.e.
Figure 1 - Present Practice of Pavement Design/Traffic Forecasting of RDA

19 ENGINEER
ENGINEER 3
MCC) for each category of vehicles are collected for both the periods of design stage and in the recent past after the road section is opened for traffic. These are converted to ADT using following factors. 4.1. Factors Used for Calculation of ADT The Planning Division of the RDA, generally use expansion factors to convert MCC to ADT depending on the hours of count of the MCC. Factor; 1.1 and 1.2 are usually used to convert 16 hours and 12 hours MCC to ADT respectively. Traffic volume counted in the manual classified count for a certain time period is expanded to obtain the 24 hours traffic volume using expansion factors derived for each district.
4.2 Calculation of Cumulative Number of standard Axles (CNSA)
From the factors derived from the American Association of State Highway and Transportation Officials (ASSHTO) road test which enable the damaging power of axle loads of different magnitudes to be expressed in terms of an equivalent number of standard axle loads, the number of axles of each type of vehicle that will use the road during its design life is equated to an equivalent number of standard axles [8]. The cumulative number of standard axles (CNSA) for the design period can be determined by the expression, CNSA = 365 ∑ Pi [(1+ri)n – 1]
Where,
Pi = number of standard axles
per day as an average for
the 1st year after
construction for vehicle
type i
ri = rate of growth for vehicle
type i
m = number of types of vehicles
n = design life in years.
At the time of pavement design, the predicted number of equivalent standard axles value (Designed CNSA) has been estimated using the traffic volumes (ADT) and the average ESA values of different vehicle categories for the road section concerned assuming that the particular road section would be constructed and in operation after a few years (generally two to three years allowed). 4.3 Selection of Traffic Class & Sub Grade
Strength Class
There are eight traffic classes (T1-T8) and six sub grade strength classes (S1-S6) given in TRL, Road Note 31 (DOE, 1993). The traffic class relevant to calculated CNSA can be selected accordingly. Similarly, sub grade class also can be selected as the CBR of sub grade is known
5. Methodology
In this research study, flexible pavement designs of recently rehabilitated or improved set of roads were analyzed to check the effectiveness of the traffic forecasting on pavement design. As the sub-grade strength of the pavements is a fixed parameter in all the cases, the only possible variable is the Traffic Class relevant to predicted CNSA. In order to test the reliability of the prediction of CNSA, three Scenarios were selected. They were selected based on the Equivalent Standard Axle (ESA), Manual Classified Counts (MCC) and Average Daily Traffic (ADT) data. Recent ADT data and design ADT are associated in the actual traffic growth rates. The local funded and foreign funded roads are analyzed separately because the traffic growth factors used for foreign funded roads are different to local funded roads(as they are two different parties) and also there are slight changes in calculating the pavement layers. So the main data required for this study is recent ADT and recent ESA values of vehicle types for each selected road section. The other data required are number of lanes, last improvement & date of improvement and the design data (i.e. design method, year, design life, ADT, predicted year of operation, actual year of operation, predicted vehicle growth
i =1 ri

ENGINEER 20
ENGINEER 4
rate, design CNSA and design pavement layers).
Since the actual date (year) of operation after rehabilitation / improvement is now known, a more realistic prediction could be made using a new set of data. As such, a new CNSA was calculated for the same design life. This was counted from the actual date of operation using the following scenarios.
Scenario – 1: Calculation of CNSA using recent data (recent ADT & ESA values) and with same (predicted r %), traffic growth rate used for the design (i.e. CNSA supposed to be carried during the rest of the life). Scenario – 2: Calculation of CNSA using design data (ADT & ESA values used for the design) and with actual traffic growth rate calculated. Scenario – 3: Calculation of CNSA using recent data (recent ADT & ESA values) and with actual traffic growth rate calculated. 6. Analysis of Results
ADT data at the design stage is essential to calculate the traffic growth rate. There were many road designs, which could not be selected, as some of the necessary information was not given in the design reports. The inclusion of ADT and ESA values at the design stage are very important. Key information should be given not only for research studies of this nature, but also for the correct engineering application at the time of pavement construction.
Specially, under this study, other problems encountered were the non availability of date of design and anticipated period of construction. These two dates or the years are required to calculate the CNSA values under different scenarios. Therefore, collected data were analyzed with respect to the particular road section in the following manner;
a) Comparison of actual traffic growth rates against the predicted rate using ADT & MCC data. b) Comparison of ESA values used for the
design with the recent ESA values.
c) Comparison of cumulative number of standard axles (CNSA) calculated under three different scenarios against the design cumulative number of standard axle.
6.1 Comparison of Actual Traffic Growth Rates
The calculated traffic growth factors for local funded roads are given in Table 1. Growth rates for the medium and heavy goods vehicles used for the design and the actual values are shown in figure 2. For the local funded roads, the predicted traffic growth rate used for the designs was 5%, except for the Dehiwala–Maharagama road for which 10% growth rate has been selected.
The calculated traffic growth factors for ADB funded roads are tabulated in Table 2. Three different growth factors have been used for the calculation of CNSA at the design stage. These growth factors have been derived from the analysis done in the feasibility study. They are as follows;
i) Growth factor for the period, up to and including the year 2010.
ii) Growth factor for the period, from the year 2011 to the end of the design life. iii) Growth factor for generated traffic at completion of the road.
Similarly, actual growth factors for each vehicle category was calculated for the period between the operation of new surface and the end of design life using the ADT data collected from Planning Division of RDA. Growth factors for large and articulated trucks of the ADB funded road sections are shown in Figure 3.
-8.0
0.0
8.0
16.0
24.0
32.0
40.0
Pili.-M
ah.
Seed-U
du.
CGHW_B
al.
Will.Gopo.
CGHW_D
od.
Maw.B
ypas
s
Dehi.-m
ah.
Road section
Gro
wth
Rat
e
PredictM.GoodH.Good
Figure 2 - Traffic growth rates of medium goods vehicles and heavy vehicles on local funded roads

21 ENGINEER
ENGINEER 5
-20
-15
-10
-5
0
5
10
15
20
25
30
Pel.-Madam.
Weer.-Tissa
Mal.-Timbol.
Tissa-K'gama
Dick.-Beli.
Amb.-Elpiti.
Pana.-Bandar.
Katu.-K'gala
Gam.-Nawa.
Road
Gro
wth
rate
PredictLarge TruckArt. Truck
Figure 3 - Traffic growth rates of large trucks
and articulated trucks- ADB funded roads
Predicted growth factor for the medium bus was 8.9% for the period up to 2010 and it was 7% between 2011 and the end of the design life, for all the roads except on the Katugastota – Kurunegala Road. For that road section, it was 7.3% and 5.7% respectively. For the large bus, predicted growth factor for the period up to 2010 was 5.2% and it was 4% for the period between 2011 and end of the design life, whereas for the Katugastota – Kurunegala Road, it was 4.2% & 3.3% respectively. Actual growth factor calculated for medium bus is negative for all the roads in the selected set of roads except on the Gampola – Nawalapitiya Road which is 1.7%. The actual growth factor for large bus is greater than the predicted growth factor. The reason for the above observations is that passenger transport regulations have imposed a ban on small buses on the roads and to replace them with large buses.
For the small trucks, predicted growth factor for the respective periods are 9.8% and 7.7% except on the Katugastota – Kurunegala Road (i.e. it is 5.5% and 4.3%). It seems that the actual growth factor for small trucks are higher than predicted rates, whilst it is less than the predicted growth rates for large trucks. It was expected that the usage of three axle trucks and articulated trucks would be increasing at and above 5.0% rate, over its design life, on the road sections once those are improved or rehabilitated. The results show that the actual growth factors for both three axle and articulated trucks are significantly higher than predicted growth rates except for a couple of road sections. This has been proved statistically, that there is a significance difference at the 5% significance level between the actual and predicted growth rates for both 3-axle and articulated trucks.
Predicted growth factor for the medium bus was 8.9% for the period up to 2010 and it was 7% between 2011 and the end of the design life, for all the roads where on the Katugastota – Kurunegala Road. For that road section, it was 7.3% and 5.7% respectively. For the large bus, predicted growth factor for the period up to 2010 was 5.2% and it was 4% for the period between 2011 and end of the design life, whereas for the Katugastota – Kurunegala Road, it was 4.2% & 3.3% respectively. Actual growth factor calculated for medium bus is negative for all the roads in the selected set of roads except on the Gampola – Nawalapitiya Road which is 1.7%. The actual growth factor for large bus is greater than the predicted growth factor. The reason for the above observations is that, passenger transport regulations have imposed a ban on small buses on the roads and to replace them with large buses. The negative growth factors are rarely obtained (as shown in Figures 2 & 3) when the recorded count for a particular type of vehicle is less than the previous year/years count for same.
For the small trucks, predicted growth factor for the respective periods are 9.8% and 7.7% except on the Katugastota – Kurunegala Road (i.e. it is 5.5% and 4.3%). It seems that the actual growth factors for small trucks are higher than predicted rates, whilst it is less than predicted growth rates for large trucks. It has been expected that the usage of three axle trucks and articulated trucks would be increasing at and above 5.0% rate, over its design life, on the road sections once those are improved or rehabilitated. The results show that the actual growth factors for both three axle and articulated trucks are significantly higher than predicted growth rates except for a couple of road sections. This has been proved statistically, that there is a significance difference at the 5% significance level between the actual and predicted growth rates for both 3-axle and articulated trucks.
6.2 Comparison of ESA Values
The ESA values obtained from recent axle load surveys for the different vehicle categories, for the local funded road links are tabulated in Table 3. ESA values of medium and heavy goods vehicles used for the design and the actual values of same for the local funded roads are shown in Figure 4.
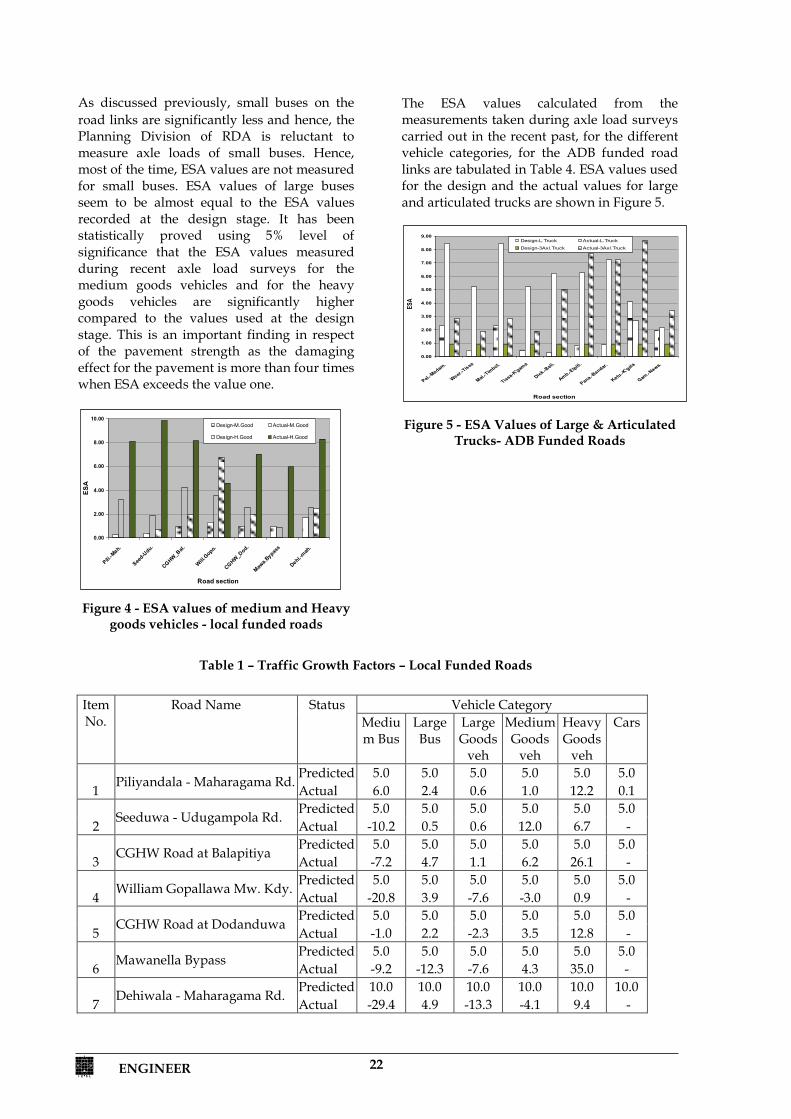
ENGINEER 22
ENGINEER 6
As discussed previously, small buses on the road links are significantly less and hence, the Planning Division of RDA is reluctant to measure axle loads of small buses. Hence, most of the time, ESA values are not measured for small buses. ESA values of large buses seem to be almost equal to the ESA values recorded at the design stage. It has been statistically proved using 5% level of significance that the ESA values measured during recent axle load surveys for the medium goods vehicles and for the heavy goods vehicles are significantly higher compared to the values used at the design stage. This is an important finding in respect of the pavement strength as the damaging effect for the pavement is more than four times when ESA exceeds the value one.
0.00
2.00
4.00
6.00
8.00
10.00
Pili.-M
ah.
Seed-U
du.
CGHW_Bal.
Will.Gopo.
CGHW_Dod.
Mawa.B
ypass
Dehi.-mah
.
Road section
ESA
Design-M.Good Actual-M.Good
Design-H.Good Actual-H.Good
Figure 4 - ESA values of medium and Heavy
goods vehicles - local funded roads
The ESA values calculated from the measurements taken during axle load surveys carried out in the recent past, for the different vehicle categories, for the ADB funded road links are tabulated in Table 4. ESA values used for the design and the actual values for large and articulated trucks are shown in Figure 5.
0.00
1.00
2.00
3.00
4.00
5.00
6.00
7.00
8.00
9.00
Pel.-Madam.
Weer.-Tissa
Mal.-Tim
bol.
Tissa-K'gama
Dick.-Beli.
Amb.-Elpiti.
Pana.-Bandar.
Katu.-K'gala
Gam.-Nawa.
Road section
ESA
Design-L.Truck Actual-L.Truck
Design-3Axl.Truck Actual-3Axl.Truck
Figure 5 - ESA Values of Large & Articulated Trucks- ADB Funded Roads
Item No.
Road Name Status Vehicle Category Medium Bus
Large Bus
Large Goods
veh
Medium Goods
veh
Heavy Goods
veh
Cars
1 Piliyandala - Maharagama Rd.
Predicted 5.0 5.0 5.0 5.0 5.0 5.0 Actual 6.0 2.4 0.6 1.0 12.2 0.1
2 Seeduwa - Udugampola Rd. Predicted 5.0 5.0 5.0 5.0 5.0 5.0
Actual -10.2 0.5 0.6 12.0 6.7 -
3 CGHW Road at Balapitiya Predicted 5.0 5.0 5.0 5.0 5.0 5.0
Actual -7.2 4.7 1.1 6.2 26.1 -
4 William Gopallawa Mw. Kdy. Predicted 5.0 5.0 5.0 5.0 5.0 5.0
Actual -20.8 3.9 -7.6 -3.0 0.9 -
5 CGHW Road at Dodanduwa Predicted 5.0 5.0 5.0 5.0 5.0 5.0
Actual -1.0 2.2 -2.3 3.5 12.8 -
6 Mawanella Bypass Predicted 5.0 5.0 5.0 5.0 5.0 5.0
Actual -9.2 -12.3 -7.6 4.3 35.0 -
7 Dehiwala - Maharagama Rd. Predicted 10.0 10.0 10.0 10.0 10.0 10.0
Actual -29.4 4.9 -13.3 -4.1 9.4 -
Table 1 – Traffic Growth Factors – Local Funded Roads

23 ENGINEER
ENGINEER 7
Item No.
Road Name Stage Vehicle Category Medium
Bus Large Bus
Small Truck
Large Truck
3-Axle truck
Articu. Truck
1
Pelmadulla-Madampe Road (C-11)
upto 2010 8.90 5.20 9.80 6.70 7.10 7.10 2011-End 7.00 4.00 7.70 5.20 5.50 6.60 Actual -6.80 16.10 10.70 0.40 7.60 3.40
2
Weerawila-Kataragama (C-10,1)
upto 2010 8.90 5.20 9.80 6.70 7.10 7.10 2011-End 7.00 4.00 7.70 5.20 5.50 6.60 Actual -6.50 -3.60 -12.60 3.00 13.20 23.80
3
Malwatte,G’wela to Timbolketiya Rd.(C-13)
upto 2010 8.90 5.20 9.80 6.70 7.10 7.10 2011-End 7.00 4.00 7.70 5.20 5.50 6.60 Actual -9.90 8.20 8.70 2.10 18.90 18.90
4
Tissa-Kataragama (C-10,2)
upto 2010 8.90 5.20 9.80 6.70 7.10 7.10 2011-End 7.00 4.00 7.70 5.20 5.50 6.60 Actual -11.60 4.00 4.20 -1.60 12.20 12.20
5
Dickwella-Beliatta (C-10,3)
upto 2010 8.90 5.20 9.80 6.70 7.10 7.10 2011-End 7.00 4.00 7.70 5.20 5.50 6.60 Actual -8.20 7.40 18.40 2.60 29.90 16.10
6
Ambalangoda-Elpitiya (C-5)
upto 2010 8.90 5.20 9.80 6.70 7.10 7.10 2011-End 7.00 4.00 7.70 5.20 5.50 6.60 Actual -10.60 6.90 10.40 6.30 27.80 16.1
7
Panadura-Rathnapura Rd. (C-3)
upto 2010 8.90 5.20 9.80 6.70 7.10 7.10 2011-End 7.00 4.00 7.70 5.20 5.50 6.60 Actual -8.80 15.70 12.70 6.60 24.6 14.9
8
Katugastota-Kurunegala (C-7)
upto 2010 7.30 4.20 8.00 5.50 5.80 5.80 2011-End 5.70 3.30 6.30 4.30 4.50 5.40 Actual -7.30 9.80 8.80 2.50 13.40 10.50
9
Gampola-Nawalapitiya (C-8)
upto 2010 8.90 5.20 9.80 6.70 7.10 7.10 2011-End 7.00 4.00 7.70 6.30 6.60 7.90 Actual 1.70 11.80 10.30 11.70 2.60 -
Table 2 – Traffic Growth Factors – ADB Funded Roads

ENGINEER 24
ENGINEER 8
Item No.
Road Name Stage Vehicle Category Medium
Bus Large Bus
Small Truck
L.Truck
3-Axle truck
Articu. Truck
1 Pelmadulla-Madampe Road (C-11)
Design 0.045 0.146 0.035 2.323 0.867 1.001 Current 0.007 0.340 0.048 8.465 2.850 4.480
2 Weerawila-Kataragama (C-10,1)
Design 0.037 0.193 0.152 0.465 0.867 1.001 Current - 0.368 0.003 5.215 1.865 6.166
3 Malwatte,Godakawela to Timbolketiya Road (C-13)
Design 0.045 0.146 0.035 2.323 0.867 1.001 Current 0.007 0.340 0.048 8.465 2.850 4.480
4 Tissa-Kataragama (C-10,2) Design 0.037 0.193 0.152 0.465 0.867 1.001
Current - 0.368 0.003 5.215 1.865 6.166
5 Dickwella-Beliatta (C-10,3)
Design 0.026 0.076 0.008 0.282 0.867 1.001 Current 0.021 0.439 0.096 6.238 4.987 -
6 Ambalangoda-Elpitiya (C-5)
Design 0.016 0.057 0.011 0.810 0.867 1.001 Current 0.017 0.376 0.309 6.285 7.714 -
7 Panadura-Rathnapura Road (C-3)
Design 0.065 0.216 0.093 3.224 0.867 1.001 Current 0.020 0.438 0.222 5.163 7.250 9.136
8 Katugastota-Kurunegala (C-7)
Design 0.115 0.450 0.162 4.115 0.867 1.001 Current 0.033 0.620 0.220 2.670 8.640 14.900
9 Gampola-Nawalapitiya (C-8)
Design 0.080 0.331 0.071 1.981 0.867 1.001 Current 0.034 0.432 0.165 2.190 3.418 5.886
Item No.
Road Name Stage Vehicle Category
Medium Bus
Large Bus
Large Goods
Veh
MediumGoods
veh
Heavy Goods
veh.
1 Piliyandala - Maharagama Road Design 0.013 0.444 0.003 0.229 -
Current - 0.400 0.321 3.181 8.090
2 Seeduwa - Udugampola road Design 0.049 0.200 0.045 0.370 0.640
Current - 0.400 0.321 1.860 9.843
3 CGHW Road at Balapitiya Design 0.019 0.329 0.176 0.918 1.925
Current 0.020 0.438 - 4.220 8.141
4 William Gopallawa Mw. Kandy Design 0.103 0.704 0.036 1.316 6.728
Current - 0.580 0.003 3.537 4.578
5 CGHW Road at Dodanduwa Design 0.019 0.329 0.176 0.918 1.925
Current 0.017 0.376 0.001 2.509 7.000
6 Mawanella Bypass Design 0.020 0.400 0.176 0.918 0.000
Current 0.169 0.400 0.010 0.864 5.950
7 Dehiwala - Maharagama Road Design 0.170 0.320 0.010 1.680 2.450
Current 0.013 0.370 0.105 2.563 8.290
Table 4 – ESA Values – Foreign Funded Roads
Table 3 – ESA Values – Locally Funded Roads

25 ENGINEER
ENGINEER 9
Similarly, in the local funded road links, ESA values recorded for the medium bus is less than the ESA values recorded at the design stage. However, ESA values of large buses and small trucks are slightly higher than the ESA values recorded at the design stage. It has been statistically proved that the ESA values of large trucks are significantly high compared to the values recorded at the design stage. This is a very important fact, mainly because of the number of large trucks using; ‘A’ & ‘B’ class roads are generally high and thereby create a tendency to damage the pavement structure before the end of its design life.
It has also been statistically proved that recent ESA values calculated for the three axle trucks and articulated trucks are significantly high compared to the ESA values at design stage. However, this may not be a fact that can be highlighted as the ESA values used for the design are default values. These default ESA values have been applied when the total number of a particular vehicle type was less than 10. This default ESA factor was calculated from the average measured values on roads where the number of vehicles weighed was greater than 10.
6.3 Comparison of Cumulative Number of Standard Axle (CNSA) Values
As discussed in the Methodology, Cumulative Number of Standard Axles (CNSA) that would carry or supposed to carry over the rehabilitated or improved pavement were calculated under three (03) different scenarios. Scenario 1 associates the present condition of traffic and it gives an indication as to what would be the result if the present condition of traffic continues at the predicted rate. It also indicates that, for the 90% of the selected road sections, the CNSA of scenario 1 is higher than the design CNSA. Scenario 2 associates the design data and the actual growth rates, and it is applied over the actual design life. Its CNSA values are almost close to the design CNSA.
Scenario 3 represents the present condition of traffic and also the actual growth rate. The CNSA values of it are higher compared to the design CNSA. Comparison of CNSA values calculated under each scenario against the designed CNSA, is done for the local funded roads and for ADB funded roads separately
The CNSA values calculated under each scenario for the local funded roads are shown in the Table 5. The relevant traffic class with respect to the CNSA value and its traffic class is also given for each road section for comparison purposes. As shown in Table 5, except for the two roads section (i.e. William Gopallawa Mawatha, Kandy and Mawanella Bypass Road) traffic class of Scenario-1 is higher than the design traffic class. It also shows that the traffic class of Scenario-3 is higher than that of design traffic class, except for the William Gopallawa Mawatha and Dehiwala-Maharagama roads. As discussed earlier, the ADT used for the design of William Gopallawa Mawatha road was over estimated. For the Dehiwala–Maharagama road, the predicted traffic growth rate for the design is twice compared to others (i.e. r = 10%). These are the probable reasons for the above two exceptions. A similar analysis could be done for the ADB funded roads too, as per the results shown in Table 6. Except for two road sections, the traffic class of Scenario-3 is higher than that of design traffic class. The CNSA values calculated under each Scenario for the ADB funded roads are shown in Table 6.

ENGINEER 26
ENGINEER 12
Table 5 – CNSA Values of Each Scenario – Local Funded Roads
Table 6 – CNSA Values of Each Scenario – ADB Funded Roads
Road Name
Pelm
adul
la-
Mad
ampe
Roa
d (C
11)
Wee
raw
ila –
Tis
sa
[C10
(1)]
Dic
kwel
la –
Be
liatta
(C
10)
Am
bala
ngod
a –
Elpi
tiya
(C5)
Pana
dura
–
Rath
napu
ra
(C3)
Kat
ugas
tota
–
Kur
uneg
ala
(C
7)
Gam
pola
–
Naw
alap
itiya
(C
8)
Tiss
a –
Kat
arag
ama
[C10
(2)]
Mal
wat
te-
Tim
bolk
etiy
a Ro
ad
(C13
)
CNSA Design
4.98 (T5)
0.34 (T2)
0.0 (T1)
0.0 (T1)
8.88 (T6)
8.67 (T6)
5.00 (T5)
0.48 (T2) 3.9 (T5)
CNSA – Scenario-1
9.66 (T6)
1.49 (T3)
3.13 (T5)
4.48 (T5)
16.57 (T7)
6.8 (T6)
11.53 (T7)
0.9 (T3) 8.25 (T6)
CNSA – Scenario-2
3.21 (T5)
0.12 (T1)
0.0 (T1)
0.0 (T1)
6.98 (T6)
8.16 (T6)
7.39 (T6)
0.0 (T1) 2.62 (T4)
CNSA – Scenario-3
10.47 (T7)
1.1 (T3)
6.47 (T6)
9.48 (T6) -- 8.17
(T6) 18.48 (T8)
0.89 (T3) 7.65 (T6)
Road Name Pi
liyan
dala
–
Mah
arag
ama
Seed
uwa
- U
duga
mpo
la
CG
HW
(1) –
Ba
lapi
tiya
Will
iam
G
opal
law
a M
w.,
Kan
dy
CG
HW
(2) -
D
odan
duw
a
Maw
anel
le -
Bypa
ss
Deh
iwal
a –
Mah
arag
ama
CNSA designed 0.75 (T3)
0.73 (T3)
3.9 (T5)
7.35 (T6)
3.6 (T5)
8.8 (T6)
9.65 (T6)
CNSA – Scenario-1 0.92(T4) 8.61(T6) 10.15(T7) 7.23(T6) 6.8(T6) 5.22(T5) 12.9
(T7) CNSA –
Scenario-2 0.83(T3) 1.18(T3) 2.69(T4) 5.4(T5) 3.61(T5) 5.56(T5) 6.09 (T6)
CNSA – Scenario-3 13.68(T7) 14.27(T7) 14.67(T7) 5.91(T5) 7.23(T6) 15.08(T7) 9.57
(T6)

27 ENGINEER
ENGINEER 10
7. Conclusion
In this research study, flexible pavement designs of recently rehabilitated or improved set of roads were analyzed to check the effectiveness of the traffic forecasting on pavement design. As the sub-grade strength of the pavements is a fixed parameter in all the cases, the only possible variable is the Traffic Class relevant to predicted CNSA. In order to test the reliability of the prediction of CNSA, the three Scenarios discussed above, were selected It is better to look back at the three Scenarios discussed above. Scenario – 1: Calculation of CNSA (Cumulative Number of Standard Axles) using recent data (i.e. recent ESA & ADT) and with same traffic growth rate used for the design.(CNSA supposed to carry during the rest of the life) Scenario – 2: Calculation of CNSA using design data (ESA & ADT used for the design) and with actual traffic growth rate. Scenario – 3: Calculation of CNSA using recent data (recent ESA & ADT) and with actual traffic growth rate. The above Scenarios were selected based on the ESA and ADT data. Recent ADT data and design MCC / ADT are associated in the actual traffic growth rates. Following conclusions were made with respect to the actual traffic growth rate and the ESA comparison of each vehicle category. It was observed that at or above 5% growth rates were predicted for both medium buses and large buses. The actual traffic growth rate of medium buses was recorded as a negative rate and also for the large buses; actual growth rate is generally less than 5%. The probable reasons for these findings were discussed above.
It can also be concluded that the growth rate of heavy goods vehicles are higher than the predicted rate. So, this study shows that there is an increasing trend of commercial vehicles on the roads. It has also been shown and statistically proved that the ESA values actually applied on these pavements by large
trucks / heavy goods vehicles are significantly high, compared to the ESA values recorded at the design stage. This could be an important factor that should be taken into account in the design of pavements as the damaging effect of the pavement increases heavily as the number of heavy vehicles increased. In order, that the pavement designs of the selected road sections to be effective, the above factors or the findings should be reflected in the designs. Therefore, the most appropriate Scenario which incorporates all the key factors identified above has to be selected out of the three Scenarios to test the effectiveness of traffic forecasting of the selected set of roads. As such, it can be concluded that “Scenario-3” is the most appropriate one to test the effectiveness of traffic forecasting on pavement designs. For twelve road sections, out of sixteen (i.e.75%), the traffic class related to Scenario-3 is higher than the design traffic class. Hence, it can be concluded that 75% of the selected road designs are under designed. Following recommendations are made in respect of the conclusions made.
i) More emphasis should be given to the estimation of percentage of commercial trucks (heavy goods vehicles).
It is possible that this percentage could substantially change during the period between the actual traffic count and the time of construction.
ii) It is recommended to use more realistic traffic growth rates which are calculated based on the latest ADT data.
iii) As there will be a gap of two to three years or more between the year of design and the year of construction, it is recommended to
re-evaluate the pavement design prior to the construction of a particular road or the section of road concerned with the latest information available.
In order to facilitate the above, following important aspects are proposed to be included in the design report at the design stage. a) Year / Date of design should be Indicated. b) Sub-grade class of each section of road should be indicated.

ENGINEER 28
ENGINEER 11
c) ESA values of each vehicle category used for the design should be indicated d) Year of ADT / MCC ,expansion factors Used for computation of ADT (if
any)and year of axle data should be stated.
e) Predicted year of operation of road pavement should be stated. f) Design report should be consistent (standard). Due to the non availability of adequate data this study was restricted to a few road sections. It is noted that, to improve the pavement designs, this should be analysed further. Future studies should include the selection of more road sections, provided the necessary data is available, and using this study as a foundation to build on.
References
1) Highway Research Board. The AASHO Road Test. Repot 5, Pavement Research Highway Research Board Special Report No. 61E National Research Council, Washington DC. 1962.
2) Paterson, W.D.O., Road Deterioration and Maintenance Effects: Models for Planning and
Management. The Highway Design and Maintenance Standards Series. The International Bank for Reconstruction and Development, Washington DC,1987.
3) DOE, Road Research Laboratory Road Note 31, Fourth Edition, “A Guide to the Structural Design of Bitumen-surfaced roads in Tropical and Sub-tropical Countries” 1993.
4) Millard, R. S., “Road Building in the Tropics” Transport Research Laboratory, Department of Transport, UK. State of the Art Review 9, 1993 PP 231 – 251.
5) Howe, J.D.G.F., A Review of Rural Traffic Counting Methods in Developing Countries, RRL Report LR 427, Road Research Laboratory, Crowthorne, 1972.
6) Road Development Authority, – “A Guide to the Structural Design of Roads under Sri Lanka Conditions”, 1999.
7) Road Development Authority, “Standard Specifications for Construction and Maintenance of Roads and Bridges”, 1989.
8) Liddle, W.J., “Application of AASHO Road Test Results to the Design of Flexible Pavement Structures”. First International Conference on the Structural Design of Asphalt Pavements, University of Michigan, 20-24 August 1962, Anm Arbor, Michigan, 1962 (University of Michigan)

section ii


29 ENGINEER
ENGINEER - Vol. XXXXIV, No. 04, pp, [28-35], 2011 © The Institution of Engineers, Sri Lanka
ENGINEER 1
Comparison of Rational Formula Alternatives for Streamflow Generation for Small Ungauged
Catchments
W.M.D.Wijesinghe and N.T.S.Wijesekera Abstract: A Unit Hydrograph can be derived using the peak discharge obtained from the Rational Equation and using unit depth of rainfall in calculating the Rainfall Intensity. Possible alternatives for selection of sub catchments, selection of a guideline to determine the Runoff Coefficients and the Time of Concentration were taken into account. A significant variation of the results was observed with the selected alternatives. In order to select a better alternative comparison of generated streamflows with the observed values is required. Unit hydrograph derivation using the Rational method would yield a lesser peak flow value and a higher time to peak when spatially distributed approach using sub catchments is used instead of a lumped single catchment The guideline used for determination of Runoff coefficients plays very important role in Rational Method and it showed considerable variation of the results in Welipenna River Basin. The time of concentration estimation method is also important when the catchments become larger. In the Welipenna River Basin the Lumped Parameter method of deriving Unit Hydrograph taking Runoff Coefficient from based on Slope, Land Use and Soil Type with Tc from ID Guidelines a Qp estimate of 0.49m3/s, while the peakflow estimate computed with the distributed parameter method using sub catchments was 0.51m3/s. Keywords: Rational Equation, Runoff Coefficients, Time of Concentration 1. Introduction Majority of the Infrastructure development projects in Sri Lanka often require engineers to work in ungauged catchments. When it is needed to carry out flow estimations for such ungauged catchments, the common method is to determine streamflows using Synthetic means. In the absence of flow data there are many methods for the development of Synthetic Unit Hydrograph (UH). Rational Method is a popular method for estimating peakflows. Once the Rational Method computes the peak discharge from a particular watershed, the Direct Runoff Hydrograph (DRH) computations can be carried out using Ponrajah, 1984 [1]. In these calculations, Rainfall Intensity is required for computing peak discharge. This DRH becomes UH when a unit depth of rainfall is used for the determination of the rainfall intensity. This UH from Rational Method defers due to the methods used. There are several methods to compute the Time of Concentration (Tc) and there are many ways to delineate the sub watersheds.
Wijesekera, 2000 [2] applied Rational method for nineteen watershed that contribute to Colombo Harbour for computing peak flows. In that study comparison of runoff coefficients computed based on tabulated values from handbooks, sample areas and remote sensing data had resulted in a common coefficient value in the case of Colombo Harbour. Batuwitage, Manchanayake and Wickramasuriya, 1986 [3] also applied Rational Equation for 16 catchments in order to calculate peak discharge. In that study they have also used the Method Recommended by Ponrajah, 1984 [1], Kirpich Equation and Bransby-William Equation, for computing Time of Concentration. In the said study it has been generally observed that the estimated values for the design flood taking the time of concentration from the Kirpich Equation and Bransby-William Equation are high when
W.M.D.Wijesinghe, B.Sc. Eng. (Moratuwa), Research Assistant, Department of Civil Engineering, University of Moratuwa, Sri Lanka Eng. (Prof.) N.T.S.Wijesekera, B.Sc. Eng. (Sri Lanka), C. Eng., FIE(Sri Lanka), M. Eng. (Tokyo), D. Eng. (Tokyo), Senior Professor of Civil Engineering, Department of Civil Engineering, University of Moratuwa, Sri Lanka
enGineeR - Vol. XXXXiV, no. 04, pp, [29-36], 2011© the institution of engineers, sri Lanka
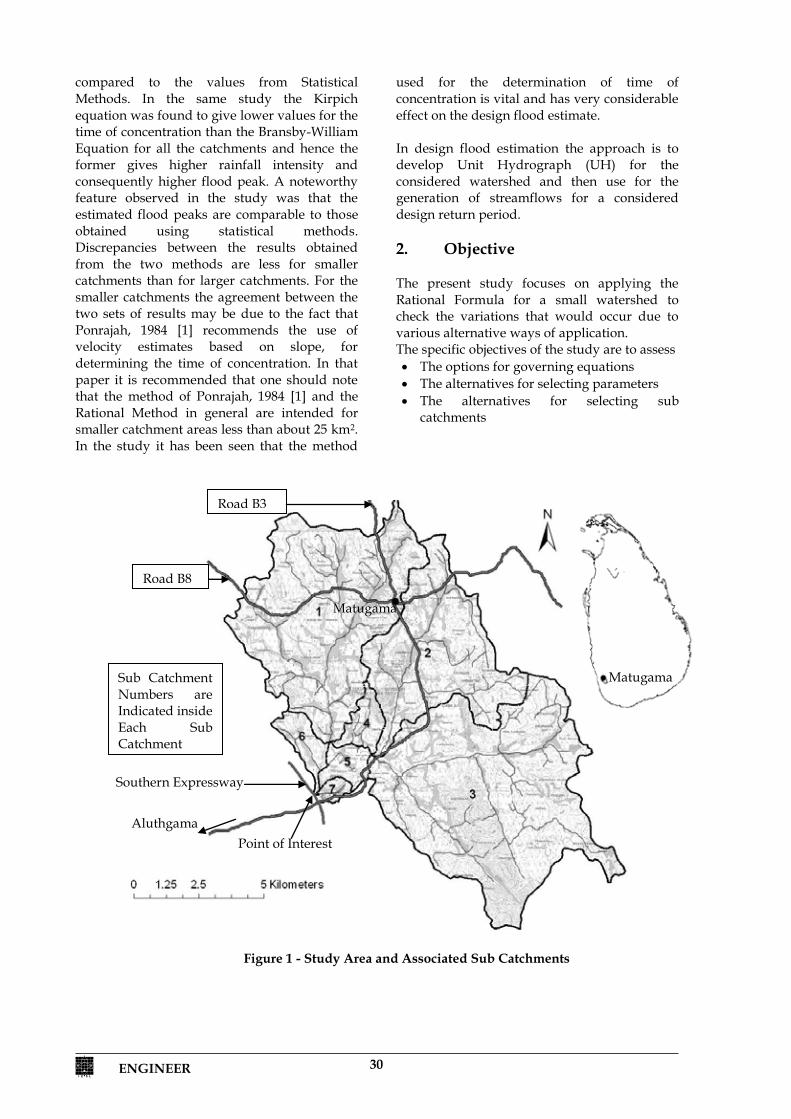
ENGINEER 30
ENGINEER 2
compared to the values from Statistical Methods. In the same study the Kirpich equation was found to give lower values for the time of concentration than the Bransby-William Equation for all the catchments and hence the former gives higher rainfall intensity and consequently higher flood peak. A noteworthy feature observed in the study was that the estimated flood peaks are comparable to those obtained using statistical methods. Discrepancies between the results obtained from the two methods are less for smaller catchments than for larger catchments. For the smaller catchments the agreement between the two sets of results may be due to the fact that Ponrajah, 1984 [1] recommends the use of velocity estimates based on slope, for determining the time of concentration. In that paper it is recommended that one should note that the method of Ponrajah, 1984 [1] and the Rational Method in general are intended for smaller catchment areas less than about 25 km2. In the study it has been seen that the method
used for the determination of time of concentration is vital and has very considerable effect on the design flood estimate. In design flood estimation the approach is to develop Unit Hydrograph (UH) for the considered watershed and then use for the generation of streamflows for a considered design return period. 2. Objective The present study focuses on applying the Rational Formula for a small watershed to check the variations that would occur due to various alternative ways of application. The specific objectives of the study are to assess The options for governing equations The alternatives for selecting parameters The alternatives for selecting sub
catchments
Figure 1 - Study Area and Associated Sub Catchments
Aluthgama
Southern Expressway
Point of Interest
Matugama
Matugama
Sub Catchment Numbers are Indicated inside Each Sub Catchment
Road B3
Road B8

31 ENGINEER
ENGINEER 3
3. Study Area The study was carried out for the watershed of Welipenna Ganga, which is a tributary of Bentota Ganga, at its intersection point with the Southern Expressway near the Welipenna Interchange of the said Expressway, which has a drainage area of 121km2. This watershed is an ungauged watershed which causes flooding at the intersection after the construction of a drainage structure. As part of the effort to find solutions for flooding, the investigation of peakflow estimation at this catchment was undertaken. The catchment is in a rural setting with land uses of paddy, forest, scrubs and commercial cultivations of rubber, tea and coconut with smaller urban area. There are no reservoirs or other significant water storages within the basin or water diversions from or into the watershed. Field visits were undertaken to observe the watershed and its drainage characteristics. 1:10,000 topographic maps of the Survey Department of Sri Lanka were used for calculation of catchment parameters. The watershed could be divided into seven sub catchments, considering the major tributaries of and the main watercourse (Figure 1). Parameters required for the calculations extracted from the main watershed and each sub watershed are presented in Table 1. Catchment slopes were determined considering the elevation difference of the highest and lowest points of the longest stream, H of each sub catchment. 4. Methodology 4.1 Approach In this approach it is assumed that the peak discharge is observed after Tc duration, where Tc is the time of concentration for the watershed and in computing peak discharge the rainfall intensity is assumed to be constant within Tc duration. Since the Unit Hydrograph (UH) is derived for a unit depth of rainfall over certain duration the rainfall intensity was calculated assuming one inch rainfall over Tc duration. A curvilinear UH was obtained for each case using the dimensionless coefficients given in Irrigation Department (ID) Guidelines [4] and the co-ordinates of the Unit Hydrographs were then modified so that the area under the curve is unity.
The main parameters required to determine the UH for a particular watershed are, Runoff Coefficients (RC), Tc and the area of the watershed. 4.2 Alternatives for Selecting Runoff
Coefficients RC computations were determined using three guidelines. Runoff coefficients were calculated based on Guideline 1 slope [1] Guideline 2 Land Use [5] Guideline 3 Slope, Land Use and Hydrologic Soil Type [6]. 4.3 Options for Governing Equations The equations in references were used to calculate the time of concentration. Irrigation Department (ID) Guidelines [1], Tc=L/(60V)+15 ….(1) Where L= Longest stream length (feet) V= Flow Velocity obtained from ID Guidelines (feet/s) Kirpich Equation [5] Tc = 0.0078L0.77S-0.385 .... (2)
Where L= Longest stream length (feet) S= Watershed Slope (feet/feet)
Bransby-William (B-W) Formula [7]. ….. (3)
Where L= Longest stream length (km) S= Watershed Slope (m/km) A= Watershed Area (km2)
4.4 Spatial Variation of Sub Catchments For the comparative assessment, three cases were considered. Case 1 Peakflow estimations were made considering the entire drainage area for the considered location as a single lumped unit. Case 2 The peakflow computations for each sub-catchment was carried out considering that the sub watershed outlet is the point at which a sub-watershed would drain to the main stream while assuming that flow taking place along the mainstream subsequent to the joining, would not have any effect on the estimations. Case 3 Peakflow estimations were carried out considering that runoff generation of a particular watershed would be limited to the drainage area determined by the point at which the sub-watershed joins the main stream but
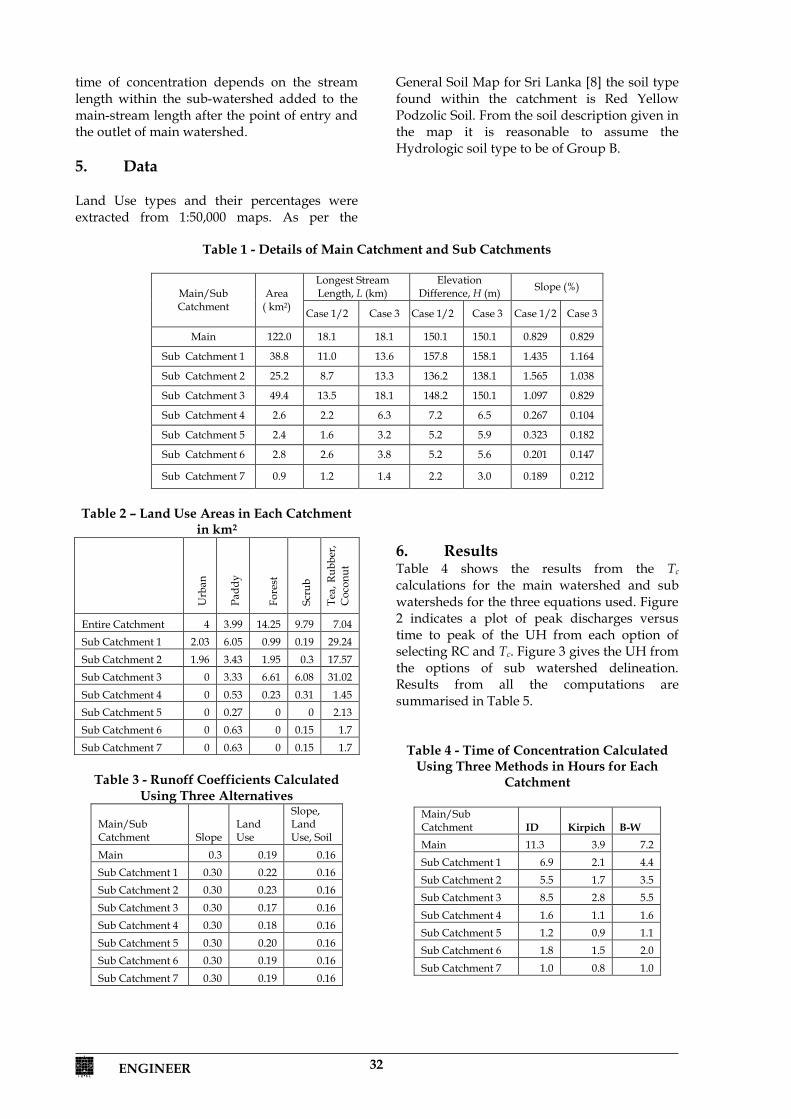
ENGINEER 32
ENGINEER 4
time of concentration depends on the stream length within the sub-watershed added to the main-stream length after the point of entry and the outlet of main watershed. 5. Data Land Use types and their percentages were extracted from 1:50,000 maps. As per the
General Soil Map for Sri Lanka [8] the soil type found within the catchment is Red Yellow Podzolic Soil. From the soil description given in the map it is reasonable to assume the Hydrologic soil type to be of Group B.
Table 1 - Details of Main Catchment and Sub Catchments
Table 2 – Land Use Areas in Each Catchment
in km2
Urb
an
Padd
y
Fore
st
Scru
b
Tea,
Rub
ber,
Coc
onut
Entire Catchment 4 3.99 14.25 9.79 7.04 Sub Catchment 1 2.03 6.05 0.99 0.19 29.24 Sub Catchment 2 1.96 3.43 1.95 0.3 17.57 Sub Catchment 3 0 3.33 6.61 6.08 31.02 Sub Catchment 4 0 0.53 0.23 0.31 1.45 Sub Catchment 5 0 0.27 0 0 2.13 Sub Catchment 6 0 0.63 0 0.15 1.7 Sub Catchment 7 0 0.63 0 0.15 1.7
Table 3 - Runoff Coefficients Calculated
Using Three Alternatives
Main/Sub Catchment Slope
Land Use
Slope, Land Use, Soil
Main 0.3 0.19 0.16 Sub Catchment 1 0.30 0.22 0.16 Sub Catchment 2 0.30 0.23 0.16 Sub Catchment 3 0.30 0.17 0.16 Sub Catchment 4 0.30 0.18 0.16 Sub Catchment 5 0.30 0.20 0.16 Sub Catchment 6 0.30 0.19 0.16 Sub Catchment 7 0.30 0.19 0.16
6. Results Table 4 shows the results from the Tc calculations for the main watershed and sub watersheds for the three equations used. Figure 2 indicates a plot of peak discharges versus time to peak of the UH from each option of selecting RC and Tc. Figure 3 gives the UH from the options of sub watershed delineation. Results from all the computations are summarised in Table 5.
Table 4 - Time of Concentration Calculated Using Three Methods in Hours for Each
Catchment
Main/Sub Catchment ID Kirpich B-W Main 11.3 3.9 7.2 Sub Catchment 1 6.9 2.1 4.4 Sub Catchment 2 5.5 1.7 3.5 Sub Catchment 3 8.5 2.8 5.5 Sub Catchment 4 1.6 1.1 1.6 Sub Catchment 5 1.2 0.9 1.1 Sub Catchment 6 1.8 1.5 2.0 Sub Catchment 7 1.0 0.8 1.0
Main/Sub Catchment
Area ( km2)
Longest Stream Length, L (km)
Elevation Difference, H (m) Slope (%)
Case 1/2 Case 3 Case 1/2 Case 3 Case 1/2 Case 3
Main 122.0 18.1 18.1 150.1 150.1 0.829 0.829
Sub Catchment 1 38.8 11.0 13.6 157.8 158.1 1.435 1.164
Sub Catchment 2 25.2 8.7 13.3 136.2 138.1 1.565 1.038
Sub Catchment 3 49.4 13.5 18.1 148.2 150.1 1.097 0.829
Sub Catchment 4 2.6 2.2 6.3 7.2 6.5 0.267 0.104
Sub Catchment 5 2.4 1.6 3.2 5.2 5.9 0.323 0.182
Sub Catchment 6 2.8 2.6 3.8 5.2 5.6 0.201 0.147
Sub Catchment 7 0.9 1.2 1.4 2.2 3.0 0.189 0.212

33 ENGINEER
ENGINEER 5
Figure 2 – Results of Peakflow and Corresponding Time to Peak with Variation of Runoff Coefficient, Tc estimation method and Method of Watershed Delineation
Figure 3 - UH for Different Watershed Delineation Options
0
0.2
0.4
0.6
0.8
1
1.2
1.4
0 5 10 15 20 25 30 35 40
time (hours)
Disc
harg
e (m
3 /s)
Case 1Case 2Case 3
0
0.5
1
1.5
2
2.5
3
3.5
4
4.5
0 2 4 6 8 10 12
Time to Peak (hours)
Pea
k D
isch
arge
(m3 /s
)ID
Kirpich
B-W
Case 1 Case 2 Case 3
Slope Land Use
Slope, Landuse, Soil

ENGINEER 34
ENGINEER 6
Table 5 - Summary of Peak Discharges and Times to Peaks
Qp in m3/s with Tc from ID
T p (h
ours
)
Qp in m3/s with Tc from Kirpich
T p (h
ours
)
Qp in m3/s with Tc from B-W Formula
T p (h
ours
)
Slop
e
Land
Use
Slop
e, L
and
Use
, Soi
l
Slop
e
Land
Use
Slop
e, L
and
Use
, Soi
l
Slop
e
Land
Use
Slop
e, L
and
Use
, Soi
l
Case 1 0.91 0.67 0.49 11.25 2.62 1.92 1.40 3.88 1.43 1.05 0.76 7.13 Case 2 1.21 0.89 0.65 6.75 3.92 2.87 2.09 2.00 1.90 1.39 1.01 4.00 Case 3 0.95 0.70 0.51 9.13 2.91 2.13 1.55 2.88 1.42 1.04 0.76 6.13
7. Discussion 7.1 Runoff Coefficients Runoff Coefficients based on Guideline 1 (Slope) always gave higher values resulting higher peak discharges. This is because the peak discharge was calculated using Rational Equation and in that equation the peak discharge is directly proportional to the Runoff Coefficient, when the other parameters are kept constant. Guideline 3 (Slope, Land Use and Soil Type) for selecting Runoff Coefficients can be considered as the most accurate one compared to the other two guidelines, since it uses three criteria for determining runoff coefficients. Therefore the peak values obtained from the other two methods were compared with the results from Guideline 3.
Table 6 - Percentage Variation of the Peakflows from Guideline 1 and 2 Compared
to the Results from Guideline 3 Tc Computation Method
Catchment Delineation Method
Guideline 1
Guideline 2
ID Guidelines
Case 1 85.71 36.73 Case 2 86.15 36.92 Case 3 86.27 37.25
Kirpich Equation
Case 1 703.57 37.14 Case 2 222.97 37.32 Case 3 489.03 37.42
B-W Equation
Case 1 410.53 38.16 Case 2 98.02 37.62 Case 3 278.95 36.84
7.2 Time of Concentration and Time to Peak Theoretically both Time to Peak and Peak Discharge are influenced by Time of Concentration since it is used in both peakflow estimation and determination of time to peak. (Figure 2). From Figure 2 it is noticed that there is a vital effect from the method used to
estimate Time of Concentration to Peak Discharge and Time to Peak. The Tc values for the main catchment and each sub catchment from the three methods are presented in Table 5. Kirpich Equation resulted in the lowest values of Tc while ID guidelines resulted in the highest values of Tc. The values calculated using Kirpich equation were used as base values for the determination of the percentage variation of the values from the other two equations. Table 7 - Percentage Difference of Tc from ID
and B-W Equations Compared to Tc from Kirpich Equation
Main/Sub Catchment
Catchment Area (m2)
% Difference of Tc with
Kirpich Equation
ID B-W Main 122.0 189.7 84.6 Sub 1 38.8 228.6 109.5 Sub 2 25.2 223.5 105.9 Sub 3 49.4 203.6 96.4 Sub 4 2.6 45.5 45.5 Sub 5 2.4 33.3 22.2 Sub 6 2.8 20.0 33.3 Sub 7 0.9 25.0 25.0
As evident in Table 7 the Tc difference between the Tc values from the three equations reduces when the catchments become smaller. Sub Catchment 7, the smallest among the seven sub catchments, 7.3 Catchment Delineation It is common knowledge that when lumped parameter models are replaced by spatially distributed parameter models then the computations would be reaching better values and closer to the reality. Therefore in case of synthetic unit hydrograph derivation too, when a drainage area is divided into sub catchments and computations are carried out, it is expected

35 ENGINEER
ENGINEER 7
that the values thus computed would provide realistic answers. Watershed streamflow amount and timing are mostly governed by the flow taking place over the land surface. The channel flows are often considered as less time consuming since the flow is concentrated into narrow sections and reaching the outlet at a comparatively less time than the overland flows. Accordingly in most hydrologic computations, flow through channel sections is usually ignored and only the processes within the rest of the watershed is utilised for assessments. The Case 2 of the present work is to simulate a similar situation where a modeller may opt to ignore the channel length from the exit of a particular sub watershed up to the main outlet of the drainage area. The case 3 takes into full account of both the overland flow and the channel flow components up to the main drainage outlet. The Case 1 is a typical lumped modelling approach. From engineering basics, it is clear that Case 3 would be the most appropriate approach and that the Case 1 would be the most simple and quick approach. The attempt of the present work was to capture the change in the values of peakflow and time to peak, when a modeller opts to either lump the parameters, or carryout a spatially distributed sub catchment approach or ignore the stream effects out side of the sub watersheds. Table 8 shows the variation of Peakflows and Time to Peak in Case 2 and 3 with respect to those of Case 1.
Table 8 – Percentage Variation of Peakflows and Time to Peak in Case 2 and 3 with respect
to those of Case 1.
In the scale of the present case study watersheds, this work clearly indicates that there is a significant benefit both in the design of structures and planning flood warning, when a modeller opts to perform the synthetic
unit hydrograph computations in a spatially distributed manner. It is also important to recognise that if the time taken for water to flow up to main catchment outlet from each sub catchment outlet is ignored, then there would be very high differences in Peak Discharge and Time to Peak, even for catchments of the magnitude selected for the present work. 8. Conclusions and
Recommendations
Unit hydrograph Derivation using the Rational method would yield a lesser peak flow value and a higher time to peak when spatially distributed approach using sub catchments is used instead of a lumped single catchment
The guideline used for determination of Runoff coefficients plays very important role in Rational Method and it showed considerable variation of the results in Welipenna River Basin.
The time of concentration estimation method is also important when the catchments become larger.
In the Welipenna River Basin the Lumped Parameter method of deriving Unit Hydrograph taking Runoff Coefficient from Guideline 3 and with Tc from ID Guidelines, resulted in a Qp estimate of 0.49m3/s, while the peakflow estimate computed with the distributed parameter method using sub catchments was 0.51m3/s.
References
1. Ponrajah, A.J.P, Design of Irrigation Headworks for Small Catchments, 1st Ed. Irrigation Department, Colombo, 1984.
2. Wijesekra, N.T.S., “A Comparison of Peak
Flow Estimates for Small Ungauged Urban Watersheds”, Transactions, Annual Sessions of the IESL, Institution of Engineers, Sri Lanka, October 2000.
3. Batuwitage, L.P, Manchanayake, P.,
Wickramasuriya, S.S, “Comparative Study of Some Design Flood Estimation Methods for Sri Lanka”, Engineer, The Journal of Institution of Engineers of Sri Lanka, Vol: XIV, No. 03, September 1986.
4. Ponrajah, 1988, Technical Guidelines for
Irrigation Works, 1st Ed. Irrigation Department, Colombo, 1988.
T c
Estim
atio
n M
etho
d
Cat
chm
ent
Del
inea
tion
Met
hod
Peakflow
Tim
e to
Pea
k
Slop
e
Land
use
Slop
e,
Land
use,
So
il
ID Guidelines
Case 2 32.97 32.84 32.65 -40.00 Case 3 4.40 4.48 4.08 -18.84
Kirpich Equation
Case 2 49.62 49.48 49.29 -48.45 Case 3 11.07 10.94 10.71 -25.77
B-W Formula
Case 2 32.87 32.38 32.89 -43.90 Case 3 -0.70 -0.95 0.00 -14.03

ENGINEER 36
ENGINEER 8
5. Chow, Ven Te, Maidment, David R., Mays, Larry W., Applied Hydrology,. Mc Grow Hill, 1988.
6. Maidment, David R., Applied Hydrology, Mc Grow Hill, Inc, 1993.
7. Institution of Engineers, Australia,
Australian Rainfall and Runoff, 1977.
8. General Soil Map of Sri Lanka, National Atlas of Sri Lanka, Survey Department of Sri Lanka, 1988.

37 ENGINEER
ENGINEER - Vol. XXXXIV, No. 04, pp, [36-44], 2011 © The Institution of Engineers, Sri Lanka
ENGINEER 1
Monitoring of Total Suspended Particles & Toxic Gasses in Stationary Combustion Systems
K T Jayasinghe
Abstract: A number of unaccounted combustion systems have been operated island wide to meet various power demands such as electricity generation, product manufacturing, process applications etc. Such systems differ from each other according to the types of combustion, types of fuel used, capacity etc. Whether the processing plant/system is small or large, it requires to burn different kinds of fuels to obtain driving forces. Widely used fuels in the country for these types of combustion systems are coal, heavy oil, light oil, LP gas, fire wood, bagas, bio gas etc. All combustion systems emit solid waste (e.g. Ash, Charcoal etc.), gaseous waste (e.g. Suspended particles, Carbon Monoxide, Carbon Dioxide, Sulphur Dioxide, Nitrogen Dioxide etc) and waste heat (conduction, convection, radiation etc) as by products during the fuel combustion. Monitoring of such gaseous waste is more difficult than monitoring of solid wastes and waste heat. There are standard flue gas emission control systems inbuilt with large capacity combustion systems such as electricity generation plants, paper/ sugar industries etc. Also, standard monitoring levels are published by reputed organizations and authorities. However, when renewing the license for setting up a new plant, especially in the Small & Medium Industries (SMI) it is essential to prove that their combustion systems are operated under the standard level (i.e. environmental friendly manner). But most of the owners ; especially SMI holders, have met with difficulties to get the required environmental certificates due to lack of awareness, non availability of measuring facilities / control mechanisms of old (existing) combustion systems and non availability of reference standards (for small combustion systems) etc. Therefore, this paper aims to discuss the widely used combustion systems in small & medium industries, common flue gas emission parameters, proposed and applicable environmental standards, sample locations and pre facility required for monitoring. Key Words: Bagas, Bio Gas, Combined Cycle, Distillation, Effluent Gases, Flue Gas, Hydraulic Diameter, Homogeneity, Parboiling, Refinery, Randleman, Suspended Particles, Volatile, Volumetric Flow 1.0 Introduction: Thermal energy requirements of industries have been met by firing different kinds of fuels in different kinds of combustion chambers. The number of systems available in the country cannot be quantified but can be classified/ categorized according to the type of fuel used, type of plant and type of process application. Many industries, especially located in urban areas and industrial zones, have obtained required thermal energy by firing heavy oil, their light oil or LP gas in different types of firing chambers. In addition to these fossil fuel systems, many numbers of bio mass fuel combustion systems and limited numbers of coal fired systems are available in different locations.
The emission control of solid fuel combustion systems, such as coal, fire wood, bio mass etc., is rather difficult than the emissions of fossil fuel combustion systems. However, due to the increase of imported fuel prices, many industries have converted their fossil fuel combustion system to solid fuel combustion systems.
Eng. K T Jayasinghe, BSc. Eng (Hon), M Eng (Energy Technology), AMIE(Sri Lanka), Principal Research Engineer, Energy & Environmental Management Centre, National Engineering Research & Development Centre.
enGineeR - Vol. XXXXiV, no. 04, pp, [37-45], 2011© the institution of engineers, sri Lanka

ENGINEER 38
ENGINEER 2
Therefore, during the last five years, use of bio mass in industries have been increased to over 681,000 Metric Tons [Annual Energy Balance 2007; Sri Lanka Sustainable Energy Authority]. While increasing the number of firing systems, there would be a high amount of emissions (both particles and gasses) to the atmosphere and therefore, responsible authorities have tightened the environmental rules & regulations against the industries.
2.0 Widely Used Combustion Systems in Industries
The various types of combustion systems available in the country can be categorized into three different groups such as large scale combustion systems, medium scale combustion systems and small scale combustion systems. The large scale combustion systems comprise up-and-coming new combined cycle power plants, diesel engine power plants, petroleum refineries, bagas combustion systems in sugar mills, kiln and furnaces operated in glass, cement, ceramic industries etc. Many numbers of furnace oil/ diesel/ fire wood combustion steam or hot water generated boiler systems have been operated in many industries all over the country. These types of combustion systems can be included in the medium scale category. In addition to those boiler systems, different types of kilns, furnaces, dryers, solid waste disposal systems have been used in industries such as garment, food processing, manufacturing, distillation processes, hotel etc. The small scale processing plants have been widely spread all over the country in urban and rural areas as well. Parboiling systems in rice mills, foundry furnaces, bakeries, charcoal processing, etc can be included in this category. In addition to the combustion systems, some processing industries emit different kinds of gases and suspended particles to the atmosphere as a waste/or by product from their processing plants, such as chemical processing plants, coir industry, metal crushers, service stations, saw mills etc.
3.0 Compositions of Exhaust Gases
in Combustion Systems The main stack emissions from fossil fuel combustion systems are Carbon Dioxide (CO2), Carbon Monoxide (CO), Sulphur Dioxide (SO2), Oxides of Nitrogen (NOx) and Total Suspended Particles (TSP) or Volatile Organic Compounds (VOC). In addition to these major emission parameters, Lead (Pb), Chlorine (Cl2), Methane (CH4) etc. are included as minor components and emission of these gases depends on the composition of the fuel. The emissions of Carbon Dioxide (CO2) and VOC in fire wood combustion systems are relatively higher than the emissions of fossil fuel combustion systems. However, SO2 content in fire wood combustion systems is comparatively negligible. The same pollutants are produced when fuels are burnt elsewhere in any type of application. However, the emission quantity depends on the plant capacity and the operating period. Flue gas emission parameters in different capacity combustion systems are given in Table-1. The values given in this table are average figures of several tests in similar kinds of plant/machineries or processes. The values of gases vary within the range of +/- 10 % (except CO level), and the values of TSP vary within the range of +/- 1.0 %. 3.1 Measuring Techniques There is a wide choice of different sampling and analytical techniques, published methods and equipment that can be used to carry out stack emission measurements. This paper describes only the widely used and applicable principles, standards, measuring techniques etc. by focusing on the small and medium industries in order to get a general overview to prepare sampling accesses for flue gas analysis.
ENGINEER 3
Table 1 - Flue Gas Emission Parameters in Different Capacity of Combustion Systems
Plant Category Fuel Type Parameters
CO2 (%)
CO (%)
NOx (ppm)
SO2 (ppm) O2 (%) Ex. Air
(%) Temp.
(0C) TSP
(mg/Nm3)
High Capacity (300 MW) Electricity Generation Fossil Fuel 4.5 0.002 180 15 15 300 500 80-100
High Capacity Thermal & Electricity Generation Bagas 10 1.000 70 650 10.0 55 230 3500 -
4500 Medium Capacity (17 MW) Electricity Generation
Diesel 5.5 0.002 775 100 14 250 370 30-50
Medium Capacity Steam Generation Fossil Fuel 12 0.002 30 420 4 25 185 10 - 15
Medium Capacity Steam Generation Fire wood 4 0.040 50 35 17 400 200 60 - 75
Small Capacity Kiln Fossil Fuel (LP Gas) 3 0.001 10 5 17 400 250 ---
Small Capacity Air Heaters Fire wood 3 1.500 25 10 15 450 150 ---
Incinerator (with Monitoring System)
Fossil Fuel / Wastes 9.0 0.003 45 4700 6.5 45 570 ---
Incinerator (without Monitoring System)
Fossil Fuel / Wastes 5 0.030 130 5 14 200 60 250 - 500
In general, two methods of gas determinations; extractive sampling method and non – extractive sampling method, have been practiced. However, the extractive sampling method is the most common and widely used. In extractive sampling, effluent gases are conditioned to remove interfering substances and particulate matter before being conveyed to the instrument. On the other hand, non extractive sampling does not remove interfering substances and sampling is confined to the gas stream in the stack or duct.
There are two measuring principles in practice to monitor flue gas emissions. These are the Periodic Emission Monitoring (PEM) and Continuous Emission Monitoring (CEM) systems. The PEM is applied to the medium and domestic level combustion systems and the CEM is applied to the large scale combustion systems. In other words, large scale combustion systems have their own inbuilt flue gas monitoring systems. However, the others have to get their consultancies by reputed parties for the measurements.
3.2 Methods and Standard Codes: Practices Many standard methods and codes developed by various standard institutes can be applied to prepare the sample locations and to monitor the emission levels (measurements). However, the
parties who are involved in such type of activities should follow the correct and convenient methods. The selection of particular methods/or codes may depend on the type of combustion systems, plant size, fuel used etc. The applicable common methods and standard codes for different combustion systems are given in Table A-1 in Appendix A. Sometimes the relevant standard methods and codes for the particular plant will be provided by the plant manufacture. 3.3 Local Standards and Parameters
Limitations The local standards available in the country are still in draft level. These local proposed standards will be implemented by the Central Environmental Authority (CEA) in Sri Lanka. The measuring parameters and limitations of the CEA proposed standards depend on the source specified, type of industries, capacity of the combustion system, method of combustion etc. In addition to those special categorizations, general atmospheric emission standards have been introduced; highlighting the upper limit of emission parameters for any general Stationary Source. Table A-2 in Appendix A shows the general atmospheric emission standards for stationary sources.

39 ENGINEER
ENGINEER 3
Table 1 - Flue Gas Emission Parameters in Different Capacity of Combustion Systems
Plant Category Fuel Type Parameters
CO2 (%)
CO (%)
NOx (ppm)
SO2 (ppm) O2 (%) Ex. Air
(%) Temp.
(0C) TSP
(mg/Nm3)
High Capacity (300 MW) Electricity Generation Fossil Fuel 4.5 0.002 180 15 15 300 500 80-100
High Capacity Thermal & Electricity Generation Bagas 10 1.000 70 650 10.0 55 230 3500 -
4500 Medium Capacity (17 MW) Electricity Generation
Diesel 5.5 0.002 775 100 14 250 370 30-50
Medium Capacity Steam Generation Fossil Fuel 12 0.002 30 420 4 25 185 10 - 15
Medium Capacity Steam Generation Fire wood 4 0.040 50 35 17 400 200 60 - 75
Small Capacity Kiln Fossil Fuel (LP Gas) 3 0.001 10 5 17 400 250 ---
Small Capacity Air Heaters Fire wood 3 1.500 25 10 15 450 150 ---
Incinerator (with Monitoring System)
Fossil Fuel / Wastes 9.0 0.003 45 4700 6.5 45 570 ---
Incinerator (without Monitoring System)
Fossil Fuel / Wastes 5 0.030 130 5 14 200 60 250 - 500
In general, two methods of gas determinations; extractive sampling method and non – extractive sampling method, have been practiced. However, the extractive sampling method is the most common and widely used. In extractive sampling, effluent gases are conditioned to remove interfering substances and particulate matter before being conveyed to the instrument. On the other hand, non extractive sampling does not remove interfering substances and sampling is confined to the gas stream in the stack or duct.
There are two measuring principles in practice to monitor flue gas emissions. These are the Periodic Emission Monitoring (PEM) and Continuous Emission Monitoring (CEM) systems. The PEM is applied to the medium and domestic level combustion systems and the CEM is applied to the large scale combustion systems. In other words, large scale combustion systems have their own inbuilt flue gas monitoring systems. However, the others have to get their consultancies by reputed parties for the measurements.
3.2 Methods and Standard Codes: Practices Many standard methods and codes developed by various standard institutes can be applied to prepare the sample locations and to monitor the emission levels (measurements). However, the
parties who are involved in such type of activities should follow the correct and convenient methods. The selection of particular methods/or codes may depend on the type of combustion systems, plant size, fuel used etc. The applicable common methods and standard codes for different combustion systems are given in Table A-1 in Appendix A. Sometimes the relevant standard methods and codes for the particular plant will be provided by the plant manufacture. 3.3 Local Standards and Parameters
Limitations The local standards available in the country are still in draft level. These local proposed standards will be implemented by the Central Environmental Authority (CEA) in Sri Lanka. The measuring parameters and limitations of the CEA proposed standards depend on the source specified, type of industries, capacity of the combustion system, method of combustion etc. In addition to those special categorizations, general atmospheric emission standards have been introduced; highlighting the upper limit of emission parameters for any general Stationary Source. Table A-2 in Appendix A shows the general atmospheric emission standards for stationary sources.

ENGINEER 40
ENGINEER 4
4.0 Sample Locations and Facility Requirements
The fundamental principle behind any sampling activity is that a small amount of collected material should be a representative of all the material being monitored. The number of samples (Tests) will depend on the homogeneity of the gas stream. Variations in concentration, temperature or velocity across the duct caused by moisture, gas leakage or air infiltration can effect the measurements. The sampling approach, techniques, method and equipment that are used can have different effects on the requirements for access, facility and services. However, the following basic requirements should be met with each system. - access to the sampling point,
- entry for sampling equipment into the stack,
- adequate space to the instruments and personnel,
- provision of essential services, electricity etc
4.1 Preparations of Sample Locations
4.1.1 Position of the Sample Plane
The selected sampling plane is usually in a section of the duct with five hydraulic diameters of straight duct upstream and two hydraulic diameters downstream. If the sampling planes are to be located near the top of the stack outlet, then the top should be five hydraulic diameters. The sample plane should be situated in a length of straight duct (prefer vertical) with uniform shape and cross sectional area. The sampling point should be as far as possible downstream and upstream avoiding any disturbances such as bends, branches, obstructions, fans, dampers and leaks etc. [Hydraulic Diameter = 4 x Area of Sampling Plane/ Length of Sampling lane Perimeter]
4.1.2 Number of Sampling Points
The number of sampling points required is determined by the size of the stack. The minimum number of sample points and sample lines for rectangular and circular ducts are shown in Table 2.
Table 2 – Minimum Number of Sample Points and Sample Lines (ISO 9096:2003)
Range of
Sampling
Plane
Area
(m2)
Circular Stack Rectangular Stacks
Range
of Duct
Diameter
(m)
Minim
Number
of
Sampling
Lines
(dia.)
Minim
Number
of
Sampling
Points per
Plane
Minim
Number
of
Side
Divisions
Number
of
Sampling
Points
per
Plane
<0.1 <0.35 - 1 - 1
0.1 to 1.0
0.35 to 1.1 2 4 2 4
1.1 to 2.0
1.1 to 1.6 2 8 3 9
> 2.0 >1.6 2 12 >=3 12
[Source; Environmental Agency – Technical Guidance – M 1]
4.1.3 Positions of Sampling Points Along the Sampling Plane
The sample plane is divided into equal areas (sample lines) and sampling is carried out from points (sample points) in the centre of these areas. There are different standard dimensions for sample points along the sample planes of circular, rectangular and square ducts. The details are not included in this paper, because these are very common and have been practiced while measuring the flow velocity and pressure inside the ducting system. In addition to those requirements, surveying the proposed sampling plane, preliminary velocity survey, and unacceptable characteristics should be considered while selecting the sampling points.
4.1.4 Sampling Access Port
The access port shall be big enough for the insertion and removal of the equipment (probes) used and to allow the sampling point to be reached. As per BS EN 13284 – 1; 2002, the access ports should have a minimum diameter of 125mm or a surface area of 100 mm x 250 mm except stacks smaller than 0.7 m diameter. A smaller socket (say 50 mm) may be allowed for the smaller stacks less than 0.7 m diameter. The port socket shall not project into the gas stream. Typical arrangement of access ports and fitments are shown in Figures 1 to Figure 3.
ENGINEER 5
4.2 Sampling Facilities and Safety
Requirements The safe and permanent working platform and lifting arrangement should be required to reach the sampling locations and the conditions of devices should be confirmed by the responsible parties. However, in exceptional circumstances; such as in old plants or those who cannot bear the setting up facility cost (especially the small scale industries), temporary structures; such as scaffolding can be used. All the platforms, whether permanent or temporary, should meet the weight criteria required for sampling and this is defined as 400 kg point load as per BS EN 13284- 1:2002 standards. {As per the Indian Standards the total load should be equivalent to the weight of at least 3 men (average weight 80 kg each) plus 90 kg of equipment weight]. The temporary platform should be tied to or supported by a permanent structure. Sampling from roof tops and mobile devices are unacceptable. The platform should provide
handrails and kick-boards that meet the requirements of the work place. Removable chains or self closing gates shall be used at the platform to prevent workers falling through access openings or ladders. The platform shall not be accommodated on free standing water and drainage is to be provided [BS EN 13284- 1:2002]. At the top of the platform, 15 Amp and 5 Amp, Single phase power supply sockets are required to operate the instruments. 4.2.1 Space for the Equipment and Personnel The space, size requirements and dimensions for platforms are illustrated in Figures 4 to Figure 7. The platform surface area should not be less than 5 m2 and minimum width at any point shall be 2 m. The minimum length in front of the access port shall be 2 m or the length of the probe plus 1 m. The platform should be wide enough to prevent sampling equipment extending beyond the platform.
Figure 1 – Standard 125 mm Access Port [Source – Technical Guide Note M 1]
Figure 3 – Plan View of Typical Arrangement of Access Fittings on Large Circular Stacks (>=3.6 m Diameter) [Source – Technical Guide Note M 1]
Figure 2 – Plan View of Typical Arrangement of Access Fittings on Large Square Rectangular Stacks [Source – Technical Guide Note M 1]
75 mm
120
mm
Pipe Stub 125 mm Schedule 40
Flang BS10-125mm
Sta
ck W
all
Sampleing Centre Line
Sampleing Centre Line
Parallel Sided Sockets Parallel Sided Sockets
Parallel Sided
Sockets
Parallel Sided
Sockets
90°

41 ENGINEER
ENGINEER 5
4.2 Sampling Facilities and Safety
Requirements The safe and permanent working platform and lifting arrangement should be required to reach the sampling locations and the conditions of devices should be confirmed by the responsible parties. However, in exceptional circumstances; such as in old plants or those who cannot bear the setting up facility cost (especially the small scale industries), temporary structures; such as scaffolding can be used. All the platforms, whether permanent or temporary, should meet the weight criteria required for sampling and this is defined as 400 kg point load as per BS EN 13284- 1:2002 standards. {As per the Indian Standards the total load should be equivalent to the weight of at least 3 men (average weight 80 kg each) plus 90 kg of equipment weight]. The temporary platform should be tied to or supported by a permanent structure. Sampling from roof tops and mobile devices are unacceptable. The platform should provide
handrails and kick-boards that meet the requirements of the work place. Removable chains or self closing gates shall be used at the platform to prevent workers falling through access openings or ladders. The platform shall not be accommodated on free standing water and drainage is to be provided [BS EN 13284- 1:2002]. At the top of the platform, 15 Amp and 5 Amp, Single phase power supply sockets are required to operate the instruments. 4.2.1 Space for the Equipment and Personnel The space, size requirements and dimensions for platforms are illustrated in Figures 4 to Figure 7. The platform surface area should not be less than 5 m2 and minimum width at any point shall be 2 m. The minimum length in front of the access port shall be 2 m or the length of the probe plus 1 m. The platform should be wide enough to prevent sampling equipment extending beyond the platform.
Figure 1 – Standard 125 mm Access Port [Source – Technical Guide Note M 1]
Figure 3 – Plan View of Typical Arrangement of Access Fittings on Large Circular Stacks (>=3.6 m Diameter) [Source – Technical Guide Note M 1]
Figure 2 – Plan View of Typical Arrangement of Access Fittings on Large Square Rectangular Stacks [Source – Technical Guide Note M 1]
75 mm
120
mm
Pipe Stub 125 mm Schedule 40
Flang BS10-125mm
Sta
ck W
all
Sampleing Centre Line
Sampleing Centre Line
Parallel Sided Sockets Parallel Sided Sockets
Parallel Sided
Sockets
Parallel Sided
Sockets
90°

ENGINEER 42
ENGINEER 6
4.3 Location Requirements for Monitoring
Gases The location requirements for measuring gas concentrations are less important than for particulates, as variations in velocity profiles tend not to affect the homogeneity of the gas concentration. This means that the proximity to bends, branches, obstruction fans and dampers are less important. But the sampling after dilution with air must be avoided. However,
sometimes it is necessary to measure stack gas velocity and volumetric flow rate. Then the measurements should be taken by following the particulate matter sampling procedures.
Duct Side Length , l1 (m) 0.6 0.8 1.0 1.2 1.4 1.6 1.8 2.0 2.2 2.4 2.6 2.8 3.0 3.2 3.4 3.6
Duct Side Width , w (m) 0.6 8.0 1.0 1.2 1.4 1.6 1.8 2.0 2.2 2.4 2.6 2.8 3.0 3.2 3.4 3.6
Width of Platform, b (m) 2.0 2.0 2.0 2.0 2.0 2.0 2.1 2.2 2.3 2.4 2.5 2.6 2.7 2.8 2.9 3.0
Figure 4 – Typical Area Required Behind Probe for Handling [Source – Technical Guide Note M 1]
Figure 5 – Plan View of Platform Working Area for Small Vertical Circular Stacks (< 3.6 m Diameter) [Source – Technical Guide Note M 1]
Figure 6 – Plan View of Platform Working Area for Square or Rectangular Ducts (Up to l 1 = 3.6 m) [Source – Technical Guide Note M 1]
Figure 7 – Plan View of Platform Working Area & Orientation Recommendations for Large Vertical Circular Stacks (>= 3.6 m Diameter) [Source – Technical Guide Note M 1]
Sampleing LinePlatform Area
Sampleing Line
Duct Maximum of 2 m or Probe Length + 1 m
Stack
Sapling Platform Subjected to Minimum of 5 m2
MInimum
of 2
m
or Prob
e Len
gth
+ 1 m
Sockets
Sapl
ing
Prob
e
Stack
Minimum Width of Platform at
Any Point in 2 m
Platform
Sam
plin
g Pl
atfo
rm
Duct b
al1
w
ENGINEER 7
There are different categories of instruments available to monitor particulates and gas contents in flue gas. The instruments used in different tests may depend on the measuring principles and techniques published by the responsible institutes. However, widely used flue gas analyzing systems and particulate matter monitoring systems are illustrated in Figure 8 & Figure 9 respectively.
Figure 8 (a) – Flue Gas Analyzer Feature, Figure 8 (b) – Standard Probe Configurations [Source – KANE International (Pvt.) Ltd., United Kingdom]
Figure 8 (b)
Figure 8 (a)
Figure 9 – Particulate Sampling Train, Equipped with In-Stack Filter; [Source - State of California Air Resources Board.
Dry GasMeter
IceWaterBath
VacuumLine
VacuumGauge
By-passValve
Pump
Orifice
TemperatureSensors
Check Valve
Silica Gel
Impingers
Temperature Sensor
MainValve
TemperatureSensor Stack
WallFlexibleTubing
Manometer
Type S Pitot Tube
SamplingNozzle
Empty Water
Impinger Train Optional, May Be Replaced By An Equivalent Condenser
* Suggested (Interference-Free) Spacings
z
In-StackFilter
Holder
TemperatureSensor
x
y
Z = 7.6 cm (3 in.)*
x = y = 1.9 cm (0.75 in) *
Type SPitot Tube
5.0 Instrumentations

43 ENGINEER
ENGINEER 7
There are different categories of instruments available to monitor particulates and gas contents in flue gas. The instruments used in different tests may depend on the measuring principles and techniques published by the responsible institutes. However, widely used flue gas analyzing systems and particulate matter monitoring systems are illustrated in Figure 8 & Figure 9 respectively.
Figure 8 (a) – Flue Gas Analyzer Feature, Figure 8 (b) – Standard Probe Configurations [Source – KANE International (Pvt.) Ltd., United Kingdom]
Figure 8 (b)
Figure 8 (a)
Figure 9 – Particulate Sampling Train, Equipped with In-Stack Filter; [Source - State of California Air Resources Board.
Dry GasMeter
IceWaterBath
VacuumLine
VacuumGauge
By-passValve
Pump
Orifice
TemperatureSensors
Check Valve
Silica Gel
Impingers
Temperature Sensor
MainValve
TemperatureSensor Stack
WallFlexibleTubing
Manometer
Type S Pitot Tube
SamplingNozzle
Empty Water
Impinger Train Optional, May Be Replaced By An Equivalent Condenser
* Suggested (Interference-Free) Spacings
z
In-StackFilter
Holder
TemperatureSensor
x
y
Z = 7.6 cm (3 in.)*
x = y = 1.9 cm (0.75 in) *
Type SPitot Tube
5.0 Instrumentations

ENGINEER 44
ENGINEER 8
6.0 General Recommendations
6.1 As far as the new environmental rules and regulations, are concerned monitoring of particulate matter and effluent gasses emitted by combustion sources/systems are essential. This monitoring can be either periodical or continuous and the method depends on the definitions of the particular standard.
6.2 Most of the large scale combustion
systems have provided the particulate matter and effluent gas controlling mechanisms ,such as bag filters, cyclone separators, water spraying etc and the inbuilt effluent gas monitoring system. The sampling ports, working platform and lifting arrangements to reach the sampling locations are also available in those types of combustion systems.
6.3 The combustion system owners
(especially SMI owners) who are having old combustion systems (plants without sampling points, lifting arrangement etc) and newcomers to the industries who are going to set up the combustion systems should have considered the instructions and details given in this paper while setting up the effluent gas monitoring system. They should also clearly understand which category of the standard codes have to be followed up with their combustion system.
6.4 More careful attention should be paid to the accurate test results of particulate matter rather than measurements of gaseous concentrations, because nonhomogeneous flow will badly affect the measurements. However, it should avoid the dilution of flue gas with fresh air, while measuring the gaseous concentrations. Further, the toxic gases such as Oxides of Nitrogen should be measured at the pre defined (as per the relevant standards) Oxygen reference level.
7.0 Acknowledgement
The author wishes to acknowledge Dr. T B Adikarinayaka; Head of the Department Agriculture and Post Harvest Technology of National Engineering Research & Development Centre giving his valuable input to standardize this paper.
References
1. International Standards; ISO 10155 – Stationary Source Emissions – Automated Monitoring of Mass Concentrations of Particles – Performance Characteristics, Test Methods and Specifications.
2. International Standards; ISO 7935 – Stationary Source Emissions – Determinations of the Mass Concentration of Sulfur Dioxide - Performance Characteristics of Automated Measuring Methods.
3. International Standards; ISO 10396 – Stationary Source Emissions – Sampling for the Automated Determination of Gas Concentrations.
4. Indian Standard; IS: 11255 (Part 4) - 1985 – Methods for Measurements of Emission from Stationary Sources.
5. Technical Guide Note (Monitoring) M 1 – Sampling Requirements for Stack Emission Monitoring; Environment Agency, Version 4, July 2006.
6. Technical Guide Note (Monitoring) M 2 – Monitoring of Stack Emission to Air; Environment Agency, Version 4, July 2006.
7. Air Quality Sampling Manual; Queensland Government, Environmental Protection Agency
8. Proposed Environmental Standards for Stationary Combustion Sources ; Central Environmental Authority, Sri Lanka
9. “KM 9106” Flue Gas Analyzer Operation Manual, Kane International Limited, Kane House, Swallowfield, Welweyn Garden City, Hertfordshire, AL 7 IJG.
10. “ENVIROTECH APM 621” Stack Monitoring Kit Operation Manual, VAYUBODHAN UPKARAN (Pvt.) Ltd, A 292/1,Okhla Industrial Area, Phase 1, New Delhi – 110 020.
11. Environmental Monitoring Reports – Energy & Environmental Management Centre, National Engineering Research & Development Centre, 2P/17B, Industrial Estate, Ekala, Ja Ela. Sri Lanka.
Figure 8 (a)
ENGINEER 9
Appendix A Table A - 1 – Common Codes and Standards Practice in Monitoring Flue Gas Emission Name of Standard Reference Code Details
International Standard ISO 7935
Stationary Source Emission –Determination of the Mass Concentration of Sulphar Dioxide – Performance Characteristics of Automated Measuring Methods
International Standard ISO 10155
Stationary Source Emission –Automated Monitoring of Mass Concentrations of Particles - Performance Characteristics, Test Methods and Specifications
International Standard ISO 10396 Stationary Source Emission – Sampling for the Automated Determination of Gas Concentrations
Bureau of Indian Standards IS 11255 (Part 3 & Part 4) Methods for Measurement of Emission from Stationary Sources
Environment Agency Technical Guidance Note – M 1 Sampling Requirements for Stack – Emission Monitoring
Environment Agency Technical Guidance Note – M 2 Monitoring of Stack Emission to Air
Environmental Protection Agency Guidance Note No 1 Air Emission Sampling Facility Emission Measurement Technical Information Centre Method 5 Determination of Particulate Emissions from
Stationary Sources
Emission Measurement Technical Information Centre Method 6 – A
Determination of Sulphar Dioxide, Moisture and Carbon Dioxide from Fossil Fuel Combustion Sources
Emission Measurement Technical Information Centre Method 6 – C Determination of Sulphar Dioxide Emission from
Stationary Sources Emission Measurement Technical Information Centre Method 7 – E Determination of Nitrogen Oxides Emission
from Stationary Sources State of California Air Resources Board Method 17 Determination of Particulate Emissions from
Stationary Sources (In-Stack Filtration Method) Central Environmental Authority – Sri Lanka ; Pollution Control Division Proposed Standards 2.1 General Atmospheric Emission Standards for
Stationary Sources Central Environmental Authority – Sri Lanka ; Pollution Control Division Proposed Standards 2.2 Sources Specific Atmospheric Emission
Standards for New Modified Stationary Sources
Table A-2 – General Atmospheric Emission Standards for Stationary Sources Name of Substance Standard applicable to Standard
Soot and dust Combustion sources 150mg/Nm3
Smoke Combustion sources Ringlemann 2
Harmful substance
Chlorine (Cl2) Hydrogen chloride (HCI)
Combustion or chemical treatment at chemical product reaction facilities or a waste incinerator
Chlorine: 30 mg/Nm3 Hydrogen chloride: 500 mg/Nm3
Fluorides (F) Hydrogen fluorides (HF)
Any commercial, industrial processes
Fluoride: 20 mg/Nm3 Hydrogen fluorides: 20 mg/Nm3
Cadmium (Cd) and its compounds
Combustion or chemical treatment at a copper, zinc or lead refinery
10 mg/Nm3 as Cd
Lead (Pb) and its compounds Combustion or chemical treatment at copper, zinc or lead refining facilities
10mg/Nm3 as Pb
Antimony (Sb) and its compound
Any commercial, industrial processes 10mg/Nm3 as Sb
Arsenic (As) and its compounds
Any commercial, industrial processes 20 mg/Nm3 as As
Copper (Cu) and its compounds
Any commercial, industrial processes 20 mg/Nm3 as Cu
Mercury (Hg) and its compounds
Any commercial, industrial processes 10 mg/Nm3 as Hg
[Source: CEA Proposed Environmental Standards]

45 ENGINEER
ENGINEER 9
Appendix A Table A - 1 – Common Codes and Standards Practice in Monitoring Flue Gas Emission Name of Standard Reference Code Details
International Standard ISO 7935
Stationary Source Emission –Determination of the Mass Concentration of Sulphar Dioxide – Performance Characteristics of Automated Measuring Methods
International Standard ISO 10155
Stationary Source Emission –Automated Monitoring of Mass Concentrations of Particles - Performance Characteristics, Test Methods and Specifications
International Standard ISO 10396 Stationary Source Emission – Sampling for the Automated Determination of Gas Concentrations
Bureau of Indian Standards IS 11255 (Part 3 & Part 4) Methods for Measurement of Emission from Stationary Sources
Environment Agency Technical Guidance Note – M 1 Sampling Requirements for Stack – Emission Monitoring
Environment Agency Technical Guidance Note – M 2 Monitoring of Stack Emission to Air
Environmental Protection Agency Guidance Note No 1 Air Emission Sampling Facility Emission Measurement Technical Information Centre Method 5 Determination of Particulate Emissions from
Stationary Sources
Emission Measurement Technical Information Centre Method 6 – A
Determination of Sulphar Dioxide, Moisture and Carbon Dioxide from Fossil Fuel Combustion Sources
Emission Measurement Technical Information Centre Method 6 – C Determination of Sulphar Dioxide Emission from
Stationary Sources Emission Measurement Technical Information Centre Method 7 – E Determination of Nitrogen Oxides Emission
from Stationary Sources State of California Air Resources Board Method 17 Determination of Particulate Emissions from
Stationary Sources (In-Stack Filtration Method) Central Environmental Authority – Sri Lanka ; Pollution Control Division Proposed Standards 2.1 General Atmospheric Emission Standards for
Stationary Sources Central Environmental Authority – Sri Lanka ; Pollution Control Division Proposed Standards 2.2 Sources Specific Atmospheric Emission
Standards for New Modified Stationary Sources
Table A-2 – General Atmospheric Emission Standards for Stationary Sources Name of Substance Standard applicable to Standard
Soot and dust Combustion sources 150mg/Nm3
Smoke Combustion sources Ringlemann 2
Harmful substance
Chlorine (Cl2) Hydrogen chloride (HCI)
Combustion or chemical treatment at chemical product reaction facilities or a waste incinerator
Chlorine: 30 mg/Nm3 Hydrogen chloride: 500 mg/Nm3
Fluorides (F) Hydrogen fluorides (HF)
Any commercial, industrial processes
Fluoride: 20 mg/Nm3 Hydrogen fluorides: 20 mg/Nm3
Cadmium (Cd) and its compounds
Combustion or chemical treatment at a copper, zinc or lead refinery
10 mg/Nm3 as Cd
Lead (Pb) and its compounds Combustion or chemical treatment at copper, zinc or lead refining facilities
10mg/Nm3 as Pb
Antimony (Sb) and its compound
Any commercial, industrial processes 10mg/Nm3 as Sb
Arsenic (As) and its compounds
Any commercial, industrial processes 20 mg/Nm3 as As
Copper (Cu) and its compounds
Any commercial, industrial processes 20 mg/Nm3 as Cu
Mercury (Hg) and its compounds
Any commercial, industrial processes 10 mg/Nm3 as Hg
[Source: CEA Proposed Environmental Standards]


47 ENGINEER
ENGINEER - Vol. XXXXIV, No. 04, pp. [page range], 2011 © The Institution of Engineers, Sri Lanka
ENGINEER 1
Design of a Wide Input Range DC-DC Converter Suitable for Lead-Acid Battery Charging
M.W.D.R. Nayanasiri and J.A.K.S.Jayasinghe, B.S. Samarasiri
Abstract: In this paper design and implementation of a wide input range Cascaded Buck and Boost (CBB) converter is presented with a robust power controller. Four new control strategies are proposed and tested for this converter based on input voltage and duty cycle of the control signals. Robust feature of the proposed control system ensures constant output DC current required to charge the Lead-Acid batteries in bulk charge mode. The robust feedback controller of the power converter is developed using a microcontroller which is acting as smart controller of the CBB converter. DC-DC converters which are used for battery charging applications with variable power sources should be able to both step-up and step-down the input voltage and provide high efficiency in the whole range of operation. The CBB converter with power switches and diodes is used to achieve above objective. CBB converter is constructed by cascading a Buck and a Boost Converter and eliminating the output capacitor of the buck converter.
Keywords: Cascaded Buck and Boost Converter, Microcontroller, Lead Acid Batteries 1. Introduction DC-DC converters with step-up and step-down capability are required in several applications where the input and output voltage ranges overlap. As an example, in the battery charging application which uses variable input power sources such as wind mills and motor-generator units of the hybrid vehicles. Topologies such as Inverted Buck-Boost converter and Single Ended Primary Inductance Converters (SEPIC) can be used to obtain constant output voltage from variable power sources [1]. But they have low efficiency, high output ripple, high noise and spikes in the output voltage. Hence they are not suitable to implement power supplies for battery charging applications.
Figure 1 – Cascaded Buck and Boost Converter A DC-DC power converter is constructed by cascading Buck and Boost Converter and eliminating the output capacitor of the Buck Converter as shown in Figure 1. This DC-DC converter has minimum components, low component stresses and low energy storage capability in order to have small size and high efficiency.
There are four possible switching states in a CBB converter topology. They are shown in Table 1.
Table 1- Switching States of CBB
Switching State
S1 S2 Mode
1 ON PWM Boost 2 PWM PWM Buck-Boost 3 OFF PWM N/A 4 PWM OFF Buck
In the buck mode , when duty cycle of the gate control signal is close to unity. But it is difficult to have duty cycle of the gate control signal of the power MOSFETs close to unity due to the switching limitations of the available power switches and their gate drive technologies. In boost mode of operation occurs when duty cycle is close to zero. With existing gate drive technologies of the power MOSFETs, it is also difficult to have duty cycle close to zero. Hence CBB converter cannot be operated satisfactorily when D< 0.1 and D>0.95 for boost and buck mode respectively. Therefore we get a dead band as shown in Figure 2.
Eng. Dulika Nayanasiri, BSc Eng.(Hons), AMIE(Sri Lanka), Formerly Research Engineer, Engineering Design Centre, University of Moratuwa. Presently PhD candidate NTU, Singapore. Eng. (Prof.) J A K S Jayasinghe, BSc Eng. (Hons), MEng., CEng., PhD, MIE(Sri Lanka), Presently, Senior Professor, Dept. of Electronics Engineering, University of Moratuwa. Eng. B S Samarasiri, BSc Eng.(Hons), CEng., MIE(Sri Lanka), Presently Director, Engineering Design Centre, University of Moratuwa.
enGineeR - Vol. XXXXiV, no. 04, pp, [47-53], 2011© the institution of engineers, sri LankaENGINEER - Vol. XXXXIV, No. 04, pp. [page range], 2011 © The Institution of Engineers, Sri Lanka
ENGINEER 1
Design of a Wide Input Range DC-DC Converter Suitable for Lead-Acid Battery Charging
M.W.D.R. Nayanasiri and J.A.K.S.Jayasinghe, B.S. Samarasiri
Abstract: In this paper design and implementation of a wide input range Cascaded Buck and Boost (CBB) converter is presented with a robust power controller. Four new control strategies are proposed and tested for this converter based on input voltage and duty cycle of the control signals. Robust feature of the proposed control system ensures constant output DC current required to charge the Lead-Acid batteries in bulk charge mode. The robust feedback controller of the power converter is developed using a microcontroller which is acting as smart controller of the CBB converter. DC-DC converters which are used for battery charging applications with variable power sources should be able to both step-up and step-down the input voltage and provide high efficiency in the whole range of operation. The CBB converter with power switches and diodes is used to achieve above objective. CBB converter is constructed by cascading a Buck and a Boost Converter and eliminating the output capacitor of the buck converter.
Keywords: Cascaded Buck and Boost Converter, Microcontroller, Lead Acid Batteries 1. Introduction DC-DC converters with step-up and step-down capability are required in several applications where the input and output voltage ranges overlap. As an example, in the battery charging application which uses variable input power sources such as wind mills and motor-generator units of the hybrid vehicles. Topologies such as Inverted Buck-Boost converter and Single Ended Primary Inductance Converters (SEPIC) can be used to obtain constant output voltage from variable power sources [1]. But they have low efficiency, high output ripple, high noise and spikes in the output voltage. Hence they are not suitable to implement power supplies for battery charging applications.
Figure 1 – Cascaded Buck and Boost Converter A DC-DC power converter is constructed by cascading Buck and Boost Converter and eliminating the output capacitor of the Buck Converter as shown in Figure 1. This DC-DC converter has minimum components, low component stresses and low energy storage capability in order to have small size and high efficiency.
There are four possible switching states in a CBB converter topology. They are shown in Table 1.
Table 1- Switching States of CBB
Switching State
S1 S2 Mode
1 ON PWM Boost 2 PWM PWM Buck-Boost 3 OFF PWM N/A 4 PWM OFF Buck
In the buck mode , when duty cycle of the gate control signal is close to unity. But it is difficult to have duty cycle of the gate control signal of the power MOSFETs close to unity due to the switching limitations of the available power switches and their gate drive technologies. In boost mode of operation occurs when duty cycle is close to zero. With existing gate drive technologies of the power MOSFETs, it is also difficult to have duty cycle close to zero. Hence CBB converter cannot be operated satisfactorily when D< 0.1 and D>0.95 for boost and buck mode respectively. Therefore we get a dead band as shown in Figure 2.
Eng. Dulika Nayanasiri, BSc Eng.(Hons), AMIE(Sri Lanka), Formerly Research Engineer, Engineering Design Centre, University of Moratuwa. Presently PhD candidate NTU, Singapore. Eng. (Prof.) J A K S Jayasinghe, BSc Eng. (Hons), MEng., CEng., PhD, MIE(Sri Lanka), Presently, Senior Professor, Dept. of Electronics Engineering, University of Moratuwa. Eng. B S Samarasiri, BSc Eng.(Hons), CEng., MIE(Sri Lanka), Presently Director, Engineering Design Centre, University of Moratuwa.

ENGINEER 48
ENGINEER 2
In buck-boost mode, occurs when duty cycle of the power switches is close to 0.5. This range of the duty cycle can achieve easily with existing MOSFET gate drive technology. Therefore buck-boost mode is used to transfer power within the above dead band. Efficiency wise, it is not advantageous to operate this converter in buck-boost mode [2]. But in order to smooth the transients, the buck-boost mode is used to transit from buck mode to boost mode or vice versa [3], [1]. Hence four control algorithms are developed for this CBB converter to obtain smooth transition between each operation modes. The proposed four control algorithms for this converter are based on the duty cycle of the gate control signal, input voltage and output current.
Figure 2 – Dead zone present in the output voltage This paper organizes as follows. The next section explains the proposed new control algorithm for this converter. Section 3 provides the specifications of the converter. In Section 4 the operation modes with switches is explained and in Section 5, the system architecture is explained in brief. Section 6 provides design and implementation details with relevant calculations. In section 7, experiment setup is presented and in the next section results obtained from the experiment are given. 2. Control Strategy Control strategy of the controller is for maintaining a constant output current from the CBB converter as the converter load and input voltage changes. Main control is implemented by using a microcontroller. Closed loop control is used to develop firmware. Switching the CBB converter between buck, buck-boost and boost modes is a complex task as transients play a major role as this mode of operation changes.
Control algorithm of the converter is based on the duty cycle of the control signal, input voltage and output current. Input voltage based control strategy is proposed in [1] for this type of converters. But, such control algorithms are not possible to use in this converter as the output load of this converter is changing while the battery pack is being charged. Hence, four new control algorithms are proposed for this converter by taking input voltage and duty cycle of the power switch control signals as control parameters. 2.1 Control strategy 1 - Input voltage based control strategy with zero initial duty cycle In this algorithm, mode of operation of the CBB converter is decided using only the input voltage. The gate control signal of the power switches are initialized with zero duty cycle. 2.2 Control strategy 2 - Input voltage based control strategy with non-zero initial duty cycle In this algorithm, mode of operation of the CBB converter is decided using input voltage. The gate control signal of the power switches are initialized with non-zero duty cycle. The duty cycle of the power switch is calculated to give minimum dips in the output current as the converter changes its mode of operation. 2.3 Control strategy 3 - Input voltage and duty cycle based control strategy Initial mode of operation of the converter is decided using input voltage. Use input voltage as the control parameter to transit from buck-boost mode to buck mode or from buck-boost mode to boost mode. Duty cycle of the control signal is used as the control parameter when it is required to transit from boost mode to buck-boost mode or from buck mode to buck-boost mode. 2.4 Control strategy 4 - Duty cycle based control strategy In this control algorithm, initial mode of operation is decided based on the input voltage. Subsequently controller changes its mode of operation according to the maximum and minimum allowable duty cycle in each mode of the CBB converter.

49 ENGINEER
ENGINEER 3
3. Specifications CBB converter is developed to charge the 48V Lead-Acid battery pack. There are four modes in the standard Lead-Acid battery charging cycle namely: trickle charge, bulk charge, over charge and float charge. In this application, bulk charge mode is used to charge the battery pack with constant current. According to the battery standard, to charge the Lead-Acid battery in bulk charging mode, battery pack should be charged with a current rated to 10%-30% of the battery capacity. As 65Ah Lead-Acid batteries are used in this design, charging current was set to 6A. Bulk charge mode of the Lead-Acid battery charging cycle ends up when the cell terminal voltage reaches 2.26V or 2.36V [4]. Therefore terminal voltage of the battery pack will be 56.64V at the end of bulk charge mode. Hence the output voltage of the CBB converter should vary from 48V to 56.64V.
Table 2 – Summary of Specifications of CBB
Description Value I/P voltage range 24V-72V O/P voltage range 48V-56.64V
O/P current 6A O/P current ripple Max. 1A
4. Modes of Operation CBB converter topology is supported for three modes of operation. In this application all three modes were implemented, inclusive of the positive buck-boost mode. Positive buck-boost mode acts as a bridge to transit from the buck mode of operation to boost mode or vice versa by providing ability to transfer the power when
. The equivalent circuit of the CBB converter is shown in Figure 3. The converter consists of input capacitor Cin, output filter capacitor Cout, two power switches Q1 and Q2, inductor L and two freewheeling diodes D1 and D2. The forward voltage drop of the diode is Vfw.
Figure 3 – Equivalent circuit of CBB converter
All modes are operated at the same frequency represented by . Figure 4 depicts typical control signal provided by the microcontroller.
Figure 4 – Control signal of power switches
4.1 Buck Mode If input voltage is greater than the output voltage or terminal voltage of the battery pack, buck mode is used. In this mode of operation, Q1 is controlled by the Pulse Width Modulated (PWM) signal as shown in Figure 4 and Q2 is always in OFF condition. With switching frequency f and duty cycle , input and output voltage relationship is given by equation (1). ... (1) This was derived by neglecting Vfw, ON switch resistance of Q1 and inductor resistance. The inductor current (IL) has a triangle shape and its average value is determined by the load. The peak-to-peak current ripple Δ IL is dependent on L and can be calculated with the help of equation (2) [5].
... (2)
4.2 Boost Mode If input voltage is less than the terminal voltage of the battery pack, then boost mode of operation is used to step-up the voltage input in order to charge the battery. In this mode of operation, Q1 is always ON and Q2 is controlled by the PWM signal provided by the main controller as shown in Figure 4. The relationship between input and output voltage can be derived by neglecting diode forward voltage drop Vfw, switch ON resistance and inductor resistance. For a switching frequency f and duty cycle , then Vout is given by equation (3),
... (3)

ENGINEER 50
ENGINEER 4
The inductor ripple current is given by equation (4) [5], ... (4) 4.3 Buck-Boost Mode This mode is used when . In this mode input and output voltage relationship is given by equation (5).
... (5) Both power switches are controlled by PWM signals having same duty cycle D. During the time both switches conduct simultaneously and during the time both switches are OFF and the energy stored in the inductor is released to the load. 5. System Architecture CBB converter is constructed as a combination of different subsystems namely: input voltage monitor, output voltage monitor, output current monitor, power supply, main controller and main power path or CBB converter. This is shown in Figure 5.
Figure 5 – System Architecture
Input and output voltage monitor subsystems are implemented using voltage followers and output current monitor subsystem is implemented using a differential amplifier. Power supply of the converter is based on linear power regulators and transistor voltage regulator. Switching frequency of the CBB is selected by considering inductor size and the power MOSFETs switching losses [6]. With higher switching frequency f , size of the inductor will be small. But the switching losses of the power MOSFETs become larger as f increases. Hence operation frequency of the CBB is selected as
15.625 kHz because this value can be easily obtained from maximum PWM register value with 4 MHz crystal. 6. Design and Implementation Same inductor (L) and same output filter capacitor (Cout) are used in all modes of operation of the CBB. Hence in the design process, the required inductor and output capacitor values for all modes of operation are calculated using equations (9) (11), (16) and (18). Then select the maximum value of inductor and capacitor which is calculated using above equations, as minimum inductor and capacitor value of the CBB converter. 6.1 Buck Mode In this mode, maximum input voltage is 72V and minimum output voltage is 48V. Hence maximum duty cycle is
... (6)
... (7) If the maximum allowable output ripple current is .
... (8) Therefore the minimum required inductor, in order to obtain continues conduction mode at the rated output current is given by equation (9).
... (9) The current ripple causes a voltage ripple ΔVout at the output capacitor Co. For normal switching frequencies, this voltage ripple is determined by the equivalent impedance Zmax. The capacitors used for our design were obtained from the local market and their technical details were not available. Therefore the capacitor values were selected to give minimum output ripple current using trial and error method. The approximate value for the output capacitor can be found using equation (10) [2],
... (10) This is assuming that ΔVo = 0.01Vo and rated power output of the converter approximately equals to 260W.
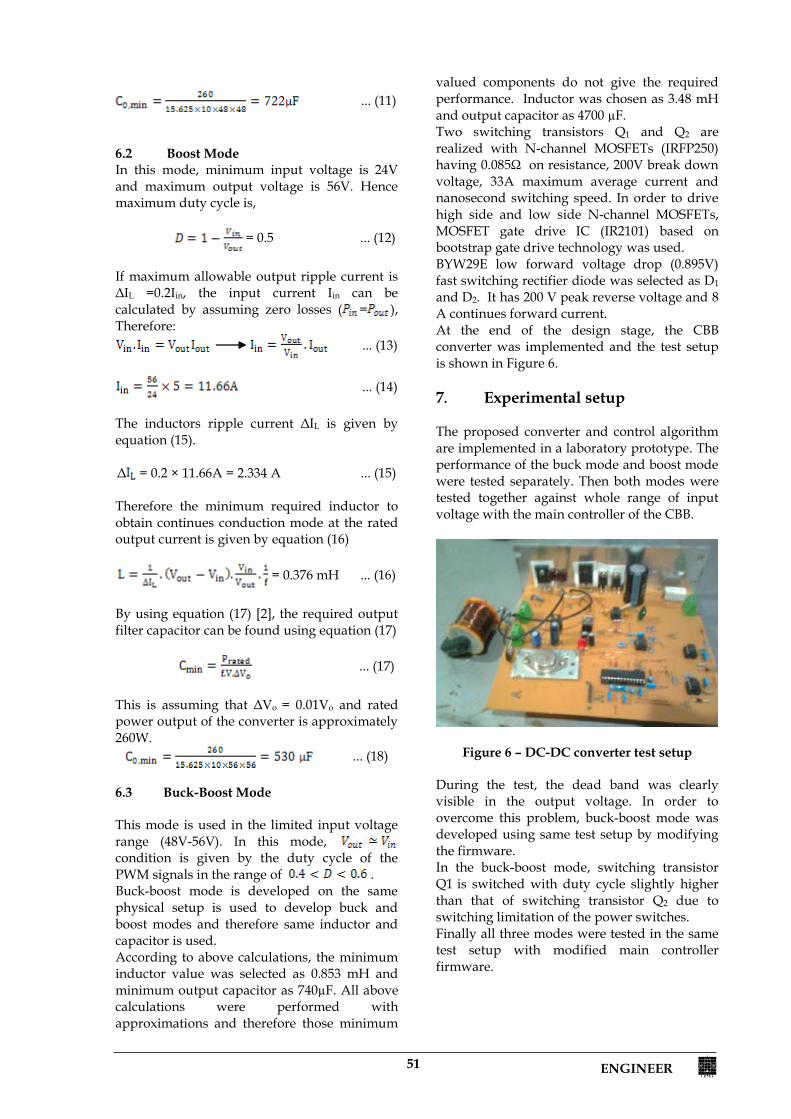
51 ENGINEER
ENGINEER 5
... (11)
6.2 Boost Mode In this mode, minimum input voltage is 24V and maximum output voltage is 56V. Hence maximum duty cycle is,
= 0.5 ... (12)
If maximum allowable output ripple current is ΔIL =0.2Iin, the input current Iin can be calculated by assuming zero losses ( = ), Therefore:
... (13)
... (14) The inductors ripple current ΔIL is given by equation (15). Δ = 0.2 × 11.66A = 2.334 A ... (15) Therefore the minimum required inductor to obtain continues conduction mode at the rated output current is given by equation (16)
= 0.376 mH ... (16) By using equation (17) [2], the required output filter capacitor can be found using equation (17)
... (17) This is assuming that ΔVo = 0.01Vo and rated power output of the converter is approximately 260W.
... (18) 6.3 Buck-Boost Mode This mode is used in the limited input voltage range (48V-56V). In this mode, condition is given by the duty cycle of the PWM signals in the range of . Buck-boost mode is developed on the same physical setup is used to develop buck and boost modes and therefore same inductor and capacitor is used. According to above calculations, the minimum inductor value was selected as 0.853 mH and minimum output capacitor as 740µF. All above calculations were performed with approximations and therefore those minimum
valued components do not give the required performance. Inductor was chosen as 3.48 mH and output capacitor as 4700 µF. Two switching transistors Q1 and Q2 are realized with N-channel MOSFETs (IRFP250) having 0.085Ω on resistance, 200V break down voltage, 33A maximum average current and nanosecond switching speed. In order to drive high side and low side N-channel MOSFETs, MOSFET gate drive IC (IR2101) based on bootstrap gate drive technology was used. BYW29E low forward voltage drop (0.895V) fast switching rectifier diode was selected as D1 and D2. It has 200 V peak reverse voltage and 8 A continues forward current. At the end of the design stage, the CBB converter was implemented and the test setup is shown in Figure 6. 7. Experimental setup The proposed converter and control algorithm are implemented in a laboratory prototype. The performance of the buck mode and boost mode were tested separately. Then both modes were tested together against whole range of input voltage with the main controller of the CBB.
Figure 6 – DC-DC converter test setup During the test, the dead band was clearly visible in the output voltage. In order to overcome this problem, buck-boost mode was developed using same test setup by modifying the firmware. In the buck-boost mode, switching transistor Q1 is switched with duty cycle slightly higher than that of switching transistor Q2 due to switching limitation of the power switches. Finally all three modes were tested in the same test setup with modified main controller firmware.

ENGINEER 52
ENGINEER 6
8. Results The results given below correspond to a 260W prototype with a switching frequency of 15.625 KHz. First, the CBB converter was tested with control strategy 1 which is based on the input voltage. In this method, converter changes its mode of operation from boost to buck-boost and then to buck mode as the input voltage increases or other way as input voltage decreases. When converter changes its mode of operation, there were significant voltage dips in the output voltage and hence a discontinuity appeared in the output current as shown in Figure 7.
Figure 7 – Output current vs. Input voltage
with control strategy 1. Then the CBB converter was tested with modified control algorithm (Control strategy 2), with an initial none zero duty cycle for the control signals. An improvement was observed in the output current as shown in Figure 8.
Figure 8 – Output current vs. Input voltage
with control strategy 2. Next the CBB converter was tested with control strategy 3 based on duty cycle and input voltage based. Dips in the output voltage and discontinuity in the output current were
improved with this control strategy and the results are shown in Figure 9. It was observed that the converter operates in the buck-boost mode within a large input voltage range. But the operation of the converter in the buck-boost mode is not efficient.
Figure 9 – Output current vs. Input voltage
with control strategy 3.
To overcome the deficiencies in control strategy 3, the CBB converter was tested with a control strategy which is completely based on the duty cycle of the MOSFETs control signals (Control strategy 4). With this control strategy, it was possible to solve the issues related to output voltage dips, output current discontinuity and operation voltage range. The results are shown in Figure 10.
Figure 10 – Output current vs. Input voltage
with control strategy 4. The CBB converter based on control strategy 4 was used to charge the 65Ah Lead-Acid battery pack with 5.5A constant current by varying input voltage from 24V to 72V. It was observed that, this converter can be operated in pure buck and boost modes with high efficiency and in the non inverted buck-boost mode with a lower efficiency.

53 ENGINEER
ENGINEER 7
Battery terminal voltage was measured with time while charging the battery pack using boost mode and varying input voltage from 24V to 40V. Results are plotted in Figure 11. 9. Conclusion In this paper steady-state behaviour of the CBB converter is analysed and presented. The equations are derived for the buck mode and boost mode, when the converter is implemented with diodes and power switches. Selection of components and implementation details are also presented. This converter is suitable for applications which require non inverted step-up and step-down operation in a single circuit with low component count, low component stress, simplicity and high efficiency.
Figure 11 - Battery Terminal Voltage vs. Time Although this converter is not efficient [2] in the buck-boost mode, show the importance of buck-boost mode to transfer power when in the application having overlapped input and output voltage range. Duty cycle based control strategy is more suitable to change the mode of operation of the CBB converter other than the input voltage based control strategies. 10. Acknowledgement The authors would like to thank Ministry of Industry and Commerce (Formerly Ministry of Industrial Development) in Sri Lanka for the financial support for this work through the Development of Hybrid three wheeler project. Special thank would go to the staff of the Engineering Design Centre of University of Moratuwa.
References 1. Chakraborty, A., Khaligh, A. and Emadi, A,
“Combination of Buck and Boost Modes to Minimize Transients in the Output of a Positive Buck Boost Converter" 32nd Annual IEEE Conference on Industrial Electronics Nov. 2006.
2. Schaltz Erik, Khaligh Alireza “Non-inverting Buck-Boost Converter for Fuel Cell Applications" June 2008.
3. Gaboriault, M and Notman, A "A High
Efficiency, Non Inverting, Buck Boost DC-DC Converter” Applied Power Electronics Conference and Exposition, pp. 1411-1415, 2004.
4. Oconnor, John A, “Simple Switch mode Lead-Acid
Battery Charger"
5. Heinz Schmidt Walter "Switched Mode Power Supplies"
6. http://schmidt-walter.eit.h-da.de/

ENGINEER - Vol. XXXXIV, No. 04, pp, [52-58], 2011 © The Institution of Engineers, Sri Lanka
ENGINEER 1
Stormwater Management Modelling for Ungauged Watershed in Matara Municipality
H.M.D. Harshani and N.T.S. Wijesekera
Most urban areas are having flood problems due to human activities. It is not easy to model urban watersheds since very often they are ungauged. This paper describes the modelling of an ungauged watershed in the Matara Municipal Council Area of Southern Sri Lanka using the free SWMM5 model of the EPA. Several field visits were conducted to capture the model parameters and flood scenario for model development and calibration. The watershed delineation was done using 1:10,000 topographic maps and canal slopes etc were determined using the elevation data of these maps. This watershed with an area of 1.12 km2 was modelled and calibration was done for the order of magnitude of the outputs. The model shows reasonable results with the actual conditions in the absence of gauge data This work demonstrates that urban stormwater model SWMM5 can be used in Matara Municipal Council area to a satisfactory level with adequate field data collection. However, for accurate results, it is necessary to suitably gauge the stream flows and carry out field and engineering surveys for the measurement of physical parameters. The model demonstrated the capability to identify engineering and stormwater management options. Model outputs revealed that cleaning of canals was one option for reducing the flooding at nodes. For the considered storm, a reduction of canal roughness from 0.2 to 0.015 reduced the flood peak by 56% and no flood is happening after introducing a rectangular detention unit which is having 200m2 floor area.
Keywords: Urban, Stormwater, ungauged, Mathematical modelling , flooding, SWMM5
1. Introduction
Today, an urban flood due to poor stormwater management is a major issue in most parts of the country. There are many flood prone urban
Matara Municipality
Walgama Watershed
Figure 1 - Study Area
Madihe Mudun Ela
Colombo- Matara Road
N
Boundary line to the watershed
Miss. H.M.D. Harshani B.Sc. Eng. (Hons) (Moratuwa), Eng. (Prof.) N.T.S.Wijesekera, B.Sc. Eng. (Sri Lanka), C. Eng., FIE(Sri Lanka), M. Eng. (Tokyo), D. Eng. (Tokyo), Senior Professor of Civil Engineering, Department of Civil Engineering, University of Moratuwa, Sri Lanka

55 ENGINEER
ENGINEER - Vol. XXXXIV, No. 04, pp, [52-58], 2011 © The Institution of Engineers, Sri Lanka
ENGINEER 1
Stormwater Management Modelling for Ungauged Watershed in Matara Municipality
H.M.D. Harshani and N.T.S. Wijesekera
Most urban areas are having flood problems due to human activities. It is not easy to model urban watersheds since very often they are ungauged. This paper describes the modelling of an ungauged watershed in the Matara Municipal Council Area of Southern Sri Lanka using the free SWMM5 model of the EPA. Several field visits were conducted to capture the model parameters and flood scenario for model development and calibration. The watershed delineation was done using 1:10,000 topographic maps and canal slopes etc were determined using the elevation data of these maps. This watershed with an area of 1.12 km2 was modelled and calibration was done for the order of magnitude of the outputs. The model shows reasonable results with the actual conditions in the absence of gauge data This work demonstrates that urban stormwater model SWMM5 can be used in Matara Municipal Council area to a satisfactory level with adequate field data collection. However, for accurate results, it is necessary to suitably gauge the stream flows and carry out field and engineering surveys for the measurement of physical parameters. The model demonstrated the capability to identify engineering and stormwater management options. Model outputs revealed that cleaning of canals was one option for reducing the flooding at nodes. For the considered storm, a reduction of canal roughness from 0.2 to 0.015 reduced the flood peak by 56% and no flood is happening after introducing a rectangular detention unit which is having 200m2 floor area.
Keywords: Urban, Stormwater, ungauged, Mathematical modelling , flooding, SWMM5
1. Introduction
Today, an urban flood due to poor stormwater management is a major issue in most parts of the country. There are many flood prone urban
Matara Municipality
Walgama Watershed
Figure 1 - Study Area
Madihe Mudun Ela
Colombo- Matara Road
N
Boundary line to the watershed
Miss. H.M.D. Harshani B.Sc. Eng. (Hons) (Moratuwa), Eng. (Prof.) N.T.S.Wijesekera, B.Sc. Eng. (Sri Lanka), C. Eng., FIE(Sri Lanka), M. Eng. (Tokyo), D. Eng. (Tokyo), Senior Professor of Civil Engineering, Department of Civil Engineering, University of Moratuwa, Sri Lanka
enGineeR - Vol. XXXXiV, no. 04, pp, [55-61], 2011© the institution of engineers, sri Lanka

ENGINEER 56
ENGINEER 2
areas which are subjected to significant inundations several times a year. (Marsalek,J et al.2006.[4]). Complaints indicate that many areas which had never flooded previously are now flooded mostly due to blockage of drainage paths and increase of impervious surfaces. Several urban areas in the country have been experiencing flood problems due to lack of proper storm water management systems. Due to high impervious area, instead of infiltrating in to the soil almost all precipitated water becomes surface runoff and when there is no proper drainage systems most of the areas get inundated. This makes roads in the city to appear as waterways and leads to a sequence of problems. In urban areas, land owners fill their lands to prevent surface runoff getting into their lands; unauthorized constructions block the drainage paths and increasing impervious areas, are the main reasons which cause the stormwater drainage problems. Polaskova et al 2005. [6], David, E et al. [3]). Therefore it is very important to evaluate the causes for the stormwater drainage problem in urban areas in order to implement suitable management options as mitigatory actions. For this study, Walgama area (Fig. 01.) of Matara Municipality which has been facing flood problems for many years was selected to investigate the stormwater drainage problem and an attempt was made to provide management options through computer based simulation modelling. EPA SWMM is a mathematical model which can be used to model stormwater in urban watersheds. But in Sri Lanka, It has not been used for ungauged small watersheds. The EPA Storm Water Management Model (SWMM) is a dynamic rainfall runoff simulation model. It was developed in 1971 by the Water Resources Engineers, for the Environmental Protection Agency (EPA).(http://www.epa.gov/ednnrmr/model.[7]). Major input parameters for the model are rainfall and catchment parameters which include sub catchments, canals, junctions, rain gauge and outfalls. Since there are no gauged urban water sheds in Sri Lanka, significant data was not available for model calibration and verification. However, Walgama watershed was selected for the mathematical modelling and data were collected through several field surveys. As SWMM can model several outfalls
simultaneously and is capable of presenting outflows at canals and junctions with animations, finding management options were easy. 2. Methodology
The study methodology included a literature survey, field work for identification of input parameters, field observations for model calibration, modeling of the watershed, and a parameter sensitivity study to propose management options.
Literature survey was carried out on several published and unpublished studies about storm water management options, urban catchment handling, runoff calculation methods and available methods for storm water management. ( Chouli.E. et al, 2005.[1]).
2.1 Data Collection
Since the study area is ungauged, there were no recorded data available. Therefore, field work was important for collecting the data for model development and calibration. Desk studies were carried out using satellite images and the 1:10,000 topographic maps of the survey department, in order to find out drainage directions, land use patterns and subcatchment slopes.
In order to model the actual field condition, as it is, all canal details and sub catchment details must be observed within the catchment area and data must be collected for each parameter. Several field visits were carried out to gather the information about the drainage network characteristics and flooding details. Since there were time and resource limitations, data were collected using linen tape and hand held GPS and at the same time eye estimations were used to estimate several parameters. Subcatchment land use pattern, topography and vegetation types were observed during field visits and subcatchment slope, area and percentage of impervious areas were calculated using GIS tool. Vegetation type and percentage of impervious area are important to determine the Manning’s Roughness Coefficient for over land flow. Typical Manning’s roughness values were collected from some text books. (Chow, V. T. et al, 1998.[2], Maidment, D.R.,1993.[5]). Parameters of subcatchments are as in Table 01. Sub catchment number is related to the figure 03 and ‘N’ stands for Coefficient of Manning roughness.

57 ENGINEER
ENGINEER 2
areas which are subjected to significant inundations several times a year. (Marsalek,J et al.2006.[4]). Complaints indicate that many areas which had never flooded previously are now flooded mostly due to blockage of drainage paths and increase of impervious surfaces. Several urban areas in the country have been experiencing flood problems due to lack of proper storm water management systems. Due to high impervious area, instead of infiltrating in to the soil almost all precipitated water becomes surface runoff and when there is no proper drainage systems most of the areas get inundated. This makes roads in the city to appear as waterways and leads to a sequence of problems. In urban areas, land owners fill their lands to prevent surface runoff getting into their lands; unauthorized constructions block the drainage paths and increasing impervious areas, are the main reasons which cause the stormwater drainage problems. Polaskova et al 2005. [6], David, E et al. [3]). Therefore it is very important to evaluate the causes for the stormwater drainage problem in urban areas in order to implement suitable management options as mitigatory actions. For this study, Walgama area (Fig. 01.) of Matara Municipality which has been facing flood problems for many years was selected to investigate the stormwater drainage problem and an attempt was made to provide management options through computer based simulation modelling. EPA SWMM is a mathematical model which can be used to model stormwater in urban watersheds. But in Sri Lanka, It has not been used for ungauged small watersheds. The EPA Storm Water Management Model (SWMM) is a dynamic rainfall runoff simulation model. It was developed in 1971 by the Water Resources Engineers, for the Environmental Protection Agency (EPA).(http://www.epa.gov/ednnrmr/model.[7]). Major input parameters for the model are rainfall and catchment parameters which include sub catchments, canals, junctions, rain gauge and outfalls. Since there are no gauged urban water sheds in Sri Lanka, significant data was not available for model calibration and verification. However, Walgama watershed was selected for the mathematical modelling and data were collected through several field surveys. As SWMM can model several outfalls
simultaneously and is capable of presenting outflows at canals and junctions with animations, finding management options were easy. 2. Methodology
The study methodology included a literature survey, field work for identification of input parameters, field observations for model calibration, modeling of the watershed, and a parameter sensitivity study to propose management options.
Literature survey was carried out on several published and unpublished studies about storm water management options, urban catchment handling, runoff calculation methods and available methods for storm water management. ( Chouli.E. et al, 2005.[1]).
2.1 Data Collection
Since the study area is ungauged, there were no recorded data available. Therefore, field work was important for collecting the data for model development and calibration. Desk studies were carried out using satellite images and the 1:10,000 topographic maps of the survey department, in order to find out drainage directions, land use patterns and subcatchment slopes.
In order to model the actual field condition, as it is, all canal details and sub catchment details must be observed within the catchment area and data must be collected for each parameter. Several field visits were carried out to gather the information about the drainage network characteristics and flooding details. Since there were time and resource limitations, data were collected using linen tape and hand held GPS and at the same time eye estimations were used to estimate several parameters. Subcatchment land use pattern, topography and vegetation types were observed during field visits and subcatchment slope, area and percentage of impervious areas were calculated using GIS tool. Vegetation type and percentage of impervious area are important to determine the Manning’s Roughness Coefficient for over land flow. Typical Manning’s roughness values were collected from some text books. (Chow, V. T. et al, 1998.[2], Maidment, D.R.,1993.[5]). Parameters of subcatchments are as in Table 01. Sub catchment number is related to the figure 03 and ‘N’ stands for Coefficient of Manning roughness.
ENGINEER 3
Subcatchment properties Subcatchment
Number Area Width %
slope %
impervious N -impervious N -
pervious 1 24.087 385 8.8 15 0.023 0.4 2 5.814 305 7.27 20 0.024 0.15 3 1.228 182 0.055 25 0.01 0.1 4 2.918 220 0.5 30 0.01 0.1 5 3.148 265 8.37 23 0.01 0.18 6 2.728 260 0.5 25 0.01 0.1 7 2.912 277 0.325 25 0.01 0.1 8 1.397 200 0.05 35 0.01 0.1 9 9.028 490 3.45 10 0.01 0.2
10 7.647 300 0.46 25 0.01 0.1 11 7.012 360 0.687 23 0.01 0.1 12 6.889 236 0.1 20 0.01 0.1 13 16.659 535 0.131 39 0.01 0.1 14 20.731 500 0.18 30 0.01 0.17
Madihe Mudun Ela is the main canal section of the Walgama watershed. Canal geometry, vegetation along the canal, bed slope, bed condition and canal lengths were observed during the field visits and GPS locations were recorded at each junction as it is important for the calculation of elevation at the junction. Some canal parameters are as given in Table 02. Geological features of each parameter were collected from digital photographs as they are useful in model verification.
A flood survey was carried out to collect past flood information from stakeholders with the aid of a questionnaire developed for this study. The public, in the watershed, provided their memories in flood events of the recent past which had occurred on 18th of July 2008. It was revealed that the upstream of Madihe Mudun Ela canal undergoes a flood, even after a small rainfall. Flood heights indicated by them are shown in Table 03 and ponded areas at each junction are indicated in Figure 04 and their flow directions were observed and noted during the field visits.
Chainage
Canal Geometry Surface cover shape Top Maximum Left Bank Right Bank Bed
width(m) depth(m)
115m
Rec
tang
ular
3 1.6 Vegetation Vegetation Clay
4.7m 1.45 0.75 Concrete Concrete Concrete
151.8m 2.5 0.8 Vegetation Vegetation Clay
20m 1 0.8 Concrete Concrete Concrete
33m 2 0.6 Concrete Concrete Concrete
80m 2 0.75 Gabian Gabian Muddy
55m 2 0.8 Gabian Gabian Muddy
15m 0.9 0.4 Vegetation Vegetation Vegetation
20m 2 0.75 Concrete Concrete Concrete
Table 1 - Subcatchment parameters
Table 2 - Collected Data from Field Surveys

ENGINEER 58
ENGINEER 4
Rainfall data of the event of 18th July 2008, which had been recorded at three hour intervals, were collected from the Irrigation Department at Matara because the flooded information collected from the field were pertaining to this event. As in Figure 02, time series was developed assuming uniform rainfall over three hour periods. 2.2 Model Development The Watershed was delineated on 1:10000 topo sheets and then major sub catchments were drawn. These were used to develop the watershed schematic as in Figure 03 and a SWMM model was developed. Collected data were used to generate flood situation for a known rainfall event. According to the terrain, fourteen sub catchments having a slope between 8.8% - 0.2% and an area between 0.05km2- 0.3km2 area variations were identified. A canal was modelled using fourteen junctions as indicated in Figure 03. Due to lack of data, each canal section was assumed to be rectangular and has the same roughness value. The dynamic behaviour of water was simulated by allowing ponding at each junction.
Junction Flood height (m) J1 1.219 J3 0.762 J4 o.305 J5 0.152 J6 0.305
Rain
fall
(mm
)
Table 3 - Past Flood Heights indicated by the stake holders
Figure 3 - Schematic Diagram of the Watershed
Time (months)
Figure 2 - Distribution of Rainfall
-Subcatchment
-Junction
S1 (0.24 km2)
S2 (0.058km2)
S14 (0.20 km2)
S9 (0.09km2)
S11 (0.07 km2) S12
(0.069 km2)
S13 (0.16km2)
S10 (0.076 km2)
S6 (0.027km2)
S4 (0.029km2)
S3 (0.012 km2)
S8 (0.14km2)
S7 (0.029 km2) S5 (0.031 km2)

59 ENGINEER
ENGINEER 5
Due to the limitation of time and resources, the ponding areas at each junction were calculated by observations. Using stakeholder information about ponding area, each area was averaged as reservoirs with an averaged rectangular base to compute the flood heights from the model calculated flood volumes. Results are shown the Table 04. 2.3 Model calibration The developed model was calibrated using flood locations and flood heights that were collected from the stakeholders (Table 03). A set of input parameters obtained from literature and compatible with the field conditions were used to develop the model and the outputs were observed. Since the model only provides the flood quantity of a particular node as a volume the conversions to heights was done as described earlier. Due to limited actual flood data availability the calibration was limited to this single event. According to the junction flooding summary from SWMM5, the junctions J1,J3, J4 and J6 were found as critical junctions that were significantly flooded. Comparison of the modelled flood heights and stakeholder flood heights are indicated in Table 04. Since the model gives approximate flood heights with the stake holder’s data, it can be decided that this model can be applied for modelling of urban watersheds. After the model development, the sensitivity of the parameters was checked by changing canal roughness, subcatchment slope, manning roughness values within reasonable limits.
3. Option Identification It is essential to provide some suitable options for this stormwater problem in this Walgama area as it severely affected the human day-to-day life. But, we have to consider an option that would incur a low cost as well as the ability to mitigate the current problem. Since most of the canals were silted and vegetated, obstruction for the flow of water is high and, as a result, the Manning’s roughness value taken for each canal was very high. As a solution, removing vegetation from the canal with proper maintenance was considered as an option. The model outputs were observed for this scenario. The key options considered for the system are shown in the last column of Table 05. According to the results, concreting the canal and increasing the depth of the canal will not bring about a significant flood reduction. At the same time, improving detention capacity was also identified as an effective way to attenuate peak flow in the catchment. A marshy land at the beginning of the canal was observed and this was targeted as detention storage. Increasing of canal depth, concreting canals were some other options that are considered in this study. Table 05 indicates the actual flood quantity and quantity of flood reduction for each option available. A reduction of Canal roughness from 0.2 to 0.015 reduced the flood peak by 56%. After the introduction of a rectangular detention unit with a floor area of 200 m2 at the junction J1 together with the reduction of canal roughness in the entire canal network, the flooding status of the project area change to zero flooding at all nodes. The water surface profile for this situation for the calculated rainfall event is shown in Figure 04.
Node Stake Holder’s
Flood Height(m)
Flood Volume Given
by Model(m3)
Estimated Ponded
Area(m2)
Flood Height
from Model(m)
J1 1.219 28109 22500 1.243
J3 0.762 7983 10000 0.792
J4 0.305 1280 4000 0.32
J5 0.152 0 2500 0
J6 0.305 5364 10000 0.518
Table 4 - Model Calibration Data
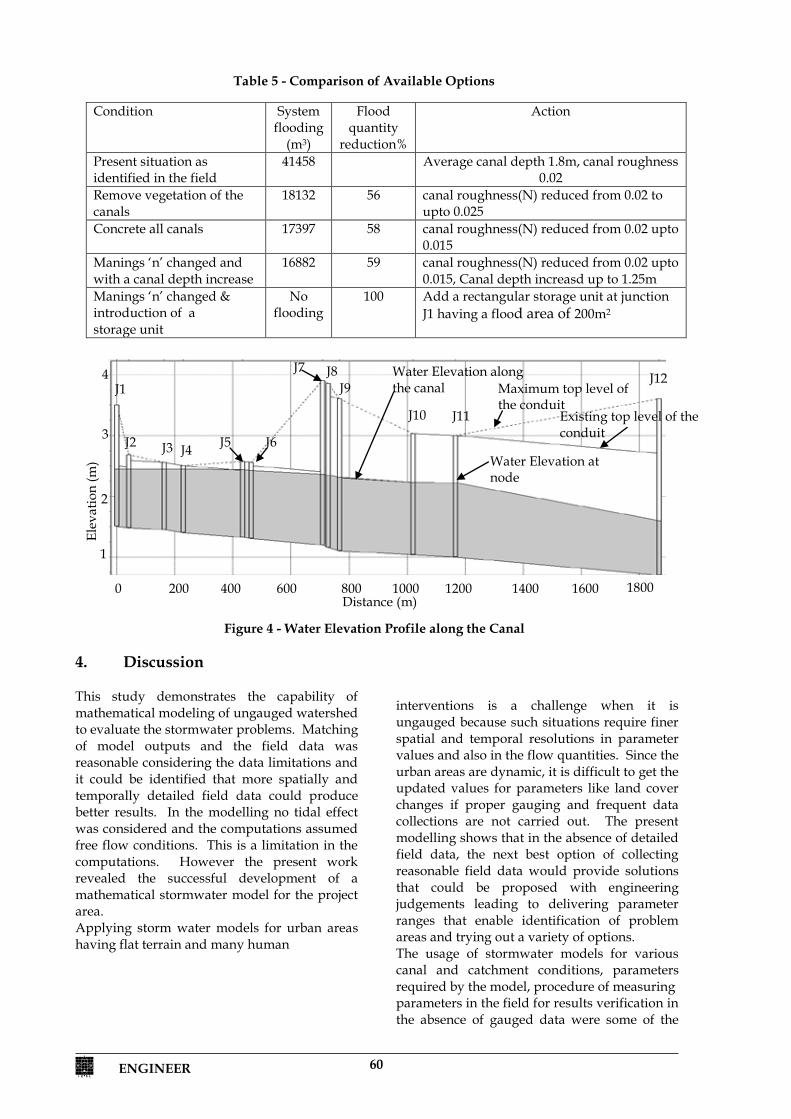
ENGINEER 60
ENGINEER 6
4. Discussion This study demonstrates the capability of mathematical modeling of ungauged watershed to evaluate the stormwater problems. Matching of model outputs and the field data was reasonable considering the data limitations and it could be identified that more spatially and temporally detailed field data could produce better results. In the modelling no tidal effect was considered and the computations assumed free flow conditions. This is a limitation in the computations. However the present work revealed the successful development of a mathematical stormwater model for the project area. Applying storm water models for urban areas having flat terrain and many human
interventions is a challenge when it is ungauged because such situations require finer spatial and temporal resolutions in parameter values and also in the flow quantities. Since the urban areas are dynamic, it is difficult to get the updated values for parameters like land cover changes if proper gauging and frequent data collections are not carried out. The present modelling shows that in the absence of detailed field data, the next best option of collecting reasonable field data would provide solutions that could be proposed with engineering judgements leading to delivering parameter ranges that enable identification of problem areas and trying out a variety of options. The usage of stormwater models for various canal and catchment conditions, parameters required by the model, procedure of measuring parameters in the field for results verification in the absence of gauged data were some of the
Condition System flooding
(m3)
Flood quantity
reduction%
Action
Present situation as identified in the field
41458 Average canal depth 1.8m, canal roughness 0.02
Remove vegetation of the canals
18132 56 canal roughness(N) reduced from 0.02 to upto 0.025
Concrete all canals 17397 58 canal roughness(N) reduced from 0.02 upto 0.015
Manings ‘n’ changed and with a canal depth increase
16882 59 canal roughness(N) reduced from 0.02 upto 0.015, Canal depth increasd up to 1.25m
Manings ‘n’ changed & introduction of a storage unit
No flooding
100 Add a rectangular storage unit at junction J1 having a flood area of 200m2
Table 5 - Comparison of Available Options
Figure 4 - Water Elevation Profile along the Canal
800 1000 1200 600
Existing top level of the conduit
Maximum top level of the conduit
J5 J6
J12
1
2
3
4
0 200 400 1800 1400 1600
J10 J11
Distance (m)
J7 J8 J9 J1
J2 J3 J4
Elev
atio
n (m
) Water Elevation at node
Water Elevation along the canal

61 ENGINEER
ENGINEER 7
critical situations that were faced during the study. To overcome the data scarce situation, the present work carried out an in-depth study of the modelling concepts to identify the parameter values that could be measured in the field for use either as base data or to make judgements over standard guideline recommendations. Also in the present work a demonstration was made that assessment of stakeholder information could be wisely used for model calibration. Though it is common for modellers to wait for base data, this type of approximate modelling can be initiated as the first step and then strengthen the results with a more focussed data collection and a follow up modelling programme. This work also presented that the potential of SWMM5 to produce the dynamic flow behaviour can also be effectively used for engineering advantage. In the present work, assessment of model outputs with parameter variations recognised that it is necessary to be careful about the following to arrive at more reliable outputs.
1. Variation of canal section and roughness values along the canal.
2. Identification of base data for model calibration and verification
3. Maps at a resolution of better than 1:10,000 scales or with elevation data at a higher spatial resolution.
4. Planning of field data collection programms and recognition of base data requirements prior to visits.
5. Tidal action must be taken into account during modelling of coastal watersheds.
5. Conclusions Major conclusions of this study can be summarized as follows.
1. SWMM 5 can be used to simulate the ungauged urban catchments which have to be studied considering the dynamic nature of human influences. However, for very specific and accurate results from the model, then, it is necessary to initiate comprehensive data collection programmes.
2. The most sensitive parameter for the
out flow is canal roughness and reducing the value from 0.02 to 0.015 caused a 56% reduction in the flood peak.
3. If an option of detention storage is provided together with canal cleaning, achieving a Manning’s roughness coefficient of 0.015 indicated that 100% flood reduction can be achieved for the considered storm.
4. Increasing of canal depth and concreting of the canal with a roughness value of 0.015 resulted in only a 1% reduction of flood peak value.
References
1. Chouli. E, Aftias, E & Deutsch, J.C, Applying Storm Water Management in Greek Cities: learning from the European Experience, Science Direct, Faculty of Civil Engineering, National Technical University of Athens, 2005.
2. Chow, V. T., Maidment, D. R. & Mays, L. W. Applied Hydrology, New York etc., McGraw-Hill. (0-07-010810-2),1998.
3. David, E, Farley.J & Haynes, C, Design and
Routing of Storm Flows in an Urbanized Watershed without Surface Streams, Journal of Hydrology, Department of Civil and Environmental Engineering, Duke University USA.
4. Marsalek,J, -CisnerosB.E.J, Karamouz,A & Chocat.B, Urban Water Cycle Processes and Interactions, International Hydrological Programme, Technical Documents in Hydrology, No. 78,UNESCO, 2006.
5. Maidment, D.R., Hand Book of Hydrology. 1st
ed. New York: McGraw Hill Book Company, 1993.
6. Polaskava K., Hlavinek P., Haloan R.,
Integrated Approach for Protection of an Urban Catchment Area. Institute of Municipal Water Management, Brno University of Technology, 2005.
7. http://www.epa.gov/ednnrmrl/models/swmm/index.htm Visited 23rd December 2009.
