vol. 1 no. 1 2020v editorial welcome! this is the first issue asric scientific journals under the...
TRANSCRIPT
ii
Vol. 1 No. 1 2020
iii
Copyright © African Scientific Research and Innovation Council, 2020
Published by: African Scientific Research and Innovation Council
Plot 114 Yakubu Gowon Crescent Asokoro
Abuja, Nigeria
The views expressed in the ASRIC Scientific Journals are those of the authors and not necessarily
those of the African Scientific Research and Innovation Council; the African Union Scientific,
Technical and Research Commission; or the organisations that they belong to.
iv
Editor in Chief:
Prof. Driss Ouazar, Vice Chair, Communication, ASRIC; Hassan II Academy of
Science and Technology; Professor
Editorial Advisory Board:
Prof. Ratemo Michieka, Chair, ASRIC; Professor of the University of Nairobi
Honorary Secretary, Kenya National Academy of Sciences
Mr James Phir, Vice Chair, Scientific and Innovation, ASRIC; Executive
Director of the Zambia Academy of Sciences;
Researcher at the University of Zambia
Prof. Mosto Onuoha, Vice Chair, Scientific and Innovation, ASRIC; President of
the Nigerian Academy of Science; Professor Emeritus
Prof. Beban Sammy Chumbow, Vice Chair, Resource Mobilization, ASRIC; President
ACALAN; Pro Chancellor; Professor Emeritus
Dr. Eng. Ahmed Hamdy, Executive Director, ASRIC; Executive Director, AU-STRC
The editorial correspondence should be sent to:
Editor-in-Chief, ASRIC Scientific Journals,
African Scientific Research and Innovation Council,
Plot 114 Yakubu Gowon Crescent Asokoro
Abuja, Nigeria
v
Editorial
Welcome! This is the first issue ASRIC Scientific Journals under the auspices of the African Scientific
Research and Innovation Council (ASRIC). The ASRIC was adopted by the African Union Executive
Council Decision (EX.CL/Dec.747 (XXII)), Addis Ababa 2013, and was inaugurated in November
2018 in accordance to its Statute. The second ASRIC Congress called for the creation of a journal
which will publish high quality, original research articles within four thematic areas identified as
follows: Agricultural Sciences; Health Sciences; Social Sciences; and Water, Energy &
Environmental Sciences. As a result the ASRIC Scientific Journals was born and it is a consolidation
of four journals categorized according to the thematic areas, including the best papers discussed
during the congress, and accepted by the evaluation committee.
The first volume of the ASRIC Scientific Journals is published with twenty two articles - five articles
under the ASRIC Journal of Agricultural Sciences; three articles in the ASRIC Journal of Health
Sciences; nine articles under the ASRIC Journal of Social Sciences; and five articles in the ASRIC
Journal of Water, Energy & Environmental Sciences. Beginning from 2021 the ASRIC Scientific
Journals will be published biannually. This will enable us to include more articles per year and have
faster processing rate of the articles we receive.
For us to realize benefits out of this journal, we encourage the submission of more of practice based
articles as this will help us in scoring highly and quickly move up in journal ranking lists. As such, we
have set standard guidelines to influence the quality of articles and we will encourage authors to work
within these standards for a better and reliable journal. In addition, adherence to these standards will
enable us receive a high impact factor for the journal and attract the submission of high-performance
papers to the journal. Nonetheless we will continue to publish excellent articles and we should find
new ideas that can create more interest in the readership of the journal and content we will consider
and adopt. Together, we can build strong journal series that can attract the African scientific
communities and extend the scope for scientific discussion forums.
I thank my entire editorial board, the editors and reviewers for all their support and I look forward to
welcoming new members to the editorial board of this multi-journal version soon. We are fortunate to
backup of experts with high standing in the academia and research who are contributing their quota
towards making the journal an influential publication.
Prof. Driss Ouazar
Editor-in-Chief

vi
Contents
ASRIC JOURNAL ON AGRICULTURAL SCIENCES 2020
ASRIC JOURNAL ON HEALTH SCIENCES 2020
ASRIC JOURNAL ON SOCIAL SCIENCES AND HUMANITIES 2020
ASRIC JOURNAL ON WATER ENERGY AND ENVIRONMENT 2020
vii

viii

ix
Table of Contents
Heavy Metals and Physico-Chemical Properties of Clarias Gariepinus from Five Water Bodies in
South East Nigeria ........................................................................................................................................ 1
Sustainable Food Production in Africa: Turning African Countries into Development Catalysts, Food
Reservoirs and Exporters ............................................................................................................................ 11
Irrigated winter wheat yield forecast using remotely sensed vegetation indices at field level, in
Matobo district of Zimbabwe ...................................................................................................................... 24
Removal of Toxic Metals from Water using Cabbage, Carrots and Lettuce as Biofilters .......................... 35
The Small Farmer Infrastructural Incentive Imbroglio in Rural Cameroon ............................................... 43
1
Available online at www.asric.org
ASRIC Journal on Agricultural Sciences 1 (2020) 1-10
a Department of Food Science and Technology, University of Nigeria, Nsukka.
b Department of Pharmacology and Therapeutics, University of Nigeria,
College of Medicine Enugu Campus.
Received 19 December 2019; revised 30 January 2020; accepted 30 January 2020
Abstract
This study was conducted to evaluate the concentration of lead (Pb), copper (Cu) and zinc (Zn) of clarias
gariepinus from three rivers (Uwana, Oziza, Akpoha,) and two aquaculture fish farms (PolyUwana and Ngwo)
in the south-eastern part of Nigeria. Samples of fish species and water were obtained in triplicates from
fishermen and aquaculture sellers. The fish samples were digested and analyzed. The physico-chemical
properties of the water samples were also determined. The result showed that Pb concentrations (ppm) in the
fish samples were 0.000 ± 0.001 (Uwana river), 0.014 ± 0.041 (Ngwo), 0.022 ± 0.026 (Akpoha river), 0.043 ±
0.057 (Oziza river) and 0.047 ± 0.063 (PolyUwana). Cu concentrations were 0.020 ± 0.027 (Uwana river), 0.028
± 0.026 (Oziza river), 0.029 ± 0.023 (PolyUwana), 0.038 ± 0.021 (Ngwo) and 0.048 ± 0.071 (Akpoha river). Zn
concentrations were 0.366 ± 0.178 (Uwana river), 0.458 ± 0.323 (PolyUwana), 0.467 ± 0.356 (Akpoha river),
0.486 ± 0.245 (Oziza river) and 0.492 ± 0.161 (Ngwo). There were significant (p < 0.05) differences between
the river sources for Pb. There was no significant difference between the river sources for Zn and Cu. The
physicochemical properties of the water showed low levels of the elements studied and the highest concentration
of metals was in Oziza river while the lowest concentration was in Ngwo Aquaculture. There were no
significant (p > 0.05) differences in Pb, Cu and Zn concentrations of the water samples. Water sample from
Oziza river was also found to have the highest turbidity (15.20), highest titrable acidity (0.95) and lowest pH
(5.47). In all cases, the heavy metal concentrations were lower than the maximum limit set by FAO/WHO.
Keywords: Heavy metals; clarias gariepinus; Physico-chemical, Aquaculture
1. Introduction
Pollution of the aquatic environment by inorganic chemicals has been considered a major threat to the
aquatic organisms including fishes. The agricultural drainage water containing pesticides and
fertilizers and effluents of industrial activities and run offs in addition to sewage effluents, supply to
water bodies huge quantities of inorganic anions and heavy metals (ECDG, 2002). The sources of
water can beconstantly polluted with a series of metals (as well as with other pollutant) which can be
sources of intoxication for man, depending on the dose of metals that exists in the water.
Heavy metals are generally referred to as those metals which possess a specific density of more
than 5 g/cm3 and adversely affect the environment and living organisms (Jarup, 2003). These metals
are essential for the maintenance of various biochemical and physiological functions in living
1 Corresponding author. Email addresses: [email protected]; [email protected] (E.N.
Aniagor), [email protected] (C.J. Igbokwe), [email protected] (T.M. Okonkwo)
2
organisms in very low concentrations, however they become harmful when they exceed certain
threshold concentrations. Heavy metals are significant environmental pollutants and their toxicity is a
problem of increasing significance for ecological, evolutionary, nutritional and environmental reasons
(Jaishankar et al., 2013; Nagajyoti et al., 2010). The most commonly found heavy metals in waste
water include arsenic, cadmium, chromium, copper, lead, nickel, and zinc, all of which cause risks for
human health and the environment (Lambert et al., 2000). Heavy metals enter the surroundings by
natural means and through human activities. Various sources of heavy metals include soil erosion,
natural weathering of the earth’s crust, mining, industrial effluents, urban runoff, sewage discharge,
insect or disease control agents applied to crops, and many others (Morais et al., 2012). Trace metals
such as Zinc (Zn), Copper (Cu) and Iron (Fe) play a biochemical role in the life processes of all
aquatic plants and animals, therefore, they are essential in the aquatic environment in trace amount.
Extensive research programs have been carried out to investigate the fishes in the inland waters of
Egypt, including the northern Delta Lakes (Shakweer and Abbas, 1996; Khallaf et al., 1998; El-
Moselhy, 1999; Elghobashy et al., 2001).
The most anthropogenic sources of metals are industries, petroleum contamination and sewage
disposal (Santos et al., 2005). Metal ions can be incorporated into food chains and concentrated in
aquatic organisms to a level that affects the physiological state. Metals have both benefits for the
human body when they act as mineral substances and also toxic effects when they reach a certain high
concentrations. One group of the effective pollutants is heavy metals which have drastic
environmental impact on all organisms (Samir and Ibrahim, 2008).
Since fish is known for the bioaccumulation of heavy metals in its body, it is an important
biomonitor of the presence of heavy metal (lead, zinc and copper) in their water. In rural areas, fish is
an important source of food for the human population and its procurement is not always controlled,
therefore, there is more often a risk for those people who consume contaminated fish.
Fish is a worldwide distributed food commodity. It is regarded as a potentially cheap source of
protein, especially in developing countries such as Nigeria and India where problems of nutritional
deficiencies persist (Mandakini and Gaihiamngam, 2010).
The level of heavy metals in the fish flesh is of interest because of potential risk to humans
(Ashraf, 2005; Barbieri et al., 2010). This present work is a public health study aimed at investigating
the heavy metal concentration of the most popularly consumed fresh water fish (Clarias Gariepinus)
in south east Nigeria. The broad objective of this study was to investigate the level of heavy metals in
Clarias gariepinus in some water bodies in South East Nigeria. The specific objectives were to:
1. Evaluate the heavy metal content of Clarias gariepinus from three rivers and two aquaculture
fish ponds.
2. Evaluate the heavy metal content of the water body
3. Evaluate the physico-chemical properties of the water bodies.
Clarias gariepinus also known as African catfish is generally considered to be one of the most
important tropical catfish species for aquaculture. It has an almost Pan-African distribution, ranging
from the Nile to West Africa and from Algeria to Southern Africa. They also occur in Asia Minor
(Obaroh et al., 2015). C. gariepinus is hardy and tolerates adverse water quality conditions. It can be
raised in high densities, resulting in high net yields. It grows fast and feeds on living and dead animal
matter. It is also able to swallow relatively large prey whole, because of its wide mouth. This species
is of major economic importance and also an important aquaculture species thus it was introduced all
over the world for farming purposes in the early 1980s. Clarias gariepinus is also of high economic
importance in many countries of the world especially African and Asian continents (Legendre et
al., 1992; Adebayo and Fagbenro 2004; Olaniyi and Omitogun 2014); and also serve mainly
as food in many homes and hotels (Omitogun et al., 2012). Recently, there has been an
increase in the farming of Clarias and Heterobranchus spp and their hybrids in Nigeria based
on their growth performance, short generation interval, and consumer preference or demand,
among others.
Nutrient Composition of Fish
The major constituents of fish are moisture, protein and fat with minerals occurring in trace
amount (Dhanapal et al., 2011).
3
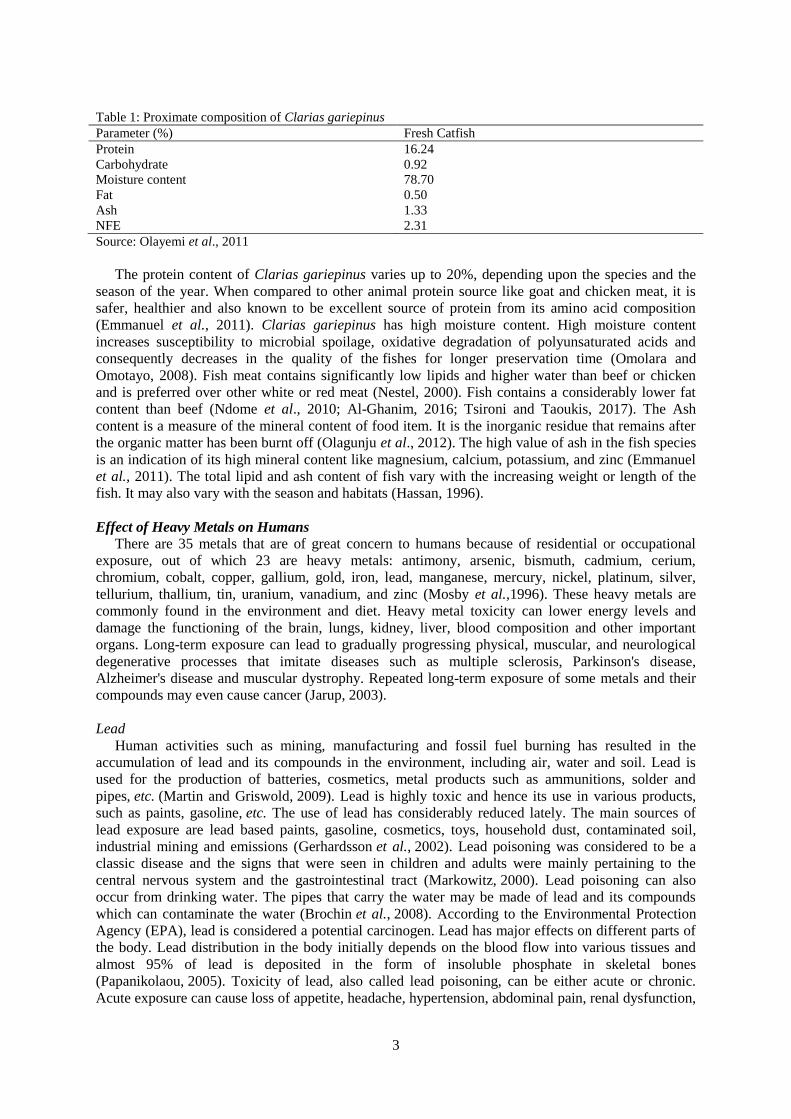
Table 1: Proximate composition of Clarias gariepinus
Parameter (%) Fresh Catfish
Protein 16.24
Carbohydrate 0.92
Moisture content 78.70
Fat 0.50
Ash 1.33
NFE 2.31
Source: Olayemi et al., 2011
The protein content of Clarias gariepinus varies up to 20%, depending upon the species and the
season of the year. When compared to other animal protein source like goat and chicken meat, it is
safer, healthier and also known to be excellent source of protein from its amino acid composition
(Emmanuel et al., 2011). Clarias gariepinus has high moisture content. High moisture content
increases susceptibility to microbial spoilage, oxidative degradation of polyunsaturated acids and
consequently decreases in the quality of the fishes for longer preservation time (Omolara and
Omotayo, 2008). Fish meat contains significantly low lipids and higher water than beef or chicken
and is preferred over other white or red meat (Nestel, 2000). Fish contains a considerably lower fat
content than beef (Ndome et al., 2010; Al-Ghanim, 2016; Tsironi and Taoukis, 2017). The Ash
content is a measure of the mineral content of food item. It is the inorganic residue that remains after
the organic matter has been burnt off (Olagunju et al., 2012). The high value of ash in the fish species
is an indication of its high mineral content like magnesium, calcium, potassium, and zinc (Emmanuel
et al., 2011). The total lipid and ash content of fish vary with the increasing weight or length of the
fish. It may also vary with the season and habitats (Hassan, 1996).
Effect of Heavy Metals on Humans
There are 35 metals that are of great concern to humans because of residential or occupational
exposure, out of which 23 are heavy metals: antimony, arsenic, bismuth, cadmium, cerium,
chromium, cobalt, copper, gallium, gold, iron, lead, manganese, mercury, nickel, platinum, silver,
tellurium, thallium, tin, uranium, vanadium, and zinc (Mosby et al.,1996). These heavy metals are
commonly found in the environment and diet. Heavy metal toxicity can lower energy levels and
damage the functioning of the brain, lungs, kidney, liver, blood composition and other important
organs. Long-term exposure can lead to gradually progressing physical, muscular, and neurological
degenerative processes that imitate diseases such as multiple sclerosis, Parkinson's disease,
Alzheimer's disease and muscular dystrophy. Repeated long-term exposure of some metals and their
compounds may even cause cancer (Jarup, 2003).
Lead
Human activities such as mining, manufacturing and fossil fuel burning has resulted in the
accumulation of lead and its compounds in the environment, including air, water and soil. Lead is
used for the production of batteries, cosmetics, metal products such as ammunitions, solder and
pipes, etc. (Martin and Griswold, 2009). Lead is highly toxic and hence its use in various products,
such as paints, gasoline, etc. The use of lead has considerably reduced lately. The main sources of
lead exposure are lead based paints, gasoline, cosmetics, toys, household dust, contaminated soil,
industrial mining and emissions (Gerhardsson et al., 2002). Lead poisoning was considered to be a
classic disease and the signs that were seen in children and adults were mainly pertaining to the
central nervous system and the gastrointestinal tract (Markowitz, 2000). Lead poisoning can also
occur from drinking water. The pipes that carry the water may be made of lead and its compounds
which can contaminate the water (Brochin et al., 2008). According to the Environmental Protection
Agency (EPA), lead is considered a potential carcinogen. Lead has major effects on different parts of
the body. Lead distribution in the body initially depends on the blood flow into various tissues and
almost 95% of lead is deposited in the form of insoluble phosphate in skeletal bones
(Papanikolaou, 2005). Toxicity of lead, also called lead poisoning, can be either acute or chronic.
Acute exposure can cause loss of appetite, headache, hypertension, abdominal pain, renal dysfunction,
4
fatigue, sleeplessness, arthritis, hallucinations etc. Acute exposure mainly occurs in the place of work
and in some manufacturing industries which make use of lead. Chronic exposure of lead can result in
mental retardation, birth defects, psychosis, autism, allergies, dyslexia, weight loss, hyperactivity,
paralysis, muscular weakness, brain damage, kidney damage and may even cause death (Martin and
Griswold, 2009). Although lead poisoning is preventable it still remains a dangerous disease which
can affect most of the organs. The plasma membrane moves into the interstitial spaces of the brain
when the blood brain barrier is exposed to elevated levels of lead concentration, resulting in a
condition called edema (Teo et al., 1997). It disrupts the intracellular second messenger systems and
alters the functioning of the central nervous system, whose protection is highly important.
Environmental and domestic sources of lead ions are the main cause of the disease but with proper
precautionary measures it is possible to reduce the risk associated with lead toxicity (Brochin et
al., 2008)
Copper
Electroplating and metalworking industries discharge large amounts of heavy metals, including
copper (Cu) and nickel (Ni) ions, in their effluents (Ting-Chu, 2009). Environmental contamination
due to copper is caused by mining, printed circuits, metallurgical, fiber production, pipe corrosion and
metal plating industries. The other major industries discharging copper in their effluents are paper and
pulp, petroleum refining and wood preserving. Agricultural sources such as fertilizers, fungicidal
sprays and animal wastes also lead to water pollution due to copper. Copper may be found as a
contaminant in food, especially shell fish, liver, mushrooms, nuts and chocolates. Any packaging
container using copper material may contaminate the product such as food, water and drink (Pamar
and Thakur, 2013). Copper has been reported to cause neurotoxicity commonly known as “Wilson’s
disease” due to deposition of copper in the lenticular nucleus of the brain and kidney failure. In some
instances, exposure to copper has resulted in jaundice and enlarged liver. It is suspected to be
responsible for one form of metal fume fever (Pamar and Thakur, 2013). Copper containing sprays are
linked to an increase in lung cancer among exposed workers (Onundi et al., 2010).
Zinc
Zinc is the 23rd most abundant element in the Earth's crust and its concentrations are rising
unnaturally, due to addition of zinc through human activities (Nasernejad et al., 2005). Zinc is a
lustrous bluish-white metal. It is brittle and crystalline at ordinary temperatures, but it becomes ductile
and malleable when heated between 110°C and 150°C. It is a fairly reactive metal that will combine
with oxygen and other non-metals, and will react with dilute acids to release hydrogen. Most zinc is
added during industrial activities, such as mining, coal and waste combustion and steel processing
(Raut et al., 2012). Zinc is widely used in industries such as galvanization, paint, batteries, smelting,
fertilizers and pesticides, fossil fuel combustion, pigment, polymer stabilizers, etc, and the wastewater
from these industries is polluted with zinc, due to its presence in large quantities (Holdren et al., 1991:
Pamar and Thakur, 2013). During washing of the electroplating tanks, considerable amounts of the
metal ions find their way into the effluent (Al-Asheh and Duvnjak, 1997). When it is present in less
quantity in human’s body, it affects the human’s health. Although humans can handle repeated
exposure to zinc, accumulation of it can be hazardous to human health (Khan and Wahab, 2006).
Toxic Effect of Heavy Metals on Aquatic Organisms
Aquatic organisms are adversely affected by heavy metals in the environment. The toxicity is
largely a function of the water chemistry and sediment composition in the surface water system
(Volesky, 2003). The metals are mineralized by microorganisms, which in turn are taken up by
plankton and further by the aquatic organisms. Finally, the metals by now, several times
biomagnified is taken up by man when he consumes fish from the contaminated water. Slightly
elevated metal levels in natural waters may cause the following sublethal effects in aquatic organisms:
i. Histological or morphological change in tissues
ii. Changes in physiology, such as suppression of growth and development, poor swimming
performance, changes in circulation
iii. Change in biochemistry, such as enzyme activity and blood chemistry
iv. Change in behaviour
5
v. Changes in reproduction (Pamar and Thakur, 2013).
2. Methods
The samples were digested using the aqua regia digestion method as described by AOAC (2010).
The digested samples were analysed according to standard methods using the Atomic Absorption
Spectophotometer (Shimadzu model AA7000) as described by AOAC (2010). The physicochemical
properties were determined according to standard methods (AOAC, 2010).
Techniques
The samples were left to thaw and three grams of each of the samples were weighed into digestion
flasks containing 28 ml aqua regia (21 ml HCl and 7 ml HNO3) fitted with water condenser. The
mixture was kept overnight at room temperature. It was then boiled for 2 hours on an electrothermal
heater. The content of the flask was allowed to cool then filtered using the whatman filter paper and
diluted to 100 ml with deionised water.
Determination of Heavy Metals
The various standards of the metals were prepared from 1000 ppm stock solution of each metal
using the formular: P1V1 = P2V2
The system was put on and allowed to initialize. The various standards were aspirated into the
flame and got atomized by the flame. The graph of the standard was plotted and displayed on the
monitor. The various samples were aspirated and analysed and the heavy metal concentrations
displayed on the screen. The procedure was repeated for each of the elements and the result was
printed out.
Studied Material
Samples of Clarias gariepinus were collected in triplicates from each collection spot. The raw
samples were collected from fishermen and women fish sellers at Akpoha, Oziza and Unwana fresh
water ecosystem. The samples were kept in an ice pack temporally from the sampling site and later
stored frozen until the analysis took place. Water samples were also be collected for analysis
alongside the fish samples at Akpoha, Oziza, and Uwana rivers and analysed in the laboratory
Samples of Clarias gariepinus were also collected from a fish pond at Uwana Polytechnic and another
fish pond at Ngwo, Enugu State and these served as control samples. The water samples from these
aquaculture sites were also collected for analysis
The fish samples were dissected and the gills, viscera and muscle parts of each of the three species
were collected, duely labeled and stored in the freezer. Also labeled and stored were samples of the
rivers and aquaculture ponds.
Area Description
South East Nigeria is one of the six geopolitical zones in Nigeria. Southeast Nigeria is a region
of Nigeria that borders Cameroon to the east and the Atlantic ocean to the south. The dominant
language of this region is Igbo. Southeastern Nigeria is also where the oil wealth of Nigeria originates
from, which has led to environmental degradation of its extreme south in the mangroves, rivers, and
swamps facing the Atlantic. Although southeastern Nigeria is often referred to as a region by
Nigerians, it stopped being an official region in 1967 after Nigeria switched to states.
3. Result and Discussion
Heavy Metal Concentration of Clarias Gariepinus obtained from South East Nigeria.
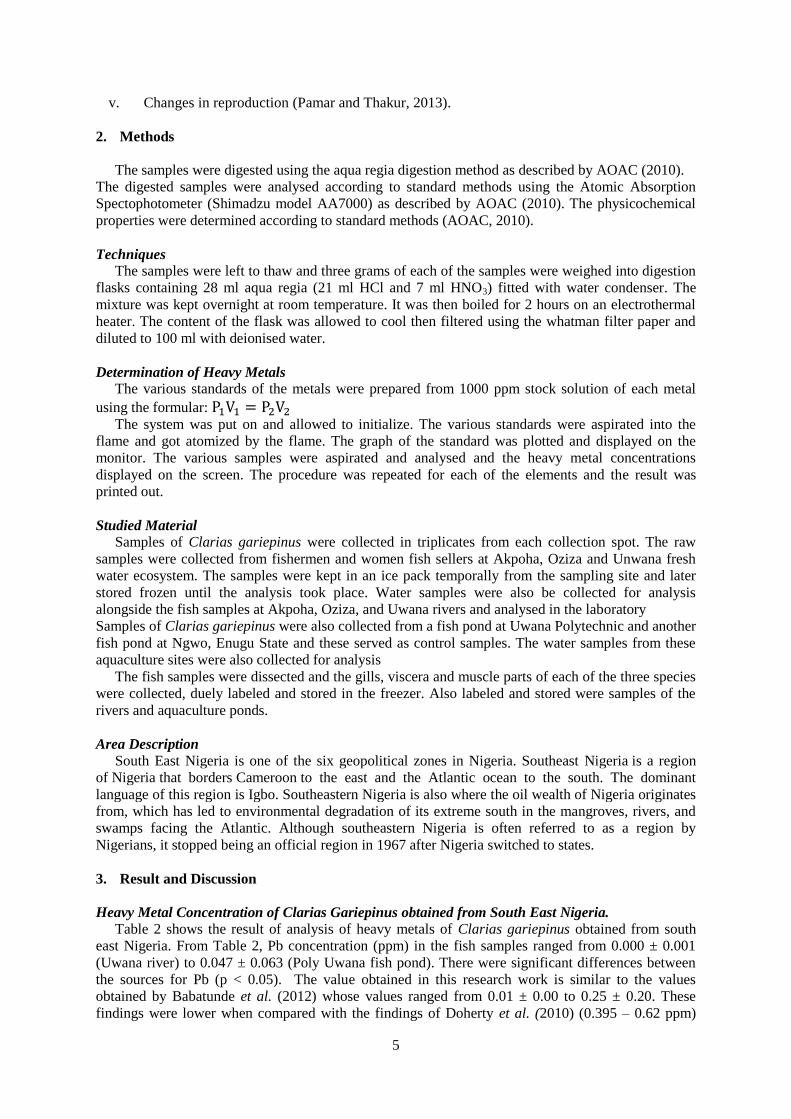
Table 2 shows the result of analysis of heavy metals of Clarias gariepinus obtained from south
east Nigeria. From Table 2, Pb concentration (ppm) in the fish samples ranged from 0.000 ± 0.001
(Uwana river) to 0.047 ± 0.063 (Poly Uwana fish pond). There were significant differences between
the sources for Pb (p < 0.05). The value obtained in this research work is similar to the values
obtained by Babatunde et al. (2012) whose values ranged from 0.01 ± 0.00 to 0.25 ± 0.20. These
findings were lower when compared with the findings of Doherty et al. (2010) (0.395 – 0.62 ppm)
6
and Okoye et al. (1991) (9 ppm) who researched on lead in some fishes from Lagos Lagoon. Farombi
et al. (2007) had the values that ranged from 0.73 to 4.12 ppm in C. gariepinus from Ogun state
Nigeria. Obasohan et al. (2006) also had the values that ranged from 0.10 to 0.83 ppm in some fishes
from Ogba River. Oronsaye et al. (2010) obtained values of 2.67 to 3.53 ppm in Mormyrops delicisus
and Mormyrus macrophthalmus from Ikpoba river dam. However, the data from this research work
were lower than the standard permissible limit for lead (< 0.5 ppm) in fish food (FEPA, 2003).
Table 2: Pb, Cu and Zn content of Clarias Gariepinus
River Pb(ppm) Cu(ppm) Zn(ppm)
Akpoha
Uwana
Oziza
Poly Uwana aquaculture water
Ngwo aquaculture water
0.022ab
± 0.026
0.000b ± 0.001
0.043ab
± 0.057
0.047a ± 0.063
0.014ab
± 0.041
0.048a ± 0.071
0.020a ± 0.027
0.028a ± 0.026
0.029a ± 0.023
0.038a ± 0.021
0.467a ± 0.356
0.366a ± 0.178
0.486a ± 0.245
0.458a ± 0.323
0.492a ± 0.164
Note: Values presented are means from triplicate samples and standard deviation. Means with same superscript
in the same column are statistically similar (p > 0.05)
Cu concentration ranged from 0.020 ± 0.027 (Uwana river) to 0.048 ± 0.071 (Akpoha river). There
was no significant difference between the river sources (p > 0.05). The values obtained in this
research work were similar to the findings of Olaifa et al. (2004) who obtained a Cu concentration of
0.0125 (ppm) and 0.0072 (ppm) in the gills during the rainy and dry seasons respectively, 0.16 ppm in
the intestine for both seasons as well as 0.05 and 0.07 (ppm) in the muscle for rainy and dry seasons,
respectively. The values obtained in this research work were lower than the standard permissible limit
of < 2ppm (FEPA, 2003).
Zn concentration ranged 0.366 ± 0.178 (Uwana river) to 0.492 ± 0.161 (Ngwo fish pond). There
was no significant difference between the river sources (p > 0.05). The values obtained in this report
were lower than that reported by Olaifa et al. (2004), who obtained a range between 0.1104 and 2.25
ppm. The values obtained were less than the WHO (1994) standard permissible limit of 3 ppm.
The trend for Pb concentration was Uwana<NgwoAkpoha<Oziza<Poly. There was no
significant difference between the river sources (p > 0.05). The trend for Cu concentration was
<Uwana<OzizaPoly<Ngwo<Akpoha. The trend for Zn concentration was
Uwana<Poly<AkpohaOziza<Ngwo. Generally fish samples from Uwana recorded the least
accumulation of these three metals while fish samples from Akpoha river recorded the highest
accumulation. This could be attributed to the fact that Akpoha river is the closest river to the major
quarrying site (Julius Berger) in Afikpo while Uwana river is the farthest river from this major
quarrying site.
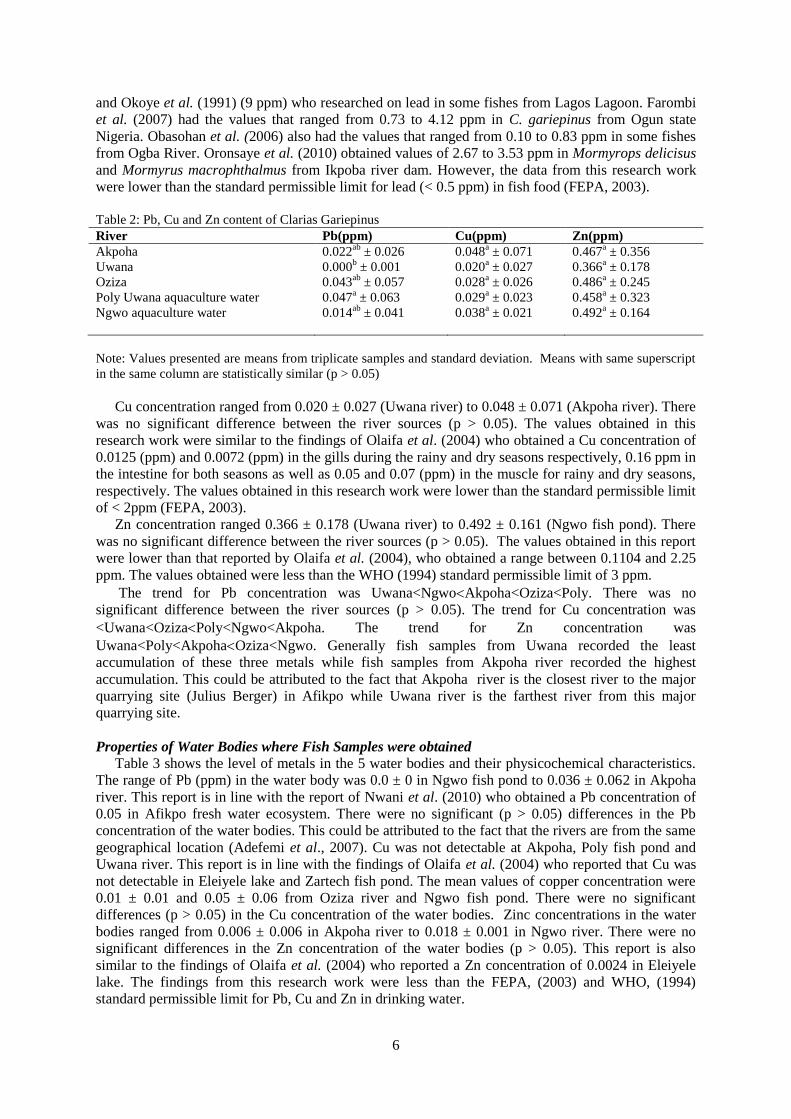
Properties of Water Bodies where Fish Samples were obtained
Table 3 shows the level of metals in the 5 water bodies and their physicochemical characteristics.
The range of Pb (ppm) in the water body was 0.0 ± 0 in Ngwo fish pond to 0.036 ± 0.062 in Akpoha
river. This report is in line with the report of Nwani et al. (2010) who obtained a Pb concentration of
0.05 in Afikpo fresh water ecosystem. There were no significant (p > 0.05) differences in the Pb
concentration of the water bodies. This could be attributed to the fact that the rivers are from the same
geographical location (Adefemi et al., 2007). Cu was not detectable at Akpoha, Poly fish pond and
Uwana river. This report is in line with the findings of Olaifa et al. (2004) who reported that Cu was
not detectable in Eleiyele lake and Zartech fish pond. The mean values of copper concentration were
0.01 ± 0.01 and 0.05 ± 0.06 from Oziza river and Ngwo fish pond. There were no significant
differences (p > 0.05) in the Cu concentration of the water bodies. Zinc concentrations in the water
bodies ranged from 0.006 ± 0.006 in Akpoha river to 0.018 ± 0.001 in Ngwo river. There were no
significant differences in the Zn concentration of the water bodies (p > 0.05). This report is also
similar to the findings of Olaifa et al. (2004) who reported a Zn concentration of 0.0024 in Eleiyele
lake. The findings from this research work were less than the FEPA, (2003) and WHO, (1994)
standard permissible limit for Pb, Cu and Zn in drinking water.
7
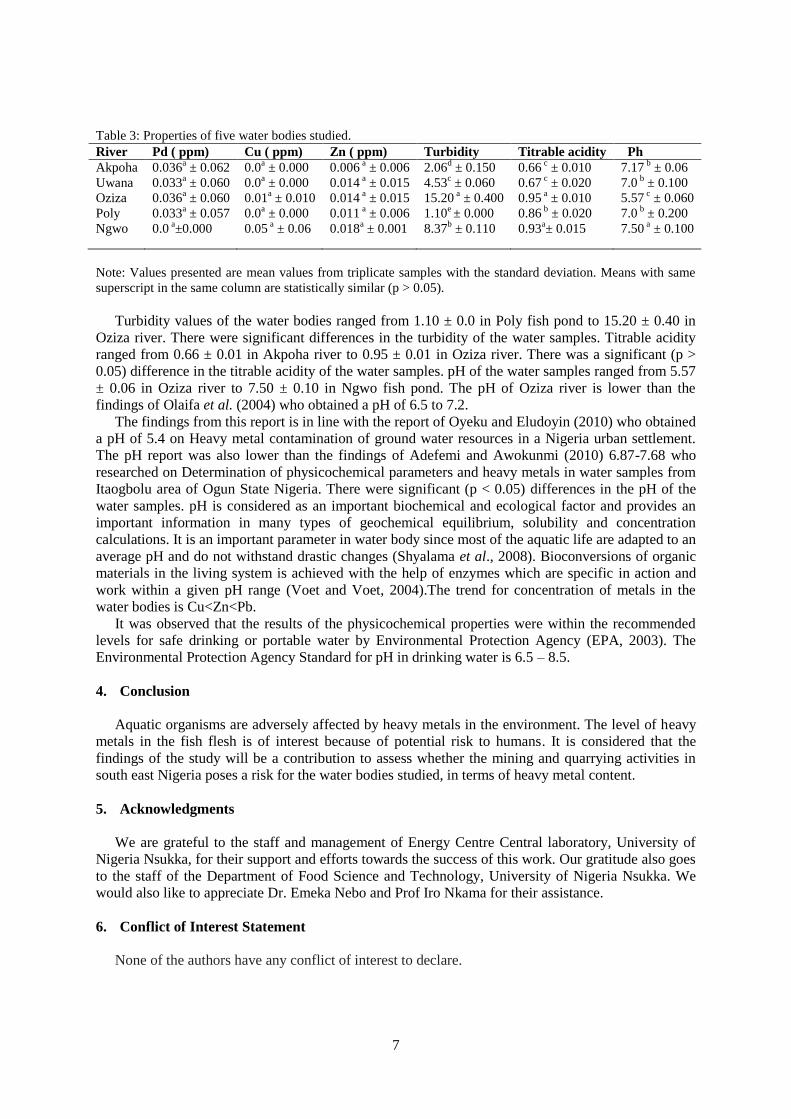
Table 3: Properties of five water bodies studied.
River Pd ( ppm) Cu ( ppm) Zn ( ppm) Turbidity Titrable acidity Ph
Akpoha
Uwana
Oziza
Poly
Ngwo
0.036a ± 0.062
0.033a ± 0.060
0.036a ± 0.060
0.033a ± 0.057
0.0 a±0.000
0.0a ± 0.000
0.0a ± 0.000
0.01a ± 0.010
0.0a ± 0.000
0.05 a ± 0.06
0.006 a ± 0.006
0.014 a ± 0.015
0.014 a ± 0.015
0.011 a ± 0.006
0.018a ± 0.001
2.06d ± 0.150
4.53c ± 0.060
15.20 a ± 0.400
1.10e ± 0.000
8.37b ± 0.110
0.66 c ± 0.010
0.67 c ± 0.020
0.95 a ± 0.010
0.86 b ± 0.020
0.93a± 0.015
7.17 b ± 0.06
7.0 b ± 0.100
5.57 c ± 0.060
7.0 b ± 0.200
7.50 a ± 0.100
Note: Values presented are mean values from triplicate samples with the standard deviation. Means with same
superscript in the same column are statistically similar (p > 0.05).
Turbidity values of the water bodies ranged from 1.10 ± 0.0 in Poly fish pond to 15.20 ± 0.40 in
Oziza river. There were significant differences in the turbidity of the water samples. Titrable acidity
ranged from 0.66 ± 0.01 in Akpoha river to 0.95 ± 0.01 in Oziza river. There was a significant (p >
0.05) difference in the titrable acidity of the water samples. pH of the water samples ranged from 5.57
± 0.06 in Oziza river to 7.50 ± 0.10 in Ngwo fish pond. The pH of Oziza river is lower than the
findings of Olaifa et al. (2004) who obtained a pH of 6.5 to 7.2.
The findings from this report is in line with the report of Oyeku and Eludoyin (2010) who obtained
a pH of 5.4 on Heavy metal contamination of ground water resources in a Nigeria urban settlement.
The pH report was also lower than the findings of Adefemi and Awokunmi (2010) 6.87-7.68 who
researched on Determination of physicochemical parameters and heavy metals in water samples from
Itaogbolu area of Ogun State Nigeria. There were significant (p < 0.05) differences in the pH of the
water samples. pH is considered as an important biochemical and ecological factor and provides an
important information in many types of geochemical equilibrium, solubility and concentration
calculations. It is an important parameter in water body since most of the aquatic life are adapted to an
average pH and do not withstand drastic changes (Shyalama et al., 2008). Bioconversions of organic
materials in the living system is achieved with the help of enzymes which are specific in action and
work within a given pH range (Voet and Voet, 2004).The trend for concentration of metals in the
water bodies is Cu<Zn<Pb.
It was observed that the results of the physicochemical properties were within the recommended
levels for safe drinking or portable water by Environmental Protection Agency (EPA, 2003). The
Environmental Protection Agency Standard for pH in drinking water is 6.5 – 8.5.
4. Conclusion
Aquatic organisms are adversely affected by heavy metals in the environment. The level of heavy
metals in the fish flesh is of interest because of potential risk to humans. It is considered that the
findings of the study will be a contribution to assess whether the mining and quarrying activities in
south east Nigeria poses a risk for the water bodies studied, in terms of heavy metal content.
5. Acknowledgments
We are grateful to the staff and management of Energy Centre Central laboratory, University of
Nigeria Nsukka, for their support and efforts towards the success of this work. Our gratitude also goes
to the staff of the Department of Food Science and Technology, University of Nigeria Nsukka. We
would also like to appreciate Dr. Emeka Nebo and Prof Iro Nkama for their assistance.
6. Conflict of Interest Statement
None of the authors have any conflict of interest to declare.
8
References
Adebayo, O. T. and Fagbenro, O. A. (2004). Induced ovulation and spawning of pond raised African giant
catfish, Heterobranchus bidorsalis by exogenous hormones. Aquaculture 242:229–236.
Adefemi, S. O., Asaolu, S. S. and Oleofe, O. (2007) Assessment of the physicochemical status of water samples
from major Dams in Ekiti State, Nigeria. Pakistan Journal of Nutrition 6(6) 657-859.
Adefemi, S. O. and Awokunmi, E.E. (2010) Determination of Physico-chemical parameters from Itaogbulu area
of Ondo State Nigeria. African Journal of Environmental science and Technology 4(3) pp 145-148
Al-Ghanim, K. A. (2016). Effect of different storage temperatures on chemical composition and sensory
attributes of the flesh of Cyprinus carpio and Clarias gariepinus. Pakistan Journal of Zoology, 48:305-
310.
Al-Asheh, S. and Duvnjak, Z. (1997). Sorption of cadmium and other heavy metals by pine bark, Adv. Environ.
Res. 1:194.
AOAC, (2010). Official methods of Analysis. Association of Official analytical chemist (18th edition).
Gaithersburg, USA.
Ashraf, W. (2005). Accumulation of heavy metals in kidney and heart tissues of Epinephelus
microdon fish from the Arabian Gulf. Environ. Monit. Assess., 101: 311-316.
Babatunde, A. M., Waidi, O. A. and Adeolu, A. A. (2012). Bioaccumulation of Heavy metals in fish organs in
Downstream Ogun coastal water Nigeria. Transitional Journal of Science and Technology. Edition 2,
No 5
Barbieri, E., A., Passos, E., Aragao, K. A., Santos, D. B. and Garcia, C. A (2010). Assessment of trace metal
levels in catfish (Cathorops spixii) from Sal River Estuary, Aracaju, State of Sergipe, Northeastern
Brazil. Water Environ. Res., 82: 2301-2307.
Brochin, R., Leone, S., Phillips, D., Shepard, N., Zisa, D. and Angerio, A. (2008). The cellular effect of lead
poisoning and its clinical picture. GUJHS. 5(2):1–8.
Dhanapal, K., Reddy, A. D. and Reddy, G. V. S. (2011). Beneficial effects of fish oil and its applicationsin
human health International Journal of Medical Biotechnology, 17(12), 137-156.
Doherty, V. F., Ogunkuade, O. O. and Kanife, U. C. (2010). Biomarkers of Oxidative Stress and Heavy Metal
Levels as Indicators of Environmental Pollution in Some Selected Fishes in Lagos, Nigeria. American-
Eurasian Journal of Agriculture and Environmental Sciences, 7 (3):359-365.
ECDG, (2002). European Commission DG ENN. E3 project ENV. E.31 ETU/0058. Heavy metals in waste.
Final report .
El-Moselhy, K. M. (1999). Levels of some metals in fish, Tilapia species caught from certain Egyptian Lakes
and River Nile. Egyptian Journal of Aquatic Biology and Fisheries, 3 : 73-83.
Emmanuel, B. E., Oshionebo, C. and Aladetohun, N. F. (2011). Comparative analysis of the
proximatecomposition of Tarpon atlanticus and Clarias gariepinus from culture systems in South-
Western Nigeria. Afr . J. Food Agric. Nutr. Dev. 11(6):5344-5359..
Farombi, E. O., Adelowo, O. A. and Ajimoko, Y. R. (2007). Biomarkers of oxidative stress and heavy metals
levels as indicators of environmental pollution in African catfish (Clarias gariepinus) from Ogun
River. International Journal of Environmental Resource and Public Health, 4(2): 158-165.
FEPA, (2003): Guideline and Standards for Environmental Pollution and Control in Nigeria. Federal
Environmental Protection Agency, Nigeria.
Ferner, D. J. (2001). Toxicity, heavy metals. eMed J. 2(5):1.
Gerhardsson, L., Dahlin, L., Knebel, R. and Schütz, A. (2002). Blood lead concentration after a shotgun
accident. Environ Health Perspect. 110(1):115–117.
Hassan, M. (1996). Influence of pond fertilization with broiler dropping on the growth performance and meat
quality of major carps: Ph.D. Thesis, University of Agriculture, Faisalabad.
Holdren, C., Harte, J., Schneider, R. and Shirley, C. (1991). A guides to commonly encountered toxics”. In:
Harte J, Holdren C, Schneider R, Shirley C (eds.) Toxics A to Z – a guide to everyday pollution
hazards. University of California Press, Berkeley, pp. 244–247, 436–438.
Jaishankar, M., Mathew, B. B., Shah, M. S. and Gowda, K. R. S. (2014) Biosorption of Few Heavy Metal Ions
Using Agricultural Wastes. Journal of Environment Pollution and Human Health. ;2(1):1–6.
Jarup, L. 2003. Hazards of heavy metal contamination. British Medical Bulletin, 68, 167-182.
Khallaf, E. A., Salal, M. and Authman, M. (1998). Assessment of heavy metals pollution and their effect on
Oreochromis niloticus in aquatic drainage canals. Egyptian Journal of Sociology and Zoology., 26 :
39-74.
Khan, M.N. and Wahab, M.F. (2006). Characterization of chemically modified corncobs and its application in
the removal of metal ions from aqueous solution. J. Hazard Mater. B 141, pp 237–244
9
Lamber, M., Leven, B. A. and Green, R. M. (2000). New methods of cleaning up heavy metal in soils and
water; Environmental science and technology briefs for citizens; Manhattan, KS: Kansas State
University.
Legendre, M., Teugels, G. G., Canty, C. and Jalabert, B. (1992). A comparative study on morphology,
growth rate and reproduction of Clarias gariepinus (Burchell 1822), Heterobranchus longifilis
(Valenciennes, 1840), and their reciprocal hybrids (Pisces: Clariidae). J. Fish Biol. 40:59–79.
Mandakini, D. H. and Gaihiamngam, K. (2010). Importance of fish in our daily food. Central institute of
fisheries education. ICAR Mumbiai.
Markowitz, M. (2000). Lead Poisoning. Pediatr Rev. 21(10):327–335.
Martin, S. and Griswold, W. (2009). Human health effects of heavy metals. Environmental Science and
Technology Briefs for Citizens. 2009;(15):1–6.
Mason, C. F. (2002). Biology of fresh water pollution. 4th ed. Essex University England. Pg 387.
Morais, S., Costa, F. G. and Pereira, M. L. (2012). Heavy metals and human health. In: Oosthuizen J,
editor. Environmental health – emerging issues and practice. 227–246.
Mosby, C. V., Glanze, W. D. and Anderson, K. N. (1996). Mosby Medical Encyclopedia, The Signet: Revised
Edition.
Nagajyoti, P. C, Lee, K. D. and Sreekanth, T. V. M. (2010). Heavy metals, occurrence and toxicity for plants: a
review. Environ Chem Lett. 8(3):199–216.
Nasernejad, B., Zadeh, T. E., Pour, B. B., Bygi, M. E. and Zamani, A. (2005). Comparison for biosorption
modeling of heavy metals (Cr(III), Cu(II), Zn(II)) adsorption from wastewater by carrot residues,
Process Biochem. 40:1319–1322.
Ndome, C., Oriakpono, O., Asitok, A. And Affiong, E. (2010). Microbial content of fresh Chrysichthys
nigrodigitatus (Catfish) and Oreochromis niloticus (Tilapia) in Calabar beach. African Journal of
Applied Zoology Environmental Biology, 12: 82-86.
Nestel, P. J. N. (2000). Fish oil and cardiovascular disease: lipids and arterial function. Am. J .Clin. Nutr .71:28-
231
Nwani, C. D., Nwachi, D. A., Ogokwu, O. I., Ude, E. F. and Odoh, G. E. (2010): Heavy metals in fish species
from lotic freshwater ecosystem at Afikpo, Nigeria. Journal of Environmental Biology. 31(5)595-601.
Obaroh, I. O., Haruna, M. A. and Ojibo, A. (2015). Comparative Study On Proximate And Mineral Element
Composition Of Clarias Gariepinus From The Cultured And Wild Sources. European Journal of Basic
and Applied Sciences. 2(2):19-26.
Obasohan, E. E., Oronsaye, J. A. O. and Obano, E. E. (2006): Heavy Metal Concentrations in Malapterurus
electricus and Chrysichthys nigrodigitatus from Ogba River in Benin City, Nigeria. African Journal of
Biotechnology. 5(10), pp 974-982.
Okoye, B. C. O., Afolabi, O. A. and Ajao, E. A. (1991): Heavy Metals in the Lagos Lagoon Sediments.
International Journal of Environmntal Studies. Vol 37: 35-41.
Olagunju, A., Muhammad, A., Mada, S.B., Mohammed, A., Mohammed, H.A. and Mahmoud, K.T.(2012).
Nutrient Composition of Tilapia zilli, Hemisynodontis membranacea, Clupeaharengus and
Scomberscombrus consumed in Zaria. World Journal of Life Science and Medical Research, 2:16.
Olaifa, F. G., Olaifa, A. K. and Onwude, T. E. (2004): Lethal and Sublethal Effects of Copper to the African
Catfish (Clarias gariepinus). African Journal of Biomedical Research, Vol 7, pg 65-70.
Olaniyi, W. A. and Omitogun, O. G. (2014). Embryonic and larval developmental stages of African giant
catfish Heterobranchus bidorsalis(Geoffroy Saint Hilaire, 1809) (Teleostei, Clariidae). Springer
Plus 3: 677. doi: 10.1186/2193- 1801- 3- 677.
Olayemi, F. F., Adedayo, M. R., Bamishaiye, E. I. and Awagu E. F. (2011). Proximate composition of catfish
(Clarias gariepinus) smoked in Nigerian stored products research institute (NSPRI): Developed kiln.
International Journal of Fisheries and Aquaculture Vol. 3(5):96-98.
Omitogun, O. G., Ilori, O., Olaniyan, O., Amupitan, P., Oresanya, T. and Aladele, S. (2012). Cryopreservation
of the sperm of the African catfish for the thriving aquaculture industry in Nigeria. Pp: 305–
329. in: I. Katkov, ed. Current frontiers in cryopreservation, 2(16) Intech Publishers, Croatia.
ISBN 979-953-307-743-6.
Omolara, O.O., Omotayo, O.D. (2008). Preliminary Studies on the effect of processing methods on
thequality of three commonly consumed marine fishes in Nigeria. Biochemistry Journal, 21: 1-7
Onundi Y. B., Mamun A. A., Al Khatib M. F. and Ahmed Y. M. (2010). Adsorption of copper, nickel and lead
ions from synthetic semiconductor industrial wastewater by palm shell activated carbon. Int. J.
Environ. Sci. Tech. Autumn, ISSN: 1735-1472, 7 (4): 751-758,
Oronsaye, J. A. O., Wangboye, O. M and Oguzie, F.A. (2010). Trace metals in Some Benthic Fishes of the
Ikpoba River Dam, Benin city, Nigeria. African Journal of Biotechnology. 9(51), pp 8860-8864.
Oyeku, O. T. and Eludoyin, O. T. (2010). Heavy metal contamination of ground water resources in a Nigerian
urban settlement. African Journal of Environmental Science and Technology vol. 4(4), 201-214.
10
Papanikolaou, N. C., Hatzidaki, E. G., Belivanis, S., Tzanakakis, G. and Tsatsakis, A. M. (2005). Lead toxicity
update. A brief review. Med Sci Monitor. 11(10):RA329.
Parmar, M. and Thakur, L. S. (2013). Heavy Metal Cu, Ni And Zn: Toxicity, Health Hazards And Their
Removal Techniques By Low Cost Adsorbents: A Short Overview, 3(3):143-157.
Raut ,N., Charif, G., Al-Saadi, A., Al-Aisri, A. and Al-Ajmi, A. (2012). A Critical Review of Removal of Zinc
from Wastewater, Proceedings of the World Congress on Engineering Vol I WCE 2012, July 4 - 6,
2012, London, U.K.
Samir, M. S. and Ibrahim, M. S. (2008). Assessment of heavy metals pollution in water and sediments and their
effect on Oreocheromis Niloticus in the Northern Delta Lakes, Egypt. 8th International symposium on
Tilapia in Aquaculture, 475-489.
Santos, I. R., E. V. Silva-filho., C. E Schaefer., M. R. Alhuguergue – Filho and L. S. Campos. (2005). Heavy
metals contamination in coastal sediments and soils near the Brazilian Antartic station, king George
Island. Marine Pollution Bulletin. 50: 85-194.
Shakweer, L. M. and M. M. Abbas (1996). Effect of sex on the concentration levels of some trace metals in
Oreochromis niloticus of lake edku and sardinella aurita of the mediteranean waters, Egypt. Bulltin of
the Institute Oceanography and Fisheries 22: 121-141.
Shyamala, R., Shanthi, M. and Lalitha, P. (2008). Physiochemical analysis of borewell water samples of
Telugupalayan area in Coimbatore district, Tamilnadu, India, E-Journal of Chemistry, 5(4): 924-929.
Skelton, P. (1993). A Complete Guide to the Freshwater Fishes of Southern Africa. Halfway House: Southern
Book Publishers Ltd.124p.
Taylor, M. P., Winder, C. and Lanphear, B. P. (2012). Eliminating childhood lead toxicity in Australia: a call to
lower the intervention level. MJA. 197(9):493.
Teo, J., Goh, K., Ahuja, A., Ng, H. and Poon, W. (1997). Intracranial vascular calcifications, glioblastoma
multiforme, and lead poisoning. AJNR. 18:576–579.
Teugels, G. G. (1986). A systematic revision of the African specie of the genus Clarias (Pisces: Clariidae).
Annales musee Royal de l'Afrique Centrale, 247: 1- 199.
Ting-Chu, H. (2009). Experimental assessment of adsorption of Cu2+ and Ni2+ from aqueous solution by oyster
shell powder. Elsevier Journal of Hazardous Materials 171,pp 995–1000, Journal homepage.
www.elsevier.com/locate/jhazmat
Tsironi, T. and Taoukis, P. S. (2017). Effect of storage temperature and osmotic pre-treatment with alternative
solutes on the shelf-life of gilthead seabream (Sparus aurata) fillets. Aquaculture and Fisheries,
2(1):39-47. http://dx.doi. org/10.1016/j.aaf.2016.10.003.
Voet, D. and Voet, J. G. (2004). Biochemistry. 3rd Edition, John Wiley and Sons Inc., U.S.A.
Wasiu, A. O., Olukayode, A. M and Ofelia, G. O. (2017). Comparison of proximate composition and sensory
attributes of Clariid catfish species of Clarias gariepinus, Heterobranchus bidorsalis, and their hybrids
Food Science & Nutrition. 5(2): 285–291
World Health Organization (WHO) (2004). Guidelines for Drinking Water Quality. 3rd Ed., World Health
Organization, ISBN: 92-4-154638-7, p. 516.
11
Available online at www.asric.org
ASRIC Journal on Agricultural Sciences 1 (2020) 11-23
a Biological Sciences Department, College of Natural and Applied Sciences, Wesley University Ondo, Nigeria. b Nematology Laboratory, International Institute of Tropical Agriculture (IITA), Oyo Road, Ibadan, Nigeria.
c Crop Protection and Environmental Biology Department, Faculty of Agriculture, University of Ibadan,
Nigeria. d Agronomy Department, Faculty of Agriculture, University of Ibadan, Nigeria. [email protected]
Received 19 December 2019; revised 30 January 2020; accepted 30 January 2020
Abstract
The myriad of challenges facing Africa, were considered in this paper, which include the nagging triplet
problems of poverty, hunger and diseases. Africa is prominent in the world hunger map of Food and Agriculture
Organization. Therefore, this paper identified poorly tapped natural and human resources, uneconomically
viable policies and poor management as some of the banes of Africa’ setback. This work proffered proactive
solutions to freeing Africa from the triplet perennial problems of poverty, hunger and diseases, through
intervention in the area of sustainable organic agricultural food production geared towards wealth creation in an
integrated community based agriculture. Organic agriculture gives credence to good health, thus is a viable
instrument in freeing Africa from diseases. In this paper, the abundance of agrarian ecologies and resources
domiciled in Africa, were highlighted and put forth to be harnessed for moving the continent from the present
precarious predicament to an enviable status. Empirical information presented in this paper recommended
organic agriculture as the panacea to sustainable food production, improved health of the populace, conducive
environmental condition and for solving the problem of climate change. Organic agriculture will also facilitate
the establishment of bilateral trade agreements, thus boosting foreign earnings of African countries. This will
make other nations of the world to be heavily dependent on Africa for raw materials and export of high quality
organic food to feed the world. The multiplier effects of these coordinated activities will turn African countries
into development catalysts, food reservoirs and enhanced foreign exchange earners.
Keywords: Development, food security, organic agriculture, improved health, triplet problem
1. Introduction
The continent of Africa is the world's second largest and second most-populous continent, being
behind Asia in both categories. At about 30.3 million km2 (11.7 million square miles) including
adjacent islands, it covers 6% of Earth's total surface area and 20% of its land area. With about 1.2
billion people as of 2016, it accounts for about 16% of the world's human population (UNDESA,
2017). Food security is when all people, at all times, in a particular location, place or region have
physical and economic access to sufficient safe and nutritious food that meet their dietary needs and
food preferences for an active and healthy life. World Food Programme Hunger Map 2019 depicts the
prevalence of undernourishment in the population of each country in 2016-18. From Africa and Asia
1 Corresponding author. Phone: +2348034827190 ; 08157680435 Email addresses:
[email protected] (E. Oyekanmi), [email protected] (D. Coyne),
[email protected] (B. Fawole), [email protected] (G. Adeoyo)
12
to Latin America and the Near East, there are 821 million people - more than 1 in 9 of the world
population - who do not get enough to eat (WFP, 2019).
Agriculture provides food for the populace, it is fundamental to food security, industrial growth
and national development. Arthur Lewis said “if agriculture remains stagnant, industry cannot
grow”. In Africa there is problem of food security and underdevelopment. Also, in some African
countries there has being over dependence on the petroleum sector, and the authors thus postulate that
“The oil wells will not flow forever, however sustainable agriculture is for life”. There is a salient and
silent fact in Africa which this technical paper built on which is, “every country in Africa has ample
natural and human potentials for sustainable and gainful agriculture that could be harnessed for food
security”. There is a clarion global call for food security, human and environmental health
improvement and alleviation of poverty. This technical paper provides the panacea which is Organic
Agriculture Based Africa Transformation Project (OABATP). This is a synergy that brings together
basic and advanced technologies through the involvement of scientists and coordinated farmers
groups made up of youth and experienced farmers, while leveraging on available human and natural
resources in each African country and utilization of improved organic farming inputs and practices. It
involves basic and advanced experimentation to deliver technologies that will transform African
agriculture, by turning each country into catalyst in the agricultural reaction, geared toward making
each country to become food basket and reserve and working out strategies to become organic
produce exporter within few years.
The myriad of challenges facing Africa, were considered in this paper, which include the nagging
triplet problems of poverty, hunger and diseases. Africa is prominent in the world hunger map of
World Food Programme. Therefore, this paper identified poorly tapped natural and human resources,
uneconomically viable policies and poor management as some of the banes of Africa’ setback. This
technical paper gives credence to organic agriculture as a means of promoting good health and
reducing poverty to the minimum. Worldwide organic agriculture is associated with provision of
chemical residue free food and good nutrition for the populace, through utilization of organically
certified best practices in crop, livestock, fisheries and aquaculture production. The exportation of
agricultural commodities will serve as foreign exchange earning to each African country and
transformation of Africa. This will definitely improve the citizens’ living standard and livelihood.
2. Problem Statement and Technical Paper Rationale
Most African countries still remain food insecure nations, conspicuously shown in the hunger map
of World Food Programme. Before now, for decades the number of hungry people had been declining
– this is not true anymore. More than 820 million people do not have enough food to eat. At the same
time, no region is exempted from the epidemic of overweight and obesity. Ending hunger and all
forms of malnutrition by 2030 is an immense challenge (FAO, 2019). Many African nations are being
trailed by underdevelopment in the various sectors without steady development in agriculture despite
the fact that most African nations are an agrarian economy (Okuneye, 2002, FAO, 2015.) The World
Food Summit estimated that approximately 840 million people in developing countries subsist on
diets that are deficient in calories. Food insecurity exists when people are undernourished because of
the physical unavailability of food, their lack of social or economic access to adequate food, and/or
inadequate food utilization.
Food-insecure people are those individuals whose food intake falls below their minimum calorie
(energy) requirements, as well as those who exhibit physical symptoms caused by energy and nutrient
deficiencies resulting from an inadequate or unbalanced diet or from the body's inability to use food
effectively because of infection or disease. Food is defined as any substance eaten to provide
nutritional support for the body. However, contamination of food with agrochemicals is on the
increase and this leads to precipitation of chemical residues in food and such food cannot be referred
to as wholesome food, because rather than provide nutritional support to the body it leads to
discomfort, degeneration of vital body organs and overall pruning of the average life span expectancy.
Chemical residues in food are those chemicals and their metabolites which are present due to their use
in food production system.
Residues of agricultural or Most African nations still remain food insecure nations, conspicuously
shown in the hunger map of food and agriculture organization. Many African nations are being
13
trailed by underdevelopment in the various sectors without steady development in agriculture despite
the fact that most African nations are agrarian economy (Okuneye, 2002, FAO, 2015.) The World
Food Summit estimated that approximately 840 million people in developing countries subsist on
diets that are deficient in calories. Food insecurity exists when people are undernourished as a result
of the physical unavailability of food, their lack of social or economic access to adequate food, and/or
inadequate food utilization. Food-insecure people are those individuals whose food intake falls below
their minimum calorie (energy) requirements, as well as those who exhibit physical symptoms caused
by energy and nutrient deficiencies resulting from an inadequate or unbalanced diet or from the body's
inability to use food effectively because of infection or disease. Food is defined as any substance
eaten to provide nutritional support for the body. However, contamination of food with agrochemicals
is on the increase and this leads to precipitation of chemical residues in food and such food cannot be
referred to as food indeed because rather than provide nutritional support to the body it leads to
discomfort, degeneration of vital body organs and overall pruning of the average life span expectancy.
Chemical residues in food are those chemicals and their metabolites which are present due to their use
in food production system. Residues of chemicals used in agricultural production could create health
challenge if not properly regulated.
3. Studied Materials and Methodology
IFOAM Reports
The International Federation of Organic Agriculture Movements (IFOAM - Organics
International) is the worldwide umbrella organization for the organic agriculture movement, which
represents close to 800 affiliates in 117 countries. Information relevant to organic agriculture along
with its best practices world were studied and adapted for Africa development in this technical paper.
The declared mission is to, "Lead, unite and assist the organic movement in its full diversity." and
vision is the "worldwide adoption of ecologically, socially and economically sound systems, based on
the Principles of Organic Agriculture". Among its wide range of activities, the federation maintains an
organic farming standard, and an organic accreditation and certification service. The four Principles of
Organic Farming are: Organic farming should sustain and enhance the health of soil, plants, animals
and humans as one and indivisible. Organic farming should be based on the living ecological systems
and cycles, work with them, emulate them and help sustain them. Organic agriculture should build on
relationships that ensure fairness with regard to common environment and life processes. Organic
farming should be managed in a precautionary and responsible manner to protect the health and well
being of current and future generations and the environment.
WFP Hunger Map
The world hunger map produced by the World Food Programme (WFP) was studied and vital
information on it was inculcated into this paper. The WFP is the food-assistance branch of the United
Nations and the world's largest humanitarian organization addressing hunger and promoting food
security. According to the WFP, it provides food assistance to an average of 91.4 million people in 83
countries each year. From its headquarters in Rome and from more than 80 country offices around the
world, the WFP works to help people who cannot produce or obtain enough food for themselves and
their families.
It is a member of the United Nations Development Group and part of its executive committee. The
WFP was first established in 1961 after the 1960 Food and Agriculture Organization (FAO)
Conference. The WFP strives to eradicate hunger and malnutrition, with the ultimate goal in mind of
eliminating the need for food aid itself. The objectives that the WFP hopes to achieve are to: Save
lives and protect livelihoods in emergencies. Support food security and nutrition and (re)build
livelihoods in fragile settings and following emergencies. Reduce risk and enable people,
communities and countries to meet their own food and nutrition needs. Reduce under-nutrition and
break the inter-generational cycle of hunger. Achieve, Zero Hunger in 2030. The WFP food aid is also
directed to fight micronutrient deficiencies, reduce child mortality, improve maternal health, and
combat disease, including HIV and AIDS.
14
WHO Reports
Reports of the World Health Organization (WHO) relevant to sustainable agriculture and
development were looked into in the conceptualization of this paper. The WHO is a specialized
agency of the United Nations that is concerned with international public health. The WHO is a
member of the United Nations Development Group. Its predecessor, the Health Organization, was an
agency of the League of Nations. Since its establishment, it has played a leading role in the
eradication of smallpox. Its current priorities include communicable diseases, in particular HIV/AIDS,
Ebola, malaria and tuberculosis; the mitigation of the effects of non-communicable diseases such as
sexual and reproductive health, development, and aging; nutrition, food security and healthy eating;
occupational health; substance abuse; and driving the development of reporting, publications, and
networking. The WHO is responsible for the World Health Report, the worldwide World Health
Survey, and World Health Day. As of 2012, the WHO has defined its roles in public health as follows:
providing leadership on matters critical to health and engaging in partnerships where joint action is
needed. Shaping the research agenda and stimulating the generation, translation, and dissemination of
valuable knowledge. Setting norms, standards, promoting, and monitoring their implementation.
Articulating ethical and evidence-based policy options. Providing technical support, catalysing
change, and building sustainable institutional capacity; and monitoring the health situation and
assessing health trends. Civil Registration and Vital Statistics (CRVS) to provide monitoring of vital
events (birth, death, wedding, divorce).
The Organic Agriculture Based Africa Transformation Project (OABATP)
Going by the experiences gathered by two of the authors of this paper, while with farmers groups
at The Olusegun Obasanjo Centre for Organic Research and Development (OOCORD), an
international Non-Governmental Organization (NGO) in Ibadan, Nigeria, the conceptualization of this
project was conceived. The idea of Organic Agriculture Based Africa Transformation Project was
experimented and it proved to be viable. Farmers testified during farmers outreach centres meetings
and farmers field days that the idea worked when implemented at micro level with them. This is a
synergy that brings together basic and advanced technologies through the involvement of scientists
and coordinated farmers groups made up of youth and experienced farmers, while leveraging on
available human and natural resources in the community and utilization of improved organic farming
inputs and practices. In this approach scientists and farmers will regularly interact on how to solve
emerging problems on the farm using biological approaches. These approaches will be laudable and
promising. Practices such as: use of neem based biopesticides for pest management, Tithonia based
biofertilizer for soil fertility maintenance and incorporation of farm yard manure and turning
biological wastes to soil amendment agents among other methods are involved. These biological
practices used for soil and pest management apart from converting waste to wealth make the
environment a better place to live in.
Strategic Research and Development Projects Activities
1. Identification, registration and coordination of farmers groups in wards, local governments
and states of countries.
2. Selection of target crops, animals, fish and aquaculture produce.
3. Acquisition of project sites and drafting of memoranda of understanding.
4. Documentation of available organic pest and soil management procedures and technologies
available.
5. Formulation of such products and large scale production.
6. Preliminary farm certification procedure.
7. Sensitization and Mobilization of farmer groups.
8. Establishment of large scale farms in various communities.
9. Regular monitoring of activities and monthly review meetings.
10. Attending to any emerging research problems on the farms.
11. Commercialization of proven technologies.
12. Attending to harvest and post harvest matters.
13. Six months review and report to supervisory bodies.
14. Organic certification process.
15
15. Ware housing of produce in notable research organizations such as IITA for export purpose.
16. Exportation of first batch of produce.
17. Release and utilization of foreign earnings.
18. Update report to funding foundation.
19. Organizing the British-African summit on organic agriculture.
20. Impact of project assessment and writing of end of project report.
Strategic Business and Developmental Cooperation with United Kingdom
This will be achieved through Organic Agriculture Submit to be hosted in Africa, which will achieve
the followings:
1. At the summit solutions will be proffered to world food crises, especially in Africa. This
summit will help to mobilize the stakeholders in agriculture, health and governance in Africa
at all levels for national development.
2. It will also fostering international partnerships, thus promoting exchange programme and
research activities in organic agriculture, between Africa and British government and other
nations.
3. The British - African Organic Agriculture Summit will promote current and future
commercial activities and trade in all African based crops, livestock, and fisheries production.
4. The result of this meeting will be to fully realize the potential of this crucial crops for poverty
alleviation and wealth generation.
5. Exchange programmes in health sector of African economy.
6. Sustainable environmental protection strategies for the British - African governments.
7. Promotion of IITA research activities, African organic agriculture network and capacity
building roles of the Africa based organic agriculture institutions.
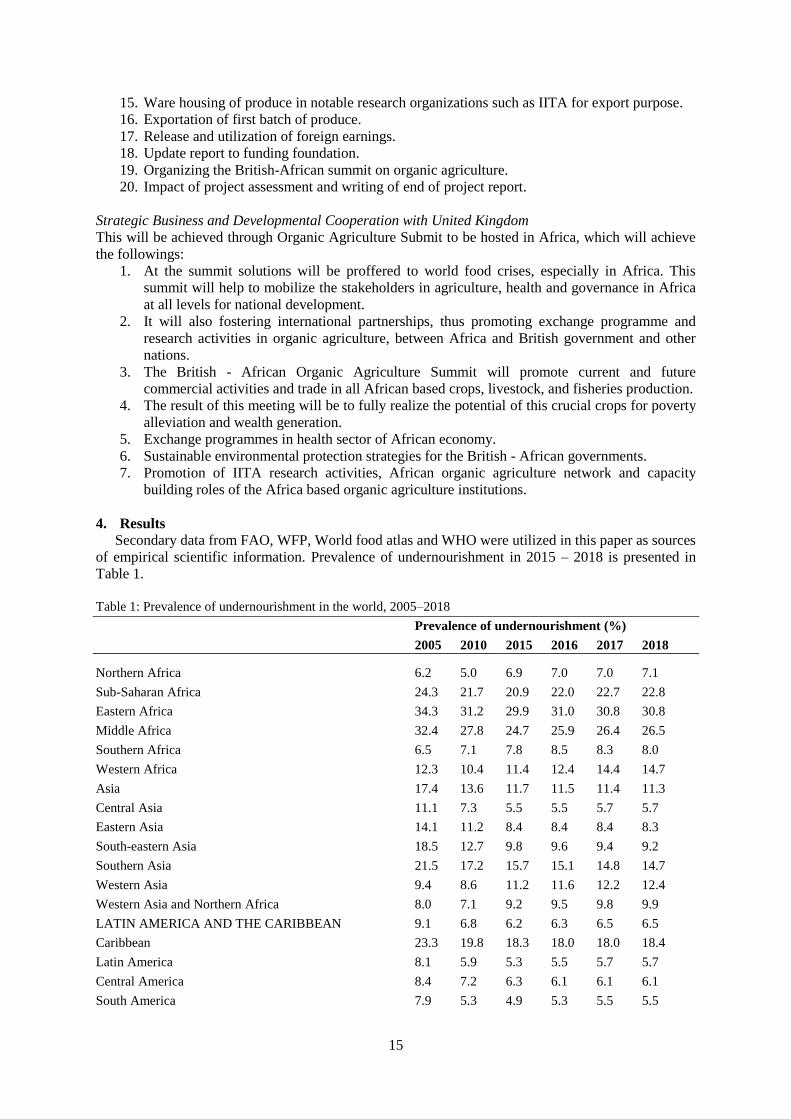
4. Results
Secondary data from FAO, WFP, World food atlas and WHO were utilized in this paper as sources
of empirical scientific information. Prevalence of undernourishment in 2015 – 2018 is presented in
Table 1.
Table 1: Prevalence of undernourishment in the world, 2005–2018
Prevalence of undernourishment (%)
2005 2010 2015 2016 2017 2018
Northern Africa 6.2 5.0 6.9 7.0 7.0 7.1
Sub-Saharan Africa 24.3 21.7 20.9 22.0 22.7 22.8
Eastern Africa 34.3 31.2 29.9 31.0 30.8 30.8
Middle Africa 32.4 27.8 24.7 25.9 26.4 26.5
Southern Africa 6.5 7.1 7.8 8.5 8.3 8.0
Western Africa 12.3 10.4 11.4 12.4 14.4 14.7
Asia 17.4 13.6 11.7 11.5 11.4 11.3
Central Asia 11.1 7.3 5.5 5.5 5.7 5.7
Eastern Asia 14.1 11.2 8.4 8.4 8.4 8.3
South-eastern Asia 18.5 12.7 9.8 9.6 9.4 9.2
Southern Asia 21.5 17.2 15.7 15.1 14.8 14.7
Western Asia 9.4 8.6 11.2 11.6 12.2 12.4
Western Asia and Northern Africa 8.0 7.1 9.2 9.5 9.8 9.9
LATIN AMERICA AND THE CARIBBEAN 9.1 6.8 6.2 6.3 6.5 6.5
Caribbean 23.3 19.8 18.3 18.0 18.0 18.4
Latin America 8.1 5.9 5.3 5.5 5.7 5.7
Central America 8.4 7.2 6.3 6.1 6.1 6.1
South America 7.9 5.3 4.9 5.3 5.5 5.5
16
OCEANIA 5.5 5.2 5.9 6.0 6.1 6.2
NORTHERN AMERICA AND EUROPE < 2.5 < 2.5 < 2.5 < 2.5 < 2.5 < 2.5
Source: FAO, 2017
Within the period of review world prevalence in undernourishment had reduced. In year 2015, the
lowest value of 10.6% was obtained and it increased slightly in 2016 and had been constant over a
period of 2017 - 2018. A similar trend was observed in Africa, however Eastern Africa had the
highest prevalence of 32.4%. In Northern America and Europe the value had remained <2.5%. Table
2 established the fact that there is hope for all African countries in Agriculture and mineral
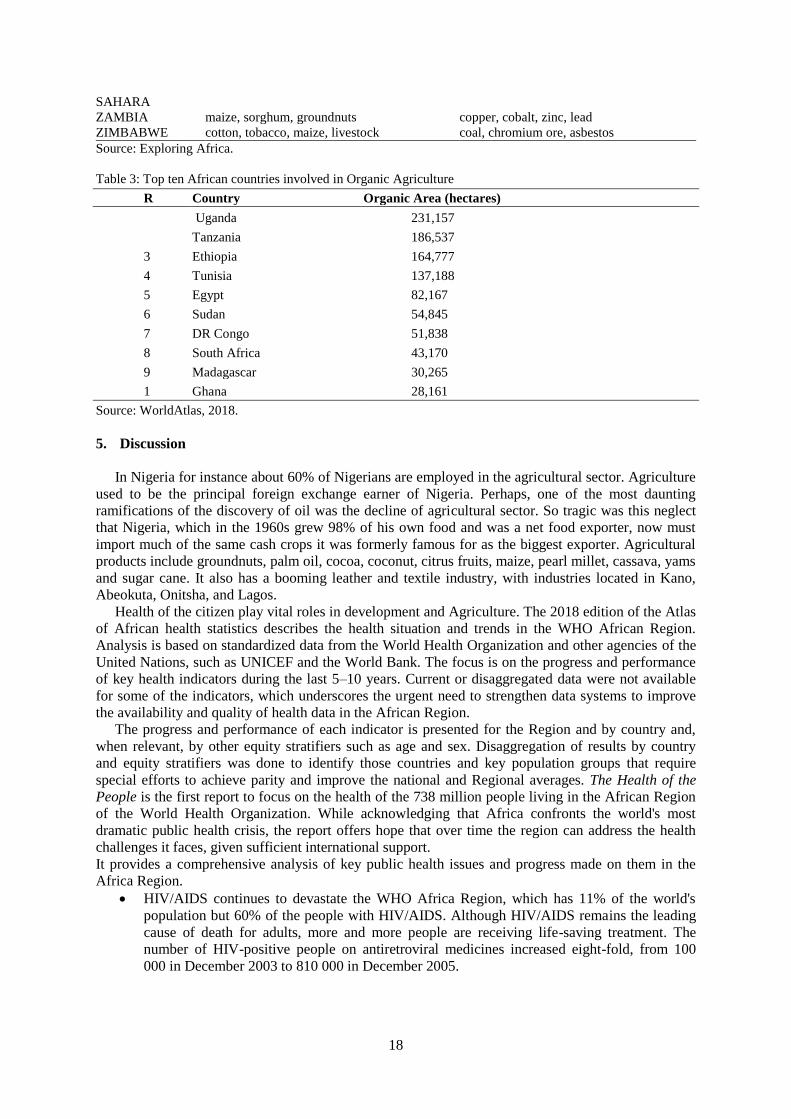
exploitation activities. The African countries that were already practicing organic agriculture are
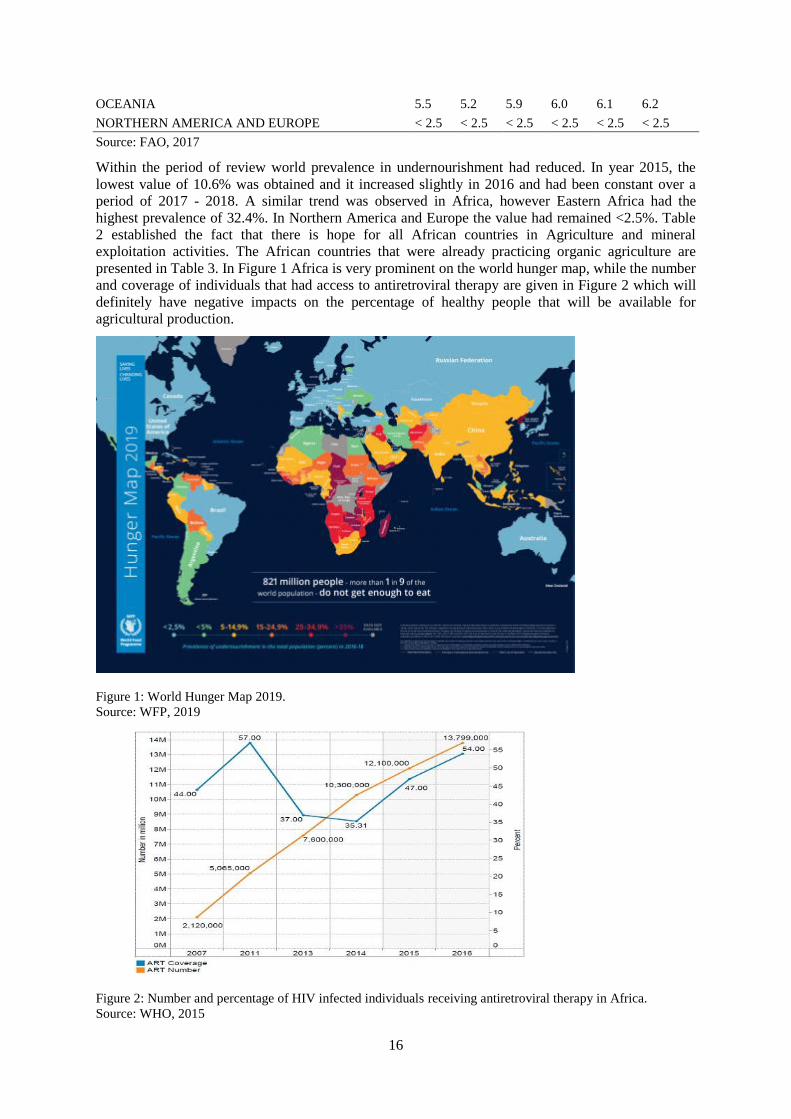
presented in Table 3. In Figure 1 Africa is very prominent on the world hunger map, while the number
and coverage of individuals that had access to antiretroviral therapy are given in Figure 2 which will
definitely have negative impacts on the percentage of healthy people that will be available for
agricultural production.
Figure 1: World Hunger Map 2019.
Source: WFP, 2019
Figure 2: Number and percentage of HIV infected individuals receiving antiretroviral therapy in Africa.
Source: WHO, 2015
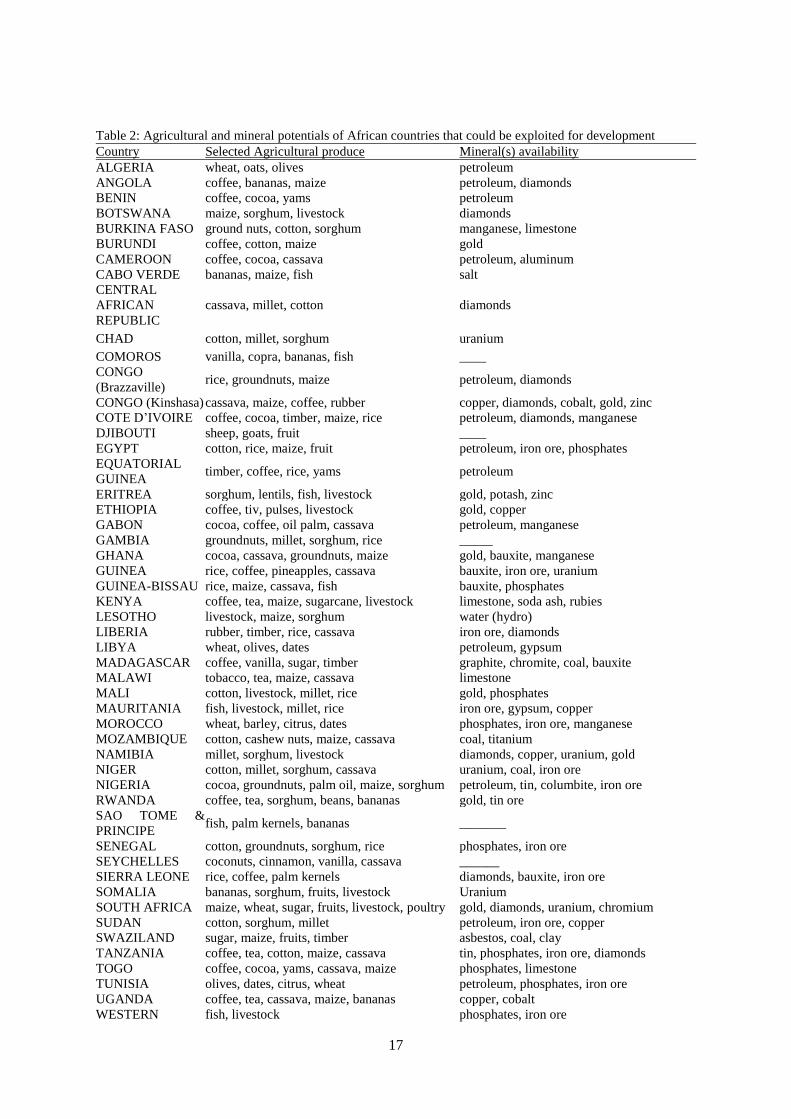
17
Table 2: Agricultural and mineral potentials of African countries that could be exploited for development
Country Selected Agricultural produce Mineral(s) availability
ALGERIA wheat, oats, olives petroleum
ANGOLA coffee, bananas, maize petroleum, diamonds
BENIN coffee, cocoa, yams petroleum
BOTSWANA maize, sorghum, livestock diamonds
BURKINA FASO ground nuts, cotton, sorghum manganese, limestone
BURUNDI coffee, cotton, maize gold
CAMEROON coffee, cocoa, cassava petroleum, aluminum
CABO VERDE bananas, maize, fish salt
CENTRAL
AFRICAN
REPUBLIC
cassava, millet, cotton diamonds
CHAD cotton, millet, sorghum uranium
COMOROS vanilla, copra, bananas, fish ____
CONGO
(Brazzaville) rice, groundnuts, maize petroleum, diamonds
CONGO (Kinshasa) cassava, maize, coffee, rubber copper, diamonds, cobalt, gold, zinc
COTE D’IVOIRE coffee, cocoa, timber, maize, rice petroleum, diamonds, manganese
DJIBOUTI sheep, goats, fruit ____
EGYPT cotton, rice, maize, fruit petroleum, iron ore, phosphates
EQUATORIAL
GUINEA timber, coffee, rice, yams petroleum
ERITREA sorghum, lentils, fish, livestock gold, potash, zinc
ETHIOPIA coffee, tiv, pulses, livestock gold, copper
GABON cocoa, coffee, oil palm, cassava petroleum, manganese
GAMBIA groundnuts, millet, sorghum, rice _____
GHANA cocoa, cassava, groundnuts, maize gold, bauxite, manganese
GUINEA rice, coffee, pineapples, cassava bauxite, iron ore, uranium
GUINEA-BISSAU rice, maize, cassava, fish bauxite, phosphates
KENYA coffee, tea, maize, sugarcane, livestock limestone, soda ash, rubies
LESOTHO livestock, maize, sorghum water (hydro)
LIBERIA rubber, timber, rice, cassava iron ore, diamonds
LIBYA wheat, olives, dates petroleum, gypsum
MADAGASCAR coffee, vanilla, sugar, timber graphite, chromite, coal, bauxite
MALAWI tobacco, tea, maize, cassava limestone
MALI cotton, livestock, millet, rice gold, phosphates
MAURITANIA fish, livestock, millet, rice iron ore, gypsum, copper
MOROCCO wheat, barley, citrus, dates phosphates, iron ore, manganese
MOZAMBIQUE cotton, cashew nuts, maize, cassava coal, titanium
NAMIBIA millet, sorghum, livestock diamonds, copper, uranium, gold
NIGER cotton, millet, sorghum, cassava uranium, coal, iron ore
NIGERIA cocoa, groundnuts, palm oil, maize, sorghum petroleum, tin, columbite, iron ore
RWANDA coffee, tea, sorghum, beans, bananas gold, tin ore
SAO TOME &
PRINCIPE fish, palm kernels, bananas _______
SENEGAL cotton, groundnuts, sorghum, rice phosphates, iron ore
SEYCHELLES coconuts, cinnamon, vanilla, cassava ______
SIERRA LEONE rice, coffee, palm kernels diamonds, bauxite, iron ore
SOMALIA bananas, sorghum, fruits, livestock Uranium
SOUTH AFRICA maize, wheat, sugar, fruits, livestock, poultry gold, diamonds, uranium, chromium
SUDAN cotton, sorghum, millet petroleum, iron ore, copper
SWAZILAND sugar, maize, fruits, timber asbestos, coal, clay
TANZANIA coffee, tea, cotton, maize, cassava tin, phosphates, iron ore, diamonds
TOGO coffee, cocoa, yams, cassava, maize phosphates, limestone
TUNISIA olives, dates, citrus, wheat petroleum, phosphates, iron ore
UGANDA coffee, tea, cassava, maize, bananas copper, cobalt
WESTERN fish, livestock phosphates, iron ore
18
SAHARA
ZAMBIA maize, sorghum, groundnuts copper, cobalt, zinc, lead
ZIMBABWE cotton, tobacco, maize, livestock coal, chromium ore, asbestos
Source: Exploring Africa.
Table 3: Top ten African countries involved in Organic Agriculture
R Country Organic Area (hectares)
Uganda 231,157
Tanzania 186,537
3 Ethiopia 164,777
4 Tunisia 137,188
5 Egypt 82,167
6 Sudan 54,845
7 DR Congo 51,838
8 South Africa 43,170
9 Madagascar 30,265
1 Ghana 28,161
Source: WorldAtlas, 2018.
5. Discussion
In Nigeria for instance about 60% of Nigerians are employed in the agricultural sector. Agriculture
used to be the principal foreign exchange earner of Nigeria. Perhaps, one of the most daunting
ramifications of the discovery of oil was the decline of agricultural sector. So tragic was this neglect
that Nigeria, which in the 1960s grew 98% of his own food and was a net food exporter, now must
import much of the same cash crops it was formerly famous for as the biggest exporter. Agricultural
products include groundnuts, palm oil, cocoa, coconut, citrus fruits, maize, pearl millet, cassava, yams
and sugar cane. It also has a booming leather and textile industry, with industries located in Kano,
Abeokuta, Onitsha, and Lagos.
Health of the citizen play vital roles in development and Agriculture. The 2018 edition of the Atlas
of African health statistics describes the health situation and trends in the WHO African Region.
Analysis is based on standardized data from the World Health Organization and other agencies of the
United Nations, such as UNICEF and the World Bank. The focus is on the progress and performance
of key health indicators during the last 5–10 years. Current or disaggregated data were not available
for some of the indicators, which underscores the urgent need to strengthen data systems to improve
the availability and quality of health data in the African Region.
The progress and performance of each indicator is presented for the Region and by country and,
when relevant, by other equity stratifiers such as age and sex. Disaggregation of results by country
and equity stratifiers was done to identify those countries and key population groups that require
special efforts to achieve parity and improve the national and Regional averages. The Health of the
People is the first report to focus on the health of the 738 million people living in the African Region
of the World Health Organization. While acknowledging that Africa confronts the world's most
dramatic public health crisis, the report offers hope that over time the region can address the health
challenges it faces, given sufficient international support.
It provides a comprehensive analysis of key public health issues and progress made on them in the
Africa Region.
HIV/AIDS continues to devastate the WHO Africa Region, which has 11% of the world's
population but 60% of the people with HIV/AIDS. Although HIV/AIDS remains the leading
cause of death for adults, more and more people are receiving life-saving treatment. The
number of HIV-positive people on antiretroviral medicines increased eight-fold, from 100
000 in December 2003 to 810 000 in December 2005.
19
More than 90% of the estimated 300–500 million malaria cases that occur worldwide every
year are in Africans, mainly in children under five years of age, but most countries are
moving towards better treatment policies.
River blindness has been eliminated as a public health problem, and guinea worm control
efforts have resulted in a 97% reduction in cases since 1986. Leprosy is close to
elimination—meaning there is less than one case per 10 000 people in the Region.
Most countries are making good progress on preventable childhood illness. Polio is close to
eradication, and 37 countries are reaching 60% or more of their children with measles
immunization. Overall measles deaths have declined by more than 50% since 1999. In 2005
alone 75 million children received measles vaccines.
While drawing the world's attention to recent successes, the report offers a candid appraisal of
major hurdles, such as the high rate of maternal and newborn mortality overall in the Region. Of the
20 countries with the highest maternal mortality ratios worldwide, 19 are in Africa; and the Region
has the highest neonatal death rate in the world. Then there is the strain on African health systems
imposed by the high burden of life-threatening communicable diseases coupled with increasing rates
of non-communicable diseases such as hypertension and coronary heart disease. Basic sanitation
needs remain unmet for many: only 58% of people living in sub-Saharan Africa have access to safe
water supplies. Non-communicable diseases, such as hypertension, heart disease, diabetes and are on
the rise; and injuries remain among the top causes of death in the Region.
The report stresses that Africa can move forward on recent progress only by strengthening its
fragile health systems.
The World Bank projects that agriculture and agribusiness in Africa will grow to be a US$1 trillion
industry in Africa by 2030. To promote this outcome, the continent must review its incentive
structures.
Agriculture averages 24% of GDP across the continent. With post-harvest activities taken into
account, agriculture-related industry accounts for nearly half of all economic activity in sub-Saharan
Africa.
The region holds about half of the world’s fertile and as-yet-unused land – and yet it spends US$25
billion annually importing food. It also uses only a tiny percentage of its renewable water resources.
Impact of Small and Medium Scale Agribusiness Enterprises
The potential growth of Africa’s food and beverage markets will only be possible with adequate
investment in small and medium-sized agribusiness enterprises. Small African firms engaged in
agribusiness greatly outnumber the large players. Former Malawian president Bingu Wa Mutharika
observed: “In West Africa, 75% of agriculture-related firms are micro or small enterprises, 20% are
semi-industrial, and 5% are industrial.”
Value chains in many African countries feature an informal chain that serves lower-income
consumers and a formal chain that caters for high-income domestic consumers or exports. In many
sectors the vast majority of the volume moves through the smaller, less formal businesses. More than
95% of the fruit and vegetables produced in Kenya move through smallholders and small and medium
enterprises (SMEs). Policymakers need to support agribusiness and technology incubators, export-
processing zones and production networks. They must also sharpen the skills associated with these
sectors.
Banks and financial institutions also play key roles in fostering technological innovation and
supporting investment in homegrown businesses. Unfortunately, their record in promoting
technological innovation in Africa has been poor.
Capital markets have played a critical role in creating SMEs in developed countries. They bring
money to the table and also help groom small and medium-sized start-ups into successful enterprises.
Venture capital in Africa, however, barely exists outside South Africa.
African countries also need to make a concerted effort to leverage expertise in the diaspora. This
cohort provides links to existing know-how, establish links to global markets and train local workers
to perform new tasks.
20
Much is already known about how to support business development. The available policy tools
include:
direct financing via matching grants;
taxation policies;
government or public procurement policies;
advance purchase arrangements; and
prizes to recognise creativity and innovation.
These can be complemented by simple ways to promote rural innovation that involve low levels of
funding, higher local commitments and consistent government policy. For example, China’s mission-
oriented “Spark Program”, created to popularize modern technology in rural areas, had spread to more
than 90% of the country’s counties by 2005.
Lessons from China’s Economic Transformation Agenda
There is growing evidence that the Chinese economic miracle is a consequence of the rural
entrepreneurship which started in the 1980s. This contradicts classical interpretations that focus on
state-led enterprises and receptiveness to foreign direct investment.
Millions of township and village enterprises were created in provinces like Zhejiang, Anhui and
Hunan. This played a key role in stimulating rural industrialization. Over the past 60 years, China has
experimented extensively with policies and programmes to encourage the growth of rural enterprises.
These include providing isolated agricultural areas with key producer inputs and access to post-
harvest, value-added food processing.
By 1995, China’s village enterprises had helped bring about a revolution in the country’s
agriculture. They had evolved to account for approximately 25% of GDP, 66% of all rural economic
output and more than 33% of total export earnings. Most of them have become private enterprises that
focus on areas outside agricultural inputs or food processing.
China’s initial rural enterprise strategy focused on the so-called five small industries it deemed
crucial to agricultural growth:
chemical fertilizer;
cement;
energy;
iron and steel; andfarm machinery.
With strong backward linkages between these rural enterprises and Chinese farmers, agricultural
development in China grew substantially in the late 1970s and 1980s. This happened through
farmland capital construction, chemical fertilization and mechanization. This expansion, coupled with
high population growth, led to a surplus of labour and a scarcity of farmland. As a result, China’s
rural enterprises increasingly shifted from supplying agricultural producer inputs to labour-intensive
consumer goods for domestic and international markets.
From the mid-1980s to the 1990s, China’s township and village enterprises saw explosive growth
in these areas. At the same time they continued to supply agricultural producers with access to key
inputs, new technologies and food-processing services. The most successful were those with strong
links to: urban and peri-urban industries with which they could form joint ventures and share technical
information; those in private ownership; and those who were willing to shift from supplying producer
inputs for farmers to manufacturing consumer goods.
China’s experience provides a mechanism for enhancing rural access to agricultural inputs such as
fertilizers and mechanization, as well as post-harvest food processing. Rural enterprises may make the
most sense in areas where farm-to-market roads cannot be easily established. Along with sparking
agricultural productivity, rural enterprises may also help provide employment for farm labourers who
have been displaced by agricultural mechanization. By keeping workers and economic activity in
rural areas, China has helped expand rural markets and limit rural-urban migration. This has also
helped create conditions under which it is easier for the government to provide key social services
such as health care and education. Township and village enterprises enjoyed government support, but
retained a degree of autonomy in their operations (WEF, 2016).
21
The Impact of Organic Agriculture on World’s Economy
We know that organic products often cost more than their conventional counterparts at grocery
stores and local farmers’ markets, but does that mean that organic agriculture is more costly than
conventional overall? The answers that experts have found, though multifaceted and complex, are
surprisingly consistent. For the most part, organic agriculture appears to be a more efficient economic
system, both for generating profit and reducing the sort of environmental impacts (often thought of as
“hidden costs”) that end up costing consumers in other ways.
One of the most persistent myths such studies consistently debunk is that organic systems are
incapable of reaching the same yields as conventional systems. After a transitional period of 3 to 5
years, organic systems can produce up to 95 per cent of conventional yields. Additionally, organic
farming is less dependent on fossil fuels, expensive inputs, and annual loans, making it less vulnerable
to financial market fluctuations (West, 2017).
Organic is a low-waste system that emphasizes quality over quantity, meaning it uses less land for
the same profit. Conventional crop subsidies exacerbate the problem, incentivizing farmers to grow
more than they can sell, which causes excess pollution, overuse of resources, and food waste.
In classic economics, capital is defined as money, machinery, tools, or other physical assets that
help increase an entity’s wealth. In the case of an investor, that would just be money used to buy
stocks or bonds to grow the initial investment over time. In the case of a farmer, capital means
tractors, greenhouses, or hand tools – things that can be used again and again to facilitate profit and
growth.
There’s a new branch of economics that would like to recognize the ways we benefit from natural
systems as a form of capital, which they’ve dubbed natural capital. Natural capital includes a mind-
boggling array of ecosystem services and resources provided by the natural world, some of which we
have yet to discover. Think: trees making oxygen and capturing pollutants from the air, wetlands
filtering water, insects pollinating plants, and the incredible biodiversity of a place like the Amazon
rainforest generating new medicines. Mother Nature does a lot for us, and the natural capital
movement would like to quantify those values in order to more easily incorporate them into the
traditional economic schemes that do not account for them.
As we have discussed, organic farming can stand its ground under traditional economic
evaluations, but when you also start to incorporate natural capital values, organic becomes the clear
winner for long-term profitability. Let us consider a few examples of how organic utilizes and
increases various natural capital functions:
Adding organic matter to the soil each year (a foundational organic practice) increases the soil’s
ability to store carbon dioxide. While conventional farming has long been the recipient of federal
crop subsidies, there is a new trend toward paying farmers for carbon sequestration, effectively
acknowledging the economic benefit of high-organic-matter soils.
Organic matter in the soil also increases the soil’s water holding capacity, reducing pressure on
water resources and making organic farms more resilient to drought. Since water costs money
(and increasingly so), drought tolerant farming systems mean cheaper food production over time.
Biodiversity on organic farms offers myriad financial benefits. A diverse crop system means a
succession of blooms that can feed insect populations (and provide them with habitat) year-round.
These beneficial insects help to keep down populations of harmful insects, reducing or
eliminating the need for pesticides, and providing pollination services to increase harvest yields.
Genetic diversity on organic vegetable and seed farms acts as a well-endowed gene bank for
potential new varieties that will be resilient against future environmental changes, insect
populations, and diseases – a service that is essential to global food security, not to mention tasty
food!
And that’s just the beginning of the list. Natural capital is a relatively new field of study, and
economists and scientists are just beginning to unpack the ways we can attribute values to it within
agricultural systems. As we learn more about the economics of natural capital and organic agriculture,
we will convince more farmers to make the switch, increasing the world’s profits of biodiversity,
nutritious food, and healthy ecosystems, farm by farm (West, 2017).
22
The Panacea
Some non-profit organizations and foundations are experimenting with promoting rural
entrepreneurship by donating cows or other livestock to rural communities. Organizations like Heifer
International provide cows, along with training about how to raise them and profit from animal
husbandry but the impact of these programmes is relatively limited. In Malawi, for instance, Heifer
International is implementing a programme alongside USAID that is designed to stimulate a dairy
industry. But it serves only 180 smallholder farmers (USAID, 2019).
Reinventing agricultural policies guided by widespread and inefficient interventionism, sustainable
change in the agricultural sector to meet the region’s challenges requires massive government
investment in the sector and in food security – that is if Africa really has the ambition and the will to
end hunger and dependence and feed its population with dignity. The role and method of intervention
by states and regional could be worked out. What role must governments play? The public sector must
drive the political ambition and develop policies structured around three main intervention areas:–
The production of public goods, mainly by investment in trans-port and communication, energy and
market infrastructure; the deployment of efficient services (support and advice, for example),
investment in research, and knowledge management, etc.– The use of economic policy instruments
with the capacity to guide strategies for economic producers and stakeholders. This mainly involves
credit policies and risk management. The agricultural programme is centred specifically around three
components: i) economic policies, institutions and leadership; ii) knowledge and experience sharing,
and iii) financing, these key issues must be looked into. Africa spent US$35bn on food imports
(excluding fish) in 2011, only 5% of it related to trading within the continent. An increase in
productivity, matched with the right set of policies and investment, could revert this situation. Africa
could replace these imports with their own produce, which would in turn reduce poverty, enhance
food and nutrition security, and provide sustainable growth to the respective societies.
A broader economic transformation is necessary to shift the current paradigm facing agriculture in
Africa. In most of the cases, urbanization and economic growth have resulted in new opportunities for
local agricultural producers. However, in Africa, this share of the market mainly belongs to foreign
companies. Imports of food staples have been rising sharply, and domestic agriculture has so far failed
to increase supply in response. Raising productivity in agriculture is vital to transformative growth,
not just because it has the potential to expand markets by displacing imports, but also because
agricultural growth is twice as effective in reducing poverty as growth in non-agricultural sectors.
6. Conclusion
The lesson from China’s experience is that development must be viewed as an expression of
human potentialities, not as a product of external interventions. Mobilization of all the stakeholders
involved in agriculture to ensure food security in Nigeria through grass root Integrated Community
Based Agriculture is essential. The project will give credence to organic produce thus making safe,
healthy and nutritious food available to all. The British-African summit will be a landmark
programme in the history of agriculture in Africa which will transform African agriculture.
Generations to come will benefit from it, our nations will be moved to a higher pedestal. This project
will transform African agriculture starting with the grass root stakeholders and the rural dwellers,
making them free of hunger and empowering every country in Africa to become agricultural produce
exporters. This technical paper proffers proactive solutions to freeing Africa from the triplet perennial
problems of poverty, hunger and diseases, through intervention in the area of sustainable organic
agricultural food production geared towards wealth creation in an integrated community based
agriculture. Organic agriculture gives credence to good health, thus is a viable instrument in freeing
Africa from diseases. In this paper, the abundance of agrarian ecologies and resources domiciled in
Africa, were highlighted and put forth to be harnessed for moving the continent from the present
precarious predicament to an enviable status. Empirical information presented in this paper
recommends organic agriculture as the panacea to sustainable food production, improved health of the
populace because it is sustainable. It will create conducive environmental condition for solving the
problem of climate change. Organic agriculture will also facilitate the establishment of bilateral trade
agreements, thus boosting foreign earnings of African countries. This will make other nations of the
world to be heavily dependent on Africa for raw materials and export of high quality organic food to
23
feed the world. The multiplier effects of these coordinated activities will turn African countries into
development catalysts, food reservoirs and enhanced foreign exchange earners.
References
FAO, 2015. The state of food and agriculture. Social protection and agriculture: breaking the cycle of rural
poverty. http://www.fao.org/state-of-food-agriculture/en/ accessed 01 September, 2019.
FAO, 2019. The state of food and agriculture: food loss and waste is a global issue. http://www.fao.org/state-of-
food-agriculture/en/ accessed 02 September, 2019.
Fassuliotis, G., 1985. The role of the nematologist in the development of resistant cultivars. In: an advanced
treatise on Meloidogyne volume 1: Biology and Control. (Ed.) Sasser, J.N. and Carter, C.C. Printed by
North Carolina State University Graphics pp. 233 – 240.
Holderness, M., Sharrock, S. Frison, E. and M. Kairo, 2000. Organic banana 2000. Towards an organic banana
initiative in the Caribbean. Report of the International workshop on the production and marketing of
organic bananas by smallholders farmers. International Network for the Improvement of banana and
Plantain, Montpellier France173p.
Kerry, B. R., 1987. Biological control. In: Principles and practise of nematode control. R.A. Brown (Ed.)
Academic Press, New York, pp. 233 – 263.
Khan, M.R., Kounsar, K. and A. Hamid, 2002. Effect of certain rhizobacteria and antagonistic fungi on root-
nodulation and root-knot nematode disease of green gram. Nematology Mediterranean 30: 85-89.
Okuneye, B. 2002. Rising cost of food prices and food insecurity in Nigeria and Its implication for poverty
reduction.CBN economic & financial review, vol. 39 no. 4
Oyekanmi, E.O., Coyne, D.L. and B. Fawole, 2008. Utilization of nematodes biocontrol and biofertilizer
potentials in selected microorganisms for improved crop production. Journal of Biological Sciences (8)
4: 746 -752.
Oyekanmi, E.O., Coyne, D.L., Fagade, O.E., and O. Osonubi, 2007. Improving root-knot nematode
management of two soybean genotypes through the application of Bradyrhizobium japonicum,
Trichoderma pseudokoningii and Glomus mosseae in full factorial combinations. Crop Protection. 26:
(7) 1006 – 1012.
UNDESA, 2017. United Nations Department of Economic World Food Programme, 2019. www.wfp.org.
Accessed on 30th
August, 2019.
USAID, 2019. United States Agency for International Development. Agriculture and food security: feed the
future in Malawi. http://www.usaid.gov.malawi/feed-the-future 2012- 2017. Accessed on 30th
August,
2019.
WEF, 2016. World Economic Forum. What lessons can we learn from China’s rapid growth?
http://www.weforum.org/agenda/2016/03. Accessed on 2nd September, 2019.
24
Available online at www.asric.org
ASRIC Journal on Agricultural Sciences 1 (2020) 24-34
a Lupane State University, Lupane, Zimbabwe
b University of Zimbabwe, Harare, Zimbabwe
Received 19 December 2019; revised 30 January 2020; accepted 30 January 2020
Abstract
Crop monitoring and yield forecasting is a crucial step in addressing food security challenges. This is
particularly important for cereals such as maize and wheat which are grown at large scale and constitute the
main staple diet for many regions. While, consumption of bread and other wheat products has been on the
increase, the national wheat production has been on the decline. Therefore, wheat yield forecasting is vital for
providing advance planning on imports to meet the production deficit. This study sought to develop a winter
wheat yield forecast model. Observed winter wheat yield data was collected from ARDA farm records for 3
years 2016-2018. Sentinel 2 imagery data was used to extract NDVI values coinciding with the centre-pivots
where winter wheat was growing. Maximum NDVI data at anthesis growth stage and observed wheat yield data
were regressed to develop a predictive equation. The two datasets were correlated (R2 = 0.8, p < 0.001). The
developed algorithm was used to predict yields and validated using observed yield data. The root mean squared
error was 0.53 tons ha-1
when averaged observed yield was 6.8 tons ha-1
. Therefore, the algorithm successfully
reproduced observed yields indicating that SENTENEL data could be confidently used in winter wheat yield
forecasting at field level. Lack of historical observed yield data and satellite imagery from SENTINEL 2
hindered adequate analysis for longer time frames. The model needs to be further tested as more SENTENEL
data accumulates.
Keywords: NDVI, Remote sensing, SENTINEL 2, Wheat yield, forecasting model.
1. Introduction
Agriculture plays an important role in the supply of cereals. The potential for expansion of
agricultural land, however, is limited. Increased production of biofuels, land degradation, volatile
grain markets, limited arable land and water resources, and extreme weather events, such as, severe
droughts and floods present global agricultural production challenges (FAO, 2017). Accordingly,
increasing agricultural production efficiency is an essential way of satisfying the future food demand.
As the human population is projected to reach 9 billion by 2050, cereal demand is expected to rise
(Vermeulen et al., 2010). The lack of access to food in the past has resulted in hunger, poverty, and
conflict. As such, food security remains at the forefront on the international agenda. Consequently,
crop production is increasingly demanding reliable, accurate and comprehensive agricultural
intelligence. Reliable crop yield forecasts play a significant role in regulating markets and anticipating
market imbalances, developing agricultural policies and mitigating food shortages efficiently.
Reliable forecasting of crop production prior to harvest is a topical problem for many governments
in the world particularly in Africa (Chahbi Bellakanji et al., 2018). The governments, agribusiness,
1 Corresponding author. Email addresses: [email protected], [email protected] (B. Chisadza);
[email protected] (P. Chiwara); [email protected] (S. Sibanda); [email protected] (O.
Gwate)
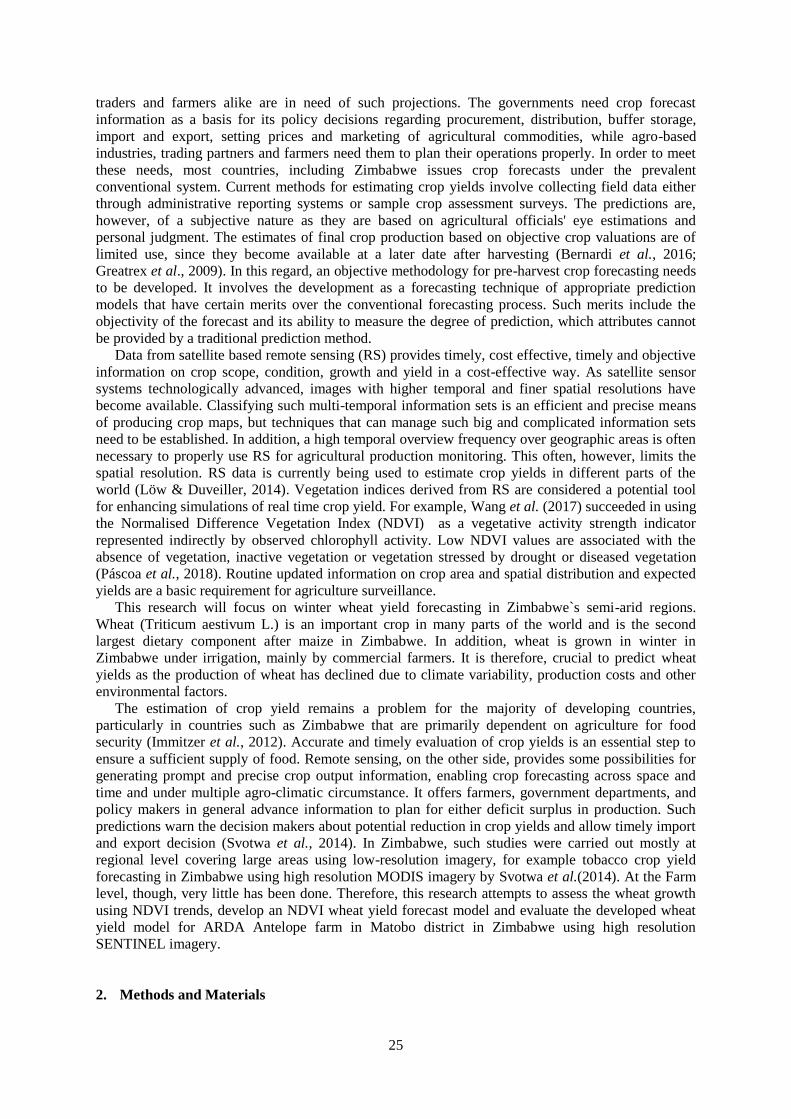
25
traders and farmers alike are in need of such projections. The governments need crop forecast
information as a basis for its policy decisions regarding procurement, distribution, buffer storage,
import and export, setting prices and marketing of agricultural commodities, while agro-based
industries, trading partners and farmers need them to plan their operations properly. In order to meet
these needs, most countries, including Zimbabwe issues crop forecasts under the prevalent
conventional system. Current methods for estimating crop yields involve collecting field data either
through administrative reporting systems or sample crop assessment surveys. The predictions are,
however, of a subjective nature as they are based on agricultural officials' eye estimations and
personal judgment. The estimates of final crop production based on objective crop valuations are of
limited use, since they become available at a later date after harvesting (Bernardi et al., 2016;
Greatrex et al., 2009). In this regard, an objective methodology for pre-harvest crop forecasting needs
to be developed. It involves the development as a forecasting technique of appropriate prediction
models that have certain merits over the conventional forecasting process. Such merits include the
objectivity of the forecast and its ability to measure the degree of prediction, which attributes cannot
be provided by a traditional prediction method.
Data from satellite based remote sensing (RS) provides timely, cost effective, timely and objective
information on crop scope, condition, growth and yield in a cost-effective way. As satellite sensor
systems technologically advanced, images with higher temporal and finer spatial resolutions have
become available. Classifying such multi-temporal information sets is an efficient and precise means
of producing crop maps, but techniques that can manage such big and complicated information sets
need to be established. In addition, a high temporal overview frequency over geographic areas is often
necessary to properly use RS for agricultural production monitoring. This often, however, limits the
spatial resolution. RS data is currently being used to estimate crop yields in different parts of the
world (Löw & Duveiller, 2014). Vegetation indices derived from RS are considered a potential tool
for enhancing simulations of real time crop yield. For example, Wang et al. (2017) succeeded in using
the Normalised Difference Vegetation Index (NDVI) as a vegetative activity strength indicator
represented indirectly by observed chlorophyll activity. Low NDVI values are associated with the
absence of vegetation, inactive vegetation or vegetation stressed by drought or diseased vegetation
(Páscoa et al., 2018). Routine updated information on crop area and spatial distribution and expected
yields are a basic requirement for agriculture surveillance.
This research will focus on winter wheat yield forecasting in Zimbabwe`s semi-arid regions.
Wheat (Triticum aestivum L.) is an important crop in many parts of the world and is the second
largest dietary component after maize in Zimbabwe. In addition, wheat is grown in winter in
Zimbabwe under irrigation, mainly by commercial farmers. It is therefore, crucial to predict wheat
yields as the production of wheat has declined due to climate variability, production costs and other
environmental factors.
The estimation of crop yield remains a problem for the majority of developing countries,
particularly in countries such as Zimbabwe that are primarily dependent on agriculture for food
security (Immitzer et al., 2012). Accurate and timely evaluation of crop yields is an essential step to
ensure a sufficient supply of food. Remote sensing, on the other side, provides some possibilities for
generating prompt and precise crop output information, enabling crop forecasting across space and
time and under multiple agro-climatic circumstance. It offers farmers, government departments, and
policy makers in general advance information to plan for either deficit surplus in production. Such
predictions warn the decision makers about potential reduction in crop yields and allow timely import
and export decision (Svotwa et al., 2014). In Zimbabwe, such studies were carried out mostly at
regional level covering large areas using low-resolution imagery, for example tobacco crop yield
forecasting in Zimbabwe using high resolution MODIS imagery by Svotwa et al.(2014). At the Farm
level, though, very little has been done. Therefore, this research attempts to assess the wheat growth
using NDVI trends, develop an NDVI wheat yield forecast model and evaluate the developed wheat
yield model for ARDA Antelope farm in Matobo district in Zimbabwe using high resolution
SENTINEL imagery.
2. Methods and Materials
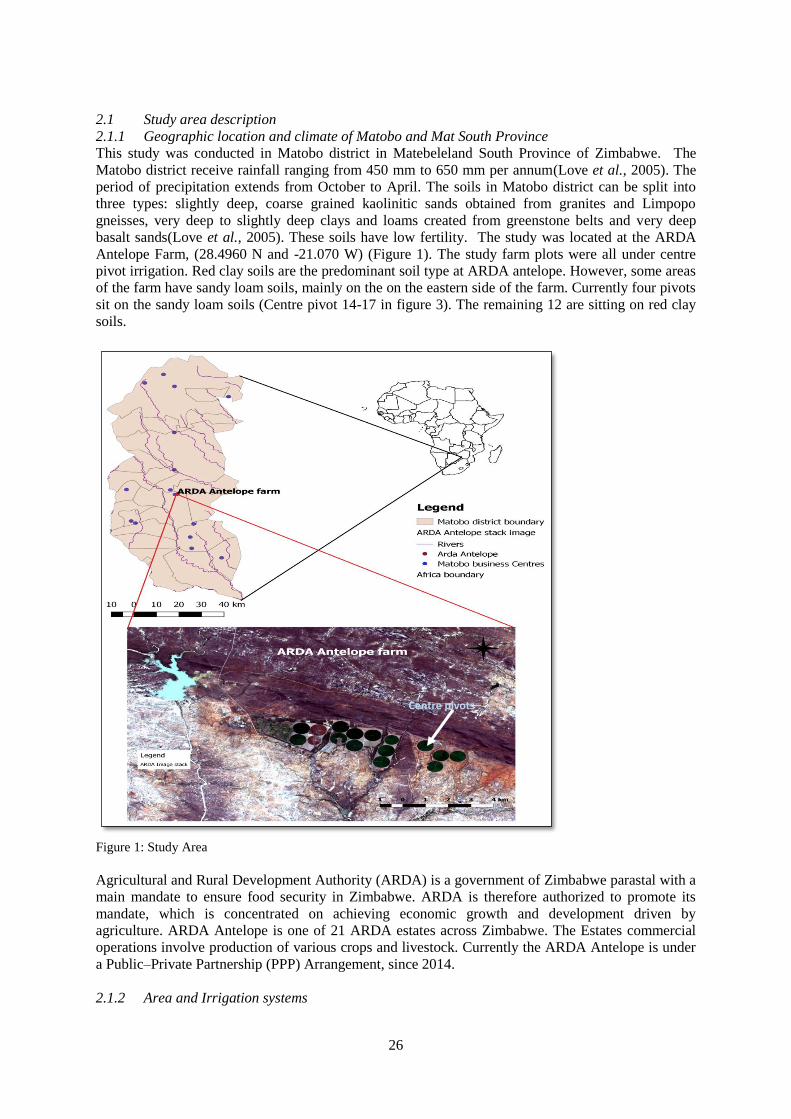
26
2.1 Study area description
2.1.1 Geographic location and climate of Matobo and Mat South Province
This study was conducted in Matobo district in Matebeleland South Province of Zimbabwe. The
Matobo district receive rainfall ranging from 450 mm to 650 mm per annum(Love et al., 2005). The
period of precipitation extends from October to April. The soils in Matobo district can be split into
three types: slightly deep, coarse grained kaolinitic sands obtained from granites and Limpopo
gneisses, very deep to slightly deep clays and loams created from greenstone belts and very deep
basalt sands(Love et al., 2005). These soils have low fertility. The study was located at the ARDA
Antelope Farm, (28.4960 N and -21.070 W) (Figure 1). The study farm plots were all under centre
pivot irrigation. Red clay soils are the predominant soil type at ARDA antelope. However, some areas
of the farm have sandy loam soils, mainly on the on the eastern side of the farm. Currently four pivots
sit on the sandy loam soils (Centre pivot 14-17 in figure 3). The remaining 12 are sitting on red clay
soils.
Figure 1: Study Area
Agricultural and Rural Development Authority (ARDA) is a government of Zimbabwe parastal with a
main mandate to ensure food security in Zimbabwe. ARDA is therefore authorized to promote its
mandate, which is concentrated on achieving economic growth and development driven by
agriculture. ARDA Antelope is one of 21 ARDA estates across Zimbabwe. The Estates commercial
operations involve production of various crops and livestock. Currently the ARDA Antelope is under
a Public–Private Partnership (PPP) Arrangement, since 2014.
2.1.2 Area and Irrigation systems
Centre pivots
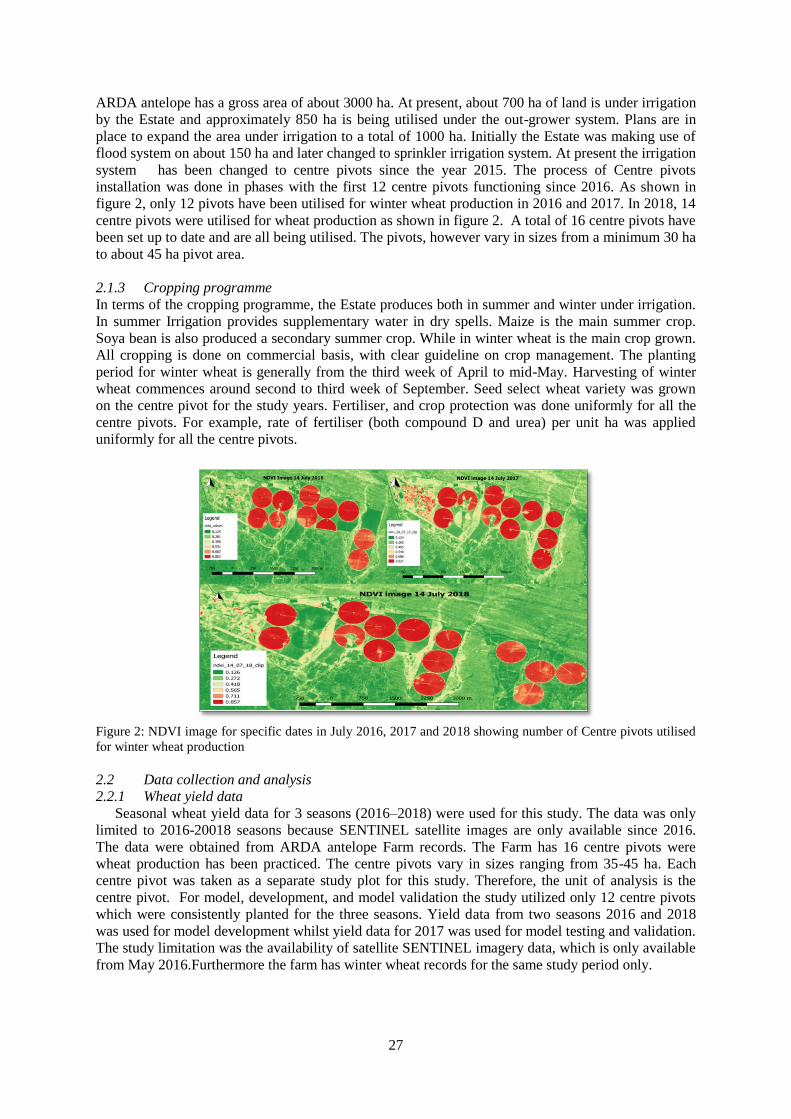
27
ARDA antelope has a gross area of about 3000 ha. At present, about 700 ha of land is under irrigation
by the Estate and approximately 850 ha is being utilised under the out-grower system. Plans are in
place to expand the area under irrigation to a total of 1000 ha. Initially the Estate was making use of
flood system on about 150 ha and later changed to sprinkler irrigation system. At present the irrigation
system has been changed to centre pivots since the year 2015. The process of Centre pivots
installation was done in phases with the first 12 centre pivots functioning since 2016. As shown in
figure 2, only 12 pivots have been utilised for winter wheat production in 2016 and 2017. In 2018, 14
centre pivots were utilised for wheat production as shown in figure 2. A total of 16 centre pivots have
been set up to date and are all being utilised. The pivots, however vary in sizes from a minimum 30 ha
to about 45 ha pivot area.
2.1.3 Cropping programme
In terms of the cropping programme, the Estate produces both in summer and winter under irrigation.
In summer Irrigation provides supplementary water in dry spells. Maize is the main summer crop.
Soya bean is also produced a secondary summer crop. While in winter wheat is the main crop grown.
All cropping is done on commercial basis, with clear guideline on crop management. The planting
period for winter wheat is generally from the third week of April to mid-May. Harvesting of winter
wheat commences around second to third week of September. Seed select wheat variety was grown
on the centre pivot for the study years. Fertiliser, and crop protection was done uniformly for all the
centre pivots. For example, rate of fertiliser (both compound D and urea) per unit ha was applied
uniformly for all the centre pivots.
Figure 2: NDVI image for specific dates in July 2016, 2017 and 2018 showing number of Centre pivots utilised
for winter wheat production
2.2 Data collection and analysis
2.2.1 Wheat yield data
Seasonal wheat yield data for 3 seasons (2016–2018) were used for this study. The data was only
limited to 2016-20018 seasons because SENTINEL satellite images are only available since 2016.
The data were obtained from ARDA antelope Farm records. The Farm has 16 centre pivots were
wheat production has been practiced. The centre pivots vary in sizes ranging from 35-45 ha. Each
centre pivot was taken as a separate study plot for this study. Therefore, the unit of analysis is the
centre pivot. For model, development, and model validation the study utilized only 12 centre pivots
which were consistently planted for the three seasons. Yield data from two seasons 2016 and 2018
was used for model development whilst yield data for 2017 was used for model testing and validation.
The study limitation was the availability of satellite SENTINEL imagery data, which is only available
from May 2016.Furthermore the farm has winter wheat records for the same study period only.
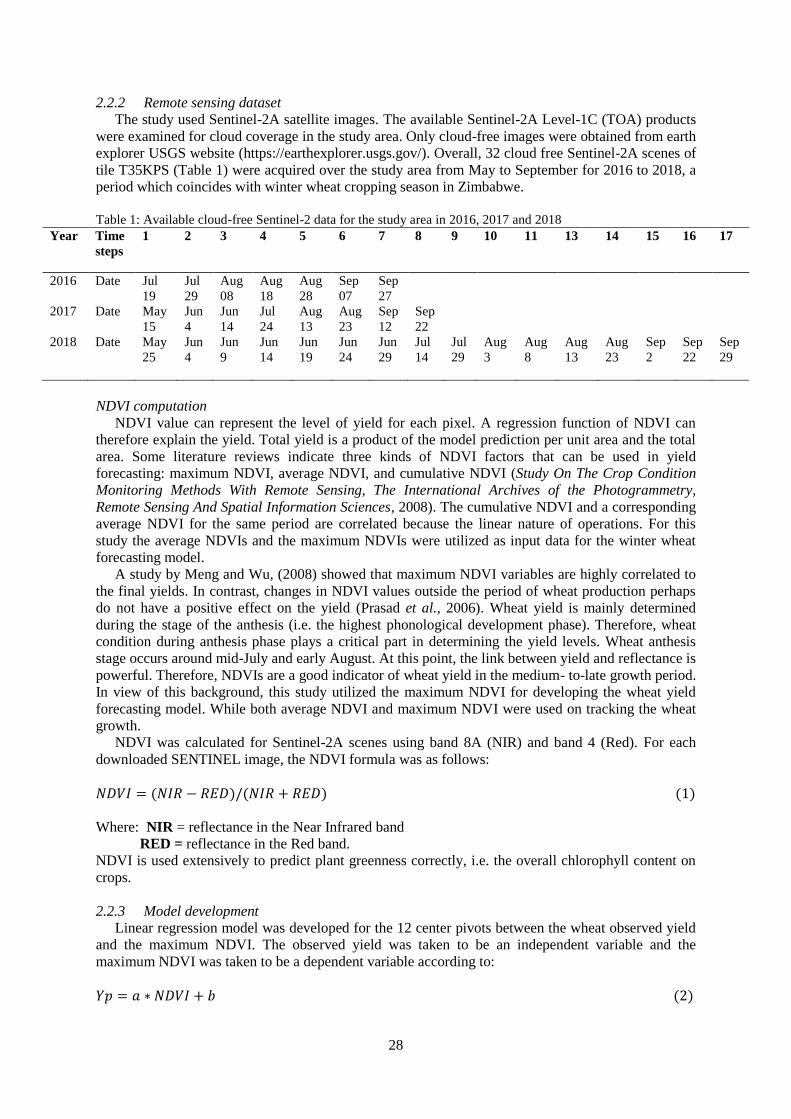
28
2.2.2 Remote sensing dataset
The study used Sentinel-2A satellite images. The available Sentinel-2A Level-1C (TOA) products
were examined for cloud coverage in the study area. Only cloud-free images were obtained from earth
explorer USGS website (https://earthexplorer.usgs.gov/). Overall, 32 cloud free Sentinel-2A scenes of
tile T35KPS (Table 1) were acquired over the study area from May to September for 2016 to 2018, a
period which coincides with winter wheat cropping season in Zimbabwe.
Table 1: Available cloud-free Sentinel-2 data for the study area in 2016, 2017 and 2018
Year Time
steps
1 2 3 4 5 6 7 8 9 10 11 13 14 15 16 17
2016 Date Jul
19
Jul
29
Aug
08
Aug
18
Aug
28
Sep
07
Sep
27
2017 Date May
15
Jun
4
Jun
14
Jul
24
Aug
13
Aug
23
Sep
12
Sep
22
2018 Date May
25
Jun
4
Jun
9
Jun
14
Jun
19
Jun
24
Jun
29
Jul
14
Jul
29
Aug
3
Aug
8
Aug
13
Aug
23
Sep
2
Sep
22
Sep
29
NDVI computation
NDVI value can represent the level of yield for each pixel. A regression function of NDVI can
therefore explain the yield. Total yield is a product of the model prediction per unit area and the total
area. Some literature reviews indicate three kinds of NDVI factors that can be used in yield
forecasting: maximum NDVI, average NDVI, and cumulative NDVI (Study On The Crop Condition
Monitoring Methods With Remote Sensing, The International Archives of the Photogrammetry,
Remote Sensing And Spatial Information Sciences, 2008). The cumulative NDVI and a corresponding
average NDVI for the same period are correlated because the linear nature of operations. For this
study the average NDVIs and the maximum NDVIs were utilized as input data for the winter wheat
forecasting model.
A study by Meng and Wu, (2008) showed that maximum NDVI variables are highly correlated to
the final yields. In contrast, changes in NDVI values outside the period of wheat production perhaps
do not have a positive effect on the yield (Prasad et al., 2006). Wheat yield is mainly determined
during the stage of the anthesis (i.e. the highest phonological development phase). Therefore, wheat
condition during anthesis phase plays a critical part in determining the yield levels. Wheat anthesis
stage occurs around mid-July and early August. At this point, the link between yield and reflectance is
powerful. Therefore, NDVIs are a good indicator of wheat yield in the medium- to-late growth period.
In view of this background, this study utilized the maximum NDVI for developing the wheat yield
forecasting model. While both average NDVI and maximum NDVI were used on tracking the wheat
growth.
NDVI was calculated for Sentinel-2A scenes using band 8A (NIR) and band 4 (Red). For each
downloaded SENTINEL image, the NDVI formula was as follows:
𝑁𝐷𝑉𝐼 = (𝑁𝐼𝑅 − 𝑅𝐸𝐷)/(𝑁𝐼𝑅 + 𝑅𝐸𝐷) (1)
Where: NIR = reflectance in the Near Infrared band
RED = reflectance in the Red band.
NDVI is used extensively to predict plant greenness correctly, i.e. the overall chlorophyll content on
crops.
2.2.3 Model development
Linear regression model was developed for the 12 center pivots between the wheat observed yield
and the maximum NDVI. The observed yield was taken to be an independent variable and the
maximum NDVI was taken to be a dependent variable according to:
𝑌𝑝 = 𝑎 ∗ 𝑁𝐷𝑉𝐼 + 𝑏 (2)
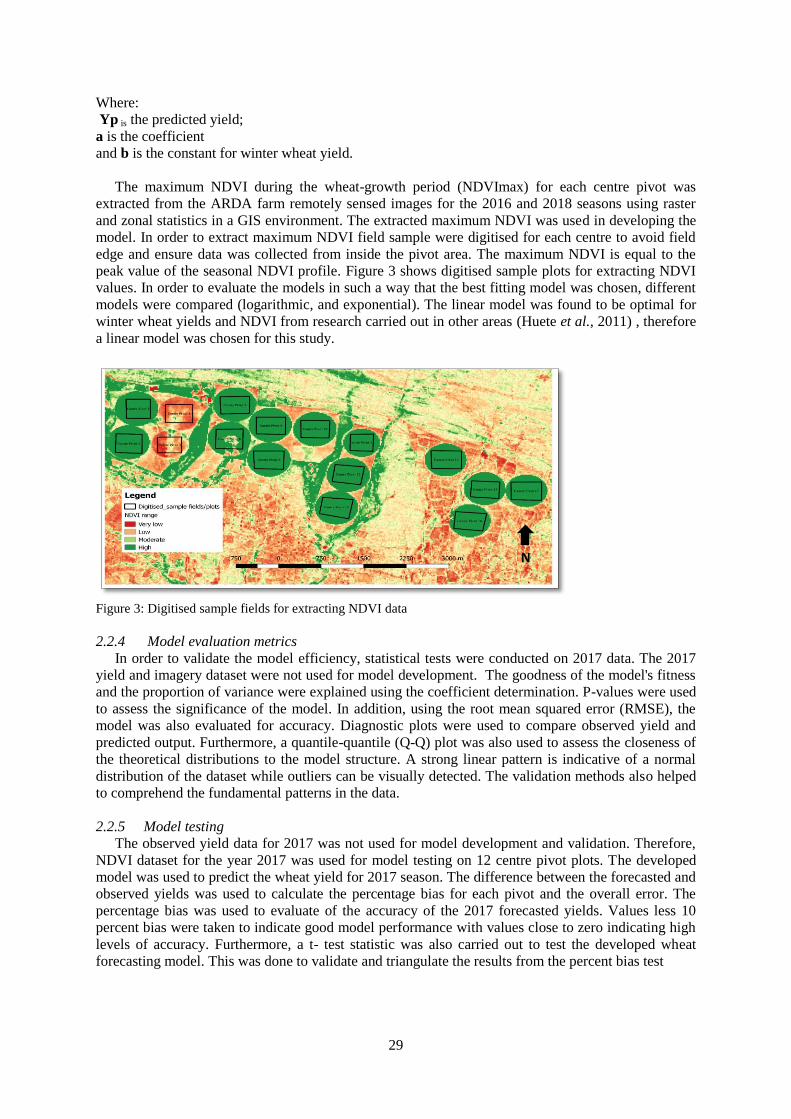
29
Where:
Yp is the predicted yield;
a is the coefficient
and b is the constant for winter wheat yield.
The maximum NDVI during the wheat-growth period (NDVImax) for each centre pivot was
extracted from the ARDA farm remotely sensed images for the 2016 and 2018 seasons using raster
and zonal statistics in a GIS environment. The extracted maximum NDVI was used in developing the
model. In order to extract maximum NDVI field sample were digitised for each centre to avoid field
edge and ensure data was collected from inside the pivot area. The maximum NDVI is equal to the
peak value of the seasonal NDVI profile. Figure 3 shows digitised sample plots for extracting NDVI
values. In order to evaluate the models in such a way that the best fitting model was chosen, different
models were compared (logarithmic, and exponential). The linear model was found to be optimal for
winter wheat yields and NDVI from research carried out in other areas (Huete et al., 2011) , therefore
a linear model was chosen for this study.
Figure 3: Digitised sample fields for extracting NDVI data
2.2.4 Model evaluation metrics
In order to validate the model efficiency, statistical tests were conducted on 2017 data. The 2017
yield and imagery dataset were not used for model development. The goodness of the model's fitness
and the proportion of variance were explained using the coefficient determination. P-values were used
to assess the significance of the model. In addition, using the root mean squared error (RMSE), the
model was also evaluated for accuracy. Diagnostic plots were used to compare observed yield and
predicted output. Furthermore, a quantile-quantile (Q-Q) plot was also used to assess the closeness of
the theoretical distributions to the model structure. A strong linear pattern is indicative of a normal
distribution of the dataset while outliers can be visually detected. The validation methods also helped
to comprehend the fundamental patterns in the data.
2.2.5 Model testing
The observed yield data for 2017 was not used for model development and validation. Therefore,
NDVI dataset for the year 2017 was used for model testing on 12 centre pivot plots. The developed
model was used to predict the wheat yield for 2017 season. The difference between the forecasted and
observed yields was used to calculate the percentage bias for each pivot and the overall error. The
percentage bias was used to evaluate of the accuracy of the 2017 forecasted yields. Values less 10
percent bias were taken to indicate good model performance with values close to zero indicating high
levels of accuracy. Furthermore, a t- test statistic was also carried out to test the developed wheat
forecasting model. This was done to validate and triangulate the results from the percent bias test
N
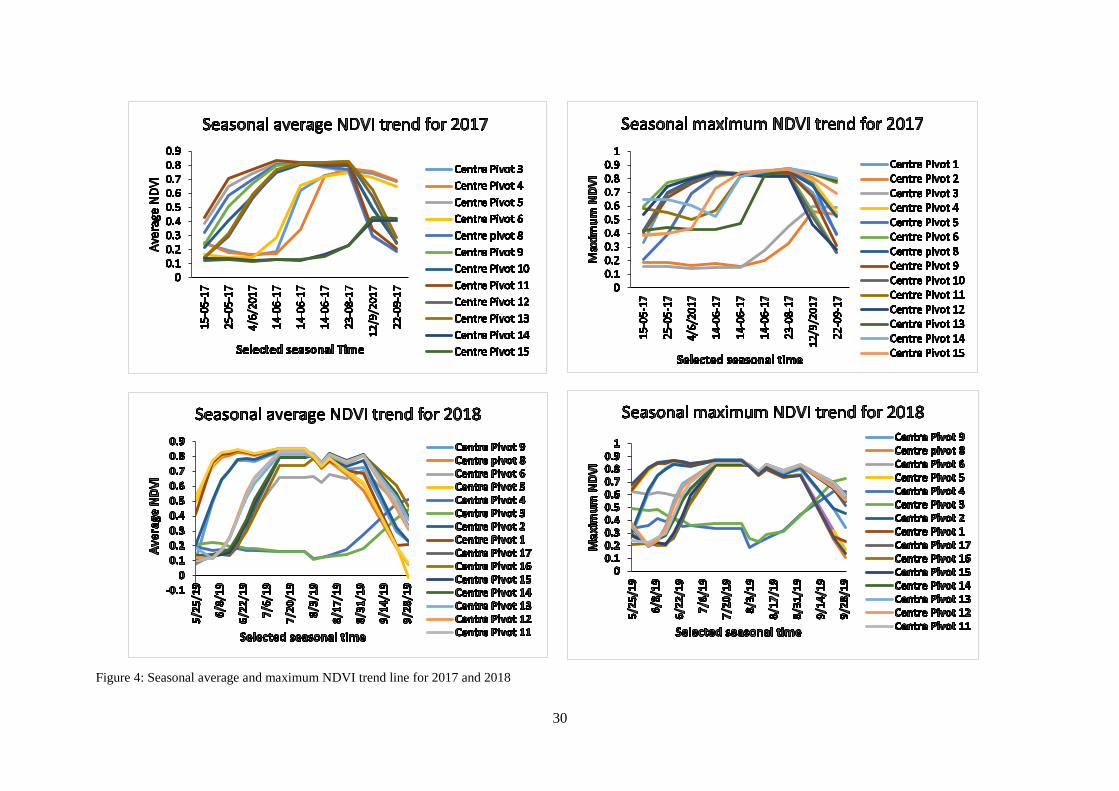
30
Figure 4: Seasonal average and maximum NDVI trend line for 2017 and 2018
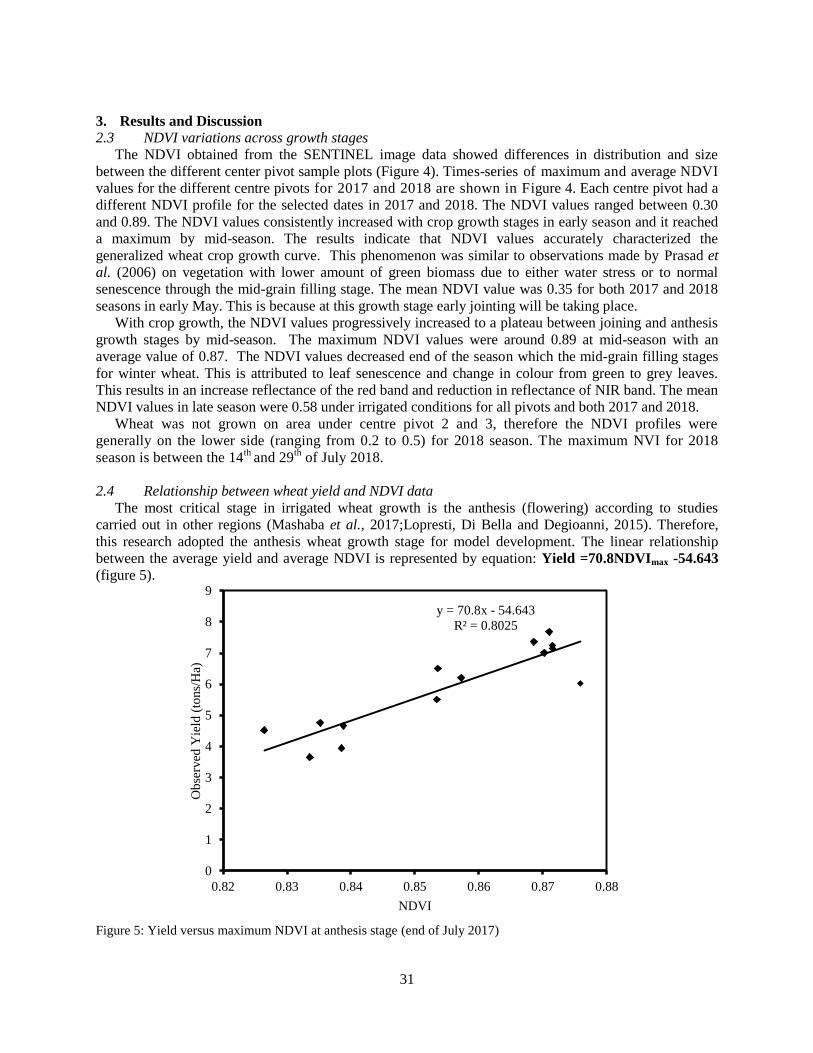
31
3. Results and Discussion
2.3 NDVI variations across growth stages
The NDVI obtained from the SENTINEL image data showed differences in distribution and size
between the different center pivot sample plots (Figure 4). Times-series of maximum and average NDVI
values for the different centre pivots for 2017 and 2018 are shown in Figure 4. Each centre pivot had a
different NDVI profile for the selected dates in 2017 and 2018. The NDVI values ranged between 0.30
and 0.89. The NDVI values consistently increased with crop growth stages in early season and it reached
a maximum by mid-season. The results indicate that NDVI values accurately characterized the
generalized wheat crop growth curve. This phenomenon was similar to observations made by Prasad et
al. (2006) on vegetation with lower amount of green biomass due to either water stress or to normal
senescence through the mid-grain filling stage. The mean NDVI value was 0.35 for both 2017 and 2018
seasons in early May. This is because at this growth stage early jointing will be taking place.
With crop growth, the NDVI values progressively increased to a plateau between joining and anthesis
growth stages by mid-season. The maximum NDVI values were around 0.89 at mid-season with an
average value of 0.87. The NDVI values decreased end of the season which the mid-grain filling stages
for winter wheat. This is attributed to leaf senescence and change in colour from green to grey leaves.
This results in an increase reflectance of the red band and reduction in reflectance of NIR band. The mean
NDVI values in late season were 0.58 under irrigated conditions for all pivots and both 2017 and 2018.
Wheat was not grown on area under centre pivot 2 and 3, therefore the NDVI profiles were
generally on the lower side (ranging from 0.2 to 0.5) for 2018 season. The maximum NVI for 2018
season is between the 14th
and 29th
of July 2018.
2.4 Relationship between wheat yield and NDVI data
The most critical stage in irrigated wheat growth is the anthesis (flowering) according to studies
carried out in other regions (Mashaba et al., 2017;Lopresti, Di Bella and Degioanni, 2015). Therefore,
this research adopted the anthesis wheat growth stage for model development. The linear relationship
between the average yield and average NDVI is represented by equation: Yield =70.8NDVImax -54.643
(figure 5).
Figure 5: Yield versus maximum NDVI at anthesis stage (end of July 2017)
y = 70.8x - 54.643
R² = 0.8025
0
1
2
3
4
5
6
7
8
9
0.82 0.83 0.84 0.85 0.86 0.87 0.88
Ob
serv
ed Y
ield
(to
ns/
Ha)
NDVI
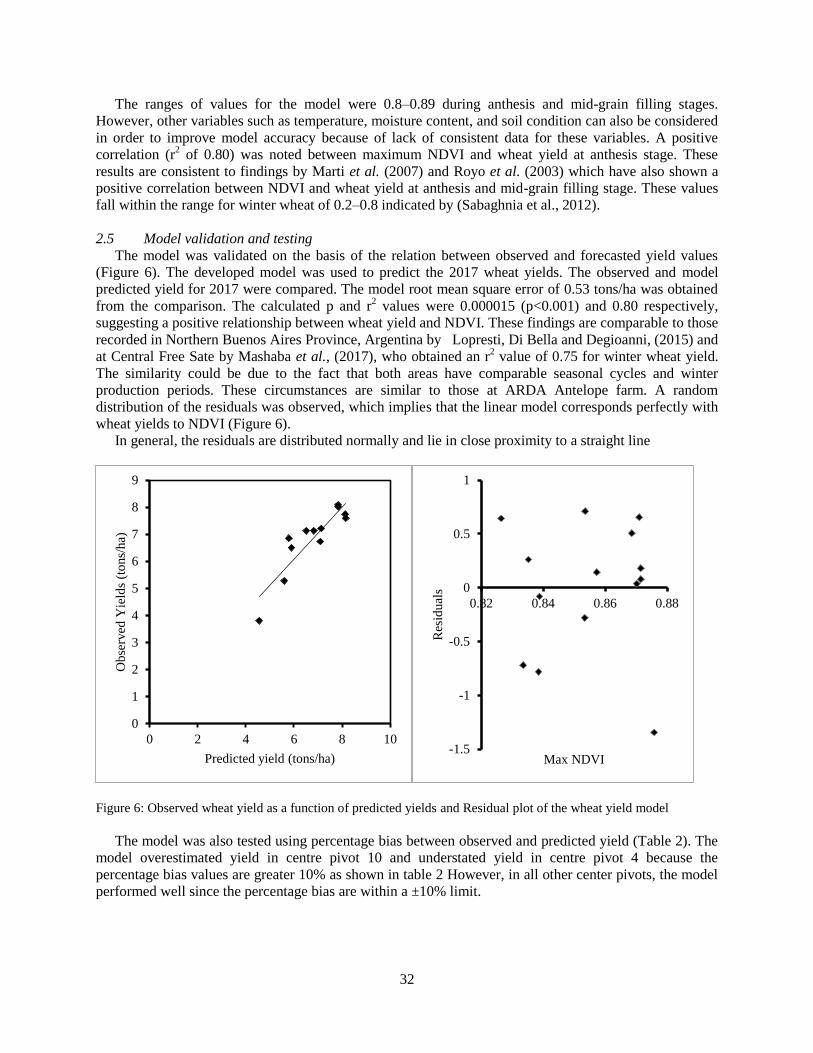
32
The ranges of values for the model were 0.8–0.89 during anthesis and mid-grain filling stages.
However, other variables such as temperature, moisture content, and soil condition can also be considered
in order to improve model accuracy because of lack of consistent data for these variables. A positive
correlation (r2 of 0.80) was noted between maximum NDVI and wheat yield at anthesis stage. These
results are consistent to findings by Marti et al. (2007) and Royo et al. (2003) which have also shown a
positive correlation between NDVI and wheat yield at anthesis and mid-grain filling stage. These values
fall within the range for winter wheat of 0.2–0.8 indicated by (Sabaghnia et al., 2012).
2.5 Model validation and testing
The model was validated on the basis of the relation between observed and forecasted yield values
(Figure 6). The developed model was used to predict the 2017 wheat yields. The observed and model
predicted yield for 2017 were compared. The model root mean square error of 0.53 tons/ha was obtained
from the comparison. The calculated p and r2 values were 0.000015 (p<0.001) and 0.80 respectively,
suggesting a positive relationship between wheat yield and NDVI. These findings are comparable to those
recorded in Northern Buenos Aires Province, Argentina by Lopresti, Di Bella and Degioanni, (2015) and
at Central Free Sate by Mashaba et al., (2017), who obtained an r2 value of 0.75 for winter wheat yield.
The similarity could be due to the fact that both areas have comparable seasonal cycles and winter
production periods. These circumstances are similar to those at ARDA Antelope farm. A random
distribution of the residuals was observed, which implies that the linear model corresponds perfectly with
wheat yields to NDVI (Figure 6).
In general, the residuals are distributed normally and lie in close proximity to a straight line
Figure 6: Observed wheat yield as a function of predicted yields and Residual plot of the wheat yield model
The model was also tested using percentage bias between observed and predicted yield (Table 2). The
model overestimated yield in centre pivot 10 and understated yield in centre pivot 4 because the
percentage bias values are greater 10% as shown in table 2 However, in all other center pivots, the model
performed well since the percentage bias are within a ±10% limit.
0
1
2
3
4
5
6
7
8
9
0 2 4 6 8 10
Ob
serv
ed Y
ield
s (t
ons/
ha)
Predicted yield (tons/ha) -1.5
-1
-0.5
0
0.5
1
0.82 0.84 0.86 0.88
Res
idual
s
Max NDVI
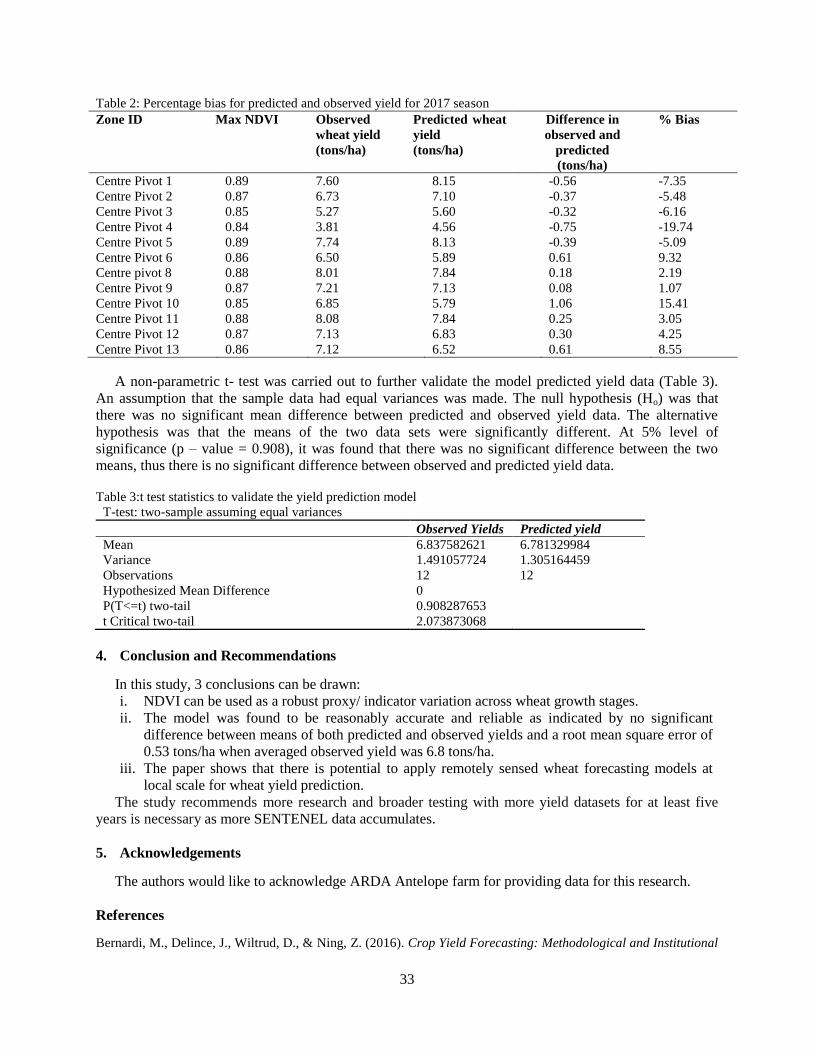
33
Table 2: Percentage bias for predicted and observed yield for 2017 season
Zone ID Max NDVI Observed
wheat yield
(tons/ha)
Predicted wheat
yield
(tons/ha)
Difference in
observed and
predicted
(tons/ha)
% Bias
Centre Pivot 1 0.89 7.60 8.15 -0.56 -7.35
Centre Pivot 2 0.87 6.73 7.10 -0.37 -5.48
Centre Pivot 3 0.85 5.27 5.60 -0.32 -6.16
Centre Pivot 4 0.84 3.81 4.56 -0.75 -19.74
Centre Pivot 5 0.89 7.74 8.13 -0.39 -5.09
Centre Pivot 6 0.86 6.50 5.89 0.61 9.32
Centre pivot 8 0.88 8.01 7.84 0.18 2.19
Centre Pivot 9 0.87 7.21 7.13 0.08 1.07
Centre Pivot 10 0.85 6.85 5.79 1.06 15.41
Centre Pivot 11 0.88 8.08 7.84 0.25 3.05
Centre Pivot 12 0.87 7.13 6.83 0.30 4.25
Centre Pivot 13 0.86 7.12 6.52 0.61 8.55
A non-parametric t- test was carried out to further validate the model predicted yield data (Table 3).
An assumption that the sample data had equal variances was made. The null hypothesis (Ho) was that
there was no significant mean difference between predicted and observed yield data. The alternative
hypothesis was that the means of the two data sets were significantly different. At 5% level of
significance (p – value = 0.908), it was found that there was no significant difference between the two
means, thus there is no significant difference between observed and predicted yield data.
Table 3:t test statistics to validate the yield prediction model
T-test: two-sample assuming equal variances
Observed Yields Predicted yield
Mean 6.837582621 6.781329984
Variance 1.491057724 1.305164459
Observations 12 12
Hypothesized Mean Difference 0
P(T<=t) two-tail 0.908287653
t Critical two-tail 2.073873068
4. Conclusion and Recommendations
In this study, 3 conclusions can be drawn:
i. NDVI can be used as a robust proxy/ indicator variation across wheat growth stages.
ii. The model was found to be reasonably accurate and reliable as indicated by no significant
difference between means of both predicted and observed yields and a root mean square error of
0.53 tons/ha when averaged observed yield was 6.8 tons/ha.
iii. The paper shows that there is potential to apply remotely sensed wheat forecasting models at
local scale for wheat yield prediction.
The study recommends more research and broader testing with more yield datasets for at least five
years is necessary as more SENTENEL data accumulates.
5. Acknowledgements
The authors would like to acknowledge ARDA Antelope farm for providing data for this research.
References
Bernardi, M., Delince, J., Wiltrud, D., & Ning, Z. (2016). Crop Yield Forecasting: Methodological and Institutional
34
Aspects.
Chahbi Bellakanji, A., Zribi, M., Lili-Chabaane, Z., & Mougenot, B. (2018). Forecasting of Cereal Yields in a Semi-
arid Area Using the Simple Algorithm for Yield Estimation (SAFY) Agro-Meteorological Model Combined
with Optical SPOT/HRV Images. https://doi.org/10.3390/s18072138
FAO. (2017). The future of food and agriculture: Trends and challenges. In The future of food and agriculture:
Trends and challenges. https://doi.org/ISBN 978-92-5-109551-5
Greatrex, H. L., Grimes, D. I. F., & Wheeler, T. R. (2009). Application of seasonal rainfall forecasts and satellite
rainfall observations to crop yield forecasting for Africa. Assembly, 11, 5434.
http://adsabs.harvard.edu/abs/2009EGUGA..11.5434G
Huete, A., Didan, K., van Leeuwen, W., Miura, T., & Glenn, E. (2011). MODIS vegetation indices. In Remote
Sensing and Digital Image Processing (Vol. 11, pp. 579–602). Springer, New York, NY.
https://doi.org/10.1007/978-1-4419-6749-7_26
Immitzer, M., Atzberger, C., & Koukal, T. (2012). Tree species classification with Random forest using very high
spatial resolution 8-band worldView-2 satellite data. Remote Sensing, 4(9), 2661–2693.
https://doi.org/10.3390/rs4092661
Lopresti, M. F., Di Bella, C. M., & Degioanni, A. J. (2015). Relationship between MODIS-NDVI data and wheat
yield: A case study in Northern Buenos Aires province, Argentina. Information Processing in Agriculture,
2(2), 73–84. https://doi.org/10.1016/j.inpa.2015.06.001
Love, D., Taigbenu, A. E., & Jonker, L. (2005). PN17. An overview of the Mzingwane Catchment,\r\nZimbabwe.
February, 20 pp. https://assets.publishing.service.gov.uk/media/57a08ca1e5274a27b2001305/WP1-
Mzingwane.pdf
Löw, F., & Duveiller, G. (2014). Defining the spatial resolution requirements for crop identification using optical
remote sensing. Remote Sensing, 6(9), 9034–9063. https://doi.org/10.3390/rs6099034
Marti, J., Bort, J., Slafer, G. A., & Araus, J. L. (2007). Can wheat yield be assessed by early measurements of
Normalized Difference Vegetation Index? Annals of Applied Biology, 150(2), 253–257.
https://doi.org/10.1111/j.1744-7348.2007.00126.x
Mashaba, Z., Chirima, G., Botai, J. O., Combrinck, L., Munghemezulu, C., & Dube, E. (2017). Forecasting winter
wheat yields using MODIS NDVI data for the Central Free State region. South African Journal of Science,
113(11/12). https://doi.org/10.17159/sajs.2017/20160201
Study On The Crop Condition Monitoring Methods With Remote Sensing, The International Archives of the
Photogrammetry, Remote Sensing And Spatial Information Sciences, (2008).
http://www.isprs.org/proceedings/XXXVII/congress/8_pdf/10_WG-VIII-10/05.pdf
Páscoa, P., Gouveia, C. M., Russo, A. C., Bojariu, R., Vicente-Serrano, S. M., & Trigo, R. M. (2018). Vegetation
vulnerability to drought on southeastern Europe. Hydrology and Earth System Sciences Discussions, 1–29.
https://doi.org/10.5194/hess-2018-264
Prasad, A. K., Chai, L., Singh, R. P., & Kafatos, M. (2006). Crop yield estimation model for Iowa using remote
sensing and surface parameters. International Journal of Applied Earth Observation and Geoinformation.
https://doi.org/10.1016/j.jag.2005.06.002
Royo, C., Aparicio, N., Villegas, D., Casadesus, J., Monneveux, P., & Araus, J. L. (2003). Usefulness of spectral
reflectance indices as durum wheat yield predictors under contrasting Mediterranean conditions.
International Journal of Remote Sensing, 24(22), 4403–4419.
https://doi.org/10.1080/0143116031000150059
Sabaghnia, N., Karimizadeh, R., & Mohammadi, M. (2012). Model selection in additive main effect and
multiplicative interaction model in durum wheat. Genetika, 44(2), 325–339.
https://doi.org/10.2298/GENSR1202325S
Svotwa, E., Masuka, A. J., Maasdorp, B., & Murwira, A. (2014). Estimating Tobacco Crop Area and Yield in
Zimbabwe Using Operational Remote Sensing and Statistical Techniques. International Journal of
Agricultural Research and Review, 2(5), 84–91. www.glovis.usgs.gov.
Vermeulen, S. J., Aggarwal, P. K., Ainslie, A., Angelone, C., Campbell, B. M., Challinor, A. J., Hansen, J., Ingram,
J. S. I., Jarvis, A., Kristjanson, P., Lau, C., Thornton, P. K., & Wollenberg, E. (2010). Agriculture, Food
Security and Climate Change: Outlook for Knowledge, Tools and Action. CCAFS Report 3., 3, 1–16.
https://cgspace.cgiar.org/handle/10568/3090
Wang, S., Zhang, L., Huang, C., & Qiao, N. (2017). An NDVI-based vegetation phenology is improved to be more
consistent with photosynthesis dynamics through applying a light use efficiency model over boreal high-
latitude forests. Remote Sensing, 9(7), 695. https://doi.org/10.3390/rs9070695
35
Available online at www.asric.org
ASRIC Journal on Agricultural Sciences 1 (2020) 35-42
a Department of Chemical Sciences, School of Sciences,
University of Energy and Natural Resources, Sunyani, Bono Region, Ghana b Department of Biology, College of Science,
University of Sulaimani, Sulaymaniyah, Kurdistan Region, Iraq
Received 19 December 2019; revised 30 January 2020; accepted 30 January 2020
Abstract
The existing technologies for removing toxic metals from the environment are very expensive and impractical
for use in developing countries. In the present study we investigated the use of Lettuce (Lactuca sativa), Cabbage
(Brassica oleracea var. capitata) and Carrots (Daucus carota subsp. Sativus) as biosorbents for removing Copper
(Cu), Lead (Pb), and Zinc metal ions from polluted water via biofiltration. The filtrates were analysed via Atomic
Absorption Spectroscopy (AAS) in order to quantitate any remaining, unremoved metals. All three biosorbents
showed considerable abilities to remove the above metals, with about 95% removal efficiency in the case of zinc
(Zn2+
). In order to understand the chemistry of the adsorption processes, the biosorbent materials, after biofiltration,
were analysed via FT-IR spectroscopy, which revealed that all three biosorbents contained compounds with phenol,
ether, alkanol, carbonyl and alkanoic acid groups that were involved in the formation of surface complexes during
the adsorption of the metal ions. To investigate the effect of this biofiltration process on the overall quality of water,
the physicochemical parameters (pH, conductivity, colour, turbidity, TDS and TSS) were also measured on river
water samples that have been pre-treated with the biosorbents. There was general improvement in the water quality
although the biofilters appeared to have introduced some mineral ions, which increased the conductivity and TDS of
the water.
Keywords: Biofitration; Lead; Zinc; Copper; Remediation; Mining; Pollution
1. Introduction
Environmental pollution from chemicals remains one of the serious threats globally (Schwarzenbach
et al. 2010), but the indiscriminate release of toxic heavy metals into soil and water bodies is much more
alarming (Valko, Morris, and Cronin 2005) and requires utmost attention. Unlike some organic
contaminants, heavy metals, which are inorganic, cannot be broken down to non-toxic forms and
therefore have long-lasting effects not only on human health but the ecosystem at large. Even at very low
concentrations heavy metals including lead (Pb), cadmium (Cd), mercury (Hg), chromium (Cr), zinc (Zn),
silver (Ag), nickel (Ni) and arsenic (As) are well known to be cytotoxic and carcinogenic in nature
(Gjorgieva Ackova 2018; Jia et al. 2017; Fashola et al. 2016; Tchounwou et al. 2012). Although heavy
1 Corresponding author. Email addresses: [email protected] (I. Emahi)
36
metals in general are naturally occurring, human activities, especially mining has caused exacerbating
levels of these toxic metals (Delplace et al. 2020; Shi et al. 2018). Once released into the environment,
toxic metals transfer and bioaccumulate in plants, tissues of animals, including freshwater fish, and
eventually enter humans through the food chain, inhalation, or handling of contaminated samples
(Delplace et al. 2020; Wuana and Okieimen 2011). The threats posed by these toxic heavy metals call for
effective removal strategies in order to avert any unexpected health implications.
(Malik et al. 2016) have discussed a number of conventional techniques that can be used in removing
heavy metals from the environment. Unfortunately, all such techniques have their limitations, especially
with respect to high cost of operations, making them largely impractical for developing countries. The
search for cheaper alternatives therefore continue to be sought by researchers worldwide. Biofiltration, a
physico-chemical process, which involves the use of biological materials (plants and microbes) to remove
heavy metals from aqueous solutions have been reported to be cost-effective and environmentally friendly
solution compared to the more expensive conventional techniques (Majumder and Gupta 2010; Srivastava
and Majumder 2008).
Plants, especially leafy vegetables grown on either contaminated soils or irrigated with polluted water
tend to be a major source of toxic metal consumption by humans (Rai et al. 2019; Intawongse and R Dean
2006; Müller and Anke 1994). Researchers have exploited this metal-adsorption ability of such plants to
use as potential biofilters for removing the same metals from the environment. Several studies suggest
that leafy vegetables such as cabbage, lettuce and carrots accumulate large amounts of heavy metals even
in the presence of high levels of plant nutrients (Al-Hiyaly 2014; Boamponsem et al. 2012; Mumba et al.
2008; Intawongse and Dean 2006; Zhou et al. 2005; Cobb et al. 2000). Vegetables have various
mechanisms for taking up heavy metals from the environment, and the various parts (roots, stems, leaves,
etc.) may accumulate different metals at different levels. For example, some plants accumulate more
metals in the leaves than in the roots or stems, and vice versa (Othman 2001).
In the present study, the use of the edible parts of cabbage (i.e. head), lettuce (i.e. leaves) and carrot
(i.e. root) as biosorbent materials for the removal of zinc, lead, and copper from artificially contaminated
water as well as river water samples was investigated. The study was carried out in Sunyani in the Bono
region of Ghana, and spanned the period from September 2018 to April 2019.
2. Materials and Methods
2.1 Reagents and Solutions
All reagents used were analytical grade. Lead oxide (PbO), Zinc oxide (ZnO) and Copper sulphate
(CuSO4) were purchased from BDH Laboratory, England, and used as is. Solutions of the heavy metal
ions, Lead (Pb2+
), Zinc (Zn2+
) and Copper (Cu2+
) were prepared through appropriate dilutions from a 1000
ppm stock solution of the respective compounds listed above. The solutions were prepared with deionized
water and supplemented with 10% (v/v) nitric acid (HNO3) to facilitate complete dissolution. Where
necessary, 0.1 M solutions of nitric acid (HNO3) and sodium hydroxide (NaOH) were used to adjust the
pH as appropriate.
2.2 Preparation of the Adsorbent/ Biofilter
The vegetables were obtained from a selected farm at Abesim Dadaa, near Abesim in the Sunyani
Municipality of the Bono Region of Ghana. The fresh vegetables, carrots (roots), lettuce (leaves), and
cabbage (head) were thoroughly washed under running tap water and further rinsed with distilled water in
the laboratory. The vegetables were then chopped into smaller pieces and air-dried for about 30 min to
allow any moisture to dry out. Afterwards, they were placed in an oven and further dried at 70 oC for 12
h. The dried vegetables were then ground to fine powder using a mechanical blender. These powdered
samples were transferred into zip-lock bags and stored airtight at 4 oC until ready for use.
37
2.3 Biosorption Experiments
The removal of Pb2+
, Zn2+
and Cu2+
ions from the artificially contaminated water were investigated
through adsorption process involving incubation of the metal ion solutions with the biosorbents
(powdered vegetable samples) followed by filtration and quantitation. Specifically, 100 mg of the finely
grinded vegetable was added to 20 ml of the metal solution in a pre-treated flask. It was then incubated at
40℃ for about 1 h with gentle shaking at 300 rpm. The suspension was then filtered using filter paper
(Whatman Nº1). Residual metal ion (Pb2+
, Zn2+
or Cu2+
) remaining in the filtrate was then quantified via
flame atomic absorption spectrophotometry (FAAS) using the Analytik Jena AAS Model AA400p
instrument, Germany. The ability of the biosorbents to remove the specific metals were determined as
percent removal, and calculated as follows:
𝑅𝑒𝑚𝑜𝑣𝑎𝑙 (%) =𝐶𝑜𝑛𝑐𝑒𝑛𝑡𝑟𝑎𝑡𝑖𝑜𝑛 𝑏𝑒𝑓𝑜𝑟𝑒 𝑓𝑖𝑙𝑡𝑟𝑎𝑡𝑖𝑜𝑛 (𝑝𝑝𝑚) − 𝐶𝑜𝑛𝑐𝑒𝑛𝑡𝑟𝑎𝑡𝑖𝑜𝑛 𝑎𝑓𝑡𝑒𝑟 𝑓𝑖𝑙𝑡𝑟𝑎𝑡𝑖𝑜𝑛 (𝑝𝑝𝑚)
𝐶𝑜𝑛𝑐𝑒𝑛𝑡𝑟𝑎𝑡𝑖𝑜𝑛 𝑏𝑒𝑓𝑜𝑟𝑒 𝑓𝑖𝑙𝑡𝑟𝑎𝑡𝑖𝑜𝑛 (𝑝𝑝𝑚)× 100
2.4 IR Characterization
The biomass residues after the biofiltration process were air-dried and analyzed for their functional
group properties via Fourier-Transform Infra red spectroscopy (FT-IR). Samples of the dried biomass
powder prior to the biofiltration were also analyzed with FT-IR in order to compare and evaluate any
changes in functional group properties before and after the biofiltration.
2.5 Application of the biofiltration process on raw water samples.
The ability of the biosorbents to improve the physicochemical quality of water was also tested on
water samples collected from the Kwabrafo River in Obuasi, a well-known mining town in Ghana. The
Kwabrafo River is defined by the presence of mining activities such as tailing dams both active and
inactive, gold-ore crushing and processing facilities, and purportedly contaminated with solid waste from
the Obuasi township (CHRAJ 2008). The stream has a turbid brownish colour with unpleasant smell, but
still used by the inhabitants for various domestic purposes. The biofiltration process described above was
carried out on these water samples for all three vegetables. The raw water sample was analyzed via
FAAS, as described above, to determine the presence of the metals (Pb2+
, Zn2+
or Cu2+
). The various
filtrates from the biofiltration process were also analyzed for the physicochemical parameters pH,
electrical conductivity, turbidity, colour, total dissolved solids and total suspended solids. The electrical
conductivity and Total Dissolved Solids (TDS) were measured using E-1 portable EC / TDS meter
(Newly Digital, China). pH of the sample was measured with pH meter (pH901, Bante Instruments,
China). The remaining parameters were analyzed using standard protocols.
3. Results and Discussion
3.1 Removal efficiencies
The FAAS was used to quantitate the actual concentrations of the metals present in the artificially
contaminated water and to also determine the concentrations of these metals remaining after the
biofiltration process.
Figure 1 provides a comparison of the removal efficiencies of the three biosorbents - carrots, cabbage,
and lettuce towards the three heavy metals zinc, lead, and copper.
All three biosorbents showed generally the same trend for uptake preference towards the three metals,
with all biosorbents showing highest removal efficiency towards zinc, followed by copper, and then lead.
About 95% (cabbage, 95.24%; carrot, 95.26%; lettuce, 95.22%) of the initial 100 ppm zinc was removed
after the biofiltration process. The uptake of copper by the three biosorbents were also very similar, with
carrots removing 67.74% of the initial 100 ppm; followed by 67.71% and 67.00% respectively for
cabbage and lettuce. The only difference in removal efficiencies among the three biosorbents was
observed for the uptake of lead. Carrot showed the highest preference for lead, with 34.76% of the initial
100 ppm removed after biofiltration. Cabbage showed an uptake efficiency of 29.81%, with the least
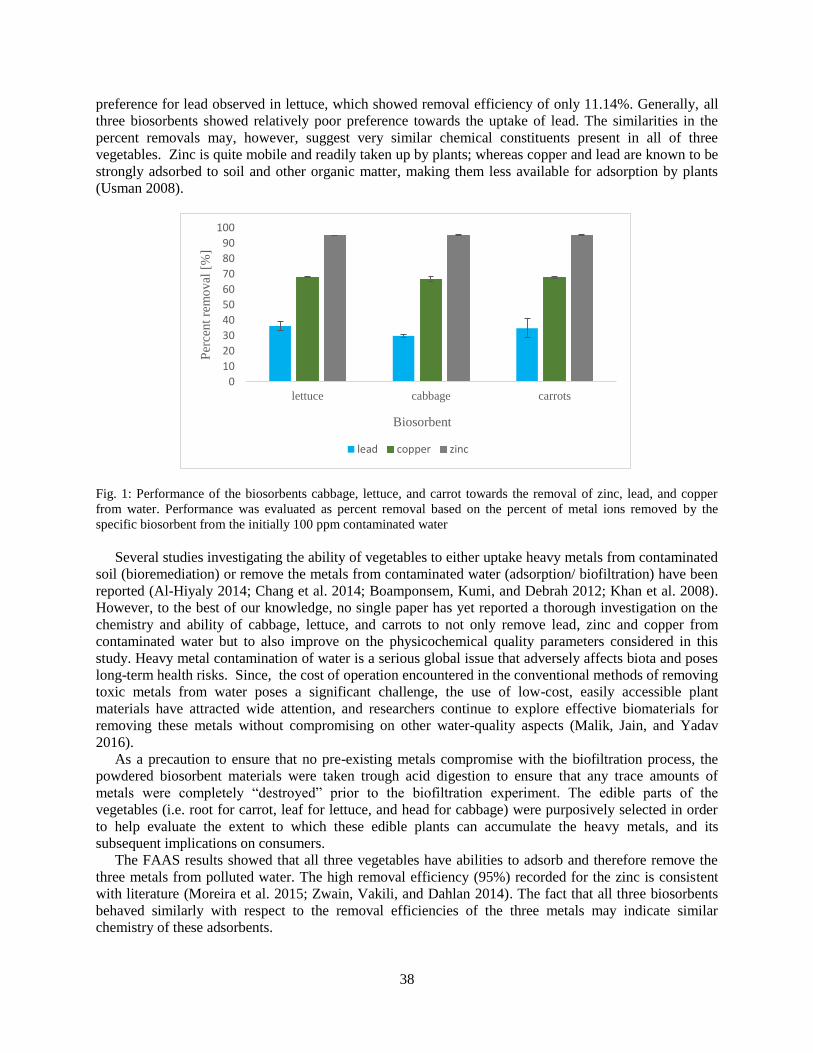
38
preference for lead observed in lettuce, which showed removal efficiency of only 11.14%. Generally, all
three biosorbents showed relatively poor preference towards the uptake of lead. The similarities in the
percent removals may, however, suggest very similar chemical constituents present in all of three
vegetables. Zinc is quite mobile and readily taken up by plants; whereas copper and lead are known to be
strongly adsorbed to soil and other organic matter, making them less available for adsorption by plants
(Usman 2008).
Fig. 1: Performance of the biosorbents cabbage, lettuce, and carrot towards the removal of zinc, lead, and copper
from water. Performance was evaluated as percent removal based on the percent of metal ions removed by the
specific biosorbent from the initially 100 ppm contaminated water
Several studies investigating the ability of vegetables to either uptake heavy metals from contaminated
soil (bioremediation) or remove the metals from contaminated water (adsorption/ biofiltration) have been
reported (Al-Hiyaly 2014; Chang et al. 2014; Boamponsem, Kumi, and Debrah 2012; Khan et al. 2008).
However, to the best of our knowledge, no single paper has yet reported a thorough investigation on the
chemistry and ability of cabbage, lettuce, and carrots to not only remove lead, zinc and copper from
contaminated water but to also improve on the physicochemical quality parameters considered in this
study. Heavy metal contamination of water is a serious global issue that adversely affects biota and poses
long-term health risks. Since, the cost of operation encountered in the conventional methods of removing
toxic metals from water poses a significant challenge, the use of low-cost, easily accessible plant
materials have attracted wide attention, and researchers continue to explore effective biomaterials for
removing these metals without compromising on other water-quality aspects (Malik, Jain, and Yadav
2016).
As a precaution to ensure that no pre-existing metals compromise with the biofiltration process, the
powdered biosorbent materials were taken trough acid digestion to ensure that any trace amounts of
metals were completely “destroyed” prior to the biofiltration experiment. The edible parts of the
vegetables (i.e. root for carrot, leaf for lettuce, and head for cabbage) were purposively selected in order
to help evaluate the extent to which these edible plants can accumulate the heavy metals, and its
subsequent implications on consumers.
The FAAS results showed that all three vegetables have abilities to adsorb and therefore remove the
three metals from polluted water. The high removal efficiency (95%) recorded for the zinc is consistent
with literature (Moreira et al. 2015; Zwain, Vakili, and Dahlan 2014). The fact that all three biosorbents
behaved similarly with respect to the removal efficiencies of the three metals may indicate similar
chemistry of these adsorbents.
0
10
20
30
40
50
60
70
80
90
100
lettuce cabbage carrots
Per
cent
rem
oval
[%
]
Biosorbent
lead copper zinc
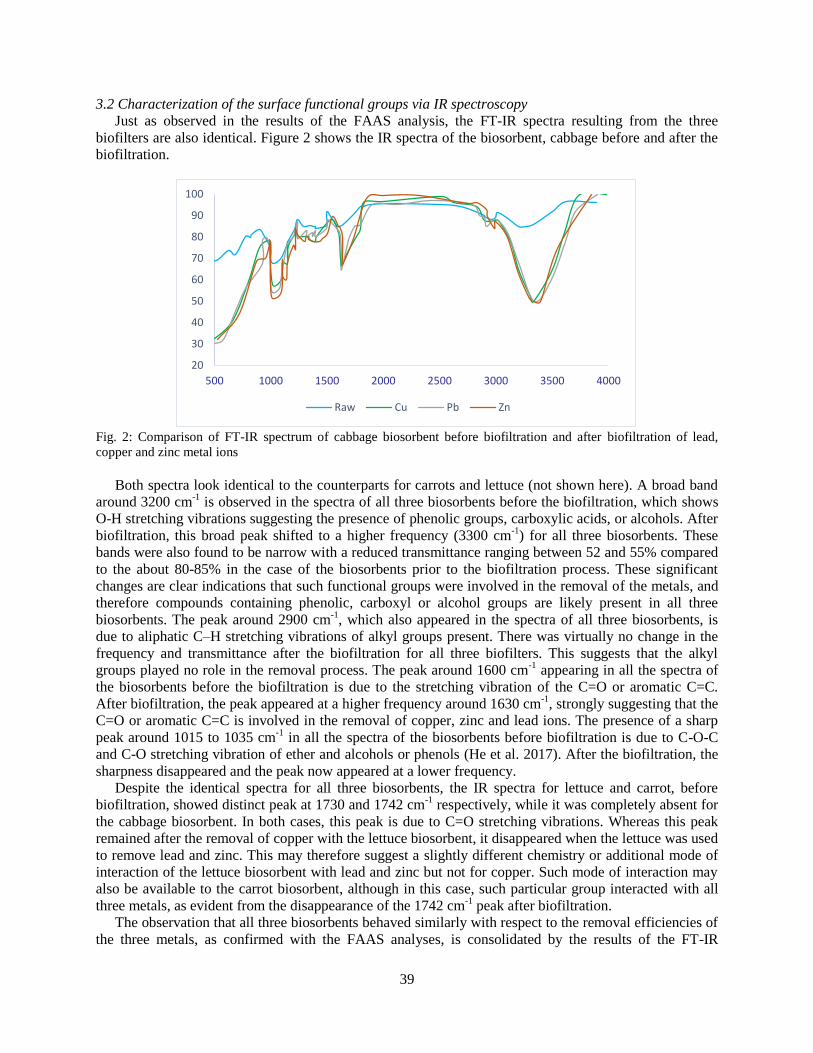
39
3.2 Characterization of the surface functional groups via IR spectroscopy
Just as observed in the results of the FAAS analysis, the FT-IR spectra resulting from the three
biofilters are also identical. Figure 2 shows the IR spectra of the biosorbent, cabbage before and after the
biofiltration.
Fig. 2: Comparison of FT-IR spectrum of cabbage biosorbent before biofiltration and after biofiltration of lead,
copper and zinc metal ions
Both spectra look identical to the counterparts for carrots and lettuce (not shown here). A broad band
around 3200 cm-1
is observed in the spectra of all three biosorbents before the biofiltration, which shows
O-H stretching vibrations suggesting the presence of phenolic groups, carboxylic acids, or alcohols. After
biofiltration, this broad peak shifted to a higher frequency (3300 cm-1
) for all three biosorbents. These
bands were also found to be narrow with a reduced transmittance ranging between 52 and 55% compared
to the about 80-85% in the case of the biosorbents prior to the biofiltration process. These significant
changes are clear indications that such functional groups were involved in the removal of the metals, and
therefore compounds containing phenolic, carboxyl or alcohol groups are likely present in all three
biosorbents. The peak around 2900 cm-1
, which also appeared in the spectra of all three biosorbents, is
due to aliphatic C–H stretching vibrations of alkyl groups present. There was virtually no change in the
frequency and transmittance after the biofiltration for all three biofilters. This suggests that the alkyl
groups played no role in the removal process. The peak around 1600 cm-1
appearing in all the spectra of
the biosorbents before the biofiltration is due to the stretching vibration of the C=O or aromatic C=C.
After biofiltration, the peak appeared at a higher frequency around 1630 cm-1
, strongly suggesting that the
C=O or aromatic C=C is involved in the removal of copper, zinc and lead ions. The presence of a sharp
peak around 1015 to 1035 cm-1
in all the spectra of the biosorbents before biofiltration is due to C-O-C
and C-O stretching vibration of ether and alcohols or phenols (He et al. 2017). After the biofiltration, the
sharpness disappeared and the peak now appeared at a lower frequency.
Despite the identical spectra for all three biosorbents, the IR spectra for lettuce and carrot, before
biofiltration, showed distinct peak at 1730 and 1742 cm-1
respectively, while it was completely absent for
the cabbage biosorbent. In both cases, this peak is due to C=O stretching vibrations. Whereas this peak
remained after the removal of copper with the lettuce biosorbent, it disappeared when the lettuce was used
to remove lead and zinc. This may therefore suggest a slightly different chemistry or additional mode of
interaction of the lettuce biosorbent with lead and zinc but not for copper. Such mode of interaction may
also be available to the carrot biosorbent, although in this case, such particular group interacted with all
three metals, as evident from the disappearance of the 1742 cm-1
peak after biofiltration.
The observation that all three biosorbents behaved similarly with respect to the removal efficiencies of
the three metals, as confirmed with the FAAS analyses, is consolidated by the results of the FT-IR
20
30
40
50
60
70
80
90
100
500 1000 1500 2000 2500 3000 3500 4000
Raw Cu Pb Zn
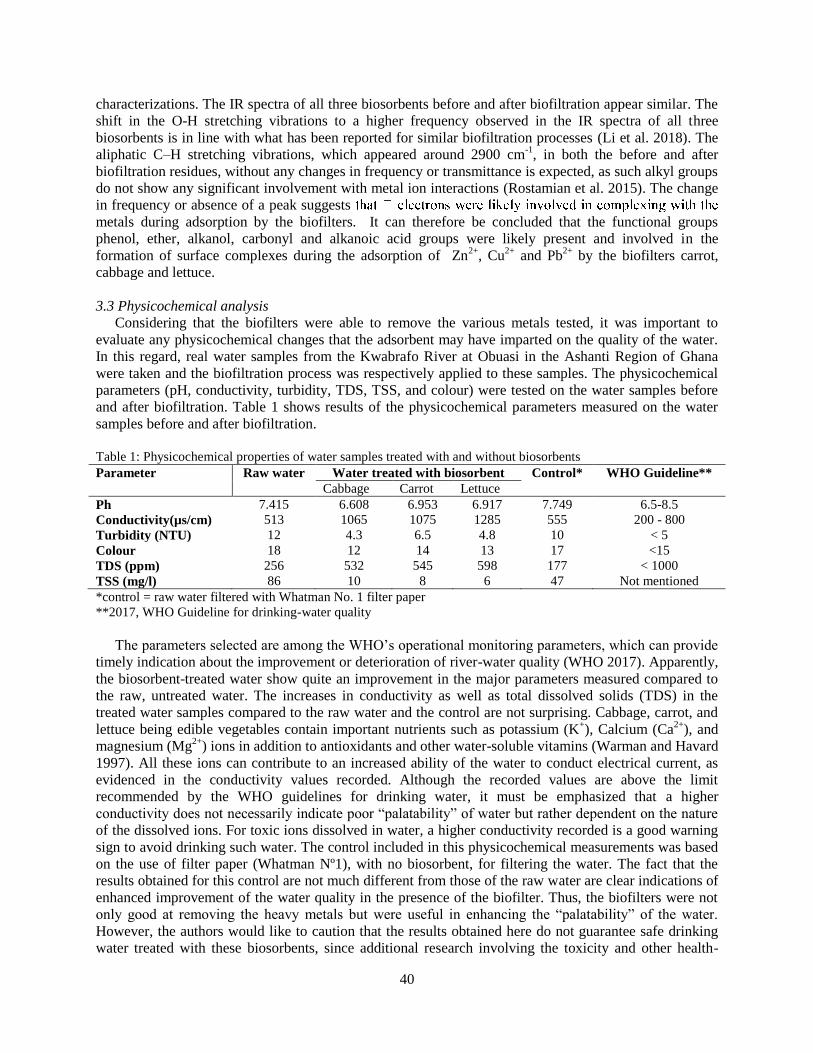
40
characterizations. The IR spectra of all three biosorbents before and after biofiltration appear similar. The
shift in the O-H stretching vibrations to a higher frequency observed in the IR spectra of all three
biosorbents is in line with what has been reported for similar biofiltration processes (Li et al. 2018). The
aliphatic C–H stretching vibrations, which appeared around 2900 cm-1
, in both the before and after
biofiltration residues, without any changes in frequency or transmittance is expected, as such alkyl groups
do not show any significant involvement with metal ion interactions (Rostamian et al. 2015). The change
in frequency or absence of a peak suggests
metals during adsorption by the biofilters. It can therefore be concluded that the functional groups
phenol, ether, alkanol, carbonyl and alkanoic acid groups were likely present and involved in the
formation of surface complexes during the adsorption of Zn2+
, Cu2+
and Pb2+
by the biofilters carrot,
cabbage and lettuce.
3.3 Physicochemical analysis
Considering that the biofilters were able to remove the various metals tested, it was important to
evaluate any physicochemical changes that the adsorbent may have imparted on the quality of the water.
In this regard, real water samples from the Kwabrafo River at Obuasi in the Ashanti Region of Ghana
were taken and the biofiltration process was respectively applied to these samples. The physicochemical
parameters (pH, conductivity, turbidity, TDS, TSS, and colour) were tested on the water samples before
and after biofiltration. Table 1 shows results of the physicochemical parameters measured on the water
samples before and after biofiltration.
Table 1: Physicochemical properties of water samples treated with and without biosorbents
Parameter Raw water Water treated with biosorbent Control* WHO Guideline**
Cabbage Carrot Lettuce
Ph 7.415 6.608 6.953 6.917 7.749 6.5-8.5
Conductivity(µs/cm) 513 1065 1075 1285 555 200 - 800
Turbidity (NTU) 12 4.3 6.5 4.8 10 < 5
Colour 18 12 14 13 17 <15
TDS (ppm) 256 532 545 598 177 < 1000
TSS (mg/l) 86 10 8 6 47 Not mentioned
*control = raw water filtered with Whatman No. 1 filter paper
**2017, WHO Guideline for drinking-water quality
The parameters selected are among the WHO’s operational monitoring parameters, which can provide
timely indication about the improvement or deterioration of river-water quality (WHO 2017). Apparently,
the biosorbent-treated water show quite an improvement in the major parameters measured compared to
the raw, untreated water. The increases in conductivity as well as total dissolved solids (TDS) in the
treated water samples compared to the raw water and the control are not surprising. Cabbage, carrot, and
lettuce being edible vegetables contain important nutrients such as potassium (K+), Calcium (Ca
2+), and
magnesium (Mg2+
) ions in addition to antioxidants and other water-soluble vitamins (Warman and Havard
1997). All these ions can contribute to an increased ability of the water to conduct electrical current, as
evidenced in the conductivity values recorded. Although the recorded values are above the limit
recommended by the WHO guidelines for drinking water, it must be emphasized that a higher
conductivity does not necessarily indicate poor “palatability” of water but rather dependent on the nature
of the dissolved ions. For toxic ions dissolved in water, a higher conductivity recorded is a good warning
sign to avoid drinking such water. The control included in this physicochemical measurements was based
on the use of filter paper (Whatman Nº1), with no biosorbent, for filtering the water. The fact that the
results obtained for this control are not much different from those of the raw water are clear indications of
enhanced improvement of the water quality in the presence of the biofilter. Thus, the biofilters were not
only good at removing the heavy metals but were useful in enhancing the “palatability” of the water.
However, the authors would like to caution that the results obtained here do not guarantee safe drinking
water treated with these biosorbents, since additional research involving the toxicity and other health-
41
related information may be required in order to draw a firm conclusion. The authors are of the view
though that the results discussed in this work will provide significant contribution for future research
aimed at developing effective, low-cost biosorbent materials for treating wastewater for irrigation
purposes.
4. Conclusion
The ability of dried, finely powdered samples of the edible parts of cabbage (head), lettuce (leaves),
and carrot (roots) to be used as biosorbents for the removal of zinc, copper and lead from the aqueous
environment were investigated using water samples artificially contaminated with 100 ppm of the
respective metals. As much as the biosorbents were able to adsorb the metals from solution, the
biosorbents were also applicable for use on river water samples to help improve the overall quality. The
use of the FT-IR to characterize the surface of the biosorbents before and after biofiltration was an
important aspect of this study. Understanding the chemistry involved in the adsorption of these metals
can lead to the development of novel adsorbents that are not only cost-effective but sensitive and selective
towards various toxic metals. This work therefore represents a significant contribution to the search for
efficient and cost-effective adsorbents in wastewater treatment technologies.
5. Acknowledgements
We would like to acknowledge, in no particular order, the help provided by the following individuals
in the data collection; Samuel Sagoe, Theophilus Koshi Asakpo, and Jonathan Opoku, all former students
in the Department of Chemical Sciences at the University of Energy and Natural Resources.
References
Al-Hiyaly, Sedik. 2014. 'Lettuce Leaves as Biosorbent Material to Remove Heavy Metal ions from Industrial
wastewater', J. Baghdad for Sci., 11: 1164-70.
Boamponsem, G. A., Michael Kumi, and Isaiah Debrah. 2012. 'Heavy Metals Accumulation In Cabbage, Lettuce
And Carrot Irrigated With Wastewater From Nagodi Mining Site In Ghana', International Journal of
Science and Technology Research., 1: 124-29.
Chang, C. Y., H. Y. Yu, J. J. Chen, F. B. Li, H. H. Zhang, and C. P. Liu. 2014. 'Accumulation of heavy metals in
leaf vegetables from agricultural soils and associated potential health risks in the Pearl River Delta, South
China', Environmental Monitoring and Assessment, 186: 1547-60.
CHRAJ. 2008. "The state of human rights in mining communities in Ghana." In. Accra :: Commission on Human
Rights & Administrative Justice.
Cobb, George, Kristin Sands, Melissa Waters, Bobby G. Wixson, and Elaine Dorward-King. 2000. 'Accumulation of
heavy metals by vegetables grown in mine wastes', Environmental Toxicology and Chemistry, 19: 600-07.
Delplace, Gauthier, Eva Schreck, Oleg S. Pokrovsky, Cyril Zouiten, Isalyne Blondet, José Darrozes, and Jérôme
Viers. 2020. 'Accumulation of heavy metals in phytoliths from reeds growing on mining environments in
Southern Europe', Science of the Total Environment, 712: 135595.
Fashola, M. O., V. M. Ngole-Jeme, and O. O. Babalola. 2016. 'Heavy Metal Pollution from Gold Mines:
Environmental Effects and Bacterial Strategies for Resistance', Int J Environ Res Public Health, 13.
Gjorgieva Ackova, Darinka. 2018. 'Heavy metals and their general toxicity on plants', Plant Science Today, 5: 14.
He, Pinjing, Qinfang Yu, Hua Zhang, Liming Shao, and Fan Lü. 2017. 'Removal of Copper (II) by Biochar
Mediated by Dissolved Organic Matter', Scientific Reports, 7.
Intawongse, Marisa, and John R. Dean. 2006. 'Uptake of heavy metals by vegetable plants grown on contaminated
soil and their bioavailability in the human gastrointestinal tract', Food Additives & Contaminants, 23: 36-
48.
Intawongse, Marisa, and John R Dean. 2006. 'Uptake of heavy metals by vegetable plants grown on contaminated
soil and their bioavailability in the human gastrointestinal tract', Food additives and contaminants, 23: 36-
48.
Jia, Y., L. Wang, Z. Qu, C. Wang, and Z. Yang. 2017. 'Effects on heavy metal accumulation in freshwater fishes:
species, tissues, and sizes', Environ Sci Pollut Res Int, 24: 9379-86.
42
Khan, S., Q. Cao, Y. M. Zheng, Y. Z. Huang, and Y. G. Zhu. 2008. 'Health risks of heavy metals in contaminated
soils and food crops irrigated with wastewater in Beijing, China', Environmental Pollution, 152: 686-92.
Li, Qiang, Lizhou Tang, Jiang Hu, Ming Jiang, Xiaodong Shi, Tianxi Zhang, Yuan Li, and Xuejun Pan. 2018.
'Removal of toxic metals from aqueous solution by biochars derived from long-root Eichhornia crassipes',
Royal Society Open Science, 5: 180966.
Majumder, Subhajit, and Suresh Gupta. 2010. Biofiltration for Heavy Metals Removal: A State-of-the-art Review.
Malik, Davendra, Chakresh Jain, and Anuj Yadav. 2016. 'Removal of heavy metals from emerging cellulosic low-
cost adsorbents: a review', Applied Water Science.
Moreira, Sarah, Diego Melo, Ari Clecius, Francisco Sousa, André Oliveira, André Oliveira, and Ronaldo
Nascimento. 2015. 'Removal of Ni 2+ , Cu 2+ , Zn 2+ , Cd 2+ and Pb 2+ ions from aqueous solutions using
cashew peduncle bagasse as an eco-friendly biosorbent', Desalination and Water Treatment: 1-14.
Müller, Mario, and Manfred Anke. 1994. 'Distribution of cadmium in the food chain (soil-plant-human) of a
cadmium exposed area and the health risks of the general population', Science of the Total Environment,
156: 151-58.
Mumba, Peter, B. Q. Chibambo, and Wilfred Kadewa. 2008. 'A Comparison of The Levels of Heavy Metals in
Cabbages Irrigated With Reservoir and Tap Water', International Journal of Environmental Research
(ISSN: 1735-6865) Vol 2 Num 1, 2.
Othman, Chra. 2001. 'Heavy metals in green vegetables and soils from vegetable gardens in Dar Es Salaam,
Tanzania', Tanzania Journal of Science, 27.
Rai, Prabhat Kumar, Sang Soo Lee, Ming Zhang, Yiu Fai Tsang, and Ki-Hyun Kim. 2019. 'Heavy metals in food
crops: Health risks, fate, mechanisms, and management', Environment International, 125: 365-85.
Rostamian, R., Manouchehr Heidarpour, Sayed-Farhad Mousavi, and Afyuni Majid. 2015. 'Characterization and
Sodium Sorption Capacity of Biochar and Activated Carbon Prepared from Rice Husk', Journal of
Agricultural Science and Technology, 17: 1057-69.
Schwarzenbach, René, Thomas Egli, Thomas B. Hofstetter, Urs Von Gunten, and Bernhard Wehrli. 2010. 'Global
Water Pollution and Human Health', Ann Rev Environ Resour, 35.
Shi, Zeming, Xinyu Wang, Yue Shi, Shijun Ni, Yunzhen Li, Dewei Wang, and Ruilin Wang. 2018. 'Impact of
intensive mining on the distribution of heavy metals in water and sediment of Anning River, southwest
China', Geochemistry: Exploration, Environment, Analysis, 19: geochem2017-054.
Srivastava, N. K., and C. B. Majumder. 2008. 'Novel biofiltration methods for the treatment of heavy metals from
industrial wastewater', J Hazard Mater, 151: 1-8.
Tchounwou, P. B., C. G. Yedjou, A. K. Patlolla, and D. J. Sutton. 2012. 'Heavy metal toxicity and the environment',
Exp Suppl, 101: 133-64.
Usman, Adel. 2008. 'The relative adsorption selectivities of Pb, Cu, Zn, Cd and Ni by soils developed on shale in
New Valley, Egypt', Geoderma, 144: 334-43.
Valko, M., H. Morris, and M. T. D. Cronin. 2005. 'Metals, Toxicity and Oxidative Stress', Current Medicinal
Chemistry, 12: 1161-208.
Warman, P. R., and K. A. Havard. 1997. 'Yield, vitamin and mineral contents of organically and conventionally
grown carrots and cabbage', Agriculture, Ecosystems & Environment, 61: 155-62.
WHO. 2017. "Guidelines for drinking-water quality: fourth edition incorporating the first addendum." In. Geneva:
World Health Organization.
Wuana, Raymond, and F. E. Okieimen. 2011. 'Heavy metals in contaminated soils: a review of sources, chemistry,
risks and best available strategies for remediation', Int Scholarly Res Network: 1-20.
Zhou, Dong-Mei, Xiu-Zhen Hao, Yu-Jun Wang, Yuan-Hua Dong, and Long Cang. 2005. 'Copper and Zn uptake by
radish and pakchoi as affected by application of livestock and poultry manures', Chemosphere, 59: 167-75.
Zwain, Haider, Mohammadtaghi Vakili, and Irvan Dahlan. 2014. 'Waste Material Adsorbents for Zinc Removal
from Wastewater: A Comprehensive Review', International Journal of Chemical Engineering, 2014: 13.
43
Available online at www.asric.org
ASRIC Journal on Agricultural Sciences 1 (2020) 43-57
a Geography Department, University of Yaounde, Cameroon
Received 19 December 2019; revised 30 January 2020; accepted 30 January 2020
Abstract
Infrastructural incentives constitute a primordial agricultural booster to small farmers in sub-Saharan Africa
(SSA) though many development agencies acclaim tenure security as the main driver for agricultural investment.
In SSA where the bulk of the farmers are smallholders in inaccessible rural areas, basic small-scale on-farm and
off-farm infrastructural incentives remain critical within the productivity, production and market chain
derivatives. This study relied on conceptual insights from different scholars, oral histories captured through
interviews, informants conversations, focus group discussions and field observations to investigate and analyze
the correlation between on-farm and off-farm infrastructural incentives and better rural livelihoods achievements
through smallholder productivity, production and improved food chain marketing systems. The study was carried
out in two and three rural communities in the North West and Centre Regions of Cameroon respectively. Results
show that small farmers generally lack on-farm water infrastructures for irrigation and spraying of crops, and
those that exist were improvised and were often cost and course ineffective. Water stresses were observed to
accentuate with climate change, impacting negatively on crop productivity and production. Storage facilities
were also improvised and no post-harvest washing and cooling infrastructures for fruits and vegetables were
available. Findings equally show that off-farm infrastructures such as roads and transport were a major challenge
to farm produce evacuation and ensuring fluidity in market chains. The study has proposed pathways for
investing in basic small-scale on-farm and off-farm infrastructural incentives in rural Cameroon in order to
address salient issues of smallholders ranging from improved productivity and production for quantitative and
qualitative household food security to poverty reduction.
Keywords: Infrastructural incentives, off-farm infrastructure, on-farm infrastructure, food security, poverty
reduction, small-scale farmers, Cameroon
1. Introduction
Small farmers in the context of this paper are those with farm holdings of two ha or less and in SSA,
they own about 80% of all farms and contribute up to 90% of the production in some SSA countries
(Wiggins, 2009 and Livingston et al. 2011). Infrastructural incentives are guided by the general theory of
incentive, which is grounded on the principle of motivation and suggests that behaviour is subject to a
desire for reinforcement (Ogolo, 1996 and Syed and Miyazako, 2013). The responsiveness of agricultural
1 Corresponding author. Email addresses : [email protected] (E.G. Bachange),
[email protected] (N.D. Mbongsi)
44
reinforcers or enablers or incentives vary widely with geographical regions, an aspect which are yet to
address. Practical application of the theory of incentive in the domain of agriculture has taken an all
global neoclassical economic approach, which has led to confusion and ambivalent outcomes in SSA
(Razavi, 2003).
Incentivizing Agriculture in Sub-Saharan Africa
Agriculture is both an economic and socio-cultural venture, and therefore, requires specific incentives
to fulfil its mission in the different geographic regions of the world. All economic ventures are
inextricably linked to incentives, implying that human behaviours are driven by a desire for reward
(Laffont and Martimort, 2002). Agricultural incentive discourses in Africa keep making headline news at
global and regional levels with two philosophical underpinnings, the pro-land tenure security incentive
school of thought and the pro-rural infrastructure incentive school of thought. Proponents of the land
tenure security incentive option are attuned to a Western and globalized neoclassical economic approach
to agricultural productivity and production, which is ill-adapted in SSA as captured by Steven Lawry.
According to the scholar, many of those who may come from the West assume that land rights
certification, registration or titling are important attributes of any kind of land tenure or property rights
system for agricultural investment (Lawry, 2015).
Studies from across SSA have proven that tenure security is a marginal incentive for agricultural
productivity and production (Townsend, 1999 and Razavi, 2003). In this connection, it has been posited
that a systematic and rigorous exercise, based on internationally-recognized methodologies that generate
indicators comparable across countries and time, is needed to measure the level and trend of policy
support to the agriculture sector (Pernechele, Ghins and Balié, 2018). This study is quite fundamental
given that despite a series of decisions and initiatives by African leaders, including the adoption of the
Maputo Declaration, the Comprehensive Africa Agriculture Development Programme (CAADP) and the
Malabo Declaration to garner and mobilize investment and resources towards agricultural development
(UN, 2017), agriculture is not competitive and food insecurity still reigns in SSA (AfDB, 2019). The
results of such a study will obviously be in consonant with the postulations of Robert E. Townsend in
1999 and Steven Lawry in 2015.
As the driving force of many economies in SSA, agriculture was perceived as the mainstay of
government revenues through heavy taxation. Such taxation in the agricultural sector was estimated to
serve as an incentive for public investment (public services and infrastructure) in rural areas.
Unfortunately that did not happen as up to currently, infrstructural investment remains poor in SSA
(Townsend, 1999) and keep undermining agricultural productivity and production. The scholar intimated
further that if indeed these high taxation levels were complemented with significant public investment as
observed in Asia, then agricultural growth would not have faired so poorly in Africa.
In suggesting incentives for agro-industry investment, Syed and Miyazako (2013) mapped out a
hierarchy of enabling conditions, which consists of essential, important and useful enablers. Among the
essential enablers are land tenure and property rights, infrastructure, and domestic and foreign trade
policy, while the important enablers include norms, standards, regulations and services relating to
production, research and development, and financial services for agro-industries. The useful enablers
include the ease of doing business in a country, the business development services available to
prospective investors, and the general intensity and effectiveness of business linkages between enterprises
in value chains (Syed and Miyazako, 2013). These enablers are macroeconomic constructs in line with
Robert E. Townsend’s approach to agricultural incentives in SSA.
The author emphasized on global price environment, together with the macroeconomic export crop,
food crop and fertilizer where policy diamonds are constructed as incentive indicators. According to the
scholar, the incentive indicators are reflecting the state of macroeconomic (monetary, exchange rate and
fiscal) and agricultural sector policies (on exports, food crops and fertilizers) relative to a perceived
frontier (Townsend, 1999). The macroeconomic policy scores are developed from an aggregate of
monetary, fiscal and exchange rate policies, as in the Adjustment in Africa study (World Bank, 1994)
(Townsend, 1999) and have very little to do with the real incentives of small farmers in SSA where in
45
many of the countries, 10-40% of harvest remains stranded and as much as 89% in Tanzania due to
inadequate supply of transport (Were-Higenyi, 2010).
In this connection, the essential enablers which focus on land tenure and property rights,
infrastructure, and domestic and foreign trade policy, are appealing, though with the exception of
infrastructure, issues of foreign trade policy and land tenure and property rights are less realistic.
Land Tenure-Agricultural Incentive Gap in Sub-Saharan Africa
The euphoria of independence lured African countries to enact pro-tenure security incentive policies
that have so far been responsive to agriculture and rather created disincentives for agricultural investment
and production (Syed and Miyazako, 2013). Since then, many voices are still being raised in support of
individualised tenure based on cadastral treatment and registration of freehold titles considered by
economists and agribusiness partners as an important incentive for agricultural investment. For instance,
the U.S. Agency for International Development (USAID) and the World Bank have recently emphasised
the need to promote freehold tenure with titles and registration as a means to incentivizing owners to use
land efficiently and maximise agricultural production (Barrows and Roth, 1990). Similarly, the
Organisation for Economic Co-operation and Development (OECD), G20, G8 leaders and the New
Partnership for Africa’s Development (NEPAD) are unanimous that private investment is essential if
agriculture is to fulfil its vital function of contributing to economic development, poverty reduction and
food security (OECD, 2013).
Private investment in this respect is alluding to private property rights in terms of land and agricultural
investment, which is associated with tenure security. Tenure security as an incentive for agriculture
investment, works well for those who are non-natives or the urban-rural commuter elite who acquire land
for purely agribusiness purposes and not the small farmer native who operates within the confines of the
concept of bundle of customary land rights (Deininger and Jin, 2006; Deininger and Ali, 2006; Deininger
et al., 2008). This distinction is very important as many studies based on macroeconomic analysis such as
the work of Stéphane Korsaga in 2018, are generic in nature and putting to question many of the
conclusions derived from small samples originating in limited geographical domains which point to the
fact that in SSA, tenure security is a marginal incentive among smallholder farmers. In many countries of
SSA, hardly is there any correlation between land title and long-term investment in smallholder
agriculture as observed among the Kisii-Kenya farmers where smallholders wanted to develop their land
regardless of title to meet subsistence and cash crop needs (Barrows and Roth, 1990). Under the
customary tenure system, to which sub-Saharan Africans adhere, people gain access to land as a social
right, granted by virtue of their membership in a community, and therefore need no other form of security.
Considerable attention has been paid to analysing the security of land tenure and investment in
agriculture. On that score, individualised tenure based on cadastral treatment and registration of freehold
titles, is viewed as a strong agricultural investment incentive for poverty reduction and social well-being
in Africa (Barrows and Roth, 1990). In SSA where the bulk of the farmers are smallholders in
inaccessible rural areas, it is increasingly dawning upon policy makers and researchers that basic small-
scale on-farm and off-farm infrastructural incentives remain critical within the productivity, production
and market chain derivatives. In rural SSA, statutory tenure security has been mistakenly taken for a
major agricultural investment incentive within the scope of smallholder agriculture (Laffont and
Martimort, 2002). Land being a primary input for agriculture (AfDB, 2017), access and accessibility to it
are fundamental (AfDB, OECD&UNDP, 2017), particularly as 61% of the land is non-cultivated, suitable
for cropping, non-forested, non-protected and has low population density (Kagwanja, 2012). Similarly, a
fair share of the 90% of unutilised arable land in SSA is located in areas with limited transport
infrastructure, and therefore, not easily accessible (Were-Higenyi, 2010; Gajigo and Lukoma, 2011 and
Jayne et al. 2014).
In most of rural SSA, communities are predominantly agricultural with exceptionally liberal land
tenure system that operates and only marginally affects both the size of individual farm holdings and the
way the land is cropped (Atteh, 1985). This situation results mainly from the fact that land is perceived as
a God-given entity and therefore it is held in trust for Him and that the population density is very low,
46
with plenty of land to go round. In the present circumstances, large-scale agricultural projects developed
in the Okun area in Nigeria over the last decade have been offered land freely by the people rather than
finding the land tenure system a hinderance (Atteh, 1985).
On-Farm and Off-Farm Infrastructural Incentives
Sustainable agriculture in the world relies on infrastructural incentives. Many scholars have
categorized agricultural infrastructures into three, to wit, road networks, irrigation technology and post-
harvest storage technology (Gajigo and Lukoma, 2011), and capital intensive (irrigation, roads, bridges),
capital extensive (extension services) and institutional infrastructure such as formal and informal
institutions (Wharton, 1967 and Patel, 2010). The different categorizations point to the fact that
agricultural infrastructure, both on-farm and off-farm, have the potential to transform existing traditional
agriculture or subsistence farming into a most modern, commercial and dynamic farming system (Patel,
2010). On that score, agricultural infrastructure comprises all those activities and facilities which help to
sustain the growth in production and income generation in the rest of the economy rather than production
and income generation within the infrastructure enterprises themselves (Bhatia, 1999). This dichotomy is
still not clear even within the European Union (EU) as the issue of whether rural development policy
should serve the needs of farmers or of broader civil society in rural areas is a continuing source of
tension in formulating rural development policy (Matthews, 2004). The small farmer on-farm and off-
farm infrastructural incentives in SSA are equally impacted by these policy discourses in Europe, which
remain unclear and are compounded by emphasis on tenure security.
So far in SSA, the tendency has been to focus on agricultural infrastructures that boost production and
productivity without regards to those infrastructures that allow for easy evacuation of farm produce to
homes and markets. Boosting agricultural production and productivity is one phase and farm produce
reaching the needy population and in good condition is another. In SSA, the challenge of infrastructural
incentives for smallholder farmers is not only limited to on-farm infrastructure, off-farm infrastructure
such as roads serve as one barrier facing small farmers in terms of distribution and market access (Njara,
2017). From the time the wind of independence started blowing across Africa till now, a plethora of
agricultural policies have been adopted at global, regional and country levels without the smallholder
farmers in SSA gaining access to on-farm and off-farm infrastructure. These policies and initiatives such
as the Presidential Infrastructure Champion Initiative (PICI) projects following the adoption of the Dakar
Agenda for Action in June 2014 and the launch of the Continental Business Network as well as the
MoveAfrica initiative seem to bear an infrastructural missing link vis-à-vis the small farmer in SSA.
Corroborating this assertion, Njara (2017) opined that lack of access to post-harvest storage (store-rooms
and cold-rooms to keep their products in good condition after harvest) and processing facilities constitutes
a barrier to entry into agricultural markets, since buyers are preoccupied with quality.
In most countries in SSA, agriculture is not only the largest contributor to gross domestic product
(GDP), but also provides employment and livelihood for a significant proportion of the population
(AfDB, 2019 and FAO, 2012). It has been observed that adequate infrastructural support to farmers is a
pre-requisite for accelerated productivity and production as well as guarantees fluidity in market chains
and lower the unit cost in the production activities (FAO, 2012 and Bhatia, 1999). Unfortunately, these
infrastructural incentives, which are actually public services that facilitate production, procurement,
processing, preservation and trade (Munyanyi, 2013 and Njobe & Kaaria, 2015) remain critical in SSA
(FAO, 2012). Studies have shown that the overall level of agricultural infrastructure development in most
countries in SSA is lower than that of other regions of the world, making it the lead impediment to
agricultural productivity (FAO, 2012).
In this region, greater attention is often paid to those agricultural incentives such as land tenure
security, removal of domestic trade barriers, improvement of access to foreign markets, coping with
international commodity price decline and fluctuations and removal of excessive agricultural taxation,
which in reality insufficiently cover the issues at hand (Njobe & Kaaria, 2015and Gajigo and Lukoma,
2011). For instance, Agenda 2063 calls on African countries to transform agriculture and industrialize
their economies, including by modernizing agriculture and agro-business through value-addition and
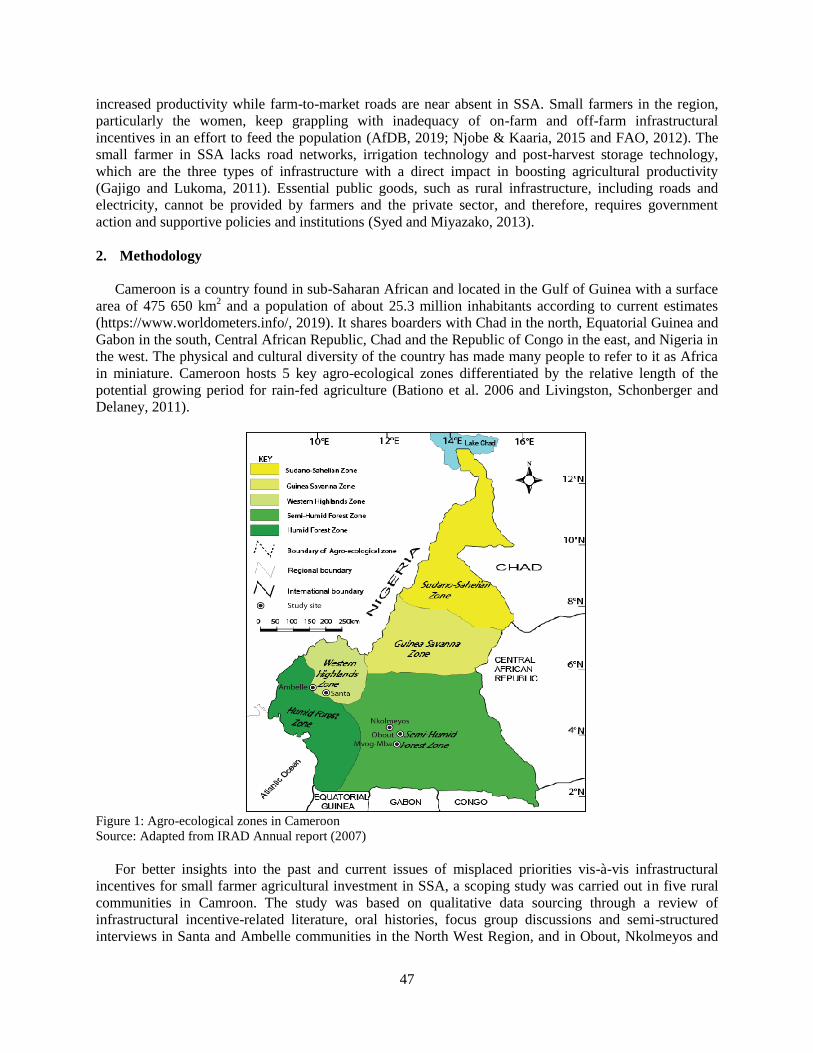
47
increased productivity while farm-to-market roads are near absent in SSA. Small farmers in the region,
particularly the women, keep grappling with inadequacy of on-farm and off-farm infrastructural
incentives in an effort to feed the population (AfDB, 2019; Njobe & Kaaria, 2015 and FAO, 2012). The
small farmer in SSA lacks road networks, irrigation technology and post-harvest storage technology,
which are the three types of infrastructure with a direct impact in boosting agricultural productivity
(Gajigo and Lukoma, 2011). Essential public goods, such as rural infrastructure, including roads and
electricity, cannot be provided by farmers and the private sector, and therefore, requires government
action and supportive policies and institutions (Syed and Miyazako, 2013).
2. Methodology
Cameroon is a country found in sub-Saharan African and located in the Gulf of Guinea with a surface
area of 475 650 km2 and a population of about 25.3 million inhabitants according to current estimates
(https://www.worldometers.info/, 2019). It shares boarders with Chad in the north, Equatorial Guinea and
Gabon in the south, Central African Republic, Chad and the Republic of Congo in the east, and Nigeria in
the west. The physical and cultural diversity of the country has made many people to refer to it as Africa
in miniature. Cameroon hosts 5 key agro-ecological zones differentiated by the relative length of the
potential growing period for rain-fed agriculture (Bationo et al. 2006 and Livingston, Schonberger and
Delaney, 2011).
Figure 1: Agro-ecological zones in Cameroon
Source: Adapted from IRAD Annual report (2007)
For better insights into the past and current issues of misplaced priorities vis-à-vis infrastructural
incentives for small farmer agricultural investment in SSA, a scoping study was carried out in five rural
communities in Camroon. The study was based on qualitative data sourcing through a review of
infrastructural incentive-related literature, oral histories, focus group discussions and semi-structured
interviews in Santa and Ambelle communities in the North West Region, and in Obout, Nkolmeyos and
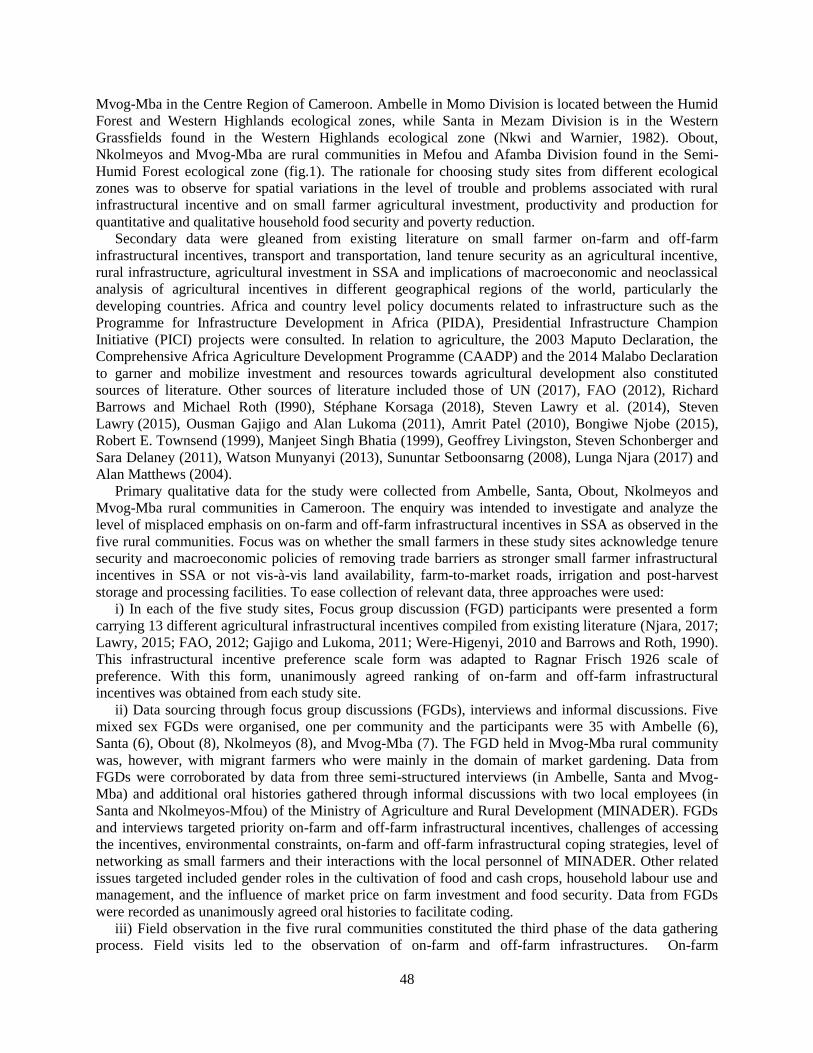
48
Mvog-Mba in the Centre Region of Cameroon. Ambelle in Momo Division is located between the Humid
Forest and Western Highlands ecological zones, while Santa in Mezam Division is in the Western
Grassfields found in the Western Highlands ecological zone (Nkwi and Warnier, 1982). Obout,
Nkolmeyos and Mvog-Mba are rural communities in Mefou and Afamba Division found in the Semi-
Humid Forest ecological zone (fig.1). The rationale for choosing study sites from different ecological
zones was to observe for spatial variations in the level of trouble and problems associated with rural
infrastructural incentive and on small farmer agricultural investment, productivity and production for
quantitative and qualitative household food security and poverty reduction.
Secondary data were gleaned from existing literature on small farmer on-farm and off-farm
infrastructural incentives, transport and transportation, land tenure security as an agricultural incentive,
rural infrastructure, agricultural investment in SSA and implications of macroeconomic and neoclassical
analysis of agricultural incentives in different geographical regions of the world, particularly the
developing countries. Africa and country level policy documents related to infrastructure such as the
Programme for Infrastructure Development in Africa (PIDA), Presidential Infrastructure Champion
Initiative (PICI) projects were consulted. In relation to agriculture, the 2003 Maputo Declaration, the
Comprehensive Africa Agriculture Development Programme (CAADP) and the 2014 Malabo Declaration
to garner and mobilize investment and resources towards agricultural development also constituted
sources of literature. Other sources of literature included those of UN (2017), FAO (2012), Richard
Barrows and Michael Roth (I990), Stéphane Korsaga (2018), Steven Lawry et al. (2014), Steven
Lawry (2015), Ousman Gajigo and Alan Lukoma (2011), Amrit Patel (2010), Bongiwe Njobe (2015),
Robert E. Townsend (1999), Manjeet Singh Bhatia (1999), Geoffrey Livingston, Steven Schonberger and
Sara Delaney (2011), Watson Munyanyi (2013), Sununtar Setboonsarng (2008), Lunga Njara (2017) and
Alan Matthews (2004).
Primary qualitative data for the study were collected from Ambelle, Santa, Obout, Nkolmeyos and
Mvog-Mba rural communities in Cameroon. The enquiry was intended to investigate and analyze the
level of misplaced emphasis on on-farm and off-farm infrastructural incentives in SSA as observed in the
five rural communities. Focus was on whether the small farmers in these study sites acknowledge tenure
security and macroeconomic policies of removing trade barriers as stronger small farmer infrastructural
incentives in SSA or not vis-à-vis land availability, farm-to-market roads, irrigation and post-harvest
storage and processing facilities. To ease collection of relevant data, three approaches were used:
i) In each of the five study sites, Focus group discussion (FGD) participants were presented a form
carrying 13 different agricultural infrastructural incentives compiled from existing literature (Njara, 2017;
Lawry, 2015; FAO, 2012; Gajigo and Lukoma, 2011; Were-Higenyi, 2010 and Barrows and Roth, 1990).
This infrastructural incentive preference scale form was adapted to Ragnar Frisch 1926 scale of
preference. With this form, unanimously agreed ranking of on-farm and off-farm infrastructural
incentives was obtained from each study site.
ii) Data sourcing through focus group discussions (FGDs), interviews and informal discussions. Five
mixed sex FGDs were organised, one per community and the participants were 35 with Ambelle (6),
Santa (6), Obout (8), Nkolmeyos (8), and Mvog-Mba (7). The FGD held in Mvog-Mba rural community
was, however, with migrant farmers who were mainly in the domain of market gardening. Data from
FGDs were corroborated by data from three semi-structured interviews (in Ambelle, Santa and Mvog-
Mba) and additional oral histories gathered through informal discussions with two local employees (in
Santa and Nkolmeyos-Mfou) of the Ministry of Agriculture and Rural Development (MINADER). FGDs
and interviews targeted priority on-farm and off-farm infrastructural incentives, challenges of accessing
the incentives, environmental constraints, on-farm and off-farm infrastructural coping strategies, level of
networking as small farmers and their interactions with the local personnel of MINADER. Other related
issues targeted included gender roles in the cultivation of food and cash crops, household labour use and
management, and the influence of market price on farm investment and food security. Data from FGDs
were recorded as unanimously agreed oral histories to facilitate coding.
iii) Field observation in the five rural communities constituted the third phase of the data gathering
process. Field visits led to the observation of on-farm and off-farm infrastructures. On-farm
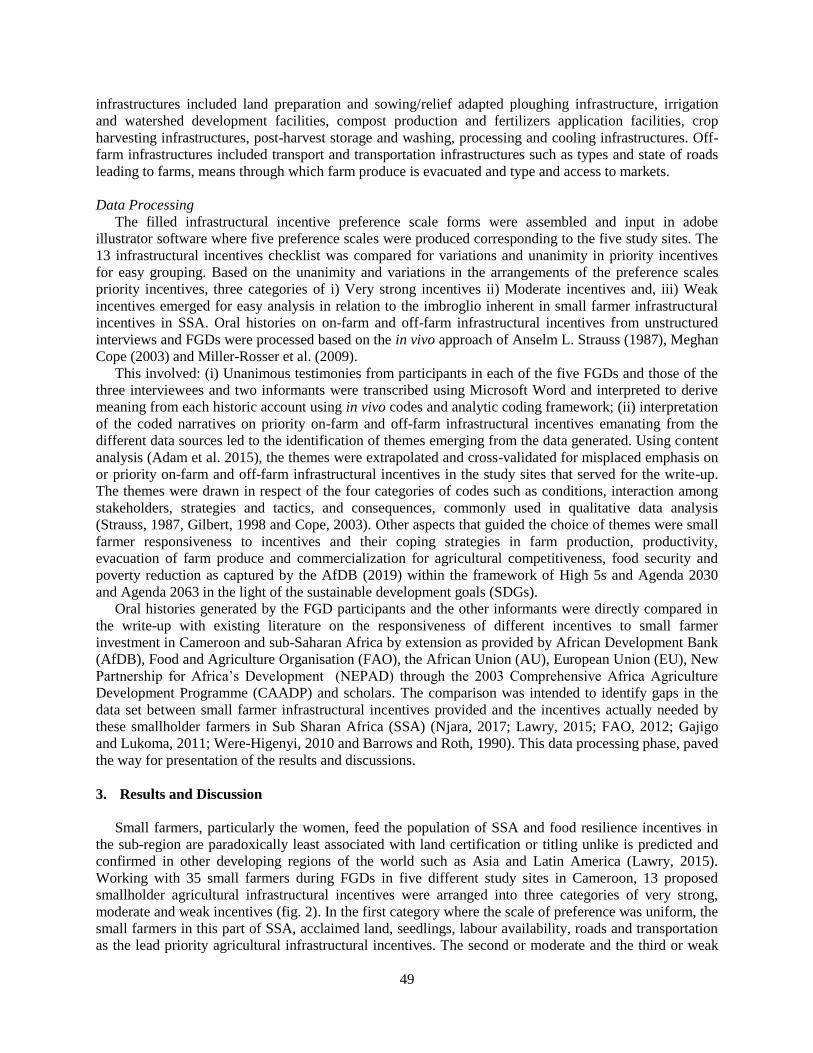
49
infrastructures included land preparation and sowing/relief adapted ploughing infrastructure, irrigation
and watershed development facilities, compost production and fertilizers application facilities, crop
harvesting infrastructures, post-harvest storage and washing, processing and cooling infrastructures. Off-
farm infrastructures included transport and transportation infrastructures such as types and state of roads
leading to farms, means through which farm produce is evacuated and type and access to markets.
Data Processing
The filled infrastructural incentive preference scale forms were assembled and input in adobe
illustrator software where five preference scales were produced corresponding to the five study sites. The
13 infrastructural incentives checklist was compared for variations and unanimity in priority incentives
for easy grouping. Based on the unanimity and variations in the arrangements of the preference scales
priority incentives, three categories of i) Very strong incentives ii) Moderate incentives and, iii) Weak
incentives emerged for easy analysis in relation to the imbroglio inherent in small farmer infrastructural
incentives in SSA. Oral histories on on-farm and off-farm infrastructural incentives from unstructured
interviews and FGDs were processed based on the in vivo approach of Anselm L. Strauss (1987), Meghan
Cope (2003) and Miller-Rosser et al. (2009).
This involved: (i) Unanimous testimonies from participants in each of the five FGDs and those of the
three interviewees and two informants were transcribed using Microsoft Word and interpreted to derive
meaning from each historic account using in vivo codes and analytic coding framework; (ii) interpretation
of the coded narratives on priority on-farm and off-farm infrastructural incentives emanating from the
different data sources led to the identification of themes emerging from the data generated. Using content
analysis (Adam et al. 2015), the themes were extrapolated and cross-validated for misplaced emphasis on
or priority on-farm and off-farm infrastructural incentives in the study sites that served for the write-up.
The themes were drawn in respect of the four categories of codes such as conditions, interaction among
stakeholders, strategies and tactics, and consequences, commonly used in qualitative data analysis
(Strauss, 1987, Gilbert, 1998 and Cope, 2003). Other aspects that guided the choice of themes were small
farmer responsiveness to incentives and their coping strategies in farm production, productivity,
evacuation of farm produce and commercialization for agricultural competitiveness, food security and
poverty reduction as captured by the AfDB (2019) within the framework of High 5s and Agenda 2030
and Agenda 2063 in the light of the sustainable development goals (SDGs).
Oral histories generated by the FGD participants and the other informants were directly compared in
the write-up with existing literature on the responsiveness of different incentives to small farmer
investment in Cameroon and sub-Saharan Africa by extension as provided by African Development Bank
(AfDB), Food and Agriculture Organisation (FAO), the African Union (AU), European Union (EU), New
Partnership for Africa’s Development (NEPAD) through the 2003 Comprehensive Africa Agriculture
Development Programme (CAADP) and scholars. The comparison was intended to identify gaps in the
data set between small farmer infrastructural incentives provided and the incentives actually needed by
these smallholder farmers in Sub Sharan Africa (SSA) (Njara, 2017; Lawry, 2015; FAO, 2012; Gajigo
and Lukoma, 2011; Were-Higenyi, 2010 and Barrows and Roth, 1990). This data processing phase, paved
the way for presentation of the results and discussions.
3. Results and Discussion
Small farmers, particularly the women, feed the population of SSA and food resilience incentives in
the sub-region are paradoxically least associated with land certification or titling unlike is predicted and
confirmed in other developing regions of the world such as Asia and Latin America (Lawry, 2015).
Working with 35 small farmers during FGDs in five different study sites in Cameroon, 13 proposed
smallholder agricultural infrastructural incentives were arranged into three categories of very strong,
moderate and weak incentives (fig. 2). In the first category where the scale of preference was uniform, the
small farmers in this part of SSA, acclaimed land, seedlings, labour availability, roads and transportation
as the lead priority agricultural infrastructural incentives. The second or moderate and the third or weak
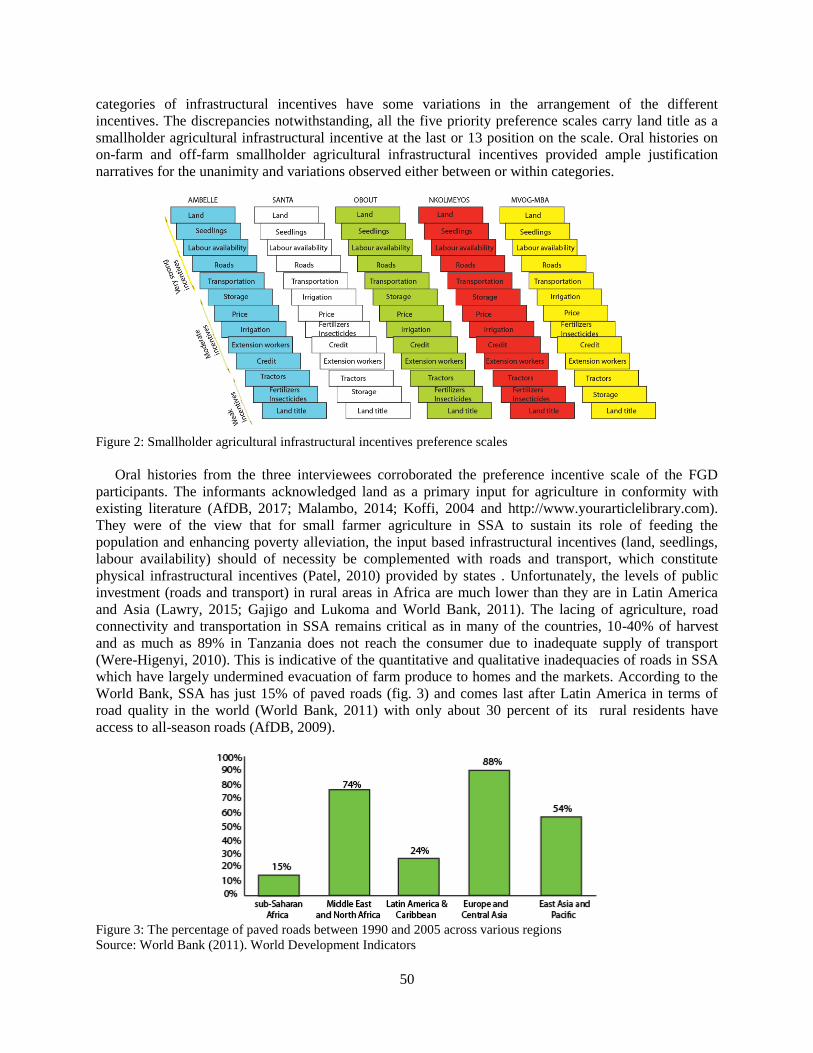
50
categories of infrastructural incentives have some variations in the arrangement of the different
incentives. The discrepancies notwithstanding, all the five priority preference scales carry land title as a
smallholder agricultural infrastructural incentive at the last or 13 position on the scale. Oral histories on
on-farm and off-farm smallholder agricultural infrastructural incentives provided ample justification
narratives for the unanimity and variations observed either between or within categories.
Figure 2: Smallholder agricultural infrastructural incentives preference scales
Oral histories from the three interviewees corroborated the preference incentive scale of the FGD
participants. The informants acknowledged land as a primary input for agriculture in conformity with
existing literature (AfDB, 2017; Malambo, 2014; Koffi, 2004 and http://www.yourarticlelibrary.com).
They were of the view that for small farmer agriculture in SSA to sustain its role of feeding the
population and enhancing poverty alleviation, the input based infrastructural incentives (land, seedlings,
labour availability) should of necessity be complemented with roads and transport, which constitute
physical infrastructural incentives (Patel, 2010) provided by states . Unfortunately, the levels of public
investment (roads and transport) in rural areas in Africa are much lower than they are in Latin America
and Asia (Lawry, 2015; Gajigo and Lukoma and World Bank, 2011). The lacing of agriculture, road
connectivity and transportation in SSA remains critical as in many of the countries, 10-40% of harvest
and as much as 89% in Tanzania does not reach the consumer due to inadequate supply of transport
(Were-Higenyi, 2010). This is indicative of the quantitative and qualitative inadequacies of roads in SSA
which have largely undermined evacuation of farm produce to homes and the markets. According to the
World Bank, SSA has just 15% of paved roads (fig. 3) and comes last after Latin America in terms of
road quality in the world (World Bank, 2011) with only about 30 percent of its rural residents have
access to all-season roads (AfDB, 2009).
Figure 3: The percentage of paved roads between 1990 and 2005 across various regions
Source: World Bank (2011). World Development Indicators
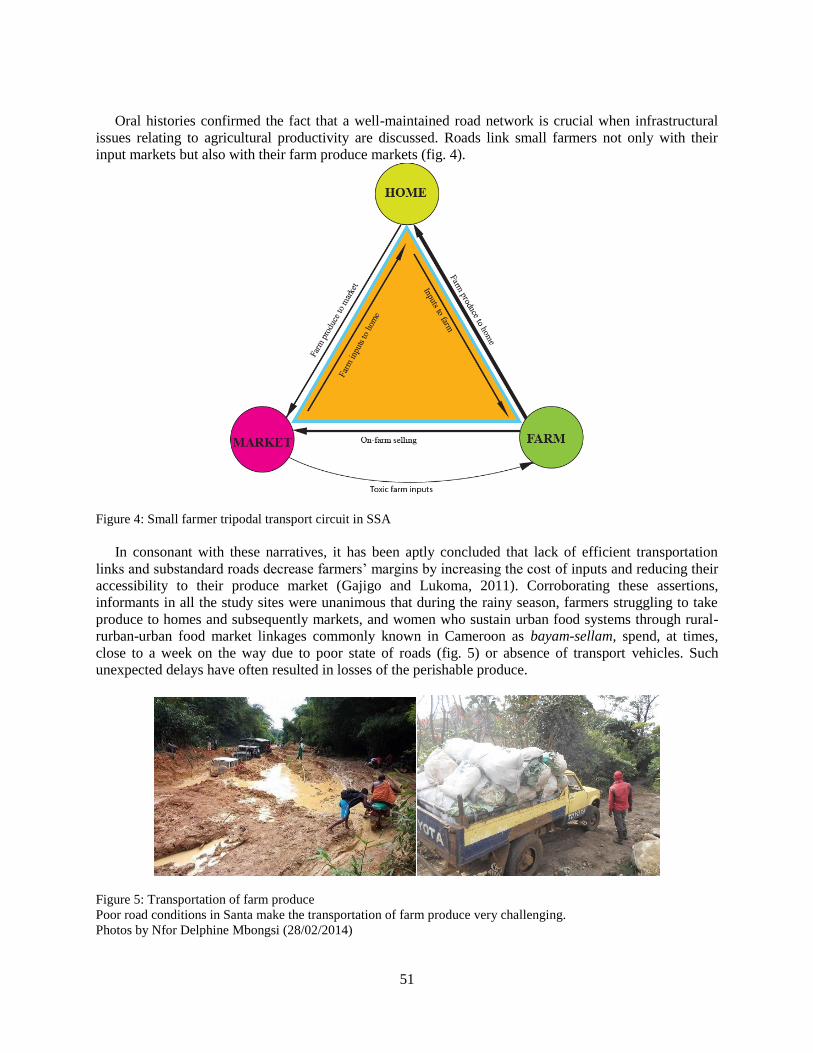
51
Oral histories confirmed the fact that a well-maintained road network is crucial when infrastructural
issues relating to agricultural productivity are discussed. Roads link small farmers not only with their
input markets but also with their farm produce markets (fig. 4).
Figure 4: Small farmer tripodal transport circuit in SSA
In consonant with these narratives, it has been aptly concluded that lack of efficient transportation
links and substandard roads decrease farmers’ margins by increasing the cost of inputs and reducing their
accessibility to their produce market (Gajigo and Lukoma, 2011). Corroborating these assertions,
informants in all the study sites were unanimous that during the rainy season, farmers struggling to take
produce to homes and subsequently markets, and women who sustain urban food systems through rural-
rurban-urban food market linkages commonly known in Cameroon as bayam-sellam, spend, at times,
close to a week on the way due to poor state of roads (fig. 5) or absence of transport vehicles. Such
unexpected delays have often resulted in losses of the perishable produce.
Figure 5: Transportation of farm produce
Poor road conditions in Santa make the transportation of farm produce very challenging.
Photos by Nfor Delphine Mbongsi (28/02/2014)
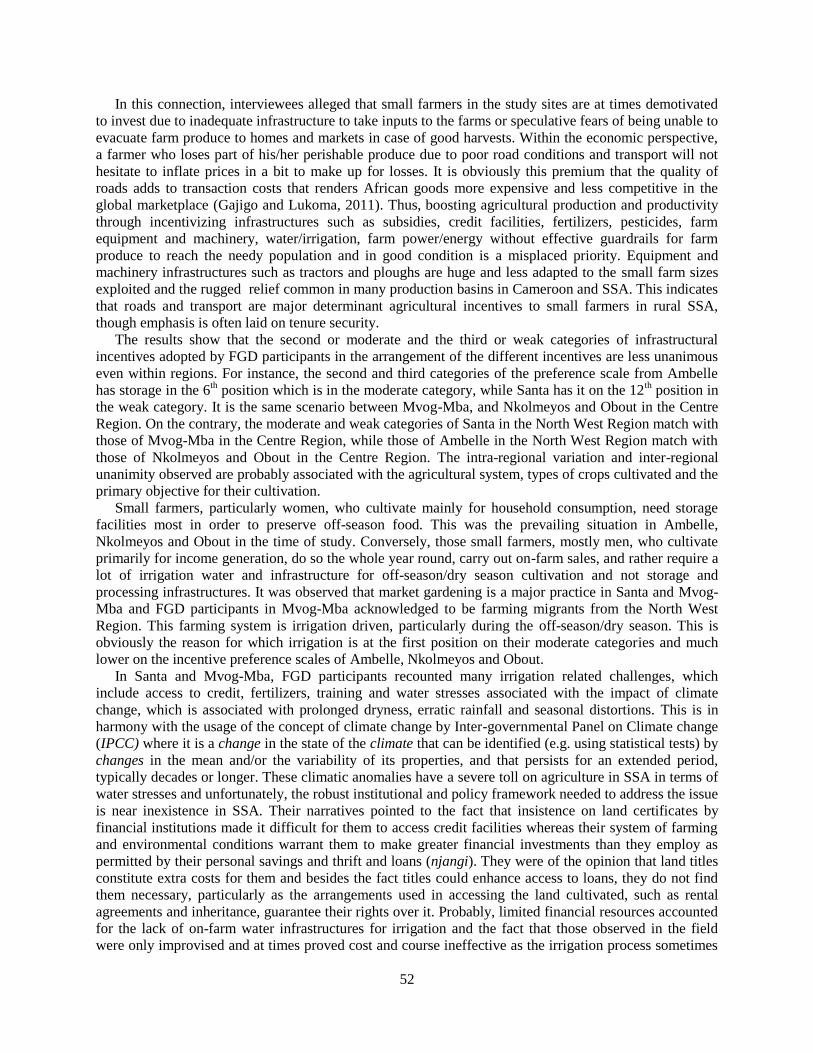
52
In this connection, interviewees alleged that small farmers in the study sites are at times demotivated
to invest due to inadequate infrastructure to take inputs to the farms or speculative fears of being unable to
evacuate farm produce to homes and markets in case of good harvests. Within the economic perspective,
a farmer who loses part of his/her perishable produce due to poor road conditions and transport will not
hesitate to inflate prices in a bit to make up for losses. It is obviously this premium that the quality of
roads adds to transaction costs that renders African goods more expensive and less competitive in the
global marketplace (Gajigo and Lukoma, 2011). Thus, boosting agricultural production and productivity
through incentivizing infrastructures such as subsidies, credit facilities, fertilizers, pesticides, farm
equipment and machinery, water/irrigation, farm power/energy without effective guardrails for farm
produce to reach the needy population and in good condition is a misplaced priority. Equipment and
machinery infrastructures such as tractors and ploughs are huge and less adapted to the small farm sizes
exploited and the rugged relief common in many production basins in Cameroon and SSA. This indicates
that roads and transport are major determinant agricultural incentives to small farmers in rural SSA,
though emphasis is often laid on tenure security.
The results show that the second or moderate and the third or weak categories of infrastructural
incentives adopted by FGD participants in the arrangement of the different incentives are less unanimous
even within regions. For instance, the second and third categories of the preference scale from Ambelle
has storage in the 6th position which is in the moderate category, while Santa has it on the 12
th position in
the weak category. It is the same scenario between Mvog-Mba, and Nkolmeyos and Obout in the Centre
Region. On the contrary, the moderate and weak categories of Santa in the North West Region match with
those of Mvog-Mba in the Centre Region, while those of Ambelle in the North West Region match with
those of Nkolmeyos and Obout in the Centre Region. The intra-regional variation and inter-regional
unanimity observed are probably associated with the agricultural system, types of crops cultivated and the
primary objective for their cultivation.
Small farmers, particularly women, who cultivate mainly for household consumption, need storage
facilities most in order to preserve off-season food. This was the prevailing situation in Ambelle,
Nkolmeyos and Obout in the time of study. Conversely, those small farmers, mostly men, who cultivate
primarily for income generation, do so the whole year round, carry out on-farm sales, and rather require a
lot of irrigation water and infrastructure for off-season/dry season cultivation and not storage and
processing infrastructures. It was observed that market gardening is a major practice in Santa and Mvog-
Mba and FGD participants in Mvog-Mba acknowledged to be farming migrants from the North West
Region. This farming system is irrigation driven, particularly during the off-season/dry season. This is
obviously the reason for which irrigation is at the first position on their moderate categories and much
lower on the incentive preference scales of Ambelle, Nkolmeyos and Obout.
In Santa and Mvog-Mba, FGD participants recounted many irrigation related challenges, which
include access to credit, fertilizers, training and water stresses associated with the impact of climate
change, which is associated with prolonged dryness, erratic rainfall and seasonal distortions. This is in
harmony with the usage of the concept of climate change by Inter-governmental Panel on Climate change
(IPCC) where it is a change in the state of the climate that can be identified (e.g. using statistical tests) by
changes in the mean and/or the variability of its properties, and that persists for an extended period,
typically decades or longer. These climatic anomalies have a severe toll on agriculture in SSA in terms of
water stresses and unfortunately, the robust institutional and policy framework needed to address the issue
is near inexistence in SSA. Their narratives pointed to the fact that insistence on land certificates by
financial institutions made it difficult for them to access credit facilities whereas their system of farming
and environmental conditions warrant them to make greater financial investments than they employ as
permitted by their personal savings and thrift and loans (njangi). They were of the opinion that land titles
constitute extra costs for them and besides the fact titles could enhance access to loans, they do not find
them necessary, particularly as the arrangements used in accessing the land cultivated, such as rental
agreements and inheritance, guarantee their rights over it. Probably, limited financial resources accounted
for the lack of on-farm water infrastructures for irrigation and the fact that those observed in the field
were only improvised and at times proved cost and course ineffective as the irrigation process sometimes
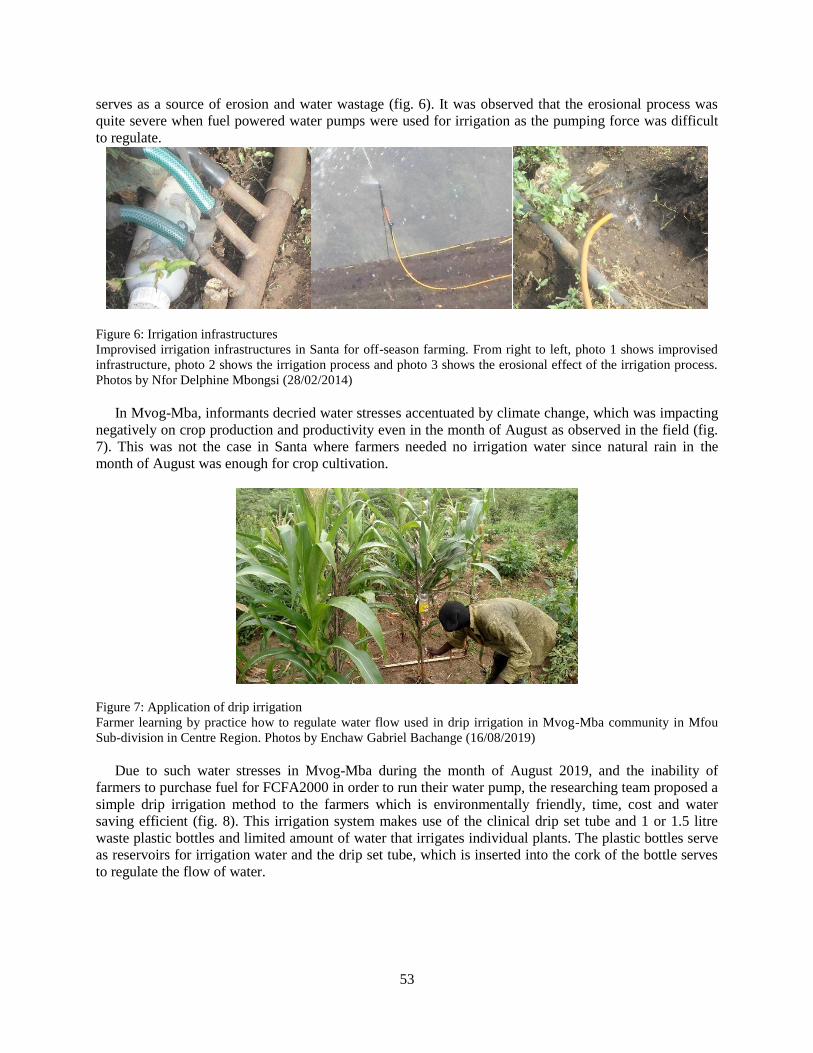
53
serves as a source of erosion and water wastage (fig. 6). It was observed that the erosional process was
quite severe when fuel powered water pumps were used for irrigation as the pumping force was difficult
to regulate.
Figure 6: Irrigation infrastructures
Improvised irrigation infrastructures in Santa for off-season farming. From right to left, photo 1 shows improvised
infrastructure, photo 2 shows the irrigation process and photo 3 shows the erosional effect of the irrigation process.
Photos by Nfor Delphine Mbongsi (28/02/2014)
In Mvog-Mba, informants decried water stresses accentuated by climate change, which was impacting
negatively on crop production and productivity even in the month of August as observed in the field (fig.
7). This was not the case in Santa where farmers needed no irrigation water since natural rain in the
month of August was enough for crop cultivation.
Figure 7: Application of drip irrigation
Farmer learning by practice how to regulate water flow used in drip irrigation in Mvog-Mba community in Mfou
Sub-division in Centre Region. Photos by Enchaw Gabriel Bachange (16/08/2019)
Due to such water stresses in Mvog-Mba during the month of August 2019, and the inability of
farmers to purchase fuel for FCFA2000 in order to run their water pump, the researching team proposed a
simple drip irrigation method to the farmers which is environmentally friendly, time, cost and water
saving efficient (fig. 8). This irrigation system makes use of the clinical drip set tube and 1 or 1.5 litre
waste plastic bottles and limited amount of water that irrigates individual plants. The plastic bottles serve
as reservoirs for irrigation water and the drip set tube, which is inserted into the cork of the bottle serves
to regulate the flow of water.
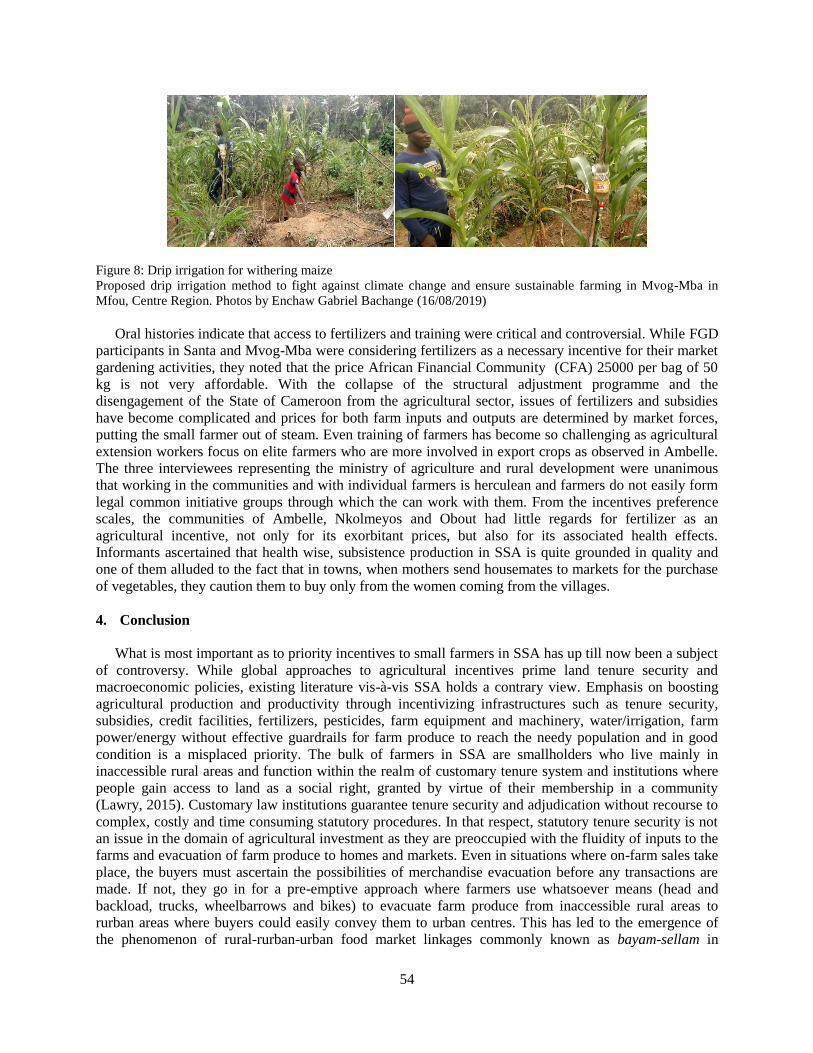
54
Figure 8: Drip irrigation for withering maize
Proposed drip irrigation method to fight against climate change and ensure sustainable farming in Mvog-Mba in
Mfou, Centre Region. Photos by Enchaw Gabriel Bachange (16/08/2019)
Oral histories indicate that access to fertilizers and training were critical and controversial. While FGD
participants in Santa and Mvog-Mba were considering fertilizers as a necessary incentive for their market
gardening activities, they noted that the price African Financial Community (CFA) 25000 per bag of 50
kg is not very affordable. With the collapse of the structural adjustment programme and the
disengagement of the State of Cameroon from the agricultural sector, issues of fertilizers and subsidies
have become complicated and prices for both farm inputs and outputs are determined by market forces,
putting the small farmer out of steam. Even training of farmers has become so challenging as agricultural
extension workers focus on elite farmers who are more involved in export crops as observed in Ambelle.
The three interviewees representing the ministry of agriculture and rural development were unanimous
that working in the communities and with individual farmers is herculean and farmers do not easily form
legal common initiative groups through which the can work with them. From the incentives preference
scales, the communities of Ambelle, Nkolmeyos and Obout had little regards for fertilizer as an
agricultural incentive, not only for its exorbitant prices, but also for its associated health effects.
Informants ascertained that health wise, subsistence production in SSA is quite grounded in quality and
one of them alluded to the fact that in towns, when mothers send housemates to markets for the purchase
of vegetables, they caution them to buy only from the women coming from the villages.
4. Conclusion
What is most important as to priority incentives to small farmers in SSA has up till now been a subject
of controversy. While global approaches to agricultural incentives prime land tenure security and
macroeconomic policies, existing literature vis-à-vis SSA holds a contrary view. Emphasis on boosting
agricultural production and productivity through incentivizing infrastructures such as tenure security,
subsidies, credit facilities, fertilizers, pesticides, farm equipment and machinery, water/irrigation, farm
power/energy without effective guardrails for farm produce to reach the needy population and in good
condition is a misplaced priority. The bulk of farmers in SSA are smallholders who live mainly in
inaccessible rural areas and function within the realm of customary tenure system and institutions where
people gain access to land as a social right, granted by virtue of their membership in a community
(Lawry, 2015). Customary law institutions guarantee tenure security and adjudication without recourse to
complex, costly and time consuming statutory procedures. In that respect, statutory tenure security is not
an issue in the domain of agricultural investment as they are preoccupied with the fluidity of inputs to the
farms and evacuation of farm produce to homes and markets. Even in situations where on-farm sales take
place, the buyers must ascertain the possibilities of merchandise evacuation before any transactions are
made. If not, they go in for a pre-emptive approach where farmers use whatsoever means (head and
backload, trucks, wheelbarrows and bikes) to evacuate farm produce from inaccessible rural areas to
rurban areas where buyers could easily convey them to urban centres. This has led to the emergence of
the phenomenon of rural-rurban-urban food market linkages commonly known as bayam-sellam in
55
Cameroon. The underpinning factor here is accessibility (transport and transportation) and if a farmer
knows apriori that he/she will lose as much as 40% of harvest due to inability to take the farm produce to
home or market (Were-Higenyi, 2010), then, the level of input investment will be affected. The quest for
farm produce evacuation has been observed to be the driving force behind unprecedented unplanned
pioneer fronts in most of SSA after logging activities wind off in an area.
A small farmer incentivizing policy shift is therefore indispensable in SSA for policy and reality to
coincide. Infrastructural incentives constitute a primordial agricultural booster to small farmers in SSA
rather than registration of titles. It has been said, where a road passes, development follows. The
precarious state of transport and transportation in SSA is a reflection of the general characteristics of on-
farm and off-farm infrastructure in the sub-region. At the level of the small farmer, on-farm and off-farm
infrastructure are only improvised. In addition, with the disengagement of states from the agricultural
sector since the collapse of the structural adjustment programmes in the 1980s, effort to stimulate rural
infrastructural development is rather dwindling. This has a bearing on the small farmer, food security and
the competitiveness of agriculture in SSA. Best practice title registration policy in SSA should be viewed
as a policy to assist in the evolution of land tenure institutions already under way, rather than a policy to
stimulate fundamental change in small-scale agricultural investment. In which case, registration should be
a strategy to avoid negative equity effects when farmers are threatened with loss of land to politically
powerful individuals (Townsend, 1999).
5. Acknowledgments
It will be intellectual dishonesty on our part to claim that only the effort of the two researchers and
authors of this paper led to its successful end. We thank Dr Ndi Roland Akoh for forwarding the call for
papers to us and we are grateful to the all the small farmers in Ambelle, Santa, Mvog-Mba, Nkolmeyos
and Obout who were very collaborative and took us to their farms, particularly those in Ambelle and
Santa at this time of war in the Southern Cameroons. We are also grateful to the bike riders who equally
served as confidence builders and eased the organization of focus group discussions. We are particularly
thankful to the Chief of Mvog-Mba and the wife who also served as field facilitators in Mfou. We are also
indebted to the local employees of the Ministry of Agriculture and Rural Development (MINADER) in
Santa and Nkolmeyos-Mfou and the interviewees in Ambelle, Santa and Mvog-Mba as well as the authors
whose works we consulted. We equally thank the organizers of the 2nd
Congress of the African Scientific,
Research and Innovation Council (ASRIC) for putting us to task by selecting our abstract. Finally, we
thank God for providing us with the means, inspiration and health to do the job. We have no valuable
words to express our thanks, but our hearts are still full of the favours received from everyone.
References
AfDB (2009). “Infrastructure Investment in Africa,” Research Brief.
AfDB (2015). Women and Agriculture : The Untapped Opportunity in the Wave of Transformation
AfDB, OECD&UNDP (2017). African Economic Outlook 2017: Entrepreneurship and Industrialization.
AfDB (2019). Feed Africa. Available at https://www.afdb.org/fileadmin/. Accessed 10 July 2019.
Ajiboye, A. O. and Afolayan, O. (2009). The impact of transportation on agricultural production in a developing
country: a case of kola nut production in Nigeria. In International Journal of Agricultural economics and
rural development. Issue 2, Vol. 2. Pp 48-57.
Atteh, D. O. (1985). The effect of land tenure systems on agricultural production: a case study of the land tenancy
system in the Okun Area of Kwara State, Nigeria. Geoforum, Elsevier. Volume 16, Issue 3. Pp 277-286
Barrows, R. and Roth, M. (1990). Land Tenure and Investment in African Agriculture: Theory and Evidence. In The
Journal of Modern African Studies, Cambridge, Cambridge University Press Vol. 28, No. 2. Pp. 265-297.
https://www.jstor.org/stable/160863. Accessed: 25-09-2018.
Bationo et al. (2006). African Soils - Their Productivity and Profitability of Fertilizer Use. Background paper for the
Africa Fertilizer Summit. June 2006, Nigeria.
56
Besley, T. and Burgess, R. (2003), "Halving Global Poverty", Journal of Economic Perspectives, Volume 17, 3, 3-
22.
Bhatia, S. M. (1999). Rural Infrastructure and Growth in Agriculture. In Economic and Political Weekly, Vol. 34,
No. 13 Pp. A43-A48. Available at https://www.jstor.org/stable/4407793. Accessed 17/08/2019.
Binswanger-Mkhize, H. P. (2009). Challenges and opportunities for African agriculture and food security: High
food prices, climate change, population growth, and HIV and AIDs. Expert Meeting on How to feed the
World in 2050. FAO, Rome.
Deininger, K., & Jin, S. (2006). Tenure security and land-related investment: Evidence from Ethiopia. European
Economic Review, 50(5), 1245-1277.
Deininger, K., Ali, D. A., & Yamano, T. (2008). Legal knowledge and economic development: The case of land
rights in Uganda. Land Economics, 84(4), 593-619.
Dorner, P. (1972). Land Reform and Economic Development. Harmondsworth, England: Penguin.
FAO (2012). Investing in market-oriented agricultural infrastructure in Africa: Summary of the proceedings of a
round-table meeting. Rome. Available at http://www.fao.org/. Accessed 19/8/2019.
Gajigo, O. and Lukoma, A. (2011). Infrastructure and Agricultural Productivity in Africa: Market Brief. Available at
www.afdb.org/. Accessed 16/8/2019.
Gollin, D. (2014). Smallholder agriculture in Africa: An overview and implications for policy IIED Working Paper.
IIED, London. http://pubs.iied.org/14640IIED ISBN 978-1-78431-091-2.
Harrison, P. (1987). The Greening of Africa. London: Paladin Grafton Books.
IRAD (2007). Annual Report of the Institute of Agricutural Research for Development. Available at
https://agritrop.cirad.fr/556139/1/document_556139.pdf. Accessed 30/08/2019
Jayne, T. S., Chamberlin, J., Headey, D. D. (2014). ‘Land pressures, the evolution of farming Systems, And
Development Strategies In Africa: A Synthesis’, Food Policy, 48 (1): 1–17.
Kagwanja, J. (2012). Supporting Land Policies and Governance of Land Tenure to improve Agriculture Investments
& Food Security: Global Forum on Agriculture Policy Coherence for Food Security in Developing
Countries OECE Conference Centre, Paris 26 November 2012. AU-ECA-AfDB Land Policy Initiative,
UNECA, Addis Ababa.
Kassali, R., Ayanwale, B. A., Idowu, O. E. and Williams, B. S. (2012). Effect of rural transportation system on
agricultural productivity in Oyo State, Nigeria. In Journal of Agriculture and Rural Development in the
Tropics and Subtropics Vol. 113 No. 1 Pp13–19. urn:nbn:de:hebis:34-2012061541307 ISSN: 1612-9830 –
journal online: www.jarts.info.
Korsaga, S. (2018). Land Tenure Security, Land-Related Investments and Agricultural Performance in Sub-Saharan
Africa: Efficiency or Equity? A Microeconomic Analysis Applied to the Case of Burkina Faso. LEMNA
Working Paper EA 4272.
Lawry, S, Samii, C, Hall, R, Leopold, A, Hornby, D, Mtero, F. (2014). The impact of land property rights
interventions on investment and agricultural productivity in developing countries: a systematic review.
Campbell Systematic Reviews. DOI: 10.4073/csr. ISSN1891-1803. Available at https://www.cifor.org/.
Accessed 16/8/2019.
Lawry, S. (2015). How does land tenure affect agricultural productivity? A systematic review. Forest News, CIFOR.
Available at https://forestsnews.cifor.org/26908/land-tenure-reforms-africa-review?fnl=en. Accessed
9/8/2019.
Livingston, G., Schonberger, S. and Delaney, S. (2011). Sub-Saharan Africa: The state of smallholders in
agriculture. Paper presented at the IFAD Conference on New Directions for Smallholder Agriculture 24-25
January, 2011. Available at https://pdfs.semanticscholar.org/f2cb/. Accessed 9/8/2019.
Malambo, M. (2014). Perceptions on the importance of land and agriculture: A case study of Lusoke Village,
Zambia. Norwegian University of Science and Technology, Trondheim.
Matthews, A. (2004). On and Off Farm Diversification: The Policy Framework. Available at https://www.tcd.ie/.
Accessed 9/8/1029.
Michalopoulos, S. (2016). Africa’s farming potential hinges on infrastructure boost. Available at
https://www.euractiv.com/section/agriculture-food/news/africa-will-not-feed-world-without-infrastructure-
boost/. Accessed 9/8/1029.
Migot-Adholla, S. E. and Bruce, J. W. (1994). Introduction: Are Indigenous African tenure systems insecure? In
Bruce, J. W. and Migot-Adholla, S. E. (eds) (1994). Searching for Land Tenure Security in Africa. World
Bank, Dubuque: Kendall/Hunt Publishing Company. Pp 1-14.
57
Munyanyi, W. (2013). Agricultural infrastructure development imperative for sustainable food production: a
Zimbabwean perspective. In Russian Journal of Agricultural and Socio-Economic Sciences, 12(24). Pp 13-
21.
Njara, L. (2017). Access to on and off-farm infrastructure, a hurdle to smallholders. Available at
http://iagrifoodnetwork.com/access-off-farm-infrastructure-hurdle-smallholders/. Accessed 19/8/2019.
Njobe, B. and Kaaria, S. (2015). Women and Agriculture : The Untapped Opportunity in the Wave of
Transformation. Available at https://www.afdb.org/. Accessed 16/8/2019.
OECD/FAO (2016). Chapter 2 Agriculture in Sub-Saharan Africa: Prospects and challenges for the next decade:
Agricultural Outlook 2016-2025. Available at http://www.fao.org/3/a-BO092E.pdf. Accessed 9/8/2019.
Ogolo, B. M. (1996). Student’s Guide to Writing Research and Project Proposals. Port-Harcourt, City-Creeks
Publishers.
Patel, A. (2010). Infrastructure for Agriculture & Rural Development in India: Need For A Comprehensive Program
& Adequate Investment. Available at https://www.microfinancegateway.org/. Accessed 9/8/2019.
Pernechele, V., Balié, J. & Ghins, L. (2018). Agricultural policy incentives in sub-Saharan Africa in the last decade
(2005–2016) – Monitoring and Analysing Food and Agricultural Policies (MAFAP) synthesis study, FAO
Agricultural Development Economics Technical Study 3. Rome, FAO. 77 pp.
Razavi, S. (2003). Agrarian Change, Gender and Land Rights. Journal of Agrarian Change. 3 (1&2): 2-32. In Njoh
(2002). Community and Change in Cameroonian Land Policy. Planning Perspectives, 15.
Salil, A. Essay on the Importance of Land in Agriculture. http://www.yourarticlelibrary.com/.
Setboonsarng, S. (2008).The Impact of Rural Infrastructure and Agricultural Support Services on Poverty: The Case
of Agrarian Reform Communities in the Philippines, ADB Institute Discussion Paper No. 110.
Slavchevska, V.; De La O Campos, P. A.; Brunelli, C. and Doss, C. (2016) Beyond Ownership: Women’s and
Men’s Land Rights in sub-Saharan Africa. World Bank, New York. Available at pubdocs.worldbank.org/.
Accessed 9/8/2019.
Townsend, E. R. (1999). Agricultural Incentives in sub-Saharan Africa: Policy Challenges. The World Bank,
Washington D.C.
UN (2017). “Financing Africa’s Infrastructure and Agricultural Development: Inclusive Growth for Economic
Transformation”. Concept Note, AFRICA WEEK 2017. UN, New York. Available at
https://www.un.org/en/africa/osaa/. Accessed 19/8/2019.
Venkatachalam, L. (2003). Infrastructure and Agricultural Development in Karnataka State, Institute for Social and
Economic Change, Nagarbhavi, Bangalore.
Warner, M., D. Kahan, and S. Lehel. (2008). “Market-Oriented Agricultural Infrastructure: Appraisal of Public-
Private Partnerships.” FAO, Rome.
Were-Higenyi, F. (2010). Rural Transport, Agriculture & Food Security –
Outcome of the SSATP/Africa College workshop at IITA, Ibadan, Nigeria, 5-7 October, 2010. Power point
Presentation.
Wiggins, S. 2009. Can the smallholder model deliver poverty reduction and food security for a rapidly growing
population in Africa? Paper for the Expert Meeting on How to feed the World in 2050, Rome.
Williams, O. T., Taal, B., Villhoth, K., Johnston, R. and Giordano, M. (2015). Accessing and putting water to
productive use in sub-Saharan Africa. Available at
https://sustainabledevelopment.un.org/content/documents/630477-Williams-
Accessing%20and%20putting%20water%20to%20productive%20use%20in%20sub-
Saharan%20Africa.pdf. Accessed 9/8/2019.
World Bank (2003). Land policies for growth and poverty reduction. Available at
http://documents.worldbank.org/curated/en/485171468309336484/310436360_20050007001644/additional
/multi0page.pdf
Zimmermann, R. Bruntrüp, M. Flaherty, S. K. (2009). Agricultural Policies in Sub-Saharan Africa Understanding
CAADP and APRM Policy Processes. German Development Institute, Bonn. https://www.die-
gdi.de/uploads/media/Studies_48.pdf.

ii

iii

iv
Table of Contents
Deriving Optimal Mean Indoor Concentration Threshold Levels of PM2.5 and VOC for Detecting
Respiratory Symptoms among Pregnant Women in Ndola and Masaiti, Zambia .................................. 1
Seroprevalence of Cryptococcus Neoformans in Human Immunodeficiency Virus Positive Patients
attending Aminu Kano Teaching Hospital Kano, Nigeria .................................................................... 15
Public Health Policy and Health Human Resource Preferences in North Central Nigeria: A Costly
Paradox? ................................................................................................................................................ 28
1
Available online at www.asric.org
ASRIC Journal on Health Sciences 1 (2020) 1-14
a Copperbelt University Michael Chilufya Sata School of Medicine Public Health Unit, Ndola, Zambia,
Received 19 December 2019; revised 30 January 2020; accepted 30 January 2020
Abstract
The burden of air pollution-related morbidity and mortality in developing countries will continue if limited
air monitoring and lack of air quality standards continue. This paper focuses on deriving optimal mean indoor
threshold concentration levels of particulate matter (PM2.5) and volatile organic compounds (VOCs) for
detecting respiratory symptoms among pregnant women in Ndola and Masaiti, Zambia.
The study involved 1,170 consenting pregnant women in a cross sectional study using a standard
questionnaire. Lung function tests were conducted and indoor PM2.5 and VOCs monitored in houses.
Biomass was the main cooking fuel. Indoor air quality monitoring results during cooking and daily average
were 501(411, 686) µg/m3 and 393 (303,578) µg/m
3 respectively for PM2.5 and 340(318,360) ppb and 343(320,
363) ppb respectively for VOCs. Significant difference in the distribution of PM2.5 (p-value = 0.001) and VOC
(p-value = 0.017) between rural and urban area were observed. Mean indoor PM2.5 and VOC varied significantly
by cooking activity in both rural (p-value < 0.001) and urban (p-value < 0.001) areas. Similarly, fuel type for
PM2.5 at p-value = 0.005 but no significant difference for VOC at p-value = 0.779. However, there was a
significant association between mean indoor VOC and forced vital capacity (FVC). Mean indoor PM2.5 was
significantly higher in households that presented with respiratory symptoms than those without respiratory
symptoms for both rural (p-value = 0.011) and urban areas (p-value < 0.001). Exposing a pregnant woman to
mean indoor PM2.5 of 418µg/m3 in rural areas and 372.3µg/m
3 in urban areas increased the risk of having at
least one respiratory symptom. Statistical significant associations were observed between mean indoor PM2.5
and respiratory symptoms.
Household air pollution levels in Zambian homes are high. Therefore, systematic PM and VOCs monitoring
is critical in order to develop strategies and policies relating to improvement of air quality and respiratory
health.
Keywords: Air pollution, Biomass, Particulate matter, Volatile organic compounds, Spirometry
1. Introduction
Currently, developing countries are increasingly experiencing a double burden of infectious and
chronic diseases (Boutayeb, 2006) partly due to environmental conditions (Sclar et al. 2005; Zulu et
1 Corresponding author. Email addresses: [email protected] (D. Mulenga); [email protected] (S. Siziya)
2
al. 2011) which are compromised by the increasing presence of poor air quality resulting from the use
of unprocessed cooking fuels such as wood, charcoal, cow dung and crop residues. These cooking
fuels produce pollutants such as respirable suspended particulate matter (RSPM) that is of major
significance as it significantly affects the cardiovascular and respiratory health of individuals (Pope
and Dockery, 2006). Animal studies have shown that wood smoke causes immune suppression in the
respiratory system (Thomas and Zelikoff 1999; Zelikoff 1994) and several previous studies elsewhere
have also documented an association between exposure to biomass (wood smoke) and incidence of
tuberculosis, after taking smoking into account (Perez-Padilla et al. 2001; Mishra et al. 1999; Gupta
and Mathur 1997).
Other than particulate matter, woodsmoke is also a source of volatile organic compounds (St.
Helen et al., 2011) which include a variety of chemicals, some of which may have short- and long-
term adverse health effects (Chikara, 2009) on the exposed. World Health Organization observed that
large magnitude of volatile organic compounds exposure is a health risk to individuals who face
chronic and daily exposures to household air pollution (WHO, 2014). Other research findings
elsewhere also indicate that exposure to volatile organic compounds from second hand smoke can
double the estimated lifetime excess risk of cancer death, however, the increased risk from exposure
to household woodsmoke could even be far greater than this due to the higher exposure concentrations
and longer exposure times (St. Helen et al., 2011).
Acceptable levels of fine particulate matter with an aerodynamic diameter of up to 2.5 mm
(PM2.5) in inspired air have been documented by the World Health Organization (WHO, 2006).
These levels are predominantly based on studies of environmental pollution and outdoor air and
suggest that air quality should be maintained at not higher than a maximum 24 h average
concentration of 25 μm3 PM2.5 in order to avoid adverse health effects. Previous studies in Asia
(Kurmi et al, 2008) of biomass burning in homes have recorded PM2.5 concentrations over 2000 μm3
and similar levels have been documented in some areas of Africa (Rumchey et al 2007; Ezzati and
Kammen 2001).
Despite indoor air quality being an important environmental condition, many countries in sub-
Saharan Africa lack air quality standards and household air pollution monitoring is limited (Petkova et
al 2013). Zambia for instance does not have an indoor air pollution monitoring program; therefore, no
attention is paid to issues relating to household air pollution. Collective evidence from short-and long-
term household air quality monitoring studies demonstrates that pollution levels in developing
countries often exceed international guidelines. Biomass burning in poorly ventilated houses in
developing countries exacerbates levels of indoor air pollutants. Despite the health risks that exposure
to indoor air pollution presents, air quality programs, particularly in sub-Saharan Africa are not a
priority. This therefore explains why indoor air pollution in developing countries still remains a major
environmental and public health concern (Bruce et al, 2000) especially among the women and
children who bear the heaviest burden of the problem due to longer times spent indoors. However,
there has been a paucity of information describing biomass fuel use and exposure levels in Zambia. It
is for this reason that we conducted a study to evaluate household air pollution levels using PM2.5 and
VOCs as indicators in rural and urban houses of Masaiti and Ndola so as to determine the optimal
threshold for detecting respiratory symptoms among the exposed women.
2. Methods
A cross sectional study among pregnant women recruited during antenatal visits was implemented
in the rural district of Masaiti and urban district of Ndola in Zambia. Masaiti, is predominantly rural
with a population of about 95,580 while Ndola being part of Zambia’s copper mining region, has a
population of 455,194 according to 2010 Census and mainly urban. An initial sample size based on
online estimate calculator was adjusted by taking into account population of expected pregnancies (n
= 10,863) in Masaiti and Ndola, the design effect and nonresponse rate of 10% giving a sample size of
1,210. Respondents were enrolled using a two stage sampling method. The Tropical Diseases
Research Centre (TDRC) Ethics Committee approved the study and permission to conduct research in
Masaiti and Ndola health facilities was granted by the Zambia Health Research Authority.
3
Data Collection
A structured questionnaire was used to capture background information and respiratory symptoms.
Spirometry was conducted among the respondents and indoor air quality monitoring was conducted in
their houses.
Monitoring of indoor PM2.5 and VOCs
Particulate matter of aerodiameter of 2.5μm3
and volatile organic compounds were monitored
using Foobot (China), an air pollution measurement devise recommended for detecting pollution due
to biomass emissions (Sousan et al., 2017; Klepeis et al., 2001; Utkarshani et al., 2017). Household air
quality monitoring was conducted in all houses where a member of the family of consenting age was
present at the time of the visit. The Foobot was kept in the house for 24hours and continuous
monitoring apportioned before cooking, during cooking and after cooking period after which the daily
average reading was obtained.
Lung function tests
Lung function tests were conducted among all the pregnant women using spirobank G (Italy).
Disposable turbines were used for mouth pieces to avoid cross infections among the respondents. The
spirometry parameters of interest were forced vital capacity (FVC), forced expiratory volume (FEV1)
in one second and this is the volume delivered in the first second of an FVC maneuver. The ratio
FEV1/FVC was also recorded and the spirometry test interpretation was based on the American
Thoracic Society (ATS) standards.
Statistical Analysis
Statistical Package for Social Sciences (SPSS version 16.0) for windows, Chicago: SPSS Inc. was
used in data analysis. Descriptive statistics were performed. Mean concentrations, median
distributions and standard deviations were calculated for PM2.5 and VOCs in micrograms (µg/m3)
and parts per billion (ppb) respectively. Comparisons of distributions of PM2.5 and VOCs between
health endpoints or rural and urban areas were analyzed using Manny Mann Whitney U test.
Comparisons across more than two variables of interest were conducted using Kruskal Wallis test.
Analyses for associations were conducted using multivariate methods and significance was set at
0.05%. Associations between indoor PM2.5 and VOCs were evaluated using relative risk ratios to
determine the risk of having respiratory symptoms among women from households with varying
levels of indoor air pollutants. A two-tailed p-value <0.05 was considered as statistically significant.
3. Results
General characteristics
The study recorded a response rate of 96.7% giving a sample size of 1,170 pregnant women of
which the majority (91.2%) were married with more than half (54.6%) having attained secondary and
only close to a third (30.0%) primary education. More than two thirds (69.6%) of the participants
were unemployed and were mainly housewives. About less than one fifth (19.7%) of the participants
reported alcohol use and only 3.1% constituted reports of cigarette smoking.
Exposure variables
Only less than 5% of the women reported not being involved in cooking duties during pregnancy.
Table 1 summarizes the fuel and kitchen types in the population and biomass was the main fuel used
in cooking. Findings further indicate the various types of cooking environments with enclosed
(43.2%) and separate room (43.3%) being the most used cooking environments. A large proportion of
households in rural area cook outdoor compared to the urban area.
PM2.5 and VOCs monitoring
Table 2 is the indoor PM2.5 and VOC concentration index for the entire study population measured
before cooking, during cooking and after cooking. Daily average concentration levels for PM2.5 varied
4
between 79µg/m3 and 921µg/m
3 while VOC concentration levels ranged from 245 ppb to 393 ppb.
Findings presented in table 3 showed a significant difference in the distributions of PM2.5 (p value =
0.001) and VOC (p value = 0.017) between rural and urban areas. Concentration levels showed a
median (Q1, Q3) daily average of 441 (315,601) µg/m3 in the rural area and 411 (303,556) µg/m
3 in
the urban areas for the PM2.5. VOC showed concentration levels of a median (Q1, Q2) daily average
of 340 (320, 362) ppb in the rural area and 343 (320,365) ppb in the urban areas. Table 4 summarizes
the median (Q1, Q3) distribution of PM2.5 and VOC before, during and after cooking periods and
results showed a significant difference across the three categories for both PM2.5 (p value <0.001) and
VOC (p value <0.001). The median (Q1, Q2) PM2.5 concentration recorded for the study population
during cooking activities and daily average were 501(411, 686) µg/m3 and 393 (303,578) µg/m
3 while
for VOCs during cooking was 340(318,360) ppb and daily average was 343(320,363) ppb. The
maximum readings for PM2.5 were obtained during cooking time which was not the case for VOC.
In table 5, distribution of pollutants (PM2.5 and VOC) by fuel type and kitchen indicated a
significant difference in mean indoor PM2.5 distribution by fuel type (p value = 0.005). VOC (p value
= 0.779) did not show any significant difference in the distribution by fuel type. Kitchen type did not
show any significant difference in the PM2.5 (p value = 0.124) and VOC (p value = 0.353) distribution.
Maternal respiratory symptoms
Table 6a summarizes the respiratory symptoms in the study population. Sputum production
(45.9%) and nasal symptoms (45.6%) were the main symptoms among the respondents. There was
statistically significant difference in some of the respiratory symptoms (Cough p value <0.001; nasal
symptoms p value 0.034) between urban and rural dwellers with the rural recording higher
proportions of the symptoms. Table 6b also summarizes the lung functions results, FEV1 (p value
0.015) and FEV1/FVC (p value <0.001) were statistically significantly different between rural and
urban. The rural had a higher proportion of individuals with better FEV1 reading compared to the
urban area, while for FEV1/FVC, it is the urban dwellers that had a higher proportion of individuals
with a better lung function reading.
In table 7 results show that there was a higher mean indoor PM2.5 concentration in both rural (p
value = 0.011) and urban (p value <0.001) houses of mothers with respiratory symptoms compared to
those without respiratory symptoms. Results further indicates that households of pregnant mothers
presenting with a cough (p value <0.001), sputum production (p value = 0.046) and wheezing (p value
= 0.001) had significantly higher mean indoor PM2.5 concentration levels than mothers who didn’t
present with respiratory symptoms (table 8). Table 9 shows that there was a significant difference in
the median distribution of indoor VOC (p value = 0.011) between households of pregnant mothers
presenting with a normal FVC and those with an abnormal FVC. Table 10 shows that on average a
PM2.5 of 311.3µg/m3 in rural and 297.6µg/m
3 in urban areas has no effect on maternal respiratory
symptoms. Impliedly an additional PM2.5 of 106.7µg/m3 in rural areas and 74.7µg/m3 in urban areas
marks the onset of respiratory symptoms among exposed pregnant women. Therefore, exposing a
pregnant woman to an indoor mean concentration of 418µg/m3 in rural areas and 372.3µg/m
3 in urban
areas increases the risk of having at least one respiratory symptom. Therefore, the mean indoor PM2.5
concentration increases with the increase in the number of maternal respiratory symptoms up to the
fourth respiratory symptom as shown in fig.1. However, no association between the number of
maternal respiratory symptoms and mean indoor volatile organic compounds was observed (fig. 2).
Figure 3 illustrates the association between indoor air pollution and number of respiratory symptoms
in rural and urban area in the same figure.
Multinomial logistic Regression
The multinomial logistic regression shows that there was a statistically significant association
between mean indoor PM2.5 concentration levels and the number of maternal respiratory symptoms.
However, mean indoor volatile organic compounds concentration levels did not show any significant
association with the number of maternal respiratory health as shown in table 11.
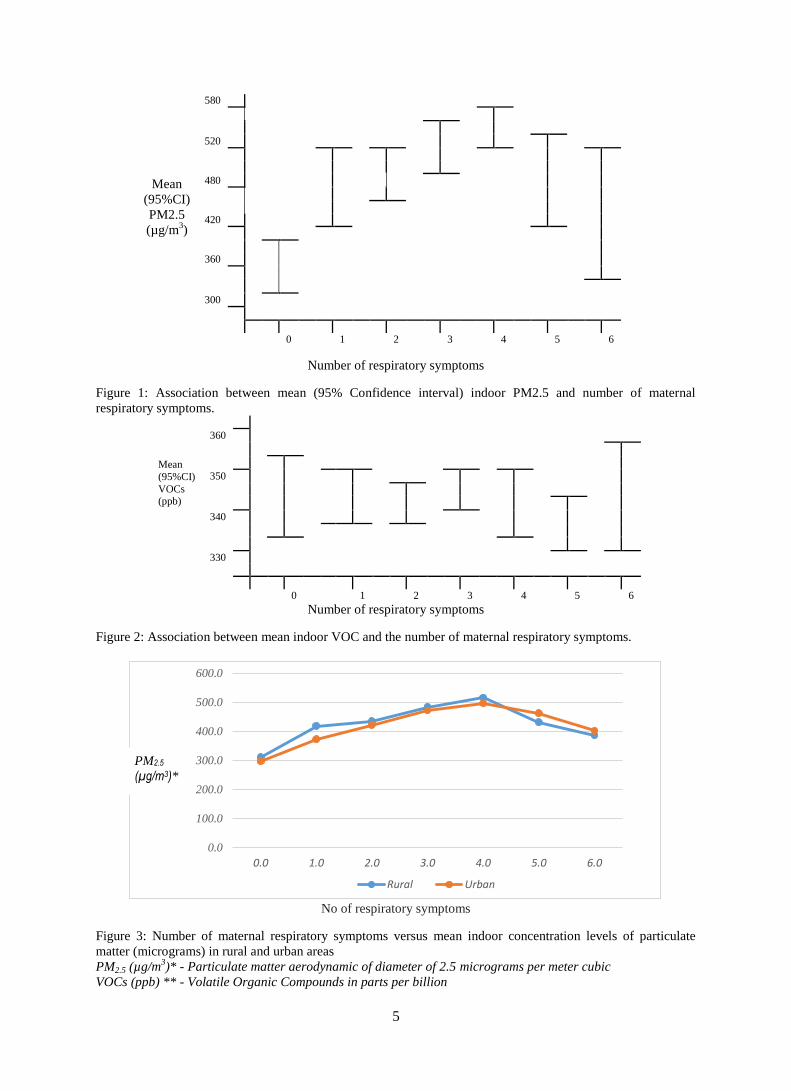
5
Mean
(95%CI)
PM2.5
(µg/m3)
580
520
480
420
360
300
0
1
2
3
4
5
6
Number of respiratory symptoms
Figure 1: Association between mean (95% Confidence interval) indoor PM2.5 and number of maternal
respiratory symptoms.
Mean
(95%CI)
VOCs (ppb)
360
350
340
330
0
1
2
3
4
5
6
Number of respiratory symptoms
Figure 2: Association between mean indoor VOC and the number of maternal respiratory symptoms.
No of respiratory symptoms
Figure 3: Number of maternal respiratory symptoms versus mean indoor concentration levels of particulate
matter (micrograms) in rural and urban areas
PM2.5 (µg/m3)* - Particulate matter aerodynamic of diameter of 2.5 micrograms per meter cubic
VOCs (ppb) ** - Volatile Organic Compounds in parts per billion
0.0
100.0
200.0
300.0
400.0
500.0
600.0
0.0 1.0 2.0 3.0 4.0 5.0 6.0
Rural Urban
PM2.5 (µg/m3)*
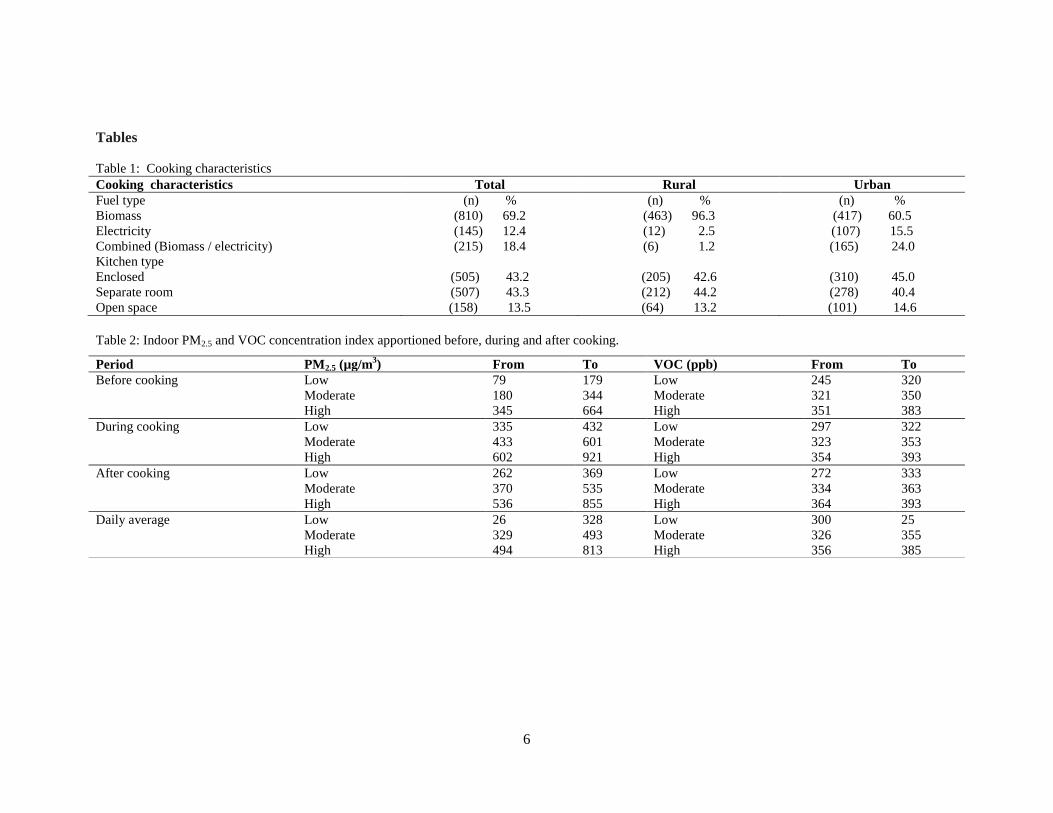
6
Tables
Table 1: Cooking characteristics
Cooking characteristics Total Rural Urban
Fuel type (n) % (n) % (n) %
Biomass (810) 69.2 (463) 96.3 (417) 60.5
Electricity (145) 12.4 (12) 2.5 (107) 15.5
Combined (Biomass / electricity) (215) 18.4 (6) 1.2 (165) 24.0
Kitchen type
Enclosed (505) 43.2 (205) 42.6 (310) 45.0
Separate room (507) 43.3 (212) 44.2 (278) 40.4
Open space (158) 13.5 (64) 13.2 (101) 14.6
Table 2: Indoor PM2.5 and VOC concentration index apportioned before, during and after cooking.
Period PM2.5 (µg/m3) From To VOC (ppb) From To
Before cooking Low 79 179 Low 245 320
Moderate 180 344 Moderate 321 350
High 345 664 High 351 383
During cooking Low 335 432 Low 297 322
Moderate 433 601 Moderate 323 353
High 602 921 High 354 393
After cooking
Low 262 369 Low 272 333
Moderate 370 535 Moderate 334 363
High 536 855 High 364 393
Daily average
Low 26 328 Low 300 25
Moderate 329 493 Moderate 326 355
High 494 813 High 356 385
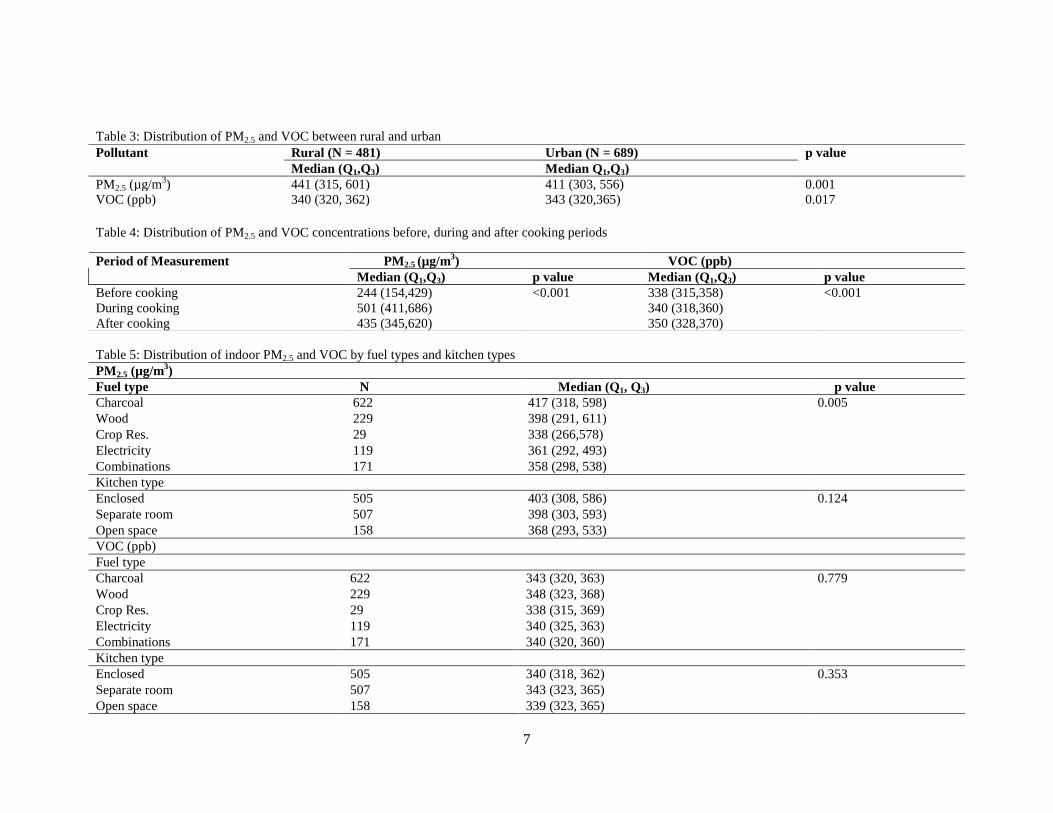
7
Table 3: Distribution of PM2.5 and VOC between rural and urban
Table 4: Distribution of PM2.5 and VOC concentrations before, during and after cooking periods
Table 5: Distribution of indoor PM2.5 and VOC by fuel types and kitchen types
Pollutant Rural (N = 481) Urban (N = 689) p value
Median (Q1,Q3) Median Q1,Q3)
PM2.5 (µg/m3) 441 (315, 601) 411 (303, 556) 0.001
VOC (ppb) 340 (320, 362) 343 (320,365) 0.017
Period of Measurement PM2.5 (µg/m3) VOC (ppb)
Median (Q1,Q3) p value Median (Q1,Q3) p value
Before cooking
During cooking
After cooking
244 (154,429)
501 (411,686)
435 (345,620)
<0.001 338 (315,358)
340 (318,360)
350 (328,370)
<0.001
PM2.5 (µg/m3)
Fuel type N Median (Q1, Q3) p value
Charcoal 622 417 (318, 598) 0.005
Wood 229 398 (291, 611)
Crop Res. 29 338 (266,578)
Electricity 119 361 (292, 493)
Combinations 171 358 (298, 538)
Kitchen type
Enclosed 505 403 (308, 586) 0.124
Separate room 507 398 (303, 593)
Open space 158 368 (293, 533)
VOC (ppb)
Fuel type
Charcoal 622 343 (320, 363) 0.779
Wood 229 348 (323, 368)
Crop Res. 29 338 (315, 369)
Electricity 119 340 (325, 363)
Combinations 171 340 (320, 360)
Kitchen type
Enclosed 505 340 (318, 362) 0.353
Separate room 507 343 (323, 365)
Open space 158 339 (323, 365)
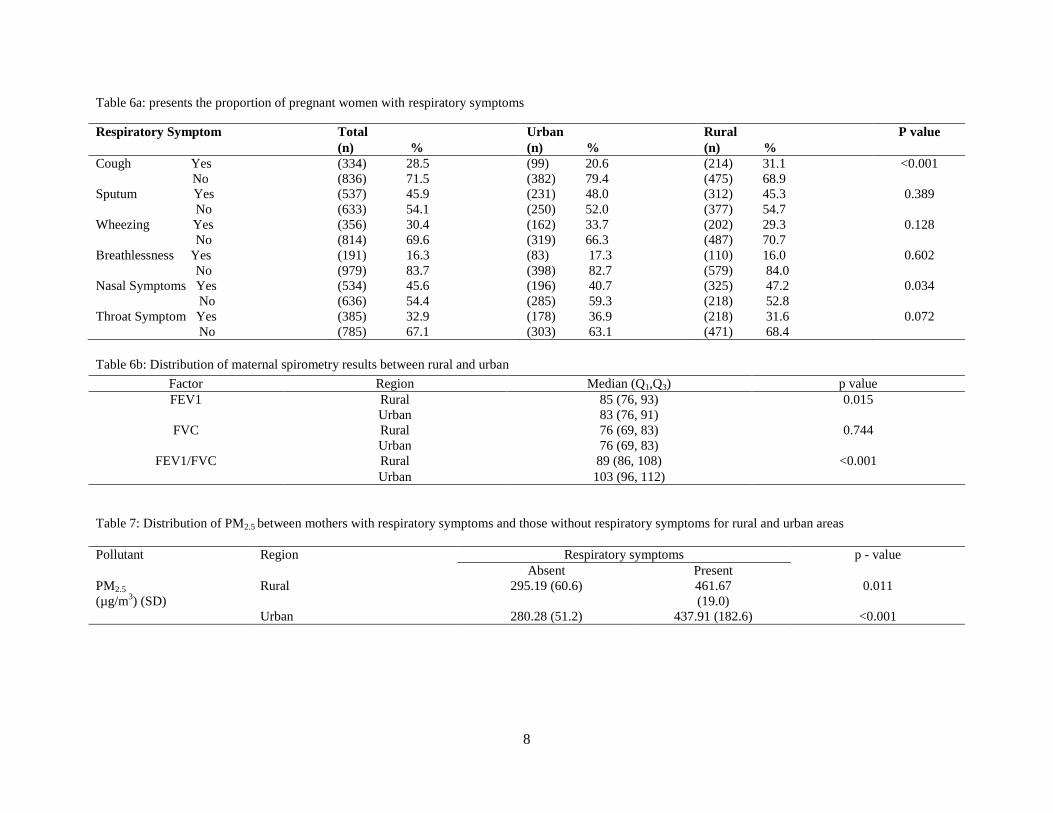
8
Table 6a: presents the proportion of pregnant women with respiratory symptoms
Table 6b: Distribution of maternal spirometry results between rural and urban
Table 7: Distribution of PM2.5 between mothers with respiratory symptoms and those without respiratory symptoms for rural and urban areas
Pollutant Region Respiratory symptoms p - value
Absent Present
PM2.5
(µg/m3) (SD)
Rural 295.19 (60.6) 461.67
(19.0)
0.011
Urban 280.28 (51.2) 437.91 (182.6) <0.001
Respiratory Symptom Total Urban Rural P value
(n) % (n) % (n) %
Cough Yes
No
(334) 28.5
(836) 71.5
(99) 20.6
(382) 79.4
(214) 31.1
(475) 68.9
<0.001
Sputum Yes
No
(537) 45.9
(633) 54.1
(231) 48.0
(250) 52.0
(312) 45.3
(377) 54.7
0.389
Wheezing Yes
No
(356) 30.4
(814) 69.6
(162) 33.7
(319) 66.3
(202) 29.3
(487) 70.7
0.128
Breathlessness Yes
No
(191) 16.3
(979) 83.7
(83) 17.3
(398) 82.7
(110) 16.0
(579) 84.0
0.602
Nasal Symptoms Yes
No
(534) 45.6
(636) 54.4
(196) 40.7
(285) 59.3
(325) 47.2
(218) 52.8
0.034
Throat Symptom Yes
No
(385) 32.9
(785) 67.1
(178) 36.9
(303) 63.1
(218) 31.6
(471) 68.4
0.072
Factor Region Median (Q1,Q3) p value
FEV1 Rural 85 (76, 93) 0.015
Urban 83 (76, 91)
FVC Rural 76 (69, 83) 0.744
Urban 76 (69, 83)
FEV1/FVC Rural 89 (86, 108) <0.001
Urban 103 (96, 112)
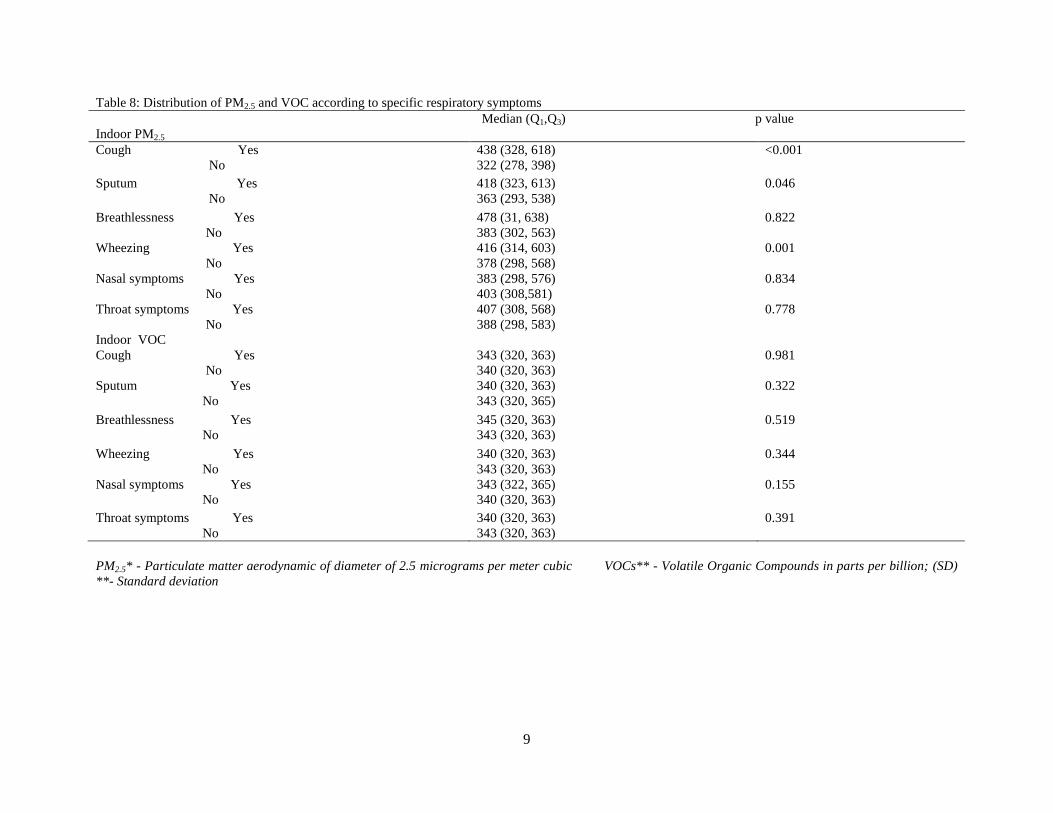
9
Table 8: Distribution of PM2.5 and VOC according to specific respiratory symptoms
Median (Q1,Q3) p value
Indoor PM2.5
Cough Yes
No
438 (328, 618)
322 (278, 398)
<0.001
Sputum Yes
No
418 (323, 613)
363 (293, 538)
0.046
Breathlessness Yes
No
478 (31, 638)
383 (302, 563)
0.822
Wheezing Yes
No
416 (314, 603)
378 (298, 568)
0.001
Nasal symptoms Yes
No
383 (298, 576)
403 (308,581)
0.834
Throat symptoms Yes
No
407 (308, 568)
388 (298, 583)
0.778
Indoor VOC
Cough Yes
No
343 (320, 363)
340 (320, 363)
0.981
Sputum Yes
No
340 (320, 363)
343 (320, 365)
0.322
Breathlessness Yes
No
345 (320, 363)
343 (320, 363)
0.519
Wheezing Yes
No
340 (320, 363)
343 (320, 363)
0.344
Nasal symptoms Yes
No
343 (322, 365)
340 (320, 363)
0.155
Throat symptoms Yes
No
340 (320, 363)
343 (320, 363)
0.391
PM2.5* - Particulate matter aerodynamic of diameter of 2.5 micrograms per meter cubic
VOCs** - Volatile Organic Compounds in parts per billion; (SD)
**- Standard deviation
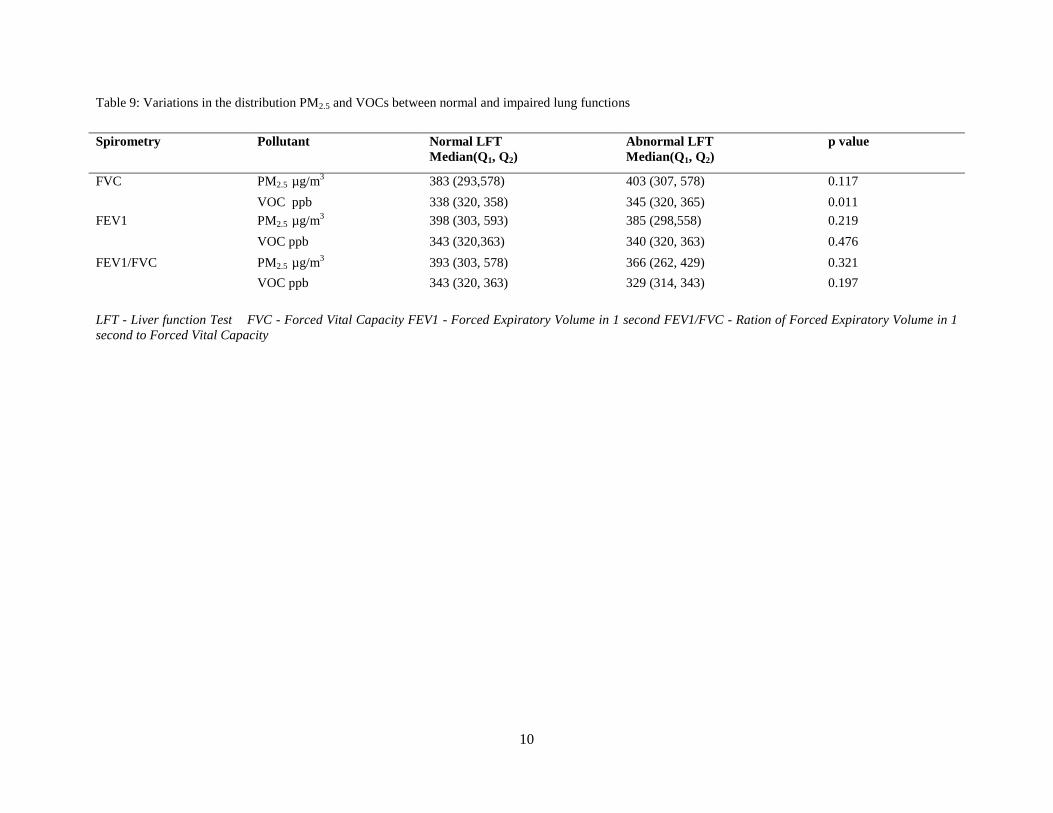
10
Table 9: Variations in the distribution PM2.5 and VOCs between normal and impaired lung functions
LFT - Liver function Test FVC - Forced Vital Capacity FEV1 - Forced Expiratory Volume in 1 second FEV1/FVC - Ration of Forced Expiratory Volume in 1
second to Forced Vital Capacity
Spirometry
Pollutant Normal LFT
Median(Q1, Q2)
Abnormal LFT
Median(Q1, Q2)
p value
FVC
PM2.5 µg/m3 383 (293,578) 403 (307, 578) 0.117
VOC ppb 338 (320, 358) 345 (320, 365) 0.011
FEV1 PM2.5 µg/m3 398 (303, 593) 385 (298,558) 0.219
VOC ppb 343 (320,363) 340 (320, 363) 0.476
FEV1/FVC PM2.5 µg/m3 393 (303, 578) 366 (262, 429) 0.321
VOC ppb 343 (320, 363) 329 (314, 343) 0.197
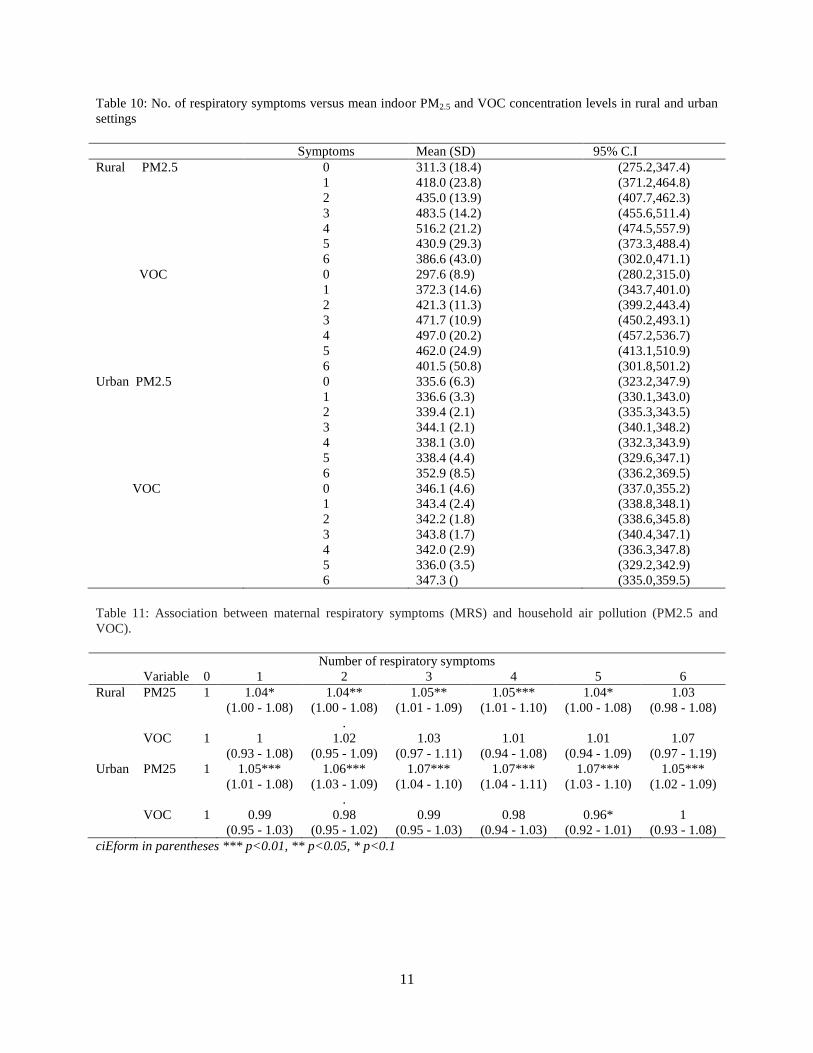
11
Table 10: No. of respiratory symptoms versus mean indoor PM2.5 and VOC concentration levels in rural and urban
settings
Symptoms Mean (SD) 95% C.I
Rural PM2.5 0 311.3 (18.4) (275.2,347.4)
1 418.0 (23.8) (371.2,464.8)
2 435.0 (13.9) (407.7,462.3)
3 483.5 (14.2) (455.6,511.4)
4 516.2 (21.2) (474.5,557.9)
5 430.9 (29.3) (373.3,488.4)
6 386.6 (43.0) (302.0,471.1)
VOC 0 297.6 (8.9) (280.2,315.0)
1 372.3 (14.6) (343.7,401.0)
2 421.3 (11.3) (399.2,443.4)
3 471.7 (10.9) (450.2,493.1)
4 497.0 (20.2) (457.2,536.7)
5 462.0 (24.9) (413.1,510.9)
6 401.5 (50.8) (301.8,501.2)
Urban PM2.5 0 335.6 (6.3) (323.2,347.9)
1 336.6 (3.3) (330.1,343.0)
2 339.4 (2.1) (335.3,343.5)
3 344.1 (2.1) (340.1,348.2)
4 338.1 (3.0) (332.3,343.9)
5 338.4 (4.4) (329.6,347.1)
6 352.9 (8.5) (336.2,369.5)
VOC 0 346.1 (4.6) (337.0,355.2)
1 343.4 (2.4) (338.8,348.1)
2 342.2 (1.8) (338.6,345.8)
3 343.8 (1.7) (340.4,347.1)
4 342.0 (2.9) (336.3,347.8)
5 336.0 (3.5) (329.2,342.9)
6 347.3 () (335.0,359.5)
Table 11: Association between maternal respiratory symptoms (MRS) and household air pollution (PM2.5 and
VOC).
Number of respiratory symptoms
Variable 0 1 2 3 4 5 6
Rural PM25 1 1.04* 1.04** 1.05** 1.05*** 1.04* 1.03
(1.00 - 1.08) (1.00 - 1.08) (1.01 - 1.09) (1.01 - 1.10) (1.00 - 1.08) (0.98 - 1.08)
.
VOC 1 1 1.02 1.03 1.01 1.01 1.07
(0.93 - 1.08) (0.95 - 1.09) (0.97 - 1.11) (0.94 - 1.08) (0.94 - 1.09) (0.97 - 1.19)
Urban PM25 1 1.05*** 1.06*** 1.07*** 1.07*** 1.07*** 1.05***
(1.01 - 1.08) (1.03 - 1.09) (1.04 - 1.10) (1.04 - 1.11) (1.03 - 1.10) (1.02 - 1.09)
.
VOC 1 0.99 0.98 0.99 0.98 0.96* 1
(0.95 - 1.03) (0.95 - 1.02) (0.95 - 1.03) (0.94 - 1.03) (0.92 - 1.01) (0.93 - 1.08)
ciEform in parentheses *** p<0.01, ** p<0.05, * p<0.1
12
4. Discussion
This study is the first to evaluate household air pollution using PM2.5 and VOCs as indicators in
Zambian houses. To the best of our knowledge it is the first study, to derive an optimal mean indoor PM2.5
threshold for detecting onset of respiratory symptoms in Zambia among pregnant women that cook
predominantly with solid fuel. The current study found high mean indoor PM2.5 and VOCs concentration
levels in both rural and urban areas of the study population. However, there seemed to be higher mean
indoor concentration levels of PM2.5 and VOCs in households that used biomass only compared to those
that used electricity. This result is in accord with what is pertaining in sub-Saharan Africa and similar
findings elsewhere indicate that particulate matter levels may be 10–50 times higher than the
recommended standards in houses where solid fuels are used (Hulin et al., 2012). Our study also observed
more respiratory symptoms among women from households where biomass only was used as cooking
fuel compared to women from households that used electricity. This finding is consistent with research
results in randomized control trials in rural Mexico (Romieu et al., 2009) that indicated that cleaner fuels
were significantly associated with a reduction of respiratory symptoms among women.
We found that there was a significant association between mean indoor PM2.5 concentration levels and
onset of maternal respiratory symptoms. These findings are consistent with results elsewhere (Dominicini
et al. 2006) indicating that even short-term exposure to PM2.5 results increased risk for cardiovascular and
respiratory hospital admissions and this is further confirmed by studies which indicate that even at
relatively low levels respirable particulate exposure can increase respiratory symptoms and mortality
(Kurma et al. 2015; Tielssch et al. 2014). Results in an Indian study also showed that increased
respiratory symptoms are related to increased indoor concentration levels of PM2.5 (Kumar, 2015). The
gases and particles are said to be responsible for weak host defenses against respiratory infections which
would further lead to an increased predisposition to respiratory infections. Inflammation of the airways
and alveoli, resulting from the exposure to these pollutants, may be another mechanism increasing the
severity of respiratory infections (Ezzati and Kammen , 2001)
A review of information relating to air pollution in Zambia indicate that there is paucity of such
information because like in many countries in the sub-Saharan Africa, air monitoring is limited and there
is a lack of air quality standards at national level. In our study, an indoor mean concentration of 418µg/m3
in rural areas and 372.3µg/m3 in urban areas was responsible for increasing the risk of having at least one
respiratory symptom among pregnant women. This is comparable with previous studies conducted in
Asia (Kurmi et al, 2008) stating that PM2.5 concentrations in houses get as high as over 2000 mg/m3 and
in some African countries like Zimbabwe and Kenya where indoor air pollution monitoring has been
conducted (Rumchey et al 2007; Ezzati and Kammen 2001). The findings of our study show that indoor
air pollution in our study population excessively exceed the WHO recommendations (WHO, 2005).
This finding is an indication that Zambian urban and rural women will continue to carry the burden of
air pollution-related morbidity and mortality if no public health interventions are implemented to control
the poor environmental conditions which are fueled by limited air monitoring and lack of air quality
standards at national level. Our current study creates an important baseline for the implementation of
systematic PM2.5 data collection to enable air pollution-related respiratory health impact assessment
among women predominantly using biomass for cooking. This will in turn help in the development of
strategies and policies relating to air quality and respiratory health.
5. Limitations
There are number of limitations that we need to mention in this study and in the first instance we
should note that women in the study were not selected randomly from the population, a cause and effect
conclusion cannot be inferred. Exposure to PM2.5 and VOC was a proxy measure as personal samplers
were not used to determine levels of exposure. Duration and frequency of exposure to pollutants was not
also assessed, conclusions relied on the respondents’ feedback.
13
6. Conclusion
Household air pollution levels in Zambian homes are high. Further research work is required because
the concentration levels that have been observed in this study are hazardous and are likely to have adverse
health outcomes. Public health interventions should therefore be identified to reduce indoor concentration
levels to less harmful standards. The process of reducing concentration levels of PM2.5 is beyond the
control of individuals and requires action by public authorities and health sector can play a pivotal role in
leading a multi-sectoral approach to the prevention of exposure to air pollution by engaging and
supporting other relevant sectors such as housing, industry and energy sectors in reducing the risk of
indoor air pollution to respiratory health among women.
7. Acknowledgements
Thanks to the Centre for Environmental and Respiratory Health (CERH) at University of Oulu in
Finland for permission to use in the development of the study tools. Many thanks also to Professor Seter
Siziya for the data analysis and proof reading the article and we wish to also thank the Ministry of Health
for approving the protocol and permission to use the health facilities for the research. Special thanks go to
the data collectors (nurses and midwives) and pregnant women for their willingness to make this research
work a success.
References
Boutayeb A. the double burden of communicable and non-communicable diseases in developing countries. Trans
Royal Soc Trop Med Hyg 2006; 100(3):191-199
Bruce N, Perez-Padilla R, Albalak R. Indoor air pollution in developing countries still remains a major
environmental and public health challenge. Bulletin of WHO, 2000-SciELO Public Health.
Chikara H, Iwamoto S, Yoshimura T. Indoor air pollution of volatile organic compounds: indoor/outdoor
concentrations, sources and exposures. Nihon Eiseigaku Zasshi 2009;64:683–8.
Central Statistics Office, Zambia 2010 Census
Domininici F, Peng R, Bell M, Pham L, Mcdermott A, Zeger S, Samet J. Fine particulate air pollution and hospital
admission for cardiovascular and respiratory diseases. JAMA 2006; 295(10):1127-1134.
Ezzati M, Kammen D. Indoor air pollution from biomass combustion and acute respiratory infections in Kenya: an
exposure-response study. Lancet 2001;358:619–24.
Gupta BN, Mathur N (1997) A study of household environmental risk factors pertaining to respiratory diseases.
Energy Environment Monitor. 1999; 13:61–67.
Hulin M, Simonic M, Viegic G, Annesi-Maesano I. Respiratory health and indoor air pollutants based on
quantitative exposure assessments. ERJ Express2012; page 1-28
Kumar R, Nagar JK, Goel N, Kumar P, Kushwah AS, Gaur SN. Indoor air pollution and asthma in children at Delhi,
India. Pneumonol Alergol Pol 2015;83:275–82.
Kumar R, Singh K, Nagar S, Kumar M, Mehto UK, Rai G and Gupta N, Pollutant levels at Cooking place and Their
Association with Respiratory Symptoms in Women in a Rural Area of Delhi-NRR. Indian J Chest Dis
Allied Sci 2015;57:225-231
Kurmi OP, Semple S, Steiner M, et al. Particulate matter exposure during domestic work in Nepal. Ann Occup Hyg
2008;52:509–17.
Mishra VK, Retherford RD, Smith KR. Biomass cooking fuels and prevalence of tuberculosis in India. International
Journal of Infectious Diseases.1999; 3:119–129.
Petkova EP, Jack DW, Volavka-Close NH, Kinney PL. Particulate matter pollution in African cities. Air Qual
Atmos Health 2013: 6:603-614
Perez-Padilla R, Perez-Guzman C, Baez-Saldana R, Torres-Cruz A Cooking with biomass stoves and tuberculosis: a
case control study. International Journal of Tuberculosis and Lung Disease.2001; 5:1–7
Pope CA 3rd, Dockery DW. Health effects of fine particulate air pollution: lines that connect. J Air Waste Manag
Assoc 2006;56:709–42.
14
Romieu I, Riojas-Rodriguez H, Marron-Mares AT,Schilmann A, Perez-Padilla R, Masera O. Improved biomass
stove intervention in rural Mexico: impact on the respiratory health of women. Int J RespirCrit Care Med
2009;180:649–56.
Rumchev K, Spickett JT, Brown HL, et al. Indoor air pollution from biomass combustion and respiratory symptoms
of women and children in a Zimbabwean village. Indoor Air 2007;17:468–74.
Tielsch JM, katz J, Zeger SL, Khatry SK, Shrestha L, Breysse P, Checkley W, Mullany LC, LeClerq SC. Designs of
two randomized, community-based trials to assess the impact of alternative cookstove installation on
respiratory illness among young children and reproductive outcomes in rural Nepal. BMC Public Health
2014, 14:1271
Sclar ED, Garau P, Carolini G. The 21st Century health challenge of slums and cities. Lancent. 2005;
365(9462):901-903
St. Helen G., Agguilar-Villalobos M, Cassidy B.E., Blount B.C., Bayer C., Hall D.B., Needham L.L., Hendry R.J.,
Naeher L.P., 2011. Characterization of volatile organic compounds (VOCs) Exposure from cooking fuels
among a cohort of pregnant women in Trujillo, peru. Am J RespirCrit Care Med 183;2011:A3894
Thomas P, Zelikoff J (1999) Air pollutants: moderators of pulmonary host resistance against infection. In: Air
pollution and health. Holgate ST et al., eds. Academic Press, San Diego, CA.
World Health Organisation (2006). Air quality guidelines, global update.
http://www.euro.who.int/Document/E90038.pdf Accessed April 2018.
World Health Organisation (2014), WHO IAQ guidelines; Household fuel combustion. WHO Geneva.
Zelikoff J (1994) Woodsmoke emissions: effects on host pulmonary immune defence. CIAR Currents, 1:3.
Zulu EM, Beguy D, Ezeh AC, Bocquier P, Madise NJ, Cleland J, Falkingham J. Overview of migration, poverty and
health dynamics in Nairobi City’s slum settlements. Urban Healt h: Bull NY Acad Med. 2011; 28(Suppl
2):S185-S199
15
Available online at www.asric.org
ASRIC Journal on Health Sciences 1 (2020) 15-27
1
a Department of Medical Microbiology and Parasitology, Faculty of Clinical Sciences,
College of Health Sciences. Bayero University Kano b Department of Microbiology, Faculty of Life Sciences, Bayero University Kano
Received 19 December 2019; revised 30 January 2020; accepted 30 January 2020
Abstract
The HIV pandemic has greatly contributed to the emergence of opportunistic fungal infections. Over the last
two decades Cryptococcus neoformans infection is estimated to cause more than 500,000 deaths annually
among HIV positive subjects in sub-Saharan Africa. However, in this environment scant attention has been paid
to the screening of this infection. This study was therefore designed to determine the prevalence of
Cryptococcus neoformans in the serum of HIV positive subjects attending HIV treatment centre in Aminu Kano
Teaching Hospital, determine the relationship between the immune status with seroprevalence of the infection
and to determine the risk factors associated with the infection. Blood was collected by venepuncture and CD4
count was determined using Partec flow cytometer. One hundred and fifty HIV positive subjects on Highly
Active Antiretroviral Therapy with a CD4 count ≤ 200 cells/µL were recruited for the study. All subjects were
grouped based on their CD4 counts into: 200-150, 149-101, 100-50 and <50 cells/µL. The test for Cryptococcus
neoformans was performed using cryptococcal antigen (CRAG) lateral flow assay detection kits. Of 150 HIV
positive subjects, 6(4.0%) were positive for serum CRAG. Positive subjects with CD4 count ≤50 cells/µL had
the highest prevalence of serum CRAG. Moreover, high seroprevalence was observed in subjects that had
contact with bird droppings. This study showed a prevalence of 4.0% serum CRAG among HIV positive
subjects that are on HAART. It is therefore recommended to implement CRAG screening strategy targeting HIV
positive subjects with lower CD4 counts.
Keywords: Cryptococcus neoformans, HIV, CRAG, CD4 count.
1 Corresponding author. +234 8032881988 Email addresses: [email protected] (I.M. Daneji);
[email protected] (A.M. Magashi); [email protected] (Y. Mohammed); [email protected]
(H.U. Takalmawa); [email protected] (A.Y. Adamu); [email protected] (A.S. Abdullahi);
[email protected] (M.I. Gesto); F.M. Daneji ([email protected]); [email protected]
(M.A Yusuf)
16
1. Introduction
The HIV pandemic has greatly contributed to the emergence of opportunistic fungal pathogens and
increased incidence of infections over the last two decades. Cryptococcosis is an opportunistic mycosis,
caused by an encapsulated yeast Cryptococcus species complex (Cryptococcus neoformans and
Cryptococcus gattii) (Lin et al., 2006 and Dzoyem et al., 2012).
Cryptococcus neoformans is the most important pathogen responsible for most clinical cases among
the Cryptococcus species complex. It has a global distribution and accounts for more than 90% of all
cases of Cryptococcosis (Litvintseva et al., 2005, Eileen and John 2016).
Recent estimates suggest that there are about 1 million new cases of cryptococcosis and at least
500,000 deaths annually worldwide due to HIV-associated cryptococcosis (Oyella et al., 2012). The vast
majority of cases occur among patients living in sub-Saharan Africa because it causes more deaths than
tuberculosis (Park et al., 2009). Sub-Saharan Africa carries the greatest burden of the world’s Acquired
Immune Deficiency Syndrome (AIDS) epidemic, with more than 60% of the world’s HIV-infected
population (approximately 25 million individuals) residing there (UNAIDS, 2006). Exposure to
Cryptococcus neoformans is thought to be universal. The organism is inhaled from the environment, and
genotypic evidence suggests acquisition can occur many years before the development of clinical
cryptococcosis in the context of immunosuppression (Velagapudi et al., 2009).
Cryptococcal antigenemia (presence of cryptococcal capsular polysaccharide antigen (CRAG) in
blood), can precede onset of cryptococcal meningitis (CM) by weeks to months (French et al., 2002). The
World Health Organization noted that the main reason for the unacceptably high mortality is a delay in
presentation when meningitis is advanced and treatment is less effective. If diagnosis could be made
earlier, the burden of cryptococcal disease may be drastically reduced. It can be seen that cryptococal
infection is an important public health problem and causes a large burden of disease among people living
with HIV/AIDS (WHO, 2011).
The prevalence of cryptococcosis in Africa and most especially in Nigeria is not well documented due
to poor recording of statistical data and low research level. In immunocompromised patients,
cryptococcosis can be severe and rapidly progressive; requiring prolonged systemic antifungal therapy
(Saag et al., 2000). The infection is the most common life-threatening disease in HIV patients, and extra-
pulmonary cryptococcosis is an AIDS- defining illness. The clinical presentation includes disseminated
meningo-encephalitis, which is rapidly fatal in the absence of therapy (Mwaba et al., 2001). This presents
with high morbidity in HIV/AIDS patients in sub-Saharan Africa. In this region, prospective studies on
cryptococcal pulmonary infections are needed so that appropriate therapy can be initiated, thus reducing
the incidence of opportunistic infections. (Junaid et al., 2008).
Few data on cryptococcosis in HIV’s patient are available in Nigeria, , hence the need of for a study
like this to find out its prevalence in HIV patients. Cryptococcosis has emerged as defining feature for
HIV/AIDS infection (Junaid et al., 2008). Patients with AIDS associated cryptococcal infections now
account for 80 – 90% of all patients with cryptococcosis (Wallace et al., 2008). A recent study in Africa
reported the prevalence of cryptococcal antigenemia in HIV patient cohorts with CD4 counts below 100
cells/µL at ranges from 2 to 13% (French et al., 2002).The seroprevalance of Cryptococcus neoformans
on population groups considered to be at risk of acquiring an infection will therefore be investigated.
In recent times, the incidence of cryptococcal meningitis in patients infected with HIV has increased
worldwide mainly because of the increased awareness on the part of both the physicians and clinical
microbiologists (Ashiru et al., 2005). It generally occurs when the CD4+ T cell count is less than
100cells/ μL and presents in descending order as cryptococcal meningitis, pulmonary cryptococcosis and
cryptococcosis of the skin (Salami et al., 2009).
A presumptive diagnosis of CM can be made on the basis of a positive cryptococcal antigen (CrAg)
using a latex agglutination or an enzyme immumo assay kit. Cryptococcal antigene testing on blood and
cerebrospinal fluid (CSF) is a highly reliable and rapid diagnostic technique with excellent sensitivity and
specificity (Antinori et al., 2005). In one study, of the 59 patients with cryptococcal infection in which 17
(28.8%) would not have been diagnosed on the day of consultation without the agglutination test
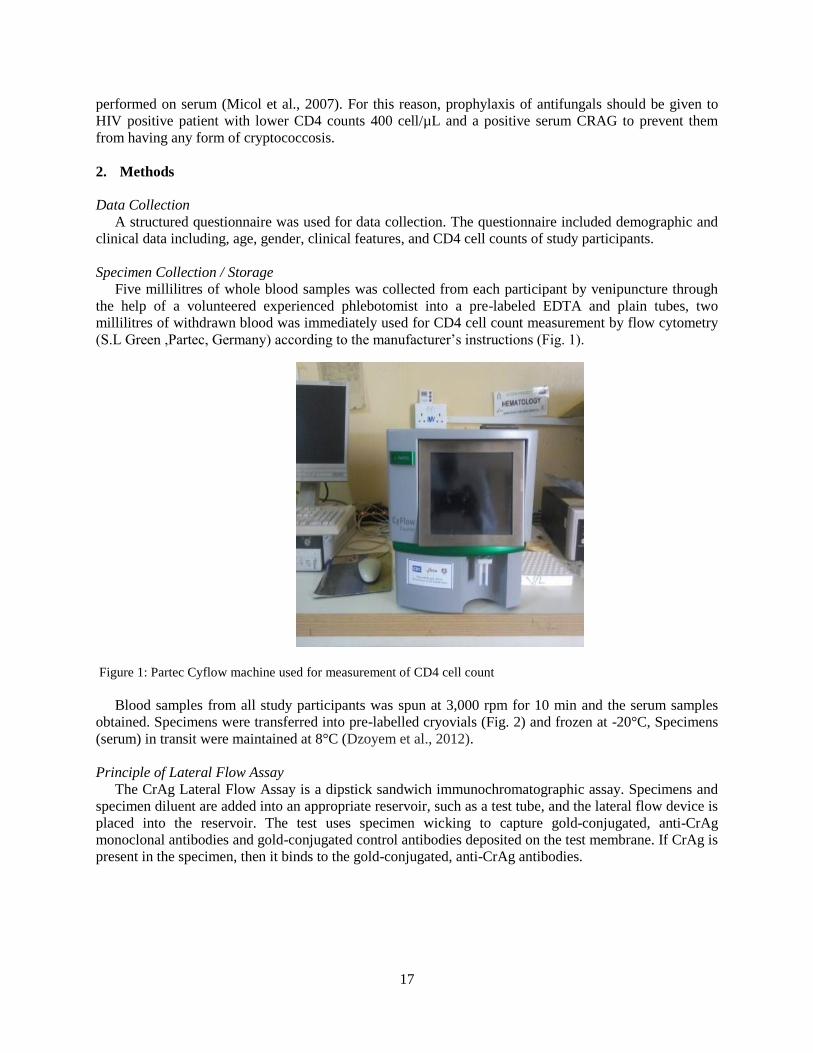
17
performed on serum (Micol et al., 2007). For this reason, prophylaxis of antifungals should be given to
HIV positive patient with lower CD4 counts 400 cell/µL and a positive serum CRAG to prevent them
from having any form of cryptococcosis.
2. Methods
Data Collection
A structured questionnaire was used for data collection. The questionnaire included demographic and
clinical data including, age, gender, clinical features, and CD4 cell counts of study participants.
Specimen Collection / Storage
Five millilitres of whole blood samples was collected from each participant by venipuncture through
the help of a volunteered experienced phlebotomist into a pre-labeled EDTA and plain tubes, two
millilitres of withdrawn blood was immediately used for CD4 cell count measurement by flow cytometry
(S.L Green ,Partec, Germany) according to the manufacturer’s instructions (Fig. 1).
Figure 1: Partec Cyflow machine used for measurement of CD4 cell count
Blood samples from all study participants was spun at 3,000 rpm for 10 min and the serum samples
obtained. Specimens were transferred into pre-labelled cryovials (Fig. 2) and frozen at -20°C, Specimens
(serum) in transit were maintained at 8°C (Dzoyem et al., 2012).
Principle of Lateral Flow Assay
The CrAg Lateral Flow Assay is a dipstick sandwich immunochromatographic assay. Specimens and
specimen diluent are added into an appropriate reservoir, such as a test tube, and the lateral flow device is
placed into the reservoir. The test uses specimen wicking to capture gold-conjugated, anti-CrAg
monoclonal antibodies and gold-conjugated control antibodies deposited on the test membrane. If CrAg is
present in the specimen, then it binds to the gold-conjugated, anti-CrAg antibodies.
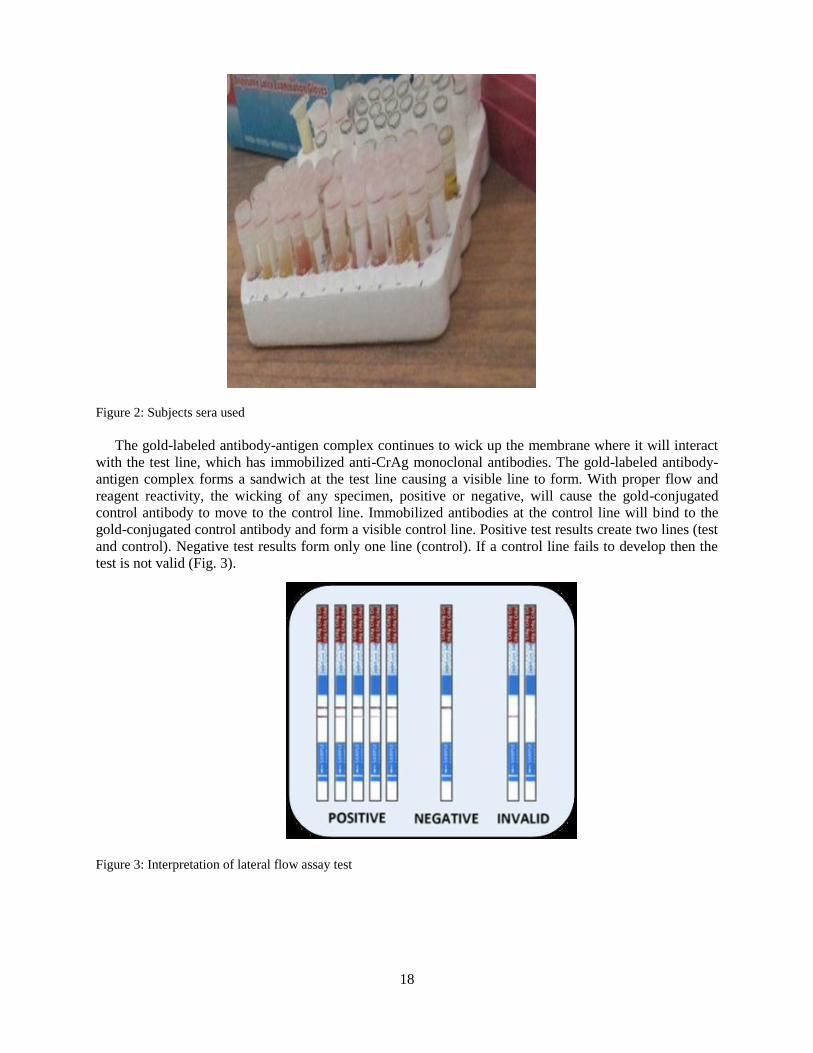
18
Figure 2: Subjects sera used
The gold-labeled antibody-antigen complex continues to wick up the membrane where it will interact
with the test line, which has immobilized anti-CrAg monoclonal antibodies. The gold-labeled antibody-
antigen complex forms a sandwich at the test line causing a visible line to form. With proper flow and
reagent reactivity, the wicking of any specimen, positive or negative, will cause the gold-conjugated
control antibody to move to the control line. Immobilized antibodies at the control line will bind to the
gold-conjugated control antibody and form a visible control line. Positive test results create two lines (test
and control). Negative test results form only one line (control). If a control line fails to develop then the
test is not valid (Fig. 3).
Figure 3: Interpretation of lateral flow assay test
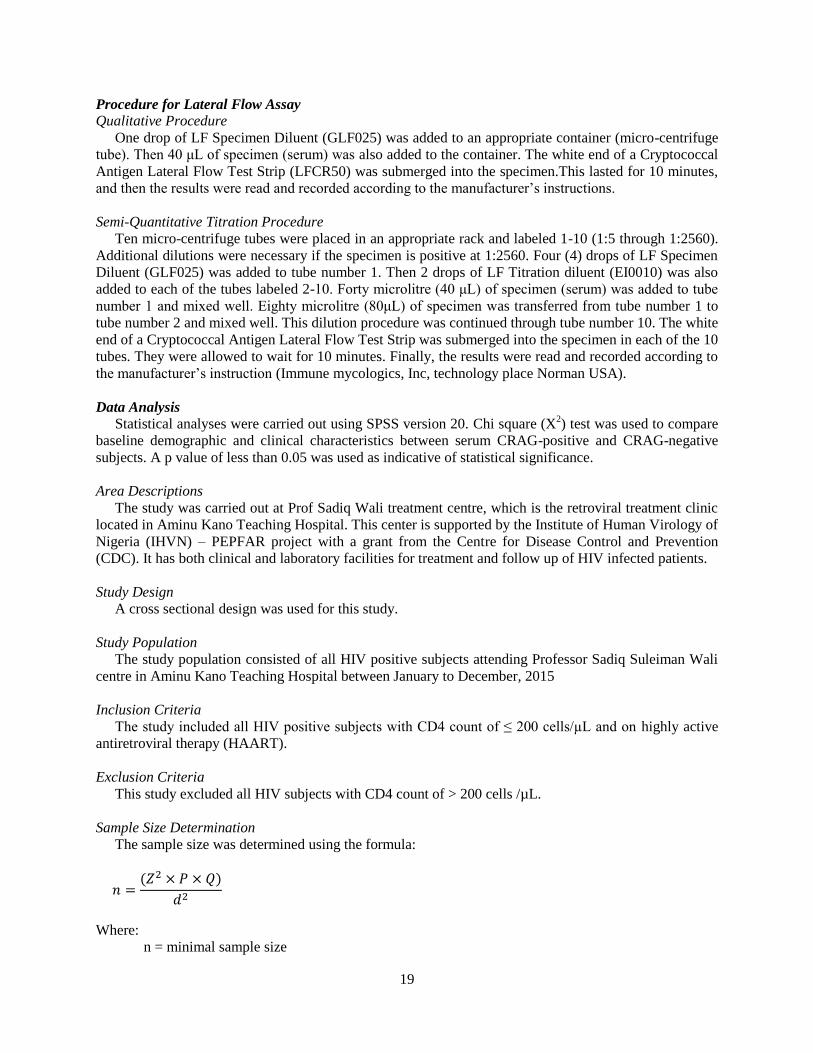
19
Procedure for Lateral Flow Assay
Qualitative Procedure
One drop of LF Specimen Diluent (GLF025) was added to an appropriate container (micro-centrifuge
tube). Then 40 μL of specimen (serum) was also added to the container. The white end of a Cryptococcal
Antigen Lateral Flow Test Strip (LFCR50) was submerged into the specimen.This lasted for 10 minutes,
and then the results were read and recorded according to the manufacturer’s instructions.
Semi-Quantitative Titration Procedure
Ten micro-centrifuge tubes were placed in an appropriate rack and labeled 1-10 (1:5 through 1:2560).
Additional dilutions were necessary if the specimen is positive at 1:2560. Four (4) drops of LF Specimen
Diluent (GLF025) was added to tube number 1. Then 2 drops of LF Titration diluent (EI0010) was also
added to each of the tubes labeled 2-10. Forty microlitre (40 μL) of specimen (serum) was added to tube
number 1 and mixed well. Eighty microlitre (80μL) of specimen was transferred from tube number 1 to
tube number 2 and mixed well. This dilution procedure was continued through tube number 10. The white
end of a Cryptococcal Antigen Lateral Flow Test Strip was submerged into the specimen in each of the 10
tubes. They were allowed to wait for 10 minutes. Finally, the results were read and recorded according to
the manufacturer’s instruction (Immune mycologics, Inc, technology place Norman USA).
Data Analysis Statistical analyses were carried out using SPSS version 20. Chi square (X
2) test was used to compare
baseline demographic and clinical characteristics between serum CRAG-positive and CRAG-negative
subjects. A p value of less than 0.05 was used as indicative of statistical significance.
Area Descriptions
The study was carried out at Prof Sadiq Wali treatment centre, which is the retroviral treatment clinic
located in Aminu Kano Teaching Hospital. This center is supported by the Institute of Human Virology of
Nigeria (IHVN) – PEPFAR project with a grant from the Centre for Disease Control and Prevention
(CDC). It has both clinical and laboratory facilities for treatment and follow up of HIV infected patients.
Study Design
A cross sectional design was used for this study.
Study Population
The study population consisted of all HIV positive subjects attending Professor Sadiq Suleiman Wali
centre in Aminu Kano Teaching Hospital between January to December, 2015
Inclusion Criteria
The study included all HIV positive subjects with CD4 count of ≤ 200 cells/µL and on highly active
antiretroviral therapy (HAART).
Exclusion Criteria
This study excluded all HIV subjects with CD4 count of > 200 cells /µL.
Sample Size Determination
The sample size was determined using the formula:
𝑛 =(𝑍2 × 𝑃 × 𝑄)
𝑑2
Where:
n = minimal sample size
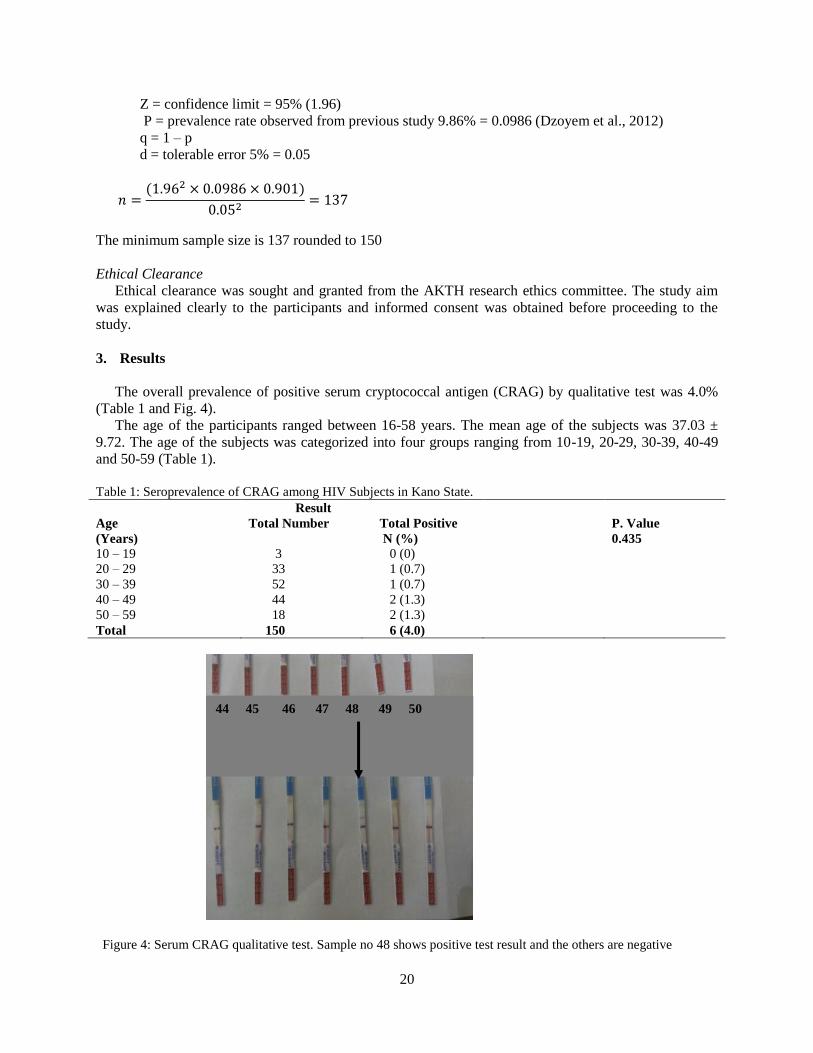
20
Z = confidence limit = 95% (1.96)
P = prevalence rate observed from previous study 9.86% = 0.0986 (Dzoyem et al., 2012)
q = 1 – p
d = tolerable error 5% = 0.05
𝑛 =(1.962 × 0.0986 × 0.901)
0.052= 137
The minimum sample size is 137 rounded to 150
Ethical Clearance
Ethical clearance was sought and granted from the AKTH research ethics committee. The study aim
was explained clearly to the participants and informed consent was obtained before proceeding to the
study.
3. Results
The overall prevalence of positive serum cryptococcal antigen (CRAG) by qualitative test was 4.0%
(Table 1 and Fig. 4).
The age of the participants ranged between 16-58 years. The mean age of the subjects was 37.03 ±
9.72. The age of the subjects was categorized into four groups ranging from 10-19, 20-29, 30-39, 40-49
and 50-59 (Table 1).
Table 1: Seroprevalence of CRAG among HIV Subjects in Kano State.
Age
(Years)
Result
Total Number
Total Positive
N (%)
P. Value
0.435
10 – 19 3 0 (0)
20 – 29 33 1 (0.7)
30 – 39
40 – 49
52
44
1 (0.7)
2 (1.3)
50 – 59 18 2 (1.3)
Total 150 6 (4.0)
Figure 4: Serum CRAG qualitative test. Sample no 48 shows positive test result and the others are negative
44 45 46 47 48 49 50
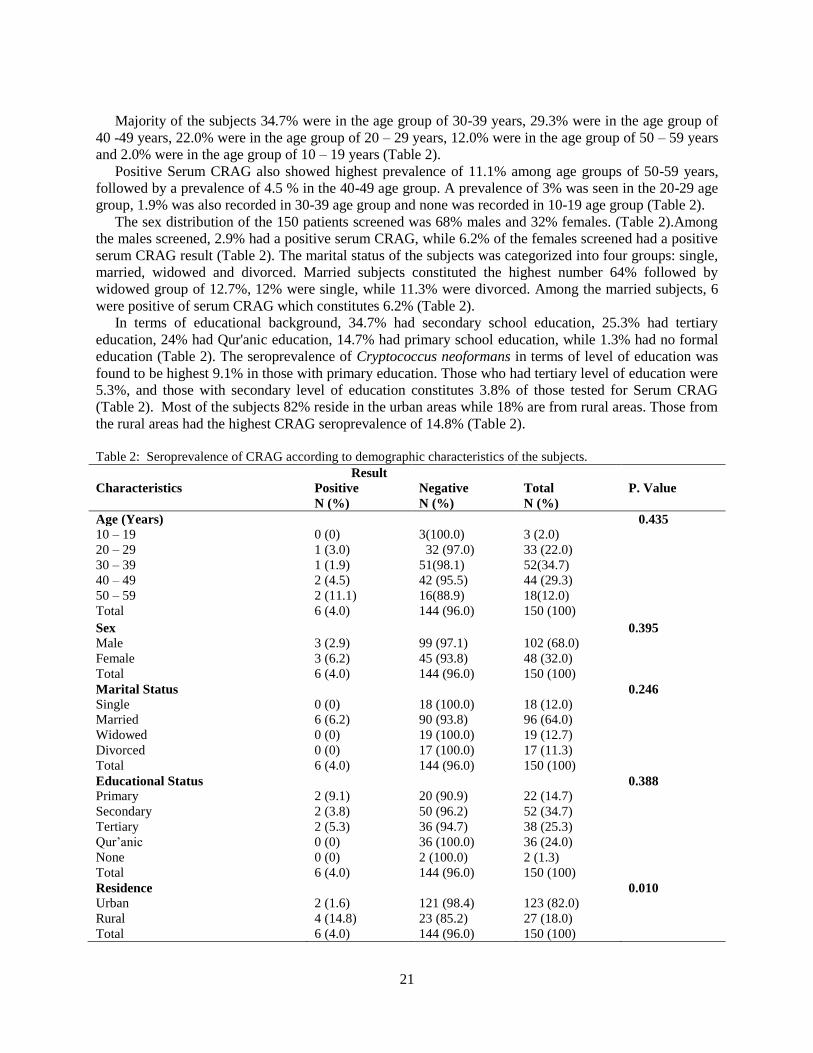
21
Majority of the subjects 34.7% were in the age group of 30-39 years, 29.3% were in the age group of
40 -49 years, 22.0% were in the age group of 20 – 29 years, 12.0% were in the age group of 50 – 59 years
and 2.0% were in the age group of 10 – 19 years (Table 2).
Positive Serum CRAG also showed highest prevalence of 11.1% among age groups of 50-59 years,
followed by a prevalence of 4.5 % in the 40-49 age group. A prevalence of 3% was seen in the 20-29 age
group, 1.9% was also recorded in 30-39 age group and none was recorded in 10-19 age group (Table 2).
The sex distribution of the 150 patients screened was 68% males and 32% females. (Table 2).Among
the males screened, 2.9% had a positive serum CRAG, while 6.2% of the females screened had a positive
serum CRAG result (Table 2). The marital status of the subjects was categorized into four groups: single,
married, widowed and divorced. Married subjects constituted the highest number 64% followed by
widowed group of 12.7%, 12% were single, while 11.3% were divorced. Among the married subjects, 6
were positive of serum CRAG which constitutes 6.2% (Table 2).
In terms of educational background, 34.7% had secondary school education, 25.3% had tertiary
education, 24% had Qur'anic education, 14.7% had primary school education, while 1.3% had no formal
education (Table 2). The seroprevalence of Cryptococcus neoformans in terms of level of education was
found to be highest 9.1% in those with primary education. Those who had tertiary level of education were
5.3%, and those with secondary level of education constitutes 3.8% of those tested for Serum CRAG
(Table 2). Most of the subjects 82% reside in the urban areas while 18% are from rural areas. Those from
the rural areas had the highest CRAG seroprevalence of 14.8% (Table 2).
Table 2: Seroprevalence of CRAG according to demographic characteristics of the subjects.
Characteristics
Result
Positive
N (%)
Negative
N (%)
Total
N (%)
P. Value
Age (Years) 0.435
10 – 19
20 – 29
30 – 39
40 – 49
0 (0)
1 (3.0)
1 (1.9)
2 (4.5)
3(100.0)
32 (97.0)
51(98.1)
42 (95.5)
3 (2.0)
33 (22.0)
52(34.7)
44 (29.3)
50 – 59 2 (11.1) 16(88.9) 18(12.0)
Total 6 (4.0) 144 (96.0) 150 (100)
Sex
Male
Female
Total
3 (2.9)
3 (6.2)
6 (4.0)
99 (97.1)
45 (93.8)
144 (96.0)
102 (68.0)
48 (32.0)
150 (100)
0.395
Marital Status
Single
Married
Widowed
Divorced
Total
0 (0)
6 (6.2)
0 (0)
0 (0)
6 (4.0)
18 (100.0)
90 (93.8)
19 (100.0)
17 (100.0)
144 (96.0)
18 (12.0)
96 (64.0)
19 (12.7)
17 (11.3)
150 (100)
0.246
Educational Status
Primary
Secondary
Tertiary
Qur’anic
None
Total
2 (9.1)
2 (3.8)
2 (5.3)
0 (0)
0 (0)
6 (4.0)
20 (90.9)
50 (96.2)
36 (94.7)
36 (100.0)
2 (100.0)
144 (96.0)
22 (14.7)
52 (34.7)
38 (25.3)
36 (24.0)
2 (1.3)
150 (100)
0.388
Residence
Urban
Rural
Total
2 (1.6)
4 (14.8)
6 (4.0)
121 (98.4)
23 (85.2)
144 (96.0)
123 (82.0)
27 (18.0)
150 (100)
0.010
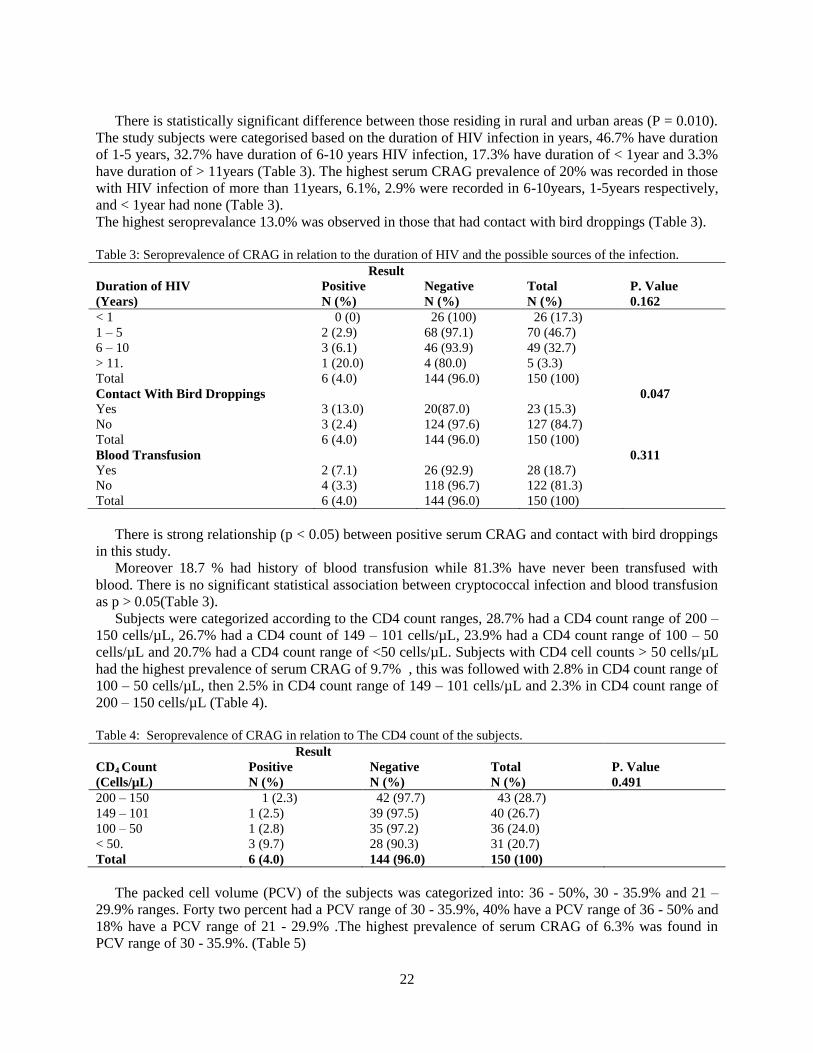
22
There is statistically significant difference between those residing in rural and urban areas (P = 0.010).
The study subjects were categorised based on the duration of HIV infection in years, 46.7% have duration
of 1-5 years, 32.7% have duration of 6-10 years HIV infection, 17.3% have duration of < 1year and 3.3%
have duration of > 11years (Table 3). The highest serum CRAG prevalence of 20% was recorded in those
with HIV infection of more than 11years, 6.1%, 2.9% were recorded in 6-10years, 1-5years respectively,
and < 1year had none (Table 3).
The highest seroprevalance 13.0% was observed in those that had contact with bird droppings (Table 3).
Table 3: Seroprevalence of CRAG in relation to the duration of HIV and the possible sources of the infection.
Duration of HIV
(Years)
Result
Positive
N (%)
Negative
N (%)
Total
N (%)
P. Value
0.162
< 1 0 (0) 26 (100) 26 (17.3)
1 – 5 2 (2.9) 68 (97.1) 70 (46.7)
6 – 10 3 (6.1) 46 (93.9) 49 (32.7)
> 11. 1 (20.0) 4 (80.0) 5 (3.3)
Total 6 (4.0) 144 (96.0) 150 (100)
Contact With Bird Droppings 0.047
Yes 3 (13.0) 20(87.0) 23 (15.3)
No 3 (2.4) 124 (97.6) 127 (84.7)
Total 6 (4.0) 144 (96.0) 150 (100)
Blood Transfusion
Yes
No
Total
2 (7.1)
4 (3.3)
6 (4.0)
26 (92.9)
118 (96.7)
144 (96.0)
28 (18.7)
122 (81.3)
150 (100)
0.311
There is strong relationship (p < 0.05) between positive serum CRAG and contact with bird droppings
in this study.
Moreover 18.7 % had history of blood transfusion while 81.3% have never been transfused with
blood. There is no significant statistical association between cryptococcal infection and blood transfusion
as p > 0.05(Table 3).
Subjects were categorized according to the CD4 count ranges, 28.7% had a CD4 count range of 200 –
150 cells/µL, 26.7% had a CD4 count of 149 – 101 cells/µL, 23.9% had a CD4 count range of 100 – 50
cells/µL and 20.7% had a CD4 count range of <50 cells/µL. Subjects with CD4 cell counts > 50 cells/µL
had the highest prevalence of serum CRAG of 9.7% , this was followed with 2.8% in CD4 count range of
100 – 50 cells/µL, then 2.5% in CD4 count range of 149 – 101 cells/µL and 2.3% in CD4 count range of
200 – 150 cells/µL (Table 4).
Table 4: Seroprevalence of CRAG in relation to The CD4 count of the subjects.
CD4 Count
(Cells/µL)
Result
Positive
N (%)
Negative
N (%)
Total
N (%)
P. Value
0.491
200 – 150 1 (2.3) 42 (97.7) 43 (28.7)
149 – 101 1 (2.5) 39 (97.5) 40 (26.7)
100 – 50 1 (2.8) 35 (97.2) 36 (24.0)
< 50. 3 (9.7) 28 (90.3) 31 (20.7)
Total 6 (4.0) 144 (96.0) 150 (100)
The packed cell volume (PCV) of the subjects was categorized into: 36 - 50%, 30 - 35.9% and 21 –
29.9% ranges. Forty two percent had a PCV range of 30 - 35.9%, 40% have a PCV range of 36 - 50% and
18% have a PCV range of 21 - 29.9% .The highest prevalence of serum CRAG of 6.3% was found in
PCV range of 30 - 35.9%. (Table 5)
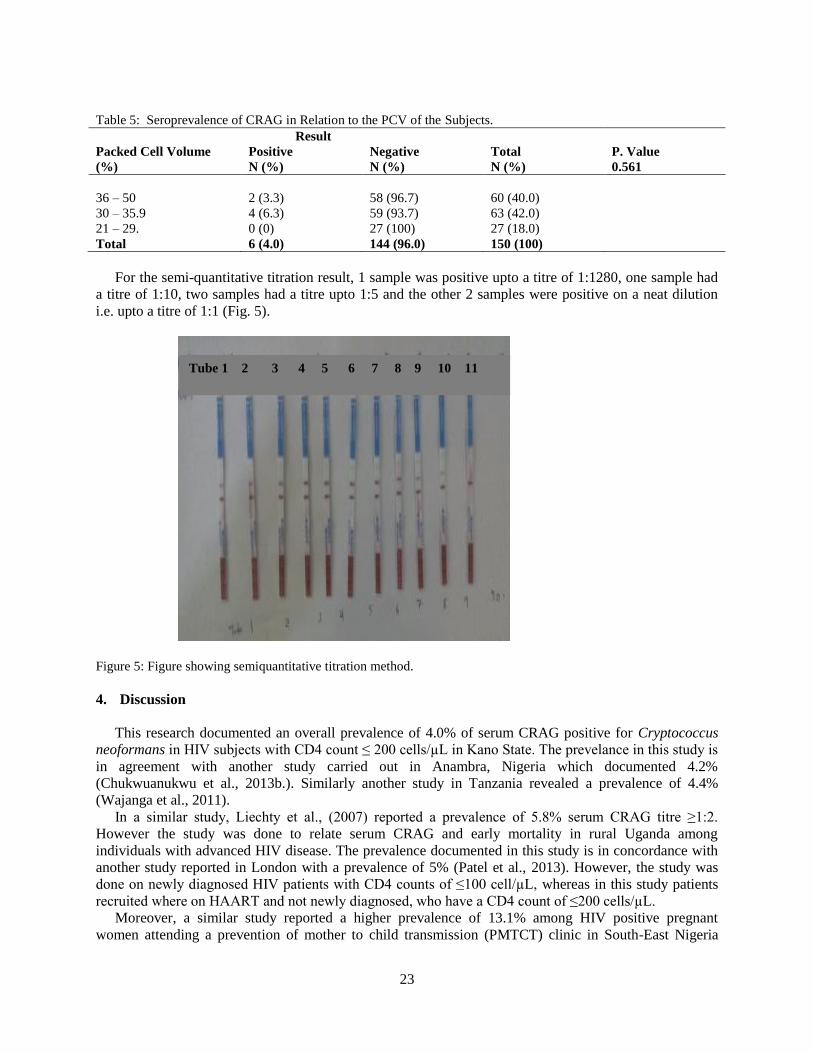
23
Table 5: Seroprevalence of CRAG in Relation to the PCV of the Subjects.
Packed Cell Volume
(%)
Result
Positive
N (%)
Negative
N (%)
Total
N (%)
P. Value
0.561
36 – 50 2 (3.3) 58 (96.7) 60 (40.0)
30 – 35.9 4 (6.3) 59 (93.7) 63 (42.0)
21 – 29. 0 (0) 27 (100) 27 (18.0)
Total 6 (4.0) 144 (96.0) 150 (100)
For the semi-quantitative titration result, 1 sample was positive upto a titre of 1:1280, one sample had
a titre of 1:10, two samples had a titre upto 1:5 and the other 2 samples were positive on a neat dilution
i.e. upto a titre of 1:1 (Fig. 5).
Figure 5: Figure showing semiquantitative titration method.
4. Discussion
This research documented an overall prevalence of 4.0% of serum CRAG positive for Cryptococcus
neoformans in HIV subjects with CD4 count ≤ 200 cells/µL in Kano State. The prevelance in this study is
in agreement with another study carried out in Anambra, Nigeria which documented 4.2%
(Chukwuanukwu et al., 2013b.). Similarly another study in Tanzania revealed a prevalence of 4.4%
(Wajanga et al., 2011).
In a similar study, Liechty et al., (2007) reported a prevalence of 5.8% serum CRAG titre ≥1:2.
However the study was done to relate serum CRAG and early mortality in rural Uganda among
individuals with advanced HIV disease. The prevalence documented in this study is in concordance with
another study reported in London with a prevalence of 5% (Patel et al., 2013). However, the study was
done on newly diagnosed HIV patients with CD4 counts of ≤100 cell/µL, whereas in this study patients
recruited where on HAART and not newly diagnosed, who have a CD4 count of ≤200 cells/µL.
Moreover, a similar study reported a higher prevalence of 13.1% among HIV positive pregnant
women attending a prevention of mother to child transmission (PMTCT) clinic in South-East Nigeria
Tube 1 2 3 4 5 6 7 8 9 10 11
24
(Chukwuanukwu et al., 2013a.). A prevalence of 12.7% was reported in Benin City, Nigeria by Osazuwa
et al., (2012) in a study conducted on anti-retroviral naïve AIDS patients. This might be a probable reason
why a high prevalence was recorded in that study. High prevalence of 9.91% was reported in the Benin
City, Nigeria in patients who are on anti-retroviral drugs with different ranges of CD4 cell counts (Egbe et
al., 2015). Another high prevalence of 9.7% was also documented in Benin (Aluyi et al., 2010). However,
in that study, sputum samples of AIDS patients were used to culture C. neoformans and not serum
samples. Similarly, low prevalence of 1.4% was reported of Cryptococcus neoformans in a survey of
bacterial and fungal opportunistic infections among HIV clients in Kano metropolis (Usman and Uba
2011). However, the sample used in the study was sputum as against to serum that was used in this study.
The use of serum in the diagnosis of cryptococcosis has improved significantly with the development of
serologic tests for the cryptococcal polysaccharide capsular antigen (CrAg), which is shed during
infection (Eileen and John 2016). In parts of Africa, a high prevalence of 19% was recorded in Kampala,
Uganda among patients with CD4 count of ≤100 cells/µL i.e among severely immunosuppressed HIV
infected patients (Oyella et al., 2012). Similarly, a prevalence of 8.2% in Uganda was documented among
HIV-infected persons with a CD4 cell count ≤100cells/µL who start HIV therapy in resource-limited
settings (Meya et al., 2010). A prevalence of 7% was also documented in Cape town, South Africa as a
result of screening for cryptococcal antigenemia in patients accessing ARV treatment program (Jarvis et
al., 2009). In Ghana, a low seroprevalance of 2% of cryptococcal antigenemia in patients with advanced
HIV infection was documented (Mamoojee et al., 2011), however only ninety-two serum samples from
adults with CD4 counts <100cells/µL was used in that study.
Moreover, other higher prevalences in other parts of the world include 18% in a study that was
conducted among HIV-infected patients in 2004 in Cambodia, Thailand (Micol et al., 2007). A prevalence
of 13.1% was also documented among HIV infected patients hospitalized with pneumonia in two rural
provinces in Thailand (Harris et al., 2012). A prevalence of 9.2% was also documented in another study
for the early diagnosis of cryptococcosis in HIV-infected patients with different ranges of CD4 cell counts
(Pongsai et al., 2010). Similarly, a prevalence of 2.5% of Cryptococcus neoformans was documented in
Isfahan, Iran (Soltani et al., 2013), their study was on isolation of Cryptococcus neoformans from pigeon
droppings and not on serum samples.
Age did not play a significant role in serum CRAG positivity in the patients used in this study.
Subjects within the age group of 50-59 years recorded the highest prevalence of 11.1% of serum CRAG
positivity. The most probable reason could be due to weakness of immune system as patients are ageing,
thereby making them highly vulnerable to infection by opportunistic mycoses (Aluyi et al., 2010).
On the basis of sex, females had more seropositivity for serum CRAG. Compared to their male
counterparts (4Females: 2males). Similar case was reported by Aluyi et al., (2010) where he reported the
occurrence of opportunistic pulmonary mycoses to be higher in females 86 (44.1%) than in males 80 (41.
0%). But there was no statistically significant difference (P= 0.385) in the prevalence of serum CRAG in
HIV subjects attending AKTH clinic in Kano.
Moreover, this study revealed that subjects from rural areas had the highest prevalence of serum
CRAG of 14.8%. This was statistically significant (p= 0.010) there is a relationship between those living
in rural areas and seropositivity to CRAG. The reason may be due to the fact that people living in rural
areas have poor health seeking behavior and also they need to travel a far distance before reaching tertiary
health centers which are located in urban areas of Kano.
Avian droppings have been reported as a potential environmental source of human pathogenic yeast.
Pigeon droppings which are abundant in public areas, could especially be a potential carrier in the spread
of pathogenic yeast into the environment subsequently humans (Chee et al., 2005). In this research a
prevalence of 13.0% was observed in those that had contact with bird droppings. Moreover, this also
showed a statistically significant relationship between contact with bird droppings. A similar prevalence
of 13% was reported by Irokanulo et al., (1997) in Jos. However, his study was on isolation of
Cryptococcus neoformans from droppings of captive birds in Jos wildlife park and Zoo. Another high
prevalence of 14.4% was reported in Awka, Nigeria (Mbata et al., 2006), the study was on isolation of
Cryptococcus neoformans from bats (Molossus major) droppings. A similar study by Nweze et al., (2015)
25
carried out in Southeastern Nigeria reported a prevalence of 22.0%, but the research was on isolation of
Cryptococcus neoformans from environmental samples of pigeon droppings and not on contact with bird
droppings. In Iran, a study reported a low prevalence of 2.5% of Cryptococcus neoformans isolated from
pigeon droppings (Soltani et al., 2013).
The distribution of cryptococcal antigenemia was highly varied with CD4 cell count levels. Patients
with CD4 cell counts of ≤50 cell/µL had the highest prevalence of serum CRAG reported in this study. In
a recent study Osazuwa et al., (2012) reported that out of 150 ART naïve AIDS patients with CD4 counts
≤ 200 cells/µL, in which 19 (12.7%) were positive for serum CRAG. Antiretroviral therapy (ART) naïve
AIDs patients with CD4 count ≤ 50 cells/µL had the highest prevalence of serum CRAG. Several studies
evaluating the prevalence of serum cryptococcal antigememia in AIDS patients have reported a
consistently higher prevalence of serum CRAG in patients with lower CD4 cell counts; 14.3% in CD4
count < 50 cells/µL (Micol et al., 2007), 12.9% in CD4 count < 100 cells/µL (Pongsai et al., 2010), 28.2%
in CD4 count < 50 cells/µL (Osazuwa et al., 2012). This trend was also observed in this study with a
9.7% in CD4 count < 50 cells/µL.
5. Conclusion
This study showed a prevalence of 4.0% among subjects who are on HAART attending AKTH clinic
in Kano State. This is more common among individuals with CD4 count ≤ 50 cells/µL as such serum
CRAG screening has an important role for the early diagnosis of cryptococcal infection in such type of
subjects with low CD4 cell counts.
Furthermore this study showed that living in rural area could be an important factor in acquiring the
cryptococcal infection.
Moreover this study also showed a significant association of serum CRAG with contact with bird
droppings in acquiring the cryptococcal infection. As such the education of residents especially those that
are HIV positive on the epidemiological relevance of bird droppings in the environment is needed.
6. Recommendations
Given the results of this study, screening for cryptococcal antigenemia should be carried out routinely
on all HIV subjects irrespective of whether patient is on HAART or not so as to minimize the morbidity
and mortality of cryptococcosis.
Routine universal screening should be performed on immunosuppressed or HIV positive subjects at
high risk of cryptococcal infection.
Further studies should be carried out on HIV subjects that are not on HAART (ARV-naive) in this
State and other parts of the country.
Moreover, there is need for further studies on the isolation of Cryptococcus neoformans from bird
droppings in this part of the country.
References
Aluyi, H. S. A., Otajevwo, F. D., Iweriebor, O., 2010. Incidence of Pulmonary Mycoses in Patients with
Acquired Immunodeficiency Diseases, Nigerian Journal of Clinical Practice, 13 : 78-83.
Antinori, S., Radice, A., Galimberti, L., Magni, C., Fasan, M., Parravicini, C., 2005. The Role of Cryptococcal
Antigen Assay in Diagnosis and Monitoring of Cryptococcal Meningitis, Journal of Clinical Microbiology,
43 : 5828-5829.
Ashiru, J. O., Aleong, K., 2005. Cryptococcal Meningitis in Patients with Human Immunodeficiency Virus
Infection: Report of Three Cases, African Journal of Clinical and Experimental Microbiology, 6 : 257-260.
Chee, H.Y., Lee, K.B., 2005. Isolation of Cryptococcus neoformans var grubii (Serotype A) from Pigeon Droppings
in Seoul, Korea, Journal of Microbiology, 43: 469-472.
26
Chukwuanukwu, R., Manafa, P., Iloghalu, E., Onyenekwe, C., Ifeanyichukwu, M., Mbamalu, C., 2013a.
Cryptococcus neoformans Antigenemia in HIV Positive Pregnant Women Attending a PMTCT Clinic in
South-East Nigeria, Journal of Biology, Agriculture and Healthcare, 3 : 15-20.
Chukwuanukwu, R. C., Manafa, P. O., Onyenekwe, C. C., Anetoh, E. C., Chukwuma, C. M., Oluboyo, A. O.,
Ochiabuto, T. B., 2013b. An Assessment of The Renal, Liver Functions and Cryptococcus neoformans
Seropositivity in HIV Seropositive Individuals in Nnamdi Azikiwe University Teaching Hospital, Nnewi,
Anambra State, International Journal of Medical Science Research ASCN/2012 /181. In press.
Dzoyem, J. P., Kechia, F. A., Ngaba, G. P., Lunga, P. K., Lohoue, P. J., 2012. Prevalence of Cryptococcosis Among
HIV-infected Patients in Yaounde, Cameroon, African Health Sciences, 12 : 129-133.
Egbe, C. A., Omoregie, R., Alex-Ighodalo, O., 2015. Cryptococcus neoformans Infection Among Human
Immunodeficiency Virus Patients on Highly Active Antiretroviral Therapy in Benin City, Nigeria, New
Zealand Journal of Medical Laboratory Science, 69 : 21-23.
Eileen K. M., John R. P., 2016. Cryptococcosis, Infectious Disease Clinics of North America, 30(1): 179–206.
French, N., Grayb, K., Waterab, C., Nakiyingi, J., Lugada, E., Moore, M., Lalloo, D., Whitworth, J. A., Gilks, C. F.,
2002. Cryptococcal Infection in a Cohort of HIV-1-Infected Ugandan Adults, Acquired Immune Deficiency
Syndrome, 16: 1031-1038.
Harris, J. R., Lindsley, M. D., Henchaichon, S., Poonwan, N., Naorat, S., Prapasiri, P., Chantra, S., Ruamcharoen,
F., Chang, L. S., Chittaganpitch, M., Mehta, N., Peruski, L., Maloney, S. A., Park, B. J., Baggett, H. C.,
2012. High Prevalence of Cryptococcal Infection Among HIV-Infected Patients Hospitalized with
Pneumonia in Thailand, Clinical Infectious Diseases, 54 : 43-50.
Irokanulo, E. O., Makinde, A. A., Akuesgi, C. O., Ekwonu, M., 1997. Cryptococcus neoformans var neoformans
Isolated from Droppings of Captive Birds in Nigeria, Journal of Wildlife diseases, 33 : 343-345.
Jarvis, J. N., Lawn, S. D., Vogt, M., Bangani, N., Wood, R., Harrison, T. S., 2009. Screening for Cryptococcal
Antigenemia in Patients Accessing an Antiretroviral Treatment Program in South Africa, Clinical
Infectious Diseases, 8 : 856-862.
Junaid, S. A., Olabode, A. O., Udeani, T. K. C., Aikoye, S., 2008. Prevalence of Pulmonary Cryptococcosis in
HIV/AIDS Patients, African Journal of Infectious Diseases, 2 : 74-79.
Liechty, C. A., Solberg, P., Were, W., Ekwaru, J. P., Ransom, R. L., Weidle, P. J., Downing, R., Coutinho, A.,
Mermin, J., 2007. Asymptomatic Serum Cryptococcal Antigenemia and Early Mortality During
Antiretroviral Therapy in Rural Uganda, Tropical Medicine and International Health, 12 : 929-935.
Lin, X., Heitman, J., 2006. The Biology of the Cryptococcus neoformans Species Complex, Annual Review of
Microbiology, 60 : 69-105.
Litvintseva, A. P., Kestenbaum, L., Vilgalys, R., Mitchell, T. G., 2005. Comparative Analysis of Environmental and
Clinical Populations of Cryptococcus neoformans, Journal of Clinical Microbiology, 43 : 556-564.
Mamoojee, Y., Shakoor, S., Gorton, R. L., Sarfo, S., Appiah, L. T., Norman, B., Balakrishnan, I., Phillips, R.,
Chadwick, D., 2011. Low Seroprevalence of Cryptococcal Antigenaemia in Patients with Advanced HIV
Infection Enrolling in an Antiretroviral Programme in Ghana, Tropical Medicine and International Health,
16 : 53-56.
Meya, D. B., Manabe, Y. C., Castelnuovo, B., Cook, B. A., Elbireer, A. M., Kambugu, A., Kamya, M. R., Bohjanen,
P. R., Boulware, D. R., 2010. Cost-Effectiveness of Serum Cryptococcal Antigen Screening to Prevent
Deaths among HIV-infected Persons with a CD4+ Cell Count ≤100 Cells/µL Who Start HIV Therapy in
Resource-limited Settings, Clinical Infectious Diseases, 51: 448-455.
Micol, R., Lortholary, O., Sar, B., Laureillard, D., Ngeth, C., Dousset, J., Chanroeun, H., Ferradini, L., Guerin, P. J.,
Dromer, F., Fontanet, A., 2007. Prevalence, Determinants of Positivity, and Clinical Utility of
Cryptococcal Antigenemia in Cambodian HIV-infected Patients, Acquired Immune Deficiency Syndrome,
45 : 555-559.
Mbata, T. I, 2006. Isolation of Cryptococcus neoformans from Bats (Molossus major) Droppings in Awka Nigeria,
Sudanese Journal of Dermatology, 4 : 115-117.
Mwaba, P., Mwansa, J., Chintu, C., Pobee, J., Scarborough, M., Portsmouth, S., Zumla, A., 2001. Clinical
Presentation, Natural History and Cumulative Death Rates of 230 Adults with Primary Cryptococcal
Meningitis in Zambian AIDS Patients Treated Under Local Conditions, Postgraduate Medical Journal, 77
: 769-773.
Nweze, E. I., Kechia, F. A., Dibua, U. E., Eze, C., Onoja, U. S., 2015. Isolation of Cryptococcus neoformans from
Environmental Samples Collected in South-Eastern Nigeria: Revista do Instituto de Medicina Tropical de
Sao Paulo, 57 : 295-298.
27
Osazuwa, O. F., Dirisu, O., Okuonghae, E., 2012. Cryptococcal Antigenemia in Anti-Retroviral Naïve AIDS
Patients: Prevalence and its Association with CD4 Cell Count, Acta Medica Iranica, 50 : 344-347.
Oyella, J., Meya, D., Bajunirwe, F., Kamya, M. R., 2012. Prevalence and Factors Associated with Cryptococcal
Antigenemia among Severely Immunosuppressed HIV-Infected Adults in Uganda: A Cross-Sectional
Study, Journal of the International AIDS Society, 15 : 1-7.
Park, B. J., Wannemuehler, K. A., Martson, B. J., Govender, N., Pappas, P. G., Chiller, T. M., 2009. Estimation of
the Current Global Burden of Cryptococcal Meningitis among Persons Living with HIV/AIDS, Acquired
Immune Deficiency Syndrome, 15 : 525-530.
Patel, S., Shin, G. Y., Wijewardana, I., Vitharana, S. R., Cormack, I., Pakianathan, M., Harrison, T. S., Bicanic, T.,
2013. The Prevalence of Cryptococcal Antigenemia in Newly Diagnosed HIV Patients in a Southwest
London Cohort, Journal of Infection, 66 : 75-79.
Pongsai, P., Atamasirikul, K., Sungkanuparph, S., 2010. The Role of Serum Cryptococcal Antigen Screening for the
Early Diagnosis of Cryptococcosis in HIV-infected Patients with Different Ranges of CD4 Cell Counts,
Journal of Infection, 60 : 474-477.
Saag, M. S., Graybill, R. J., Larsen, R. A., Pappas, P. G., Perect, J. R., Powderly, W. G., Sobel, J. D., Dismukes, W.
E., 2000. Practice Guidelines for the Management of Cryptococcal Disease, Clinical Infectious Diseases,
30 : 710-718.
Salami, A. K, Ogunmodede, J. A., Fowotade, A., Nwabuisi, C., Wahab, K. W., Desalu, O. O., Fadeyi, A., 2009.
Cryptococcal Meningitis in a Newly Diagnosed AIDS Patient: A Case Report, West African Journal of
Medicine, 28 : 343-346.
Soltani, M., Bayat, M., Hashemi, S. J., Zia, M., Pestechian, N., 2013. Isolation of Cryptococcus neoformans and
other Opportunistic Fungi from Pigeon Droppings, Journal of Research in Medical Sciences, 18 : 56-60.
UNAIDS (2006). Factsheet on Sub-Saharan Africa. accessed on 26/5/2017.
http://data.unaids.org/pub/globalreport/2006/200605-fs_subsaharanafrica_en.pdf
Usman, A. D., Uba, A., 2011. A Survey of Bacterial and Fungal Opportunistic Infections among HIV Clients in
Kano Metropolis, Bayero Journal of Pure and Applied Sciences, 4 : 148-152.
Velagapudi, R., Hsueh, Y. P., Geunes-Boyer, S., Wright, J. R., Heitman, J., 2009. Spores as Infectious Propagules of
Cryptococcus neoformans, Infectious Immunology, 77 : 4345-4355.
Wajanga, B. M. K., Kalluvya, S., Downs, J. A., Johnson, W. D., Fitzgerald, D. W., Peck, R. N., 2011. Universal
Screening of Tanzanian HIV Infected Adult Inpatients with the Serum Cryptococcal Antigen to Improve
Diagnosis and Reduce Mortality: An Operational Study, Journal of the International AIDS Society, 14 : 48-
50.
Wallace, R. S., Meyer, W., Wanke, B., Costa, S. P., Trilles, L., Nascimento, J. L., Medeiros, R., Morales, B. P.,
Bezerra, C. C., Macedo, R. C., Ferreira, S. O., Barbosa, G. G., Perez, M. A., Nishikawa, M. M., Lazera, M.
S., 2008. Primary Endemic Cryptococcosis gattii by Molecular Type VGII in the State of Pará, Brazil,
Memorias do Instituto Oswaldo Cruz, 103 : 813-818.
World Health Organization (2011). Rapid advice: diagnosis, prevention and management of Cryptococcal disease
in HIV‐infected adults, adolescents and children. 5-20; accessed on 26/5/2017,
https://www.who.int/hiv/pub/cryptococcal_disease2011/
28
Available online at www.asric.org
ASRIC Journal on Health Sciences 1 (2020) 28-50
1
a Department of Public Administration, Kogi State University Anyigba- Nigeria
Received 19 December 2019; revised 30 January 2020; accepted 30 January 2020
Abstract
Nigeria has some of the most disturbing health indicators in sub Saharan Africa and indeed the world. The
WHO estimates that about 157 out of 1000 Nigerian children annually die before their fifth birthdays, from
preventable/treatable diseases. This is aside the fact that Nigeria contributes about 10% of global maternal
mortality though it hosts just 2% of the world female population. This narrative positions Nigeria as the 2nd
highest contributor to global under five mortality, and registers Nigeria as a major contributor to global disease
burden. Attempts at reversing the trend, is hinged on a health policy anchored on Primary Health Care. Ironically
however, a greater percentage of Nigeria’s health professionals prefer job placements at the secondary and
tertiary levels of health care delivery even though 53% of the population live in rural areas and are serviced by
Primary Health Care institutions. This paper interrogates leadership gaps and lapses responsible for this paradox
in Kogi State, North – Central Nigeria, while measuring its socio economic cost on the country, and indeed,
Africa. Key findings show that health human resource preferences for the other levels of health care delivery
may be the result of a yawning gap between Public Health Policy (hinged on Primary Heath Care) and
political/leadership will/commitment to implementing it. This is reflected in the lack of autonomy for Local
Government Authorities who play huge roles in the implementation of Primary Health Care, and the lack of
special incentive for health workers in rural posts. The paper recommends far reaching Human Resource for
Health policy reforms among others.
Keywords: Public Health Policy, Primary Heath Care, Health Human Resources, Local government autonomy.
1. Introduction
Nigeria is a federation of 36 states that hosts over 140, million people (NPC, 2006). Aside the fact that
it is the most populous nation in Africa; it is endowed with huge mineral resources like oil and gas. With
such huge potentials, the expectation should be that the attainment of the millennium development goals
especially in a critical sector as health would be easily realizable. However, Nigeria continues to lag
behind on almost all indices of the Sustainable Development Goals, and more so in the critical health
related goals.
The situation of maternal and child health in Nigeria is among the worst in Africa and has not
improved substantially and in northern part of the country has worsened over the past decade (Ladipo,
1 Corresponding author. +2348038132529 Email addresses: [email protected] (H. Achimugu)
29
2009). If the argument of the World Health Organization (2006) that maternal and child health is the most
important issue that determine global and national wellbeing, is anything to go by, then Nigeria is far
from being healthy.
Indeed, maternal mortality remains the leading cause of death among women of reproductive age
globally, but the situation in Nigeria is quite exceptional; for instance, Nigeria has only 2% of the global
female population but contributes 10% to the global maternal mortality burden (UNICEF, 2015).
Annually, an estimated 58, 000 Nigerian women die from pregnancy related causes out of a global total of
529,000. (WHO, 2015). A Nigerian woman’s lifetime chance of dying from pregnancy related causes is 1
in 22 (FMOH, 2016). Also, wide regional and urban/rural inequalities in maternal mortality ratios exist.
The result of survey by UNICEF (2016), reveal that the chances of dying from maternally related causes
was 6 times higher for a woman from the north compared to a woman from the south. In the same vein,
the risk of maternal death for a woman from rural region is twice that of an urban woman (National
Health Review, 2007). Similarly, Nigeria is the second largest contributor to child mortality worldwide
(WHO, 2007). Annually, an estimated one million Nigerian children aged less than five years die, a figure
that represents over 10% of global total. The National Demographic Health Survey (2018) found that
children born in the south are more likely to reach their fifth birthday than their counterparts in the north.
It also discovered that those in rural areas are 2.5 times more at the risk of death before five, than those in
the urban areas. Nigerians disease burden therefore demands both a regional as well as a rural/urban
understanding. Moreso that Nigeria has the highest TB burden in Africa and is fourth out of 22 TB high
burden countries that contribute 80% to the estimated 3 million annual deaths from the tuberculosis.
(WHO,2010).
The centrality of human resources to health outcomes is today a global fact. The Nigerian Health
Review (2006) therefore argues that the heart of a nation’s health system is the workforce, and that it is
central to the turnaround of a nation’s health care quality as well as national wellbeing, hence he need for
a close examination. It is observed that apart from Egypt and South Africa, Nigeria has one of largest
stock of human resources for health in Africa (NHC, 2016). The number of registered doctors is about 54,
524, Nurses 128,918, Midwives 90,189, Dentist 2,356, and Pharmacists 13,199 among others. These
figures mean that Nigeria has 30 doctors per 100,000 population and 100 nurses per 100,000 populations
(FMOH, 2015). These ratios are above the sub Saharan average of 15 doctors and 72 nurses per 100,000
populations (World Health Report, 2017). In spite of the fairly large stock of human resources for health,
the health status of the ordinary Nigerian is one of the worst in sub Saharan Africa (HERFON, 2017).
Kogi state is one among the six states that make up Nigeria’s North Central Region. This region has
the worst health indicators compared to the South-East South-West and South-South regions. Only about
23% of women needing maternal care have access to a doctor. This is in sharp contrast to 50.8% and
38.8% in the South East and South- South respectively (NPC-NDHS, 2008). Irrespective of Kogi State’s
fairly impressive supply of human resource for health (in comparison to other states in the North-Central
Region) it continues to have about the worst health indicators in the region.
Maternal mortality is as high as 38.6% (NHC, 2010). Recorded death from communicable/preventable
diseases stands at 58.2%, while child mortality rate is 36.1% with the rural areas having the worst counts
(NDHR, 2010). This rather appalling indicator makes Kogi State a major contributor to Nigeria’s poor
health status as well as its poor supply of health human resources are capable of propelling the nation
further away from the SDGs. Kogi State’s huge disease burden amidst a fairly large supply of human
resource for health is quite paradoxical and therefore calls for a critical analysis.
From the issues raised above, there are very clear gaps in extant knowledge to underscore the necessity
of this study. Ogundeji, (2002), carried out a comprehensive study of primary health care institutions in
Nigeria and found among other things that they were mere structures without equipment and health
human resources to man them. Similarly, Iyayi, (2007) carried out a national desk study of the social
determinant of health and establish the fact that the primary and secondary level of health were starved of
adequate human resources. While these studies were in-depth and strategic, none focused on the situation
in Kogi State and how its case differs from other states and regions in Nigeria.
30
Furthermore, Lambo, (2008), while establishing a link between poverty, health and sustainable
development in Africa argues that health work force motivation in Africa is at a record low. Using the six
geo-political zones as units of analyses, he shows how rural medical/health workers turnover rate was
very high as a result of low morale. Kogi State was not chosen in that study/analysis, neither did the study
engage in a comparative analysis of rural and urban areas. An MSH, (2010), study also focused on
motivation but discussed the uneven distribution of health human resources in Nigeria, between tertiary,
secondary and primary health care facilities. It did not focus on any particular state neither did it focus on
the rural/urban dimensions of the challenge. This represents a major gap in extant knowledge that must be
understood for the purpose of repositioning the Nigerian public health sector.
2. Methods and Techniques
This research adopts a survey design. Hence, Interviews were conducted and questionnaire
administered on the study population consisting of both junior and senior professional staff of
government owned primary and secondary health care facilities in Kogi state. A content analysis of some
related secondary materials was also embarked upon to show clear understanding of the issues under
examination and to discover gaps in extant literature/knowledge which this research seeks to fill.
2.1 Survey Design
Since the research has a state wide coverage, it was imperative to make the study population and
sample, as representative as possible. Hence, Kogi State’s 21 local government areas were classified
along urban, semi-urban and rural divides (Using the availability of some social and economic amenities
like; electricity, good roads, good/functional hospitals, pipe borne water and volume of economic
activities as yard stick).
One local government each was selected from the three clusters, each representing one of Kogi State’s
three senatorial zones (Kogi-Central, Kogi-East and Kogi-West). Lokoja was therefore purposively
selected to represent urban areas, Okene to represent semi-urban areas and Ofu to represent rural areas.
A 35 question research instrument (questionnaire) was administered on the sample population, using
proportional equal allocation method. This was to ensure that each local government had respondents
selected in proportion to its population. Hence, achieving balance and representativeness, in the selection
of respondents for the study, per local government.
Interview
An unstructured interview was also used in this study. This was majorly to substantiate and give
indepth explanations to the information given in the questionnaire.
Three groups of respondents were interviewed. First, opinion leaders/residents of the research area.
Second, Medical/Health workers and senior staff members of the local government Health Department.
This was in a bid to harness the views of the service providers, service beneficiaries and policy
implementers in order to arrive at a better understanding of the variables under examination.
The interview method is important in this regard because, a large number of people in the host
communities are not educated. It is also important because a good number of the top local government
health department officials may not be readily available and willing to sit over a questionnaire of 35
questions.
Content Analysis
Human resource for health care is a global challenge with regards to meeting health related
Millennium Development Goals. Hence, a lot of arguments abound with regards to how the challenge can
be overcome. This study therefore relied to a large extent on secondary sources.
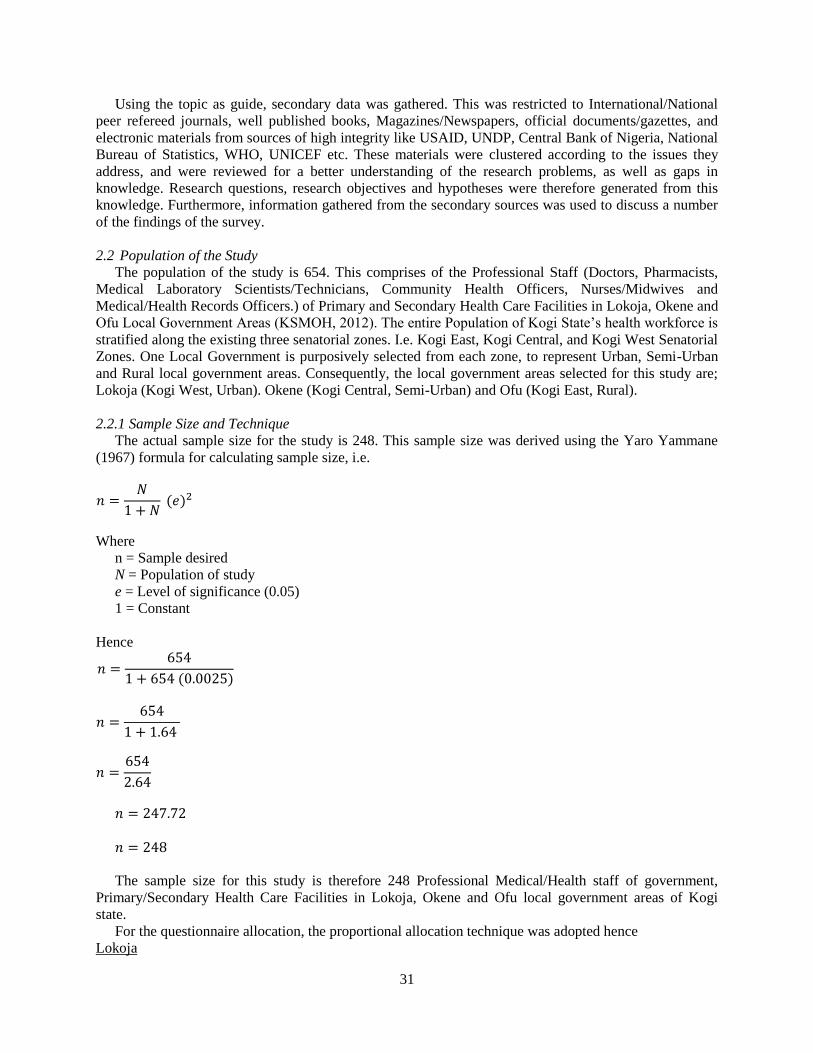
31
Using the topic as guide, secondary data was gathered. This was restricted to International/National
peer refereed journals, well published books, Magazines/Newspapers, official documents/gazettes, and
electronic materials from sources of high integrity like USAID, UNDP, Central Bank of Nigeria, National
Bureau of Statistics, WHO, UNICEF etc. These materials were clustered according to the issues they
address, and were reviewed for a better understanding of the research problems, as well as gaps in
knowledge. Research questions, research objectives and hypotheses were therefore generated from this
knowledge. Furthermore, information gathered from the secondary sources was used to discuss a number
of the findings of the survey.
2.2 Population of the Study
The population of the study is 654. This comprises of the Professional Staff (Doctors, Pharmacists,
Medical Laboratory Scientists/Technicians, Community Health Officers, Nurses/Midwives and
Medical/Health Records Officers.) of Primary and Secondary Health Care Facilities in Lokoja, Okene and
Ofu Local Government Areas (KSMOH, 2012). The entire Population of Kogi State’s health workforce is
stratified along the existing three senatorial zones. I.e. Kogi East, Kogi Central, and Kogi West Senatorial
Zones. One Local Government is purposively selected from each zone, to represent Urban, Semi-Urban
and Rural local government areas. Consequently, the local government areas selected for this study are;
Lokoja (Kogi West, Urban). Okene (Kogi Central, Semi-Urban) and Ofu (Kogi East, Rural).
2.2.1 Sample Size and Technique
The actual sample size for the study is 248. This sample size was derived using the Yaro Yammane
(1967) formula for calculating sample size, i.e.
𝑛 =𝑁
1 + 𝑁 (𝑒)2
Where
n = Sample desired
N = Population of study
e = Level of significance (0.05)
1 = Constant
Hence
𝑛 =654
1 + 654 (0.0025)
𝑛 =654
1 + 1.64
𝑛 =654
2.64
𝑛 = 247.72
𝑛 = 248
The sample size for this study is therefore 248 Professional Medical/Health staff of government,
Primary/Secondary Health Care Facilities in Lokoja, Okene and Ofu local government areas of Kogi
state.
For the questionnaire allocation, the proportional allocation technique was adopted hence
Lokoja
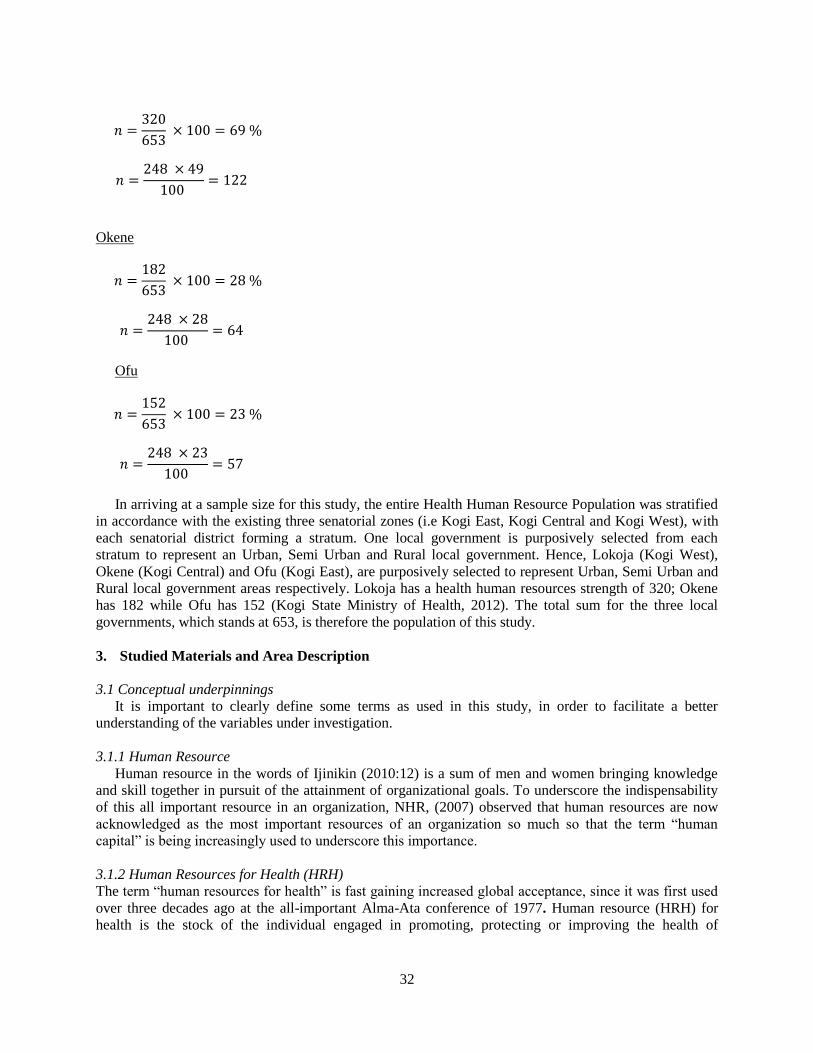
32
𝑛 =320
653 × 100 = 69 %
𝑛 =248 × 49
100 = 122
Okene
𝑛 =182
653 × 100 = 28 %
𝑛 =248 × 28
100 = 64
Ofu
𝑛 =152
653 × 100 = 23 %
𝑛 =248 × 23
100 = 57
In arriving at a sample size for this study, the entire Health Human Resource Population was stratified
in accordance with the existing three senatorial zones (i.e Kogi East, Kogi Central and Kogi West), with
each senatorial district forming a stratum. One local government is purposively selected from each
stratum to represent an Urban, Semi Urban and Rural local government. Hence, Lokoja (Kogi West),
Okene (Kogi Central) and Ofu (Kogi East), are purposively selected to represent Urban, Semi Urban and
Rural local government areas respectively. Lokoja has a health human resources strength of 320; Okene
has 182 while Ofu has 152 (Kogi State Ministry of Health, 2012). The total sum for the three local
governments, which stands at 653, is therefore the population of this study.
3. Studied Materials and Area Description
3.1 Conceptual underpinnings
It is important to clearly define some terms as used in this study, in order to facilitate a better
understanding of the variables under investigation.
3.1.1 Human Resource
Human resource in the words of Ijinikin (2010:12) is a sum of men and women bringing knowledge
and skill together in pursuit of the attainment of organizational goals. To underscore the indispensability
of this all important resource in an organization, NHR, (2007) observed that human resources are now
acknowledged as the most important resources of an organization so much so that the term “human
capital” is being increasingly used to underscore this importance.
3.1.2 Human Resources for Health (HRH)
The term “human resources for health” is fast gaining increased global acceptance, since it was first used
over three decades ago at the all-important Alma-Ata conference of 1977. Human resource (HRH) for
health is the stock of the individual engaged in promoting, protecting or improving the health of
33
populations and all people primarily engaged in actions with the primary intent of enhancing health
(NHR, 2006:213).
3.1.3 Health Human Resource Preferences
This refers to the Level of health care delivery and work location a medical/health worker prefers to
work in. Health care delivery in Nigeria is stratified along the lines of Primary, secondary, and tertiary
health care. It equally refers to the specific geographical location i.e Urban, semi-Urban or rural.
3.1.4 Primary Health Care
Facilities at this level serve as the entry point of the community into the health care delivery system.
These facilities include health centers, clinics, dispensaries, and health posts. They provide general
preventive, curative, promotive, and pre-referral care to the population. Primary facilities are staffed by
nurses, community health officers, community health extension workers (CHEWs), junior CHEWs, and
environmental health officers. Most private sector practitioners also provide health care at this level
(FMOH, 2008).
3.1.5 Secondary Health Care
Secondary care facilities, including general hospitals. They provide general medical and laboratory
services, as well as specialized health services, such as surgery, pediatrics, obstetrics and gynecology to
patients referred from the primary health care level. Medical officers, nurses, midwives, laboratory and
pharmacists, and community health officers typically staff general hospitals. Primary and secondary care
is also provided by the largely unregulated private health sector, which includes a wide range of providers
such as physician practices, clinics, and hospitals (FMOH, 2008).
3.1.6 Tertiary Health Care
Tertiary level facilities form the highest level of health care in the country. Tertiary health care, consist
of highly specialized services, care for specific disease conditions or specific group of patients. These
include specialist and teaching hospitals and Federal Medical Centers (FMCs). They manage patients
referred from the primary and secondary levels and have special expertise and full-fledged technological
capacity that enable them to serve as resource centers for knowledge generation and diffusion. Each state
has at least one tertiary health facility. Selected centers are encouraged to develop special expertise in the
advanced modern technology thereby serving as a resource for evaluating and adapting these new
developments in the context of local needs and opportunities. Current efforts to supply modern hospital
equipment to health facilities are limited to federal tertiary hospitals. There are 15 Federal Teaching
Hospitals located in Ibadan, Lagos, Benin, Ile-Ife, Ilorin, Enugu, Nnewi, Calabar, Port-Harcourt, Jos,
Kano, Zaria, Maiduguri, Irrua and Sokoto. Currently 9 hospitals are equipped and efforts are on the way
to equip the other 6 hospitals (IIM, 2013). This is a medical equipment initiative, and state- of- the -art
equipment have been supplied and installed, and most are in use. There however remains a huge problem
of shortage of workers to operate these equipment, especially in radiography and radiotherapy (IIM,
2013).
Health service provision in Nigeria includes a wide range of providers in both the public and private
sectors, such as public facilities managed by federal, state, and local governments, private for-profit
providers, NGOs, community-based and faith-based organizations, and traditional care givers. Pharmacies
provide health care service in the form of drugs and supplies. The health sector is characterized by wide
regional disparities in status, service delivery, and resource availability. More health services are located
in the southern states than in the north (Oloriegbe, 2007).
3.1.7 Professional Medical/Health Workers
The group of health personnel regarded to as professional health workers are those required to be
licensed before they can practice. They include medical doctors, dentists, pharmacists, medical laboratory
34
scientists/technicians, nurses/midwives, community health extension officers/workers, environmental
health officers, radiographers and medical records officers (WHO, 2006: 112).
3.2 History of Health Care Delivery in Nigeria
The geographical entity known today as Nigeria came into formal existence in 1914 with the
amalgamation by the British colonial government of its northern protectorate with the southern
protectorate which had earlier, in 1906, been joined with the Lagos colony, the latter of which itself was
annexed to Britain in 1861. However, the verifiable medical history of Nigeria dates back to the 15th
century, in forms that are related to trading activities on the Atlantic coast and across the Sahara
(Schrams, 1966).
For several reasons, it is difficult to define precisely the beginning of the colonial era, and therefore
the nature and corresponding succinct impact of colonization in Nigeria. If 1861 is taken as the pivotal
point, it would exclude the preceding six decades that witnessed the overthrow (in 1804) in the north, of
indigenous Hausa rule by Fulanis, itself an enduring act of colonization, in the mode of similar events
replicated throughout history. (Ogunlesi, 2003). Although considerable changes in the socio-cultural
fabrics of the indigenous communities are likely to have taken place, the scantiness and in most cases,
lack of ready access to any reliable documented information on the impact of the Fulani take over and
incursion on the health system of the region, inevitably means that this facet of the history of the Nigerian
health sector will not comprise a definitive feature in this review. This notwithstanding, there is
substantial residual evidence in the north, of the influence of ancient Arabic and Persian medicine
transferred across the trans-Saharan trade routes, as was the corresponding and more prevalent non-
indigenous western medicine across the Atlantic Ocean. (Adetokumbo, 2009).
Schram (1966) drew attention to a variety of appellations for medical careers in different parts of the
country in the pre colonial period. Some examples are, in the north, the Wonbai or first aider, and the
Gozam, an all purpose barber surgeon in Nupeland. A medicine man that used magic was known as a
Cigbecizi. In Ibo land medicine men were generally referred to as Dibias while the general practitioner in
Yoruba land was known as and popularly referred to as the Adahunse.
3.2.1 Pre- Colonial Era
In the first phase of the pre-colonial era, all communities had some form of organized social structure
an important component of which was a health care system. Attention for the provision of personal health
care usually centered on individuals with acknowledged expertise in preventive, curative and
rehabilitative medicine (Ogunlesi, 2003). The knowledge, skills and expertise of the various traditional
health practitioners were passed down generations within their families, to kith and kin. Such knowledge
and skills were closely guarded secrets seeing that the practitioner made his living, and the means of
sustenance of his dependants (the nuclear and extended family), through his successful dispensation of
personal health care. Invariably, over the years, some individuals took on the mantle of specialists, e.g. in
midwifery (the equivalent modern practitioners of who are pejoratively and condescendingly referred to
as traditional birth attendants [TBAs]); treatment of psychological disorders; orthopedics etc. Others were
generalists to whom clients turn for a variety of ailments ranging from infertility and impotence, through
persistent feverishness, loss of weight, chronic skin ulcers, haemoptysis, etc. the most successful of such
practitioners were very highly regarded and respected in their communities (WHO, 1999). There was of
course, an admixture of witchcraft and practice of traditional herbalism, with the use crude forms of
therapeutically active concoctions, shades of which still persist in some communities (Giues, 1998).
Although not conversant with modern germ theory of disease causation or the fundamental scientific
basis of such complex issues like generics and immunology, these ancient (pre-colonial) communities had
established, and were governed by sets of rules and regulations that were based on years of carefully
accumulated observations and analysis that promoted good public health and limited the transmission of
disease through communicability or inheritance (Dugary, 1980). There were prescribed penalties and
enforceable sanctions for any breach of the communal regulations. There were, unfortunately and
inevitably of course, socio-cultural practices and taboos that were injurious to personal health or
35
compromised public health. Notable among these were the practice of female circumcision and the use of
non-sterile instruments, like a piece of bamboo stick, to cut the umbilical cord of the newborn, with their
well-documented adverse consequences. Uninformed post-natal care contributed to high maternal
mortality, while high infant and child mortality rates induced families to encourage and pursue high birth
rates to make up for attendant wastages. Only hardly children survived to work the farms and bear
children of the next generation. It was a matter of survival of the fittest. (NHR, 2007).
The above was the general scenario at the time the first ocean-going Europeans made initial contact
with the indigenous Nigerian populations. Commerce, which was the primary motive of the initial
contacts, soon became a highly lucrative slave trade. As the trade in human cargo intensified, expanded
scourge of locally endemic diseases, notably malaria, yellow fever and the ubiquitous dysenteric
diarrheas, to which the previously unexpected European slave traders were subjected, compelled the
proprietors of the slave trade to introduce limited forms of medical care facilities for their staff (Adewusi,
2005).
Throughout this period, the medical care facilities were based and available, only on board the slave
ships. The slave traders never ventured inland beyond the coast where slaves were brought. The slaves
were held in transit fortresses situated along the way, prior to their transfer to the slave ships. In due
course, high morbidity and mortality among the slaves, which meant a proportionate loss of revenue to
the slave traders, led to some measure of improvement in the appallingly unhygienic condition under
which slaves were kept in transit, particularly on board ships, during the perilous journey across the
Atlantic Ocean to the ultimate slave markets. A significant adverse consequence (side-effect) of the slave
trade was the two way trans-continental spread of infectious diseases to which the recipient non-endemic
populations had no previous exposure or immunity, with dire consequences in most cases. (Ogunlesi,
2003).
3.2.2 The Colonial Era
The end of the slave trade in the late 19th century brought in its wake to the west coast of Africa a
rapid and sustained influx of various, mainly Europe-based, religious missions and trading organizations.
These ventured much further inland, by road and up the River Niger its tributaries, as well as Ogun and
Cross Rivers, than the slave traders did. This could be regarded as the, albeit stuttering, beginning of the
colonial period with regard to the evolution of the health services. The establishment of a formal
administrative structure intended primarily to coordinate and protect the interest of the British trading
companies led to the appointment of John Beecroft as the first British consul, based in Lagos, Nigeria, in
1849. This was followed soon after by the appointment of another consul, in Calabar, a dozen years
before the formal annexation of the colony of Lagos by Britain (Dugan, 1920).
It is difficult to define a clear period of transition from traditional to modern medicine. Records
however indicate that western type medical care was first introduced in the Nigerian territory (in the
Benin district), in the second half of the 15th century through the Dutch west indices company. The care
was provided for the trading staff in their outposts and not into the indigenous African population. No
hospitals were built on the mainland until the latter part of the 19th century, but existed in offshore islands
three centuries earlier. (Schram. 1996).
A Dr. Williams of Britain was credited with carrying out, in mid-19th century, several vaccination
sessions and dressing of ulcers on indigenous populations along the west coast of Africa, including the
Niger Delta and up to Lokoja. (Schram, 1966). The growth and development of health services in the
colonial period can be divided into two main complementary categories. The first is the provision and
delivery of health care through the establishment of health care facilities, and the second is the supply
through recruitment and training of health manpower.
2.3.3 Provision of Health Services
Although the traders had brought with them a few doctors and nurses to look after themselves and
communities, it was the missionaries that introduced the major definitive modern medical care into the
Nigerian territory in the 1860s. A detailed catalogue of the health care facilities provided by the
36
missionaries during the colonial period is beyond the scope of this chapter. However, it is of historical
importance to describe briefly the general pattern of the evolution of these facilities and the subsequent
development and growth of the health sector under the colonial administration and the government and
people of Nigeria. A few examples would help to illustrate this point. Understandably the distribution of
the health care facilities provided by the religious missions coincided with the geographical location of
their missionary activities, although inevitably there were, and still are, considerable territorial overlaps
between the missions spheres of influence (Lucas, 1998).
The first set of Roman Catholic nuns in Nigeria lived in a convent on broad street, Lagos in 1873. In
1886, a pioneering set of nuns, led by a sister Maira of Assumption, moved to Abeokuta and worked
under father Francois, founder of the first full-fledged land-based hospital, the famous sacred heart
hospital, in Abeokuta while the Roman Catholic Mission continued its pastoral and health related work in
the south western parts of the country, it ultimately held sway in most of south eastern and mid-western
Nigeria. (Ogunlesi, 2003). In this regard the contribution of Catholic Missionaries from the Republic of
Ireland to medical work in Nigeria, in all their mission posts to their adherents and beyond has been most
extraordinary.
The Presbyterian Mission also operated in south-eastern Nigeria. One of the most celebrated and a
devoted missionary of this period was Mary Slessor (1848-1915) a Schottish lady recruited by the foreign
mission board of the United Presbyterian Church of Scotland (UPCS). She worked for four decades in
Calabar where she died and was buried. It is noteworthy that the famous Rev. Hope Waddell, an Irish
man, also of the UPCS but whose missionary work in the Calabar area preceded that of Slessor by 30
years, and many of his missionary colleagues were not health professionals, but received training and
acquired relevant skills which enabled them to run clinics and dispensaries in and around Calabar. The
first record of vaccination against smallpox was conducted by Rev. Waddell in Calabar in the mid-1950s.
(WHO, 2003). The Church Missionary Society (CMS) Yoruba mission was founded and spearheaded by
Henry Townsend (1813-1886) and David Hinderer who oversaw the mission’s operation in Lagos and
Abeokuta. The mission later extended its activities to Badagry. In early 1850s, a dispensary available to
all comers was opened for three days a week in Abeokuta. In1864, the Reverend Samuel Adayi Crowther
was consecrated by the Church of England as the Bishop of Western Equitorial Africa beyond Queen’s
Dominion, and soon thereafter undertook a mission up the Niger as far as Lokoja and then to Calabar by
way of the Cross River and on to south Cameroon. The establishment of various healthcare posts
followed in the wake of Crowther’s Episcopal missions. Anglican and Methodist missions were all in the
forefront of the provision of care in dispensaries and maternity centres as well as home nursing. (Schrams,
1966). The Qua Iboe Mission founded in 1891 established a number of dispensary and maternity services
in southern Nigeria as did the Baptist Mission with one of its most outstanding and extant legacies being
the mission’s famous hospital in Ogbomosho .
The reputed Iyi Enu hospital, (near Onitsha) was built by a coalition of the protestant missions in
1906. The Sudan United Mission (SUM) inaugurated in 1904 concentrated its activities in the middle belt
area of the country while the Sudan Interior Mission (SIM) founded in 1893 worked in the core,
predominantly Islamic north operating in the early days, two medical stations in Bida and Pategi
(Ogunlesi, 2003). Many of the mission hospitals have continued to provide important healthcare services,
especially in northern Nigeria, even in the post colonial period. In south-western Nigeria, frequent
internecine conflicts during this period tended to disrupt missionary work, including medical services.
(NHR, 2006). Unfortunately, uncongenial environmental conditions led to a high rate of morbidity and
mortality among the pioneering European missionaries, many of whom “died of fever or returned home
with their health permanently wrecked” (Kingsley, 1897:63). To avoid duplication and ensure reasonable
geographical spread of medical and health care facilities, there was an agreement by the stakeholders
regarding where each of the early missionary societies shall work.
The first set of medical facilities provided by the British colonial government consisted of clinics and
hospitals situated in Lagos and Calabar and other coastal trading posts. The first government hospital in
Calabar, St. Margaret’s, was built in 1896. Establishment of these health facilities was gradually
expanded to other parts of the country in tandem with the spread of the activities of the colonial
37
enterprises. Access to the medical services was for many years limited to Europeans, and later granted,
for commercial self-interest preservation motives, to African staff of the European organizations.
(Schrams, 1996).
The first sets of hospitals in the colonial period were “bush hospitals constructed of grass thatch,
bamboo and mud, to meet the needs of the military during the First World War” (Schrams, 1966). For
most of the colonial period, general hospitals fell into two broad categories:
1. European hospitals that were later designated as “Nursing Homes” and
2. ‘African’ hospitals that became the later date general hospitals, with private and public wards.
The early colonial period also witnessed the establishment of specialized health care institutions, most
of which were concentrated in Lagos. These include an infectious diseases hospital and the Yaba
Lunatic/Mental Asylum (better known in the post-colonial period and to date as the Yaba
Neuropsychiatry Hospital). The Calabar mental asylum was built in 1904. Other Specialist Medical
Centres like the Igbobi Orthopedic Hospital and the Massey Street Dispensary (1903), later the Greek
hospital in Lagos was built in 1925 by a Dr. G.M Gray but was later bought over by the government.
(NHR, 2007).
The first leper settlement was established in 1897 by father Coquard, an ordained Priest with some
medical training though he never qualified as a doctor. (FMOH, 2004).
The first inspector of Nuisances was gazetted in 1877, and a medical and sanitary department was
created in Lagos in 1897.
3.3 Primary Health Care and health care policy in Nigeria
The National Health Policy was adopted in 1988 and was reviewed in 2004, and more recently in
2016. All the new versions interestingly retains PHC as the key approach.
The underlying principles of the modified National Health Policy are as follows;
The principles of social justice and equity and the ideals of freedom and opportunity that have been
affirmed in the 1999 Constitution of the Federal Republic of Nigeria, health and access to quality and
affordable health care is a human right. Equity in health care and in health for all Nigerians is an ideal
goal to be pursued; Primary Health Care (PHC) is to remain the basic philosophy and strategy for national
health development, Good quality health care is to be achieved through cost-effective interventions that
are targeted at priority health problems. A high level of efficiency and accountability shall be maintained
in the development and management of the national health system, Effective partnership and
collaboration between various health actors is to be pursued, while safeguarding the identity of each.
Since health is an integral part of overall development, inter-sectoral cooperation and collaboration
between the different health-related Ministries, development agencies and other relevant institutions shall
be strengthened; and a gender sensitive and responsive national health system shall be achieved by
mainstreaming gender considerations in the implementation of all health programmes (National Health
Policy, 2004).
The overall policy objective is to strengthen the national health system such that it will be able to
provide effective, efficient quality, accessible and affordable health services that will improve the health
status of Nigerians through the achievement of the health-related Social Development Goals (SDGs).
Hence, the main health policy targets are the same as the health targets of the Social Development Goals,
namely:
The Federal Government has also undertaken a series of steps aimed at reforming the national health
system and strengthening the strategies. The reform also relates to the National Economic Empowerment
and Development Strategy (NEEDS) and is being developed in the context of the African Union New
Partnership for African Development (NEPAD). One feature of the new reform is the decision to develop
and expand public-private partnerships. In this way, private contributions will serve to expand the
provisions from the health sector and also to align private health programmes more closely with national
policies. (NHC, 2009).
38
3.4 Status of the Nigerian Health Care Delivery System
Recent assessments of the health care system in Nigeria indicate that it is not only dismal; efforts to
improve it over the years have been insignificant (Ogunkelu, 2010). Indeed, Nigeria lags behind many
other African countries on various health indicators. A World Health Organization evaluation of the
health situation in different parts of the world placed Nigeria 137 out of 191 countries that were surveyed
in 2016 (WHO, 2016). Indeed UNDP’s Human Development Report (2013) ranks Nigeria 153 out 186
countries in the world in terms of overall human development. Ghana is ranked 135 while South Africa is
ranked 121 on the HDI. Compared with South Africa and Ghana, the indices for life expectancy, infant
mortality and maternal mortality rates are much higher in Nigeria than in these other countries. (Kpamor,
2012).
Given the fact that Health human resources is central to all health outcomes, the overall performance
of the health system in Nigeria can be seen as a direct consequence of the dismal situation of health
human resource ( Iyayi 2009:108). As Gupta et al (2004:75) reported in a survey of the situation in some
health care facilities in Nigeria. Simple treatments for easy to diagnose conditions such as childhood
diarrhea, that is oral rehydration solution (ORS) sachets, were not available in 70% of the facilities
surveyed. Strengthening of policies on preventive health care is also urgent in light of evidence that
public health surveillance may be particularly poor in rural areas. Lack of cold storage equipment meant
that vaccines were not available in a majority of locations. The survey also found that morale was
typically low among staff. These findings support the observations from an earlier study by Ogundeji
(2001) who reported acute staff shortages in health facilities in several states across the country. While
the poor performance of the health system in Nigeria can be attributed to different factors, the human
resources factor plays a predominant role. For this reason, efforts to improve the health care performance
must understand the nature of this contributory factor and how it can be more adequately managed.
(NHC, 2009).
3.5 Availability and Distribution of Health Human Resources in Nigeria.
Although the availability of various resources such as funds, drugs, materials and facilities impact
upon the performance of health care systems, the availability, distribution, quality, mix and motivation of
human resources has greater impact upon Primary and secondary healthcare than any of the other factors,
(NHC,2009). The number of health personnel available also has a greater impact upon access to different
types of care and therefore to desired health outcomes. It determines the workload of health professionals
and their ultimate level of productivity. Available data shows that there are shortages being highest
among doctors, nurses, laboratory scientists and radiologists in Nigeria, (NHR, 2006). For example,
Nigeria has far fewer numbers of births attended to by health professionals than Ghana, and South Africa,
(UNDP, 2005). In fact, the number of births attended by skilled health personnel in Nigeria was 35% and
below the average for Sub Saharan Africa (41%)and Ghana(44%)as well as South Africa (84%) over the
period of 1995- 2003, (Iyayi, 2007). Nigeria also has far fewer doctors per 100,000 of the population than
South Africa.
Apart from the problems of numbers, health professionals also tend to be more concentrated at the
higher levels of care than at the primary health care level. It is thus not surprising to find that access to
antenatal and post natal care by the type of provider as well as attendance of a mother during birth by type
of health personnel varies across the geo- political zones of the country. In the case of access to antenatal
care, only 5.4% of women in the North West were attended to or had access to a doctor. A large number
of women (54%) were not attended to by any one. These figures are in sharp contrast with the South West
zone where 56.0% of the women had access to a doctor and another 35.9% had access to nurse/midwife.
Health outcomes in terms of maternal mortality rates also vary in relation to level of access to health
personnel across the geo-political zones.
3.6 An Overview of the Nigerian Health Care System
Nigerian health system includes orthodox, alternative and traditional systems of health care delivery.
The government recognizes and regulates these three systems. There are three levels of health care
39
delivery: primary, secondary and tertiary. These are managed by Local, State and Federal Governments
respectively (NHC, 2009). The formal health sector is operated with primary health care as the
cornerstone of the National health policy (Oloriegbe, 2007).
Nigerian health status indicators are very poor with very slow improvement in key health indicators.
Today Nigeria ranks among the countries with highest child and maternal mortality rates (UNDP,2010).
The health sector is characterized by wide regional disparities in health status, service delivery, and
resource availability. More health services are located in the southern states than in the north. The formal
health information system is at the early stage of implementation. However reliable health indicators are
available through by the Federal and State Ministries of Health, the National Population, and National
Bureau of Statistics with significant support of the partners (NHR, 2006).
3.7 Health Human Resources Utilisation in Nigeria
Health workers are employed both in public and private sectors. In the private sector, though there is
optimal utilization of workers, however, salaries and wages are far below those of their contemporaries in
the in the public sector (Gupta, 2003). Private sector workers used to earn more than public sector
workers before 1990, however in the public sector, there had been regular salary increases over the years,
which is as a result of negotiations prompted by health workers associations, that have been influencing
the salary of health workers in the public sector, the Nigerian Medical Association (NMA) is particularly
articulate and powerful (WHO,2008).
Though the Federal government continues to promise significant increase in remuneration of health
workers in the public sector, this increase would only affect Federal health workers (Health is on the
concurrent list in Nigeria, that is each level of government determines what it spends on health) (UNDP,
2011). State government and Local government health workers would have to negotiate their
remuneration (which is usually lower than what the Federal government offers), with their respective
authorities. It may also be important to note as Ogundeji (2011) observes, that even Federal health
workers do not earn what their contemporaries working for international agencies, corporations and oil
companies earn. While in the public sector, health workers are not utilized as efficiently as those in the
private sector (Iyayi, 2006). This becomes evident during the nights and weekends when there is poorer
provision of workers in public health facilities. Currently, the health workforce is top heavy due to freeze
on employment in the past; junior workers deliver the crucial weekend and night duties. The conventional
duty roster deploys workers in three shifts of morning, afternoon and nights. However some states like
Lagos States have only two shifts namely morning (8.00 a.m. to 4.00 p.m.), and night (4.00 p.m. to 8.00
a.m.). The night shift is therefore for a period of 16 hours. In a 7-day cycle the worker does 2 mornings, 2
nights and 3 off days. There is however no change in remuneration (NHC, 2009).
4. Results
Table 1 indicates that 24 respondents representing 12.4% would prefer the primary health care level,
58 respondents representing 29.9% showed preference for the secondary health care level, while 112
respondents representing 57.7% would prefer to practice their profession at the tertiary health care level.
This statistics hold a lot of implication for health care delivery in Kogi State and indeed Nigeria.
The WHO (2011) argues among other things that the primary and secondary levels of health care are
majorly responsible for a nation’s health status. The implication therefore is that if these levels of health
care cannot attract and retain qualified and well-motivated workforce, it begins to underperform with all
the attendant negative influence on national wellbeing. At the national stage this problem is a huge
challenge. Iyayi, (2007) states that apart from the problem of number, health professionals also tend to be
more concentrated at the higher levels of care than at the primary care level. This issue remains a huge
challenge because; the tertiary health institutions are not only very few but are also far away from the
grassroots. More worrisome however is the fact that the primary and secondary levels of health care are
the levels of care available to the rural populace and if this level cannot attract the best of health human
40
resources it leaves a large section of Nigeria without quality health care and service access, since over
60% of Nigerians live in the rural areas (Nigeria Health Review, 2012).
While indicating reasons for the huge preference for tertiary health care, 83% of the respondents who
preferred tertiary health care identified a conducive work environment and better remuneration as their
motivation, while 17% indicated family comfort and opportunity for further training/development as the
motivation. It is therefore important to note that the preference of respondents is majorly centered on the
job environment and not actually the job content, work load and other such considerations.
Table 2 indicates that only 30 respondents (15.5%) would prefer to work in the rural area while an
amazing 63.9% of respondent opted for the urban area. This lopsided preference in favour of urban areas
has become a very glaring characteristic of Nigeria health human resources distribution. For a state as
Kogi which has few urban centers and a whole lot of rural areas, the implication of this preference
remains very huge and worrisome. If it is on the global stage described by Annan (2012) as a recipe for
national health failure, then its implications for Kogi State and indeed Nigeria is more gory and
worrisome. This tough line is canvassed because about 70% of the Kogi State population resides in the
rural areas (KCSDA, 2011). If only 15.5% of the health human resources under investigation would
prefer working in rural areas, then 70% of Kogi State indigenes would have very slim hopes of accessing
quality health care. The concern therefore is that 70% of citizens cannot be unable to access quality health
care and the State would be healthy.
As to why a huge 63.9% of respondent would prefer the urban area, 37% of respondent who prefer
urban areas cited opportunities for further training/development, 61% cited better living/working
conditions, while a meager 2% state’ other reasons.
The tables 3, 4 and 5 show the job location preference of health human resources working in urban
(Lokoja), semi-urban (Okene) and rural areas (Ofu). Data presented above clearly indicates preference of
health human resources in Kogi State for urban areas. Health workforces in urban areas show preference
for urban areas by 73%, as against 10.2% preference for rural posts. Health human resources in semi-
urban areas still show higher preference for job posts in urban areas by 44% as against 24% preference for
semi-urban areas. Interestingly, health workforce in rural areas still show preference for working in urban
posts by 63% as against 8.7% of respondents who opted for the rural areas.
This trend continues to be an issue of great concern especially with regards to meeting up with health
related Social Development Goals, giving the fact that 2015 is only two years away. If about 70% of the
Kogi State population according to KCSDA (2011) reside in the rural areas and the bulk of Kogi State’s
health human resources prefer job post in urban centers, than the rural areas. With this trend, the
attainment of health related Social Development Goals in Kogi State may be in jeopardy. This is because
the access of 70% of any population to qualitative health services would definitely be key to the kind of
health outcomes that characterises that given population.
In explaining why a large stock of health human resources in Kogi State would prefer urban post to
the rural ones, 16% of respondents cite better opportunity or further Career/Professional development,
52% cited the availability of vital social amenities (electricity, pipe born water and good roads) as reason
for their preference for urban areas, While 32.2% cited the lack of special incentives for rural health
workers as reason. These factors are therefore pivotal to attempts at motivating and retaining competent
health human resources at the rural level in Kogi State.
Table 1: Level of Health Care Delivery of Respondents Practice Preference
Primary Health Care Secondary Health Care Tertiary Health Care Total
24 (12.4%) 58 (29.9%) 112 (57.7%) 194
Source: Field Survey
Table 2 Job Location of Respondents’ Preference
Urban Semi-urban Rural Total
124 (63.9%) 40 (20.6%) 30 (15.5%) 194
Source: Field Survey
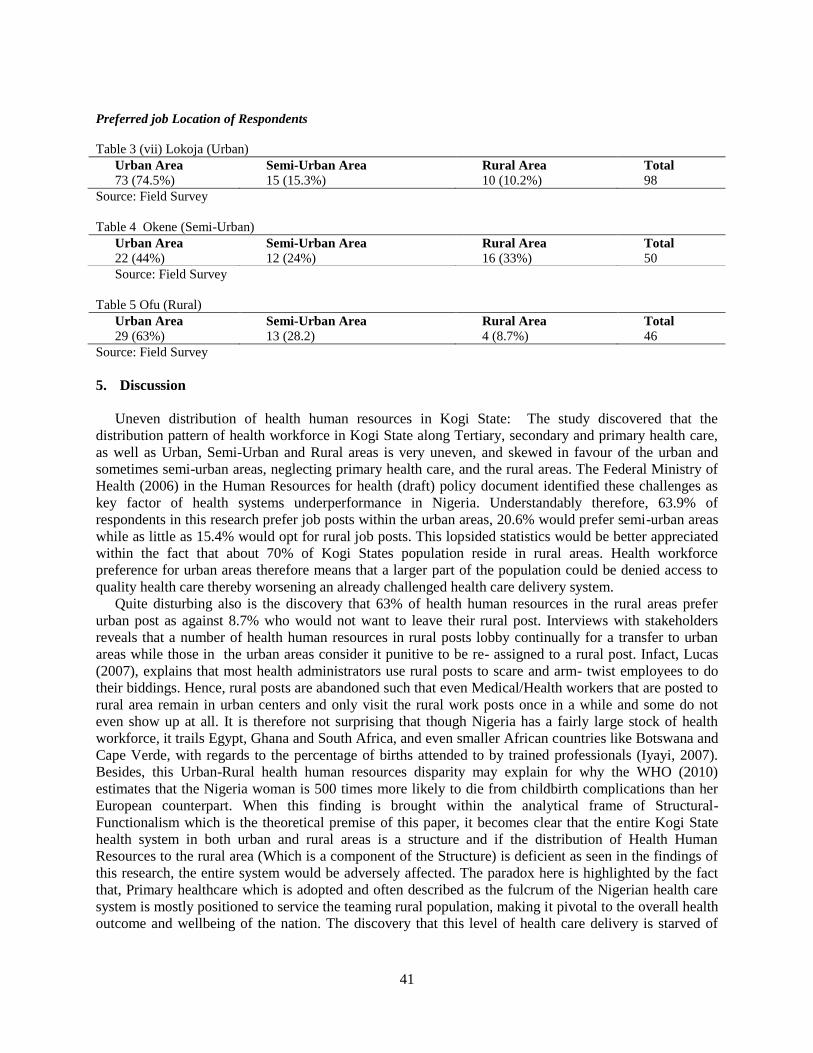
41
Preferred job Location of Respondents
Table 3 (vii) Lokoja (Urban)
Urban Area Semi-Urban Area Rural Area Total
73 (74.5%) 15 (15.3%) 10 (10.2%) 98
Source: Field Survey
Table 4 Okene (Semi-Urban)
Source: Field Survey
Table 5 Ofu (Rural)
Urban Area Semi-Urban Area Rural Area Total
29 (63%) 13 (28.2) 4 (8.7%) 46
Source: Field Survey
5. Discussion
Uneven distribution of health human resources in Kogi State: The study discovered that the
distribution pattern of health workforce in Kogi State along Tertiary, secondary and primary health care,
as well as Urban, Semi-Urban and Rural areas is very uneven, and skewed in favour of the urban and
sometimes semi-urban areas, neglecting primary health care, and the rural areas. The Federal Ministry of
Health (2006) in the Human Resources for health (draft) policy document identified these challenges as
key factor of health systems underperformance in Nigeria. Understandably therefore, 63.9% of
respondents in this research prefer job posts within the urban areas, 20.6% would prefer semi-urban areas
while as little as 15.4% would opt for rural job posts. This lopsided statistics would be better appreciated
within the fact that about 70% of Kogi States population reside in rural areas. Health workforce
preference for urban areas therefore means that a larger part of the population could be denied access to
quality health care thereby worsening an already challenged health care delivery system.
Quite disturbing also is the discovery that 63% of health human resources in the rural areas prefer
urban post as against 8.7% who would not want to leave their rural post. Interviews with stakeholders
reveals that a number of health human resources in rural posts lobby continually for a transfer to urban
areas while those in the urban areas consider it punitive to be re- assigned to a rural post. Infact, Lucas
(2007), explains that most health administrators use rural posts to scare and arm- twist employees to do
their biddings. Hence, rural posts are abandoned such that even Medical/Health workers that are posted to
rural area remain in urban centers and only visit the rural work posts once in a while and some do not
even show up at all. It is therefore not surprising that though Nigeria has a fairly large stock of health
workforce, it trails Egypt, Ghana and South Africa, and even smaller African countries like Botswana and
Cape Verde, with regards to the percentage of births attended to by trained professionals (Iyayi, 2007).
Besides, this Urban-Rural health human resources disparity may explain for why the WHO (2010)
estimates that the Nigeria woman is 500 times more likely to die from childbirth complications than her
European counterpart. When this finding is brought within the analytical frame of Structural-
Functionalism which is the theoretical premise of this paper, it becomes clear that the entire Kogi State
health system in both urban and rural areas is a structure and if the distribution of Health Human
Resources to the rural area (Which is a component of the Structure) is deficient as seen in the findings of
this research, the entire system would be adversely affected. The paradox here is highlighted by the fact
that, Primary healthcare which is adopted and often described as the fulcrum of the Nigerian health care
system is mostly positioned to service the teaming rural population, making it pivotal to the overall health
outcome and wellbeing of the nation. The discovery that this level of health care delivery is starved of
Urban Area Semi-Urban Area Rural Area Total
22 (44%) 12 (24%) 16 (33%) 50
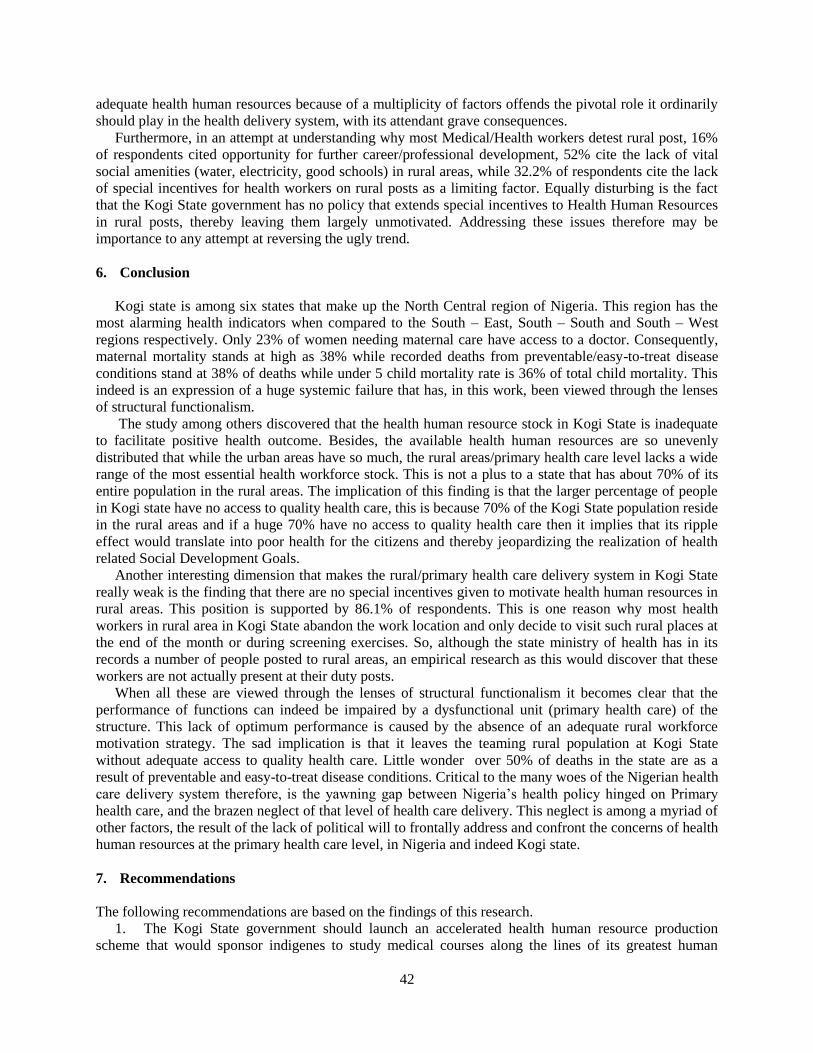
42
adequate health human resources because of a multiplicity of factors offends the pivotal role it ordinarily
should play in the health delivery system, with its attendant grave consequences.
Furthermore, in an attempt at understanding why most Medical/Health workers detest rural post, 16%
of respondents cited opportunity for further career/professional development, 52% cite the lack of vital
social amenities (water, electricity, good schools) in rural areas, while 32.2% of respondents cite the lack
of special incentives for health workers on rural posts as a limiting factor. Equally disturbing is the fact
that the Kogi State government has no policy that extends special incentives to Health Human Resources
in rural posts, thereby leaving them largely unmotivated. Addressing these issues therefore may be
importance to any attempt at reversing the ugly trend.
6. Conclusion
Kogi state is among six states that make up the North Central region of Nigeria. This region has the
most alarming health indicators when compared to the South – East, South – South and South – West
regions respectively. Only 23% of women needing maternal care have access to a doctor. Consequently,
maternal mortality stands at high as 38% while recorded deaths from preventable/easy-to-treat disease
conditions stand at 38% of deaths while under 5 child mortality rate is 36% of total child mortality. This
indeed is an expression of a huge systemic failure that has, in this work, been viewed through the lenses
of structural functionalism.
The study among others discovered that the health human resource stock in Kogi State is inadequate
to facilitate positive health outcome. Besides, the available health human resources are so unevenly
distributed that while the urban areas have so much, the rural areas/primary health care level lacks a wide
range of the most essential health workforce stock. This is not a plus to a state that has about 70% of its
entire population in the rural areas. The implication of this finding is that the larger percentage of people
in Kogi state have no access to quality health care, this is because 70% of the Kogi State population reside
in the rural areas and if a huge 70% have no access to quality health care then it implies that its ripple
effect would translate into poor health for the citizens and thereby jeopardizing the realization of health
related Social Development Goals.
Another interesting dimension that makes the rural/primary health care delivery system in Kogi State
really weak is the finding that there are no special incentives given to motivate health human resources in
rural areas. This position is supported by 86.1% of respondents. This is one reason why most health
workers in rural area in Kogi State abandon the work location and only decide to visit such rural places at
the end of the month or during screening exercises. So, although the state ministry of health has in its
records a number of people posted to rural areas, an empirical research as this would discover that these
workers are not actually present at their duty posts.
When all these are viewed through the lenses of structural functionalism it becomes clear that the
performance of functions can indeed be impaired by a dysfunctional unit (primary health care) of the
structure. This lack of optimum performance is caused by the absence of an adequate rural workforce
motivation strategy. The sad implication is that it leaves the teaming rural population at Kogi State
without adequate access to quality health care. Little wonder over 50% of deaths in the state are as a
result of preventable and easy-to-treat disease conditions. Critical to the many woes of the Nigerian health
care delivery system therefore, is the yawning gap between Nigeria’s health policy hinged on Primary
health care, and the brazen neglect of that level of health care delivery. This neglect is among a myriad of
other factors, the result of the lack of political will to frontally address and confront the concerns of health
human resources at the primary health care level, in Nigeria and indeed Kogi state.
7. Recommendations
The following recommendations are based on the findings of this research.
1. The Kogi State government should launch an accelerated health human resource production
scheme that would sponsor indigenes to study medical courses along the lines of its greatest human
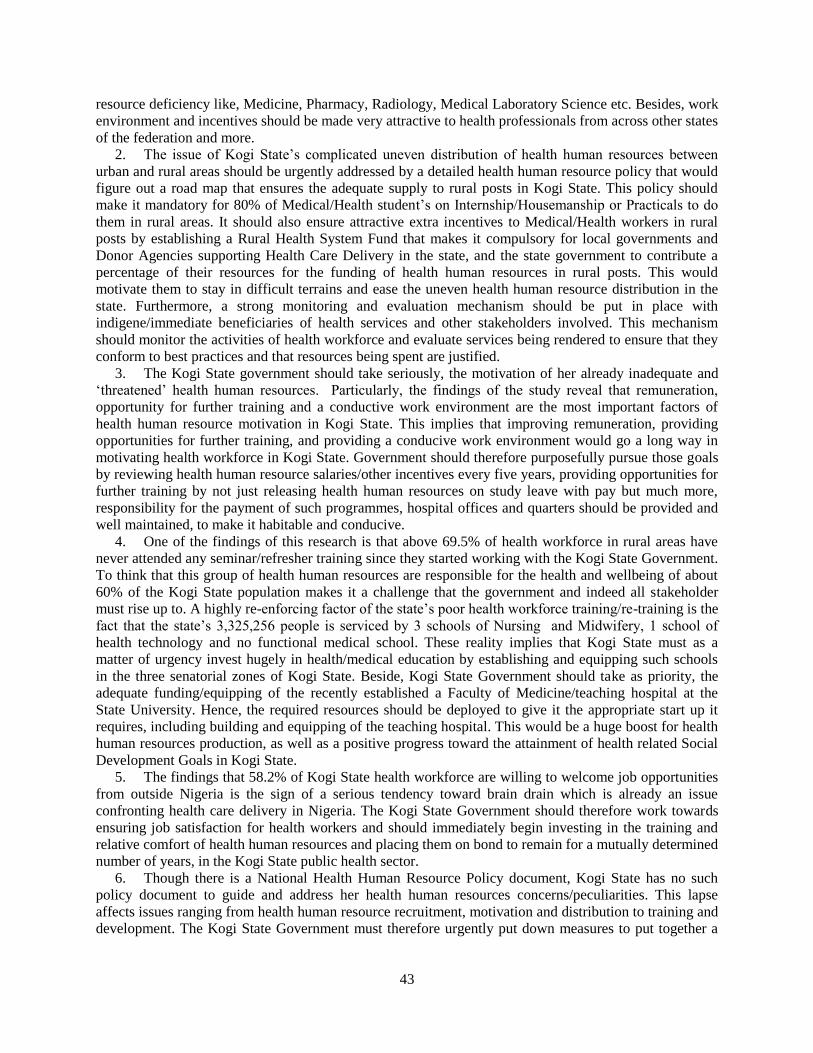
43
resource deficiency like, Medicine, Pharmacy, Radiology, Medical Laboratory Science etc. Besides, work
environment and incentives should be made very attractive to health professionals from across other states
of the federation and more.
2. The issue of Kogi State’s complicated uneven distribution of health human resources between
urban and rural areas should be urgently addressed by a detailed health human resource policy that would
figure out a road map that ensures the adequate supply to rural posts in Kogi State. This policy should
make it mandatory for 80% of Medical/Health student’s on Internship/Housemanship or Practicals to do
them in rural areas. It should also ensure attractive extra incentives to Medical/Health workers in rural
posts by establishing a Rural Health System Fund that makes it compulsory for local governments and
Donor Agencies supporting Health Care Delivery in the state, and the state government to contribute a
percentage of their resources for the funding of health human resources in rural posts. This would
motivate them to stay in difficult terrains and ease the uneven health human resource distribution in the
state. Furthermore, a strong monitoring and evaluation mechanism should be put in place with
indigene/immediate beneficiaries of health services and other stakeholders involved. This mechanism
should monitor the activities of health workforce and evaluate services being rendered to ensure that they
conform to best practices and that resources being spent are justified.
3. The Kogi State government should take seriously, the motivation of her already inadequate and
‘threatened’ health human resources. Particularly, the findings of the study reveal that remuneration,
opportunity for further training and a conductive work environment are the most important factors of
health human resource motivation in Kogi State. This implies that improving remuneration, providing
opportunities for further training, and providing a conducive work environment would go a long way in
motivating health workforce in Kogi State. Government should therefore purposefully pursue those goals
by reviewing health human resource salaries/other incentives every five years, providing opportunities for
further training by not just releasing health human resources on study leave with pay but much more,
responsibility for the payment of such programmes, hospital offices and quarters should be provided and
well maintained, to make it habitable and conducive.
4. One of the findings of this research is that above 69.5% of health workforce in rural areas have
never attended any seminar/refresher training since they started working with the Kogi State Government.
To think that this group of health human resources are responsible for the health and wellbeing of about
60% of the Kogi State population makes it a challenge that the government and indeed all stakeholder
must rise up to. A highly re-enforcing factor of the state’s poor health workforce training/re-training is the
fact that the state’s 3,325,256 people is serviced by 3 schools of Nursing and Midwifery, 1 school of
health technology and no functional medical school. These reality implies that Kogi State must as a
matter of urgency invest hugely in health/medical education by establishing and equipping such schools
in the three senatorial zones of Kogi State. Beside, Kogi State Government should take as priority, the
adequate funding/equipping of the recently established a Faculty of Medicine/teaching hospital at the
State University. Hence, the required resources should be deployed to give it the appropriate start up it
requires, including building and equipping of the teaching hospital. This would be a huge boost for health
human resources production, as well as a positive progress toward the attainment of health related Social
Development Goals in Kogi State.
5. The findings that 58.2% of Kogi State health workforce are willing to welcome job opportunities
from outside Nigeria is the sign of a serious tendency toward brain drain which is already an issue
confronting health care delivery in Nigeria. The Kogi State Government should therefore work towards
ensuring job satisfaction for health workers and should immediately begin investing in the training and
relative comfort of health human resources and placing them on bond to remain for a mutually determined
number of years, in the Kogi State public health sector.
6. Though there is a National Health Human Resource Policy document, Kogi State has no such
policy document to guide and address her health human resources concerns/peculiarities. This lapse
affects issues ranging from health human resource recruitment, motivation and distribution to training and
development. The Kogi State Government must therefore urgently put down measures to put together a
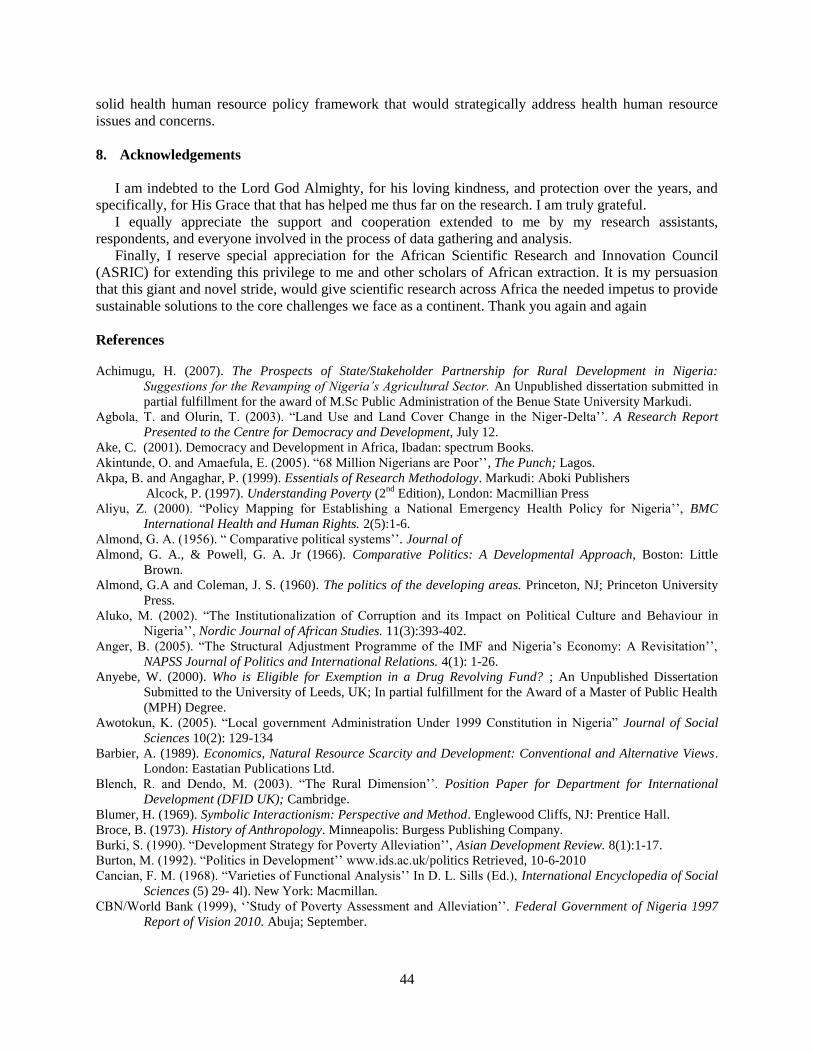
44
solid health human resource policy framework that would strategically address health human resource
issues and concerns.
8. Acknowledgements
I am indebted to the Lord God Almighty, for his loving kindness, and protection over the years, and
specifically, for His Grace that that has helped me thus far on the research. I am truly grateful.
I equally appreciate the support and cooperation extended to me by my research assistants,
respondents, and everyone involved in the process of data gathering and analysis.
Finally, I reserve special appreciation for the African Scientific Research and Innovation Council
(ASRIC) for extending this privilege to me and other scholars of African extraction. It is my persuasion
that this giant and novel stride, would give scientific research across Africa the needed impetus to provide
sustainable solutions to the core challenges we face as a continent. Thank you again and again
References
Achimugu, H. (2007). The Prospects of State/Stakeholder Partnership for Rural Development in Nigeria:
Suggestions for the Revamping of Nigeria’s Agricultural Sector. An Unpublished dissertation submitted in
partial fulfillment for the award of M.Sc Public Administration of the Benue State University Markudi.
Agbola, T. and Olurin, T. (2003). “Land Use and Land Cover Change in the Niger-Delta’’. A Research Report
Presented to the Centre for Democracy and Development, July 12.
Ake, C. (2001). Democracy and Development in Africa, Ibadan: spectrum Books.
Akintunde, O. and Amaefula, E. (2005). “68 Million Nigerians are Poor’’, The Punch; Lagos.
Akpa, B. and Angaghar, P. (1999). Essentials of Research Methodology. Markudi: Aboki Publishers
Alcock, P. (1997). Understanding Poverty (2nd
Edition), London: Macmillian Press
Aliyu, Z. (2000). “Policy Mapping for Establishing a National Emergency Health Policy for Nigeria’’, BMC
International Health and Human Rights. 2(5):1-6.
Almond, G. A. (1956). “ Comparative political systems’’. Journal of
Almond, G. A., & Powell, G. A. Jr (1966). Comparative Politics: A Developmental Approach, Boston: Little
Brown.
Almond, G.A and Coleman, J. S. (1960). The politics of the developing areas. Princeton, NJ; Princeton University
Press.
Aluko, M. (2002). “The Institutionalization of Corruption and its Impact on Political Culture and Behaviour in
Nigeria’’, Nordic Journal of African Studies. 11(3):393-402.
Anger, B. (2005). “The Structural Adjustment Programme of the IMF and Nigeria’s Economy: A Revisitation’’,
NAPSS Journal of Politics and International Relations. 4(1): 1-26.
Anyebe, W. (2000). Who is Eligible for Exemption in a Drug Revolving Fund? ; An Unpublished Dissertation
Submitted to the University of Leeds, UK; In partial fulfillment for the Award of a Master of Public Health
(MPH) Degree.
Awotokun, K. (2005). “Local government Administration Under 1999 Constitution in Nigeria” Journal of Social
Sciences 10(2): 129-134
Barbier, A. (1989). Economics, Natural Resource Scarcity and Development: Conventional and Alternative Views.
London: Eastatian Publications Ltd.
Blench, R. and Dendo, M. (2003). “The Rural Dimension’’. Position Paper for Department for International
Development (DFID UK); Cambridge.
Blumer, H. (1969). Symbolic Interactionism: Perspective and Method. Englewood Cliffs, NJ: Prentice Hall.
Broce, B. (1973). History of Anthropology. Minneapolis: Burgess Publishing Company.
Burki, S. (1990). “Development Strategy for Poverty Alleviation’’, Asian Development Review. 8(1):1-17.
Burton, M. (1992). “Politics in Development’’ www.ids.ac.uk/politics Retrieved, 10-6-2010
Cancian, F. M. (1968). “Varieties of Functional Analysis’’ In D. L. Sills (Ed.), International Encyclopedia of Social
Sciences (5) 29- 4l). New York: Macmillan.
CBN/World Bank (1999), ‘’Study of Poverty Assessment and Alleviation’’. Federal Government of Nigeria 1997
Report of Vision 2010. Abuja; September.
45
Centre for Reproductive Rights (2008). “Broken promises: Human Rights, Accountability and Maternal Deaths in
Nigeria”. CRR bulletin 1 (3) 6-11.
Chambers, R. (1997). Whose reality counts? Putting the First Last. London: Intermediate Technology.
Cleaver, F. (2001). “Institutions, Agency and the Limitations of Participatory Approaches to Development” in
Cooke, B. and Kothari, U. (eds.) Participation:The New Tyranny? London: Zed Books.
Cooke, B. and Kothari, U. (2001). “The case of Participation as Tyranny” in Cooke, B. and Kothari, U. (eds.)
Participation: The New Tyranny? London: Zed Books.
Cornwall, A. (2000). “Beneficiary, consumer, citizen: Perspectives on participation for Poverty Reduction’’, SIDA
Studies, no. 2, Stockholm: SIDA.
Dungan, A.J. (1980). Sleeping Sickness Epidemics in Health in Tropical Africa during the Colonial Period. Sabben-
Clare (Ed.). London: Clarendon Press
Dunn, W. N. (1981). Public policy Analysis: An Introduction. Englewood Cliffs, NJ: Prentice Hall
Duru, A. (2008). “Poverty in the Midst of Plenty’’. Daily Independent, Lagos; April.
Easton, D. (1953). The political system: An inquiry into the state of political science. Chicago: University of
Chicago Press.
Edoh, T. (2003). “Poverty and the Survival of Democracy in Nigeria’’, Nigeria Journal of Political and
Administrative Studies. 1(4):7-15.
Ekpu, R. (2004). “87 Percent of Nigerians are Poor’’. New Age; Lagos; December 13.
Esaterlin,J.(1972). Economic History, London: Macmillian Press Ltd.
Ezeani, E. (1995). In Ode, S. (2006) “Privatisation in Nigeria: A Critical Analysis’’, NAPPS Journal of Politics and
International Relations; 5(1): 140-160.
Ezeazu, E. et’al, (2003). “The Role of Civil Society Organizations in the Processes of Political and Socio-Economic
Transformation in Nigeria’’. Notes for the Department of International Development (DFID) Abuja
Federal Government of Nigeria (2004). Nigeria: National Economic Empowerment and Development Strategy
(NEEDS) (Draft). Abuja: National Planning Commission,
Federal Ministry of Health, (2004). “Achieving Health Related Millennium Development Goals in Nigeria “ A
Report of the Presidential committee on Achieving Millennium Development Goals in Nigeria.
Federal Ministry of Health. (2006). Draft Human Resources for Health Policy.
Federal Ministry of Health. (2008). National Human Resources for Health Policy Draft.
Federal Ministry of Health. (2009). Broken Promises: Human Rights, Accountability, and Maternal deaths in
Nigeria. Abuja: FMOH
Federal Ministry of Health. (2010). Health Sector Reform Programme- Strategic Thrusts; Key Performance
objectives; and Plan of Action 2010-2013. Abuja: FMOH.
Federal Ministry of Health. (2004). Health Sector Reform Programme (HSRP)
Federal Office of Statistics. (1997). National Consumer Survey 1996/1997. Abuja; November.
FGN, (2007). “National Human Resources for Health Policy 2006”, Abuja: FMOH.
Fisher, J. R, & Soemarsono, A. (2008). “Mass media Impact on Post-Secondary Policy Making: A Case Study of a
Failed Merger attempt”. Competition Forum, 6(l), 96-102.
Fisher, J. R. (1991) “ News Media Functions in policy making” Canadian Journal of Communications, 16(l), 139-
145.
Freire, P. (1997). In Smith et al (eds.) Natured by Knowledge. New York: The Apex Press.
Gana, T. (2001). “Civil Society and the Consolidation of Democracy”, Nigeria Journal of Political and
Administrative Studies. 1(5):10-16.
Gani, F. in Elumilade, D. et’al (2006). “Appraising the Institutional Framework for Poverty Alleviation Programme
in Nigeria”, International Research Journal of Finance and Economy. Issue 3]. 10-12
Gidddens, A. (1993). Sociology. London: Polity Press.
Gilles, H.M. and Lucas, A.O. (1998). “Tropical Medicine: 100 Years of Progress”. British Medical Bulletin 54 (2):
269-80.
Global Forum for Health Research. (2001). Monitoring Financial Flows for Health Research. Geneva: GFHR.
Goffman, E. (1958). The Presentation of Self in Everyday Life. Edinburgh: University of Edinburgh, Social Sciences
Research Centre.
Goldschmidt, W. (1996). “Functionalism” in Encyclopedia of Cultural Anthropology. New York: Henry Holt and
Company.
Goodland, R. and Ledec, G. (1987). “Neo-Classical Economics and Principles of Sustainable Development”,
Ecological Modeling. 38(4):15-26.

46
Habeebi, A. (2012). Sample Size Determination in the Social Sciences.www.socialsciencethinktank.com Retrieved
4-8-2012
Health Development Agency (2000). Participatory approaches in Health Promotion and Health
Planning.URL:www.hda-online.org.uk. ISBN 1842790102. Retrieved, 12 – 09 - 2012
Health Reform Foundation of Nigeria. (2005). Nigeria Health Review 2005. Abuja; HERFON.
Health Reform Foundation of Nigeria. (2006). Nigeria Health Review 2006. Abuja; HERFON.
Health Reform Foundation of Nigeria. (2007). Nigeria Health Review 2007. Abuja; HERFON.
Health Reform Foundation of Nigeria. (2010). Nigeria Health Review 2010. Abuja; HERFON.
Health Reform Foundation of Nigeria. (2011). Nigeria Health Review 2011. Abuja; HERFON.
Health Reform Foundation of Nigeria. (2012). Nigeria Health Review 2012. Abuja; HERFON
Herman, J. and Larry T. (1994). Symbolic Interaction: An Introduction to Social Psychology. Lanham, MD:
Altamira Press.
Heymans, C. and Pycroft, C. (2005). “Drivers of Change in Nigeria: Towards Restructuring the Political Economy’’.
Abuja; DFID-Nigeria.
Huddat J. (2003). “The Health Human Resources Crisis in Africa”. An issues paper. USAID Bureau for Africa.
Harare: Benaby.
Hulme, D. et’al . (2001). “Chronic Poverty: Meaning and Analytical Framework’’. CPRC Working Paper 2. Institute
of Development Policy and Management. University of Manchester, UK.
Ibrahim, J. et’al (2003). “Constitutional Reform as Driver for Pro-poor Change in Nigeria’’. Position for DFID
(London).
Idachaba, F. (2003). “Agriculture in Nigeria: Identifying Opportunities for increased Commercialisation and
investment’’ www.usaid.org/nigeria. Retrieved, 08-12 - 2013
Igbinovia, P. et’al (2006). Law and Social Policy Legislation and Administration in Nigeria, Lagos: Ababa Press.
IIM (2013). “Jonathan Constitutes Boards of 15 Teaching Hospitals and NAFDAC’’
www.ilorin.infomobile.com/fullnews Retrieved, 28 - 02 - 2013
Iornumbe, G. (2005). “Political Instability and National Development in Nigeria”, NAPSS Journal of Politics and
International Relations. 4(1):27-37.
Irving, J. (2007). Fifty Key Sociologists: The Formative Theorists. New York: Routledge.
Iyayi, F. (2007). “ Social Determinants of Health in Nigeria”. Nigerian Health Review. Lucas (ed.). pp. 270-279.
Iyayi, F. (2007). “The Social Determinants of Health in Nigeria” Nigeria Health Review (Lucas ed.) Chapter 13.
Iyayi, F. (2009). “Understanding what it takes to address Nigeria’ Health Human Resources Challenge.’’ National
Health Conference. Abuja: HERFON
Iyayi, F. and Abaragu, O. (2005). “Human Resource Management in National Development” A paper presented at
the Inaugural Conference of the Academy of Management of Nigeria. Rockview Hotel Abuja.
Jalal, J. (1999). “Democratic Decentralization in Urban Governance: A Comparative Study of Two Indian Cities”,
Institute of Development Studies Bulletin; 32(1).
Kogi State Agency for Poverty Reduction. (2004). Project Cycle. Lokoja
Kogi State Ministry of Health. (2012). Health Human Resource Population. Lokoja: KSMoH.
Kpamor, Z. (2012). “Nigeria’s Health Statistics and Trends” A paper presented at the Nigeria Behind the Headlines:
Population, Health and Natural Resources Conference organized by The Woodrow Wilson Center for
scholars environmental change and Security Program Global Health Initiative, and Africa Program. 25th
April, 2012
KSCSDA (2011). State Social Development fact sheet. Lokoja: KSCSDA
Kuznet, F. (1966). Economics, Oxford: Oxford University Press Ltd.
Laderchi, C. (2001). “Participatory Methods in the Analysis of Poverty: A critical Review’’, Working paper No. 62.
QEHWP62. Queen Elizabeth House, Oxford University.
Ladipo, O.A. (2009). “Delivery of an Effective Maternal and Child Health Services in Nigeria” National Health
Conference 2009. Pp.16-38: Abuja: HERFON
Ladipo, O.A. (2010). “ Determinant of Infant and Under 5 Mortality in Nigeria” National Health Conference 2010.
Pp.26-41: Abuja: HERFON
Lambo, E. (2008). “Linkages between Poverty Health and Sustainable Development in Africa”: A Position Paper.
NACA Abuja.
LaRossa, R. and Reitzes, D.C. (1993). “Symbolic Interactionism and Family Studies.” In Source book of Family
Theories and Methods: A Contextual Approach, P. G. Boss (Ed.) 135–163
Lee, Jong Wook. (2006). “Message from the Director-General” in working together for Health: The World Health
Report, 2006: XIII.
47
Lethbridge, J. (2004). “Public Sector Reform and Demand for Human Resources”. Human Resources for Health, 1
(2): 2-15.
Levy, M. J. (1968). “Structural- Functional Analysis’’. In D. L. Sills (Êd.), International Encyclopedia of the Social
Sciences ( 5) 2l-29, New York: Macmillan.
London: Routledge.
Lucas, A.O. (2007). “Primary Care vs. Primary Health Care: classifying the confusion and resolving the conflict”.
Health Science African. 3 (3):6-15.
Management Science for Health. (2010). Motivating Health Human Resources in Transitional States. Abuja: MSH
Manning, R. (2007). “Pro-poor Growth: Negotiating Consensus on a Contentious Issue’’, Society for International
Development. 50 (2):6-13.
Marx, K. and Engels, F. (1998) [1848]. The Communist Manifesto. New York: Penguin.
Maryanski, A. and Turner, J. (1992). The Social Cage: Human Nature and the Evolution of Society. Stanford, CA:
Stanford University Press
Mazuri, A. (1992). “Towards Diagnosing and Treating Cultural Dependency: The Case of the African University’’,
International Journal of Education Development. 12(2):95-111.
Mbuli, B. (2008). Poverty Reduction Strategies in South Africa. An unpublished Dissertation submitted in partial
fulfillment for the award of M.Sc in Commerce of the University of South Africa.
Medical and Dental Council of Nigeria. (2008). Combating Brain Drain in the health sector: Whose Responsibility?
Abuja- Nigeria.
Merton, R. K. (1968). Theory and social structure. New York: Free Press.
Mohan, G. (2001). “Beyond Participation: Strategies for Deeper Empowerment” in Cooke, B. and Kothari, U.
(eds.) Participation: TheNewTyranny?London: Zed Books.
Mosha, H. (1986). “The Role of African Universities in National Development: A Critical Analysis’’, Higher
Education. 15(2):113-134.
National Bureau of Statistics, (2005). Social Statistics of Nigeria: Abuja.
National Bureau of Statistics, (2006). The Nigeria Statistical Fact Sheet: Abuja.
National Health Conference (2009). “Primary Health Care in Nigeria: 30 years After Alma-Ata.’’ Abuja: NHC
National Health Conference (2010). “Effective Interventions to Achieve Health Related MDGs in Nigeria’’. Abuja:
NHC
National Health Conference (2010). “Governance and Legislation(Stewardship) for Primary Health Care in
Nigeria’’. Abuja: NHC
National Population Commission (2004). National Demographic and Health Survey. Abuja: NPC
National Population Commission (2008). National Demographic and Health Survey. Abuja: NPC
National Population Commission (2010). National Demographic and Health Survey. Abuja: NPC.
Ndubisi, E. (2003). “Peace Building: Path to Sustainable Development’’, Sunday Vanguard; Lagos; March 20.
Nnamani, C. (2003). “Poverty: Degradation of the Human Race’’. The Punch; Lagos; October 23.
Nnoli, O. (2000). “Failed to Produce the Desired Result’’. The Punch; Lagos; June 15.
Nnoyelu, A. (2005). “Gender, Poverty Eradication and Development in Nigeria’’. In Okeibunor, J. and Anugwom,
E. (eds.), the Social Sciences and Socio-Economic Transformation in Africa: Essays in Honour of
Professor D.S. Obiekeze. Nsukka: Great AP Publishers.
O’Riodan, C. (1998). “Understanding Sustainable Development’’ www.accademicreview.com Retrieved, 20 – 10 -
2012
Obadan, M. (2006). “Poverty Reduction in Nigeria: The way forward’’, CBN Economic and Financial Review:
39(4): 8-21
Obasi, T. (2000). Research Methodology in Political Science, Enugu: Academic Publishing Company.
Ogundeji, M.O. (2002). Background and Status of PHC Activities in Nigeria, Ibadan: XANFUN Limited
Ogunkelu, B. (2007). “The State of Health in Nigeria: A Focus on Women and Children” Global Health Council
Washington DC USA.
Ogunlesi, T.O. (2003). Medicine My Passport, Ibadan, Spectrum Books Ltd.
Ojiakor, N. (2003). “Gender and Poverty Issues, Problems and Solutions’’. In Obiajulu (Ed.) Readings in
Humanities. Enugu: John Jacob Publishers.
Okoye, U. and Onyukwu, E. (2007). “Sustaining Poverty Reduction Efforts Through Inter-Agency Collaboration in
Nigeria’’. In Kenneth, O. (Ed.), State Society Relations in Nigeria, democratic Consolidation, Conflicts and
Reforms. London: Adoni and Abbey.
Ola, R. (1984). Local government Administration in Nigeria: Kegan Paul International
Olowonefa, B. (2001). “Thoughts on Poverty Eradication’’. The Anchor; Lagos; November 23.
48
Onah, F. and Vincent, N. (2005). “Oil Exploitation and Sustainable Development in the Niger-Delta Area,
Nigeria’’, African Journal of Political and Administrative Studies. 2(1):151-166.
Osualu, E.C (2005). Introduction to Research Methodology: Onitsha, Africana – First Publishers Limited. Third
Edition
Oyemoni, E. (2003). An Assessment of Poverty Reduction Strategies in Nigeria (1983-2003). An unpublished
dissertation submitted in partial fulfillment for the award of the PhD of St. Clement University, South
Africa. September.
Parsons, T. (1951). The social system, Glencoe, IL: Free Press.
Parsons, T. (1961). Theories of Society: Foundations of Modern Sociological Theory. New York: Free Press.
Patnaik, P. (1998). “Amartya Sen and the Theory of Public Action’’, Economic and Political Weekly. Vol. 33, N. 45,
pp. 2855-2859
Polítics, 18, (3)91-409.
Radcliffe-Brown, A. (1952). Structure and Function in Primitive Society: Essays and Addresses. London: Cohen
and West.
Ray, C. (1997). Towards a Theory of the Dialectics of Rural Development, Newcastle: University of Newcastle
Press.
Raynolds, P. (1994). Theoretical Complexities. London: Integrity Press
Rodney, W. (1972). How Europe Underdeveloped Africa,London: Bogle-L’overture Publications.
Ross, M., (2003). “Nigeria’s Oil Sector and the Poor’’. A Position Paper for the Department of International
Development, UK. UCLA Los Angeles.
Sachs, A. (2000). “Poverty and Social exclusion’’ www.socialsciencediscuss.com Retrieved, 26 – 07 - 2015
Sawadago, G. (1994). “The Future, Missions and Roles of African Universities’’. Commissioned paper for AAU,
Accra. Education working group on higher education.
Schrams, R. (1966). Development of Nigeria Health Services 1460-1960. Thesis for an MD of the Cambridge
University UK.
Seers, D. (1972). The Economics of Development, London: Macmillan Press Ltd.
Sen, A. (1999). Development as Freedom. New York: Alfred Knopf.
Shehu, D. (2000). “Poverty Alleviation in Northern Nigeria’’. A paper presented at CDD planning meeting Abuja
Smith, M. G. (1966). “A Structural Approach to Comparative Politics’’. In D. Easton (Ed.), Varieties of Political
Theory (1) 13-128, Englewood Cliffs, NJ: Prentice Hall.
Soludo, C. (2005). “Political Economy of Sustainable Development in Nigeria’’. The Nigerian Tribune; Lagos;
June 7.
Spencer, H. (1898). The Principles of Biology. New York: D. Appleton and Company.
Szirma, C. (1990). “The Varied Dimensions of Development’’ www.economiclife.com Retrieved, 19 – 02- 2019
Thom-Manuel, D. (2008). “ Nigeria: Strategy for Poverty Eradication’’, This Day; Lagos; November 16.
Townsend, A. (1979). Poverty in the United Kingdom: A Survey of Household Resources and Standard of Living,
Harmondsworth: Penguin.
Tukur, H. (2004). “Nigeria has no business with poverty’’ www.allafrica.com Retrieved, 14 – 03 - 2010
Turner, J. (2003). The Structure of Sociological Theory. 7th ed. Belmont, CA: Thompson/Wadsworth.
Ugoh, S. and Ukpere, W. (2009). “Appraising the Trend on Poverty Alleviation Programmes in Nigeria with
Emphasis on the National Poverty Eradication Programme (NAPEP)’’, Business Papers and Reports
(2009); Cape Peninsula University of Technology; Cape Peninsula South Africa.
Ugwuoke, C. (2003). “Gender Issues in Poverty Amelioration in Nigeria’’, International Journal of Social Inquiry.
1(2):138-145.
Ulluweshewa, B. (1993). In Eboh et’al (eds.), Rural Development in Nigeria: Concepts, Processes and Prospect,
Enugu: Auto-Century Publishing Company.
UNAIDS/WHO (2002). “Epidemiological Fact sheet 2002 update, sub-Saharan Africa”. www.unaids.org Retrieved,
19 – 01- 2011
UNDP (1998). Overcoming Human Poverty. New York, United Nations Publication.
UNDP (2010). World Development Report
UNDP Human Development Report, (2004). HIV and AIDS: A Challenge to Sustainable Human Development.
UNIADS (2001). “HIV/AIDS and communication for behavior and social change: programme, experiences,
examples and the way forward”. Geneva, Switzerland,
UNICEF (2007). Sub-Saharan Africa Assessment. New York: UNICEF
UNICEF (2010). The State of the World’s Children. New York: UNICEF
United Nations (1997). Human Development Report; New York; Oxford University Press.
49
United Nations Development Programme (2000). Human Development Report; Oxford; Oxford University Press.
United Nations Economic and Social Council (2002) “Substantive Issues arising in the Implementation of the
international covenant on social and cultural rights” Background paper submitted by the Centre for
Reproductive Law and Policy.
Watson, A. (1998). “Poverty, Policy and Aid’’ www.reasonbank.com Retrieved, 24 – 10 - 2018
WHO (2003). The World Health Report 2003. Geneva: WHO
WHO (2006). Working together for Health, The World Health Report 2006.
WHO (2011). “Road Maps for Accelerating the Attainment of the Millennium Development Goals Related to
Maternal and New Born Health in Africa’’. Geneva: WHO.
Wilkinson, R. (2002). “Charity Begins at Home’’, BMJ. 305(6):165-168.
Wilkinson, R. and Marmort M. (eds.) (2003). “Social Determinants of Health: The Solid fact”. WHO Contact
Session, Copenhagen.
Wiwa, K. (2004). In the Shadow of a Saint, London: Doubleday.
Woodger, J. H. (1948). Biological principles: A critical study.
World Bank (1996). “Nigeria: Poverty in the Midst of Plenty’’. Report No. 120; Washington D.C.
World Bank (2009). World Report. www.worldbankgroup.org/Nigeria Retrieved, 12-09- 2018
Wunsch, J.S and Olowu, D. (1996). “Regime Transformation from below: Decentralization, Local Governance and
Democratic Reform in Nigeria”. Studies on comparative international development. 31 (4): 66-82.
Zupi, N. (2007). “The Multi-dimensions Of Poverty: Some Conceptual and Policy Challenges”, Society for
International Development. 50(2):26-32.

50
ii

iii
iv
Table of Contents
The Antecedents of Entrepreneurial Intention among Sudanese University Students .................................. 1
Women Entrepreneur Motivations, Challenges, and Growth Aspiration: A Gender Lens Analysis in
Sudan ............................................................................................................................................................ 9
Economic Implications of Cocoa Production on farmers’ Welfare in South West Region of Cameroon .. 20
Indigenous Justice System in land conflict resolution: The case of the Paramount Chief’s court in the
Oguaa Traditional area, Ghana ................................................................................................................... 37
Book-keeping as a Correlate of Effective Small-Scale Business Development in Orita-challenge and
Challenge Market Areas in Ibadan, Oyo State, Nigeria .............................................................................. 50
Creating Sustainable Employment in Africa: Leveraging on the Capacity of the Informal Sector ............ 59
Financial Inclusion as a Panacea for Reducing Poverty and Hunger in Africa: Lessons from Nigeria ...... 82
Internationalization of Micro, Small, and Medium Enterprises and Start-Ups in Ghana: Challenges and
Drivers ........................................................................................................................................................ 94
Interrogating Public-Private Partnership in African Healthcare within the Lenses of Capitalist
Philanthropy in Nigeria’s Primary Health System .................................................................................... 107
1
Available online at www.asric.org
ASRIC Journal on Social Sciences & Humanities 1 (2020) 1-8
a School of Management Studies, University of Khartoum, Sudan
Received 19 December 2019; revised 30 January 2020; accepted 30 January 2020
Abstract
The aim of the present paper is to investigate the role of individual and societal attitudes perception in shaping the
entrepreneurial behavioral intentions of the individual through the lenses of The Theory of Planned Behavior (TPB)
to find out whether the university students will have intentions to become entrepreneurs. The survey of 395 of
graduate and undergraduate students across four colleges at the University of Khartoum was used for data collection.
SPSS was used to analyze the data. The results indicate that entrepreneurial intention of the respondents can be
predicted from the attitude towards becoming an entrepreneur, perceived behavioral control and subjective norms.
The findings revealed that TPB is a valuable tool in understanding the entrepreneurial intention of university
students in Sudan. The majority of students intend to start a business in the future
Keywords: Entrepreneurial intentions; Theory of Planned Behaviour; University students; Societal attitudes; Sudan
1. Introduction
In a poor country such as Sudan, with fast population growth and a rising labor force participation
rate, creating employment opportunities becomes the top priority for a strategy of economic restoration.
The generation of new jobs is considered central for any future development for the Sudanese economy
for two reasons: on one hand, the stagnant Sudanese economy which is resource-dependent is unable to
absorb the young workers who enter the labor force each year. On the other hand, the potential for an
increasing population is the human capital and an opportunity to create new industries and expand
economies.
These realities and their consequences has been acknowledged by the Sudanese government in the
form of vigorous efforts taken since the dawn of the 1990s, the most radical one was the Sudan’s
Structural Program (SAP) which aimed at, among other things, enhancing the role of the private sector to
lead economic development through the removal of administrative and non-administrative obstacles and
the liberalizing of the economic atmosphere by opening all sectors of the economy to private investment
with the exception of oil production. Since then Sudanese policymakers continued to recognize the
potentially beneficial role of the private sector in sustainable development by putting forward more
stringent measures to ensure the promotion of entrepreneurial firms and new venture creation
(Musa 2012; Gangi et al. 2015).
1 Corresponding author. Email addresses: e.mansour@ uofk.edu (I.H.F. Mansour); a.omer @ uofk.edu (A. Omer)
2
The unanimously accepted theoretical proposition of the role entrepreneurship plays in the national
economies has been empirically established through a series of recent studies; of particular importance
here is the profound positive impact of entrepreneurship on the GDP per capita and the employment rate
(Endeavor insight 2015). In order to rip these benefits, important measures have been taken by the
Sudanese government in order to develop entrepreneurial capacity, especially in regard to ease of
obtaining micro-finance. Central Bank of Sudan (CBOS) took the initiative of formulating a vision for
developing and expanding the microfinance sector by the creation of a favorable legal environment,
encouraging banks to allocate specific resources to microfinance, removal of collateral barriers, and
allowing diversified Islamic modes of finance. These policies recognized Microentrepreneurs and micro-
enterprises, including artisan, low-income productive families, manufacturing, mining, exports, and
agriculture among the priority sectors to receive support. (Ahmed and Ammar, 2015)
Along with these legal and institutional efforts, governmental and non-governmental initiatives have
been announced with the ultimate goal of promoting entrepreneurship among Sudanese youth. For
instance, Workshops, associations, media campaigns, and outreach programs have been designed to
increase awareness and develop entrepreneurial capacity.
Despite all these efforts, critical factors with a relatively bigger impact on fostering entrepreneurial
initiatives in Sudan have been neglected by researchers and policymakers. Recent reports revealed an
under-utilization of the available financial resources and a decelerating growth of SMEs establishment in
the Sudanese economy, highlighting weak entrepreneurial culture, and the domination of the view of
Micro Finance as a subsidy lending not business-oriented lending as the main reasons of those dismal
outcomes.
The individual’s attitude has been shown to affect the entrepreneurial propensity. This propensity is
also contingent upon the social context in which actions are taken (Capelleras et al., 2013). The aim of the
present paper is to investigate the role of societal perception and individual attitudes in shaping the
entrepreneurial behavioral intentions of the individual through the lenses of The Theory of Planned
Behavior (TPB).
The value of this paper is threefold; first, it constitutes an original contribution to the rapidly evolving
field of entrepreneurship literature in Sudan, secondly, it will provide policymakers with an invaluable
insight on some of the factors affecting entrepreneurship orientation among Sudanese youth and aid them
in designing appropriate interventions, and finally, it tries to shed light on the often-overlooked role of
cultural norms and individual attitudes in shaping the entrepreneurial behavior of the Sudanese within the
scope of a well-established theory.
This paper examines, based on the theory of planned behavior, whether university students in Sudan
have the intention to start their own businesses.
Specifically, the objectives of this study are:
1. To test whether the theory of planned behavior can help explain the entrepreneurial intention of
Sudanese university students.
2. To determine whether university students will have the intention to start a business.
3. To find out the factors that affect students’ intention to start a business?
2. Literature Review
The research on the question of why people choose entrepreneurship as a career option is mainly
dominated by two disciplines: On one hand, the ideas adapted from social cognitive theory have widely
impacted entrepreneurial research, especially the work in entrepreneurial intentions (Elfving, 2009),
several studies using social psychological approaches concentrated on a dichotomy of factors related to
society and individuals to identify those decisive factors which affects the behavioral intention to start a
new business.
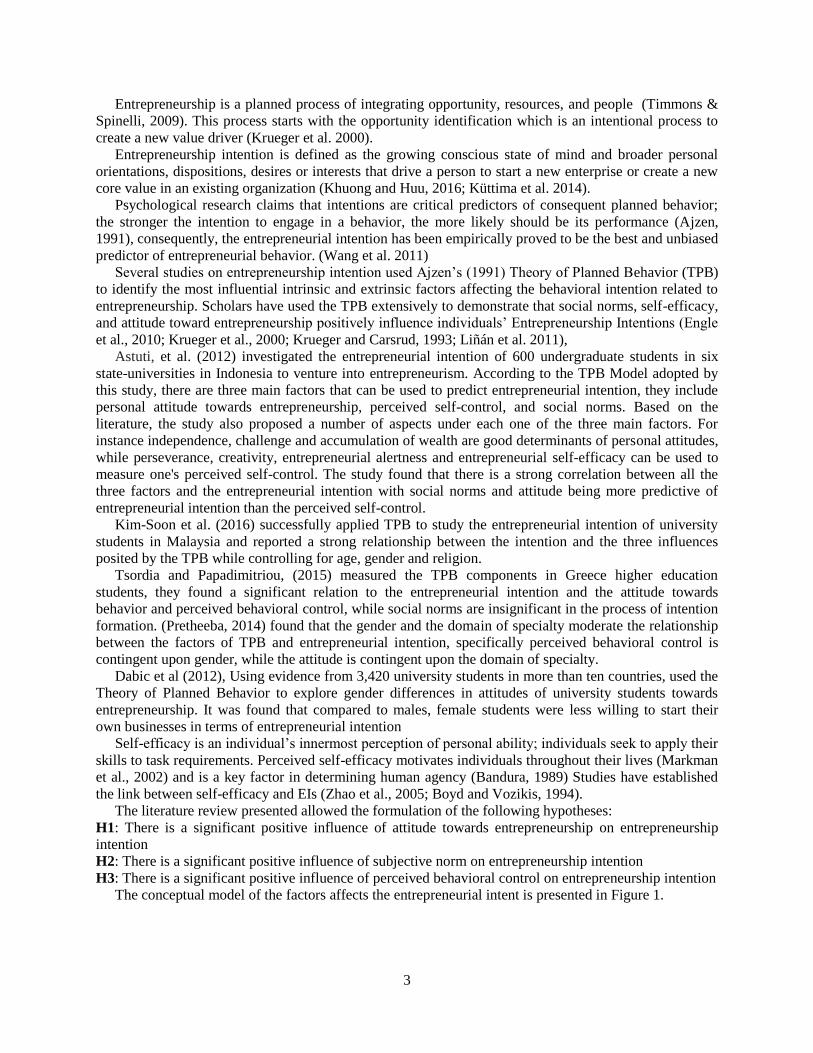
3
Entrepreneurship is a planned process of integrating opportunity, resources, and people (Timmons &
Spinelli, 2009). This process starts with the opportunity identification which is an intentional process to
create a new value driver (Krueger et al. 2000).
Entrepreneurship intention is defined as the growing conscious state of mind and broader personal
orientations, dispositions, desires or interests that drive a person to start a new enterprise or create a new
core value in an existing organization (Khuong and Huu, 2016; Küttima et al. 2014).
Psychological research claims that intentions are critical predictors of consequent planned behavior;
the stronger the intention to engage in a behavior, the more likely should be its performance (Ajzen,
1991), consequently, the entrepreneurial intention has been empirically proved to be the best and unbiased
predictor of entrepreneurial behavior. (Wang et al. 2011)
Several studies on entrepreneurship intention used Ajzen’s (1991) Theory of Planned Behavior (TPB)
to identify the most influential intrinsic and extrinsic factors affecting the behavioral intention related to
entrepreneurship. Scholars have used the TPB extensively to demonstrate that social norms, self-efficacy,
and attitude toward entrepreneurship positively influence individuals’ Entrepreneurship Intentions (Engle
et al., 2010; Krueger et al., 2000; Krueger and Carsrud, 1993; Liñán et al. 2011),
Astuti, et al. (2012) investigated the entrepreneurial intention of 600 undergraduate students in six
state-universities in Indonesia to venture into entrepreneurism. According to the TPB Model adopted by
this study, there are three main factors that can be used to predict entrepreneurial intention, they include
personal attitude towards entrepreneurship, perceived self-control, and social norms. Based on the
literature, the study also proposed a number of aspects under each one of the three main factors. For
instance independence, challenge and accumulation of wealth are good determinants of personal attitudes,
while perseverance, creativity, entrepreneurial alertness and entrepreneurial self-efficacy can be used to
measure one's perceived self-control. The study found that there is a strong correlation between all the
three factors and the entrepreneurial intention with social norms and attitude being more predictive of
entrepreneurial intention than the perceived self-control.
Kim-Soon et al. (2016) successfully applied TPB to study the entrepreneurial intention of university
students in Malaysia and reported a strong relationship between the intention and the three influences
posited by the TPB while controlling for age, gender and religion.
Tsordia and Papadimitriou, (2015) measured the TPB components in Greece higher education
students, they found a significant relation to the entrepreneurial intention and the attitude towards
behavior and perceived behavioral control, while social norms are insignificant in the process of intention
formation. (Pretheeba, 2014) found that the gender and the domain of specialty moderate the relationship
between the factors of TPB and entrepreneurial intention, specifically perceived behavioral control is
contingent upon gender, while the attitude is contingent upon the domain of specialty.
Dabic et al (2012), Using evidence from 3,420 university students in more than ten countries, used the
Theory of Planned Behavior to explore gender differences in attitudes of university students towards
entrepreneurship. It was found that compared to males, female students were less willing to start their
own businesses in terms of entrepreneurial intention
Self-efficacy is an individual’s innermost perception of personal ability; individuals seek to apply their
skills to task requirements. Perceived self-efficacy motivates individuals throughout their lives (Markman
et al., 2002) and is a key factor in determining human agency (Bandura, 1989) Studies have established
the link between self-efficacy and EIs (Zhao et al., 2005; Boyd and Vozikis, 1994).
The literature review presented allowed the formulation of the following hypotheses:
H1: There is a significant positive influence of attitude towards entrepreneurship on entrepreneurship
intention
H2: There is a significant positive influence of subjective norm on entrepreneurship intention
H3: There is a significant positive influence of perceived behavioral control on entrepreneurship intention
The conceptual model of the factors affects the entrepreneurial intent is presented in Figure 1.
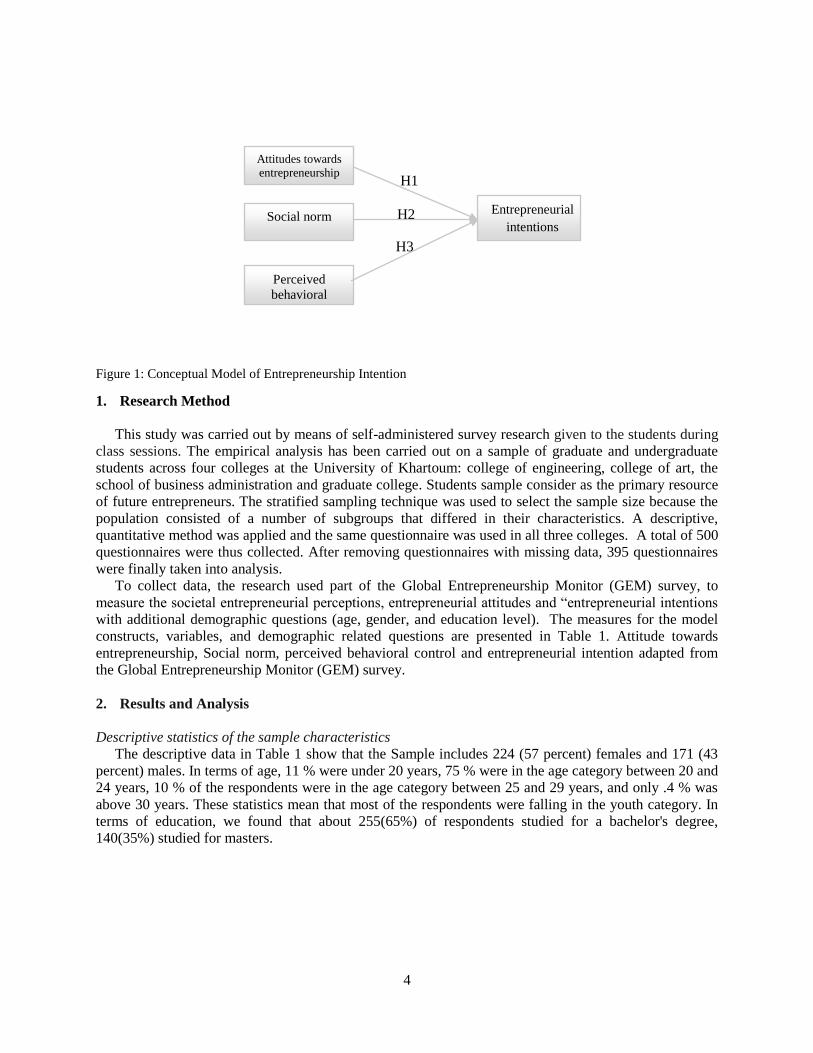
4
Figure 1: Conceptual Model of Entrepreneurship Intention
1. Research Method
This study was carried out by means of self-administered survey research given to the students during
class sessions. The empirical analysis has been carried out on a sample of graduate and undergraduate
students across four colleges at the University of Khartoum: college of engineering, college of art, the
school of business administration and graduate college. Students sample consider as the primary resource
of future entrepreneurs. The stratified sampling technique was used to select the sample size because the
population consisted of a number of subgroups that differed in their characteristics. A descriptive,
quantitative method was applied and the same questionnaire was used in all three colleges. A total of 500
questionnaires were thus collected. After removing questionnaires with missing data, 395 questionnaires
were finally taken into analysis.
To collect data, the research used part of the Global Entrepreneurship Monitor (GEM) survey, to
measure the societal entrepreneurial perceptions, entrepreneurial attitudes and “entrepreneurial intentions
with additional demographic questions (age, gender, and education level). The measures for the model
constructs, variables, and demographic related questions are presented in Table 1. Attitude towards
entrepreneurship, Social norm, perceived behavioral control and entrepreneurial intention adapted from
the Global Entrepreneurship Monitor (GEM) survey.
2. Results and Analysis
Descriptive statistics of the sample characteristics
The descriptive data in Table 1 show that the Sample includes 224 (57 percent) females and 171 (43
percent) males. In terms of age, 11 % were under 20 years, 75 % were in the age category between 20 and
24 years, 10 % of the respondents were in the age category between 25 and 29 years, and only .4 % was
above 30 years. These statistics mean that most of the respondents were falling in the youth category. In
terms of education, we found that about 255(65%) of respondents studied for a bachelor's degree,
140(35%) studied for masters.
H2
H1
Entrepreneurial
intentions Social norm
Perceived
behavioral
control
Attitudes towards
entrepreneurship
H3
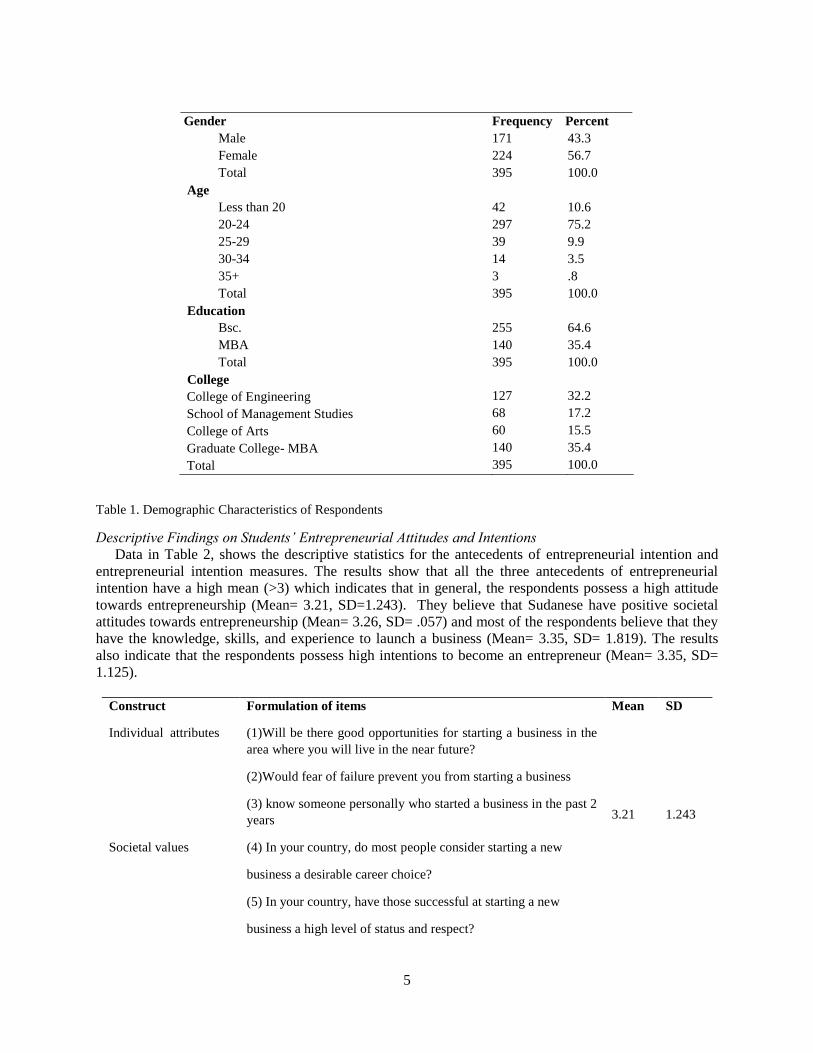
5
Gender Frequency Percent
Male 171 43.3
Female 224 56.7
Total 395 100.0
Age
Less than 20 42 10.6
20-24 297 75.2
25-29 39 9.9
30-34 14 3.5
35+ 3 .8
Total 395 100.0
Education
Bsc. 255 64.6
MBA 140 35.4
Total 395 100.0
College
College of Engineering 127 32.2
School of Management Studies 68 17.2
College of Arts 60 15.5
Graduate College- MBA 140 35.4
Total 395 100.0
Table 1. Demographic Characteristics of Respondents
Descriptive Findings on Students’ Entrepreneurial Attitudes and Intentions
Data in Table 2, shows the descriptive statistics for the antecedents of entrepreneurial intention and
entrepreneurial intention measures. The results show that all the three antecedents of entrepreneurial
intention have a high mean (>3) which indicates that in general, the respondents possess a high attitude
towards entrepreneurship (Mean= 3.21, SD=1.243). They believe that Sudanese have positive societal
attitudes towards entrepreneurship (Mean= 3.26, SD= .057) and most of the respondents believe that they
have the knowledge, skills, and experience to launch a business (Mean= 3.35, SD= 1.819). The results
also indicate that the respondents possess high intentions to become an entrepreneur (Mean= 3.35, SD=
1.125).
Construct Formulation of items Mean SD
Individual attributes (1)Will be there good opportunities for starting a business in the
area where you will live in the near future?
(2)Would fear of failure prevent you from starting a business
(3) know someone personally who started a business in the past 2
years
3.21
1.243
Societal values (4) In your country, do most people consider starting a new
business a desirable career choice?
(5) In your country, have those successful at starting a new
business a high level of status and respect?
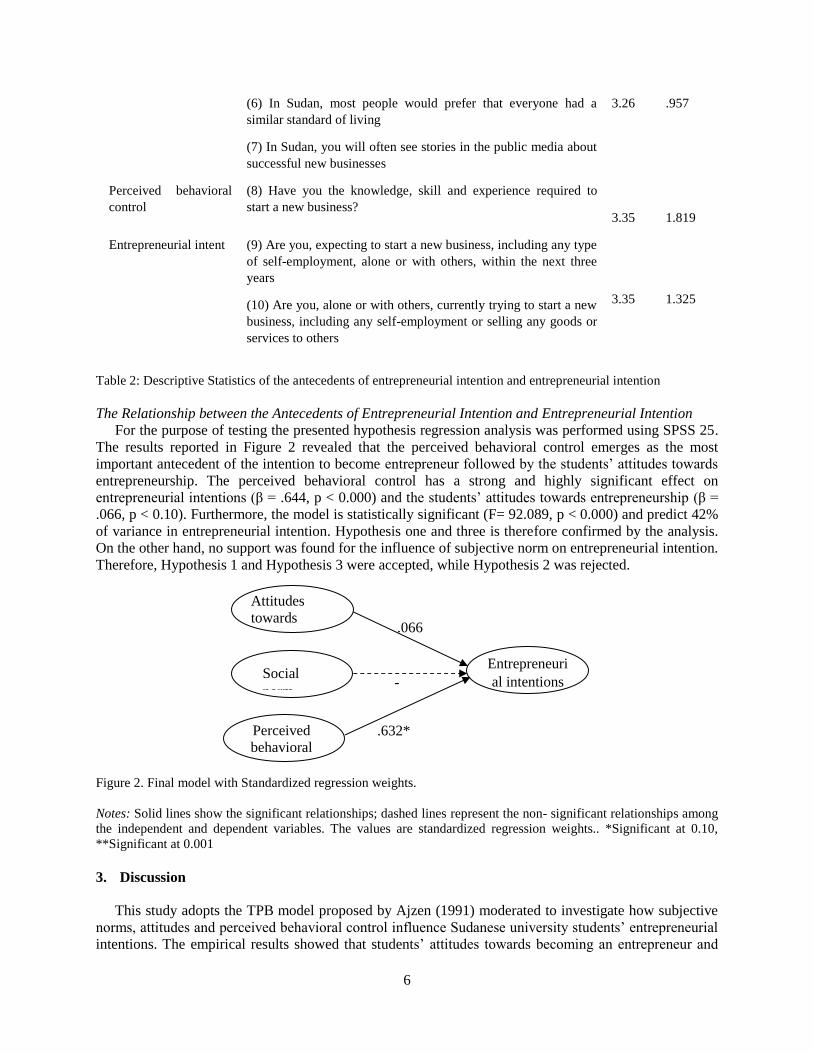
6
(6) In Sudan, most people would prefer that everyone had a
similar standard of living
(7) In Sudan, you will often see stories in the public media about
successful new businesses
3.26 .957
Perceived behavioral
control
(8) Have you the knowledge, skill and experience required to
start a new business?
3.35
1.819
Entrepreneurial intent (9) Are you, expecting to start a new business, including any type
of self-employment, alone or with others, within the next three
years
(10) Are you, alone or with others, currently trying to start a new
business, including any self-employment or selling any goods or
services to others
3.35
1.325
Table 2: Descriptive Statistics of the antecedents of entrepreneurial intention and entrepreneurial intention
The Relationship between the Antecedents of Entrepreneurial Intention and Entrepreneurial Intention
For the purpose of testing the presented hypothesis regression analysis was performed using SPSS 25.
The results reported in Figure 2 revealed that the perceived behavioral control emerges as the most
important antecedent of the intention to become entrepreneur followed by the students’ attitudes towards
entrepreneurship. The perceived behavioral control has a strong and highly significant effect on
entrepreneurial intentions (β = .644, p < 0.000) and the students’ attitudes towards entrepreneurship (β =
.066, p < 0.10). Furthermore, the model is statistically significant (F= 92.089, p < 0.000) and predict 42%
of variance in entrepreneurial intention. Hypothesis one and three is therefore confirmed by the analysis.
On the other hand, no support was found for the influence of subjective norm on entrepreneurial intention.
Therefore, Hypothesis 1 and Hypothesis 3 were accepted, while Hypothesis 2 was rejected.
Figure 2. Final model with Standardized regression weights.
Notes: Solid lines show the significant relationships; dashed lines represent the non- significant relationships among
the independent and dependent variables. The values are standardized regression weights.. *Significant at 0.10,
**Significant at 0.001
3. Discussion
This study adopts the TPB model proposed by Ajzen (1991) moderated to investigate how subjective
norms, attitudes and perceived behavioral control influence Sudanese university students’ entrepreneurial
intentions. The empirical results showed that students’ attitudes towards becoming an entrepreneur and
Social
norm
Attitudes
towards
entrepreneurs
Perceived
behavioral
control
Entrepreneuri
al intentions
.066
*
-
.044
.632*
*
7
perceived behavioral control have positive influences on entrepreneurial intentions. These results are
consistent with those yielded by previous studies (Tsordia and Papadimitriou, (2015); Hao et al., 2005;
Boyd and Vozikis, (1994)). On the other hand, subjective norms do not seem to influence entrepreneurial
intentions. This is not a surprising finding, previously several studies demonstrate that subjective norms
often fail to predict intentions (Armitage and Conner, 2001; Liñán 2004; Liñán and Chen, 2009).
4. Conclusion
The significant impact of perceived behavioral control as the most important antecedent of the
intention to become entrepreneur revealed by this study will help Sudanese policymakers in designing
more effective education and training policies that enhance the positive impact of the accumulation of
knowledge and skills needed for entrepreneurship.
References
Ajzen, I. (1991). The theory of planned behaviour. Organizational Behaviour and Human Decision Process, 50(2),
179–121.
Ahmed, E. M., & Ammar, A. (2015). Islamic Microfinance in Sudanese Perspective. Journal of Business &
Financial Affairs, 4(149), 2167-0234.
Armitage, C. J., & Conner, M. (2001). Efficacy of the theory of planned behaviour: A meta‐analytic review. British
journal of social psychology, 40(4), 471-499.
Astuti, R. D., & Martdianty, F. (2012). Students' Perception and Intention toward Entrepreneurship: Development of
Planned Behavior Entrepreneurial Model on Six State Universities in Indonesia. In International
Conference on Enterprise Marketing and Globalization (EMG). Proceedings (p. 131). Global Science and
Technology Forum.
Bandura, A. (1989). Human agency in social cognitive theory. American psychologist, 44(9), 1175.
Boyd, N. G., & Vozikis, G. S. (1994). The influence of self-efficacy on the development of entrepreneurial
intentions and actions. Entrepreneurship theory and practice, 18(4), 63-77.
Capelleras, J. L., Contín Pilart, I., Martín Sánchez, V., & Larraza Kintana, M. (2013). The influence of individual
perceptions and the urban/rural environment on nascent entrepreneurship. Investigaciones Regionales, 26
(2013), 97-113.
Dabic, M., Daim, T., Bayraktaroglu, E., Novak, I., & Basic, M. (2012). Exploring gender differences in attitudes of
university students towards entrepreneurship: an international survey. International Journal of Gender and
Entrepreneurship, 4(3), 316-336.
Elfving, J., Brännback, M., & Carsrud, A. (2009). Toward a contextual model of entrepreneurial intentions.
In Understanding the entrepreneurial mind . 23-33). Springer, New York, NY.
Gangi, Y. A. & Timan, E., (2015). Entrepreneurship education in Sudan. Journal for International Business and
Entrepreneurship Development, 8(3), 231-247.
Khuong, M. N., & An, N. H. (2016). The factors affecting entrepreneurial intention of the students of Vietnam
national university—a mediation analysis of perception toward entrepreneurship. Journal of Economics,
Business and Management, 4(2), 104-111.
Kim-Soon, N., Ahmad, A. R., & Ibrahim, N. N. (2016). Theory of planned behavior: undergraduates’
entrepreneurial motivation and entrepreneurship career intention at a public university. Journal of
Entrepreneurship: Research & Practice, 2016, 1-14.
Krueger, N. F., & Carsrud, A. L. (1993). Entrepreneurial intentions: applying the theory of planned
behaviour. Entrepreneurship & Regional Development, 5(4), 315-330.
Krueger Jr, N. F., Reilly, M. D., & Carsrud, A. L. (2000). Competing models of entrepreneurial intentions. Journal
of business venturing, 15(5-6), 411-432.
Küttim, M., Kallaste, M., Venesaar, U., & Kiis, A. (2014). Entrepreneurship education at university level and
students’ entrepreneurial intentions. Procedia-Social and Behavioral Sciences, 110, 658-668.
Markman, G. D., Balkin, D. B., & Baron, R. A. (2002). Inventors and new venture formation: The effects of general
self–efficacy and regretful thinking. Entrepreneurship theory and practice, 27(2), 149-165.
Liñán, F. (2004). Intention-based models of entrepreneurship education. Piccolla Impresa/Small Business, 3(1), 11-
35.
8
Liñán, F., & Chen, Y. W. (2009). Development and cross–cultural application of a specific instrument to measure
entrepreneurial intentions. Entrepreneurship theory and practice, 33(3), 593-617.
Musa, E. A. (2012). Emerging Women Entrepreneurs in Sudan: Individual Characteristics, Obstacles and
Empowerment.
Pretheeba, P. (2014). Predicting entrepreneurial intention among business and engineering students in Sri
Lanka. Ruhuna Journal of Management and Finance, 1(1), 25-36.
Timmons J.A., Spinelli S., (2009), New Venture Creation – Entrepreneurship for the 21st Century, McGraw Hill
International, USA
Tsordia, C., & Papadimitriou, D. (2015). The role of theory of planned behavior on entrepreneurial intention of
Greek business students. International Journal of Synergy and Research, 4(1), 23.
Wang, W., Lu, W., & Millington, J. K. (2011). Determinants of entrepreneurial intention among college students in
China and USA. Journal of Global Entrepreneurship Research, 1(1), 35-44.
Zhao, H., Seibert, S. E., & Hills, G. E. (2005). The mediating role of self-efficacy in the development of
entrepreneurial intentions. Journal of applied psychology, 90(6), 1265.
9
Available online at www.asric.org
ASRIC Journal on Social Sciences & Humanities 1 (2020) 9-19
a School of Management Studies, University of Khartoum, Sudan
b Ahmed Bin Mohamed military college, Qatar
Received 19 December 2019; revised 30 January 2020; accepted 30 January 2020
Abstract
Women entrepreneurship has developed considerably around the world, and it is widely established that
entrepreneurship is important for economic growth and wealth. Although more and more Sudanese women are
taking up the entrepreneurship challenge, male entrepreneurs still outnumber them in Sudan. The purpose of this
study is to shed light on women’s entrepreneurship in Sudan by understanding challenges and constraints facing
them, to determine the motivational factors drive their intentions to start their own business and their growth
aspiration vis-a-vis their male counterparts.
Data were collected using a survey questionnaire with both close-ended and open-ended questions conducted in
Khartoum state the capital of Sudan. The sample frame consisted of a list of (40) male and (50) female entrepreneurs
owned running businesses. The findings revealed that females in the sample became entrepreneurs for reasons of
Self-fulfillment whilst male entrepreneurs were motivated by the need for more income. Compared to men, females
were more likely than males to name necessity as a motive to start their business with a wider gender gap while
factors such as Self-fulfillment show a narrow gender gap. The most frequent challenges faced by female
entrepreneurs are gender-specific challenges whereas Access to finance is a challenge for males. Males surpassed
females’ entrepreneurs in their export orientations
Based on this, the study argues that for female entrepreneurship to flourish, Sudan needs to introduce more
effective policies and regulations supportive to women entrepreneurs.
Keywords: Entrepreneurship; Women Entrepreneur; Challenge; Motivation; Gender; Sudan
1. Introduction
The importance of entrepreneurship is widely recognized and its socioeconomic impact on community
development has been well documented. To mention some of its numerous benefits, entrepreneurship
contributes to generating more jobs, securing a better quality of life, and supply markets with new and
innovative products. Moreover, it enhances economic growth and promotes economic development.
Entrepreneurship is very much related to Small and Medium Enterprises (SMEs) since the later is seen
as a vehicle for entrepreneurship development, contributing not just to employment and social and
political stability, but also innovative and competitive power (Thurik & Wennekers, 2004). Realizing its
socio-economic benefits, many countries have designed and implemented strategies and policies that aim
1 Corresponding author. Email addresses: [email protected] (I.H.F. Mansour); [email protected]
(Y.A. Gangi)
10
at developing their entrepreneurial sector. However, it can be argued, that for any country to successfully
develop its entrepreneurship sector, it needs to identify the driving forces in this sector. Many factors have
been identified by scholars as determinants and driving forces for entrepreneurship developments. Among
the several factors, two factors have been identified as the main driving forces for the entrepreneurial
development process. These are highly motivated and competitive entrepreneurs and encouraging
entrepreneurial environment. The role of these two elements is not debatable and thus, is widely
recognized by researchers and decision-makers throughout the globe. Entrepreneur motivations and
challenges are among the topics of high concern for scholars. Previous studies on entrepreneur
motivations have shown that entrepreneurs in different countries are motivated to entrepreneurial
activities by different factors (Cromie 1987, Sarri & Trihopoulou, 2005). However, the results of some
studies have shown that entrepreneurs in some countries share many entrepreneurial motivations in
common (Stephan, et al 2015). Because of this, the identification of entrepreneurial motivations has
become one of the issues that need to be addressed in different countries of the world.
2. Statement of the problem
Entrepreneurship development has become very significant in a modern economy, as it contributes to
job creation, economic growth enhancement, improving the standard of living and boosting socio-
economic development in countries at large. Given that, various research work has been conducted in
different countries of the world to investigate the conditions and the key factors that encourage their
entrepreneurship development. Entrepreneurs’ motivations and challenges were among the topics that
have been extensively investigated to examine their role in new venture creation, success, and growth.
The objectives of these studies were to provide a better understanding of entrepreneurial behavior in these
countries. Because entrepreneur motivations and challenges are considered by many authors as some of
the most important factors that can have a significant effect on entrepreneurial activities (Baum, 2007;
Stefanovic, et al 2010).
Due to its importance for entrepreneurship development, considerable research has been undertaken to
identify the main factors that motivate individuals to become entrepreneurs (Rauch & Frese, 2000). The
results obtained by these studies are diverse, and thus, no consensus among the researchers on the main
factors that motivate entrepreneurs. The objective of the present study is to investigate the main factors
that motivate females entrepreneurs to establish their own businesses and to examine the challenges that
they face. In other words, the present research aims to get an answer to the question: what are the
motivational and challenge factors of female entrepreneurs in Sudan? As it can be seen latter all these
issues are studied with emphasis on gender differences between male and female. Therefore, the aim of
the present paper is extended to include gender analysis of women entrepreneurs in Sudan. This issue is
handled by comparing the motivations of the female Sudanese entrepreneurs with their male counterparts
and the challenges that are encountered by both of them. Our purpose here is to investigate whether any
differences do exist between male and female entrepreneurs concerning their entrepreneurial motivations,
the challenges they face, and their aspirations for growth. More specifically the paper is trying to answer
to the following question:
1. Are male and female entrepreneurs’ sharing the same motivations?
2. Are male and female entrepreneurs’ facing same challenges?
3. Are male and female entrepreneurs’ having the same aspirations for growth?
4. What kinds of supportive mechanisms exist for Sudanese females compared to male
entrepreneurs?
In examining the entrepreneur motivations and challenges, the paper should enrich the literature with
empirical results about Sudan and thus, help in understanding its entrepreneurship sector. Moreover, the
paper assists Sudanese policymakers in their future attempts to design a policy to support entrepreneurs
and enhance entrepreneurship development in Sudan.
11
In the next section, reviews of the related literature will be reviewed. The section after details the
methodology used, followed by analysis and discussion of the results. Finally, the study discusses the
implications and limitations of this research and suggestions for future research.
3. Literature Review
Entrepreneur Motivations
There is no agreement among authors regarding the classification of entrepreneur motivations.
Different classifications have been introduced by different authors depending on the purpose and focus of
their studies. One of the early classifications which were originated in the 1980s and recently has become
very popular is the opportunity versus necessity entrepreneurship. This classification has been adopted by
the Global Entrepreneurship Monitor (GEM) since the early 2000s and has started to collect and present
its data according to it. The opportunity entrepreneurs refer to those who start their own business
motivated by their intention to utilize an investment opportunity. While the necessity entrepreneurs
comprise those people who are forced to engage in entrepreneurial activity for reasons such as poverty
and lack of employment opportunities. For those people, starting a business is not their prime
consideration until they have exhausted other options. Thus, they choose entrepreneurial activity not
because they love it and favour it to other activities, but they choose it to secure goods and services that
would satisfy their basic needs and thus let them have a decent life.
Another classification of entrepreneur motivations proposed by Gilad and Levine (1986) distinguishes
between positive factors that “pull” people toward entrepreneurship and the negative factors that “push”
people into entrepreneurship. The push factors include job dissatisfaction, difficulty finding employment
(or risk of unemployment), insufficient salary, family pressure and/or inflexible work hours. Whereas,
pull factors: include the need for achievement; the desire to be independent; desire to generate wealth and
social development possibilities (Segal, et al 2005). Other researchers have revealed that “pull and push
factors” may include: survival, desire to achieve personal goals, to feed one’s family, to be respected,
quest for pride of ownership, peer pressure, desire for social recognition, desire to deal with the issue of
gender discrimination in the labour market and loss of job (Moses, et al 2014).
Stephan et al (2015), after reviewing a large number of studies on entrepreneurship motivations ended
up with grouping the studies that investigate entrepreneur motivations into three streams: The first one
includes the studies that classify entrepreneurial motivations into necessity versus opportunity
motivations. This classification is developed from the previous classification of push-pull factors. These
studies rely on McClelland's (1961) theory of the need to achieve, which suggests that individuals with a
strong need to achieve often find their way to entrepreneurship and succeed better than others.
The second stream comprises the studies that adopt multi-dimensional typologies of entrepreneurial
motivations. Some of these studies distinguished between economic motivations of entrepreneurs and
non-economic motivations. Cromie (1987) was one of the early authors who adopted this classification.
He examined the entrepreneur motivations differences between male and female grounded on a list of
twelve socio-economic factors, these are autonomy, achievement, career dissatisfaction, job
dissatisfaction, money expected to be earn, child-rearing opportunity, inheritance opportunity, offer
employment opportunity to other, to enjoy greater social status in self-employment, outlet for skills had
acquired from previous jobs, market opportunity, and job insecurity.
The third stream contains the studies that differentiate between entrepreneurs whose motivation to
grow a business and others whose motivation is growth ambitions. Each one of those has different driving
forces. For example, entrepreneurs whose motivation to grow a business may be driven by some factors
like desire to generate more income, to prove one's own ability to succeed, personal satisfaction, pursue
one's interest in entrepreneurship, desire to own a business, desire to have control over what one is doing,
desire for more flexibility in managing own time, inspired by friend's and other people's success and
desire for a balanced lifestyle. Whereas, the motivation for growth ambition may comprise cognitive,
affective, and behavioral factors, (Hermans et al., 2012).
12
However, Stephan et al (2015) concluded that the main dimensions that capture entrepreneurial
motivations in sufficient breadth and depth are the following: achievement; challenge and learning;
independence and autonomy; income security and financial success; recognition and status; family and
roles; dissatisfaction; community and social motivations. This conclusion implies that entrepreneurs have
different and diversified motivations, to the extent that they can hardly be identified by a set of factors.
One possible justification for these variations is that the factors that motivate entrepreneurs may differ
across countries and time.
So far a review of the literature related to entrepreneurs' motivations, in general, was carried out. Next,
we move to the review of the literature that compares men entrepreneur motivations to their women
counterparts. The main objective of this kind of literature review is to examine the similarities and
differences between men and women entrepreneur motivations. Moses et al (2014) undertake a systematic
literature review of many theoretical models that are used to determine the factors that motivate women
and push them into entrepreneurship. They argue that men are usually motivated by factors such as the
desire for greater independence, desire for power, authority, and improved financial opportunity, whereas,
women are driven to entrepreneurship by factors such as autonomy, independence and balancing work
with family life. Scott (1986), stated that men and women are motivated by different factors for starting a
business; men stressed the desire to be their own bosses and women reported being concerned with
personal challenge and satisfaction.
Along the same vein, Cavada et al (2017) investigated motivations of women entrepreneurs in Mexico
and compared it to men entrepreneurs. Their findings entail that women entrepreneur's decisions to start-
up businesses are influenced by factors different from their men counterparts. These factors include the
entrepreneurs' personal traits, social and economic factors. Their justification for this situation is that
women in Mexico have a conservative traditional attitude, risk-averse tendency, and non-cooperation of
family members. These characteristics cause women entrepreneurs to be hesitant to the extent that deter
from starting a business.
In a comprehensive literature review Brush (1993) notes that previous research identifies several
motivational differences between women and men entrepreneurs. She observes that a higher proportion of
women are motivated by factors such as dissatisfaction with their current jobs, and see entrepreneurship
as an alternative job that suits them most. In this respect, some scholars reveal that occupational flexibility
is a motivator in women entrepreneurship more than in male entrepreneurship. This factor is a more
critical factor for women entrepreneurs compared to their men counterparts (Taylor and Kosarek, 1995).
In support of this; Orhan and Scott (2001) emphasized that flexibility, desire and need to work and raise
families are more peculiar with women entrepreneurs especially those with children, their venture choice
offers them more flexibility to accommodate both their business and family responsibilities.
Entrepreneur Challenges
Entrepreneurship involves a lot of risks. Those who decide to be an entrepreneur and establish their
own business should expect to experience many challenges in starting up and maintaining their
businesses. Problems like finding suitable sources of finance for their investment project, inadequate
training and access to information are an example of challenges that entrepreneurs may face irrespective
of their sexes (males or females). Besides these challenges, female entrepreneurs face other more
complicated and deeply rooted problems of individual and socio-economic nature, such as risk avoidance,
limited sources of capital and society sexual discrimination. Moreover, according to Jamali (2009), the
lack of government support in terms of policy, laws, and services has been identified as obstacles for
women entrepreneurs. In addition, normative constraints and societal attitudes based on cultural and
religious beliefs in some countries are another challenge to the work of women in general or that of
women in entrepreneurship in particular (Jamali, 2009). For example, Chamlou (2008) stated that
attitudes toward working women and women's work more generally are less favorable in the Middle East
and North Africa than in other regions. She further argued that across the region attitudes toward women's
employment and women's work outside the home are correlated with entrepreneurship outcomes. This
result suggests that to overcome the challenges that face both male and female entrepreneurs different
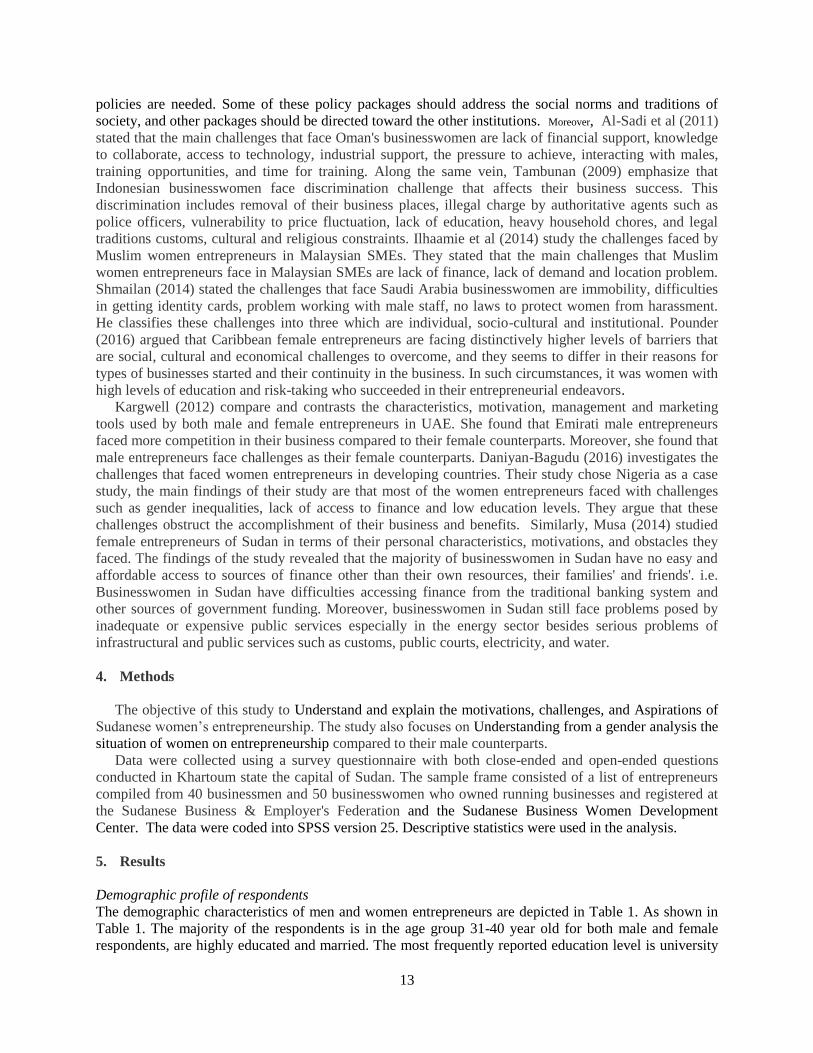
13
policies are needed. Some of these policy packages should address the social norms and traditions of
society, and other packages should be directed toward the other institutions. Moreover, Al-Sadi et al (2011)
stated that the main challenges that face Oman's businesswomen are lack of financial support, knowledge
to collaborate, access to technology, industrial support, the pressure to achieve, interacting with males,
training opportunities, and time for training. Along the same vein, Tambunan (2009) emphasize that
Indonesian businesswomen face discrimination challenge that affects their business success. This
discrimination includes removal of their business places, illegal charge by authoritative agents such as
police officers, vulnerability to price fluctuation, lack of education, heavy household chores, and legal
traditions customs, cultural and religious constraints. Ilhaamie et al (2014) study the challenges faced by
Muslim women entrepreneurs in Malaysian SMEs. They stated that the main challenges that Muslim
women entrepreneurs face in Malaysian SMEs are lack of finance, lack of demand and location problem.
Shmailan (2014) stated the challenges that face Saudi Arabia businesswomen are immobility, difficulties
in getting identity cards, problem working with male staff, no laws to protect women from harassment.
He classifies these challenges into three which are individual, socio-cultural and institutional. Pounder
(2016) argued that Caribbean female entrepreneurs are facing distinctively higher levels of barriers that
are social, cultural and economical challenges to overcome, and they seems to differ in their reasons for
types of businesses started and their continuity in the business. In such circumstances, it was women with
high levels of education and risk-taking who succeeded in their entrepreneurial endeavors.
Kargwell (2012) compare and contrasts the characteristics, motivation, management and marketing
tools used by both male and female entrepreneurs in UAE. She found that Emirati male entrepreneurs
faced more competition in their business compared to their female counterparts. Moreover, she found that
male entrepreneurs face challenges as their female counterparts. Daniyan-Bagudu (2016) investigates the
challenges that faced women entrepreneurs in developing countries. Their study chose Nigeria as a case
study, the main findings of their study are that most of the women entrepreneurs faced with challenges
such as gender inequalities, lack of access to finance and low education levels. They argue that these
challenges obstruct the accomplishment of their business and benefits. Similarly, Musa (2014) studied
female entrepreneurs of Sudan in terms of their personal characteristics, motivations, and obstacles they
faced. The findings of the study revealed that the majority of businesswomen in Sudan have no easy and
affordable access to sources of finance other than their own resources, their families' and friends'. i.e.
Businesswomen in Sudan have difficulties accessing finance from the traditional banking system and
other sources of government funding. Moreover, businesswomen in Sudan still face problems posed by
inadequate or expensive public services especially in the energy sector besides serious problems of
infrastructural and public services such as customs, public courts, electricity, and water.
4. Methods
The objective of this study to Understand and explain the motivations, challenges, and Aspirations of
Sudanese women’s entrepreneurship. The study also focuses on Understanding from a gender analysis the
situation of women on entrepreneurship compared to their male counterparts.
Data were collected using a survey questionnaire with both close-ended and open-ended questions
conducted in Khartoum state the capital of Sudan. The sample frame consisted of a list of entrepreneurs
compiled from 40 businessmen and 50 businesswomen who owned running businesses and registered at
the Sudanese Business & Employer's Federation and the Sudanese Business Women Development
Center. The data were coded into SPSS version 25. Descriptive statistics were used in the analysis.
5. Results
Demographic profile of respondents
The demographic characteristics of men and women entrepreneurs are depicted in Table 1. As shown in
Table 1. The majority of the respondents is in the age group 31-40 year old for both male and female
respondents, are highly educated and married. The most frequently reported education level is university
14
degree (28% for female and 75% for male), followed by (10% for female and 20% for male) post-
graduate degree. Similar results were revealed in the GEM Women Report (2017) where women
participated in entrepreneurship were 25-44-year-olds.
Regarding the respondents’ marital status, we found that 66% of the female and 55% of the males %
entrepreneurs are married while 34% of the female and 45% of the male were singles.32% and 70% of the
female and male respectively have a previous working experience prior to starting up their own business.
Furthermore, the results also show that the majority of businesses 78% of the female and 60% of the male
are in service sectors.
Table 1: Respondents’ Profile
Female % Male %
Age
21-30 34 20
31-40 40 57
41-50 16 15
51-60 8 8
60+ 2 0
Education < High school 16 0
High school 16 5
University 28 75
Post-graduate 12 20
Marital Status
Married 66 55
Single 34 45
Entrepreneurship training Yes 32 52
No 68 48
Previous Work experience
Yes 32 70
No 68 30
Sector
Industry 22 40
Service 78 60
Motivations of entrepreneurship
As shown in Table 2, in general, Sudanese entrepreneurs are more motivated by push factors such as
Necessity and need for more income (55%). Compared to men, women (28%) are more likely than men
(12.5%) to name necessity as a motive to start their business with a wider gender gap while pull factors
such as Self-fulfillment show a narrow gender gap. More specifically, when the participating males and
females entrepreneurs were asked about their motivations behind their decisions to become an
entrepreneur, the majority of female entrepreneurs (48%) reported that the main motive is self-fulfillment
followed by (28%) necessity, then need for more income came third (24%). Whereas the need for more
income was the main motive for the male entrepreneurs (47.5%), followed by self-fulfillment (40%), and
necessity or no other option came last with (12.5%). These results were supported by Sadi and Al-Ghazali
(2012) in Saudi Arabia and Naser et. al., (2009) in the United Arab Emirates. These studies indicated self-
fulfillment, as one of the important factors in the development of women's entrepreneurship. In line with
the GEM 2017 report women are 20% or more likely to indicate necessity motives than men.
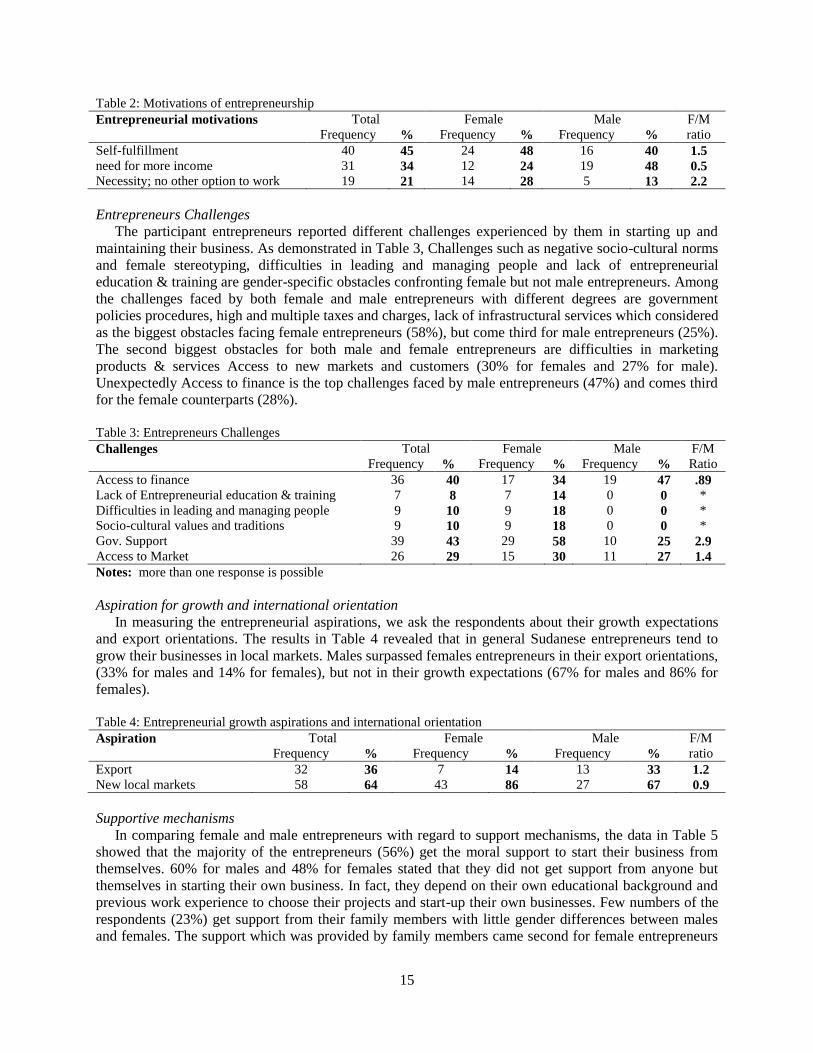
15
Table 2: Motivations of entrepreneurship
Entrepreneurial motivations Total Female Male F/M
ratio Frequency % Frequency % Frequency %
Self-fulfillment 40 45 24 48 16 40 1.5
need for more income 31 34 12 24 19 48 0.5
Necessity; no other option to work 19 21 14 28 5 13 2.2
Entrepreneurs Challenges
The participant entrepreneurs reported different challenges experienced by them in starting up and
maintaining their business. As demonstrated in Table 3, Challenges such as negative socio-cultural norms
and female stereotyping, difficulties in leading and managing people and lack of entrepreneurial
education & training are gender-specific obstacles confronting female but not male entrepreneurs. Among
the challenges faced by both female and male entrepreneurs with different degrees are government
policies procedures, high and multiple taxes and charges, lack of infrastructural services which considered
as the biggest obstacles facing female entrepreneurs (58%), but come third for male entrepreneurs (25%).
The second biggest obstacles for both male and female entrepreneurs are difficulties in marketing
products & services Access to new markets and customers (30% for females and 27% for male).
Unexpectedly Access to finance is the top challenges faced by male entrepreneurs (47%) and comes third
for the female counterparts (28%).
Table 3: Entrepreneurs Challenges
Challenges Total Female Male F/M
Ratio Frequency % Frequency % Frequency %
Access to finance 36 40 17 34 19 47 .89
Lack of Entrepreneurial education & training 7 8 7 14 0 0 *
Difficulties in leading and managing people 9 10 9 18 0 0 *
Socio-cultural values and traditions 9 10 9 18 0 0 *
Gov. Support 39 43 29 58 10 25 2.9
Access to Market 26 29 15 30 11 27 1.4
Notes: more than one response is possible
Aspiration for growth and international orientation
In measuring the entrepreneurial aspirations, we ask the respondents about their growth expectations
and export orientations. The results in Table 4 revealed that in general Sudanese entrepreneurs tend to
grow their businesses in local markets. Males surpassed females entrepreneurs in their export orientations,
(33% for males and 14% for females), but not in their growth expectations (67% for males and 86% for
females).
Table 4: Entrepreneurial growth aspirations and international orientation
Aspiration Total Female Male F/M
ratio Frequency % Frequency % Frequency %
Export 32 36 7 14 13 33 1.2
New local markets 58 64 43 86 27 67 0.9
Supportive mechanisms
In comparing female and male entrepreneurs with regard to support mechanisms, the data in Table 5
showed that the majority of the entrepreneurs (56%) get the moral support to start their business from
themselves. 60% for males and 48% for females stated that they did not get support from anyone but
themselves in starting their own business. In fact, they depend on their own educational background and
previous work experience to choose their projects and start-up their own businesses. Few numbers of the
respondents (23%) get support from their family members with little gender differences between males
and females. The support which was provided by family members came second for female entrepreneurs
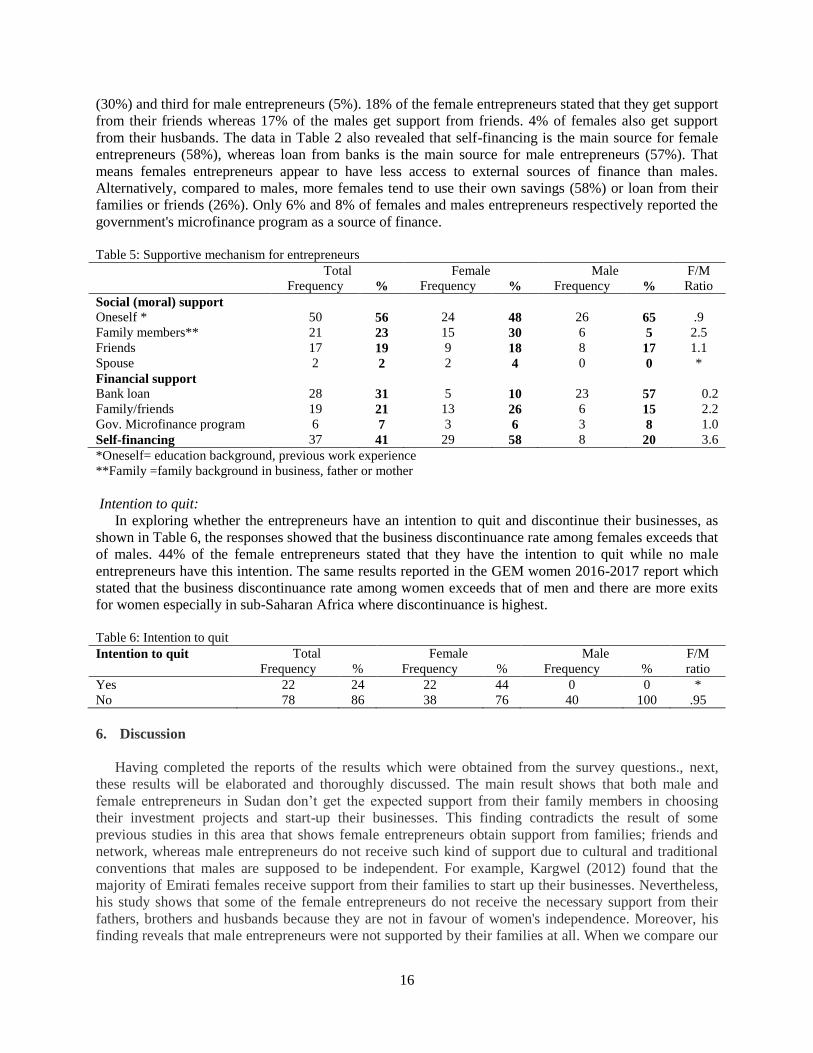
16
(30%) and third for male entrepreneurs (5%). 18% of the female entrepreneurs stated that they get support
from their friends whereas 17% of the males get support from friends. 4% of females also get support
from their husbands. The data in Table 2 also revealed that self-financing is the main source for female
entrepreneurs (58%), whereas loan from banks is the main source for male entrepreneurs (57%). That
means females entrepreneurs appear to have less access to external sources of finance than males.
Alternatively, compared to males, more females tend to use their own savings (58%) or loan from their
families or friends (26%). Only 6% and 8% of females and males entrepreneurs respectively reported the
government's microfinance program as a source of finance.
Table 5: Supportive mechanism for entrepreneurs
Total Female Male F/M
Ratio Frequency % Frequency % Frequency %
Social (moral) support
Oneself * 50 56 24 48 26 65 .9
Family members** 21 23 15 30 6 5 2.5
Friends 17 19 9 18 8 17 1.1
Spouse 2 2 2 4 0 0 *
Financial support
Bank loan 28 31 5 10 23 57 0.2
Family/friends 19 21 13 26 6 15 2.2
Gov. Microfinance program 6 7 3 6 3 8 1.0
Self-financing 37 41 29 58 8 20 3.6
*Oneself= education background, previous work experience
**Family =family background in business, father or mother
Intention to quit:
In exploring whether the entrepreneurs have an intention to quit and discontinue their businesses, as
shown in Table 6, the responses showed that the business discontinuance rate among females exceeds that
of males. 44% of the female entrepreneurs stated that they have the intention to quit while no male
entrepreneurs have this intention. The same results reported in the GEM women 2016-2017 report which
stated that the business discontinuance rate among women exceeds that of men and there are more exits
for women especially in sub-Saharan Africa where discontinuance is highest.
Table 6: Intention to quit
Intention to quit Total Female Male F/M
ratio Frequency % Frequency % Frequency %
Yes 22 24 22 44 0 0 *
No 78 86 38 76 40 100 .95
6. Discussion
Having completed the reports of the results which were obtained from the survey questions., next,
these results will be elaborated and thoroughly discussed. The main result shows that both male and
female entrepreneurs in Sudan don’t get the expected support from their family members in choosing
their investment projects and start-up their businesses. This finding contradicts the result of some
previous studies in this area that shows female entrepreneurs obtain support from families; friends and
network, whereas male entrepreneurs do not receive such kind of support due to cultural and traditional
conventions that males are supposed to be independent. For example, Kargwel (2012) found that the
majority of Emirati females receive support from their families to start up their businesses. Nevertheless,
his study shows that some of the female entrepreneurs do not receive the necessary support from their
fathers, brothers and husbands because they are not in favour of women's independence. Moreover, his
finding reveals that male entrepreneurs were not supported by their families at all. When we compare our
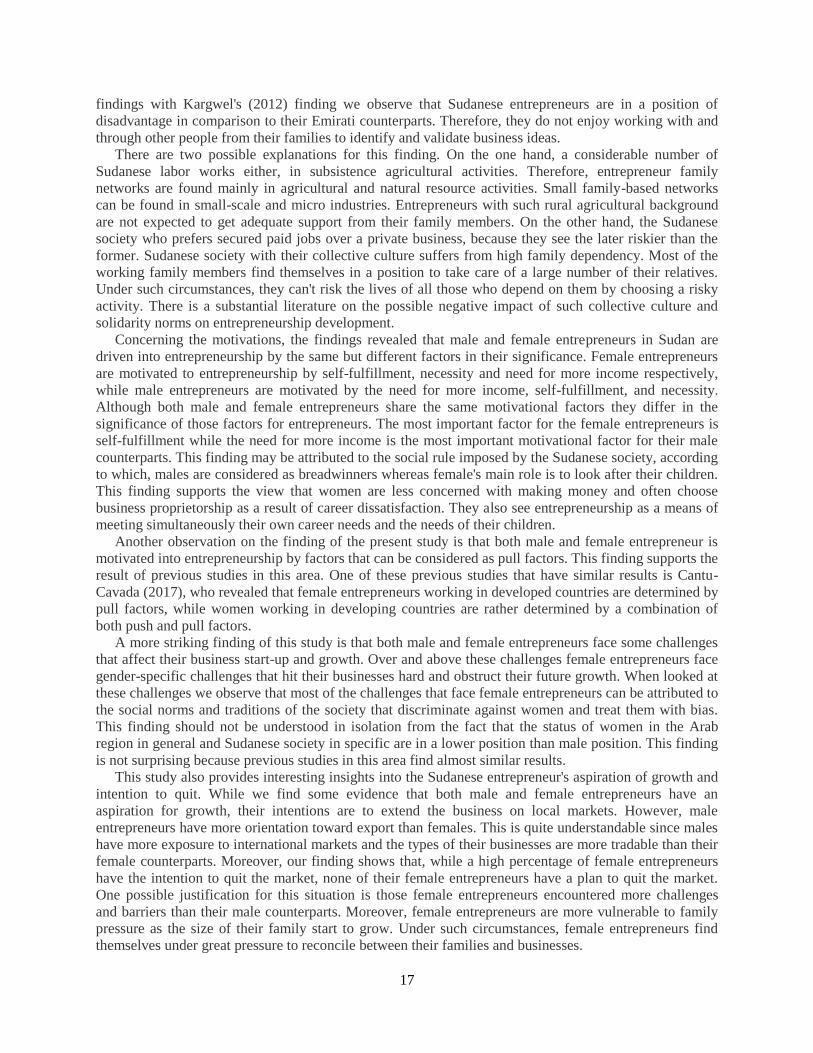
17
findings with Kargwel's (2012) finding we observe that Sudanese entrepreneurs are in a position of
disadvantage in comparison to their Emirati counterparts. Therefore, they do not enjoy working with and
through other people from their families to identify and validate business ideas.
There are two possible explanations for this finding. On the one hand, a considerable number of
Sudanese labor works either, in subsistence agricultural activities. Therefore, entrepreneur family
networks are found mainly in agricultural and natural resource activities. Small family-based networks
can be found in small-scale and micro industries. Entrepreneurs with such rural agricultural background
are not expected to get adequate support from their family members. On the other hand, the Sudanese
society who prefers secured paid jobs over a private business, because they see the later riskier than the
former. Sudanese society with their collective culture suffers from high family dependency. Most of the
working family members find themselves in a position to take care of a large number of their relatives.
Under such circumstances, they can't risk the lives of all those who depend on them by choosing a risky
activity. There is a substantial literature on the possible negative impact of such collective culture and
solidarity norms on entrepreneurship development.
Concerning the motivations, the findings revealed that male and female entrepreneurs in Sudan are
driven into entrepreneurship by the same but different factors in their significance. Female entrepreneurs
are motivated to entrepreneurship by self-fulfillment, necessity and need for more income respectively,
while male entrepreneurs are motivated by the need for more income, self-fulfillment, and necessity.
Although both male and female entrepreneurs share the same motivational factors they differ in the
significance of those factors for entrepreneurs. The most important factor for the female entrepreneurs is
self-fulfillment while the need for more income is the most important motivational factor for their male
counterparts. This finding may be attributed to the social rule imposed by the Sudanese society, according
to which, males are considered as breadwinners whereas female's main role is to look after their children.
This finding supports the view that women are less concerned with making money and often choose
business proprietorship as a result of career dissatisfaction. They also see entrepreneurship as a means of
meeting simultaneously their own career needs and the needs of their children.
Another observation on the finding of the present study is that both male and female entrepreneur is
motivated into entrepreneurship by factors that can be considered as pull factors. This finding supports the
result of previous studies in this area. One of these previous studies that have similar results is Cantu-
Cavada (2017), who revealed that female entrepreneurs working in developed countries are determined by
pull factors, while women working in developing countries are rather determined by a combination of
both push and pull factors.
A more striking finding of this study is that both male and female entrepreneurs face some challenges
that affect their business start-up and growth. Over and above these challenges female entrepreneurs face
gender-specific challenges that hit their businesses hard and obstruct their future growth. When looked at
these challenges we observe that most of the challenges that face female entrepreneurs can be attributed to
the social norms and traditions of the society that discriminate against women and treat them with bias.
This finding should not be understood in isolation from the fact that the status of women in the Arab
region in general and Sudanese society in specific are in a lower position than male position. This finding
is not surprising because previous studies in this area find almost similar results.
This study also provides interesting insights into the Sudanese entrepreneur's aspiration of growth and
intention to quit. While we find some evidence that both male and female entrepreneurs have an
aspiration for growth, their intentions are to extend the business on local markets. However, male
entrepreneurs have more orientation toward export than females. This is quite understandable since males
have more exposure to international markets and the types of their businesses are more tradable than their
female counterparts. Moreover, our finding shows that, while a high percentage of female entrepreneurs
have the intention to quit the market, none of their female entrepreneurs have a plan to quit the market.
One possible justification for this situation is those female entrepreneurs encountered more challenges
and barriers than their male counterparts. Moreover, female entrepreneurs are more vulnerable to family
pressure as the size of their family start to grow. Under such circumstances, female entrepreneurs find
themselves under great pressure to reconcile between their families and businesses.
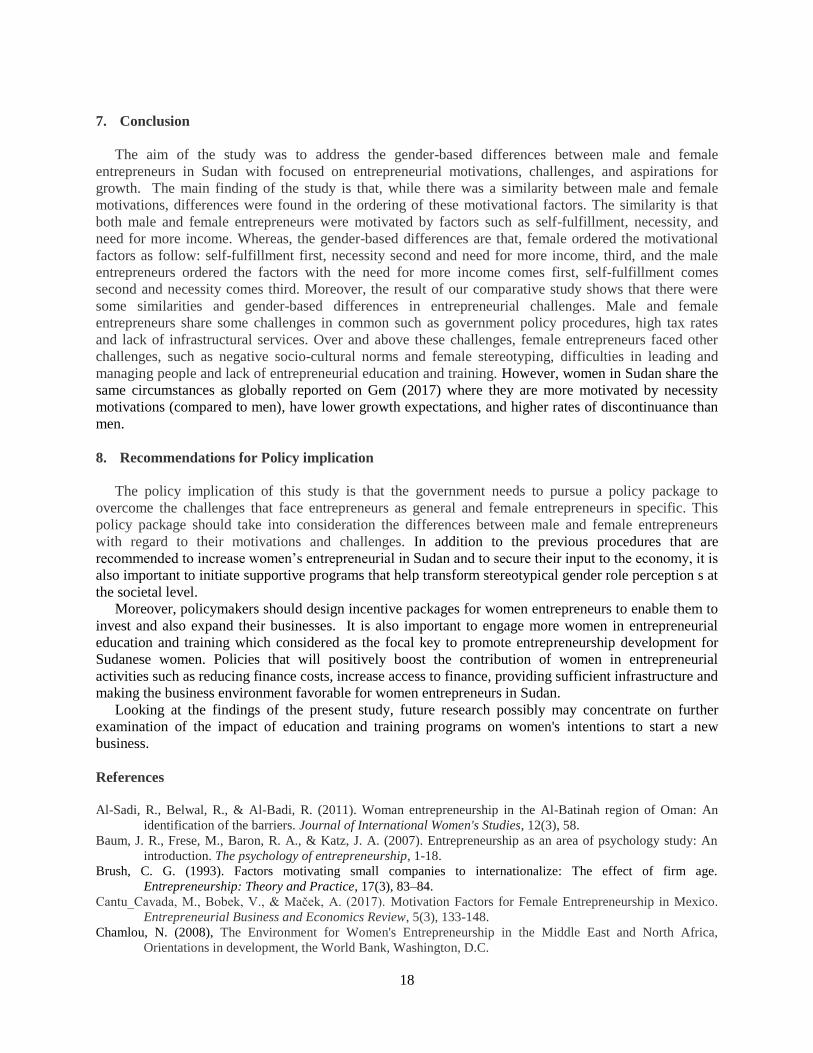
18
7. Conclusion
The aim of the study was to address the gender-based differences between male and female
entrepreneurs in Sudan with focused on entrepreneurial motivations, challenges, and aspirations for
growth. The main finding of the study is that, while there was a similarity between male and female
motivations, differences were found in the ordering of these motivational factors. The similarity is that
both male and female entrepreneurs were motivated by factors such as self-fulfillment, necessity, and
need for more income. Whereas, the gender-based differences are that, female ordered the motivational
factors as follow: self-fulfillment first, necessity second and need for more income, third, and the male
entrepreneurs ordered the factors with the need for more income comes first, self-fulfillment comes
second and necessity comes third. Moreover, the result of our comparative study shows that there were
some similarities and gender-based differences in entrepreneurial challenges. Male and female
entrepreneurs share some challenges in common such as government policy procedures, high tax rates
and lack of infrastructural services. Over and above these challenges, female entrepreneurs faced other
challenges, such as negative socio-cultural norms and female stereotyping, difficulties in leading and
managing people and lack of entrepreneurial education and training. However, women in Sudan share the
same circumstances as globally reported on Gem (2017) where they are more motivated by necessity
motivations (compared to men), have lower growth expectations, and higher rates of discontinuance than
men.
8. Recommendations for Policy implication
The policy implication of this study is that the government needs to pursue a policy package to
overcome the challenges that face entrepreneurs as general and female entrepreneurs in specific. This
policy package should take into consideration the differences between male and female entrepreneurs
with regard to their motivations and challenges. In addition to the previous procedures that are
recommended to increase women’s entrepreneurial in Sudan and to secure their input to the economy, it is
also important to initiate supportive programs that help transform stereotypical gender role perception s at
the societal level.
Moreover, policymakers should design incentive packages for women entrepreneurs to enable them to
invest and also expand their businesses. It is also important to engage more women in entrepreneurial
education and training which considered as the focal key to promote entrepreneurship development for
Sudanese women. Policies that will positively boost the contribution of women in entrepreneurial
activities such as reducing finance costs, increase access to finance, providing sufficient infrastructure and
making the business environment favorable for women entrepreneurs in Sudan.
Looking at the findings of the present study, future research possibly may concentrate on further
examination of the impact of education and training programs on women's intentions to start a new
business.
References
Al-Sadi, R., Belwal, R., & Al-Badi, R. (2011). Woman entrepreneurship in the Al-Batinah region of Oman: An
identification of the barriers. Journal of International Women's Studies, 12(3), 58.
Baum, J. R., Frese, M., Baron, R. A., & Katz, J. A. (2007). Entrepreneurship as an area of psychology study: An
introduction. The psychology of entrepreneurship, 1-18.
Brush, C. G. (1993). Factors motivating small companies to internationalize: The effect of firm age.
Entrepreneurship: Theory and Practice, 17(3), 83–84.
Cantu_Cavada, M., Bobek, V., & Maček, A. (2017). Motivation Factors for Female Entrepreneurship in Mexico.
Entrepreneurial Business and Economics Review, 5(3), 133-148.
Chamlou, N. (2008), The Environment for Women's Entrepreneurship in the Middle East and North Africa,
Orientations in development, the World Bank, Washington, D.C.
19
Cromie, S. (1987) “Motivations of aspiring male and female entrepreneurs”.Journal of Occupational Behaviour, 8,
251-261
Daniyan-Bagudu, H., Mohd Khan, S.J. Abdul-Hakim Roslan, A.H. (2016), The Issues and Challenges Facing the
Female Entrepreneurs in Lagos State, Nigeria, 3rd Kanita Postgraduate International Conference on
Gender Studies, Universiti Sains Malaysia, Penang.
Gilad, B. & Levine, P. (1986). A behavioral model of entrepreneurial supply. Journal of Small Business
Management, 24 (4), 45-54.
Ilhaamie, A.G.A., Arni, B.S., Rosmawani, C.H., and Al-Banna, M.H. (2014), Challenges of Muslim Women
Entrepreneurs in Malaysian SMEs, International Journal of Innovation, Management and Technology,
5(6), 428-433
.Kargwel, S.A. (2012), "A Comparative Study on Gender and Entrepreneurship Development: Still a Male's World
within UAE cultural context", International Journal of Business and Social Science 3(6), pp.44-55.
McClelland, D. C. (1965). N achievement and entrepreneurship: A longitudinal study. Journal of Personality and
Social Psychology, 1(4), 389.
Moses, C., Olokundun, A. M., & Mosunmola, A. (2014). Determining Women Entrepreneurial Motivation: A
Review of Theoretical Model. International Journal of Small Business and Entrepreneurship
Research, 2(3), 43-54.
Musa, E. A. (2014). Emerging Women Entrepreneurs in Sudan: Individual Characteristics, Obstacles, and
Empowerment. Rainer Hampp Verlag.
Pounder, P. (2016). Entrepreneurship and gender disparity in the Caribbean. Journal of Research on Women and
Gender, 6.
Reynolds, P.D., Camp, S.M., Bygrave, W.D., Autio, E. & Hay, M. (2002). GEM Global Entrepreneurship Report,
2001 Summary Report, 1-126. Available at:
http://www.gemconsortium.org/download/1293023015823/Summary%20Report%20Version%208%2002
%20April%2002.pdf
Sarri, K. & Trihopoulou, A. (2005). Female entrepreneurs' personal characteristics and motivation: a review of the
Greek situation, Women in Management Review, 20 (1), 24 – 36.
Scott, C. E. (1986). “Why more women are becoming entrepreneurs. Journal of Small Business Management, 24,
37.
Segal, G.; Borgia, D. & Schoenfeld, J. (2005). The motivation to become an entrepreneur. International Journal of
Entrepreneurial Behavior & Research, 11(1), 42 – 57.
Shmailan, A. (2014). Female entrepreneurs in Saudi Arabia: A comparison of barriers and motivations: moving
from disenfranchisement to empowerment. Elite Research Journal of Education and Review, 2(2), 6-21.
Stefanovic, I., Prokic, S., & Rankovič, L. (2010). Motivational and success factors of entrepreneurs: the evidence
from a developing country. Zb. rad. Ekon. fak. Rij. 28, 2, 251-269
Stephan, U., Hart, M., Mickiewicz, T., and Drews, C. (2015), “Understanding Motivations for Entrepreneurship”,
BIS research paper No. 212, Department for business innovation & skills, United Kingdom.
Tambunan, T. (2009), “Women entrepreneurship in Asian developing countries: Their development and main
constraints”, Journal of Development and Agricultural Economics, 1(2), 027-040.
Taylor SR, Kosarek DL (1995). "A Study of Women-Owned Businesses in the Dallas/Fort Worth Metroplex",
Business and Economics Monograph, 4.
Thurik, R., & Wennekers, S. (2004). Entrepreneurship, small business, and economic growth. Journal of small
business and enterprise development, 11(1), 140-149.
20
Available online at www.asric.org
ASRIC Journal on Social Sciences & Humanities 1 (2020) 20-36
a Department of Economics, Faculty of Economics and Management,
University of Bamenda, Cameroon b Higher Teacher Technical Training College, University of Buea, Cameroon
c Higher Institute of Commerce and Management, University of Bamenda, Cameroon
Received 19 December 2019; revised 30 January 2020; accepted 30 January 2020
Abstract
This study affirms Adam Smith’s assertion in his welfare theory that individuals are led by an ‘invisible hand’ to
promote an end which was no part of their intention. To Smith, individuals in an attempt to take care of their welfare
end up promoting the growth and development of the entire nation. Therefore, development at best can be achieved
by concentrating on welfare improvement of the citizens rather than concentrating on development in order to
improve welfare as has been adopted by most scholars. This study investigates the effect of cocoa production on the
welfare of its farmers in the South West Region of Cameroon. A multi-stage sampling technique was adopted in the
distribution of the 430 questionnaires. With the use of Principal Component Analysis (PCA) and the path regression,
the study revealed that fertilizers usage and chemical spray on the farm has a positive significant effect on cocoa
production, whereas access to credit and perceived climate variability has a negative direct significant effect. Cocoa
production has a positive significant effect on household income. The outcome of household income on welfare was
seen by its influence on home consumption, child education and basic needs provision. The above results permit this
study to recommend among others the following: The introduction of improved cocoa species which are more
adaptive under the current and highly unpredictable climate scenario. Creation of village banks that would provide
loans to farmers in the form of inputs rather than money; farmer education to avoid financial mismanagement; need
for diversification in order to avoid the risk and uncertainty involve in cocoa production and the “village-first”
development strategy that will lure the young and energetic generation in to the cocoa sector.
Keywords: Cocoa production; Path regression; Welfare; South West region
1. Introduction
Agriculture has proven to be the major sustainer of most World economies especially African
economies. This sector contribute to development as an economic activity, as a livelihood, and as a
1 Corresponding author. Email addresses: [email protected]; [email protected] (J.T. Ngong);
[email protected] (A.D. Akume); [email protected] (N.G. Forgha); [email protected] (V.A.
Wujung)
21
provider of environmental services, making it a unique instrument for poverty reduction, welfare
improvement and development, (Dethier and Effenberger, 2012; World Development Report, WDR,
2008). Three billion of the developing world’s 5.5 billion people, nearly half of humanity, live in rural
and depend directly or indirectly on agriculture for their livelihood.
The economy of Cameroon is predominantly agrarian and agriculture remains one of the main driving
forces for the country‘s economic growth and development. This sector employs over 70 percent of the
country‘s workforce, contributes about 32 percent of its GDP and 30 percent of its export revenue
(MINADER, 2012; Asare and David, 2011 and Molua and Lambi 2007). This agricultural strength comes
principally from the export crop sector, which is based on cocoa, coffee, timber, banana, rubber and palm
oil, with cocoa as the leading subsector (Tosam et al, 2019). Cameroon has approximately 250,000 cocoa
farms with about 60 percent of the country’s population depending directly or indirectly on cocoa for their
livelihood (Klarer, 2014; FAO, 2005). The country earns about 250 billion CFA francs (308.6 million
pounds) a year from cocoa, accounting for about half its primary-sector exports, National Cocoa and
Coffee Board, (NCCB, 2013). In 2009 cocoa accounted for 15% of Cameroon‘s total annual exports, and
2.2% of the country‘s GNP (Armathé et al., 2013). Thus the welfare of millions of families
including 600,000 farmers in Cameroon, depends on the cocoa industry.
Apart from its contribution to the nation’s economy through the revenue it generates, cocoa is a plant-
based food that contains carbohydrates, fats, proteins, natural minerals and some vitamins. Thus this crop
unlike other plant foods contains a group of compounds which exhibit several health benefits (Taubert et
al, 2007). Cocoa therefore does not only contribute to welfare indirectly through the income that comes
from it sales but also directly as food through the health benefits it provides. Unfortunately the
consumption of cocoa in Cameroon like in many Sub Saharan African countries is approximately 0.6 %.
Therefore the contribution of cocoa to farmers’ welfare in Cameroon and the South West Region in
particular is merely indirect through the income they earn from its production. Most of the cocoa
producers have never tasted chocolate, though their lives revolve around its key ingredient (Cocoa
Barometer, 2015). The cultivation of this rich plant based food which has proven to be one of the major
contributors to export earnings and GNP of the economy of Cameroon is predominantly in two basins in
the country (The South West and the Center basins).
The South West Region is the leading cocoa producing basin in Cameroon. This region produced over
58% of the country’s total production in 2012 (FAO, 2014; MINADER, 2012). The main source of the
livelihood of most inhabitants in the South West Region is cocoa production. Given that over 65% of the
farming population in the south West Region are involved in cocoa production it will be erroneous to talk
about their welfare without making allusion to their main source of income “cocoa production”.
Production in the South West Region of Cameroon moved from 46000 tons in 2001 to 98,450 tons in
2007 and to 188,329 tons in 2014, contributing 42%, 46.3% and 59.8% to the National output of Cocoa in
2001, 2007 and 2014 respectively (National Institute of Statistics, ‘NIS’, 2018). This imply that cocoa
production in the South West Region as well as the regional share of total national production of cocoa
has risen significantly in recent years; re-echoing the role played by the South West region (SWR) in
Cocoa production in Cameroon. However, the farmers who cultivate and pick the cocoa beans in this
Region; the most important actors in the cocoa value chain, seem to be languishing in poverty.
The evolution of poverty in the Region shows that the rate of poverty moved from 33.8% in 2001 to
27.5% in 2007 and to 18.2% in 2014, (NIS, 2016). This declining trend of poverty is in line with the
increasing trend of cocoa production in the region. On the contrary, despite this rise in output and fall in
poverty rates in the region, most cocoa farmers in many cocoa-growing communities are still suffering
from low incomes, high levels of poverty and poor nutrition (Klarer, 2014). This contradicts Chayanov
(1920) and Barnum and Squire (1979) Farm Household Models, which states that an increase in output all
other things being constant will increase ‘full household income’ and consequently welfare.
The growing of cocoa requires much investment in terms of time; this restricts the cocoa farmers from
diversifying their economic activities and thus leaves them in a very delicate financial situation (National
Cocoa and Coffee Board ‘NCCB’, 2014). This therefore endangers the cocoa sector which feed, cloth and
takes cares of the livelihood needs of thousands of families in the South West Region of Cameroon.
22
Aware of this demise in the cocoa sector and the plight of the cocoa farmer, the government of
Cameroon has in the past and even recently undertaken enormous reforms, in an attempt to revamp the
cocoa sector and improve the welfare situation of the cocoa farmers. These reforms includes, but are not
limited to the following; liberalization of the cocoa sector in 1989, which was aimed at, increasing the
efficiency of commodity marketing and raise prices received by farmers among others; A modernization
policy reform in 2000, fuelled by price fluctuations and negative balance of trade, that was designed with
the goal of raising cocoa production from 137,000 tons to 320,000 tons by 2015. The strategy was first
aimed at attracting a “younger, more financially viable and more educated” generation of farmers into the
sector, secondly in facilitating new farmer’s access to vast extensions of land from 4 hectares and above,
and finally in producing and distributing cocoa hybrid species to farmers accompanied by training. The
disbursement of 2.1 billion FCFA in 2004; this was to be used in providing more technical, financial and
institutional support to farmers (NIS, 2016; NCCB, 2014).
A re-launch program began in 2006 under the name ‘Professionnalisation Agricole et Renforcement
Institutionnel’ (PARI) and was aimed at creating awareness and attracting local investors into the sector.
It was led by the Ministry of Agriculture and Rural Development (MINADER) and the Sustainable Tree
Crop Program (STCP) driven by the International Institute of Tropical Agriculture (IITA). Its activities
included; diffusing better cultural practices including agro forestry, improving infrastructures, organizing
farmers into cooperatives to ease marketing, and facilitating their access to farm inputs, information and
credit (Ndoping, 2011; Kamdem et al., 2010).
The Development fund for the Cocoa and Coffee (FODECC) was created on March 2006 by the
decree No 2006/085 of 9th March 2006. Her principal mission is to support this sector through funding of
projects aimed at protecting, increasing and guarantying both the qualitative and quantitative cocoa
production. In this same 2006 the state-run Cameroon Cocoa Development Authority (SODECAO)
decided to acquire land in the south west region for distribution to farmers to open new cocoa farms
(MINADER, 2012). Plans have also been developed to improve rural infrastructure and empower farmers
to negotiate better prices with buyers. The government announced a 5 years cocoa project in 2009 stating
that it would invest $10 million on 20 million seedlings in the first year alone. The Inter-professional
Cocoa and Coffee Council (CCIC) launched its "New Generation" scheme in 2012 to lure young people
to cocoa farming and create new plantations by funding agricultural schools and giving logistical and
financial help to the new farmers (MINADER, 2012). The NCCB regulator also pledged to invest 1.7
billion CFA francs to rehabilitate 2,500 cocoa dryers in the main growing areas to reduce the presence of
smoke in beans and reinforce controls in an effort to meet tougher European Union (EU) quality standards
(NCCB, 2015).
The above reforms were not without fruits: liberalization has helped farmers to be enjoying higher
cocoa prices. Evidence is the fact that prices moved from 430 FCFA in 1988 to 1,695 FCFA in 2011
(NIS, 2018); Road network density (paved and unpaved roads) moved from 3.8% in 1987 to 7.2% of the
surface area in the South West Region (SWR) in 2001 (Klarer, 2014 and Njume-Ebong, 2004). About
20% of the cocoa farming population in the SWR has successfully gone through training and certification
at Farmer field Schools (FFS) (Kimengsi et al., 2016). Over 114 ovens and over 1,000 canvas sheets
(tarpaulins) were distributed freely to cocoa farmers in Cameroon's Central and South West Regions for
quality improvement among others. However, not all the fruits have been realized by these reforms and
even among those realized the levels are still below expectations.
Thus despite these efforts by the government and it associated results much has not change in the
cocoa sector in the South West Region as many cocoa farmers continue to live in destitute poverty. This
is evident by the fact that annual average revenue per person in the cocoa producing zones of the South
West Region as revealed by Folefack, (2010) stands at 228,263 FCFA (386USD) implying that an
individual lives on 625.4 FCFA per day, which is less than the 738 FCFA limit set by Cameroon
Household Survey 2007 (ECAM3) for falling into poverty in Cameroon. Again Cocoa Barometer, (2015)
and Klarer, (2014) attest to the fact that one out of every four cocoa farmers in these cocoa fields still
goes to bed hungry every night.
23
The above analyses reveal that the real contributing factors to the welfare of cocoa farmers in the
South West Region are yet to be known and one will not need a prophet to affirm these field realities as
one visit these cocoa producing communities. This therefore undeniably calls for an investigation into the
economic implications of cocoa production on the welfare of its producers and that is where this paper
finds its grounds.
Many studies/similar works have been carried out on cocoa production and livelihood sustenance in
the world, Africa, Cameroon and the South West Region. Some of these studies looked at cocoa
production and its growth challenges (Tchokote et al., 2015; Achu , 2009; Wokia-azi, et al, 2008; Vigneri,
2007; Amin, 2001). Others were carried out to examine the influence of climate on cocoa production,
(Kimengsi et al, 2013; Oyekale, and Oladele, 2012). Others looked at cocoa as an export crop and its
effect on livelihood (Hasnah, et al., 2011; Ladé, 2007; Uba, 1998; Baye, 1998); and cocoa as a small
holder activity (Mubeteneh, 2015; Bemieh, 2013); farmer’s unions and cocoa production (Kimengsi et al,
2016; Njila, 2012); determinants of cocoa production (Effah et al., 2017; Forgha and Tosam, 2013 and
Fadipe et al., 2012); technical efficiency, cocoa output and livelihood improvement (Mukete et al 2016;
2018; Naftali et al. 2014; Richman, 2010); value chain in cocoa production and it livelihood implications
(Belen, 2013; Gereffi and Fernandez-Stark, 2011; Traoré, 2009; Kazianga et al., 2002); livelihood
diversification and welfare (Daud, 2018; Oyinbo and Olaleye 2016; Abimbola and Oluwakemi, 2013;
Aneani, et al, 2011); the effect of poverty on household welfare (akerele and Adewuyi, 2011; Ekow,
2011; Naschold, 2008); the effect of famer innovation on household welfare (Tambo and Wünscher,
2014), cocoa production, agriculture and welfare as well as welfare determinants among others
(Lekobane and Seleka, 2017; Bellemare, et al., 2016; Lawal et al., 2015; Ademiluyi, 2014; Quartey,
2012).
These studies adopted various methodologies in the analysis of data ranging from Ordered Probit
regression, endogenous switching regression, integrated impact assessment, two-stage least square (2
SLS), FGT poverty model and Tobit regression, Ordinary Least Squares (OLS), Generalized Method of
Moments (GMM), profitability and efficiency indexes, multinomial logit among others. The present paper
has used the Principal Component Analysis (PCA) and path regression in its data analysis which has been
adopted by none of the above studies.
Some of the above scholars have used various variables as proxies for welfare. Some have used
household assets as a proxy for welfare (Ekow, 2011; Naschold, 2008); some have used expenditure
(Lekobane and Seleka, 2017; Lawal et al. 2015); others household income (Tambo and Wunscher, 2014;
Oyinbo and Olaleye, 2016; Daud et al., 2018) and some household consumption (Bellemare et al. 2016;
Akerele and Adewuyi, 2011). Those who adopted the use of income as a proxy for welfare used per capita
household income to capture welfare. This study did not use per capita household income like other
studies but adopted the use of household income and observe the effect of household income on home
consumption, child education as well as basic needs provision among the cocoa farming households in the
south West Region of Cameroon making the study unique.
2. Methods, Techniques, Studied Material and Area Description
The study adopted a cross-sectional research design which included both survey and ethnographic
methods (Ranjit 1996). This cross-sectional study design shows much relevance in this study since it
seeks to analyze the economic implications of cocoa production on the welfare of cocoa farmers using a
cross section of the farming population of the South West region of Cameroon. It will therefore gives an
overall picture of how cocoa farming affects the welfare of the cocoa farmers through its effect on shelter
provision, food, clothing, education and health among others that has been captured by household income.
The study made use of primary sources of data as well as a mixed method research design in primary data
collection. Structured questionnaire and ethnographic techniques were used in the data collection process.
The ethnographic study methods used include interviews and observations (with pictures on the ground).
The choice of this design is due to the fact that it is relatively quick and easy to conduct (no long
periods of follow-up). Data on all variables is collected at the same time. With this design it is possible to
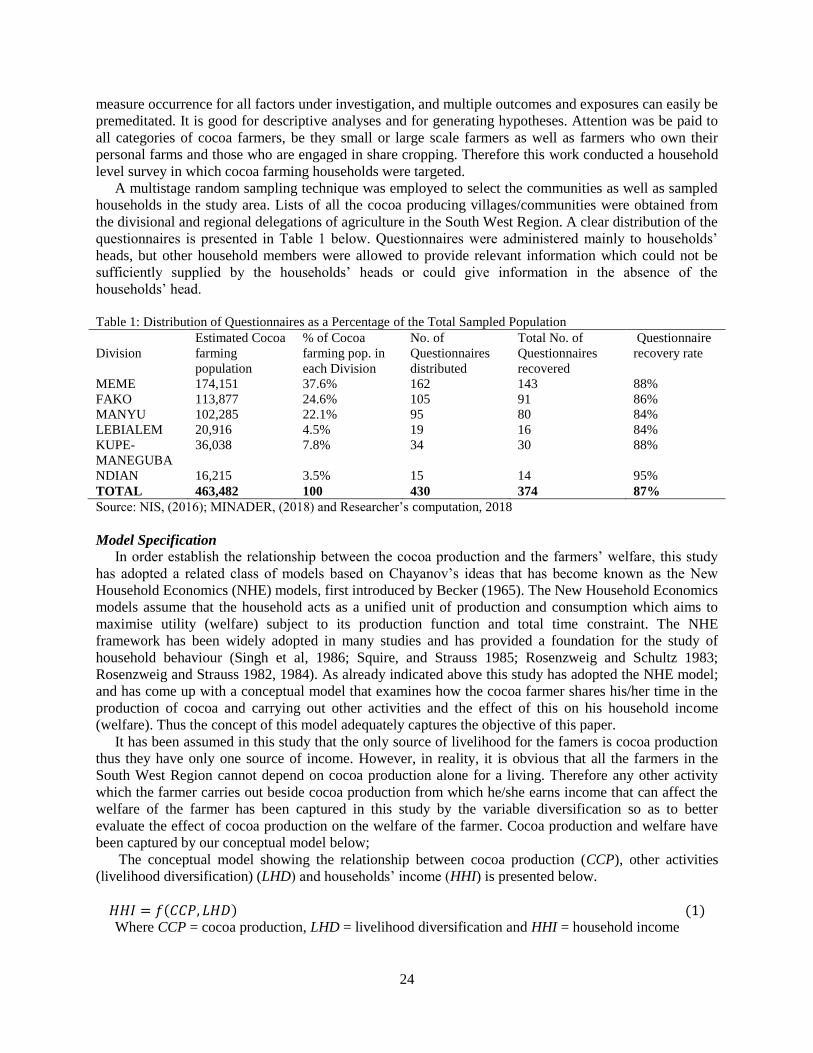
24
measure occurrence for all factors under investigation, and multiple outcomes and exposures can easily be
premeditated. It is good for descriptive analyses and for generating hypotheses. Attention was be paid to
all categories of cocoa farmers, be they small or large scale farmers as well as farmers who own their
personal farms and those who are engaged in share cropping. Therefore this work conducted a household
level survey in which cocoa farming households were targeted.
A multistage random sampling technique was employed to select the communities as well as sampled
households in the study area. Lists of all the cocoa producing villages/communities were obtained from
the divisional and regional delegations of agriculture in the South West Region. A clear distribution of the
questionnaires is presented in Table 1 below. Questionnaires were administered mainly to households’
heads, but other household members were allowed to provide relevant information which could not be
sufficiently supplied by the households’ heads or could give information in the absence of the
households’ head.
Table 1: Distribution of Questionnaires as a Percentage of the Total Sampled Population
Division
Estimated Cocoa
farming
population
% of Cocoa
farming pop. in
each Division
No. of
Questionnaires
distributed
Total No. of
Questionnaires
recovered
Questionnaire
recovery rate
MEME 174,151 37.6% 162 143 88%
FAKO 113,877 24.6% 105 91 86%
MANYU 102,285 22.1% 95 80 84%
LEBIALEM 20,916 4.5% 19 16 84%
KUPE-
MANEGUBA
36,038 7.8% 34 30 88%
NDIAN 16,215 3.5% 15 14 95%
TOTAL 463,482 100 430 374 87%
Source: NIS, (2016); MINADER, (2018) and Researcher’s computation, 2018
Model Specification
In order establish the relationship between the cocoa production and the farmers’ welfare, this study
has adopted a related class of models based on Chayanov’s ideas that has become known as the New
Household Economics (NHE) models, first introduced by Becker (1965). The New Household Economics
models assume that the household acts as a unified unit of production and consumption which aims to
maximise utility (welfare) subject to its production function and total time constraint. The NHE
framework has been widely adopted in many studies and has provided a foundation for the study of
household behaviour (Singh et al, 1986; Squire, and Strauss 1985; Rosenzweig and Schultz 1983;
Rosenzweig and Strauss 1982, 1984). As already indicated above this study has adopted the NHE model;
and has come up with a conceptual model that examines how the cocoa farmer shares his/her time in the
production of cocoa and carrying out other activities and the effect of this on his household income
(welfare). Thus the concept of this model adequately captures the objective of this paper.
It has been assumed in this study that the only source of livelihood for the famers is cocoa production
thus they have only one source of income. However, in reality, it is obvious that all the farmers in the
South West Region cannot depend on cocoa production alone for a living. Therefore any other activity
which the farmer carries out beside cocoa production from which he/she earns income that can affect the
welfare of the farmer has been captured in this study by the variable diversification so as to better
evaluate the effect of cocoa production on the welfare of the farmer. Cocoa production and welfare have
been captured by our conceptual model below;
The conceptual model showing the relationship between cocoa production (CCP), other activities
(livelihood diversification) (LHD) and households’ income (HHI) is presented below.
𝐻𝐻𝐼 = 𝑓(𝐶𝐶𝑃, 𝐿𝐻𝐷) (1) Where CCP = cocoa production, LHD = livelihood diversification and HHI = household income
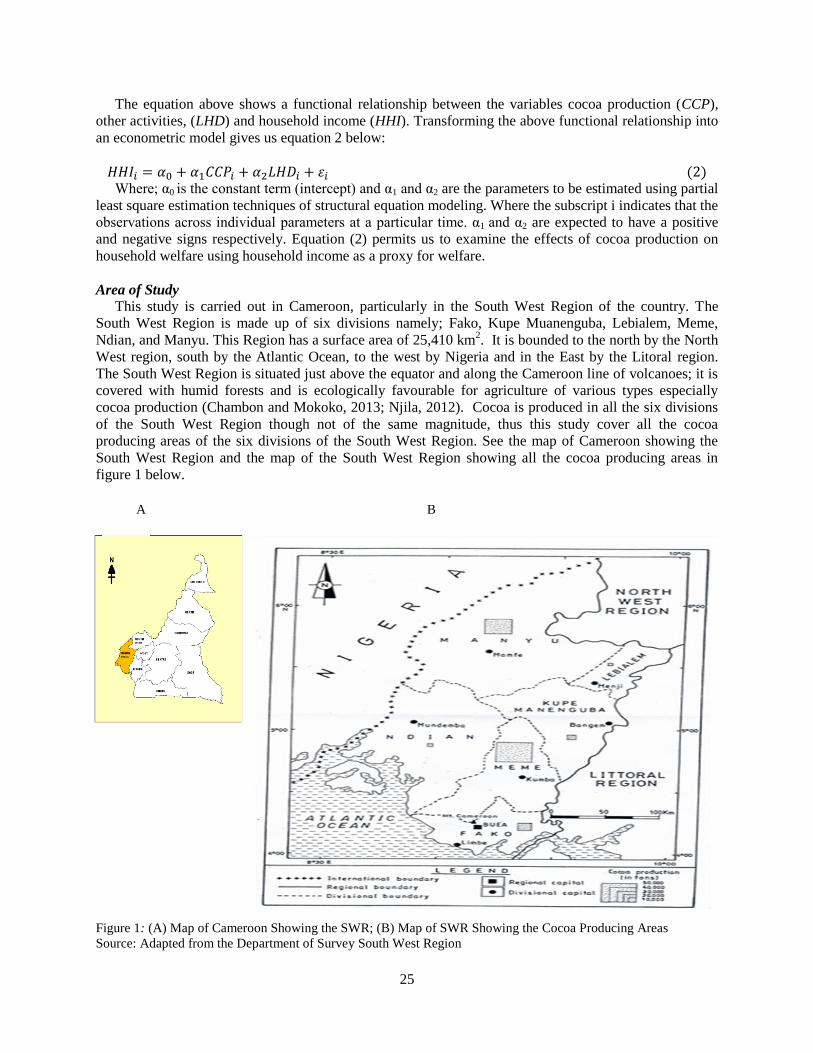
25
The equation above shows a functional relationship between the variables cocoa production (CCP),
other activities, (LHD) and household income (HHI). Transforming the above functional relationship into
an econometric model gives us equation 2 below:
𝐻𝐻𝐼𝑖 = 𝛼0 + 𝛼1𝐶𝐶𝑃𝑖 + 𝛼2𝐿𝐻𝐷𝑖 + 𝜀𝑖 (2) Where; α0 is the constant term (intercept) and α1 and α2 are the parameters to be estimated using partial
least square estimation techniques of structural equation modeling. Where the subscript i indicates that the
observations across individual parameters at a particular time. α1 and α2 are expected to have a positive
and negative signs respectively. Equation (2) permits us to examine the effects of cocoa production on
household welfare using household income as a proxy for welfare.
Area of Study
This study is carried out in Cameroon, particularly in the South West Region of the country. The
South West Region is made up of six divisions namely; Fako, Kupe Muanenguba, Lebialem, Meme,
Ndian, and Manyu. This Region has a surface area of 25,410 km2. It is bounded to the north by the North
West region, south by the Atlantic Ocean, to the west by Nigeria and in the East by the Litoral region.
The South West Region is situated just above the equator and along the Cameroon line of volcanoes; it is
covered with humid forests and is ecologically favourable for agriculture of various types especially
cocoa production (Chambon and Mokoko, 2013; Njila, 2012). Cocoa is produced in all the six divisions
of the South West Region though not of the same magnitude, thus this study cover all the cocoa
producing areas of the six divisions of the South West Region. See the map of Cameroon showing the
South West Region and the map of the South West Region showing all the cocoa producing areas in
figure 1 below.
Figure 1: (A) Map of Cameroon Showing the SWR; (B) Map of SWR Showing the Cocoa Producing Areas
Source: Adapted from the Department of Survey South West Region
A B
26
The reason for the choice of this region is because it is one of the two cocoa production basins in
Cameroon and again the region is heavily endowed with a lot of potentials for cocoa production. Cocoa is
produced in 7 of the 10 Regions of Cameroon but the South West Region alone produces over 58% of the
cocoa produced in Cameroon thus the region stand as the country’s main pillar in terms of cocoa
production (FAO, 2014; MINADER, 2012). This high production is largely due to its rich soils and
humid climate. The region has the highest output per hectare in Cameroon averaging more than 425 kg
per ha. Cocoa production was first introduced in Cameroon, in the South West Region as early as 1886 –
1887 by the German colonial masters who managed its production and exportation as raw materials for
their home industries; therefore this region has a long history of cocoa production (NCCB, 2014; Iyabano,
2012).
3. Presentation of Results
Both descriptive and inferential statistics were used in analysing the data. The first part of the analysis
deals with the socio economic characteristics of cocoa farmers in the South West Region (that is
descriptive statistics). This was to enable us to ascertain who these cocoa farmers are by bringing out their
characteristics which to an extent has an effect on their welfare. From these descriptive statistics, it is
evident that; the age of the household head, marital status, level of education, dependency ratio, farm size,
farm age, accessibility of the farm, farmer training, land laws (land ownership) and gender of the
household head are all socioeconomic characteristics of cocoa farmers in the South west Region of
Cameroon.
Inferential statistics
In order to adequately ascertain the economic implication of cocoa production on the farmers’ welfare it
was necessary to subject the question items on the questionnaire to a number of pre -test analyses. This
was done to ensure that the items reflect the concepts being measured. In other words, pre-test are
necessary to ensure reliability and validity of the concepts being measured. The first test was the Kaiser-
Meyer-Olkin and Bartlett's test for the factorability of the items of households’ income measure through
dimensional reduction (see table 2)
Table 2: KMO and Bartlett's Test Kaiser-Meyer-Olkin Measure of Sampling Adequacy. 0.676
Bartlett's Test of Sphericity
Approx. Chi-Square 545.103
Df 15
Sig. 0.000
Source: Researcher Computations, 2018
The result in table (2) shows moderate evidence of factorability of the items using principal component
analysis. Both Bartlett’s test for sphericity and the Kaiser-Meyer-Olkin (KMO) are significant. The
significant of these tests permit the researcher to identify the few significant underling items that cluster
into a homogenous set. We proceed to present the result of the communalities obtained through principal
component extraction method. Communalities explained the proportion of the variance explained by each
item. It is recommended to be greater than or equal to 0.5 (Thalut, 2017). The result of the communalities
extracted has been presented in table (3) below.
The communality of the six question items on table 3 that was finally adopted in the study shows strong
evidence of explained variability. We can now present the result of the total variance explained on table 4.
The result in table 4 shows that the six question items has been reduced to regression factor scores with a
total percentage cumulative variance of 65.455 with the initial eigenvalues of 2.472 and 1.455 for
component one and two respectively. To examine the disposition of the items with respect to the two
components, we present the result of result of the rotated component matrix on table 5.
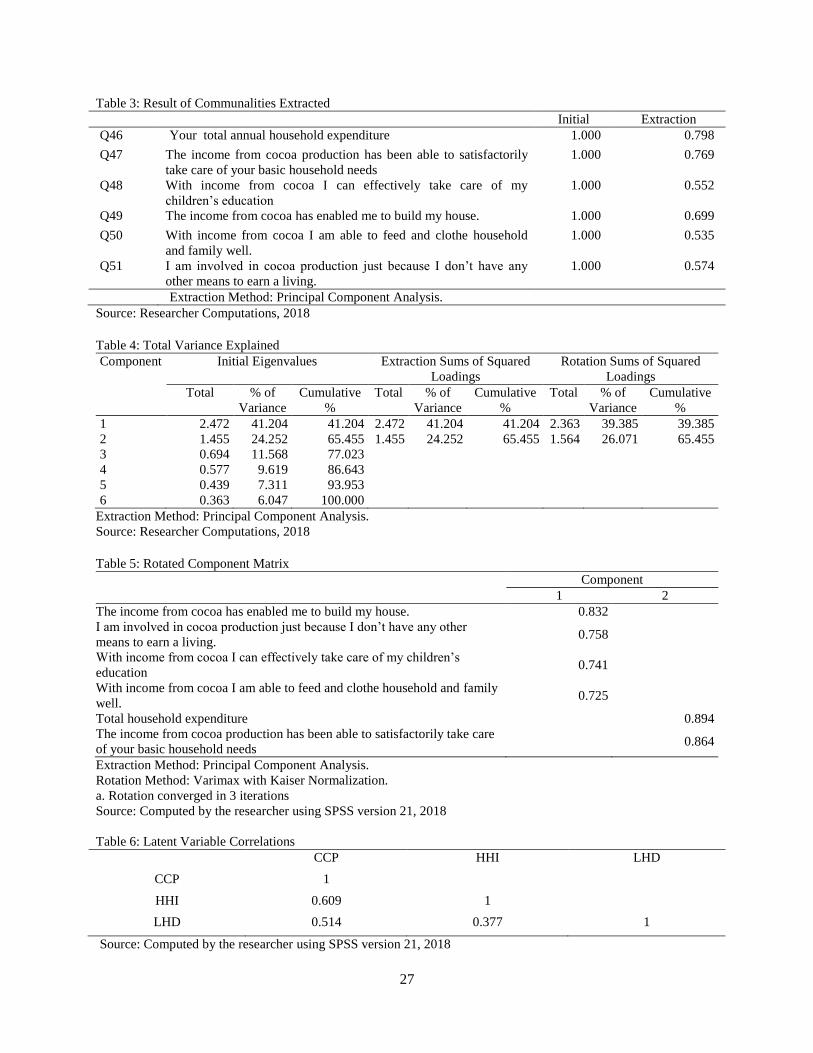
27
Table 3: Result of Communalities Extracted
Initial Extraction
Q46 Your total annual household expenditure 1.000 0.798
Q47 The income from cocoa production has been able to satisfactorily
take care of your basic household needs
1.000 0.769
Q48 With income from cocoa I can effectively take care of my
children’s education
1.000 0.552
Q49 The income from cocoa has enabled me to build my house. 1.000 0.699
Q50 With income from cocoa I am able to feed and clothe household
and family well.
1.000 0.535
Q51 I am involved in cocoa production just because I don’t have any
other means to earn a living.
1.000 0.574
Extraction Method: Principal Component Analysis.
Source: Researcher Computations, 2018
Table 4: Total Variance Explained Component Initial Eigenvalues Extraction Sums of Squared
Loadings
Rotation Sums of Squared
Loadings
Total % of
Variance
Cumulative
%
Total % of
Variance
Cumulative
%
Total % of
Variance
Cumulative
%
1 2.472 41.204 41.204 2.472 41.204 41.204 2.363 39.385 39.385
2 1.455 24.252 65.455 1.455 24.252 65.455 1.564 26.071 65.455
3 0.694 11.568 77.023
4 0.577 9.619 86.643
5 0.439 7.311 93.953
6 0.363 6.047 100.000
Extraction Method: Principal Component Analysis.
Source: Researcher Computations, 2018
Table 5: Rotated Component Matrix Component
1 2
The income from cocoa has enabled me to build my house. 0.832
I am involved in cocoa production just because I don’t have any other
means to earn a living. 0.758
With income from cocoa I can effectively take care of my children’s
education 0.741
With income from cocoa I am able to feed and clothe household and family
well. 0.725
Total household expenditure 0.894
The income from cocoa production has been able to satisfactorily take care
of your basic household needs 0.864
Extraction Method: Principal Component Analysis.
Rotation Method: Varimax with Kaiser Normalization.
a. Rotation converged in 3 iterations
Source: Computed by the researcher using SPSS version 21, 2018
Table 6: Latent Variable Correlations
CCP HHI LHD
CCP 1
HHI 0.609 1
LHD 0.514 0.377 1
Source: Computed by the researcher using SPSS version 21, 2018
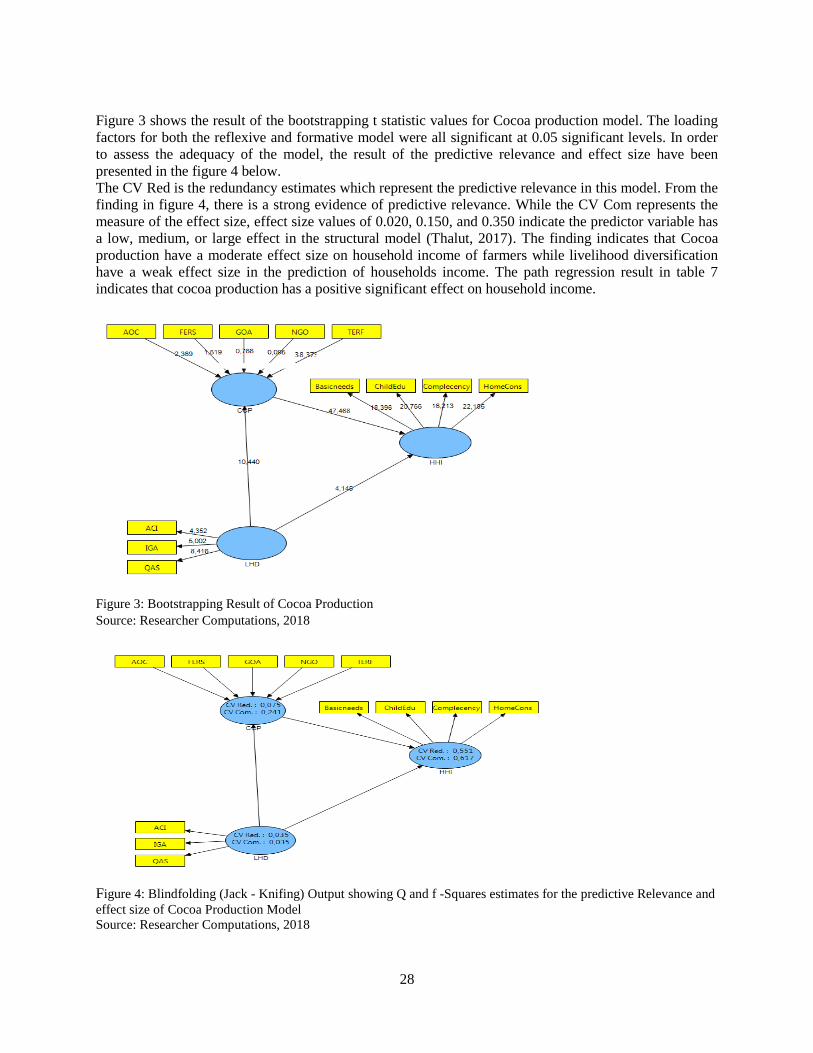
28
Figure 3 shows the result of the bootstrapping t statistic values for Cocoa production model. The loading
factors for both the reflexive and formative model were all significant at 0.05 significant levels. In order
to assess the adequacy of the model, the result of the predictive relevance and effect size have been
presented in the figure 4 below.
The CV Red is the redundancy estimates which represent the predictive relevance in this model. From the
finding in figure 4, there is a strong evidence of predictive relevance. While the CV Com represents the
measure of the effect size, effect size values of 0.020, 0.150, and 0.350 indicate the predictor variable has
a low, medium, or large effect in the structural model (Thalut, 2017). The finding indicates that Cocoa
production have a moderate effect size on household income of farmers while livelihood diversification
have a weak effect size in the prediction of households income. The path regression result in table 7
indicates that cocoa production has a positive significant effect on household income.
Figure 3: Bootstrapping Result of Cocoa Production
Source: Researcher Computations, 2018
Figure 4: Blindfolding (Jack - Knifing) Output showing Q and f -Squares estimates for the predictive Relevance and
effect size of Cocoa Production Model
Source: Researcher Computations, 2018
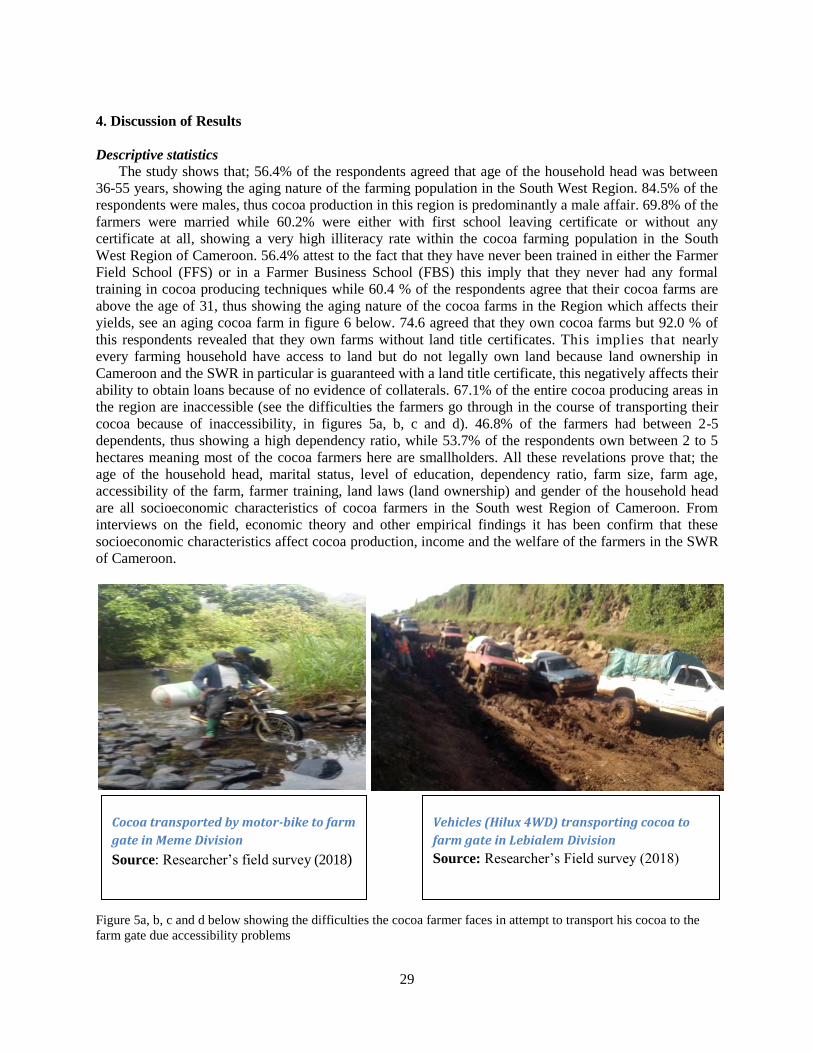
29
4. Discussion of Results
Descriptive statistics The study shows that; 56.4% of the respondents agreed that age of the household head was between
36-55 years, showing the aging nature of the farming population in the South West Region. 84.5% of the
respondents were males, thus cocoa production in this region is predominantly a male affair. 69.8% of the
farmers were married while 60.2% were either with first school leaving certificate or without any
certificate at all, showing a very high illiteracy rate within the cocoa farming population in the South
West Region of Cameroon. 56.4% attest to the fact that they have never been trained in either the Farmer
Field School (FFS) or in a Farmer Business School (FBS) this imply that they never had any formal
training in cocoa producing techniques while 60.4 % of the respondents agree that their cocoa farms are
above the age of 31, thus showing the aging nature of the cocoa farms in the Region which affects their
yields, see an aging cocoa farm in figure 6 below. 74.6 agreed that they own cocoa farms but 92.0 % of
this respondents revealed that they own farms without land title certificates. This implies that nearly
every farming household have access to land but do not legally own land because land ownership in
Cameroon and the SWR in particular is guaranteed with a land title certificate, this negatively affects their
ability to obtain loans because of no evidence of collaterals. 67.1% of the entire cocoa producing areas in
the region are inaccessible (see the difficulties the farmers go through in the course of transporting their
cocoa because of inaccessibility, in figures 5a, b, c and d). 46.8% of the farmers had between 2-5
dependents, thus showing a high dependency ratio, while 53.7% of the respondents own between 2 to 5
hectares meaning most of the cocoa farmers here are smallholders. All these revelations prove that; the
age of the household head, marital status, level of education, dependency ratio, farm size, farm age,
accessibility of the farm, farmer training, land laws (land ownership) and gender of the household head
are all socioeconomic characteristics of cocoa farmers in the South west Region of Cameroon. From
interviews on the field, economic theory and other empirical findings it has been confirm that these
socioeconomic characteristics affect cocoa production, income and the welfare of the farmers in the SWR
of Cameroon.
Figure 5a, b, c and d below showing the difficulties the cocoa farmer faces in attempt to transport his cocoa to the
farm gate due accessibility problems
Vehicles (Hilux 4WD) transporting cocoa to
farm gate in Lebialem Division
Source: Researcher’s Field survey (2018)
Cocoa transported by motor-bike to farm
gate in Meme Division
Source: Researcher’s field survey (2018)
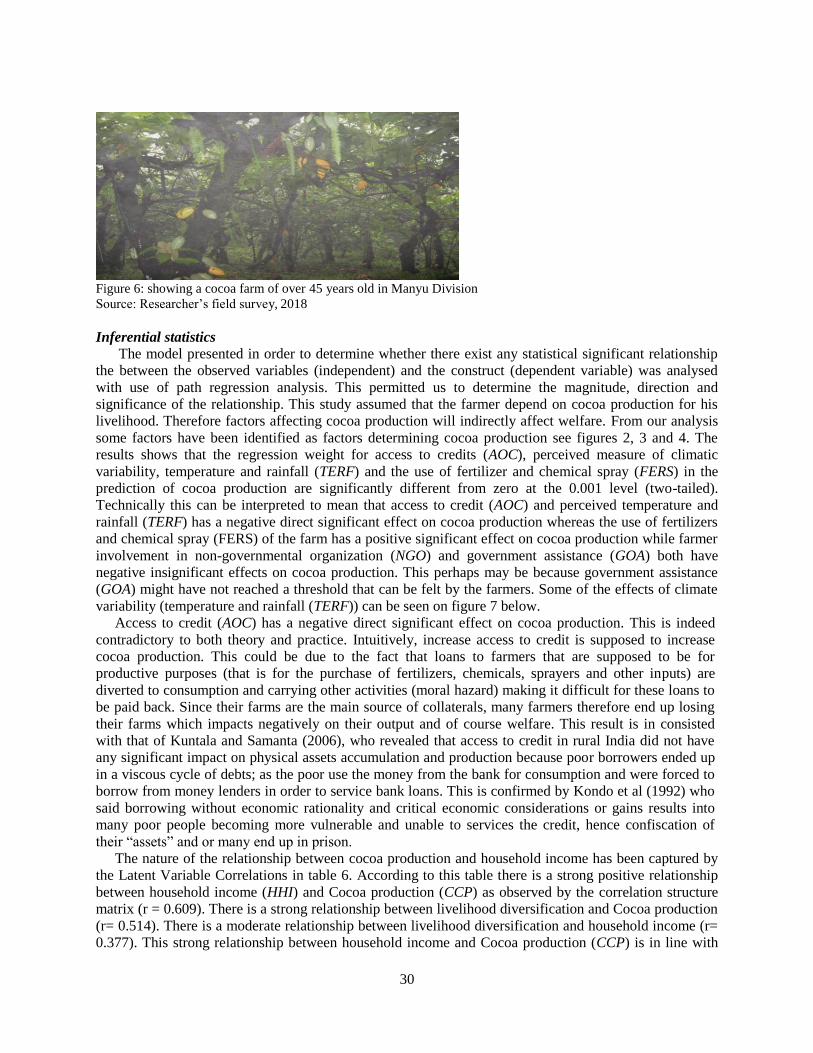
30
Figure 6: showing a cocoa farm of over 45 years old in Manyu Division
Source: Researcher’s field survey, 2018
Inferential statistics
The model presented in order to determine whether there exist any statistical significant relationship
the between the observed variables (independent) and the construct (dependent variable) was analysed
with use of path regression analysis. This permitted us to determine the magnitude, direction and
significance of the relationship. This study assumed that the farmer depend on cocoa production for his
livelihood. Therefore factors affecting cocoa production will indirectly affect welfare. From our analysis
some factors have been identified as factors determining cocoa production see figures 2, 3 and 4. The
results shows that the regression weight for access to credits (AOC), perceived measure of climatic
variability, temperature and rainfall (TERF) and the use of fertilizer and chemical spray (FERS) in the
prediction of cocoa production are significantly different from zero at the 0.001 level (two-tailed).
Technically this can be interpreted to mean that access to credit (AOC) and perceived temperature and
rainfall (TERF) has a negative direct significant effect on cocoa production whereas the use of fertilizers
and chemical spray (FERS) of the farm has a positive significant effect on cocoa production while farmer
involvement in non-governmental organization (NGO) and government assistance (GOA) both have
negative insignificant effects on cocoa production. This perhaps may be because government assistance
(GOA) might have not reached a threshold that can be felt by the farmers. Some of the effects of climate
variability (temperature and rainfall (TERF)) can be seen on figure 7 below.
Access to credit (AOC) has a negative direct significant effect on cocoa production. This is indeed
contradictory to both theory and practice. Intuitively, increase access to credit is supposed to increase
cocoa production. This could be due to the fact that loans to farmers that are supposed to be for
productive purposes (that is for the purchase of fertilizers, chemicals, sprayers and other inputs) are
diverted to consumption and carrying other activities (moral hazard) making it difficult for these loans to
be paid back. Since their farms are the main source of collaterals, many farmers therefore end up losing
their farms which impacts negatively on their output and of course welfare. This result is in consisted
with that of Kuntala and Samanta (2006), who revealed that access to credit in rural India did not have
any significant impact on physical assets accumulation and production because poor borrowers ended up
in a viscous cycle of debts; as the poor use the money from the bank for consumption and were forced to
borrow from money lenders in order to service bank loans. This is confirmed by Kondo et al (1992) who
said borrowing without economic rationality and critical economic considerations or gains results into
many poor people becoming more vulnerable and unable to services the credit, hence confiscation of
their “assets” and or many end up in prison.
The nature of the relationship between cocoa production and household income has been captured by
the Latent Variable Correlations in table 6. According to this table there is a strong positive relationship
between household income (HHI) and Cocoa production (CCP) as observed by the correlation structure
matrix (r = 0.609). There is a strong relationship between livelihood diversification and Cocoa production
(r= 0.514). There is a moderate relationship between livelihood diversification and household income (r=
0.377). This strong relationship between household income and Cocoa production (CCP) is in line with
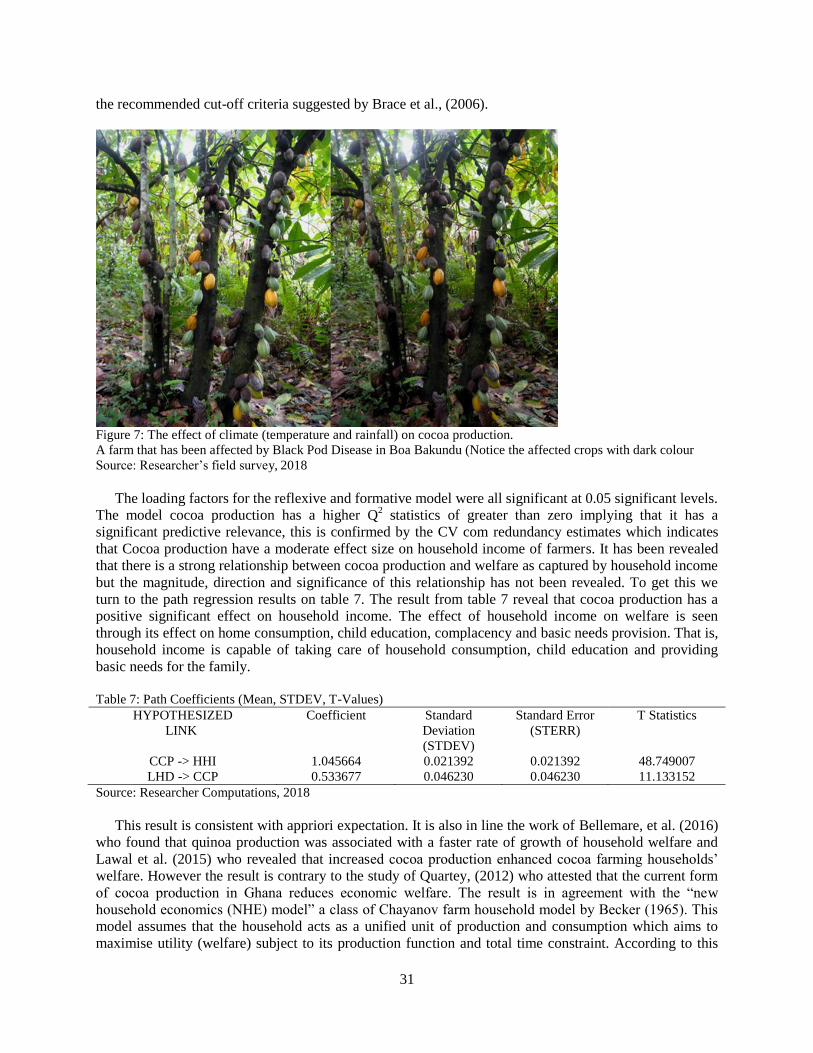
31
the recommended cut-off criteria suggested by Brace et al., (2006).
Figure 7: The effect of climate (temperature and rainfall) on cocoa production.
A farm that has been affected by Black Pod Disease in Boa Bakundu (Notice the affected crops with dark colour
Source: Researcher’s field survey, 2018
The loading factors for the reflexive and formative model were all significant at 0.05 significant levels.
The model cocoa production has a higher Q2 statistics of greater than zero implying that it has a
significant predictive relevance, this is confirmed by the CV com redundancy estimates which indicates
that Cocoa production have a moderate effect size on household income of farmers. It has been revealed
that there is a strong relationship between cocoa production and welfare as captured by household income
but the magnitude, direction and significance of this relationship has not been revealed. To get this we
turn to the path regression results on table 7. The result from table 7 reveal that cocoa production has a
positive significant effect on household income. The effect of household income on welfare is seen
through its effect on home consumption, child education, complacency and basic needs provision. That is,
household income is capable of taking care of household consumption, child education and providing
basic needs for the family.
Table 7: Path Coefficients (Mean, STDEV, T-Values)
HYPOTHESIZED
LINK
Coefficient Standard
Deviation
(STDEV)
Standard Error
(STERR)
T Statistics
CCP -> HHI 1.045664 0.021392 0.021392 48.749007
LHD -> CCP 0.533677 0.046230 0.046230 11.133152
Source: Researcher Computations, 2018
This result is consistent with appriori expectation. It is also in line the work of Bellemare, et al. (2016)
who found that quinoa production was associated with a faster rate of growth of household welfare and
Lawal et al. (2015) who revealed that increased cocoa production enhanced cocoa farming households’
welfare. However the result is contrary to the study of Quartey, (2012) who attested that the current form
of cocoa production in Ghana reduces economic welfare. The result is in agreement with the “new
household economics (NHE) model” a class of Chayanov farm household model by Becker (1965). This
model assumes that the household acts as a unified unit of production and consumption which aims to
maximise utility (welfare) subject to its production function and total time constraint. According to this
32
theory, increased production will improve income and hence welfare. Again it is in line with The
Expected Utility and Decision Theory which stipulates that individuals are consider to make decisions
consistent with their expected personal objectives so as to maximize their personal ‘welfare’ or
‘happiness’ thus the decision for the production of cocoa is consistent with welfare improvement in the
South West Region of Cameroon.
5. Conclusion and Recommendations
Cocoa production has both direct and indirect effects on welfare. It affects welfare directly through the
nutritive and health benefits cocoa products exhibit, and indirectly through the income that is earned from
its production. However its contribution to the welfare of its producers in the South West Region of
Cameroon remains indirect. This is because about 99% of cocoa producers have never tasted the products
from this precious plant which the discoverer named “food of the gods” nor do most of them even know
the finish products of cocoa. This study has revealed that cocoa production has a positive significant
effect on the welfare of its farmers in the South West Region of Cameroon. From this analysis therefore
we conclude that income from cocoa production is capable of taking the cocoa farmers in the South West
Region out of the poverty situation they find themselves in today because it contributes significantly to
household welfare. However some of the socioeconomic characteristics of the cocoa farmers have
perpetually kept them in poverty; among which are (i) illiteracy rates; This has led to financial
mismanagement amongst the cocoa farmers. Illiteracy has caused some farmers to live with the notion
that any amount of money earned is to be spent. Consequently they hold money only for one reason
(transactionary motive). This illusion has lure them into reckless spending. Hence it is possible for a
cocoa farmer to earn 1.5 million F CFA in October and in January (two months after) he is taking loans
(farm inputs and money) from the license buying agents, a habit which kept many in a vicious cycle of
poverty. (ii) Farm accessibility; in fact 67.1% of the entire cocoa producing areas in the region are
inaccessible thus increasing the famers’ expenditure in transporting their cocoa to the farm gate causing
some to end up with little or nothing at the end of production season. Despite these ills, one thing that
seems glaring is that cocoa production remains one the highest income generating activity among other
agricultural activities as affirmed by the United Nation Conference on Trade and Development UNCTD,
(2004) and can contributes significantly to the growth of other sectors in the South West Region as well
as the growth of the entire nation. Therefore concentration on welfare improvement will bring about the
much needed growth and development faster than concentration on development for welfare
improvement.
However unlike the salaried workers, the cocoa farmer in the South West Region of Cameroon is not
covered by any social security net. For him there is no pension, no housing subsidies, no children’s
education allowance, no paid vacations and hardly any satisfactory healthcare. He enjoys little or no
expressways, no lighted streets, no postal and telecommunication services and the rest of those basic
amenities heavily financed from his labour’s harvest. Not only is the cocoa farmer hardest hit by such
crises but he must continue to produce more to replenish state coffers, keep some of the country’s miss-
managers on the payroll and pay for foreign debts contracted for projects most of which has instead
eluded the cocoa sector rather than build it. In fact, the zeal and spirit of sacrifice of the cocoa farmer to
continue producing despite the challenges he faces in the sector is eminent. This silent drama of the cocoa
farmer in the South West Region and Cameroon in general deserves the timely attention of the
government. If this attention can be turn to the cocoa farmer, in our opinion the cocoa farmer could work
for Cameroon the same development miracles performed by farmers elsewhere in the world.
On the bases of these therefore the study recommends; the formation of micro-financial units
otherwise known as village banks that will make loans available to farmers in form of inputs, as their
cocoa farms can serve as collateral security and they can better monitor the borrower to see that the loan
is used for the purpose for which it was contracted. The government, should embark on research so as to
introduce improve cocoa species which can adapt to the caprices of climate and still maintain high yields.
33
The provision of basic infrastructure especially roads in the rural areas in particular is a necessary pre-
condition for rural poverty alleviation. The government should also create farm to market roads to reduce
the cost of transportation and decrease current production losses to match the increase in farm input
prices. Community participation on road maintenance is recommended. There is need for the construction
of local storage fascilities by the farmers. This will enable them store their produce during the rainy
season (production season) when the roads are very bad or completely impassable and the cost of
transportation too high. The stored cocoa could be released during the dry season when the conditions of
the roads are better. Again cocoa is usually limited in supply during this period; as such they could reap
much from the high prices thus making more income and improving their welfare.
Education plays indispensable role in improving the welfare of the cocoa producing households as it
facilitates households’ access to credit and more importantly regulate the spending habit of the farmers
among others. Financial management programs should be introduced to the farmers. This will assist the
farmer to know how to better manage their finances. It has be uncovered in this study that the major
predicament of these farmers is financial mismanagement. Policy makers should give priority to
programmes that will encourage poor households to be educated through mass literacy programmes, free
adult education among others. Farmers should equally be encouraged to go for training in Farmer Field
School (FFS) and Farmer Business School (FBS). So that they can be equip with better techniques of
production and should do cocoa farming as a business.
It is recommended that agro-industrialization and the provision of social amenities be instituted in the
cocoa growing communities. To an extent it will reverse the current pattern of village-urban migration of
the youths in search for employment and city attractions. This will improved quality of city life as it will
relieve it of stressful demographic pressures and crime waves, thereby demonstrating the validity of the
thesis that a “village-first” development strategy benefits urban centres as well, in contrast to the “city-
first” strategy practiced in Cameroon.
6. Acknowledgments
Special credit and gratitude goes to, Prof. Njimanted Godfrey, Prof. Akume Daniel Akume and Prof.
Vukenkeng Andrew Wujung with whom we worked as a team for the realization of this paper. Their
advice, constructive criticisms, suggestions and the material added from the conception to the completion
of this work remains invaluable.
Much appreciation goes to my wonderful and lovely brother, Prof. Jude Ndzifon Kimengsi for his
constant support all through this period. I wish to salute the hospitality of the authorities of the Ministry
of Agriculture and Rural Development (MINADER) both at the divisional and regional levels, National
Institute of Statistics (NIS) for granting me access to relevant data in this work. Special thanks also go to
my research assistants, Eyoh Anjueh, Kuma Titus, Suh Jerome, Mokula Emmanuel, Gama Lambert, Loh
Hubert, Itoe Michael, Itoe prosper, Bau Charles, Nebongo Albert, Nanje Oliver, Itoe Manfred, and
Akama Lucas through whom I could easily get data in the field. All other works that have been used as
building blocks for this study have duly been acknowledge through citations.
References
Abimbola O. and Oluwakemi A., (2013) Livelihood Diversification and Welfare of Rural Households in Ondo State,
Nigeria. Journal of Development and Agricultural Economics Vol. 5(12), pp. 482-489,
Achu C. C., (2009): Sustainable Cocoa Production In Southern Cameroon: Potential and Constraints of Integrated
Pest Management (IPM). Conference on International Research on Food Security, Natural Resource
Management and Rural Development.ed. Tropentag 2009 University of Hamburg.
Amin A., (2001). Rural Poverty and Agricultural Development in Cameroon. College par la Cahine UNESCO
(Université Montesquieu-Bordeau Paris).
Aneani, F., Anchirinah, V. M., Owusu-Ansah, F. and Asamoah, M., (2011) An Analysis of the Extent and
Determinants of Crop Diversification by Cocoa (Theobroma cacao) Farmers in Ghana, African Journal of
Agricultural Research Vol. 6(18), pp. 4277-4287, ISSN 1991-637X.
34
Armathé, A. J., Mesmin, T., Unusa, H., and Soleil, B. R. A., (2013). A comparative study of the influence of
climatic elements on cocoa production in two agro-systems of bimodal rainfall: Case of Ngomedzap forest
zone and the contact area of forest-savanna of Bokito. Journal of the Cameroon Academy of Sciences,
11(1).
Asare, R., and David, S., (2011). Good agricultural practices for sustainable cocoa production: a guide for farmer
train- ing. Manual no. 3: Conservation and biodiversity in and around cocoa farms. Development and
Environment Series 12- Revised 2011. Forest & Landscape Denmark.
Baye, M. R., (1998). “Determinants of demand for Cameroon cocoa export”. Journal of Rural Economics and
development, Dept. of Agric. Economics, University of Ibadan, Ibadan- Nigeria, vol. 13, No. 1. pp. 67– 78.
Belen M. R., (2013) From Producers to Export Markets: The Case of the Cocoa Value Chain in Ghana. Journal of
African Development. Volume 15 #2
Bellemare M. F., Fajardo-Gonzalez J. and Gitter S.R., (2016) Foods and Fads: The Welfare Impacts of Rising
Quinoa Prices in Peru Working Paper No. 2016-06
Bemieh C. F., (2013). Small-scale versus large-scale cocoa farming in Cameroon: which farm type is more ready
for the future? Advanced level European Erasmus Mundus Master Program: Agricultural Food and
Environmental Policy Analysis (AFEPA) Degree thesis No 829, ISSN 1401-4084 Uppsala 2013.
Biyase M. and Zwane T., (2017) An Empirical Analysis of the Determinants of poverty and household welfare in
South Africa, MPRA Paper No. 77085, posted 27 February 2017 09:35 UTC, Online at https://mpra.ub.uni-
muenchen.de/77085/
Biyase, M., Zwane T., (2018) An Empirical Analysis of the Determinants of Poverty and Household Welfare in
South Africa; The Journal of Developing Areas Volume 52, Number 1, pp. 115-130.
Chambon, B. and Mokoko, G. S., (2013) Les déterminants du choix des cultures pérennes dans les systèmes de
production diversifiés des hévéaculteurs au sud-ouest Cameroun. In Cultures pérennes tropicales: enjeux
économiques et écologiques de la diversification. (pp.185-196). Versailles Cedex, France: Éditions Quae.
Chayanov, A.V., (1920), ‘Peasant farm organisation’, translated in A.V. Chayanov: The Theory of Peasant
Economy, eds D. Thorner, B. Kerblay and R.E.F. Smith (1966), Irwin, Homewood, Illinois.
Cocoa Barometer, (2014).Pdf www.cocoabarometer.orgAntonie FountainCoordinator VOICE
Cocoa Barometer, (2015) USA.pdf www.cocoabarometer.org
Cronbach, L., (1951). Coefficient alpha and the internal structure of tests. Psychometrika, 16 (3), 297 - 334.
Daud, A., Amoke B., Omotayo, A., Omotosho, A., Adeniyi, A., (2018). Effect of Income Diversification on
Household’s Income in Rural Oyo State, Nigeria.Acta Universitatis Danubius. Oeconomica. 14. 155-167.
Dethier, J.J., Effenberger, A., (2012), Agriculture and development: A brief review of the literature. Econ.
Syst.doi:10.1016/j.ecosys.2011.09.003
Effah E. S, Yusif H. M. and Kwasi W. B., (2017) Determinants of cocoa production in the Ashanti region
International Standard Journal Number (ISJN) e-ISJN: A4372 – 2604 ISSN 2354 – 4147 VOL. 5 (1), PP.
21-25,
Ekow E. A., (2011) Rural Livelihood Diversification and Agricultural Household Welfare in Ghana, Journal of
Development and Agricultural Economics Vol. 3(7), pp. 325-334, ISSN 2006- 9774
Fadipe A. E., Adenuga A. H. and Ilori, T. E., (2012) Economic Analysis of Cocoa Production in Oyo State, Nigeria.
Nigerian Journal of Agriculture, Food and Environment; NJAFE VOL. 8 No. 4, 2012 588(4):58-63.
FAO, (2005) The state of agricultural commodity markets, FAO, Commodities and Trade Division, Rome.
FAO, (2014) The state of agricultural commodity markets, FAO, Commodities and Trade Division, Rome.
Forgha N. G. and Tosam J. N., (2013) An Analysis of the Socio-Economic Determinants of Cocoa Production in
Meme Division, Cameroon. Greener Journal of Business and Management Studies ISSN: 2276-7827 Vol.
3 (6), pp. 298-308.
Fule, B., (2013). Small-scale versus large-scale cocoa farming in Cameroon. Which farm type is more ready for the
future? Master of Science Thesis in Agricultural Food and Environmental Policy Analysis
(AFEPA).Swedish University of Agricultural Sciences, Uppsala. Accessed 20th May, 2016. Available at
http://stud.epsilon.slu.se/6438/1/Fule_CB_140218.pdf.
Hasnah, F. E., Villano R. A. and Patrick I., (2011) The Potential of Cocoa gribusiness for Poverty Alleviation in
West Sumatra. 55th
National Conference of the Australian Agricultural and Resource Economics Society
Melbourne, Australia 8-11 February 2011
Iyabano, A. H., (2012). Analyse du fonctionnement de la filière cacao (Theobroma cacao L.): Une estimation des
coûts et marges des acteurs (cas des regions du sud et sud ouest, Cameroun). Mémoire de fin d’études
présenté en vue de l’obtention du Diplôme d’Ingénieur Agronome.The University of Dschang.
35
Kamdem C. B., Galtier F., Gockowski H. D.B., Egg J and Dia B. K., (2010)What determines the price receive by
cocoa farmers in Cameroon? An empirical analysis based on bargaining theory. African Journal of
Agricultural and Resource Economics 5(2) 318 – 339
Kazianga, H. and Sanders, J. H., 2002. “Cocoa Production in Cameroon: Technology, Profitability and the
Environment.” A synthesis of the thesis of Harounan Kazianga, Adoption of Improved Cocoa Technologies
in Cameroon, Purdue University, Department of Agricultural Economics, West Lafayette, IN; for USAID
Kimengsi J. N. and Tosam J. N., (2013) Climate Variability and Cocoa Production in Meme Division of Cameroon:
Agricultural Development Policy options. Greener Journal of Agricultural Sciences ISSN: 2276-7770 Vol.
3 (8), pp. 606-617.
Kimengsi J. N. Balgah R. A. and Tosam J. N., (2016) Improving Cocoa Processing and Marketing for
Conservation in the Mount Cameroon National Park Communities: Challenges and Way Forward: Greener
Journal of Social Sciences, ISSN: 2276-7800 ICV: 5.99 Vol. 6 (1), pp. 001-010.
Klarer A. J., (2014) The Evolution and Expansion of Cacao Farming in South West Cameroon and its Effects on
Local Livelihoods; Resources, Agricultural Systems and Development (RESAD) Published Master Thesis,
Copenhagen University, Copenhagen AFS4Food, SupAgro IRC, Montpellier
Ladé A. D., (2007) The African export industry: What happened and how can it be revived? Case study on the
Cameroonian cocoa sector. Food and Agriculture Organization of the United Nations, Rome, 2007,
[online] available from http://www.fao.org/docrep/016/ap304e/ap304e.pdf [09/01/2014]
Lawal, J.O., Omonona, B. T., Oluwatayo, I. B., Oyekale, A. S., and Salman K. K., (2015) Welfare Transitions and
its Correlates among Cocoa Farming Households in Nigeria: An Application of Ordered Probit Approach.
Paper prepared for presentation at the 2015 Agricultural & Applied Economics Association and Western
Agricultural Economics Association Annual Meeting, San Francisco, CA, July 26-28
Lekobane, R. and Seleka, B., (2017). Determinants of Household Welfare and Poverty in Botswana, 2002/2003
and 2009/2010, Journal of Poverty, 21(1), pp. 42-60.
Lovo, S., (2014) Analyzing the welfare-improving potential of land in the former homelands of South Africa.
Agricultural Economics, 45 (6). pp. 679-692. ISSN 0169-5150
MINADER, (2012). Annual Report 2012 for the South West. Ministry of Agriculture and Rural Development for
Cameroon. Report Retrieved from the Regional Delegation.
MINADER, (2013). Annual Report for the Ministry of Agriculture and Rural Development, South West Region,
Meme Divisional Delegate
Mohammed D. Asamoah D. And Asiedu-Appiah F., (2011) Cocoa Value Chain-Implication for the Smallholder
Farmer in Ghana
Molua E. L. and Lambi C. M., (2007) The Economic Impact of Climate Change on Agriculture in Cameroon; World
Bank Development Research Group, Sustainable Rural and Urban Development Team. Policy Research
Working Paper 4364
Mubeteneh C. T., (2015) The Cameroon Cocoa Story; report produced with the assistance of the European Union
within the project “Supply Change – Make Supermarkets fair”, Department of Crop Science, University of
Dschang, Cameroon
Mukete, N., (2016) Analysis of the Technical Efficiency of Smallholder Cocoa Farmers in South West Cameroon.
American Journal of Rural Development. Vol. 4, No. 6, 2016, pp 129-133.
Mukete N., Zhou L., Beckline M., Patricia B., (2018) Cocoa Production in Cameroon: A Socioeconomic and
Technical Efficiency Perspective; International Journal of Agricultural Economics, Vol. 3, No 1, 2018 pp
1-8
Naftali N. K, Kihombo A, and Natalia K., (2014): Contribution of Contract Cocoa Production on Improving
Livelihood of Smallholder Farmers. International Journal of Scientific and Research Publications, Volume
4, Issue 10, ISSN 2250-3153
Njila A., (2012) Farmer’s union and the economic sustainability of cocoa farming in Cameroon; Published
bachelor’s thesis Laurea University of Applied Sciences Otaniemi
Naschold F., (2008) Structural Household Welfare Dynamics; A published Ph.D Dissertation Presented to the
Faculty of the Graduate School of Cornell University; © May 2008.
NIS, (2016). National Institute of Statistics; Annual Report 2015 for the South West. Ministry of Agriculture and
Rural Development for Cameroon. Report Retrieved from the Regional Delegation.
NIS, (2018). National Institute of Statistics; Annual Report 2018 for the South West; Report Retrieved from the
Divisional Delegation
NCCB, (National Cocoa and Coffee Board) (2014).Cocoa Statistics.NCCB; Retrieved from www. oncc.com
NCCB, (National Cocoa and Coffee Board). (2013), Cocoa Statistics. NCCB.
36
NCCB, (2015) National Cocoa and Coffee Board) Cocoa Statistics; Retrieved from www. oncc.com
Nelson R. and Winter S., (1974) “Neoclassical versus evolutionary theories of economic growth: Critique and
perspective,” Econ. J, pp. 886-905, 1974.
Ndoping M., (2011). Cocoa and Coffee Risk Management in Cameroon: Point of view of NCCB Cameroon in
developing su-regional commodities exchanges. Global commodities forum
Njume-Ebong M., (2004 ) Agricultural Expansion for Poverty Eradication in Africa, Rethinking Strategy from a
Village Perspective; Case Study of Cameroon. Development Studies Programme www.chede.org CHEDE
LTD.
Oyekale A. S. and Oladele O. I., (2012) Determinants of Climate Change Adaptation Among Cocoa Farmers in
Southwest Nigeria, Journal of Science and Technology, VOL. 2, Special Issue, ICESR 2012 ISSN 2225-
7217
Oyinbo O. and Olaleye K. T (2016) Farm Households Livelihood Diversification and Poverty Alleviation in Giwa
Local Government Area of Kaduna State, Nigeria. The Journal of Sustainable Development Vol. 15, Iss. 1,
Pp. 219-232
Pigou, A C., (1932), The Economics of Welfare, Library of Economics and Liberty,
http://www.econlib.org/library/NPDBooks/Pigou/pgEW.html
Quartey J. D., (2012) Economic Welfare Implication of Ghana’s Cocoa Production in a Changing Global Climate;
Journal of Economics and Sustainable Development, (Paper) ISSN 2222-2855(Online)Vol.7, No.14, 2016
142
Ravallion M, (2001): Measuring Aggregate Welfare in Development Countries. How well do National Accounts and
Surveys Agree? World Bank Working, Washington D.C, Pp 2665
Richman D. (2010). What Drives Efficiency on the Ghanaian Cocoa Farm? Ghana Institute of Management and
Public Administration. www.csae.ox.ac.uk/conferences /2010-EDiA/papers/498-Dzene.pdf
Singh, I., Squire, L. and Strauss, J. (1986) Agricultural Households Models: Extensions, Applications, and Policy,
Johns Hopkins University Press, Baltimore and London.
Sullivan, J. L., & Niemi, R. H. (1979). Reliability and Validity Assessment. California: Sage Publication.
Tambo J. A and Wünscher T. (2014) More than adopters: the welfare impacts of farmer innovation in rural Ghana
Selected Paper prepared for presentation at the Agricultural & Applied Economics Association’s 2014
AAEA Annual Meeting, Minneapolis, MN, July 27-29, 2014.
Taubert, D., Roesen, R., Schömig, E. (2007). "Effect of cocoa and tea intake on blood pressure: a meta-analysis".
Arch. Intern. Med. 167 (7): 626–34. doi:10.1001/archinte.167.7.626 Wikipedia, 2011.
Tchokote J., Onyebuchi K. O., Paul M., Nguezet P. M. D., (2015): An Economic Appraisal of Cocoa Production in
Cameroon: The Case Study of Lekie Division. Journal of Economics and Sustainable Development ISSN
2222-1700 (Paper) ISSN 2222-2855 Vol.6, No.9,
Thalut, N. (2017). Integration of fiancial exclusion into sustainable rice production for poverty reduction in Ndop.
Bambili: University of Bamenda library.
Tosam J. N., Akume D. A., Njimanted G. F., and Vukenkeng A. W., (2019) An Empirical Investigation of the
Determinants of Cocoa Production in the South West Region of Cameroon; International Journal of
Economics, Commerce and Management; United Kingdom Vol. VII, Issue 5 ISSN 2348 0386
Traoré D., (2009) Cocoa and Coffee Value Chains in West and Central Africa: Constraints and Options for
Revenue-Raising Diversification. AAACP Paper Series – No. 3.All ACP Agricultural Commodities
Programme
Uba, A. A., (1998). Processing cocoa for export: A business times Lagos Publication.
Ukoha, O. O., Mejeha, R. O and Nte, I. N., (2007 ): Determinants of Farmers Welfare in Ebonyi State, Nigeria.
Pakistan Journal of Social Science 4 (3):351-354.
UNCTAD, (2004) United Nations Conference on Trade and Development, 2004. Handbook of International Trade
and Development Statistics. Geneva Switzerland.
Vigneri M., (2007) Drivers of cocoa production growth in Ghana; ODI Project Briefing No 4. December 2007
WDR, (2008) World Development Report: Agriculture for development.
Wokia-azi N., Kumase, Hernes B. and Stephen K., (2008). A Gendered Analysis of Cocoa Production in Southern
Cameroon.A Final Draft in Opportunities and Constraints.
World Bank, (1999) World Development Report 1998/99, World Bank/Oxford University Press
37
Available online at www.asric.org
ASRIC Journal on Social Sciences & Humanities 1 (2020) 37-49
a The Institute for Development Studies (IDS), University of Cape Coast, Ghana
b Department of Sociology and Social Work, Kwame Nkrumah University of Science and Technology, Ghana
c Pan African University Institute of Life and Earth Science Including Health and Agriculture
University of Ibadan, Nigeria
Received 19 December 2019; revised 30 January 2020; accepted 30 January 2020
Abstract
Indigenous African societies have had their own in-built structures and mechanisms for managing and resolving
misunderstandings related to land and other natural resources. These in-built structures were based on cooperation
among people and an outcome was expected to be mutually beneficial to all parties involved. The indigenous justice
system particularly the chief’s courts are time tested and has been prevalent in many African countries, yet the utility
of these social control mechanisms remain challenge in contemporary African society. This study examined the
indigenous justice system in land conflict resolution at the paramount chief’s court in the Oguaa Traditional area
laying emphasis on their efficacy in contemporary land dispute resolution. Data were collected through in-depth
interviews of traditional authorities, land experts and litigants at both the chief’s court and state court. Through
attendance and direct observation of conflict resolution sessions at chief’s court, in-depth interviews facilitated the
collection of non-participant observatory data. The sampling procedure was generally purposive for all respondents
informed by a single case study design. Through thematic analysis, the emerged themes were analysed. It was found
that, the chief’s court presents an indigenous well-structured leadership hierarchy appropriate for dealing with land
conflicts within its jurisdiction. Land conflicts resolution procedures at the chief’s court continue to be largely
informal, flexible and voluntary participation. An effective collaboration between land sector agencies and
traditional authorities should not only be seen as a desire but a necessity. A more entrenching approach will be for
the chief’s court to be mandated and empowered with legal backing to enforce their decisions in land conflicts
resolution through.
Keywords: Land conflict, Indigenous Justice system, Chief’s court, Ogua, Ghana
1. Introduction
Conflict is a natural phenomenon and an inevitable part of human existence. The concept of conflict
defies a single definition. According to Wallensteen (2002), a conflict has generally been defined as a
1 Corresponding author. Email addresses: [email protected] (M. Obeng)
38
situation in which two or more parties strive to acquire the same scarce resources at the same time. As
noted by Midodzi and Imoro (2011), Africa has gained the reputation of being the world’s leading
platform of conflict, war and instability. Most of these conflicts are a product of competition for political
power, social recognition and more particularly natural resources such as land. Ghana, a country accorded
the image of relative peace and stability within this troubled region has been witnessing a series of long
standing tribal and communal conflicts of which many are land related (Akudugu and Kendie, 2010).
Land conflicts are particularly sensitive, and seem very volatile. For this reason, the management and
resolution of land conflicts is therefore critical to the development of every society. Indigenous African
societies had their own in-built structures and mechanisms for managing and resolving misunderstandings
related to natural resources (Kendie and Akudugu, 2010). The indigenous justice system is one of the
crucial systems for addressing conflict issues in most African traditional communities. The indigenous
justice system predates colonial rule. The participatory nature of the customary conflict resolution
processes ensure consensus building where discussions are open and shared with the community
(Wehremann, 2008).
The indigenous justice system is time tested and has been prevalent on the African continent even in
countries with no formal state recognition. The chief’s court or the customary courts are usually the
setting for such conflict resolution processes. Unlike non-indigenous ones, indigenous mechanisms are
often more accessible to disadvantaged people, speedy, less complex, inexpensive and thrives in
maintaining harmony and integration in the community (Boege, 2006; Owusu- Yeboah, 2005).
According to Wojkowska (2006), in Malawi, between 80% and 90% of all conflicts are resolved through
customary courts. Moreover, approximately 85% of the population uses chiefs’ courts for resolution of
conflicts in Sierra Leone. In addition, 80% of Burundians take their cases to the chiefs’ courts as a first
choice.
Ghana is currently challenged with a high incidence of tenure insecurity and has a long way to go in
terms of conflict resolution of land conflicts (Agbosu, 2000). For some time now, conflict resolution in
Ghana has gained prominence with efforts directed towards developing alternative and acceptable
mechanisms for dealing with the country’s numerous conflicts. The works of Crook (2004) and Arko-
Adjei (2006) have shown that land issues before formal law courts are not resolved in time resulting in
many land cases piled up in law courts. In Ghana, there have been several attempts to address land
conflicts and reduce the backlog of land cases in law courts by encouraging out-of-court settlement
(Water Aid, 2009).
Kariuki (2015) have explored the utility of employing the Social Capital Theory to explain the
restorative nature of dispute resolution by traditional leaders in African Societies. In this theory, the social
networks, bonds, reciprocal duties and trust, bind people together and enable them to coexist (Putnam,
2000). In a social capital framework, agreed behaviours, strong social networks and bonds exist within
communities to prevent and manage conflict effectively.
Theoretically, the Problem Assurance theory has been applied broadly to understand how land related
conflicts are resolved and managed by traditional institutions. According to Runge (1986), the theory is
based on the fact that rural communities had effective mechanisms and institutions for the management of
their natural resources base and their related conflicts. It asserts that local communities and traditional
institutions have been able to establish and maintain organisational structures and enforce mutually
agreed rules on the use of natural resources such as land. Non indigenous rules established by government
to manage and resolve land related conflict have most often been in conflict with the needed right of
indigenes thereby making dispute resolution difficult (North, 1990; Marsh, 2001).
Several studies on the use of traditional institutions in land conflict resolution exist and have presented
a strong case for the recognition of customary courts with particular reference to studies from Uganda,
Burundi, Ethiopia and Ghana (Baribeau, 2012; Edossa et al, 2005; Crook, 2008; Thorson, 2009). In
Ghana, traditional courts which are popularly known as chiefs’ courts exist. Despite the fact that critics
(see for example, Owusu-Yeboah, 2005; Boege, 2006; Odametey, 2007) see them as conservative and
unable to deliver justice in this contemporary Ghana, the chiefs’ courts have played a crucial role in the
39
dispensing justice in the indigenous communities. In Cape Coast, the Oguaa Traditional Council plays a
mediator role in the resolution of several land conflicts within the area.
Not much is known about the current nature of indigenous justice system in land conflict resolution
and their contemporary utility. The results of such a study within the local setting can be useful to policy
makers and other stakeholders. This paper examines the indigenous justice system in land conflict
resolution at the paramount chief’s court in the Oguaa Traditional area.
2. Method
Study setting and population
The study was carried out at the Oguaa Traditional found in the Cape Coast Metropolis of Ghana. The
Oguaa Traditional Area is the only traditional area which constitutes the entire political metropolis of
Cape Coast. The Oguaa Traditional Area is bounded to the south by the Gulf of Guinea, west by the
Edina Traditional area, and to the East by the Asebu Traditional area.
Traditional administration of the area dates back to the 1660s, and is composed of the Omanhene
(Paramount Chief), ahenfo or mpakamufo (chiefs of various grades or subordinate chiefs), tufuhene
(master of arms), apanfo or omanfo (counselors), asafo-mpanyinfo (heads of the various companies) and
akyeame (spokesmen). The Omanhene is assisted by a council. The council’s membership comprises
certain hereditary chiefs, supported by persons elected on merit. The total population of Oguaa
Traditional area which constitutes the entire Cape Coast metropolis as at 2010 census is 169,894 out of
which 82,810 representing 48.7% are males and 87,084 representing 51.3% are females. Farming and
fishing are predominantly the occupation in the area. Farming is done in the northern parts of the
traditional area whilst fishing is the main occupation along the southern coastal parts.
The study focuses on the Oguaa Paramount chief’s court popularly known as the Emintsimadze court.
The choice of the study setting was informed by the consistent and effective roles traditional authorities in
the area played in indigenously resolving land conflict within its jurisdiction.
Study design
The study employed a descriptive case study design using qualitative research approach underpinned
by a desire to observe, describe and document aspects of a situation as it naturally takes place
(Sarantakos, 2005). Consistent with Sarantakos (1993), qualitative research helps achieve a deeper
understanding of the respondents’ world and present a more realistic view of the world of the respondent
giving the opportunity for participants to respond more elaborately.
Sampling
Purposive sampling and snowball non-probability sampling techniques were employed to select study
participants. The sampling strategy was adopted The researchers deemed it fit to adopt these sampling
methods, considering the nature of the research target group to enable the researcher arrive at a reasonable
and sound data collection from the formal and chiefs’ court users and traditional authorities in order to
ease the data gathering process. Purposive sampling was chosen because the problem being investigated
required the gathering of information from people who are relevant to the subject matter. Members in the
study area deemed to have sufficient information were enrolled.
The inclusion criteria was land disputants who had had encounter with the justice systems. Participant
referral through the snowballing was adopted until saturation was reached such that there was no emerged
information. In total, 42 respondents were selected through the purposive sampling technique. A total of
15 participants were enrolled using the snowballing approach. In all, 57 participants were enrolled for the
study. The choice of traditional authorities and litigants to interview was informed by the absence of
accurate data on people using either the formal courts or the chiefs’ courts. A total of 35 out of the study
participants were actual litigants who were using the the formal courts and the chiefs’ courts at the time of
the study. There were 17 in-depth interviews conducted with traditional authorities. The remaining 5
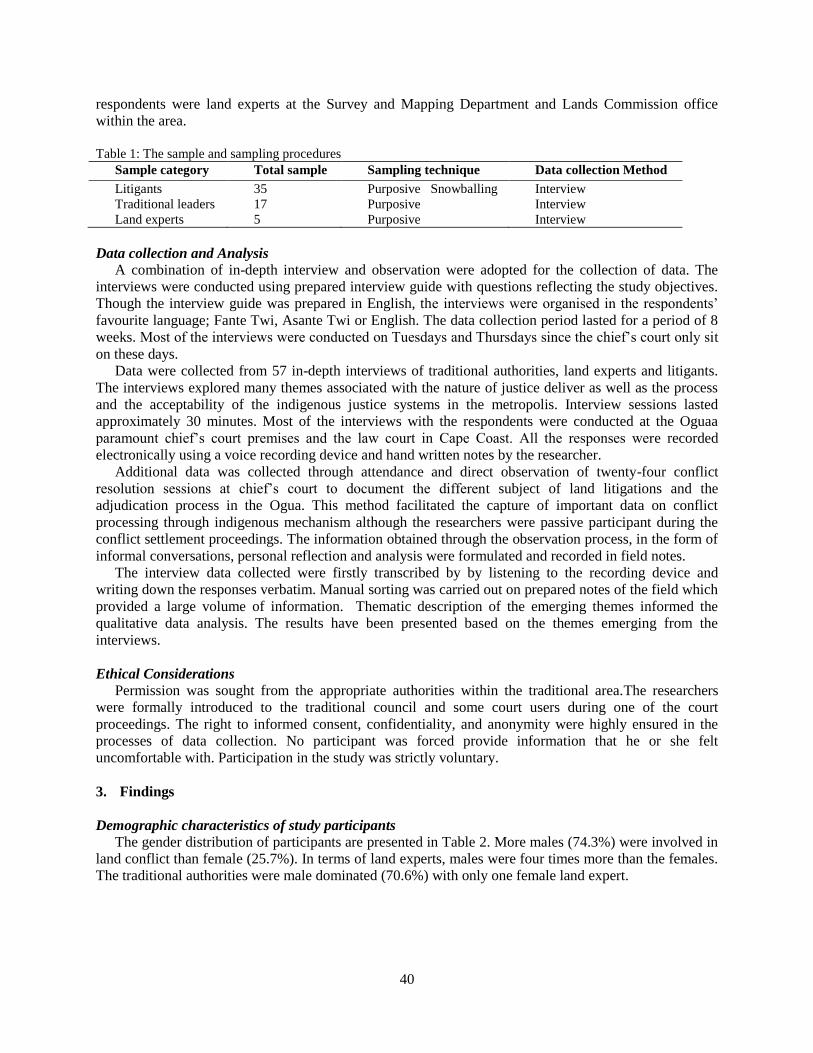
40
respondents were land experts at the Survey and Mapping Department and Lands Commission office
within the area.
Table 1: The sample and sampling procedures
Sample category Total sample Sampling technique Data collection Method
Litigants 35 Purposive Snowballing Interview
Traditional leaders 17 Purposive Interview
Land experts 5 Purposive Interview
Data collection and Analysis
A combination of in-depth interview and observation were adopted for the collection of data. The
interviews were conducted using prepared interview guide with questions reflecting the study objectives.
Though the interview guide was prepared in English, the interviews were organised in the respondents’
favourite language; Fante Twi, Asante Twi or English. The data collection period lasted for a period of 8
weeks. Most of the interviews were conducted on Tuesdays and Thursdays since the chief’s court only sit
on these days.
Data were collected from 57 in-depth interviews of traditional authorities, land experts and litigants.
The interviews explored many themes associated with the nature of justice deliver as well as the process
and the acceptability of the indigenous justice systems in the metropolis. Interview sessions lasted
approximately 30 minutes. Most of the interviews with the respondents were conducted at the Oguaa
paramount chief’s court premises and the law court in Cape Coast. All the responses were recorded
electronically using a voice recording device and hand written notes by the researcher.
Additional data was collected through attendance and direct observation of twenty-four conflict
resolution sessions at chief’s court to document the different subject of land litigations and the
adjudication process in the Ogua. This method facilitated the capture of important data on conflict
processing through indigenous mechanism although the researchers were passive participant during the
conflict settlement proceedings. The information obtained through the observation process, in the form of
informal conversations, personal reflection and analysis were formulated and recorded in field notes.
The interview data collected were firstly transcribed by by listening to the recording device and
writing down the responses verbatim. Manual sorting was carried out on prepared notes of the field which
provided a large volume of information. Thematic description of the emerging themes informed the
qualitative data analysis. The results have been presented based on the themes emerging from the
interviews.
Ethical Considerations
Permission was sought from the appropriate authorities within the traditional area.The researchers
were formally introduced to the traditional council and some court users during one of the court
proceedings. The right to informed consent, confidentiality, and anonymity were highly ensured in the
processes of data collection. No participant was forced provide information that he or she felt
uncomfortable with. Participation in the study was strictly voluntary.
3. Findings
Demographic characteristics of study participants
The gender distribution of participants are presented in Table 2. More males (74.3%) were involved in
land conflict than female (25.7%). In terms of land experts, males were four times more than the females.
The traditional authorities were male dominated (70.6%) with only one female land expert.
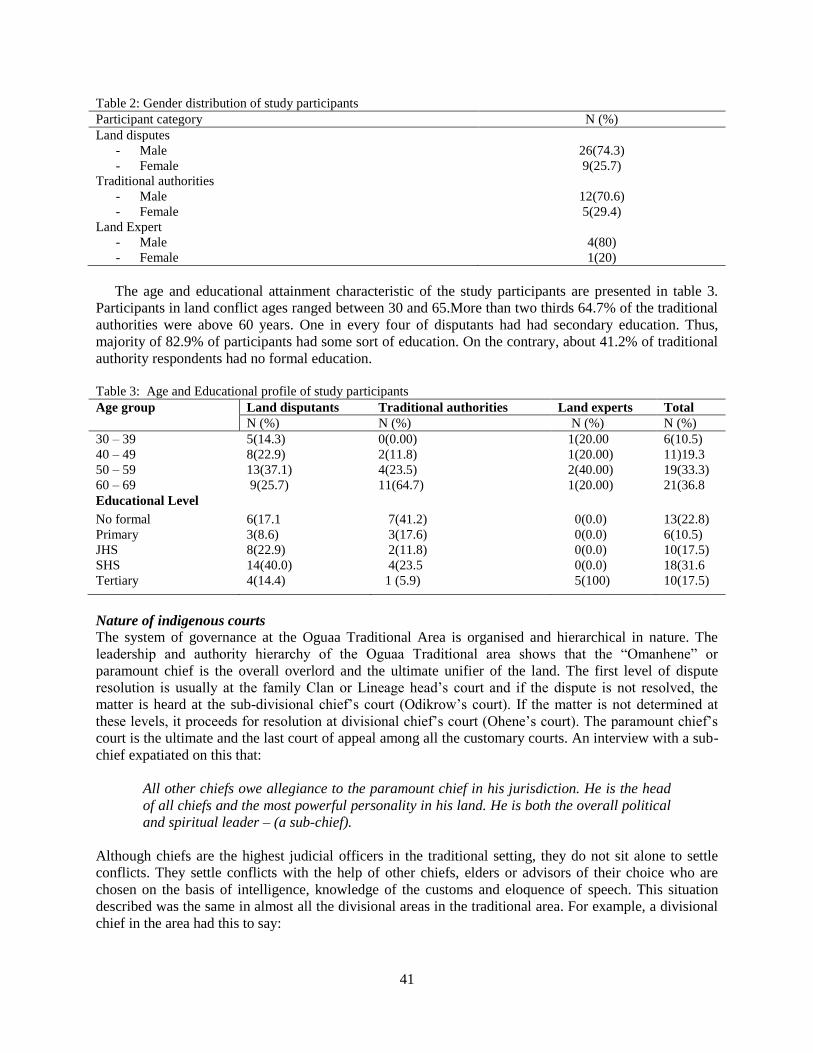
41
Table 2: Gender distribution of study participants
Participant category N (%)
Land disputes
- Male 26(74.3)
- Female 9(25.7)
Traditional authorities
- Male 12(70.6)
- Female 5(29.4)
Land Expert
- Male 4(80)
- Female 1(20)
The age and educational attainment characteristic of the study participants are presented in table 3.
Participants in land conflict ages ranged between 30 and 65.More than two thirds 64.7% of the traditional
authorities were above 60 years. One in every four of disputants had had secondary education. Thus,
majority of 82.9% of participants had some sort of education. On the contrary, about 41.2% of traditional
authority respondents had no formal education.
Table 3: Age and Educational profile of study participants
Age group Land disputants Traditional authorities Land experts Total
N (%) N (%) N (%) N (%)
30 – 39 5(14.3) 0(0.00) 1(20.00 6(10.5)
40 – 49 8(22.9) 2(11.8) 1(20.00) 11)19.3
50 – 59 13(37.1) 4(23.5) 2(40.00) 19(33.3)
60 – 69 9(25.7) 11(64.7) 1(20.00) 21(36.8
Educational Level
No formal 6(17.1 7(41.2) 0(0.0) 13(22.8)
Primary 3(8.6) 3(17.6) 0(0.0) 6(10.5)
JHS 8(22.9) 2(11.8) 0(0.0) 10(17.5)
SHS 14(40.0) 4(23.5 0(0.0) 18(31.6
Tertiary 4(14.4) 1 (5.9) 5(100) 10(17.5)
Nature of indigenous courts
The system of governance at the Oguaa Traditional Area is organised and hierarchical in nature. The
leadership and authority hierarchy of the Oguaa Traditional area shows that the “Omanhene” or
paramount chief is the overall overlord and the ultimate unifier of the land. The first level of dispute
resolution is usually at the family Clan or Lineage head’s court and if the dispute is not resolved, the
matter is heard at the sub-divisional chief’s court (Odikrow’s court). If the matter is not determined at
these levels, it proceeds for resolution at divisional chief’s court (Ohene’s court). The paramount chief’s
court is the ultimate and the last court of appeal among all the customary courts. An interview with a sub-
chief expatiated on this that:
All other chiefs owe allegiance to the paramount chief in his jurisdiction. He is the head
of all chiefs and the most powerful personality in his land. He is both the overall political
and spiritual leader – (a sub-chief).
Although chiefs are the highest judicial officers in the traditional setting, they do not sit alone to settle
conflicts. They settle conflicts with the help of other chiefs, elders or advisors of their choice who are
chosen on the basis of intelligence, knowledge of the customs and eloquence of speech. This situation
described was the same in almost all the divisional areas in the traditional area. For example, a divisional
chief in the area had this to say:

42
As a divisional chief, I have my court and when I sit as a court I do invite some other
elders. These elders who form part of my panel have advanced in years and have
adequate knowledge of our tradition and customs. They offer good advice to a presiding
chief especially in judgement of conflicts – (a divisional chief).
A similar response was given by another divisional chief at the palace:
I always invite prominent members of society who command respect, and have high
moral standards and good judgment to sit on my panel. I sit with my linguist and not less
than four other people. My panel must always be an odd number – (a chief).
During the researcher’s direct observation of court proceedings, it was observed that female traditional
authorities rarely form part of the panel. In response to a question on whether female traditional leaders
were allowed to settle cases, a female traditional leader said:
If only a woman had gone through the entire necessary requirements and has been
accepted as a chief by the Omanhene then she is obliged to hear conflicts. Also, the queen
mother and other female traditional leaders decide cases mainly involving divorce and
gender related cases – (an interview with an Obaapanyin at palace).
One significant issue that came to light during the fieldwork was the rule that a chief should not hear a
matter in which he has a personal interest. This was to ensure the impartiality of the chief. In every
session of hearing a matter at the court, it was observed that any member on the panel who was directly
related to the case was not allowed to hear the matter before the panel.
Characterising land conflicts in Chiefs’ court
The in-depth interviews of traditional authorities provided that the largest single category of land cases
received by the chiefs’ court involved family conflicts of some kind, mainly inheritance conflicts between
different sides of a family, amongst children of the deceased or between the widow and the children,
conflicts over unauthorised disposition of family land by an individual family member, and property
conflicts between divorcees. One chief made the following submissions:
Many land cases are brought before the chiefs. We deal with cases like land inheritance
conflicts and wrongful disposition of land by a family member. We also settle land cases
among children who are bereaved. – (a 56 year old chief).
When the researcher asked why most land cases received at the chiefs’ court are related to family
members, another chief at the Omanhen’s palace explained:
Many people will prefer to settle their family land issue with the chief since they think we
the chiefs have proper knowledge of their land as compared to the state judge and do not
want their family to be destroyed after the state court resolves their conflict. - (a 59 year
old chief).
In the observations at the paramount chief’s court sitting coupled with the responses from the in-depth
interviews with some traditional authorities, land conflict cases came before chiefs in two ways. Firstly,
most land conflict cases come before the chiefs in the form of direct petition from community members
and secondly, they come by referrals from the state court in the metropolis.
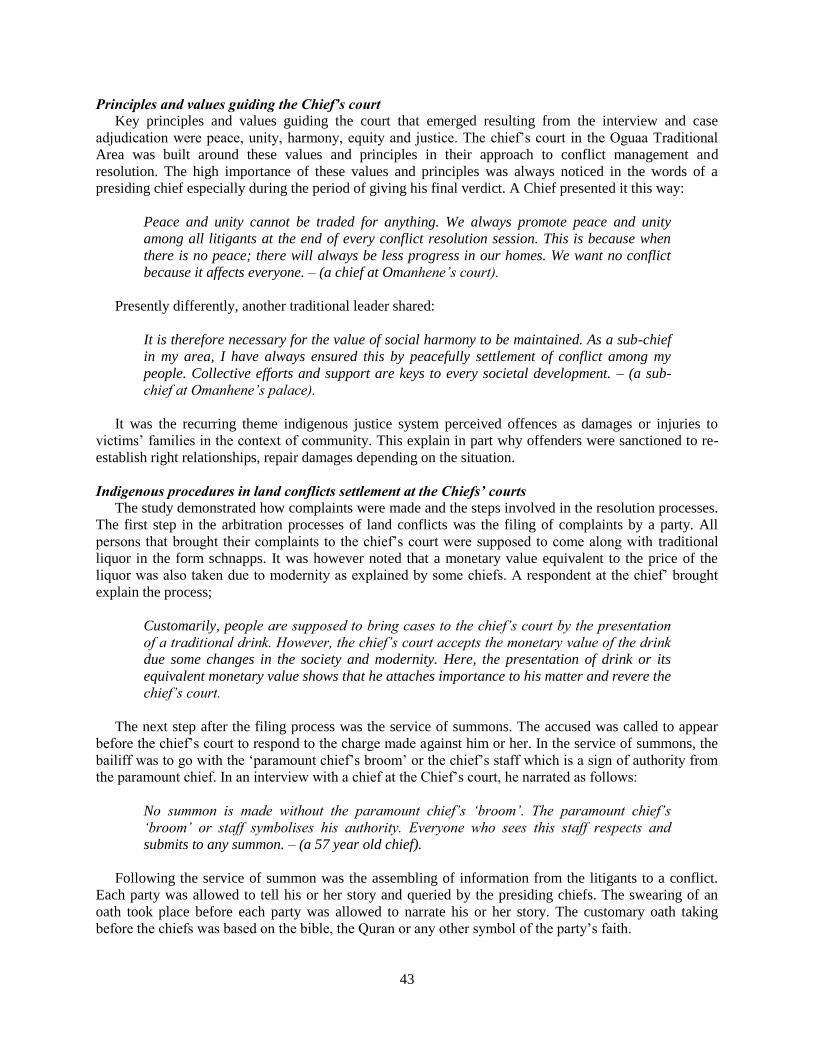
43
Principles and values guiding the Chief’s court
Key principles and values guiding the court that emerged resulting from the interview and case
adjudication were peace, unity, harmony, equity and justice. The chief’s court in the Oguaa Traditional
Area was built around these values and principles in their approach to conflict management and
resolution. The high importance of these values and principles was always noticed in the words of a
presiding chief especially during the period of giving his final verdict. A Chief presented it this way:
Peace and unity cannot be traded for anything. We always promote peace and unity
among all litigants at the end of every conflict resolution session. This is because when
there is no peace; there will always be less progress in our homes. We want no conflict
because it affects everyone. – (a chief at Omanhene’s court).
Presently differently, another traditional leader shared:
It is therefore necessary for the value of social harmony to be maintained. As a sub-chief
in my area, I have always ensured this by peacefully settlement of conflict among my
people. Collective efforts and support are keys to every societal development. – (a sub-
chief at Omanhene’s palace).
It was the recurring theme indigenous justice system perceived offences as damages or injuries to
victims’ families in the context of community. This explain in part why offenders were sanctioned to re-
establish right relationships, repair damages depending on the situation.
Indigenous procedures in land conflicts settlement at the Chiefs’ courts
The study demonstrated how complaints were made and the steps involved in the resolution processes.
The first step in the arbitration processes of land conflicts was the filing of complaints by a party. All
persons that brought their complaints to the chief’s court were supposed to come along with traditional
liquor in the form schnapps. It was however noted that a monetary value equivalent to the price of the
liquor was also taken due to modernity as explained by some chiefs. A respondent at the chief’ brought
explain the process;
Customarily, people are supposed to bring cases to the chief’s court by the presentation
of a traditional drink. However, the chief’s court accepts the monetary value of the drink
due some changes in the society and modernity. Here, the presentation of drink or its
equivalent monetary value shows that he attaches importance to his matter and revere the
chief’s court.
The next step after the filing process was the service of summons. The accused was called to appear
before the chief’s court to respond to the charge made against him or her. In the service of summons, the
bailiff was to go with the ‘paramount chief’s broom’ or the chief’s staff which is a sign of authority from
the paramount chief. In an interview with a chief at the Chief’s court, he narrated as follows:
No summon is made without the paramount chief’s ‘broom’. The paramount chief’s
‘broom’ or staff symbolises his authority. Everyone who sees this staff respects and
submits to any summon. – (a 57 year old chief).
Following the service of summon was the assembling of information from the litigants to a conflict.
Each party was allowed to tell his or her story and queried by the presiding chiefs. The swearing of an
oath took place before each party was allowed to narrate his or her story. The customary oath taking
before the chiefs was based on the bible, the Quran or any other symbol of the party’s faith.
44
Although proceedings were opened to the general public in all cases observed, the public was
disallowed to make contributions to proceedings with the exception of witnesses. Both parties were also
given the opportunity to question each other however they did so through the presiding panel. The native
language (Fante Twi) was used throughout all the court proceedings for easy understanding and
submission.
The last step in the resolution processes is the rendering of verdict and the determination of
compensation. The panel of chiefs retired for secret deliberation to consider the case before them after
hearing all parties involved. At the time of rendering verdict, the presiding chief summed up all the
accounts heard and determined whether or not the accused was guilty. Every verdict given by the chiefs
was backed by reasons. The losing party was made to incur all the expenses of the litigation at end of
every case.
In the case of the complainant, he would also be forced to pay penalty fees for inconvenience. In an
interview with a litigant at the chief’s court, he said that, any person who refuses to comply with the
chief’s decision is likely to be rejected by the whole society and can never seek assistance from the chiefs
when in trouble. The aim of traditional dispute resolution by the chiefs in the Oguaa Traditional area was
not to necessarily punish the wrongdoers but to restore social harmony.
Usage and utility of the indigenous court
As far as the usage and utility of the indigenous court was concerned, the respondents were generally
satisfied with the process of resolving conflicts in the chief’s court. Most of their reasons for preferring
the chief’s court to the state courts were very similar and included; the fact that traditional leaders knew
much about the lands within their jurisdiction and can settle the conflicts amicably. Another was that it
saves time and money to resolve conflicts at the chief’s court. More so, it was observed that litigants
prefer traditional courts because they were generally seen as flexible, informal, not intimidating and
accessible.
Most respondents noted the chief’s court promote lasting peace and relations between members of a
family or close friends in the society. These observations are reflected in the narrative below:
The state often brings enmity between parties to a conflict after its verdict. The state
court’s ruling doesn’t necessary consider whether we are brothers or not. The chief’s
court stands for peace and stability in the society and will do everything in their capacity
to ensure a lasting peace since you are all related. – (a 52 year old male litigant at
chief’s court).
Reiterating the above statement with further justification another participant expressed her opinion by
submitting why she preferred the indigenous court:
I always choose the chief’s court to prevent delays, waste of time and money. The state
courts are noted for delay tactics in land cases. – (a 60 year old woman at a chief’s
court).
Some litigants blamed State Attorneys whiles other also blamed the parties to a conflict themselves
and indicated such issues as basis for their preference for the Traditional Courts. One respondent
lamented that he had been arranged before the law court for illegal sale of a neighbour’s land however the
plaintiff had never turned up any time the case was scheduled. Many respondents further revealed that
they prefer chiefs’ courts because they allow them to put forth their cases properly.
I am permitted to express myself very well at the chief’s court because I speak my own
language. The chiefs give you time to exhaust all your argument unlike the law court. – (a
29 year old litigant at the law court).
45
While some respondents preferred to settle their conflicts only in indigenous court, some wanted them
resolved in state court. Generally, litigants preferred to go the state court for protection and ensure that the
other party receives adequate punishment when conflicts are very threatening to their lives. Some
respondents opted for the state court over the chief’s court because of the difficulty in enforcing
judgement at the chief’s court.
My friend who is also my neighbour owes me some money for the lease of my land to him.
He refused to honour summon after filing my complaints at the chief’s court. Since he
was not ready to appear before the elders, I have therefore brought the matter to the state
court to get back my money – (A 51 year old male at the state court).
Other respondents expressed fears about possible bias at the chief’s court. This was reiterated in the
following statement:
Traditional authorities at the chief’s court may abuse their power to because of
familiarisation. They are always likely to favour the rich in the society since they would
always give them something special that the poor cannot give. – (a 39 year old
respondent).
Most respondents indicated that the existence of many unresolved chieftaincy conflicts in some areas
prevented them from using the chief’s court to resolve their matters. A 42 year old female respondent
noted that the only way to attract people to use the chiefs’ courts was for chiefs to be free from conflicts
and partiality.
4. Discussion
The study sought to examine the indigenous ways of resolving land conflict at the paramount chief’s
court in the Oguaa Traditional area using descriptive survey design. The relevance and effectiveness of
chiefs’ courts in land conflicts resolution, to a very large extent, was found not to be in doubt. The
gendered nature of the litigants, traditional council composition and land experts were rooted in the
patriarchal Ghanaian society historical antecedents. Majority of the principal adjudicators at the chief’s
court were males. The most possible explanation for gendered composition of the entire participants may
be attributable to the age long tradition where leadership in the traditional society has been patriarchal in
nature.
Further probe by the researchers brought to the fore that the most possible explanation for the male
dominance in land dispute as compared to female may be due to the fact that males are usually heads of
family or clan lands and other valuable properties in most part of the study area. These findings are
consistent with earlier studied by Whitehead and Tsikata (2003) where they explain this male gendered
composition to result from males dominating in land holdings in the customary land sector.
Our study identified old age to be associated with membership of the adjudicating body. While this
may appear refreshing for the complements of historical legacy, it takes away the utility of knowledge,
experience gained in conflict and people management from academic domains and assume old age
synonymises wisdom-an error that could explain partly from accusations of biases among the few who
opined such unfair cases adjudication. In our study, more than two thirds majority (64.7%) of the
traditional authorities were above the age of 60 years. This gives little room for the input of young people
who form the larger population in the traditional area.
This reflects the association of wisdom to old age in the customs and traditions of the people in the
study area, a view that has been espoused by Nhongo (2004). Consequently, it was not surprising to see
most traditional leaders in their old age. The Problem Assurance theory is thus corroborated in this
observation. Anchoring this observation on this theory, the assurance emerges that the adjudicating body
are old age people with privilege of historical know-how as opposed to the legal court which may have a
46
judge without any knowledge of land boundaries and clan histories but may be called upon to read
judgement on principles that may remain inapplicable to the rules and procedures of the traditional and
family lands.
Our study’s finding is consistent with the tenets of the assurance theory. It corroborate the arguments
put out by the problem assurance theorists. It has established that indigenous people or traditional
authorities continue to play an important role in how land related conflicts are managed and resolved.
Thus, most of the respondents still believe that the traditional authorities should be left to manage and
resolve land issues in the society.
This study found out that although chiefs are the highest judicial officers in the traditional setting, they
do not sit alone to settle disputes. They settle disputes with the help of other chiefs, elders or advisors of
their choice who are chosen on the basis of intelligence, knowledge of the customs and eloquence of
speech. The finding corroborates a study of land dispute resolution in the Kacerere area of Uganda by
Thorson (2009). In Thorson’s observation, indigenous dispute resolution groups were composed by elders
and trusted men in the community. This composed team are largely involved in handling almost all land
disputes in the area. Decisions were made based on their knowledge and wisdom and had been successful
in resolving many land cases.
In addition as has been reported by Nwolise (2004), it is had emerged a near truth in many African
society’s that non-indigenous methods of dispute resolution mechanisms which are essentially western in
origin and based on the court system have failed woefully to deliver justice, restore social harmony, and
maintain enduring peace. Besides the outcome of the dispute resolution always leaves the parties
relationship in animosity due to the approach of win-lose outcome (Best, 2006).
The present study found that the chief’s court promote social harmony, lasting peace and relations
among members of the community. This finding resonate with Nwolise (2004) and Wehremann (2008)
who observed that, with indigenous methods of resolving conflict, the emphasis was not necessarily to
pronounce judgement, but resolving conflict and restoring social harmony and consensus building among
the parties in conflict. It is however not a full proof system as the observations from a few of the
participants on accusations of familiarity breeding biases challenges how sacrosanct this option of land
dispute adjudication is.
Critics of indigenous justice systems have suggested that chiefs are biased, and consequently their
decisions are not acceptable since they are mostly engaged in cases that they have personal interest
(Boege, 2006; Odametey, 2007). Notwithstanding, internal mechanisms remain in place to avert the
occurrence or abuse of the process. This was identified during the study by establish that at the chief’s
court, a chief on a resolution panel who had a direct interest in matter either recused himself or was
replaced in order to ensure impartial trial.
The findings demonstrated that, dispute resolution processes at the chief’s court were built around
certain important principles and values like peace coexistence, unity, social harmony, equity and justice.
All these principles and values were ensured to re-establish right relationships, repair damages depending
on the situation. This findings concurs with Brock-Utne (2001) who report that the immediate goal of
such conflict resolution is to mend the broken or destroyed relationship, rectify wrongs and reinstate
justice.
The local people appreciated the chiefs’ courts because settlement procedures and rules were simple,
informal and flexible and commend to the understanding of the ordinary man. More so, the chief’s court
derived their importance from the fact that they are closest to the rural communities and use the language
of the concerned community. No technical rules of evidence apply. This finding demonstrates adequacy
of the Problem Assurance theory’s through its assertion that local communities and traditional institutions
have been able to establish and maintain organisational structures and enforce mutually agreed rules on
the use of natural resources such as land. This finding also supports Bennett (2006) who has contended
that the courts are cheap, the language used is familiar and the procedures are simple.
It can be noted from the results of the study that while preference for the traditional Court was high,
some of the participants did not think that traditional courts can manage and resolve land conflicts better
since they lack the power to enforce their decisions. This reiterates similar calls that have been made by
47
Kludzie, (2000) that chiefs’ courts are still popular and powerful, offer a potential alternative to the state
courts, but they lack state power to compel attendance or enforce decisions. In this regards, Chirayath et
al. (2005) have therefore cautioned the relative lack of attention to the customary justice systems given
their prevalence in the society.
Indigenous methods of land conflict resolution are still relevant in most communities. This is because
they have effective mechanisms for the resolution land related conflicts. In line with this conviction,
proponents of Problem Assurance theory argue that alienation and isolation of local institutions such as
the traditional institutions is unjustified given their custodian role and demonstrated abilities to resolve
land conflicts amicably.
5. Conclusion
Our study has demonstrated that the indigenous methods of resolving land conflict plays an important
role in conflict resolution among members of the Oguaa Traditional area. The Paramount chief’s court
presents an indigenous well-structured leadership hierarchy which is deeply rooted in the local
communities. It is a useful supplement to relieve the backlog of land cases in the state courts. Emphasis in
the approach of the chief's court is on facilitating reconciliation and arriving at a mutually satisfactory
solution.
Land conflicts resolution at the chief’s court is still largely informal, flexible and voluntary
participation. The customary system at the chief’s court also employs inclusive and participatory
approaches in the resolution processes. The community as a whole are also involved in finding solutions
thereby making it more sustainable. More so, the decisions of chiefs result in fewer costs and the
proceedings are expeditious. Local people appreciate indigenous land conflicts resolution processes with
compromising agreements as their outcome but many are concerned about the lack of authority to enforce
decisions. It is for this reason that the study recommends the chief’s court should be mandated and
empowered by the state to enforce their decisions in land conflicts resolution. Thus, customary or chief’s
court should be recognised as part of the judicial system.
It is also necessary that traditional authorities receive regular workshops and proper training by state.
Their training should not simply be confined to the academic sphere, but should also embrace
administrative training. They should also be trained in customary law and procedure as well as be abreast
with modern trends of arbitration and negotiations in land conflicts. Furthermore, indigenous institutions
must be open and transparent in their administration of their areas, particularly on issues bordering on
resource management, collection of royalties, and adjudicating customary justice. This would win the
trust and legitimacy of people in their jurisdiction. Thus, sensitive matters like land cases will be brought
before their court.
6. Acknowledgement
The authors wish to acknowledge the traditional rulers who allowed them entry into the pace to
observe the proceedings. Mention must also be made of all the traditional leaders who granted the
interviews
References
Agbosu, L.K. (2000). Ghana land law: contradiction between Anglo-American and customary conceptions of tenure
practices. Working Paper. Madison: 32.
Akudugu, M.A & Kendie, S.B. (2010). Natural Resources Utilisation and Conflict Management in the Bongo
District of Ghana. In Apusigah, A., Miller. D. (eds). Endogenous Knowledge and African Development
(pp.82-97). Kumasi: University Printing Press
Arko-Adjei, A. (2006). A Conceptual Approach for Enhancing Customary Land Management: Case from Ghana.
5th FIG Regional Conference on promoting land administration and good governance. Accra, Ghana.
48
Baribeau, G. (2012). Search for Common Ground and Land Conflict in Burundi: A Strategic Review, 2011. Search
for Common Ground. Washington, DC.
Bennett T. W. (2006). Traditional Courts and Fundamental Rights. In M. O Hinz (ed). The shades of New Leaves
Governance in Traditional Authority: A Southern African Perspective. 157-166.
Best, S. (2006). Introduction to Peace and Conflict Studies in West Africa: A Reader. Ibadan: Spectrum Books
Limited, p. 97.
Boege, V. (2006). Traditional approaches to conflict transformation-potentials and limits. Berghof handbook for
conflict transformation. Berlin, Berghof Research Centre for Constructive Conflict Management.
Brock-Utne, B. (2001). Indigenous Conflict Resolution in Africa. A draft presented to week-end seminar on
Indigenous Solutions to Conflicts held at the University of Oslo, Institute of Educational Research, 23 – 24
of February 2001.
Chirayath, L., Sage, C. & Woolcock, M. (2005). Customary Law and Policy Reform: Engaging with the
Plurality of Justice Systems. Washington DC: World Bank.
Crook R. C. (2004). Access to Justice and Land Disputes in Ghana’s State Courts: the Litigants’ Perspective. 50 J.
Legal Pluralism & Unofficial L.1, 15.
Dzivenu, S. (2008). The politics of inclusion and exclusion of traditional authorities in Africa: chiefs and justice
administration in Botswana and Ghana. In Political Perspectives, 2 (1) 1-30.
Edossa, D. C., Babel, M. S., Gupta, A. D. & Awulachew, S. B. (2005). Indigenous systems of conflict resolution in
Oromia, Ethiopia. In proceedings of the International workshop on African Water Laws: Plural Legislative
Frameworks for Rural Water Management in Africa. Johannesburg, South Africa Department of Water
Affairs and Forestry.
Kairuki F. (2015). Conflict Resolution by Elders in Africa: Successes, Challenges and Opportunities. Nairobi:
Kariuki Muigua & Co. Advocates
Kludzie, A. P. K. (2000). Chieftaincy in Ghana. Maryland: Austin & Winfield.
Marsh, M. (2001). Working with local institutions to support Sustainable livelihood. University of California,
Berkeley.
Midodzi, P. E & Imoro, R. K (2011). Assessing the effectiveness of the alternative dispute resolution mechanism in
the Alavanyo-Nkonya conflict in the Volta region of Ghana. International Journal of Peace and
Development Studies Vol. 2(7), pp.195-202.
Nhongo, T. (2004). Poverty, Social Security and the Rights of Older People in Africa. In Achacha, L. M. and Letsic,
L. (eds). Report on the Workshop Proceedings on Gender and Ageing (pp.11-18). University o f
Botswana: Gender Policy and Programme Committee (GPPC)
North, D. (1990). Institutions, Institutional Change and Economic Performance. Cambridge University Press.
Cambridge.
Nukunya, G. K. (2003). Tradition and change in Ghana: An introduction to sociology. Accra: Ghana University
Press.
Nwolise, O. B. C. (2004). Traditional approaches to Conflict Resolution Among the Igbo People of Nigeria:
Reinforcing the Need for Africa to Rediscover its Roots. AMANI Journal of African Peace, vol 1, no. 1,
pp.35-57
Odamatey, C. (2007). The Regulation of Land Disputes: Promoting the Option of Alternative Dispute Resolution
Mechanisms: The Case of Ghana. Master’s Thesis. Munchen Centre of Land Management and Land
Tenure, Technische Universitat
Owusu-Yeboah, M. (2005). Chief’s Customary Courts in Ghana, how Popular, how Just. Paper presented at the
International Workshop on Adjudication of Land Disputes, Legal Pluralism and the Protection of
Land Rights in Ghana and Cote d’Ivoire, Institute of Commonwealth Studies, University of London, 17-18
February 2005.
Putnam, R.D. (2000). Bowling Alone: The Collapse and Revival of American Community. New York: Simon &
Schuster
Runge, C. E. (1986). Common property and collective action in economic development. World Development,
14:623-635.
Sackey, G. (2010). Investigating Justice Systems in Land conflict resolution: A case study of Kinondoni
Municipality, Tanzania. Msc. Thesis, Faculty of Geo-information science and Earth Observation,
University of Twente.
Sarantakos, S. (1993). Social Research (3rd
ed.). New York: Palgrave Houndmills
Sarantakos, S. (2005). Social research (3rd
ed.). Basingstoke: Palgrave Macmillan.

49
Thornson, P. K. (2009). Dispute Resolution and Legitimacy in Kacerere: Examples of Two Land Disputes. Bachelor
thesis, Division of Political Science, Lulea University of Technology, Stockholm.
Water Aid (2009). A Study on Land Tenure in Urban Areas Report. Accra: Water Aid.
Wehrmann, B. (2008). Land conflicts: A practical guide to dealing with land disputes. Eschborn, Germany:
Deutsche Gesellschaft fur.
Whitehead, A. & Tsikata D. (2003). Policy discourses on women’s land rights in sub-Saharan Africa: The
implications of the re-turn to the customary. Journal of Agrarian Change 3 (1 and 2): pp.67-112.
Wojkowska, E. (2006). Doing Justice: How Informal Justice Systems Can Contribute. Oslo: UNDP
50
Available online at www.asric.org
ASRIC Journal on Social Sciences & Humanities 1 (2020) 50-58
a Department of Educational Management, Faculty of Arts & Education Lead City University,
Ibadan, Oyo State, Nigeria
Received 19 December 2019; revised 30 January 2020; accepted 30 January 2020
Abstract
Small scale business is a business that employs a small number of workers and does not have a high volume of sales.
Small-scale business is organized, operated, managed and controlled by a small business owner. This study
examined book-keeping as a correlate of small-scale business development in Orita Challenge and Challenge market
areas in Ibadan, Oyo State. 3 research questions and 2 hypotheses were formulated to achieve the stated purpose of
the study. The study used descriptive research design. All small-scale business owners in Orita-challenge and
Challenge market areas were the target population. Purposive and simple random sampling techniques were used to
select the samples for the study. 67% small scale business owners out of the average number were randomly selected
from each market making 702 respondents. Structured questionnaire was used to collect data. The instrument was
validated and a pilot study was carried out on 10 small scale business owners who were not part of the sample and
the reliability coefficient Cronbach alpha was 0.701. Percentage was used to analyse the research questions while
Pearson Product Moment Correlation Coefficient was used for hypothesis one while t-test distribution was used for
the second hypothesis. From the results, it was observed that many of the small business owners in those markets do
not keep records for transactions (46%), and only very few of them had daily purchase book (8%). From the few
people who were keeping daily records, many of them claimed not to be facing any challenges in book-keeping
(72%). Moreover, the findings showed that there was significant relationship (P<0.05) between effective book-
keeping and small-scale business development in Orita-challenge and Challenge market areas. It was recommended
that training or orientation should be organised by local government for the small-scale business owners on the
importance of book-keeping for business development.
Keywords: Small scale business; Market area; Book-keeping; Development; Orita challenge; Challenge; Ibadan
1. Introduction
The history of business cannot be discussed without taking into consideration about the history of
small-scale business. The history of small-scale business has been in existence since creation and more to
1 Corresponding author. +234 805 514 5060; +234 810 939 6747; Email addresses: [email protected] (A.O.
Oredein); [email protected] (I.M. Stowe)
51
it; currently, is the situation of the nation whereby to get a “white collar” job seems impossible which has
now led so many people to become owners of business. Many big scale businesses started from small
scale business. This implies that small scale business could grow gradually to big scale business. Small
scale business is a kind of business that does not need a huge amount of money to run it. The money
could be as low as N5,000 (ten thousand naira) only. Small scale business is also known as “petty
trading”. The Central Bank of Nigeria, in the monetary policy circular number 12 (twelve) of 1980,
defined small scale business as a business concern with annual turnover between N25,000 (twenty-five
thousand) and N50,000 (fifty thousand) only. Small scale business is a business that employs a small
number of workers and does not have a high volume of sales. Often times, it is even like a “one man
show” where the business is organized, operated, managed and controlled by the business owner. Small
scale business has been in operation for long and the proof can be seen all around the residential areas,
and market places. All great grandparents engaged in one scale business or the other and used the
proceeds to train the children. In fact, in some homes, the small scale business is being named after the
family. In Nigeria, there is no doubt that small scale business has contributed immensely to the economic
growth as well as meeting the immediate needs of people by enhancing national gross domestic products
and making it readily available for use. Small scale business is like the intermediary between the
wholesale and the consumer whereby strengthen the industrial linkages.
In recognizing the immense contribution of small-scale business in Nigerian economy, in 1970, the
government begun programs to assist the business in the areas of finance, extension and advisory services
including training and provision of infrastructures. Also, specialized banks were established to meet the
needs of small-scale business owners by giving loans; still, small scale business owners face many
obstacles that limit long term survival and development of the business. The obstacles could include;
improper book-keeping, family issues, environmental issues, lack of knowledge, irregularity or changes in
the price of goods and lack of market survey to mention few. Some research studies have been carried out
on the rate of small-scale business failure and observed that there are more in developing countries than
developed countries (Marlow, 2009; and Okafor, 2008). In the olden days, some business owners make
use of chalk or charcoal to write on the wall anything that has to do with the business and many times
there will not be any proper record.
Book-keeping is a process of recording all financial transactions in a systematic and logic manner
(Owolabi, Ogundajo & Olayinka, 2016). Book-keeping is very essential in the growth of any business
because it keeps the entrepreneur on track as regards expenditure. Book-keeping helps the business
owners to have a proper record for estimation and to monitor the progress of the business. From
observation, many of these small-scale business owners seem not to be keeping records which has so been
difficult to calculate the net profit, and unable to determine the correct financial position of the business.
If it is difficult to determine the correct financial position of any business then it will likely be impossible
to formulate plans and policies for the future of the business (Wanjala, Bwisa, Wandara, Wanyama &
Wanjala, 2014).
Book-keeping helps the small-scale business owners reduce the possibilities of early failure, increase
chance of business existence, serves as a basis for planning and controlling business operations, increases
the chance of productivity and also help to keep business in an encyclopedic healthy state to face
competition (Aruwa, 2006). There are some certain records that need to be kept by the small-scale
business owners for the business not to fail. These records include; purchase and sales day books, invoice
and receipt to mention few. Olukotun, James and Olore, 2012 argued that many small-scale businesses do
not keep records and concluded that inadequacy of proper accounting system is the primary factor for
business failures. Many of the small-scale business owners are more concern of the goods to sell than the
record keeping which can bring or lead to growth and sustainability of the business. Failure to keep
records sometimes makes some of the small-scale business owners to become seasonal traders.
A study carried out by Adekunle and Adegbite (2014), showed that majority of the small-scale
business owners do not prepare yearly financial statements which has led to poor financial performance
and business collapsed in the long run. Some of the small-scale business owners seem to have desire to
keep records but because of the illiteracy level which has limited the necessity for keeping records. Also,
52
some seem not to have business book-keeping training as an apprentice. Wanjala, et al (2014) confirmed
in a study carried out that majority of the small-scale business owners would have been good in practicing
book-keeping management but due to the low level of education attained and lack of accounting
knowledge.
A small-scale business is said to be successful if the business is producing the desired or intended
goals and objectives. Orita-challenge and Challenge markets are one of the small daily markets in Ibadan
Southeast Local Government area, Ibadan, Oyo state, Nigeria. Orita-challenge and Challenge markets are
markets where buying and selling of goods or products take place. It is a retail market. The markets are
filled up with small scale businesses that almost all the shops have less than five workers. In fact, some of
the shops are been handled by family members; father, mother, and children. Different kinds of goods or
products can be seen like; groceries, vegetables, pepper, and food stuffs to mention few.
2. Statement of the Problem
Small scale business has been identified by researchers as a key focal point to national economic
growth and development (Owolabi et al 2016; Marlow, 2009; Okafor, 2008; Aruwa, 2005). From
observations, it seems the small-scale business in Orita-challenge and Challenge areas die prematurely
and very few grow up to become an enterprise or a middle scale business. Many times, one can see a
small-scale owner selling a product and in no time such person might not be coming to the market again;
even some will change to another product entirely. And sometimes, it will be so obvious that the size of
the product is diminishing. One keep-on wondering what could have caused such situation. Is it because
of lack of education and knowledge about the product? Is it because of lack or poor record keeping? Is it
because of the environment? Studies have been carried out and revealed that about 60% small scale
businesses fail within the early years of operation while some experience a deteriorating performance
which could either lead to stagnation or have a natural death (Bowen, Morara & Mureithi, 2009; Boachie-
Mensha & Marfo-Yiadom, 2005). Studies carried out are not within this geographical location, and some
studies focused on the middle scale business. To this end, the aim of this study seeks to investigate on
book-keeping as a correlate of effective small-scale business development in Orita-challenge and
Challenge areas, Ibadan southeast local government area, Ibadan, Oyo State.
3. Objectives of the Study
Also, the specific objectives are to:
1. identify the education, age, and gender level of the small-scale business owners
2. investigate the types of accounting records being kept by small scale business owners
3. identify challenges being faced in keeping records by small scale business owners
4. analyse the relationship between book-keeping and small-scale business development.
5. investigate gender difference in book-keeping by small scale business owners.
4. Research Questions
1. What is the education, age, and gender level of the small-scale business owners in Orita-
challenge and Challenge market areas respectively?
2. What are the types of book-keeping records for measuring financial performance by small
scale business owners in Orita-challenge and Challenge market areas respectively?
3. What are the challenges being faced in keeping records by small scale business owners in
Orita, and Orita-challenge market areas respectively?
53
5. Hypotheses
1. Ho1: There will be no significant relationship between book-keeping and effective small-
scale business in Orita-challenge and Challenge market areas.
2. Ho2: There will be no significant gender difference in book-keeping for measuring financial
performance of small-scale business in Orita-challenge, and Challenge market areas.
6. Methodology
Descriptive research design was used to obtain relevant information in relation to the population and
describe the variables as it were without any manipulation.
The population of this study comprised of all small-scale business owners in Orita-challenge and
Challenge market places in Ibadan Southeast Local Government area, Ibadan, Oyo State. There was an
average of six hundred (600) and an average of four hundred and fifty (450) small scale business owners
in Orita-challenge and Challenge market areas place respectively. Simple Random and Purposive
Sampling techniques were used to select the respondents. Orita-challenge market consists of both small
scale and middle scale businesses but the researcher purposively selected the small-scale business. 67% of
each population from the Orita-challenge (402 respondents) and Orita (300 respondents) market areas
were randomly selected making 702 sample size (respondents).
The research instruments used to collect data were observation, questionnaire and interview. The
researcher used observation method to gather information about the markets and observed the various
things around the market such as the way the small-scale business owners interact with customers, and
how buying and selling was being done. Also, the researcher observed whether the small-scale business
owners really keep records or not. The researcher made use of structured interview to elicit information
from the respondents who could not fill the questionnaire. Third instrument was a structured
questionnaire titled “Small Scale Business Questionnaire” (SSBQ). The questionnaire was divided into
three sections. Section A contained items to elicit information on the demographic data of the
respondents. The items under Section B measured the importance of book-keeping, challenges, and
benefits of book-keeping. Section C contained items to elicit information on small scale business
development, measured the importance, and characteristics of small-scale business. Four-Likert’s Scale of
measurement was used in sections B, C and D.
The questionnaire was exposed to face and content validity which was done by research instrument
experts. Also, a pilot study was carried out to validate the instrument and the reliability of the instrument
was tested using test-retest method to establish the stability principle and the co-efficient was 0.701.
The data was subjected to statistical analysis, using descriptive statistics for the research questions.
Correlation analysis and t-test were used for the hypotheses at 5% level of significance.
7. Results
Research Question One: What is the education, age, and gender level of the small-scale business
owners in Orita, and Orita-challenge market areas respectively?
Table 1 shows the analysis of respondents by gender, age, marital status and educational qualification.
The result reveals that there are more female (69%) small scale business owners than male (31%). This
was so evident during the observation. The result corroborated with the research carried out by Owolabi
et al (2016) that more female are into small scale businesses than male counterpart. The result shows that
the age bracket 25-35 (35%) has the highest percentage of the small-scale business owners followed by
the age bracket 36-45 (32%) and the age bracket below 25 has the least (2%). This is an indication that
young people are more encouraged and interested to start business now on like before. Also, there more
married people (72%) than the other marital status group. The result also reveals that the highest
educational qualification of the respondents is secondary school certificate (34%) while the least is
postgraduate degree certificate (2%). From the interview, those with postgraduate degree certificate are
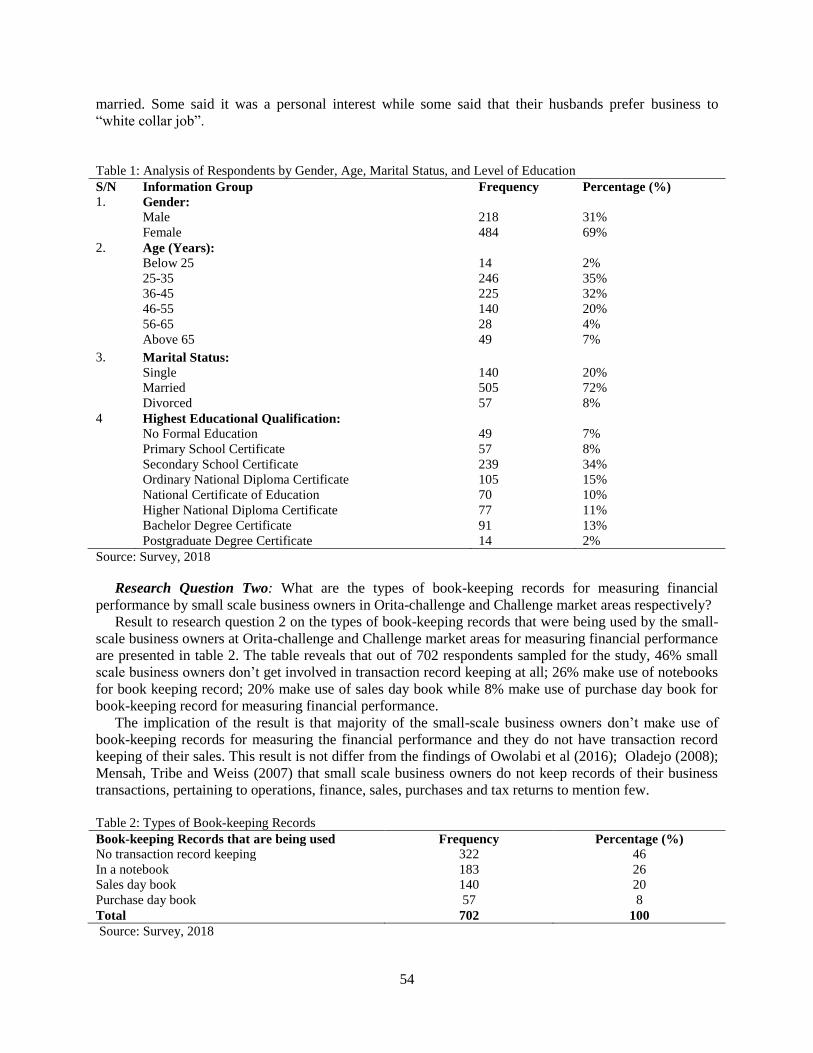
54
married. Some said it was a personal interest while some said that their husbands prefer business to
“white collar job”.
Table 1: Analysis of Respondents by Gender, Age, Marital Status, and Level of Education
S/N Information Group Frequency Percentage (%)
1. Gender:
Male
Female
218
484
31%
69%
2. Age (Years):
Below 25
25-35
36-45
46-55
56-65
Above 65
14
246
225
140
28
49
2%
35%
32%
20%
4%
7%
3. Marital Status:
Single
Married
Divorced
140
505
57
20%
72%
8%
4 Highest Educational Qualification:
No Formal Education
Primary School Certificate
Secondary School Certificate
Ordinary National Diploma Certificate
National Certificate of Education
Higher National Diploma Certificate
Bachelor Degree Certificate
Postgraduate Degree Certificate
49
57
239
105
70
77
91
14
7%
8%
34%
15%
10%
11%
13%
2%
Source: Survey, 2018
Research Question Two: What are the types of book-keeping records for measuring financial
performance by small scale business owners in Orita-challenge and Challenge market areas respectively?
Result to research question 2 on the types of book-keeping records that were being used by the small-
scale business owners at Orita-challenge and Challenge market areas for measuring financial performance
are presented in table 2. The table reveals that out of 702 respondents sampled for the study, 46% small
scale business owners don’t get involved in transaction record keeping at all; 26% make use of notebooks
for book keeping record; 20% make use of sales day book while 8% make use of purchase day book for
book-keeping record for measuring financial performance.
The implication of the result is that majority of the small-scale business owners don’t make use of
book-keeping records for measuring the financial performance and they do not have transaction record
keeping of their sales. This result is not differ from the findings of Owolabi et al (2016); Oladejo (2008);
Mensah, Tribe and Weiss (2007) that small scale business owners do not keep records of their business
transactions, pertaining to operations, finance, sales, purchases and tax returns to mention few.
Table 2: Types of Book-keeping Records
Book-keeping Records that are being used Frequency Percentage (%)
No transaction record keeping 322 46
In a notebook 183 26
Sales day book 140 20
Purchase day book 57 8
Total 702 100
Source: Survey, 2018
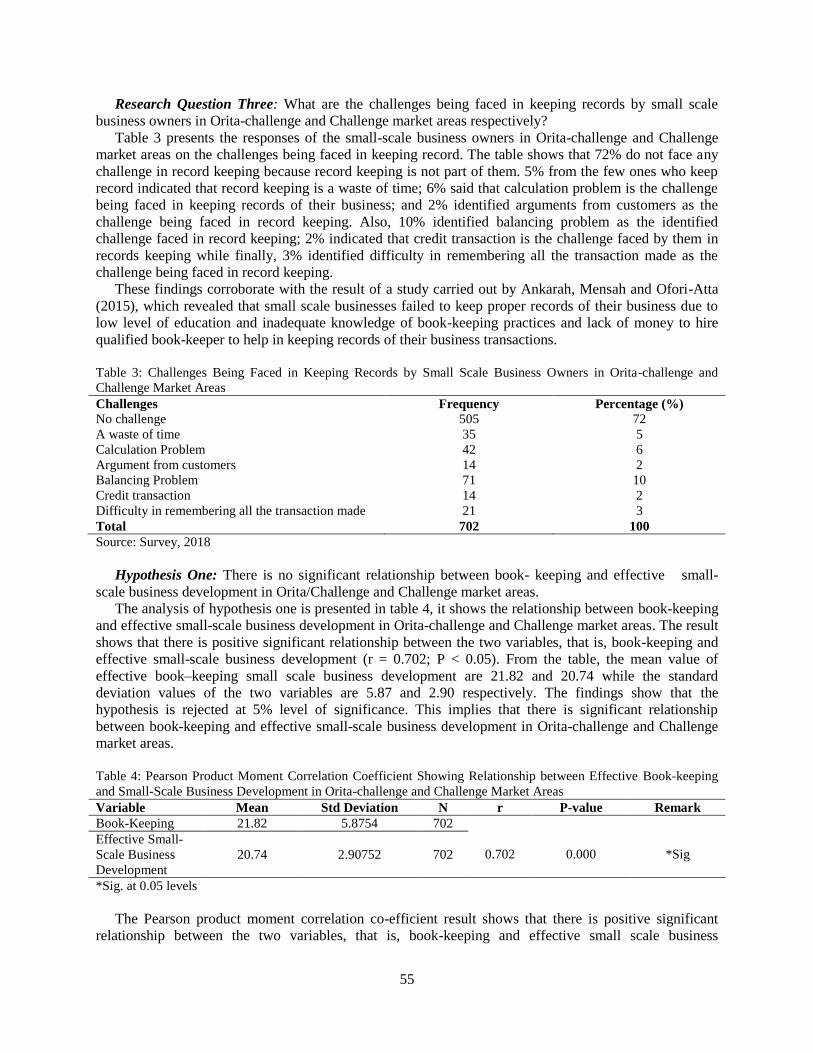
55
Research Question Three: What are the challenges being faced in keeping records by small scale
business owners in Orita-challenge and Challenge market areas respectively?
Table 3 presents the responses of the small-scale business owners in Orita-challenge and Challenge
market areas on the challenges being faced in keeping record. The table shows that 72% do not face any
challenge in record keeping because record keeping is not part of them. 5% from the few ones who keep
record indicated that record keeping is a waste of time; 6% said that calculation problem is the challenge
being faced in keeping records of their business; and 2% identified arguments from customers as the
challenge being faced in record keeping. Also, 10% identified balancing problem as the identified
challenge faced in record keeping; 2% indicated that credit transaction is the challenge faced by them in
records keeping while finally, 3% identified difficulty in remembering all the transaction made as the
challenge being faced in record keeping.
These findings corroborate with the result of a study carried out by Ankarah, Mensah and Ofori-Atta
(2015), which revealed that small scale businesses failed to keep proper records of their business due to
low level of education and inadequate knowledge of book-keeping practices and lack of money to hire
qualified book-keeper to help in keeping records of their business transactions.
Table 3: Challenges Being Faced in Keeping Records by Small Scale Business Owners in Orita-challenge and
Challenge Market Areas
Challenges Frequency Percentage (%)
No challenge 505 72
A waste of time 35 5
Calculation Problem 42 6
Argument from customers 14 2
Balancing Problem 71 10
Credit transaction 14 2
Difficulty in remembering all the transaction made 21 3
Total 702 100
Source: Survey, 2018
Hypothesis One: There is no significant relationship between book- keeping and effective small-
scale business development in Orita/Challenge and Challenge market areas.
The analysis of hypothesis one is presented in table 4, it shows the relationship between book-keeping
and effective small-scale business development in Orita-challenge and Challenge market areas. The result
shows that there is positive significant relationship between the two variables, that is, book-keeping and
effective small-scale business development (r = 0.702; P < 0.05). From the table, the mean value of
effective book–keeping small scale business development are 21.82 and 20.74 while the standard
deviation values of the two variables are 5.87 and 2.90 respectively. The findings show that the
hypothesis is rejected at 5% level of significance. This implies that there is significant relationship
between book-keeping and effective small-scale business development in Orita-challenge and Challenge
market areas.
Table 4: Pearson Product Moment Correlation Coefficient Showing Relationship between Effective Book-keeping
and Small-Scale Business Development in Orita-challenge and Challenge Market Areas
Variable Mean Std Deviation N r P-value Remark
Book-Keeping 21.82 5.8754 702
0.702
0.000
*Sig Effective Small-
Scale Business
Development
20.74 2.90752 702
*Sig. at 0.05 levels
The Pearson product moment correlation co-efficient result shows that there is positive significant
relationship between the two variables, that is, book-keeping and effective small scale business
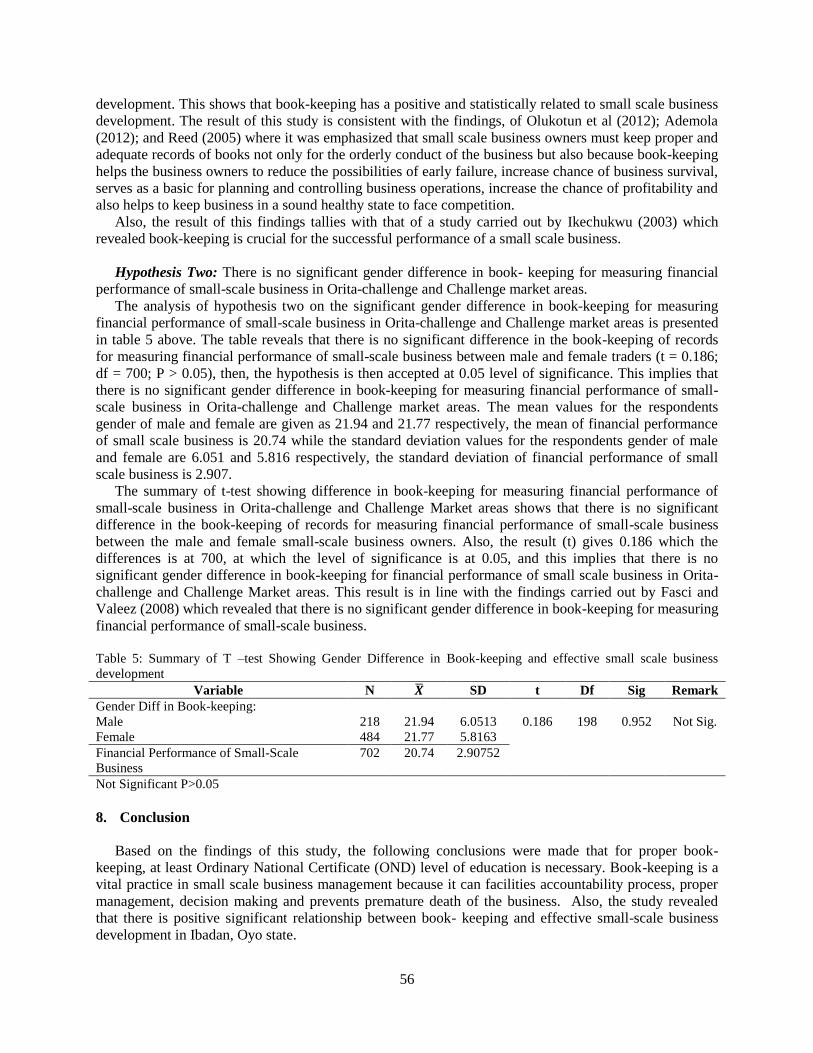
56
development. This shows that book-keeping has a positive and statistically related to small scale business
development. The result of this study is consistent with the findings, of Olukotun et al (2012); Ademola
(2012); and Reed (2005) where it was emphasized that small scale business owners must keep proper and
adequate records of books not only for the orderly conduct of the business but also because book-keeping
helps the business owners to reduce the possibilities of early failure, increase chance of business survival,
serves as a basic for planning and controlling business operations, increase the chance of profitability and
also helps to keep business in a sound healthy state to face competition.
Also, the result of this findings tallies with that of a study carried out by Ikechukwu (2003) which
revealed book-keeping is crucial for the successful performance of a small scale business.
Hypothesis Two: There is no significant gender difference in book- keeping for measuring financial
performance of small-scale business in Orita-challenge and Challenge market areas.
The analysis of hypothesis two on the significant gender difference in book-keeping for measuring
financial performance of small-scale business in Orita-challenge and Challenge market areas is presented
in table 5 above. The table reveals that there is no significant difference in the book-keeping of records
for measuring financial performance of small-scale business between male and female traders (t = 0.186;
df = 700; P > 0.05), then, the hypothesis is then accepted at 0.05 level of significance. This implies that
there is no significant gender difference in book-keeping for measuring financial performance of small-
scale business in Orita-challenge and Challenge market areas. The mean values for the respondents
gender of male and female are given as 21.94 and 21.77 respectively, the mean of financial performance
of small scale business is 20.74 while the standard deviation values for the respondents gender of male
and female are 6.051 and 5.816 respectively, the standard deviation of financial performance of small
scale business is 2.907.
The summary of t-test showing difference in book-keeping for measuring financial performance of
small-scale business in Orita-challenge and Challenge Market areas shows that there is no significant
difference in the book-keeping of records for measuring financial performance of small-scale business
between the male and female small-scale business owners. Also, the result (t) gives 0.186 which the
differences is at 700, at which the level of significance is at 0.05, and this implies that there is no
significant gender difference in book-keeping for financial performance of small scale business in Orita-
challenge and Challenge Market areas. This result is in line with the findings carried out by Fasci and
Valeez (2008) which revealed that there is no significant gender difference in book-keeping for measuring
financial performance of small-scale business.
Table 5: Summary of T –test Showing Gender Difference in Book-keeping and effective small scale business
development
Variable N �̅� SD t Df Sig Remark
Gender Diff in Book-keeping:
0.186
198
0.952
Not Sig. Male 218 21.94 6.0513
Female 484 21.77 5.8163
Financial Performance of Small-Scale
Business
702 20.74 2.90752
Not Significant P>0.05
8. Conclusion
Based on the findings of this study, the following conclusions were made that for proper book-
keeping, at least Ordinary National Certificate (OND) level of education is necessary. Book-keeping is a
vital practice in small scale business management because it can facilities accountability process, proper
management, decision making and prevents premature death of the business. Also, the study revealed
that there is positive significant relationship between book- keeping and effective small-scale business
development in Ibadan, Oyo state.
57
The study also concluded that book-keeping is the key to a successful business, book-keeping should
be part of the small-scale business owners to promote their business effectively. The study also concluded
that there is no gender difference in book-keeping for measuring the financial performance of small-scale
business in Orita-challenge and Challenge market areas in Ibadan, Oyo state.
9. Recommendations
The study therefore made the following recommendations:
1. It is therefore recommended that the government (local and state levels) should enhance better
management practices for growth and development in the small scale businesses by organizing
adult education, workshops, seminars, professional trainings to guide the small scale owners
on book-keeping because the small scale business participate a lot in the county's Gross
Domestic Product (GDP) and provides employment opportunities to the citizens.
2. The National Board for Small Scale Industries (NBSSI) with support from government and
Non-governmental organizations (NGO’s) should organized book-keeping training for the
small-scale business owners.
3. There should be more book-keeping consultancy firms that provide book-keeping advice and
should be opened up throughout the country to facilitate better book-keeping amongst small
scale business owners.
4. Universities and colleges should also offer more courses related to book-keeping apart from
the general business courses especially when students are offering entrepreneurship education.
5. Microfinance Banks should work with small scale business owners to open account with them
and encourage them to keep their daily sales in the banks.
6. Small scale business owners should avail themselves of the opportunist to learn book-keeping
so has to have access to credit facilities from the financial institutions.
7. Stock taking should be done on a daily basis many people have to keep their records so as to
ensure the survival of the small scale business.
References
Adekunle, A.A; & Adegbite, T.A. (2014). The analysis of the impact of accounting records keeping on the
performance of the small scale entreprerises. International Journal of Academy Research in Business &
Social Sciences, 4(1); Pp 1-17
Ademola G.O (2012), The Roles of Record Keeping in the Survival and Growth of Small-Scale Enterprises in Ijumu
Local Government Area of Kogi State. Global Journal of Management and Business Research, 12(13);
Versions 1.0 Year 2012
Ankarah , E, Mensah, C. C. Y., & Ofori – Atta K. (2015). The Relevance of Book- Keeping Information in the
Management and Business in the Yilo Krobo District in Ghana, European Journal of Business
Management, 7; Pp 8-19
Aruwa S.A. (2006). The Business Entrepreneur, Academy Publications, Kaduna, Nigeria
Boachie-Mensah, F.O.; & Marfo-Yiadom, E. (2005). Entrepreneurship and small business management, Ghana
University Press.
Bowen, M.; Morara, M.; & Mureithi, S. (2009). Management of business challenges among small and micro
enterprise in Nairobi-Kenya
Central Bank of Nigeria (1980) Credit Guidelines (Monetary Policy Circular No.12)
Fasci & Valez (2008), Quality of Record Keeping and Performance in Small Business Enterprises, Unpublished
Master Thesis, Makerere University Business School, Kampala, Uganda
Ikechukwu, C. (2003) Success Key Point: Book- Keeping and Accounts. Onitsha: Hybrid Publishers Limited
Marlow. M. (2009) The Role of Government Policy on Entrepreneurial Activity, Productive, Unproductive, or
Destructive, Entrepreneurship Theory and Practice, 32(5); Pp 779- 790
Mensah, J. V. Tribe, M., & Weiss, J. (2007) The Small-Scale Manufacturing Sector in Ghana: A Source of
Dynamism or of Subsistence Income? Journal of International Development 19 (2); Pp 253-273
58
National Economic Reconstruction Fund (1989) Information Bulletin and Operational Guidelines for Small Scale
Business January 12, 1989
Okafor E.E. (2008) Development Crisis of Power Supply and Implications for the Industrial Sector; Dept of
Sociology, University of Ibadan
Oladejo M. (2008). Essentials of Management and Accounting (2nd Edition), Ikeja Peace Concept Page 32- 93
Olukotun, A.G; James, S.O.; & Olore, I. (2012). The roles of book-keeping in the survival and growth of small-scale
enterprises in Ijumu Local Government Area of Kogi State. Global Journal of Management & Business
Research, 12(13)
Owolabi, s.A; Ogundejo, G.O.; & Olayinka, I.M. (2016). Book-keeping and sustainability of small-scale business in
Nigeria: An assessment of Agbara local government area, Ogun State. Unique Journal of Business
Management Research; 3(1), Pp 11-21.
Reed, R. (2005) Good Small Business Guide; How to Start and Grow Your Own Business; 2nd
Edition, A & C Black
Publishers Ltd, London
Wanjala, S.N.; Bwisa, H.M.; Wandra, R.W.; Wanyama, K.W.; & Wanjala, A.S. (2014). Effect of book-keeping
management practices on business performance of micro and small-scale butchery enterprises in Kimilli
sub-county, Bungoma, Kenya. The International Journal of Business & Management 2(9). Pp 234-255.
59
Available online at www.asric.org
ASRIC Journal on Social Sciences & Humanities 1 (2020) 59-81
a Department of Economics, University of Uyo, Uyo
Received 19 December 2019; revised 30 January 2020; accepted 30 January 2020
Abstract
This paper throws up the challenging effect of unemployment on the sustainable existence of Africa. It reviews the
contemporary measures adopted by selected African governments to solve the menace of unemployment which is
assumed to breeding extreme poverty in Africa. Many of the programs instituted by these governments to reduce
unemployment in Africa had been anchored on the traditional (agricultural) and modern (industrial) sectors. The
paper goes on to show that many of the unemployed labour force in Africa are located and engaged in the informal
sector – an emerging sector that sits in the middle of the dual economic conception of modern (industrial) and
traditional (agricultural) sectors. Using a fixed effect panel regression analysis, the paper confirms the positive but
insignificant relationship between poverty and unemployment in Africa, using a 10 country study. The statistical
insignificance of unemployment in explaining its positive relationship with poverty is explained by the vast informal
sector in these African countries. A review of the informal sector indicates that it has a very large capacity to create
and destroy jobs. Since entry into the sector and exit is free and unrestricted, coupled with its labour intensive
production techniques, its capacity to absorb more labour is large. However, the unsustainability of jobs in the
sector, which is informed by the character of the informal sector leads to easy job destruction and makes employees
in the sector not to see their engagement as employment – thus bourgeoning the mass of unemployed in the
continent. Arising hence, the paper proffers suggestions that could create sustainable employment in the sector,
while repositioning it as an advantage to solve the unemployment and poverty problems encountered in Africa.
Keywords: Informal sector; Job creation; Job destruction; Unemployment; Inflation; Poverty
1. Introduction
Unemployment, poverty, and disease had been indicated recently as the major problems of African
economies. High unemployment rates have been reported in many African countries. The biggest
economy in Africa (Nigeria) is reported to have an unemployment rate of about 23.1% in 2018. Of this
total employment rate in Nigeria, youth unemployment was estimated to be 55.4% and underemployment
was 20.21% (NBS, 2019).
The roaring unemployment rate in Africa had recently resulted in a shrinking African economy, where
aggregate demand is drastically falling, prices are very flexible upwards and sticky downwards, standards
of health care and education is deteriorating as parents do not have the wherewithal to support their
families; this exacerbates diseases as families cannot afford education and health care. Also, inflation has
1 Corresponding author. Tel. +2348181077078 Email addresses: [email protected] (C.N. Ekong)
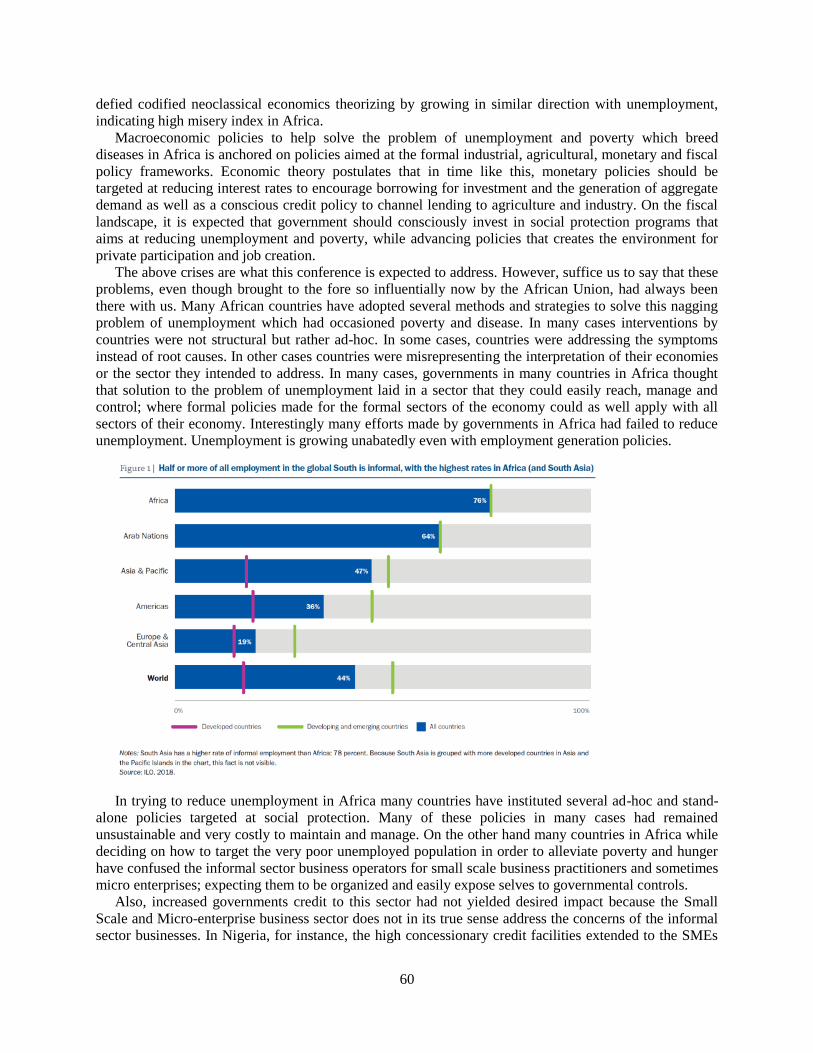
60
defied codified neoclassical economics theorizing by growing in similar direction with unemployment,
indicating high misery index in Africa.
Macroeconomic policies to help solve the problem of unemployment and poverty which breed
diseases in Africa is anchored on policies aimed at the formal industrial, agricultural, monetary and fiscal
policy frameworks. Economic theory postulates that in time like this, monetary policies should be
targeted at reducing interest rates to encourage borrowing for investment and the generation of aggregate
demand as well as a conscious credit policy to channel lending to agriculture and industry. On the fiscal
landscape, it is expected that government should consciously invest in social protection programs that
aims at reducing unemployment and poverty, while advancing policies that creates the environment for
private participation and job creation.
The above crises are what this conference is expected to address. However, suffice us to say that these
problems, even though brought to the fore so influentially now by the African Union, had always been
there with us. Many African countries have adopted several methods and strategies to solve this nagging
problem of unemployment which had occasioned poverty and disease. In many cases interventions by
countries were not structural but rather ad-hoc. In some cases, countries were addressing the symptoms
instead of root causes. In other cases countries were misrepresenting the interpretation of their economies
or the sector they intended to address. In many cases, governments in many countries in Africa thought
that solution to the problem of unemployment laid in a sector that they could easily reach, manage and
control; where formal policies made for the formal sectors of the economy could as well apply with all
sectors of their economy. Interestingly many efforts made by governments in Africa had failed to reduce
unemployment. Unemployment is growing unabatedly even with employment generation policies.
In trying to reduce unemployment in Africa many countries have instituted several ad-hoc and stand-
alone policies targeted at social protection. Many of these policies in many cases had remained
unsustainable and very costly to maintain and manage. On the other hand many countries in Africa while
deciding on how to target the very poor unemployed population in order to alleviate poverty and hunger
have confused the informal sector business operators for small scale business practitioners and sometimes
micro enterprises; expecting them to be organized and easily expose selves to governmental controls.
Also, increased governments credit to this sector had not yielded desired impact because the Small
Scale and Micro-enterprise business sector does not in its true sense address the concerns of the informal
sector businesses. In Nigeria, for instance, the high concessionary credit facilities extended to the SMEs
61
had not reduced the unemployment situation that this policy was intended to achieve. Similarly, the
National Directorate for Employment (NDE) programs had not succeeded in addressing unemployment
problems in Nigeria because they had not targeted the informal sector where most of the unemployed
dead-weight resides. The Social Protection Programs of the current government of Nigeria (Conditional
Cash Transfer, School Feeding, Anchor Borrowers Scheme, Agricultural deepening programs, Small
Scale Enterprises credit Programs) has also not succeeded in majorly reducing unemployment as expected
as the informal sector was not targeted.
In a reported research carried out by World Resources Institute (WRI) in collaboration with WIEGO
(Women in Informal Employment Globalizing and Organizing), it presents the state of informal sector in
the global South. It states that the informal sector generate 25 to 50 per cent of value added outside of
agricultural activities. It goes further to state that most of the urban workforce in the global south is
informal. The ILO defines informal employment as employment without legal or social protection. Fig 1
derived from the report shows that 76% of African workforce is employed in the informal sector (ILO,
2018)
Cheru (2019) in his work concludes that the informal sector is largely marginalized; that they are not
listened to by policymakers in government or in the international organizations. He further argues that
when policies are made they affect large percentage of firms, entrepreneurs, employees and communities
but the informal sector is less likely consulted.
The paradox, where expanding economy, occasioned by growth in the value of the GDP, was relating
positively with unemployment rates, bred reason for concern. A further paradox is where we noticed from
literature that there was an emerging and ‘hidden’ sector in Africa’s economy that had an inert capacity to
reduce unemployment in the growing economies if well harnessed, but there was lethargy on the part of
responsible stakeholders to appropriately identify and analyze the implicit capacity of the emerging
employment potent sector and adapt same to stem the tide of the raging unemployment scenario which is
taunted by many as ravaging and threatening the very existence of Africa. Although literature is replete
with works on informal sector’s positive impact on employment generation in Africa, this paper isolates
the implicit nature and character of the informal sector that sustains the capacity that affords the sector
that ability to continually create jobs. It further adds to literature by suggesting some innovative and novel
ideas to sustain the chain-like job creation capacity of the sector, which can, even in the short run, reduce
the pressure of unemployment in Africa. Again, as in Ekong (2014), this paper describes the theoretical
emergence of a third economy (the informal economy), outside the structural dual economic stratification
of traditional (agricultural) and modern (industrial) economies.
The paper is treated in sections thus:
Section 1 – Background
Section 2 – Historical Evolution of the Informal Sector
Section 3 – Emerging Labour Characteristics of African Nations
Section 4 – Theoretical Issues
Section 5 – Poverty, Unemployment, and Inflation in Africa
Section 6 – Conceptual Description of the Capacity of the Informal Sector to Create Jobs
Section 7 – Sustaining Informal sector jobs
Section 8 - Conclusion
2. Historical Evolution of the Informal Sector
This section of the paper is drawn majorly from the work of Ekong (2014). Contemporary economic
development and growth theorizing had been limited in its stratification of the structure of the global
economic system. The Structuralists who had shown more prominence in the stratification procedure
dwells more on dualism as their major basis for stratification. They had all the long stratified economies
into two broad sectors: the traditional (agricultural) sector, and the modern (industrial) sector (Todaro and
Smith, 2009); (Jhingan, 2008).
62
With increase in the activities of the modern (industrial) sector, as in Lewis (1955), surplus labour
from the agricultural sector had started migrating to the modern sector (the Structural growth theory).
With the employment glut in the modern (industrial) sector and capacity issues, firms in the formal sector
were now unable to employ the increasing number of labour that emigrated from the traditional
(agricultural) sector. This might have been occasioned by wage inflexibility and other market inhibiting
factors. Also, given the fact that manpower requirement in the industrial sector must be highly skilled, the
non, low, and semi-skilled labour that emigrated to the industrial sector from the traditional sector
remained unemployable as either their skills did not match existing employment opportunities or that
their marginal product was either zero or less than zero. This situation raised a continuum of
unemployable labour force in the modern sector that was reluctant to return to the agricultural sector,
even though employment opportunities existed for them in the sector. This population started raising the
army of labour that sought after any employable source to make ends meet. Activities in the informal
sector then became their sanctuary.
The dual of the above scenario was also observed in the traditional (agricultural) sector. Active labour
force in the sector that theory refers to as being employed in the traditional sector had started opting for
formal sector jobs. Even those who could not possibly earn those jobs because of their incapacity and
inadequate factor endowment, due largely to peer pressure and eventual oil-based increasing revenue
earnings of Nigeria, which made importation of food to complement the dwindling fortunes of
agricultural production in the country to cover up imminent drop in production, decided to stay away
from engagement in the traditional (agricultural) sector. In many cases, such labour force opted to remain
unemployed, except in the modern sector. With increasing pressure for survival, this group had to resort
to informal sector engagements, even in the traditional (agricultural) sector. This activity kept growing the
ranks of the informal sector. A conundrum, the informal sector, started emerging from the dual ends of
the theoretical divide of global economies.
The reality of the growing and bourgeoning informal sector that arose from the dual economy
theoretical setting was first officially discovered by the ILO mission to Kenya in 1972 by Hans Singer
and Richard. The mission discovered that the traditional sector in Kenya, which they called the informal
sector, included profitable and efficient business enterprises that served as employment reservoir for the
mass of those who were unable to secure employment in the formal sector (Chen, 2004). Notice that the
ILO actually defined informal employment as employment without legal or social protection.
Following from this discovery experts started investigating to understand and bring up more bodies of
knowledge concerning the new experience. Hart (1973) quoted in Chen (2004) coined the term ‘informal
sector’ in his 1971 study of low income activities among unskilled migrants from Northern Ghana to the
capital city, Accra, who could not find wage employment. This corroborates our earlier claim of the
emergence of the informal sector in Nigeria from the two theoretical sectorial dual of modern (industrial)
and traditional (agricultural) sectors.
Lessons from many economies of the world have been indicated to show that informal sector expands
during periods of economic adjustments and economic crises (Tokman, 1984; Lee (1988); Standing
(1999); Rodrik (1997). The argument by these studies indicates that when economic downturn ensues,
firms will retrench and reduce capacity. The workers laid off who cannot find employment in the formal
sector will find alternative in the informal sector. Also, the importance and overwhelming expansive
nature or character of the informal sector confirms the assertion that, informal employment is more than
half of non-agricultural employment in most developed regions and as high as 82% of non-agricultural
employment in South Asia as indicated in the work of Vanek, et al (2012).
Furthermore, De Soto (1989), Loayza (1996) points out that in many countries, especially poor
countries, a heavy burden of taxes, bribes, bureaucratic hassles, as well as labour market restrictions and
inefficient government institutions drives many producers into the informal sector. This is indicative of
the fact that informal sector activities are either not or very loosely supervised by government. There is
therefore no barrier to entry and exit. Using data from 69 countries, Friedman, Johnson, Kaufmann, and
Zoido-Lobaton (2000) adds that costs of bureaucracy and corruption are strongly and positively related to
the size of the informal sector.
63
This paper agrees in full with the definition and classification of the nature of informal sector by Ekpo
and Umoh (2014). They see the informal sector as such which refers to economic activities operated
outside official norms of governmental regulations and that it include a wide range of small scale, largely
self-employed activities. They further classify the nature of the informal sector into:
i. The Informal Productive Sub-sector: comprising all economic activities involving the production
of tangible goods. They include agricultural production, mining and quarrying (excluding
petroleum), small-scale manufacturing, building and construction. Specifically, they manifest in
food production, woodwork, furniture making, garment making, welding and iron works, among
others.
ii. Informal Service Sub-sector: Including repairs and maintenance, informal education services,
health services, counselling services as well as labour for menial work. Repairs and maintenance
services include tailoring, vehicle repairs and maintenance, tinkering, carpentry and servicing of
various household and commercial tools. Informal health services, especially in the rural areas,
include traditional birth attendants, herbalists and other traditional medical practitioners. There are
also traditional spiritualists who offer counselling services. These services are rendered for fees
paid to those who render them.
iii. Informal Financial Sub-sector: Including mostly underground, unofficial, irregular, informal,
shadowy, and parallel. The most predominant type of informal finance in Nigeria is the Esusu.
Among the Yoruba, it is called either Esusu or Ajo. Among the lgbo, it is called lsusu or Utu while
the Edo calls it Osusu. The Hausa call it Adashi', the Nupe Dashi, the Ibibio Etibe, while the
Kalabari call it Oku. Some Esusu groups operate with written laws while others operate with
unwritten laws but on oath of allegiance and mutual trust. The general practice is that esusu
associations contribute a fixed amount periodically and give all or part of the accumulated funds to
one or more member(s) in rotation until all members have benefited from the pool.
There is an emerging development in the Small and Medium Scale Businesses (SMEs) financial
enterprise where we have POS agents (mobile money operators) that engage in money transfer as well as
cash withdrawals, their engagement and activities are well outside the scope of the informal market: as
they are fully registered by the monetary authority to be empowered to transfer money or take payments.
This paper will rather classify them into the SME bracket.
It should, however, be noted here that this paper defines the informal to be distinct from the Small
Scale Enterprises (SSEs), by the fact that they remain unregistered by government, have no legal status,
do not pay taxes, and does not transact any official business with government.
Other specific activities in the informal sector include: Truck pushing, Hawking, Driving, Garbage
collection, roadside mechanics, barbing, hair dressing saloons, small shops, bicycle and motorcycle
repairing, cobbling, shoe shinning, weaving, dye and printing of cloth, casual works with restaurants and
hotels, security guards, day labourers in construction, agriculture, money lending, etc.
3. Emerging Labour Characteristics of African Cities and Nations
An interesting emerging scenario in Africa is the emerging character of economic activities and labour
force type in its major cities. The developing scenario seems to be propelled by the mass rural-urban
migration in Africa, especially by the younger generation. As far back as 1968, C. R. Frank quoted in
Byerlee (1974) in his study on rural-urban migration in Africa had discovered that Africa urban growth
rates are among the highest in the world, averaging 7% annually, with several cities having growth rates
in excess of 10% of the urban labour force which consisted largely of young school leavers. Similarly,
Caldwell (1969), in his study in Ghana drew inference to a fact; that many people saw the rural areas as
representing traditional life while the towns presents new possibilities. This tradition had continued to
date in many African countries, where young people, especially, had always sought to migrate to towns to
experience new possibilities. These movements had created enormous pressure on facilities in the towns.
Very importantly noticeable is that opportunities in the cities are finite and are not elastic enough to
provide employment, shelter, healthcare, education, among others to all migrants. This, therefore, creates
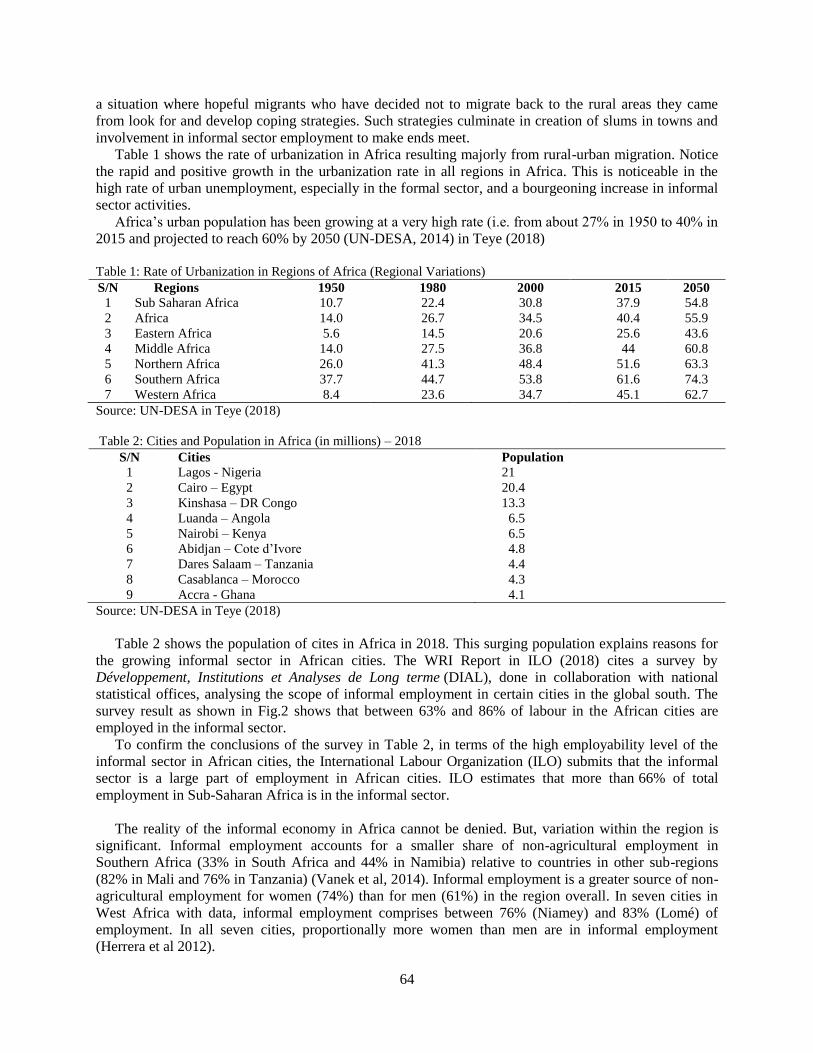
64
a situation where hopeful migrants who have decided not to migrate back to the rural areas they came
from look for and develop coping strategies. Such strategies culminate in creation of slums in towns and
involvement in informal sector employment to make ends meet.
Table 1 shows the rate of urbanization in Africa resulting majorly from rural-urban migration. Notice
the rapid and positive growth in the urbanization rate in all regions in Africa. This is noticeable in the
high rate of urban unemployment, especially in the formal sector, and a bourgeoning increase in informal
sector activities.
Africa’s urban population has been growing at a very high rate (i.e. from about 27% in 1950 to 40% in
2015 and projected to reach 60% by 2050 (UN-DESA, 2014) in Teye (2018)
Table 1: Rate of Urbanization in Regions of Africa (Regional Variations)
S/N Regions 1950 1980 2000 2015 2050
1 Sub Saharan Africa 10.7 22.4 30.8 37.9 54.8
2 Africa 14.0 26.7 34.5 40.4 55.9
3 Eastern Africa 5.6 14.5 20.6 25.6 43.6
4 Middle Africa 14.0 27.5 36.8 44 60.8
5 Northern Africa 26.0 41.3 48.4 51.6 63.3
6 Southern Africa 37.7 44.7 53.8 61.6 74.3
7 Western Africa 8.4 23.6 34.7 45.1 62.7
Source: UN-DESA in Teye (2018)
Table 2: Cities and Population in Africa (in millions) – 2018
S/N Cities Population
1 Lagos - Nigeria 21
2 Cairo – Egypt 20.4
3 Kinshasa – DR Congo 13.3
4 Luanda – Angola 6.5
5 Nairobi – Kenya 6.5
6 Abidjan – Cote d’Ivore 4.8
7 Dares Salaam – Tanzania 4.4
8 Casablanca – Morocco 4.3
9 Accra - Ghana 4.1
Source: UN-DESA in Teye (2018)
Table 2 shows the population of cites in Africa in 2018. This surging population explains reasons for
the growing informal sector in African cities. The WRI Report in ILO (2018) cites a survey by
Développement, Institutions et Analyses de Long terme (DIAL), done in collaboration with national
statistical offices, analysing the scope of informal employment in certain cities in the global south. The
survey result as shown in Fig.2 shows that between 63% and 86% of labour in the African cities are
employed in the informal sector.
To confirm the conclusions of the survey in Table 2, in terms of the high employability level of the
informal sector in African cities, the International Labour Organization (ILO) submits that the informal
sector is a large part of employment in African cities. ILO estimates that more than 66% of total
employment in Sub-Saharan Africa is in the informal sector.
The reality of the informal economy in Africa cannot be denied. But, variation within the region is
significant. Informal employment accounts for a smaller share of non-agricultural employment in
Southern Africa (33% in South Africa and 44% in Namibia) relative to countries in other sub-regions
(82% in Mali and 76% in Tanzania) (Vanek et al, 2014). Informal employment is a greater source of non-
agricultural employment for women (74%) than for men (61%) in the region overall. In seven cities in
West Africa with data, informal employment comprises between 76% (Niamey) and 83% (Lomé) of
employment. In all seven cities, proportionally more women than men are in informal employment
(Herrera et al 2012).
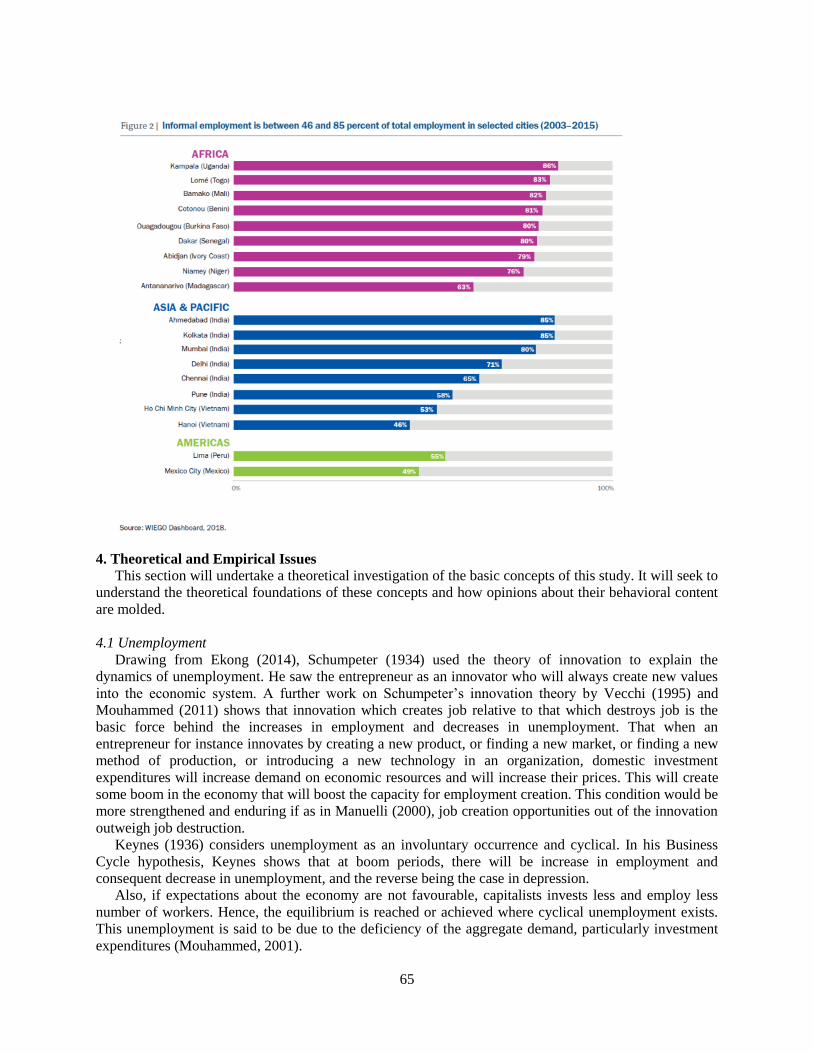
65
4. Theoretical and Empirical Issues
This section will undertake a theoretical investigation of the basic concepts of this study. It will seek to
understand the theoretical foundations of these concepts and how opinions about their behavioral content
are molded.
4.1 Unemployment
Drawing from Ekong (2014), Schumpeter (1934) used the theory of innovation to explain the
dynamics of unemployment. He saw the entrepreneur as an innovator who will always create new values
into the economic system. A further work on Schumpeter’s innovation theory by Vecchi (1995) and
Mouhammed (2011) shows that innovation which creates job relative to that which destroys job is the
basic force behind the increases in employment and decreases in unemployment. That when an
entrepreneur for instance innovates by creating a new product, or finding a new market, or finding a new
method of production, or introducing a new technology in an organization, domestic investment
expenditures will increase demand on economic resources and will increase their prices. This will create
some boom in the economy that will boost the capacity for employment creation. This condition would be
more strengthened and enduring if as in Manuelli (2000), job creation opportunities out of the innovation
outweigh job destruction.
Keynes (1936) considers unemployment as an involuntary occurrence and cyclical. In his Business
Cycle hypothesis, Keynes shows that at boom periods, there will be increase in employment and
consequent decrease in unemployment, and the reverse being the case in depression.
Also, if expectations about the economy are not favourable, capitalists invests less and employ less
number of workers. Hence, the equilibrium is reached or achieved where cyclical unemployment exists.
This unemployment is said to be due to the deficiency of the aggregate demand, particularly investment
expenditures (Mouhammed, 2001).
66
Davidson (1988) argues that involuntary unemployment is explained by inadequacy of effective
demand, instability of exchange rates, and international mobility of finances which create uncertainty that
weakens entrepreneurial confidence to make investments to reduce unemployment. However, other
economists argue that involuntary unemployment is due to contractionary nature of policies (monetary or
fiscal) which creates deficiency in aggregate demand. Also some Keynesians think that the unexpected
increase in price level, or a higher rate of inflation, will reduce the real wage and increase demand for
labour (Mouhammned, 2011).
In another theory showing unemployment in the real business cycle, Chatterjee (1995 and 1999)
argued that the growth of productivity of input which revolutionizes technology is the main source of
employment and unemployment. That is, if the growth of outputs increases more than the growth of
inputs, then total factor productivity has increased. On the contrary, if total factor productivity is not
growing, then the firm and the economy become inefficient. It follows, therefore, that reallocation of
labour and capital cannot be achieved and labour and capital will be used in less profitable opportunities.
If shocks to productivity brought about by technological shocks do not exist, Mouhammed (2011)
concludes that unemployment will rise.
Mouhammed (2011) furthers the productivity argument by considering a standard microeconomic
theory. In this theory, the marginal revenue product (MRP) is given as:
𝑀𝑅𝑃𝐿 = (𝑀𝑅)(𝑀𝑃𝐿)
And the profit maximizing firm will hire workers until MRPL = W, where W = wage rate
It is assumed that the production function is of the form where output (Q) depends on two resources
Labour (L) and all other resources combined as O, and is subject to constant returns to scale, where the
sum of the exponents of L and O is equal to one. It is also assumed that the production function is affected
by the technological level A such that:
𝑄 = 𝐴𝐿𝑎𝑂𝑏 (1)
Differentiating the production function partially with respect to labour yields, we have:
𝑑𝑄
𝑑𝐿= 𝑎𝐴𝐿𝑎−1𝑂𝑏 (2)
Using the marginal product of labour in the MRPL equation to obtain
𝑀𝑅𝑃𝐿 = 𝑀𝑅 × 𝑀𝑃 = 𝑀𝑅 × (𝑎𝐴𝐿𝑎−1𝑂𝑏) (3)
Because,
𝑀𝑃𝐿 = (𝑎𝐴𝐿𝑎−1𝑂𝑏)
The MRPL should be equal to the real wage rate W/P, where P is the price of the product. The MRPL is
equal to the value of the marginal product of labour if MR = P under perfect competition. Under
imperfect competition, the MRPL is smaller than the value of the marginal product, indicating the
existence of labour exploitation. In any event, solving for L, we obtain the employment level.
𝐿 = 𝑎𝑃𝑄𝑊⁄ (4)
Where, PQ represents the GDP. If the numerator and the denominator of the above equation are
divided by L, one can obtain
67
𝐿 = 𝑎𝑃𝑄 𝐿/𝑊/⁄ 𝐿 = 𝑎 (𝑎𝑣𝑒𝑟𝑎𝑔𝑒 𝑝𝑟𝑜𝑑𝑢𝑐𝑡 𝑜𝑓𝑙𝑎𝑏𝑜𝑢𝑟
𝑎𝑣𝑒𝑟𝑎𝑔𝑒 𝑤𝑎𝑔𝑒) (5)
𝐿 = 𝑎 (𝑃𝑄/𝐿)(𝐿/𝑊)
This equation states that if labour productivity (or the average product of labour) increases, assuming
W is constant, the demand for labour, L, will rise, and the unemployment rate will decline. And this shift
(or increase) in the demand for labour can occur, for example, if investment or capital formation
increases. This is because if labour productivity increases relative to wages, the employer or the producer
will increase the firm’s rate of profit by hiring more workers (L).
Arising from the above we can see clearly that under perfect market condition (the kind presented by
the informal economy), the demand for labour reflects labour productivity. Employers will hire workers
up to the point where the value of marginal product (VMPL = MPL x P) is equal to the wage rate.
Contrastingly, under imperfect market condition, where the demand for labour reflects the marginal
revenue product (MRPL = MPL x MRx), where MRx is the marginal revenue, and MRx is lower than the
market price P, it follows that the MRPL is lower than the VMPL. That is, there is exploitation of the
labour force by employers. The second outcome under the imperfect market condition is that the marginal
labour cost will be above the labour supply. When the MRPL intersects the marginal factor cost, the
employment of labour is determined. But this employment level is lower than the level of employment
determined under perfect market condition.
It follows therefore that an economy dominated by large corporations will generate lower level of
employment.
4.2 The Informal Sector
In 1972, an ILO Employment Mission to Kenya first analyzed economic activities outside the formal
economy using the term ‘informal sector’ which had been coined by economist Keith Hart’s previous
study of economic activities in Ghana.
Hart’s (1971) term was taken up rapidly by development studies and by international agencies. In
1972 the ILO, began to codify the definition of informality, particularly keeping in mind the needs of
national statistical authorities in measuring the extent and nature of informality. In 1993, the ILO
provided the following definition for the informal sector. ILO in paragraph 5 of the ILO Report of the
Fifteenth International Conference of Labour Statisticians (1993) defined the informal enterprises “as
private unincorporated enterprises (excluding quasi-corporations), that is, enterprises owned by
individuals or households that are not constituted as separate legal entities independently of their owners,
and for which no complete accounts are available that would permit a financial separation of the
production activities of the enterprise from the other activities of its owner(s). Private unincorporated
enterprises include unincorporated enterprises owned and operated by individual household members or
by several members of the same household, as well as unincorporated partnerships and co-operatives
formed by members of different households, if they lack complete sets of accounts”
The informal sector as an economic reality has been receiving a mixed review in development circles.
Many observers consider the informal sector to be marginal or peripheral and not linked to the formal
sector or to modern capitalist development. Some of these observers believe that the informal sector in
developing countries would disappear once these countries achieved sufficient levels of economic growth
or modern industrial development. Others argue that industrial development might take a different pattern
in developing countries – including the expansion of informal economic activities – than it had in
developed countries (Chen, 2012:1). This conclusion is however not generally and convincingly true.
What we have noticed in Africa is a continuous expansion of the informal sector as the economy grows.
Chen (2004) quoted in Ekong (2014) summarizes the thinking of economists regarding informal sector
into four dominant schools of thought regarding the nature and composition of the informal sector. He
classifies them thus:
68
(i) The Dualist School – In his characterization, Chen (2004) drawing from the key proponents of this
school of thought (Hart: 1973; ILO: 1972; Sethuramann: 1976; Tokman: 1978) shows that the Dualist
School see the informal sector as comprising marginal activities – distinct from and not related to the
formal sector – that provide income for the poor and a safety net in times of crisis. That this arises as a
result of the informal sector operations being excluded from the modern economic opportunities due to
imbalances between the growth rates of the population and of modern industrial employment, as well as a
mismatch between people’s skills and the structure of modern economic opportunities.
The Dualists, Chen (2004) continues, hold strongly to the notion that informal sector activities have
few linkages to the formal sector, but, rather operate as a distinct separate sector of the economy and that
the informal workforce – assumed to be largely self-employed – comprise the less advantaged sector of a
dualistic or segmented labour market. They pay less attention to links between informal enterprises and
government regulations. But, however, recommend that governments should create more jobs and provide
credit and business development services to the informal operators, as well as basic infrastructure and
social services to families.
(ii) The Structuralists School – Summarizing from the works of Moser, 1978; Castells and Portes,
1989; Chen (2004) posits the Structuralists school as microenterprises and workers that serve to reduce
input and labour cost, and thereby increase the competitiveness of large capitalist firms. That the nature of
capitalism growth drives informality – that is, attempts by formal firms to reduce labour costs and
increase competitiveness and the reaction of formal firms to the power of organized labour, State
regulation of the economy; to global competition; and to the process of industrialization.
The Structuralists, Chen (2004) furthers, see the informal and formal economies as intrinsically linked.
That they see both informal enterprises and informal wage workers as subordinated to the interests of
capitalist development, providing cheap goods and services. The structuralists, Chen (2004) further
submits, argue that governments should address the unequal relationship between “big business” and
subordinated producers and workers by regulating both commercial and employment relationships.
(iii) The Legalists School – The Legalists as explained by Chen (2004) argue that a hostile legal
system leads the self-employed to operate informally with their own informal extra-legal norms. The legal
system is said to be so elitist and focused only in serving the formal sector. In many countries, for
example Nigeria, bureaucratic processes required for the registration of enterprises are so elitist that many
informal sector businesses see such as unattainable.
(iv) The Voluntarists – The Voluntarists are of the opinion that informal sector operators choose to
operate informally, after weighing the cost-benefits of informality relative to formality. Voluntarists pay
relatively little attention to the economic linkages between formal and informal firms but subscribe to the
notion that informal enterprises create unfair competition for formal enterprises because they avoid
formal regulations, taxes, and other costs of production.
Notwithstanding the novel classification of the informal sector by Chen (2004), Boswell (1973) had
long argued and classified the sector into three basic stereotypes. However, Boswell’s (1973) work had
been argued to have been more skewed to Small Business that were themselves semi-formal. The three
classifications included: the classical, romantic, and modern stereotypes.
The classical model comes with the simple themes of the entrepreneur; competition and profit
maximization. The model sees the businessman as mixing ownership and control. However, most
contemporary economic analyses have challenged the efficacy of this model, as current trends concentrate
on corporation rather than entrepreneurial management.
The romantic stereotype, Boswell (1973) argues owes much to the classical tradition, by applying
value judgment more vigorously. It concentrates on the small business as a source of economic utility.
The model colours many stories of successful businessmen and company histories, and it infuses much of
the polemical (passionate) literature in defense of small businesses.
The modernistic model views small businesses as being inefficient, traditionalistic and family
determined; that small businesses are generally inimical to progress and professionalism. However, the
conclusions of this model are seen by Clarke (1973) to be half-truths, misunderstanding and unnecessary
generalization of small business activities. The model has a strong preference for large formal firms,
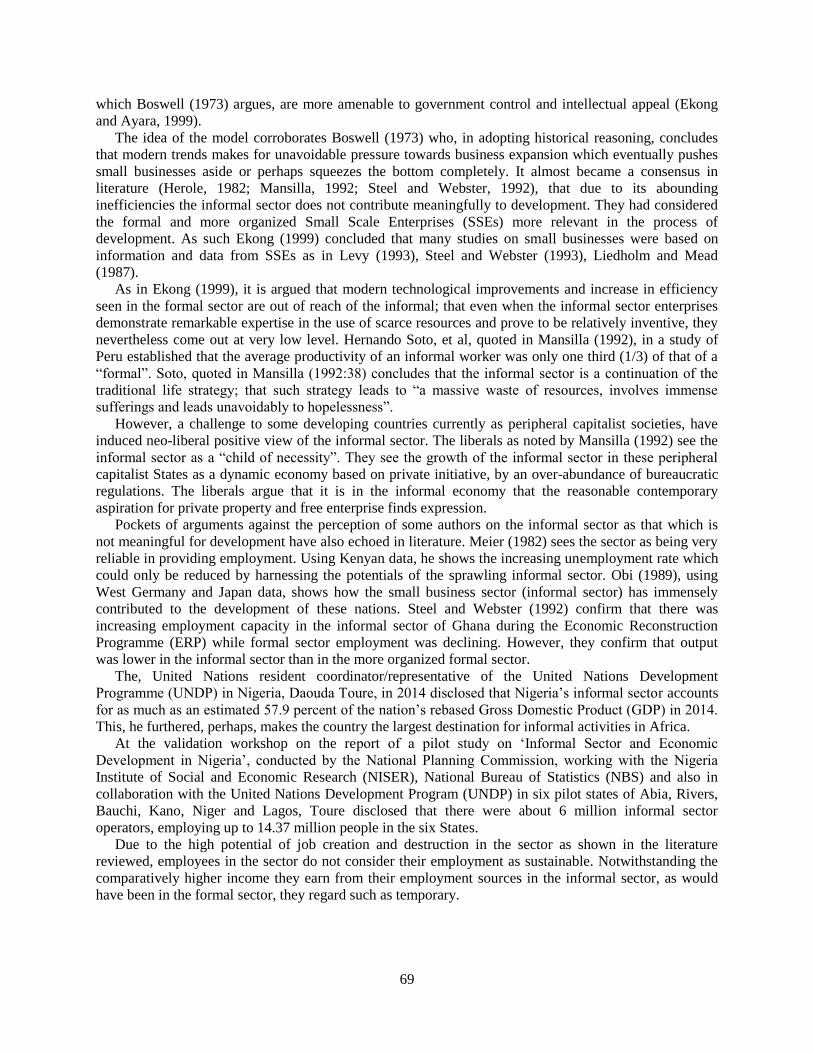
69
which Boswell (1973) argues, are more amenable to government control and intellectual appeal (Ekong
and Ayara, 1999).
The idea of the model corroborates Boswell (1973) who, in adopting historical reasoning, concludes
that modern trends makes for unavoidable pressure towards business expansion which eventually pushes
small businesses aside or perhaps squeezes the bottom completely. It almost became a consensus in
literature (Herole, 1982; Mansilla, 1992; Steel and Webster, 1992), that due to its abounding
inefficiencies the informal sector does not contribute meaningfully to development. They had considered
the formal and more organized Small Scale Enterprises (SSEs) more relevant in the process of
development. As such Ekong (1999) concluded that many studies on small businesses were based on
information and data from SSEs as in Levy (1993), Steel and Webster (1993), Liedholm and Mead
(1987).
As in Ekong (1999), it is argued that modern technological improvements and increase in efficiency
seen in the formal sector are out of reach of the informal; that even when the informal sector enterprises
demonstrate remarkable expertise in the use of scarce resources and prove to be relatively inventive, they
nevertheless come out at very low level. Hernando Soto, et al, quoted in Mansilla (1992), in a study of
Peru established that the average productivity of an informal worker was only one third (1/3) of that of a
“formal”. Soto, quoted in Mansilla (1992:38) concludes that the informal sector is a continuation of the
traditional life strategy; that such strategy leads to “a massive waste of resources, involves immense
sufferings and leads unavoidably to hopelessness”.
However, a challenge to some developing countries currently as peripheral capitalist societies, have
induced neo-liberal positive view of the informal sector. The liberals as noted by Mansilla (1992) see the
informal sector as a “child of necessity”. They see the growth of the informal sector in these peripheral
capitalist States as a dynamic economy based on private initiative, by an over-abundance of bureaucratic
regulations. The liberals argue that it is in the informal economy that the reasonable contemporary
aspiration for private property and free enterprise finds expression.
Pockets of arguments against the perception of some authors on the informal sector as that which is
not meaningful for development have also echoed in literature. Meier (1982) sees the sector as being very
reliable in providing employment. Using Kenyan data, he shows the increasing unemployment rate which
could only be reduced by harnessing the potentials of the sprawling informal sector. Obi (1989), using
West Germany and Japan data, shows how the small business sector (informal sector) has immensely
contributed to the development of these nations. Steel and Webster (1992) confirm that there was
increasing employment capacity in the informal sector of Ghana during the Economic Reconstruction
Programme (ERP) while formal sector employment was declining. However, they confirm that output
was lower in the informal sector than in the more organized formal sector.
The, United Nations resident coordinator/representative of the United Nations Development
Programme (UNDP) in Nigeria, Daouda Toure, in 2014 disclosed that Nigeria’s informal sector accounts
for as much as an estimated 57.9 percent of the nation’s rebased Gross Domestic Product (GDP) in 2014.
This, he furthered, perhaps, makes the country the largest destination for informal activities in Africa.
At the validation workshop on the report of a pilot study on ‘Informal Sector and Economic
Development in Nigeria’, conducted by the National Planning Commission, working with the Nigeria
Institute of Social and Economic Research (NISER), National Bureau of Statistics (NBS) and also in
collaboration with the United Nations Development Program (UNDP) in six pilot states of Abia, Rivers,
Bauchi, Kano, Niger and Lagos, Toure disclosed that there were about 6 million informal sector
operators, employing up to 14.37 million people in the six States.
Due to the high potential of job creation and destruction in the sector as shown in the literature
reviewed, employees in the sector do not consider their employment as sustainable. Notwithstanding the
comparatively higher income they earn from their employment sources in the informal sector, as would
have been in the formal sector, they regard such as temporary.
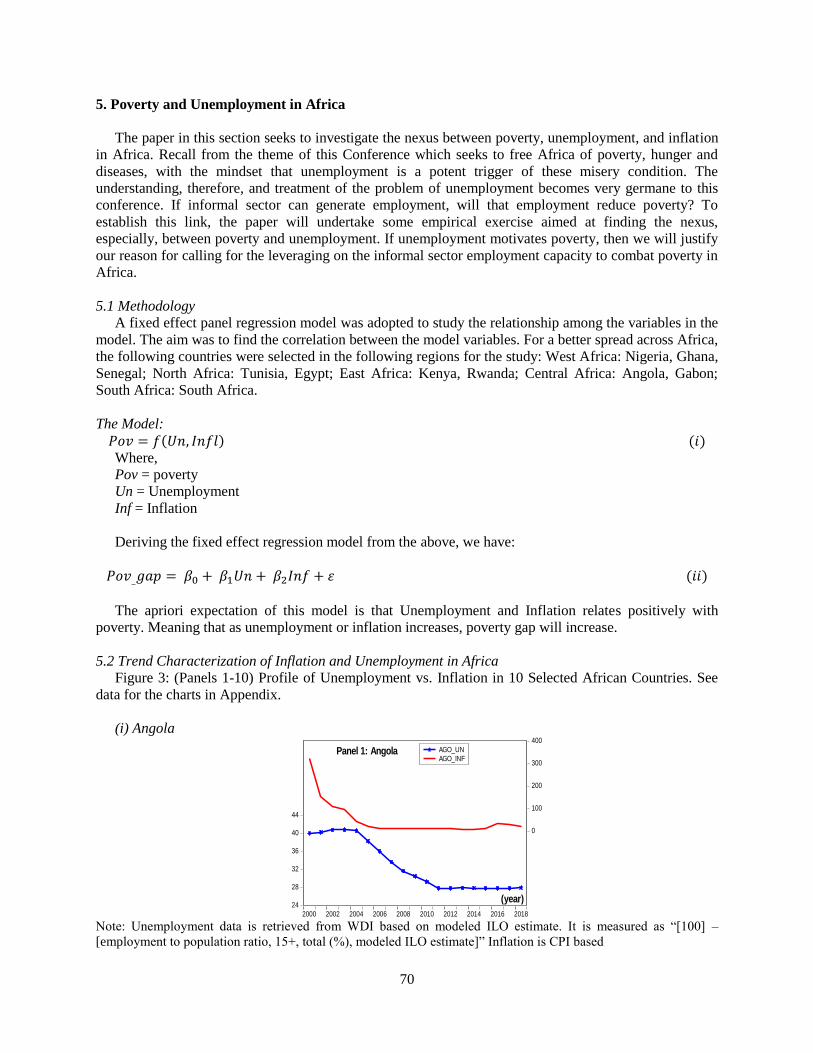
70
5. Poverty and Unemployment in Africa
The paper in this section seeks to investigate the nexus between poverty, unemployment, and inflation
in Africa. Recall from the theme of this Conference which seeks to free Africa of poverty, hunger and
diseases, with the mindset that unemployment is a potent trigger of these misery condition. The
understanding, therefore, and treatment of the problem of unemployment becomes very germane to this
conference. If informal sector can generate employment, will that employment reduce poverty? To
establish this link, the paper will undertake some empirical exercise aimed at finding the nexus,
especially, between poverty and unemployment. If unemployment motivates poverty, then we will justify
our reason for calling for the leveraging on the informal sector employment capacity to combat poverty in
Africa.
5.1 Methodology
A fixed effect panel regression model was adopted to study the relationship among the variables in the
model. The aim was to find the correlation between the model variables. For a better spread across Africa,
the following countries were selected in the following regions for the study: West Africa: Nigeria, Ghana,
Senegal; North Africa: Tunisia, Egypt; East Africa: Kenya, Rwanda; Central Africa: Angola, Gabon;
South Africa: South Africa.
The Model:
𝑃𝑜𝑣 = 𝑓(𝑈𝑛, 𝐼𝑛𝑓𝑙) (𝑖)
Where,
Pov = poverty
Un = Unemployment
Inf = Inflation
Deriving the fixed effect regression model from the above, we have:
𝑃𝑜𝑣_𝑔𝑎𝑝 = 𝛽0 + 𝛽1𝑈𝑛 + 𝛽2𝐼𝑛𝑓 + 𝜀 (𝑖𝑖)
The apriori expectation of this model is that Unemployment and Inflation relates positively with
poverty. Meaning that as unemployment or inflation increases, poverty gap will increase.
5.2 Trend Characterization of Inflation and Unemployment in Africa
Figure 3: (Panels 1-10) Profile of Unemployment vs. Inflation in 10 Selected African Countries. See
data for the charts in Appendix.
(i) Angola
Note: Unemployment data is retrieved from WDI based on modeled ILO estimate. It is measured as “[100] –
[employment to population ratio, 15+, total (%), modeled ILO estimate]” Inflation is CPI based
24
28
32
36
40
44
0
100
200
300
400
2000 2002 2004 2006 2008 2010 2012 2014 2016 2018
AGO_UN
AGO_INFPanel 1: Angola
(year)
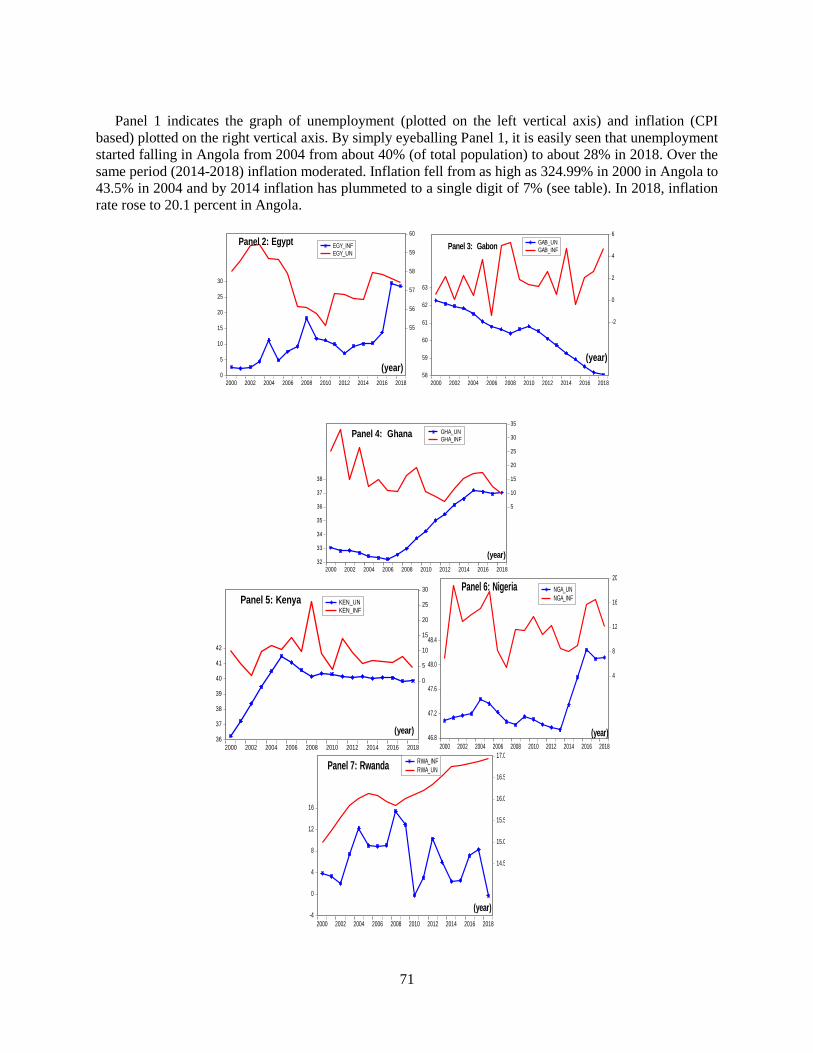
71
Panel 1 indicates the graph of unemployment (plotted on the left vertical axis) and inflation (CPI
based) plotted on the right vertical axis. By simply eyeballing Panel 1, it is easily seen that unemployment
started falling in Angola from 2004 from about 40% (of total population) to about 28% in 2018. Over the
same period (2014-2018) inflation moderated. Inflation fell from as high as 324.99% in 2000 in Angola to
43.5% in 2004 and by 2014 inflation has plummeted to a single digit of 7% (see table). In 2018, inflation
rate rose to 20.1 percent in Angola.
0
5
10
15
20
25
30
55
56
57
58
59
60
2000 2002 2004 2006 2008 2010 2012 2014 2016 2018
EGY_INF
EGY_UN
Panel 2: Egypt
(year)58
59
60
61
62
63
-2
0
2
4
6
2000 2002 2004 2006 2008 2010 2012 2014 2016 2018
GAB_UN
GAB_INFPanel 3: Gabon
(year)
32
33
34
35
36
37
38
5
10
15
20
25
30
35
2000 2002 2004 2006 2008 2010 2012 2014 2016 2018
GHA_UN
GHA_INFPanel 4: Ghana
(year)
36
37
38
39
40
41
42
0
5
10
15
20
25
30
2000 2002 2004 2006 2008 2010 2012 2014 2016 2018
KEN_UN
KEN_INF
Panel 5: Kenya
(year)46.8
47.2
47.6
48.0
48.4
4
8
12
16
20
2000 2002 2004 2006 2008 2010 2012 2014 2016 2018
NGA_UN
NGA_INF
Panel 6: Nigeria
(year)
-4
0
4
8
12
16
14.5
15.0
15.5
16.0
16.5
17.0
2000 2002 2004 2006 2008 2010 2012 2014 2016 2018
RWA_INF
RWA_UNPanel 7: Rwanda
(year)
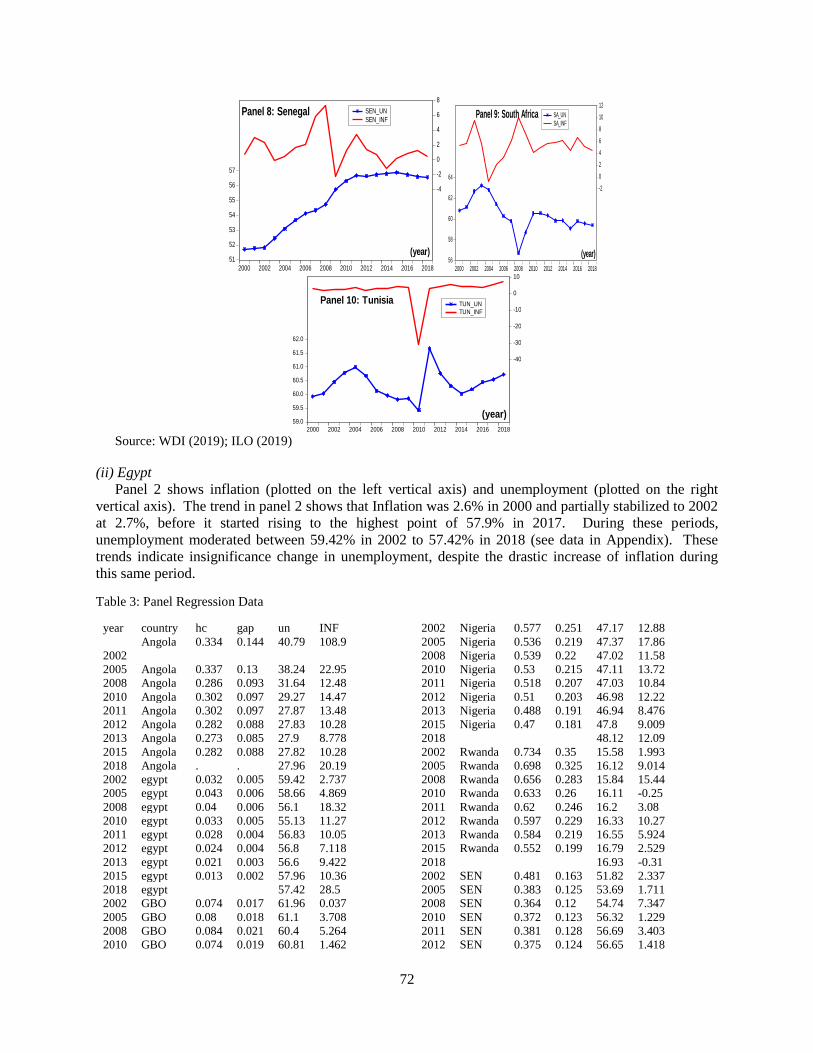
72
Source: WDI (2019); ILO (2019)
(ii) Egypt
Panel 2 shows inflation (plotted on the left vertical axis) and unemployment (plotted on the right
vertical axis). The trend in panel 2 shows that Inflation was 2.6% in 2000 and partially stabilized to 2002
at 2.7%, before it started rising to the highest point of 57.9% in 2017. During these periods,
unemployment moderated between 59.42% in 2002 to 57.42% in 2018 (see data in Appendix). These
trends indicate insignificance change in unemployment, despite the drastic increase of inflation during
this same period.
Table 3: Panel Regression Data
year country hc gap un INF
2002
Angola 0.334 0.144 40.79 108.9
2005 Angola 0.337 0.13 38.24 22.95
2008 Angola 0.286 0.093 31.64 12.48
2010 Angola 0.302 0.097 29.27 14.47
2011 Angola 0.302 0.097 27.87 13.48
2012 Angola 0.282 0.088 27.83 10.28
2013 Angola 0.273 0.085 27.9 8.778
2015 Angola 0.282 0.088 27.82 10.28
2018 Angola . . 27.96 20.19
2002 egypt 0.032 0.005 59.42 2.737
2005 egypt 0.043 0.006 58.66 4.869
2008 egypt 0.04 0.006 56.1 18.32
2010 egypt 0.033 0.005 55.13 11.27
2011 egypt 0.028 0.004 56.83 10.05
2012 egypt 0.024 0.004 56.8 7.118
2013 egypt 0.021 0.003 56.6 9.422
2015 egypt 0.013 0.002 57.96 10.36
2018 egypt 57.42 28.5
2002 GBO 0.074 0.017 61.96 0.037
2005 GBO 0.08 0.018 61.1 3.708
2008 GBO 0.084 0.021 60.4 5.264
2010 GBO 0.074 0.019 60.81 1.462
2002 Nigeria 0.577 0.251 47.17 12.88
2005 Nigeria 0.536 0.219 47.37 17.86
2008 Nigeria 0.539 0.22 47.02 11.58
2010 Nigeria 0.53 0.215 47.11 13.72
2011 Nigeria 0.518 0.207 47.03 10.84
2012 Nigeria 0.51 0.203 46.98 12.22
2013 Nigeria 0.488 0.191 46.94 8.476
2015 Nigeria 0.47 0.181 47.8 9.009
2018 48.12 12.09
2002 Rwanda 0.734 0.35 15.58 1.993
2005 Rwanda 0.698 0.325 16.12 9.014
2008 Rwanda 0.656 0.283 15.84 15.44
2010 Rwanda 0.633 0.26 16.11 -0.25
2011 Rwanda 0.62 0.246 16.2 3.08
2012 Rwanda 0.597 0.229 16.33 10.27
2013 Rwanda 0.584 0.219 16.55 5.924
2015 Rwanda 0.552 0.199 16.79 2.529
2018 16.93 -0.31
2002 SEN 0.481 0.163 51.82 2.337
2005 SEN 0.383 0.125 53.69 1.711
2008 SEN 0.364 0.12 54.74 7.347
2010 SEN 0.372 0.123 56.32 1.229
2011 SEN 0.381 0.128 56.69 3.403
2012 SEN 0.375 0.124 56.65 1.418
51
52
53
54
55
56
57
-4
-2
0
2
4
6
8
2000 2002 2004 2006 2008 2010 2012 2014 2016 2018
SEN_UN
SEN_INFPanel 8: Senegal
(year)56
58
60
62
64
-2
0
2
4
6
8
10
12
2000 2002 2004 2006 2008 2010 2012 2014 2016 2018
SA_UN
SA_INFPanel 9: South Africa
(year)
59.0
59.5
60.0
60.5
61.0
61.5
62.0
-40
-30
-20
-10
0
10
2000 2002 2004 2006 2008 2010 2012 2014 2016 2018
TUN_UN
TUN_INF
Panel 10: Tunisia
(year)
73
2011 GBO 0.063 0.016 60.54 1.263
2012 GBO 0.057 0.014 60.12 2.652
2013 GBO 0.05 0.012 59.75 0.505
2015 GBO 0.04 0.01 58.94 -0.34
2018 58.06 4.749
2002 Ghana 0.312 0.107 32.86 14.82
2005 Ghana 0.258 0.087 32.33 15.12
2008 Ghana 0.214 0.068 32.99 16.52
2010 Ghana 0.187 0.057 34.25 10.71
2011 Ghana 0.15 0.045 35.03 8.727
2012 Ghana 0.131 0.038 35.47 7.126
2013 Ghana 0.119 0.035 36.16 11.67
2015 Ghana 0.132 0.043 37.22 17.15
2018 37.05 9.837
2002 Kenya 0.417 0.151 38.4 1.961
2005 Kenya 0.439 0.163 41.5 10.31
2008 Kenya 0.421 0.151 40.17 26.24
2010 Kenya 0.407 0.142 40.32 3.961
2011 Kenya 0.4 0.137 40.16 14.02
2012 Kenya 0.394 0.133 40.09 9.378
2013 Kenya 0.387 0.128 40.17 5.717
2015 Kenya 0.373 0.119 40.1 6.582
2018 39.87 4.69
2013 SEN 0.375 0.125 56.74 0.71
2015 SEN 0.339 0.109 56.9 0.135
2018 56.57 0.456
2002 SA 0.337 0.121 62.68 9.495
2005 SA 0.261 0.084 61.46 2.063
2008 SA 0.174 0.05 56.74 10.06
2010 SA 0.165 0.049 60.57 4.064
2011 SA 0.167 0.05 60.59 5.017
2012 SA 0.172 0.053 60.36 5.724
2013 SA 0.176 0.056 59.85 5.776
2015 SA 0.189 0.062 59.1 4.509
2018 59.44 4.505
2002 TUN 0.049 0.01 60.46 2.721
2005 TUN 0.035 0.007 60.69 2.018
2008 TUN 0.026 0.005 59.81 4.345
2010 TUN 0.021 0.004 59.43 -30.9
2011 TUN 0.019 0.004 61.67 3.24
2012 TUN 0.014 0.003 60.77 4.612
2013 TUN 0.009 0.002 60.32 5.316
2015 TUN 0.004 6E-
04
60.19 4.437
2018 60.73 7.308
Source: ILO (2019); WDI (2019); World Bank PovCalNet (2019)
(iii) Gabon
Unemployment – Inflation trend for Gabon is as shown in panel 3. Unemployment is plotted from left
to right, while Inflation is plotted from right to left. The graph for Unemployment for the periods under
review shows a continuous, but moderate reduction from 61.96% in 2002 to 58.06% in 2018. Inflation
during the same periods stood at 0.037% in 2002 to 4.749% in 2018. However, within these periods
(2000 – 2018), inflation fluctuate between -1.5% in 2006 being the least to 5.264% in 2008 being the
highest in Gabon.
(iv) Ghana
Panel 4 indicates Ghana’s unemployment graph on the left hand side and inflation on the right hand
side. The graph shows a moderate reduction in unemployment from 33.1% in 2000 to 32.1% in 2006.
Unemployment skyrocketed from 32.5% in 2007 to 37.22% in 2015, after which it stabilizes within 37%
in the remaining periods. Inflation in Ghana was as high as 33.15% in 2001 but dropped drastically to
14.82% the following year (2002). In 2018, Ghana inflation dropped to a single digit of 9.837%. It is
however, noted that despite the reduction in inflation in Ghana, unemployment in Ghana has been
increasing.
(v) Kenya
In panel 5, it is observed that unemployment for Kenya, which is plotted from left to right skyrocketed
from 36.1% of the total population to 41.5% in 2005 after which it shows a slight reduction to 40.17% in
2008. Between 2008 and 2015, unemployment fluctuates a little above 40% (see data in Appendix).
Inflation in Kenya, which is plotted in the right hand side in panel 5; within these same periods witnesses
a serious fluctuation. Inflation rose from 1.961% in 2002 to the highest point of 26.24% in 2008, after
which shows a drastic reduction to a single digit of 3.961% in 2010. Inflation in Kenya however finally
settled at 4.69% in 2018.
(vi) Nigeria
Panel 6 indicates the case of Nigeria, were unemployment and inflation are plotted from left to right
and right to left respectively. Unemployment in Nigeria stood at 47% in 2000 later stabilized a little
above 47% between 2002 and 2011, with an insignificance reduction in unemployment to 46.9% in 2012
and 2013. Unemployment in Nigeria however, witnesses a further increase between 2015 and 2018 with
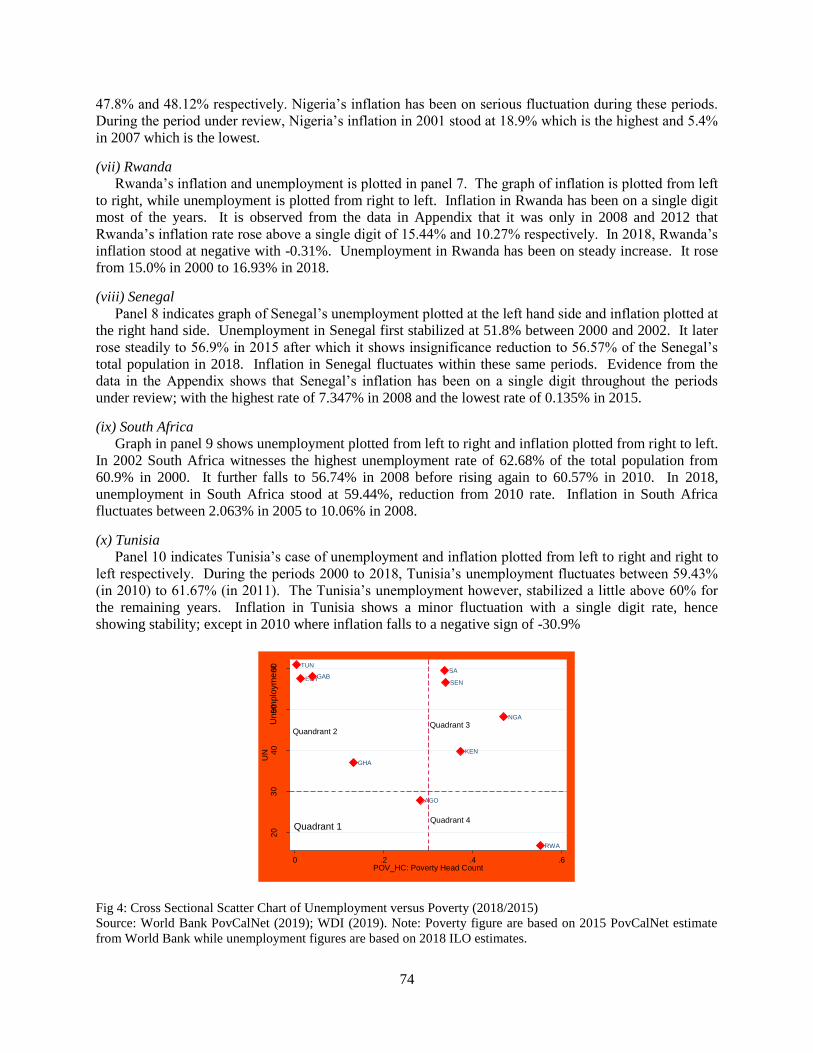
74
47.8% and 48.12% respectively. Nigeria’s inflation has been on serious fluctuation during these periods.
During the period under review, Nigeria’s inflation in 2001 stood at 18.9% which is the highest and 5.4%
in 2007 which is the lowest.
(vii) Rwanda
Rwanda’s inflation and unemployment is plotted in panel 7. The graph of inflation is plotted from left
to right, while unemployment is plotted from right to left. Inflation in Rwanda has been on a single digit
most of the years. It is observed from the data in Appendix that it was only in 2008 and 2012 that
Rwanda’s inflation rate rose above a single digit of 15.44% and 10.27% respectively. In 2018, Rwanda’s
inflation stood at negative with -0.31%. Unemployment in Rwanda has been on steady increase. It rose
from 15.0% in 2000 to 16.93% in 2018.
(viii) Senegal
Panel 8 indicates graph of Senegal’s unemployment plotted at the left hand side and inflation plotted at
the right hand side. Unemployment in Senegal first stabilized at 51.8% between 2000 and 2002. It later
rose steadily to 56.9% in 2015 after which it shows insignificance reduction to 56.57% of the Senegal’s
total population in 2018. Inflation in Senegal fluctuates within these same periods. Evidence from the
data in the Appendix shows that Senegal’s inflation has been on a single digit throughout the periods
under review; with the highest rate of 7.347% in 2008 and the lowest rate of 0.135% in 2015.
(ix) South Africa
Graph in panel 9 shows unemployment plotted from left to right and inflation plotted from right to left.
In 2002 South Africa witnesses the highest unemployment rate of 62.68% of the total population from
60.9% in 2000. It further falls to 56.74% in 2008 before rising again to 60.57% in 2010. In 2018,
unemployment in South Africa stood at 59.44%, reduction from 2010 rate. Inflation in South Africa
fluctuates between 2.063% in 2005 to 10.06% in 2008.
(x) Tunisia
Panel 10 indicates Tunisia’s case of unemployment and inflation plotted from left to right and right to
left respectively. During the periods 2000 to 2018, Tunisia’s unemployment fluctuates between 59.43%
(in 2010) to 61.67% (in 2011). The Tunisia’s unemployment however, stabilized a little above 60% for
the remaining years. Inflation in Tunisia shows a minor fluctuation with a single digit rate, hence
showing stability; except in 2010 where inflation falls to a negative sign of -30.9%
Fig 4: Cross Sectional Scatter Chart of Unemployment versus Poverty (2018/2015)
Source: World Bank PovCalNet (2019); WDI (2019). Note: Poverty figure are based on 2015 PovCalNet estimate
from World Bank while unemployment figures are based on 2018 ILO estimates.
AGO
EGYGAB
GHA
KEN
NGA
RWA
SEN
SATUN
Un
em
plo
ym
ent
Quadrant 1
Quandrant 2Quadrant 3
Quadrant 4
20
30
40
50
60
UN
0 .2 .4 .6POV_HC: Poverty Head Count
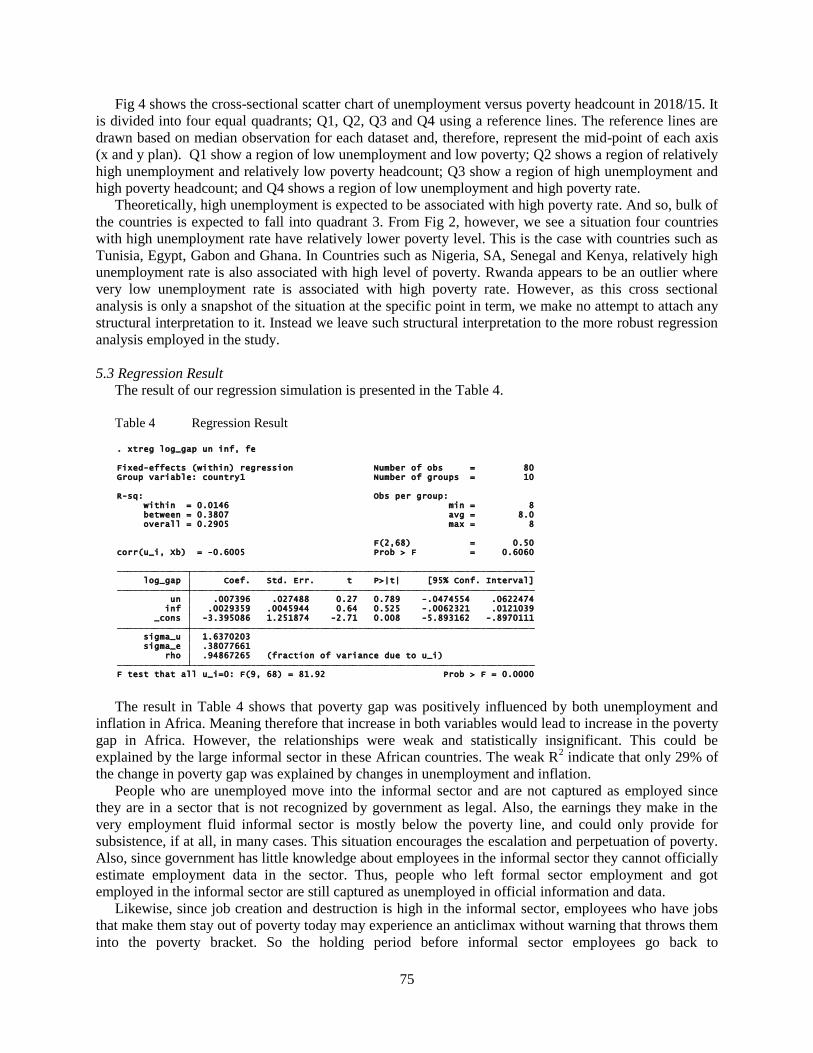
75
Fig 4 shows the cross-sectional scatter chart of unemployment versus poverty headcount in 2018/15. It
is divided into four equal quadrants; Q1, Q2, Q3 and Q4 using a reference lines. The reference lines are
drawn based on median observation for each dataset and, therefore, represent the mid-point of each axis
(x and y plan). Q1 show a region of low unemployment and low poverty; Q2 shows a region of relatively
high unemployment and relatively low poverty headcount; Q3 show a region of high unemployment and
high poverty headcount; and Q4 shows a region of low unemployment and high poverty rate.
Theoretically, high unemployment is expected to be associated with high poverty rate. And so, bulk of
the countries is expected to fall into quadrant 3. From Fig 2, however, we see a situation four countries
with high unemployment rate have relatively lower poverty level. This is the case with countries such as
Tunisia, Egypt, Gabon and Ghana. In Countries such as Nigeria, SA, Senegal and Kenya, relatively high
unemployment rate is also associated with high level of poverty. Rwanda appears to be an outlier where
very low unemployment rate is associated with high poverty rate. However, as this cross sectional
analysis is only a snapshot of the situation at the specific point in term, we make no attempt to attach any
structural interpretation to it. Instead we leave such structural interpretation to the more robust regression
analysis employed in the study.
5.3 Regression Result
The result of our regression simulation is presented in the Table 4.
Table 4 Regression Result
The result in Table 4 shows that poverty gap was positively influenced by both unemployment and
inflation in Africa. Meaning therefore that increase in both variables would lead to increase in the poverty
gap in Africa. However, the relationships were weak and statistically insignificant. This could be
explained by the large informal sector in these African countries. The weak R2 indicate that only 29% of
the change in poverty gap was explained by changes in unemployment and inflation.
People who are unemployed move into the informal sector and are not captured as employed since
they are in a sector that is not recognized by government as legal. Also, the earnings they make in the
very employment fluid informal sector is mostly below the poverty line, and could only provide for
subsistence, if at all, in many cases. This situation encourages the escalation and perpetuation of poverty.
Also, since government has little knowledge about employees in the informal sector they cannot officially
estimate employment data in the sector. Thus, people who left formal sector employment and got
employed in the informal sector are still captured as unemployed in official information and data.
Likewise, since job creation and destruction is high in the informal sector, employees who have jobs
that make them stay out of poverty today may experience an anticlimax without warning that throws them
into the poverty bracket. So the holding period before informal sector employees go back to
F test that all u_i=0: F(9, 68) = 81.92 Prob > F = 0.0000 rho .94867265 (fraction of variance due to u_i) sigma_e .38077661 sigma_u 1.6370203 _cons -3.395086 1.251874 -2.71 0.008 -5.893162 -.8970111 inf .0029359 .0045944 0.64 0.525 -.0062321 .0121039 un .007396 .027488 0.27 0.789 -.0474554 .0622474 log_gap Coef. Std. Err. t P>|t| [95% Conf. Interval]
corr(u_i, Xb) = -0.6005 Prob > F = 0.6060 F(2,68) = 0.50
overall = 0.2905 max = 8 between = 0.3807 avg = 8.0 within = 0.0146 min = 8R-sq: Obs per group:
Group variable: country1 Number of groups = 10Fixed-effects (within) regression Number of obs = 80
. xtreg log_gap un inf, fe
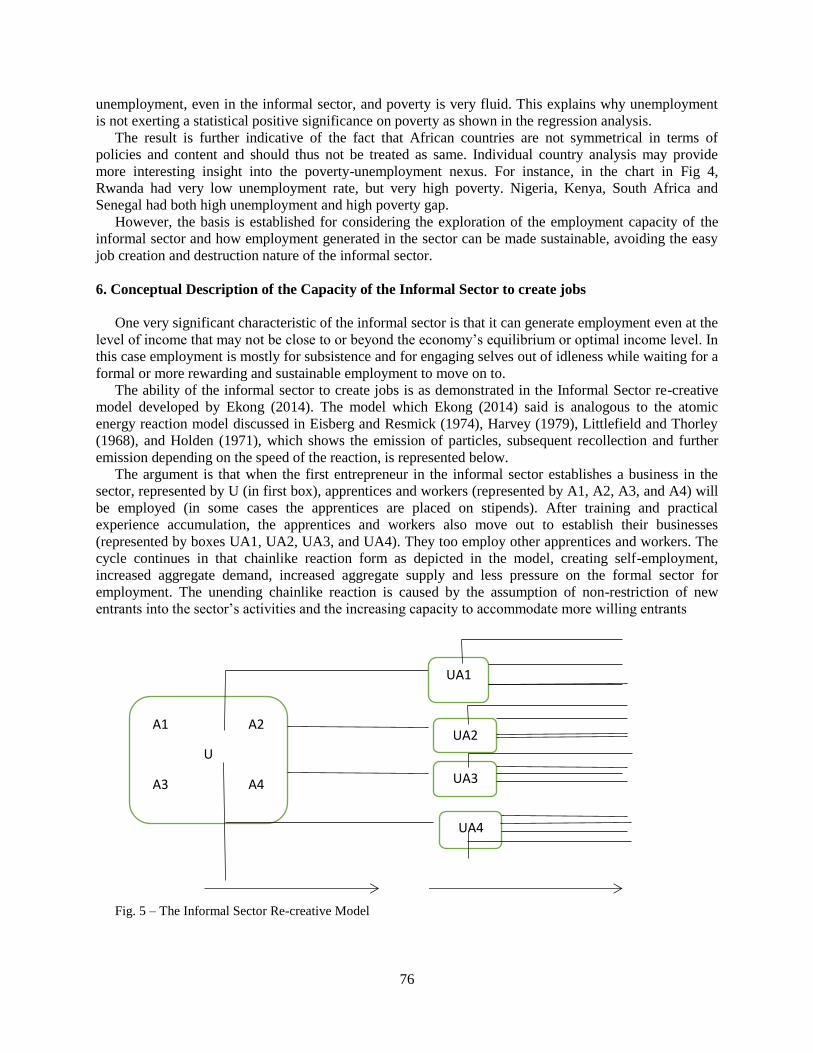
76
unemployment, even in the informal sector, and poverty is very fluid. This explains why unemployment
is not exerting a statistical positive significance on poverty as shown in the regression analysis.
The result is further indicative of the fact that African countries are not symmetrical in terms of
policies and content and should thus not be treated as same. Individual country analysis may provide
more interesting insight into the poverty-unemployment nexus. For instance, in the chart in Fig 4,
Rwanda had very low unemployment rate, but very high poverty. Nigeria, Kenya, South Africa and
Senegal had both high unemployment and high poverty gap.
However, the basis is established for considering the exploration of the employment capacity of the
informal sector and how employment generated in the sector can be made sustainable, avoiding the easy
job creation and destruction nature of the informal sector.
6. Conceptual Description of the Capacity of the Informal Sector to create jobs
One very significant characteristic of the informal sector is that it can generate employment even at the
level of income that may not be close to or beyond the economy’s equilibrium or optimal income level. In
this case employment is mostly for subsistence and for engaging selves out of idleness while waiting for a
formal or more rewarding and sustainable employment to move on to.
The ability of the informal sector to create jobs is as demonstrated in the Informal Sector re-creative
model developed by Ekong (2014). The model which Ekong (2014) said is analogous to the atomic
energy reaction model discussed in Eisberg and Resmick (1974), Harvey (1979), Littlefield and Thorley
(1968), and Holden (1971), which shows the emission of particles, subsequent recollection and further
emission depending on the speed of the reaction, is represented below.
The argument is that when the first entrepreneur in the informal sector establishes a business in the
sector, represented by U (in first box), apprentices and workers (represented by A1, A2, A3, and A4) will
be employed (in some cases the apprentices are placed on stipends). After training and practical
experience accumulation, the apprentices and workers also move out to establish their businesses
(represented by boxes UA1, UA2, UA3, and UA4). They too employ other apprentices and workers. The
cycle continues in that chainlike reaction form as depicted in the model, creating self-employment,
increased aggregate demand, increased aggregate supply and less pressure on the formal sector for
employment. The unending chainlike reaction is caused by the assumption of non-restriction of new
entrants into the sector’s activities and the increasing capacity to accommodate more willing entrants
Fig. 5 – The Informal Sector Re-creative Model
A1 A2
U
A3 A4
UA1
UA2
UA3
UA4
77
7. Why Informal Sector Jobs are not seen as employment in Africa
It is interesting to note that in many African countries, jobs in the informal sector, and even small scale
enterprises sectors are not regarded as employment. It is often noticed where employees in the informal
sector pass selves as unemployed and will seek any opportunity to get formal sector jobs. Cases abound
around this. A case in point: a young Nigerian graduate who as a result of unemployment decided to be
entrepreneurial by owning and driving a cab. He made a net earnings of sixty thousand naira (N60,000) a
week, meaning that he earn two hundred and forty thousand naira (N240,000) a month from the driving
trade. He interestingly opted to have a formal job that will only pay forty thousand naira (N40,000) a
month, instead of the cab business. This decision set is varied all over Africa. The paper will attempt here
to suggest reasons for the occurrence of this scenario. .
This paper adduces the following as reasons to why informal sector jobs are not seen as or considered
employment in Africa.
i. Unsustainability and Uncertainty
Jobs are easily created and so easily destroyed. Unsustainability of employment creates an
atmosphere of uncertainty that exposes the informal sector worker to the hazard and uncertainty of
securing the current job and therefore creating a situation of inability to plan for the future. For
instance a mason may not always find job after completing the one he had on hand.
ii. No protection from Government
Since their activities are assumed to be illegal, government has no plan or policies to protect
activities in the sector. Rather government policies are in the main to destroy them. This forces
operators of the sector to go more underground. The cost of such wane their activities and in many
causes them to easily loose investment, thus destroying jobs. For example, the illegal oil refineries
in the Niger Delta of Nigeria that was said to have created enormous jobs for youths in the area,
thus insulating reactions from the post-restiveness era, once destroyed by government recently had
raised fresh issues including job destruction, uncertainty, and unsustainability of employment in
the sector.
iii. No access to Formal Credit Sources
Inability of informal sector actors to access formal credit sources condemns them to the vicious
cycle of smallness and easy extinction. Also, when they seek to source credit from the informal
sources, they end up paying exorbitant interests that easily kills their businesses.
iv. No Official Registration
Most of the operations of the informal sector business are underground and they mostly evade
registration to be officially recognized by the government. Therefore, they stand a great risk of
losing their investment to regulatory agencies at any point in time. This will immediately send
them out of employment.
v. Multiple Tax Policies
Efforts by African governments to deepen their tax base have made them to start focusing on the
informal sector for purposes of increasing tax revenues. This creates a situation where the informal
sector businesses are taxed in multiple. Such tax policies easily leads to situations where
businesses in the sector are decimated, driving them out of the employment so easily.
vi. Erratic Wage Structure and Earnings
The wage structure and earnings in the informal sector is so chaotic and uncoordinated. There are
no uniformity in earnings and no guarantee that what you earn today will be the same the next day.
This, however, posits a closer and real picture of market mechanism. Erratic wages and earnings
ensues uncertainty and inability to plan. As such workers in the sector are not comfortable and
guaranteed of a future; making them see current employment source as quite temporary.
vii. Chaotic Work Environment Organization
The work environment and organization in the informal sector setting is such that breeds an
environment of confusion and chaos. No one cares to keep a good environment and work culture
because activities are seen to be temporary. That since they are not recognized by
78
viii. No Responsible Response to Need for Knowledge and Changing Technology
Also noticed in Africa’s informal sector is that many operators do not worry about responding to
changing technology. Many see technology and changes as waste of time which is introducing
new inferior bundles that will not stay in the market. They give this excuse in order to continue in
their old ways of doing things. Auto mechanics, for instance see the use of diagnosing equipment
as not as good as the rule of thumb or trial by error to identify faults in cars. Once these
practitioners refuse to upscale their technical knowledge, they get locked out of the market.
8. Sustaining Informal Sector Jobs
In order to take advantage of the inherent capacity of the informal sector to generate employment,
certain specific activities must be undertaken. In this section, the paper will discuss strategies to harness
and enhance the capacity of the informal sector to raise sustainable employment, deriving from the
problems identified and highlighted earlier in the paper. These strategies are thus presented.
8.1 Pension contributions should be encouraged in the informal sector
This work has brought to the fore the clear observation of uncertainty and unsustainability in the
informal sector employment market. The uncertainty and unsustainability has been identified to be caused
by the high frequency at which employment is created and destroyed in the sector. Meaning, for example,
that in a year an employee in the sector may stay unemployed for less than half of the period. If this
happens, such employees will never see jobs in the sector as employment which they can build a career
on. They would rather be hanging on jobs in the sector waiting for an opportunity where they can access
jobs in the formal sector, where some level of sustainability and certainty is guaranteed. To reverse this
trend, this paper suggests that government should take interest in this sector by establishing a non-
cumbersome Pension Scheme for the sector. The scheme should be organized such that practitioners and
employees in the sector contribute to the fund while they are employed. When they lose their jobs or lose
out of business in the sector, the Pension should sustain with periodical sustainable allowances till they
are able to get new jobs.
If this suggestion is established and sustained, practitioners and employees in the informal sector will
see their jobs as employment and will input their best to develop the capacity of their investments and
knowledge, which will go a long in up scaling the productivity of the sector and strengthening further its
contribution to the entire economy.
8.2 Government should set up informal activities clusters in Regions of the Countries
To better organize businesses and activities in the informal sector in Africa, the paper suggests that
government should show more than a cursory interest in its organization to position it well to benefit the
entire economy. The interesting scenario about the sector is that once government shows direction, the
system will run itself, because of the laissez faire nature of the informal sector.
The paper suggests that African governments should set up clusters of different kinds of trade in the
informal sector in its urban and rural regional centers. In centers that have automobile mechanics, for
instance automobile mechanic village clusters, there should be automobile diagnostic shops, mechanical
work centers, electrical work centers, panel works centers, a training academy, spare parts fabrication
unit, among others.
A similar conception could be activated for other trades in the sector. This will encourage
inclusiveness, specialization, and complementarity, which are key growth drivers.
8.3 Government should build technical training academies
Technical training academies which are not targeted at too rigorous academics but more at technical
knowledge should be established. Such academies should not be taken away from where the trade is
practiced. For example, academies to train auto mechanics should be located in the mechanic villages or
clusters; that of tailors should be hosted in tailoring clusters, etc.
79
8.4 Eradication of Multiple-Taxation in the Sector
Even from the theoretical reasoning that we have brought up in this paper, some experts in the area
have insisted that the main causative factor that has led to the perpetuation of the informal economy is
taxes. Those businesses will always tend to evade high taxes to operate in the informal or underground
economy where they hide from government tax. It is however, discovered recently in developing
countries that the informal sector no longer totally hide from taxation. In Nigeria, for example, the Local
Governments who are so close to the activities of the informal sector had taken that advantage of taxing
businesses in the sector out business. In many cases, taxes had been multiple: involving community,
Local Governments, State Governments, and Federal Government. If such taxes are harmonized and
reduced, businesses in the sector will make more profit and investment for expansion and acquisition of
more experience to leap into formality.
9. Conclusion
This paper draws its inspiration from the theme of the Conference which expresses serious concern
about unemployment in Africa and how it is exacerbating and deepening poverty and disease. The paper
went on to establish the empirical nexus between unemployment and poverty in Africa. This was to
inform the paper whether there was any objective reason to pursue any policy of employment creation and
if unemployment and poverty are positively related. Results from the fixed effect panel regression
indicated positive relationship between poverty and unemployment even though the relationship was not
statistically significant coupled with a weak R-squared (R2). The explanation was that the statistical
insignificance of the regression result was as a result of the large informal sector in Africa. This result
persuaded the author to probe into the employment capacity of the informal with the hope of
understanding its content and context as well suggesting sustainable strategies for employment created in
the sector and how to re-focus the informal sector for optimal benefits to African economies.
References
Boswell, J. (1973), The Rise and Decline of Small Firms, London : Allen & Urwin
Byerlee, D. (1974), “Rural–Urban Migration in Africa: Theory, Policy and Research Implications”. The
International Migration Review. Vol. 8, No. 4, pp. 543-566. Sage Publications Inc. on behalf of Centre for
Migration Studies of New York, Inc. https://www.jstor.org/stable/3002204
Caldwell, J. C. (1969), Africa Rural-Urban Migration: the Movement to Ghana’s Towns. Australian National
University Press. Pp, xi + 258, bibl., map. 95s (UK). Published online by Cambridge University Press (23
January, 2012).
Castells, M. and A. Portes (1989), “World Underneath: The Origins, Dynamics, and Effects of the Informal
Economy.” in A. Portes, M. Castells & Lauren A. Benton (eds.), The Informal Economy: Studies in
Advanced and Less Advanced Developed Countries. Baltimore, MD, USA: John Hopkins University Press.
Chartterjee (1995), “Productivity Growth and the American Business Cycle”. Business Review, Federal Reserve
Bank of Philadelphia, pp. 13-23.
Chartterjee (1999), “Real Business Cycle: A Legacy of Countercyclical Policies?” Business Review, Federal Reserve
Bank of Philadelphia, 17-27.
Chen, M., J. Vanek, and M. Carr (2004), Mainstreaming Informal Employment and Gender in Poverty Reduction: A
handbook for Policymakers and other Stakeholders. London: Commonwealth Secretariat.
Chen, M. A. (2006), “Rethinking the Informal economy: Linkages with the Formal Economy and the Formal
Regulatory Environment” in B. Guha-Khasnobi, R. Kanbur, and E. Orstrom(2006), (eds.), Unlocking
Human Potential: Concepts and Policies for linking the Informal Sectors. Oxford Univ. Press.
Chen, M. A (2012), “The Informal Economy: Definitions, Theories and Policies”, Women in Informal Employment
Globalizing and Organizing (WIEGO). Working paper No. 1.
Chen, M. A. and Wiego Network (2017), “The Informal Economy in African Cities: Key to Inclusive and
Sustainable Urban Development”. OECD Global Forum on Development, 5 April, 2017.
https://www.oecd.org/site/oecdgfd
80
Clarke, P (1973), Small Businesses: How They Survive and Succeed. Longman
Davidson, P. (1988), “Post Keynesian Employment Analysis and Macroeconomics of OECD Unemployment,” The
Economics Journal, 108, 448, 817-831
De Soto, Hernando (1989), The Other Path: The Invisible Revolution in the Third World, Harper & Row.
Dodman, D., L. Hayley, M. Rusca, S. Colenbrander (2017), “African Urbanization and Urbanism: Implications for
risk accumulation and reduction”, International Journal of Disaster Risk Reduction. Vol. 26, pp 7-15
Ekong, C. N. and N. Ayara(1999), “Beyond Adjustment in Nigeria: The Role of the Informal Sector in Employment
Generation”. Journal of Accounting and Management, Univ. of Uyo. Uyo.
Ekong, C. N. (2014), “Creating Sustainable Employment in Nigeria: Leveraging on the Capacity of the Informal
Sector”, Scholars Journal of Economics, Business and Management (SJEBM). Vol. 1 – Issue 10, pp. 505 –
517. http://saspjournals.com
Ekpo, A. H. and Okon Umoh (2014), “The Informal Sector” - Online Nigeria: Nigeria's Information. Retrieved from
http://www.onlinenigeria.com/links/economy
Eisberg, R. and Robert Resmick (1984), Quantum Physics of Atoms Molecules, Solids, Nuclei and Particles. John
Wiley and Sons Inc. New York
Friedman, E., Johnson, S., Kaufmann, D., and Zoido-Lobaton, P. (2000), “Dodging the grabbing hand: the
determinants of unofficial activity in 69 countries,” Journal of Public Economics, 76, 459-493.
Hart, K (1973), “Informal Income Opportunities and Urban Employment in Ghana”. Journal of Modern African
Studies, Vol. 11. No 1
Harvey, B. G. (1969), Introduction to Nuclear Physics and Chemistry. Prentice-Hall Inc., Englewood Cliffs, New
Jersey
Herrera, J, Kuépié, M., Nordman, C., Oudin, X. and Roubaud, F. (2012) “Informal sector and informal employment:
Overview of data for 11 Cities in 10 Developing Countries”, WIEGO Working Paper (Statistics) No. 9.
Herole, (1982), “The Informal Sector: Survival Economy in 3rd
World Metropolitan Cities”, Economics, Vol. 26
Holden, A (1971), The Nature of Atoms, Clarendon Press, Oxford.
ILO, 1972. “Employment, Income and Equality. A strategy for increasing productive employment in Kenya”, ILO,
Geneva.
ILO (1993), “ILO Report of the Fifteenth International Conference of Labour Statisticians”, ILO, Geneva
ILO (2001), “Reducing the decent work deficit: A global challenge”. Report of the Director-General, International
Labour Conference, 89th Session, ILO, Geneva.
ILO (2002a), “Decent Work and the Informal Economy” - Report VI presented for the General Discussion at the
International Labour Conference
ILO (2002b), “Women and Men in the Informal Economy – A Statistical Picture”. ILO Geneva.
ILO (2013), “Measuring informality: a statistical manual on the informal sector and informal employment”, ILO,
Geneva. http://www.wiego.org/sites/wiego.org/files/publications/files/Herrera_WIEGO_WP9.pdf
ILO (2018), https://www.ilo.org/addisababa/whats-new/wcms_377286/lang--en/index.htm.
https://www.brookings.edu/wpncontent/uploads fotw_20180601_africaurban001.png
Jackson, T. (2016), “Don’t underestimate the power of Africa’s informal sector in a global economy”, Quartz
Africa. https://www.goodreads.com/book/show/1769332.african_renaissance
Jhinghan, M. L. (2008), The Economics of Development and Planning. Vrinda Publications Ltd. Delhi.
Keynes, J. (1936), The General Theory of Employment, Interest and Money. London: Harcourt.
Lee, E. (1998), “The Asian Financial Crises: The Challenges for Social Policy”. ILO, Geneva
Levy, S. (2008), Good Intentions, Bad Outcomes: Informality, Productivity, and Growth in Mexico. Washington
DC: The Brookings Institution Press.
Lewis, W. A. (1954), “Economic Development with Unlimited Supplies of Labour.” Manchester School of
Economic and Social Studies, Vol. 23, No. 2
Lewis, W. A. (1955), The Theory of Economic Growth. London: G. Allen & Unwin, Ltd
Liedholm, C. and D. Mead (1992), “The Structure and growth of Microenterprises in Southern and Eastern Africa:
Evidence from Recent Survey”. Draft Paper. East Lansing. M1: Department of Economics, Michigan State
University.
Littlefield, T. A. and N. Thorley (1968), Atomic and Nuclear Physics-An Introduction in SI units. Van Nostrand
Beinhold Company, London
Loayza, N. (1996), “The Economics of the Informal Sector: A Simple Model and Some Empirical Evidence from
Latin America,” Carnegie-Rochester Conference Series on Public Policy, 45, 129 – 162.
Mansilla, H (1992), “The Informal Economy and the Perpetuation of Underdevelopment: the Case of Bolivia.” In
Economics, a Biannual Collection of Recent German Studies, Georg Hanser, Metzingen.
81
Manuelli, R. (2000), “Technological Change, the Labour Market, and the Stock Market”, NBER Working Paper
8022 (Nov)
Meier, G. (1982), Leading Issues in Economic Development. Oxford Univ. Press, New Delhi, India.
Moser, O. N. (1978), “Informal Sector or petty Commodity Production: Dualism of Dependence in Urban
Development?” Journal of World Development, Vol. 6, Issue #: 9-10. Women in in Informal Employment:
Globalizing and Organizing (WIEGO).
Mouhammed, A. H. (2010), “Unemployment and the Entrepreneur”, International Journal of Economics and
Research, 1, 1, 1-14
Mouhammed, A. H. (2011), “Important Theories of Unemployment and Public Policies”, Journal of Applied
Business and Economics, Vol. 12(5).
National Bureau of Statistics (2019), “Key Statistics”.
Obi, R. U. (1989), “Indigenous Small-scale Industries in Nigeria.” Journal of Israel Oriental Society. Israel
Rodrik, D (1997), “Has Globalisation Gone Too Far?” Washington, DC: Institute for International Economics.
Rogan, M. and P. Cichello (2017), “Can informal employment actually reduce poverty?” WIEGO
Blog. http://www.wiego.org/blog/can-informal-employment-actually-reduce-poverty.
Schumpeter, J. (1934), Theory of Economic Development, Cambridge, MA: Harvard University Press.
Sethuraman, S. V. (1976), "The Urban Informal Sector: Concept, Measurement and Policy", International Labour
Review. Vol.114, No.1, pp 69-81.
Sethuraman, S.V., ed. (1981), “The Urban Informal Sector in Developing Countries: Employment, Poverty, and
Environment”. ILO, Geneva.
Sow, M. (2018), “Figures of the Week: Informal Employment in African Cities”. Africa in Focus, Friday, June 1,
2018.
Standing, G. (1999), Global Labour Flexibility: Seeking Distributive Justice. New York: St Martin’s Press
Steel W. P. and Villa M. Webster (1992),”How Small Enterprises in Ghana have responded to Adjustment.” The
World Bank Economic Review
Teye, J. (2018), “Urbanization and Migration in Africa” in Expert Group Meeting, United Nations Headquarters in
New York, 1-2 November, 2018.
Todaro, M. and Smith, S.(2009), Economic Development. Pearson Education, New York
Tokman, V. (ed.), (1972), Beyond Regulation: The Informal Economy in Latin America. Boulder, Co., USA: Lynne
Rienner Publishers
Tokman, V. (1978), “An Exploration into the Nature of the Informal-Formal Sector Relationship,” World
Development, Vol. 6, No. 9/10. Oxford, Pergamon Press Ltd.
UN Statistics Division. 2015. The World’s Women 2015. New York, USA: UN Statistics Division.
Vanek. J, M. Chen, R. Hussmanns, J. Heintz, and F. Carre (2012), “Women and Men in the Informal Economy: A
Statistical Picture”. ILO and WIEGO, Geneva.
Vanek, Joann, Martha Chen, Françoise Carré, James Heintz and Ralf Hussmanns (2014), “Statistics on the Informal
Economy: Definitions, Regional Estimates and Challenges”. WIEGO Working Paper (Statistics) No. 2.
Cambridge, USA: http://www.wiego.org/sites/wiego.org/files/publications/files/Vanek-Statistics
Vecchi, N. (1995), Entrepreneurs, Institutions, and Economic Change: The Economics Thought of J. A. Schumpeter
(1905-1925). London: Edward Elgar
82
Available online at www.asric.org
ASRIC Journal on Social Sciences & Humanities 1 (2020) 82-93
a Department of Economics, Faculty of Social Sciences, Usmanu Danfodiyo University Sokoto.
Received 19 December 2019; revised 30 January 2020; accepted 30 January 2020
Abstract
Financial inclusion was launched in 2011 with over 90 emerging and developing countries as signatories. The
objectives of the strategy were to bring those people excluded from the financial system and also to reduce poverty
and ensure financial stability. The level of financial exclusion in the developed countries is lower when compared
with that of the developing countries. This justifies the need for a very comprehensive approach to financial
inclusion in the developing countries. Therefore, developing countries like Africa have been pursuing financial
inclusion strategy. However, despite the efforts by African countries in this regards much is still desired to take us to
the promise land. This scenario according to some scholars is not unrelated with the political economy of the
African nations. This paper is purely theoretical and therefore examines poverty situation in Africa, analyze the
financial inclusion strategy and also examines the challenges to financial Inclusion. To arrive at our conclusion a
suitable framework was identified and argues that there are reasons why rural areas deserve special attention in
pursuit of financial inclusion strategy and that the overall success of the programme depends to a large extent in
accommodating rural dwellers. The paper therefore, concluded that if a well-articulated and rural biased approach to
financial inclusion is pursued the levels of poverty and hunger could be substantially reduced in Africa.
Keywords: Financial inclusion, financial exclusion, Poverty, Nigeria, Africa
1. Introduction
Poverty and hunger are twin evils that no economy can prosper when they are on increase. In fact the
objective of any development programme should aim at eliminating or at least reducing their effects.
This paper however, assumes that the two could be fought simultaneously, although at certain level they
may require separate strategies. The scourge of poverty is as old as human history never the less we come
to know that in the modern day economy there are several ways through which we can fight this scourge
of poverty. Therefore, scholars from different background have offered suggestions as to how countries
can overcome the threat of poverty. The most recent development strategy is the pursuit of sustainable
inclusive growth which is also assumed to be pro-poor growth strategy. While considerable achievements
have been recorded in some parts of the world in the fight against poverty, in other parts it has not been
all that successful. However, Africa is now the second fastest growing region after Asia, with annual
GDP of about five percent (5%) over the last decade, unfortunately however, this growth has not been
1 Corresponding author. Tel: +2348135219790. Email addresses: [email protected] (N.M. Aliero)
83
translated into shared prosperity and improved livelihoods among Africans, (Kharas, Hamel and Hoper
2018, Baier and Hamel 2018). Looking at its poverty situation, Sub-Saharan Africa is the only region in
the world where the overall number of extremely poor people is increasing rather than decreasing.
According to the World Bank Latest Poverty and Shared Prosperity Report of the 736 million people who
are living on $1.90 per day 413 million are in Africa which is more than 56% of the world’s total (World
Bank 2019).
According to Alkire, Christop, Robles and Vaz (2016) the poverty indices in Africa are scaring. In
their study which covered 103 countries, poverty was measured using 10 indicators such as malnutrition,
child mortality, years of schooling, access to cooking gas, sanitation, safe drinking water, electricity,
ownership of form of transport among others. The report defines the most severe form of poverty as
destitution, and by this definition, 282 million people in sub-Saharan Africa are destitute. The study
further argued that if the scope of poverty is widened to capture all those who are multi-dimensionally
poor, 6 in every 10 sub-Saharan Africans are poor or 521 million people. However, going by country
specific situation there are countries that are showing positive outcomes. The Oxford Poverty and Human
Development Initiative (OPHI) study showed that three of the four countries in the world that did best in
reducing poverty were in Africa. Ethiopia for instance, has reduced the proportion of destitution by 30%
between 2000 and 2011. On the whole the study shows that poverty is more prevalent in the rural areas
than in the urban areas. And the more remote is a locality the poorer they are. In a related study, Kharas,
Hamel & Hoper (2018) argued that in 2019 some 70% of the world’s poor will live in Africa, up from
50% few years back. By 2023 the study insists Africa’s share of poverty will rise to over 80%. They
therefore concluded that for Africa to end poverty by 2030 more than one person would have to escape
poverty every second, and this could only be achieved by improving quality of governance and institution
as well as bold attempt to fight corruption.
Alkire et al (2018) also report that of the 10 countries in the world with the highest number of people
living in extreme poverty 7 are from Africa. These countries include Nigeria with 86.9 million people,
India 71.5 million people, DRC Congo 60.9m, Ethiopia 23.9m, Tanzania 19.9m, Mozambique 17.8m,
Bangladesh 17.0m, Kenya 14.7m, Indonesia 14.2m and Uganda also 14.2 million people. On the other
hand, the 10 countries in Africa with highest number of people living in extreme poverty include Nigeria,
DRC Congo, Ethiopia, Tanzania, Mozambique, Kenya, Uganda, South Africa, South Sudan and Zambia
in that order. Therefore statistics have shown that currently Nigeria has the highest number of people
living in extreme poverty.
Since its launch in 2011, financial inclusion has been pursued by all African countries that are
signatories to the declaration but the overall performance has not been very impressive. Demirguc-Kunt
and Klapper(2013) reported that overall only 23% of adult in Africa have an account at a formal financial
institution. They further asserted that within Africa a large variation exist, for example account ownership
by adult is 42% in Southern Africa, 7% in Central Africa, 23% in North Africa while 95% of adult are
unbaked in DRC Congo and Central African Republic. In Nigeria however, the Central Bank of Nigeria
(CBN) (2018) reported that as at 2016 58.4% of Nigeria’s population are financially served as against
their target of 69.5%, implying that 41.6 % or 40.9million people are unbanked. Out of the 58.4% that are
financially served only 48.6% are served by formal financial institutions, still out of this figure (48.6%)
only 38.3% are actually banked. From these statistics it is clear that there is a long way to go in our
pursuit of financial inclusion strategy. In view of this development, this study argues that financial
inclusion could be a panacea to reducing poverty and hunger in Africa despite all limitations, but that will
depend on embracing a rural biased financial inclusion strategy. This is because majority of Africans are
living in the rural areas. To achieve this objective the paper is divided into six sections including this
introduction. Section two presents theoretical framework for the study, section three present the financial
inclusion strategy thrust, and section four highlights some of the challenges to financial inclusion in
Africa. Section five presents arguments for a rural biased financial inclusion strategy while section six
concludes the paper.
84
2. Theoretical Framework (Sustainable Livelihoods)
The sustainable livelihoods approach to development, according to Brocklesby and Fischer (2003), has
evolved from changing perspectives on poverty, participation, and sustainable development. In 1989, the
World Commission on Environment and Development used the term “sustainable livelihoods” (SL) in
discussion on resource ownership, basic needs and rural livelihoods security. Also, the 1992 UN
Conference on Environment and Development located sustainable livelihoods as a means of linking
socio-economic and environmental concern. Both fora were important for moving international concern
with environmental issues towards a focus on people and their livelihoods activities and placing these
concerns within a policy framework for sustainable development.
For Chambers and Conway (1992), the sustainable livelihoods draw on aspects of integrated rural
development of the 1970s, food security initiative of the 1980s, farming systems research, gender
analysis, risk and vulnerability assessment, participatory poverty assessment and appreciative enquiry. In
general, however, by 1990, the idea of sustainable livelihood had consolidated into an approach or a
number of very similar approaches, developed and/or implemented by inter-governmental organizations
(UNDP, FAO, IFAO), bilateral donors, (e.g. DFID), NGOs (e.g. Care International or Oxfam), and
research institutes (e.g. International Institute for Sustainable Development in Winnipeg, Institute of
Development Studies in Sussex, and the Overseas Development Institute in London). These approaches
are underpinned by an “asset-vulnerability approach” to understanding poverty. They seek to bring
together the lesson of best practices in development with a set of guiding principles supported in an
analytical framework, which act as a tool to analyzing issues, (Brocklesby and Fisher, 2003). Its
evolution, therefore, could be traced in a trajectory of thinking about poverty, from income through basic
needs and vulnerability to current multidimensional concepts, (Ashley and Marilyn, 1999).
According to Chambers and Conway (1992) there are two broad approaches to defining livelihoods.
One has a narrower economic focus on production, employment and household income. The other takes a
more holistic view and unites concepts of economic development, reduced vulnerability, environmental
sustainability, while identifying and building on the strengths of the urban and rural poor. They therefore,
defined livelihood as comprising the capabilities and asset (including both material and social resources)
and activities required for a means of living. Household, they further argued, has a sustainable livelihood
when they can cope with and recover from shocks and stresses and can maintain their capabilities and
assets without undermining the natural resource base.
Ashley and Marilyn (1999) explained the SL approach by means of hedgehog and fox analogy. A
hedgehog could be thought of having one big idea, whereas, the fox followed a diversity of strategies.
This was the livelihoods approach. The SL concept begins by looking at different kinds of assets available
to poor people, described as five kinds of capital: human, natural, financial, social and physical capitals.
These underpinned livelihood strategies which then produced livelihoods outcomes, more income, but
also reduced vulnerability, improved food security, and more sustainable use of natural resources.
Chambers and Conway (1992) drawing from a definition adopted by the International Institute of
Sustainable Development, the UNDP and a host of other organizations, sees SL as being concerned with
people’s capacities to generate and maintain their means of living, enhance their well being, and that of
future generations. These capacities are contingent upon the availability and the accessibility of options
which are ecological, socio-cultural, economic and political and are predicated on equity, ownership of
resources and participatory decision making. Both the notions of sustainable livelihoods and sustainable
development incorporate the idea of change and uncertainty.
Virgo and Atkins (2004) were very specific, when they held that, sustainable rural livelihoods simply
formalizes what we already understand from our own live: how to reduce our vulnerability to outside
shocks, trends and culture through building-up our capital assets (natural, social, physical, financial and
human). They therefore, stated that, in the case of a poor farming family, different strategies will be
adopted to ensure food security for the family. These may include using improved varieties to boost
yields of food crops and protecting forest resource for fodder (natural capital), cooperating with other
families to obtain better purchasing power and marketing influence (social capital), establishing a new
85
house (physical capital), income-generating activities by the women or migration for employment by the
men, and establishing savings and credit funds (financial capital) or sending children to school so that
they will gain beneficial skills (human capital). Virgo and Atkins, concluded by arguing that the
sustainable rural livelihoods (SRL), only focuses on the fact that we all operate in a holistic fashion,
according to our own perception of how we can improve our livelihood. If we treat topic in isolation,
without understanding the whole, there can be problems. As Ashley and Marilyn (1999) would say, SRL
had been particularly useful to have a holistic approach with a wide range of entry points, and one which
was built-up from poor people’s own perspectives.
Brocklesby and Fisher (2003) have identified four component of SL as consisting of the following:
a. People are conceived as living within vulnerability context in which they are exposed to risks,
through sudden shocks, trends overtime and seasonal change,
b. People have a number of capital assets which they draw upon to make their livelihoods. These
include, social capital (social network and relationships of trust), natural capital (natural resource
stocks), financial capital (savings, income, credit), physical capital (transport, shelter, water,
communication) and human capital (skills, labour, knowledge). These, put together, form assets
pentagon for assessing people’s overall asset base,
c. These assets are drawn on within people’s livelihoods strategies, i.e. choice and activities through
which people seek to generate a living or positive livelihoods outcome,
d. Policies, institutions and processes are held to shape people’s access to assets and livelihoods
activities, as well as the vulnerability context in which they live. It is here that linkages can be
made between livelihoods activities taking place at the micro and the meso-or mean-levels.
The basic features of the SL approach include the following:
a) It is a bottom-top approach, and therefore emphasizes the important role of involving people in
the design, implementation, monitoring and evaluation of policies and programmes that affect them.
b) While it embodies holistic and dynamic approach, it also encourages linkage between micro and
macro-level which should be sustainable and people-centered,
c) It recognizes effective participation of the people through joint-effort in development process,
d) Its identification of various forms of capital has given it a multidimensional approach to
development.
In addition to the above, the SRL theory is concerned with improving the livelihoods of the vulnerable
people in the rural areas, among which is accessibility to resources, including financial resource (credit),
which equally is a thematic issue, in this study. The sustainable rural livelihoods theory is therefore,
found to be a relevant theoretical framework for this study.
3. Financial Inclusion Strategy
Financial inclusion refers to all initiatives that make formal financial services available, accessible,
and affordable to all segments of the population. This therefore requires paying particular attention to
specific group of people who have been excluded from the formal financial system either because of their
income level and volatility, gender, geographical location, type of employment or level of financial
literacy (Triki, Thouraya and Faye 2013). A well-entrenched financial inclusion strategy is expected to
develop the poor peoples’ capacities, strengthen their human, physical and financial capital so that they
can effectively engage in income-generating activities and be able to mange risks associated with their
livelihoods. The scope of financial inclusion goes beyond improved access to credit to also encompass
enhanced access to savings, insurance and other financial series. A financial inclusion strategy must
address three major areas viz: financial access (making financial services available and affordable to the
users), financial usage (making customers use financial services frequently and regularly) and financial
service quality (making financial services tailored to client’s needs).
The financial inclusion strategy was first muted and adopted as a development strategy at the Maya
declaration in Mexico in 2011 at a meeting of Global Policy Forum where over 90 emerging and
developing countries converged. As a global initiative it recognizes the critical role of financial inclusion
86
in empowering and transforming the lives of the poor and also improving national and global financial
stability which will ensure the attainment of inclusive growth. According to the policy document, the
members were therefore committed to:
a. Put in place a financial inclusion strategy that creates an enabling environment for effective
access to financial services that makes full use of appropriate technology and substantially lower
the unit cost of financial services.
b. Implement a sound and proportional regulatory framework that achieves the complementary
goals of financial inclusion, stability and financial integrity.
c. Recognize consumer protection and empowerment as key pillars of financial inclusion efforts to
ensure that all people are included in their country’s financial sector.
d. Make evidence-based financial inclusion policy a priority by collecting and analyzing
comprehensive data, tracking the changing profile of financial inclusion, and producing
comparable indicators in the network.
Nigeria as a signatory to the Maya declaration launched its Financial Inclusion Strategy in 2012. The
target of the policy was to achieve overall inclusion of 80% comprising of formal 70% and informal 10%
by the year 2020. There were 22 Key Performance Indicators with which other targets could be adjudged.
The policy identified some key stake holders who were there to complement the effort of CBN, which
include:
a. Regulators; which include CBN, National Communication Commission, National Insurance
Commission, Pension Commission, Nigeria Deposit Insurance Corporation and the Securities and
Exchange Commission.
b. Development Partners; Non-Governmental Organizations, Foundations and Multilateral Agencies
c. Public Sector Institutions; Federal Ministries, National Identity Management Commission,
Nigeria Postal Services, Government Agencies and Programmes
d. Distribution Actors; such as Mobile Network Providers, Interbank Settlement Providers and
Super agents
e. Other Financial Institutions; Mobile Money operators and Other Fine Tech Companies
f. Users; These are Consumers and Advocacy groups
With these stakeholders identified the Financial Inclusion policy in Nigeria also identified certain
elements which will guarantee the success of the programme (CBN 2018). These elements are:
a. Ease of access to financial products and services, which implies that financial products must be
within easy reach of all segments of the population and should no have onerous requirements
b. Use of broad range of financial products and services; so that financial inclusion implies not only
access but also usage of full spectrum of financial services including but not limited to payment
system, savings, credit, insurance and pension products.
c. Financial products should be designed according to meet the needs of clients and should consider
income levels as well as access to distribution channels
d. Financial services should be affordable even for low-income groups
As at the end of 2016 58.4% of the 96.4 million adults in Nigeria were financially served. Across all
inclusion targets (Products, Channels and Enablers) the outcome was below expectation. It was however
found that five groups of people were the most excluded and they include; women, rural dwellers, youth,
people living in the north-east and north-west as well as Micro, Small and Medium Enterprises (MSMEs).
Some of the reasons for this ugly trend include low and volatile income levels, inflationary environment,
high illiteracy rates, inadequate infrastructure, governance challenges, and the limited competition within
the banking industry as well as the high cost of banking (Demirguc-Kunt and Klapper 2013). Other
factors as outlined by CBN (2018) are cultural barriers, difficulty in profitably serving the excluded
group, high levels of unemployment, security challenges in some parts and the continuing high level of
informality in the economy. Below we present the picture of financial inclusion (exclusion) in Nigeria.
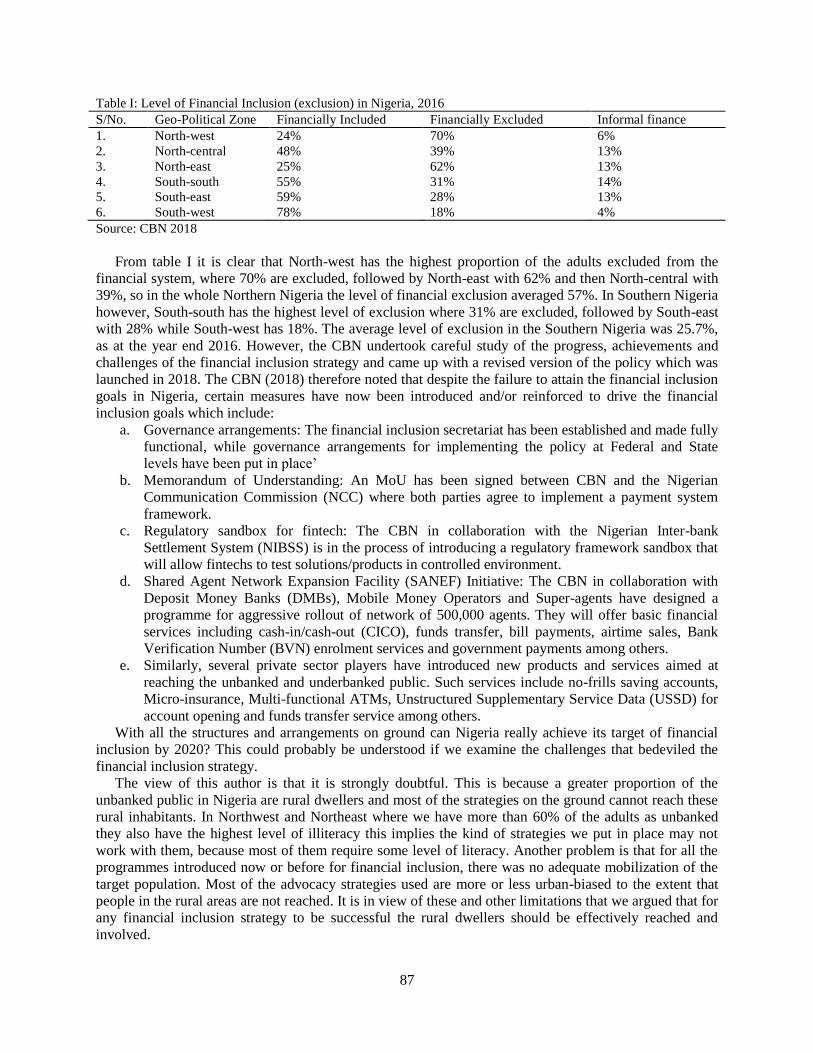
87
Table I: Level of Financial Inclusion (exclusion) in Nigeria, 2016
S/No. Geo-Political Zone Financially Included Financially Excluded Informal finance
1. North-west 24% 70% 6%
2. North-central 48% 39% 13%
3. North-east 25% 62% 13%
4. South-south 55% 31% 14%
5. South-east 59% 28% 13%
6. South-west 78% 18% 4%
Source: CBN 2018
From table I it is clear that North-west has the highest proportion of the adults excluded from the
financial system, where 70% are excluded, followed by North-east with 62% and then North-central with
39%, so in the whole Northern Nigeria the level of financial exclusion averaged 57%. In Southern Nigeria
however, South-south has the highest level of exclusion where 31% are excluded, followed by South-east
with 28% while South-west has 18%. The average level of exclusion in the Southern Nigeria was 25.7%,
as at the year end 2016. However, the CBN undertook careful study of the progress, achievements and
challenges of the financial inclusion strategy and came up with a revised version of the policy which was
launched in 2018. The CBN (2018) therefore noted that despite the failure to attain the financial inclusion
goals in Nigeria, certain measures have now been introduced and/or reinforced to drive the financial
inclusion goals which include:
a. Governance arrangements: The financial inclusion secretariat has been established and made fully
functional, while governance arrangements for implementing the policy at Federal and State
levels have been put in place’
b. Memorandum of Understanding: An MoU has been signed between CBN and the Nigerian
Communication Commission (NCC) where both parties agree to implement a payment system
framework.
c. Regulatory sandbox for fintech: The CBN in collaboration with the Nigerian Inter-bank
Settlement System (NIBSS) is in the process of introducing a regulatory framework sandbox that
will allow fintechs to test solutions/products in controlled environment.
d. Shared Agent Network Expansion Facility (SANEF) Initiative: The CBN in collaboration with
Deposit Money Banks (DMBs), Mobile Money Operators and Super-agents have designed a
programme for aggressive rollout of network of 500,000 agents. They will offer basic financial
services including cash-in/cash-out (CICO), funds transfer, bill payments, airtime sales, Bank
Verification Number (BVN) enrolment services and government payments among others.
e. Similarly, several private sector players have introduced new products and services aimed at
reaching the unbanked and underbanked public. Such services include no-frills saving accounts,
Micro-insurance, Multi-functional ATMs, Unstructured Supplementary Service Data (USSD) for
account opening and funds transfer service among others.
With all the structures and arrangements on ground can Nigeria really achieve its target of financial
inclusion by 2020? This could probably be understood if we examine the challenges that bedeviled the
financial inclusion strategy.
The view of this author is that it is strongly doubtful. This is because a greater proportion of the
unbanked public in Nigeria are rural dwellers and most of the strategies on the ground cannot reach these
rural inhabitants. In Northwest and Northeast where we have more than 60% of the adults as unbanked
they also have the highest level of illiteracy this implies the kind of strategies we put in place may not
work with them, because most of them require some level of literacy. Another problem is that for all the
programmes introduced now or before for financial inclusion, there was no adequate mobilization of the
target population. Most of the advocacy strategies used are more or less urban-biased to the extent that
people in the rural areas are not reached. It is in view of these and other limitations that we argued that for
any financial inclusion strategy to be successful the rural dwellers should be effectively reached and
involved.
88
4. The Challenges of Financial Inclusion
There is no gain saying that the financial inclusion strategy faces a number of challenges, however
these challenges vary from country to country, but yet there are some that may appear to be universal.
Danashvar, Garry, Lopez, Santamarfa and Villareal (n.d) observed that the challenges that limit the
financial inclusion of excluded population groups at the national level are accentuated in rural areas.
Firstly, sparse population density, compounded by low income levels, offer very low margins to
compensate for high operating costs of incorporating the excluded population, especially through
traditional business schemes. Secondly, the users’ limited financial capacities restricts demand, while
those of the financial service providers constrain effective supply in the absence of products suited to the
need and conditions of small rural providers. This is compounded by the persistence of perverse
incentives for non-payment, associated with clientelism in public-policy actions, the vulnerability of rural
environment to risks of various kinds, low rate of formal property ownership which reduce the range of
collateral-eligible assets and limitations in terms of both the coverage and the quality of the available
infrastructure.
Babu (2015) while analyzing the challenges and opportunities of financial inclusion in India identified
the challenges to include implementation, infrastructure, role of non-bank financial institutions, bank
licensing, technology, credibility of banks and attitude of the unbanked. Ahmed and Jianguo (2014) on
the other hand, while analyzing the challenges of financial inclusion in Tanzania identified the following
challenges:
i. Lack of education: they argued that lack of sufficient education or knowledge concerning access
to various financial services is a problem to majority Tanzanians which in turn affects the overall
peoples’ access to finances. Basically it was realized that, majority of people within the country
lack information on various services particularly loans in terms of access and repayment.
Therefore, one of the basic ways to improve peoples’ access to financial services is the provision
of education to the public to remove the wrong long-stuck mentality on various financial services.
ii. Low technology: The major problem here was realized to be low communication technology
infrastructure which causes uneven distribution of information between financial institutions and
the people utilizing the financial services. Banks therefore need to make significant
improvements in various areas such as Management Information System. The improvement in
technology will assists in uniting many people in different geographical areas.
iii. High cost associated with the important financial services: Another challenge is the costs that are
associated with the consumption of financial services. Various charges such as interest rates,
service charge on using ATM were sought to exert pressure on the customers which in turn
affects their general usage of the services. Basically, in this, it was realized that the charges that
put on various services are in most cases destructive to the overall mood of the respondents to
utilize the services of the financial institution. In order to curb this, there is need to harmonize the
overall charges so that the users can be comfortable in paying them without problem.
iv. Regulatory requirements: Regulatory requirements such as Know Your Customer (KYC) rules
that have been introduced to prevent money laundering can also make it difficult to open even a
bank account as they may not have the necessary documentation. It has also been observed that
many people do not have collateral or credit record due to lack of proper credit bureau.
In Nigeria Adesanya (2017) listed the challenges of financial inclusion to include the following:
i. Misconception: Generally, there is a believe that once it works anywhere else it can work in
Nigeria. But the reality is that the culture and economy ideology defer because Nigeria is still
predominantly cash based. Second, there is another believe that the rate of mobile users should
directly result to mobile money subscriber but this is another mistake because most of the people
under the are hostile to the wave electronic financial transaction platform an still believe the do-
it-for-me service. That is why the esusu and ajoo (informal financial providers) are strongly
trusted and established.
89
ii. Channel: From the above, it is clear that the preferred channel is not corporate sit and take coffee
approach but rugged style. The reality is similar to gold diggers and commodity trader, while the
former dig to extract gold the later only trade in available gold in the market without even
touching it. The most appropriate channel is for the unbanked is the combination of their trusted
traditional method and technology.
iii. Framework: The Mobile Money Operations render financial services through their agents who
currently see such partnership as hindrance to its primary business, while on the part of
commercial banks, they use contract staff (Direct sales agent/executives) to chase customers for
deposit with the possibility of great risks to bank and lack of comfort by customers.
iv. Compensation model: Most of the agents under the Mobile Money Operators and Direct Sales
Agent (Executives) of the commercial banks complained bitterly on the unattractive incentives
from rendering such services. Targets that are not backed by market intelligence and strategy for
successful implementation.
v. Market intelligence: The situation in Nigeria is like asking the sight of challenged person (like
blind) to just run without any direction, assistance or guide. It may shock you that many of the
financial institutions do not even have sufficient market intelligence that can create access to the
unbanked population.
Furthermore, Kama and Adigun (2013) identified the challenges to financial inclusion to include the
following:
i. A major challenge is how to ensure that the poor rural dwellers are carried along considering the
lack of financial sophistication among them due to general low level of financial literacy.
Majority of the financially excluded Nigerians lack knowledge of the services and benefits
derivable from accessing financial services, while staff of the service providers often display lack
of adequate understanding of the services and so unable to effectively educate the rural people.
ii. The second challenge is the inability to save as a result of double digit inflation with its attendants
effects on real interest rate and continuous erosion of the value of money.
iii. There is also the challenge of increasing poverty. Although the economy is reported to have
exited from recession, majority of the Nigerians still remain poor, while unemployment rate has
remained high. This means the poor peoples’ propensity to consume would be higher than the
propensity to save if they even have it.
iv. The uncompetitive wage levels, particularly in the public sector where a large number belong to
the low-cadre means that these groups are excluded financially. Though their salaries are paid
into the bank but the personnel only visit the bank once in a month to collect their salaries with
little or nothing to save
In addition to earlier mentioned factors the author of this paper feels there are other factors that
challenge the success of financial inclusion in Nigeria, which are discussed hereunder:
i. Wide spread prevalence of crime and criminality: Different forms of crime are widely spread in
Nigeria, ranging from 419, cultism, ritual money, kidnapping, yahoo-yahoo boysism, cybercrime,
theft and robbery among others. These happening have instituted fear in the mind of people to the
extent that any new development that has to do with is thought to be a scam and as such many
would run away from it. People do not want expose their wealth holdings or expose their
financial strength. A such people have continued to refuse formal banking services.
ii. High level corruption: Corruption is like a cancer in the life our economy it has different faces
and inflicts injury on the economy from a variety of perspectives. In this context, corruption
hindered the success of financial inclusion by diverting resources meant for the success of the
programme to the pockets of some bureaucrats. People in government today celebrate the launch
of a new programme not for its promising objects but for the money that will be released for it,
which will end in their pockets. Secondly, financial industry cannot succeed anywhere without
effective supervision and inspection, it is doubtful that if those charged with the supervisory
responsibility may not compromise for a fee. Corruption has killed many programmes in Nigeria.
90
iii. Loss of confidence in the government programmes: Arising from the poor performance of
previous government in Nigeria and wide spread corruption in government, citizens have lost
confidence in government, such that they see any thong from government as mere rhetoric. So
that any time a new programme is introduced they will say give them some few days, it will be no
more.
iv. New developments in the banking industry: A number developments were recorded during the
period when financial inclusion was being implemented, which gave rise to some negative
repercussions on the success of the strategy especially in the rural areas. First, there was this issue
of Bank Verification Number (BVN). Many dubious accounts were abandoned by their owners
and many wre scared from opening accounts. The rural dwellers in particular find very
cumbersome and time wasting. Also transaction cost has increased during the period with the
introduction of new charges and upward review of some other charges. For example the
introduction of fifty naira stamp duty on any deposit made into an account, charges on ATM
withdrawal, charges on debit card issuance etc. These charges put together discouraged many
rural dwellers from opening bank account.
5. Arguments for a Rural-Biased Financial Inclusion Strategy
Although the financial inclusion strategy was introduced in Nigeria in 2012, similar approaches in the
past were used with the hope to bring the unbanked into the framework of financial system. Such
programmes include the Rural Banking Scheme of 1977-1983, The Peoples’ Bank 1989-1994,
Community Banking 1990-2005 and the Microfinance Scheme which was introduced in 2005. Despite all
these, the rural banking scheme in Nigeria has not achieved the desired results. This is because,
commercial banks were not willing to locate their branches in the rural areas as they have complained of
high cost of operation coupled with low patronage. The rural dwellers on the other hand, have decried
high cost of credit and discriminatory attitude of the bank staff as well as their insistence on collateral in
granting loans, (Okorie 1990). These and other problems brought to the lime light that the rural banking
in Nigeria was not achieving its objectives. Below, we present some reasons justifying the need for a
rural biased financial inclusion strategy in Nigeria:
a. Lessons from Experience: This argument becomes necessary because of the apparent problems
encountered in the previous experiences of reaching the rural dwellers with the banking and financial
services. In Nigeria several programmes have been introduced but have not yielded the desired results.
They include the Rural Banking Programme, Peoples Banking Programme, Community Banking
Programme and the Microfinancing Programme. It must therefore be noted that rural areas are distinct
from the urban areas in the sense that rural dwellers are mostly not educated and have erratic and low
level of income most of the times with relatively high propensities to consume (MPC). The environment
is not conducive for professional bankers because they have no such facilities in the cities like
recreational centres, good road, supermarkets, health centres, good schools for their children etc. On the
part of regulators, when they come for supervision and appraisal they have always treated both rural-
based and urban-based banks on the same scale, and the implication is that a very sound and potentially
viable bank might be seen as distressed because of seasonality in the income of its customers. This was
the problem with most of the rural Community Banks. Another problem is with the legal framework for
the operation of the banks, this is because as much as there is difference between the economic activities
of rural and urban dwellers, there is also such difference in their environmental conditions and such
disparities need to be embodied in the legal framework.
b. The Majority Rule: Nigerian policy makers have been conscious of the fact that majority of the
nation’s population reside in the rural areas, and majority of the poor are found in the rural areas. It is
equally clear that these people in the rural areas are hardly reached with the programmes and projects of
various levels of government. Of much concern is the issue of providing banking and credit facilities to
the rural dwellers. In the early years of Nigeria’s independence, the government used to provide credit
and farm inputs directly to the farmers through its agencies, which did not, impact much on their
91
productivity. The 1970’s marked the beginning of taking solid steps in providing specialised institutions
and programmes for the provision of not only credit but also banking services to the rural populace in
Nigeria. The former Nigeria Agricultural and Cooperatives Bank (NACB) and the Rural Banking Scheme
were all introduced in the 1970’s. However, the Rural Banking Scheme had not achieved its objectives, as
it did not last long. The major reason being higher cost of operating a rural branch and second valid factor
was that there was no effective supervision, which gave rise to fraud.
c. Over Concentration of Government Presence in Urban Areas: There is no gain saying that over the
years government programmes in Nigeria have been urban biased. In addition to the existence of almost
all seats of government in the urban areas, most of the corporate bodies are also headquartered in the
cities, including financial institutions. In particular, there are banks that by their making are exclusive of
the urban centres, such as the Bank of Industry, the Nigerian Export and Import Bank and the Education
Bank. We even have the Urban Development Bank, which was specifically established to finance
urbanization problems. All these are in addition to over twenty banks operating in the country each of
which has at least a branch in the state capital. Even the restructured Bank of Agriculture, has majority of
its branches in the cities, and as such, not doing very well in the area of providing rural finance. On the
other hand, development financing in the developing countries should emphasizes more on rural finance
because of the apparent disadvantage of rural areas in attracting private banks; it is thus believed that only
government intervention can guarantee efficient and effective financial inclusion in the rural areas.
d. Transaction Cost: Scholars of development finance have argued that transaction cost is one of the
major determinants for accessing banking services in general and it has been argued that high transaction
cost discourages rural dwellers from accessing financial services (Guia-Abiad, 1993; Aryeetey, 1995
Sercadoti, 2005). The transaction costs of rural lending in developing countries are high, mainly due to
small loans size, high frequency of transactions, large geographical spread, the heterogeneity of borrowers
as well as the lack of a rural bank branch network as an additional problem, (Sercadoti, 2005). It is
therefore argued here, that in order to encourage rural dwellers to deal with financial institutions we must
bring these institutions closer to them, thereby cutting down their transaction cost.
e. Level of Economic Activities: Most of the small scale industries in Nigeria are agro-allied and a
typical rural community in Nigeria is agrarian. Hence, taking banking to the door steps of rural
community implies boosting agricultural production and derivatively supporting and encouraging agro-
allied industries operating in the country. In addition to this, there are a number of non-farm economic
activities in the rural areas, and these activities could be widened and encouraged if rural dwellers have
access to formal financial services to enable them finance their expansion and sometimes modernization.
f. Level of Poverty: As at 1998, two-third (2/3) of Nigerians were poor, 80% of who are found in the
rural areas (Badayi, 2002). Presently, Nigeria is the country with highest number of the poorest of the
poor in the world. Farmers, on their part, have responded to this problem by turning to moneylenders,
reducing inputs in farming, overcapitalising and internalising risks, by over-diversification of activities,
which lead to sub-optimal assets allocation. The combined effects of these coping strategies are a poverty-
trap (Hess, 2003). The current challenge, therefore, is to innovate a low-cost way of reaching the rural
poor. Therefore, availability and accessibility to financial services by the rural poor could enhance their
productivity thereby improving their output and finally, reducing their poverty level.
6. Conclusion and Recommendations
The central argument of this paper is that financial inclusion as a development strategy can be used in
reducing hunger and poverty in Africa where majority of the extremely poor people live. However, the
success of financial inclusion in reducing African poverty and hunger depends on the repositioning the
strategy to accommodate the rural inhabitants who are mainly excluded by the formal financial system.
The rural poor have five forms of capital all of which could be utilized in harnessing their capabilities for
development, as argued by the Sustainable Livelihoods theory. It has also been shown that there are
reasons why financial inclusion strategy should embody a rural biased approach so that the rural poor
could be captured. Bearing in mind the great potentials in the livelihoods strategies of the rural people,
92
availability of accessible and affordable financial services will enhance their productive capacities and
increase their income level thereby reducing poverty and hunger.
The experience of Nigeria in the financial inclusion journey is one with little success however; there is
room for adjustment to ensure successful achievement of the targets. African countries should therefore,
learn from these experiences in Nigeria ranging from the earlier arrangements of reaching the rural poor
with the financial services to the current strategy of financial inclusion. There is no doubt that the
productive capacities of African poor could be harnessed, but not with traditional approach of
government. African countries must institutionalize the fight with corruption at a very large scale in order
to realize their development dream.
References
Adesanya, O. O. (2017) Financial Inclusion in Nigeria the Challenges of Banks and Mobile Bank of Morocco-
CEMLA-IFC Seminar at the ISI World Statistics Congress on Financial Inclusion, Marrakech Morocco
July.
Ahmed, M. S. and Jianguo, W. (2014) Financial Inclusion and Challenges in Tanzania, Research Journal of Finance
and Accounting 5(21)
Alliance for Financial Inclusion (2009) Financial Inclusion Policies: An Overview of the Issues Tokyo, Japan
Alkire, S., Christop. J., Gisela, R., and Ana, V. (2016) Multidimensional Poverty in Africa, Oxford Poverty and
Human Development Initiative (OPHI) Briefing No. 40
Aryeetey, E. (1995) Filing the Niche: Informal Finance in Africa, East Educational Publishers AERC, Nairobi
Kenya 1st Edition
Ashley, C. and Marilyn H. (1999) From Income Poverty to Sustainable Livelihoods: Practical Implications of
Evolving Framework for Understanding Poverty, Talk at the Overseas Development Institute.
Babu, S. H. (2015) Financial Inclusion: Challenges and Opportunities in India, International of Research in
Commerce and Management, 6(3).
Badayi, A. S. (2002) Towards Effective Poverty Alleviation Strategies, NCEMA Policy Analysis Series, 8(1).
Baier, J. and Hamel, K. (2018) Africa the Last Frontier for Eradicating Poverty, Brookings Discussion Paper,
Brookings Institute, October.
Brocklesbey, M. A. and Fischer, E. (2003) Community Development in Sustainable Livelihoods Approaches – An
Introduction, Community Development Journal, 38(3), July.
Central Bank of Nigeria (2018) National Financial Inclusion Strategy (Revised), CBN Abuja, Nigeria, October.
Chambers, R. and Conway, G. (1992) Sustainable Rural Livelihoods Practical Concepts for the 21st Century, IDS
Discussion Paper No. 296.
Damodaran A. (2013) Financial Inclusion: Issues and Challenges, AKGEC International Journal of Technology,
4(2).
Daneshvar, C., Garry, S., Lopez, J., Santamariya, J., and Villareal F. G. (n.d.) Financial Inclusion of Small Scale
Rural Producers: Trends and Challenges, in Villareal, F. G. (ed) (n.d.) Financial Inclusion of Small Rural
Producers, IFAD and Economic Commission for Latin America and Caribbean Investing in Rural People.
Demirguc-Kunt, A. and Klapper, L. (2013) Financial Inclusion in Africa: A Snapshot, in Triki, F. and Faye, I.
(2013) (ed), Financial Inclusion in Africa.
Guia-Abiad, V. (1993) Borrower Transaction Cost and Credit Rationing in Rural Financial Markets: The Philippines
Case, The Developing Economies, xxi - 2
Hess, U. (2003) Innovative Financial Services in Rural India, Mansoon-Indexed-Lending and Insurance, for
Smallholders, Agricultural and Rural Development Working Paper, No, 9 World Bank.
International Labour Organization (n.d.) Developing the Rural Economy through Financial Inclusion: The Role of
Access to Finance, Decent Work in the Rural Economy, Policy Guidance Notes.
Kama, U. and Adigun M. (2013) Financial Inclusion in Nigeria: Issues and Challenges, Occasional Paper No, 45,
CBN Abuja Nigeria.
Okorie A. (1990) Rural Banking in Nigeria: Empirical Evidence of Indicative Policy Variables, from Anambra
State, Agricultural Economics, 7(1).
Salazar, D. (2018) Why is Financial Inclusion in Nigeria Lagging Compared to its African Peers? Financial
Inclusion Insight.
Sacerdoti, E. (2005) Access to Bank Credit in Sub-Saharan Africa: Key Issues and Reform Strategies, IMF Working
Paper, WP/05/166

93
Triki, T., Thouraya s. and Faye I. (2003) (ed) Financial Inclusion in Africa, African Development Bnak Group
Ghana
Villareal, F. G. (n.d.) (ed) Financial Inclusion of Small Rural Producers, IFAD and Economic Commission for Latin
America and Caribbean (ECLAC), Investing in Rural People.
Virgo,K. and Atkins, W. S. (2004) Sustainable Rural Livelihoods Concept: Theory or Reality,
http//www.uk/biennialsP.htm, 6/12/2004
94
Available online at www.asric.org
ASRIC Journal on Social Sciences & Humanities 1 (2020) 94-106
a Department of Economics, IT-Business Faculty, Ghana Technology University College.
b Entrepreneurship Training Institutes
Received 19 December 2019; revised 30 January 2020; accepted 30 January 2020
Abstract
The contribution of SME’s towards the macroeconomics growth and development of the Ghanaian economy is of no
doubt significant. At the microlevel, MSME’s help reduce household level poverty, unemployment and boost
entrepreneurial activities. Despite this, the growth of MSMEs in Ghana has been significantly low, with majority
unable to enter the international market or dying with the owner. This study investigated the drivers of SME’s and
start-ups growth in Ghana and the factors influencing their internationalization. More specifically, the study
examines the motives, challenges and inhibiting factors responsible for the internationalization of MSMEs and start-
ups in Ghana. Using the cross-sectional data gathered from a sample of 500 entrepreneurs across all the districts in
the greater Accra region of Ghana, the descriptive statistics and logit regression analysis was performed. Results
from the descriptive statistics shows that frequent power fluctuation and outages, the lack of access to finance,
government policies and the risk preferences of the business owner are major drivers of MSMEs and start-up growth
in Ghana. The logit regression analysis shows that apart from socioeconomic characteristics, the inability of
Ghanaian firms to adopt advance technology, high cost of production, risk preference of the owner, poor quality of
the product produce, inadequate capital and the international regulations and competition were the main factors
obstructing Ghanaian MSME’s from entering into the international market. The study recommends that for MSME’s
to thrive in Ghana and dare to enter the international market there is the need for policies favouring internalisation,
sustainable energy supply, cultural and attitudinal change and better government regulation.
Keywords: Risk Preference, Internationalization, logit regression
1. Introduction
Micro, Small and Medium Enterprises (MSMEs) have been documented in the empirical literature as
important drivers of job creation, Gross Domestic Product (GDP) and economic development and growth
in most developing countries (Fowowe, 2017; International Trade Centre, 2016; Liñán, Paul, & Fayolle,
2019). The MSMEs sector is one of the fastest growing sectors in developing countries. However, the fast
pace of growth of global markets have arouse competition and intensified the interdependence of national
economies (Knight, 2000), pushing governments to espouse market-oriented policies, both internationally
and domestically (Liñán, Paul, & Fayolle, 2019; Acs & Preston, 1997). As a result, MSMEs are
progressively becoming international in nature in developing countries. Generally, the decision of firms to
1 Corresponding author. Email addresses: [email protected] (R.K. Asravor)
95
either enter the international market or not in based on several factors, principal among these factors, is
access to funds. An essential obstacle, therefore, inhibiting firm expansion into the international market is
insufficient funds(Fowowe, 2017; Malhotra, et al., 2007). Even among the various types of business
entities, access to funds is a biggest challenge for MSMEs as compared to limited liabilities and
corporations (Fowowe, 2017; Beck, Demirguc-Kunt, & Maksimovic, 2002).
In Ghana, MSMEs gained prominence in the early 1960s and since then, has play important roles in
job creation and economic development and are largely regarded as the backbone of the Ghanaian
economy. MSMEs in Ghana represent about 85% of all businesses operating in the private sector and
contribute about 70% of Ghana’s GDP (International Trade Centre, 2016). A significant number of
scholarly and empirical articles (Bhatti & Awais, 2012; Fowowe, 2017; Malhotra, et al., 2007) have
investigated the challenges affecting the development of MSMEs in particular geographical locations
(Wang, 2016) but very little research has been directed towards understanding why MSMEs and start-ups
in developing economies have not internationalized. In order to develop a cogent and an expedient policy,
it is important to understand the drivers of SME’s and start-ups growth in Ghana and the factors
influences their internationalization. Data obtained from the Ghana Investment Promotion Centre (GIPC)
shows that between 1994 and mid-2011, about 17 registered Nigerian firms where operating in Ghana, yet
very little is known of Ghanaian firms operating in other ECOWAS countries much more the African
union and the world in general.
More specifically, the study seeks to examine the motives, challenges and inhibiting factors
responsible for the internationalization of MSMEs and start-ups in Ghana. To this end, the following
research questions were asked in this study:
1. What are the motives for the internationalization of MSMEs and start-ups in Ghana?
2. What are the challenges for the internationalization of MSMEs and start-ups in Ghana?
3. What factors determines the internationalisation of MSMEs and start-ups in Ghana?
These questions were answered using a cross-sectional data gathered from a sample of 500 entrepreneurs
across all the major districts in the greater Accra region of Ghana. Research question one and two were
answered using descriptive statistics while the logit regression analysis was performed to answer research
question three.
2. Literature Review and Theoretical Framework
2.1. Conceptual Review
Generally, the based is based on certain key concepts applied in the business field. The concepts used in
this paper include, internationalisation, Micro, small and medium enterprises, risk preferences and start-
ups.
2.1.1 Internationalisation
There is no agreed definition of internationalization. Internationalization as used in this refers to the
process of increasing involvement of enterprises in international markets. Internationalization defines the
process of designing products to meet the needs of users in many countries.
2.1.2 Micro, small and medium enterprises
There is no single, uniformly acceptable, definition of a micro, small and medium enterprises. Micro,
small and medium enterprises is defined by the levels of capitalisation, sales and employment. Micro- and
small-scale enterprises from the employment perspective refers to employing up to 9 employees, medium-
scale enterprises as those employing between 10 and 29 workers, and large-scale enterprises as those
employing 30 or more employees (Gockel & Akoena, 2002).
96
2.1.3 Start-ups
A start-up is a company that is in the first stage of its operations. These companies are often initially
bankrolled by their entrepreneurial founder as they attempt to capitalize on developing a product or
service for which they believe there is a demand.
2.1.4 Risk preferences
Risk preference as used in this study refers to the attitude people hold towards risks, which is a key
factor in studies on investors’ decision-making behaviour.
2.2 Theoretical Review
Numerous theories exist in the empirical literature to explain the internationalisation of business
entities. Key among these theories are the Resources Based View (RBV), Transactions Cost Analysis
(TCA), Institutional Theory, Eclectic Framework and Uppsala Model. As indicated by Brouthers and
Hennart (2007) the most generally functional theories from the point of view of entry mode decision, are
the Transaction Cost Analysis (TCA), Resource-based View (RBV), Institutional Theory, Dunning
Eclectic Framework and the Uppsala model.
2.2.1 Transaction Cost Approach (TCA)
Transaction Cost Approach (TCA) has become common in the literature (Dwyer & Oh, 1988; Heide &
John, 1988), particularly in entry-mode investigations (Klein, 1989; Klein, Frazier, & Roth, 1990). Based
on the assumption that markets are competitive with numerous potential suppliers, which reduces the
need for monitoring and enforcing supplier behaviour (Hennart, 1989), the TCA approach argues that
low-control modes are preferred because the threat of replacement reduces opportunism and forces
suppliers to perform efficiently (Anderson & Coughlan, 1987). Nevertheless, when the markets fail, the
range of suppliers existing to the firm is constrained leading to “small-numbers bargaining” and the
supplier’s tendency to behave opportunistically is reduced through stern negotiation and supervision of
contractual relationships (Dwyer and Oh, 1988). This thereby increases the transaction costs related to
low-control modes. Thus, TCA theory argues that transaction-specific assets meaningfully determine the
market efficacy and then decide the governance structure, which, in internationalization, is market entry
mode.
2.2.2 Institutional Theory
The general premise of the institutional theory is that firms adopt business structures and practices that
are said to be “isomorphic” to those of the other firms due to their hunt to attain legitimacy
(Yiu & Makino, 2002). Davis, Desai and Francis (2000) posited that the two sources of isomorphic
pressures that affect a strategic business unit (SBU) entry-mode choice are the internal institutional
environment (the parent organization) and host country institutional environment. Contrary to Davis,
Desai and Francis (2000), Scott (1995), suggested that the Regulative pillar, the Normative pillar and the
Cognitive pillars are the three pillars of the institutional theory. The regulative pillar concerns the rules
and laws existing to ensure stability and order in societies while the normative pillar is the domain of
social values, cultures, and norms in the societies and cognitive pillar is the established cognitive
structures in society that are taken for granted. DiMaggio and Powell (1983) argues that organizations
choose a specific form of structure and practice either because it would receive regulative and normative
consent since it is vital as a result of their dependence on resources from these environments, or because it
is not taken serious as the proper way. Thus, entry mode choice is limited by both internal isomorphism
(parent company) and external isomorphism (host country).
2.2.3 Dunning Eclectic Framework
Dunning’s Eclectic framework developed by Dunning in 1988 has been severally applied to a
mammoth of studies by authors such as Agarwal and Ramaswami (1992), Brouthers, Brouthers and
Werner (1996), and Tse, Pan and Au (1997) to investigate the strategies employed by companies to select
97
particular foreign market entry modes. According to the Dunning’s eclectic Ownership Loion
Internationalisation (OLI) framework of foreign direct investment into an international market by a
company is made based on three (3) important variables, which are, Ownership advantages, Location
advantages and Internalization advantages
(Dunning, 1995). Thus, ownership advantage refers to the control matters, the costs and benefits of
inter-firm relationships and transactions, whereas location advantage focusses on resource commitment
matters, the availability and cost of resources. The internationalisation advantage aspect concerns
primarily the reduction of transaction and coordination costs. These three group of variables directly
affect a business’ entry model decision since it influences management’s perception of asset power
(ownership advantage), costs of integration (internalization advantages), and market attractiveness
(location specific advantage) (Agarwal and Ramaswami, 1992). The framework also suggests that when
OLI advantages are high, firm will prefer more integrated modes of entry.
2.2.4 Uppsala model
The study was theoretically guided by the Uppsala Internationalization Model. The Uppsala Model is
the most widely used in foreign market entry mode research, hence, the adoption of this model.
Furthermore, the model was adopted for this study because it helped achieve and best explain the
objectives and the results obtained in this paper. The intensification of the activities of firms on
international markets has best been explained by the Uppsala model propounded by (Johanson & Vahlne,
1977) and (Johanson & Wiedersheim-Paul, 1975). The model has widely been tested in the
manufacturing industries but has not been widely applied in the service industry where this study is
focused on. However, considering the growing importance of the service industry and the fact that it is
now mixed with light manufacturing firms, the authors deemed it necessary to apply the model for this
study.
According to the model, firms internationalize their activities in the immediate physically close
markets (those with same or similar cultural and/or geographical features) and gradually move to the
distant markets. The propounders further argued that when a firm settles on a new foreign market, it
focuses on a low resource commitment mode and will only graduate to higher commitment modes if it
had gained enough experiential knowledge form the lower commitment modes (Rodriguez, 2004). The
model proposed that firms begin foreign sales with occasional export orders and then move on to regular
exports. The commitment of the firms may however decrease or cease completely if performance and
prospects are not well met. Uppsala model specifies that the level of commitment may also decrease or
cease if performance and prospect are not sufficiently met. The main assumptions of the model are that a
firm’s knowledge of a market or lack of it is what compels its internationalization activities where market
knowledge is a function psychic distance between home and host countries and the firm's accumulated
experiences accumulated in the markets. The model asserts that:
1. firms choose new countries for expansion based on their psychic closeness to the host country
and moved on to more psychically distant countries if only they gain experiential knowledge from
past international operations; and
2. the commitment of resources in selected countries increases in an incremental pattern as the firm
gains experience in each market.
2.3 Empirical Review
Hutchinson, Alexander, Quinn, and Doherty (2007) in their empirical study drawing on case study
evidence on the reasons small specialist retailers internationalize and the facilitating factors that help them
overcome the obstacles to internationalization. Employing the qualitative research technique, Hutchinson,
et al., (2007) found that a strong company brand identity is the most significant motive for expansion,
other internal and external factors facilitate the international decision-making process.
In their empirical study, Yiu and Makino (2002) found that the more restricted the regulatory
environment of the host country is, the more probability that a joint venture will be chosen over a wholly
98
owned subsidiary. In addition, the more restrictive the normative domain of the host country, the more
likely the multinational enterprise will choose a joint venture.
Applying the Dunning Eclectic framework, Brouthers, Brouthers and Werner (1996) posited that as
locational and ownership advantages increased firms are inclined to employ more integrated modes entry,
especially in the case of computer software industry operating in the United State of America.
Tse, Pan and Au (1997) reported that as OLI advantages increased, business organisations tended to
employ more wholly owned entry mode into China whereas applying the institutional theory, Davis, et al
(2000) found that SBUs using wholly-owned entry modes demonstrated high level of internal (parent)
isomorphism.
Butler, Doktor, & Lins (2010) posited that an entrepreneur willing to internationalize should be more
skilled than to continue on his domestic market while the influence of socioeconomic factors, such as,
education, age and the level of social security within both the domestic and host country has been
identified by Hessels et. al. (2008) to influence the willingness of SMEs to grow and export
(internationalised).
3. Methodology
3.1 Study Area
The study was conducted in the Greater Accra region of Ghana. The choice of the Greater Accra
region of Ghana is because it is the region with the highest concentration of MSMEs in Ghana. Secondly,
the Greater Accra region has the highest concentration of diverse kind of MSMEs compared to other
regions of Ghana. Within the Greater Accra region, ten (10) main metropolises were selected for this
study. The first being the Kasoa Municipal Assembly, the Madina/Adenta Municipal Assembly, the circle
business enclave, the Accra business district and the Kaneshie, Tema business center, Spintex, Ashiaman,
Lapaz and Nima/Mamobi.
3.2 Sampling Technique
In this study, the multistage sampling technique, made up of purposive and simple random sampling
technique was employed in this study. Purposive sampling was employed to sample the various municipal
and metropolitan assemblies for the study. The purposive sampling was also used to first collect the list of
Ghanaian companies that have internationalised and those which have not internationalised. The list of
these firms was then numbered and then later sampled using the simple random sampling techniques.
The Rstudio command of “sample” was used to select 350 MSMEs that have not internationalised and
150 MSMEs that have internationalised. On average two MSMEs were interviewed and administered
with the questionnaire each day. Due to the bulkiness of the information being requested and to facilitate
accuracy of the data being collected, ten (10) research assistants were employed. In all, five weeks was
spent in the collection of the data from the owners of the MSMEs in the study area.
3.3 Sampling Size and data analysis
The sample size of the study is 500 MSMEs in Ghana. In each of the ten (10) study area. Since there is
no reliable record of the population of all MSMEs in Ghana, the sample size of the study was computed
using the minimum sample size criterion (Guadagnoli & Velicer, 1988) required for accuracy (equation
1). This is stated as:
𝑛 =𝑝∗𝑞∗𝑧2
𝑒2 (1)
Following the International Trade Centre which estimates that MSMEs constitute over 85 percent of
the population (International Trade Centre, 2016), the percentage of picking a MSMEs (𝑝 ) is given by the
85 per cent. The percentage of not picking an MSMEs (𝑞) is given by the 15 percent, the margin of error
(𝑒 ) is equated to 5 percent and the standard normal distribution (Z) is unconventionally set at 99%
confidence level (2.58). Thus, the estimated minimum sample (𝑛) for this study was 339 MSMEs. In
99
order to avoid the issue of incomplete question and high no response rate, an oversampling was done
hence the sample size was 500 MSMEs.
3.4 Model Specification
In this study, we consider the probability of going international from the perspective of MSMEs
operating in the Greater Accra region of Ghana. The study employs the binary logistic regression for
estimating determinants of going international. The choice of the logit model is because the outcome
variable, that is the going international or not has two possible outcome, hence, lies in the interval of 0
and 1 (Wooldridge, 2013). The event going international is expression 𝐺𝐼 = 1 and 𝐺𝐼 = 0 represents an
event that is not going international. The logistic regression analysis was employed for predicting the
probability that 𝐺𝐼 = 1 for known values of the predictor variables 𝑋1, … . 𝑋𝑘 . This technique helped the
researchers to identify the significant and most influential predictor variables affecting MSMEs going
international (𝐺𝐼 = 1). In binary logistic regression, the dependent variable 𝐺𝐼 is defined as follows
(equation 2):
𝑌 = {1 𝑖𝑓 𝑆𝑀𝐸𝑠 𝑔𝑜𝑒𝑠 𝑖𝑛𝑡𝑒𝑟𝑛𝑎𝑡𝑖𝑜𝑛𝑎𝑙0 𝑖𝑓 𝑜𝑡ℎ𝑒𝑟𝑤𝑖𝑠𝑒
(2)
The binary logistic regression of a dichotomous outcome variable 𝐺𝐼 on a combination of 𝑘 discrete
and continuous independent variables 𝑋1, 𝑋2, … . 𝑋𝑘 is defined by the following logit function (equation
3):
𝑙𝑜𝑔𝑖𝑡(𝑃𝑖) = 𝑙𝑛 (𝑃𝑖
1 − 𝑃𝑖) = �̂�0 + �̂�1𝑥1 + �̂�2𝑥2 + ⋯ + �̂�𝑘𝑥𝑘 (3)
The probability of MSMEs going international is given by the statistical expressions (equation 4):
𝑃𝑟(𝑌 = 1) =1
1 + exp(−𝑧) (4)
Where
𝑍 = �̂�0 + �̂�1𝑥1 + �̂�2𝑥2 + ⋯ + �̂�𝑘𝑥𝑘 (5)
Using equation (5), the probability of 𝐺𝐼 = 1 (the probability of firm credit participant), given the
values contributing variables for access to credit 𝑋1, 𝑋2, … . 𝑋𝑘, can be done for any randomly selected
firm in the study. However, according to Greene (2002) the coefficients of the logistics regressions only
provide the direction of the effect of the independent variables on the dependent variable. Thus, the
estimates represent neither the actual magnitude of change nor the probabilities. Instead, the marginal
effects are used to measure the expected change in probability of a technique being chosen with respect to
a unit change in an independent variable from the mean. The marginal effect was computed by
differentiating the coefficients at their mean as follows:
𝜕𝑍
𝜕𝑥𝑘= 𝛽𝑖(𝑍 = �̂�0 + �̂�1𝑥1 + �̂�2𝑥2 + ⋯ + �̂�𝑘𝑥𝑘 ) (6)
4. Analysis of Data
4.1 Descriptive Statistics
The descriptive statistics as presented in Table 1 shows that 55.4% of the responding MSMEs
entrepreneurs interviewed were males of the average age of approximately 37 years.
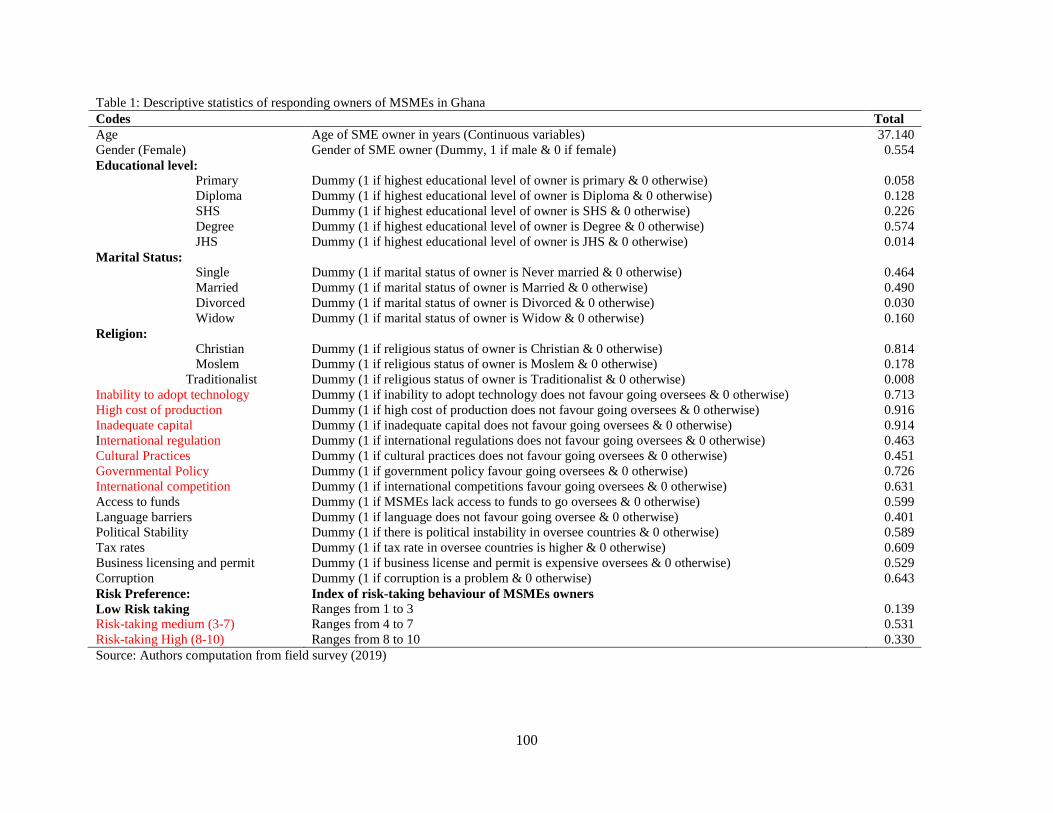
100
Table 1: Descriptive statistics of responding owners of MSMEs in Ghana
Codes
Total
Age Age of SME owner in years (Continuous variables) 37.140
Gender (Female) Gender of SME owner (Dummy, 1 if male & 0 if female) 0.554
Educational level:
Primary Dummy (1 if highest educational level of owner is primary & 0 otherwise) 0.058
Diploma Dummy (1 if highest educational level of owner is Diploma & 0 otherwise) 0.128
SHS Dummy (1 if highest educational level of owner is SHS & 0 otherwise) 0.226
Degree Dummy (1 if highest educational level of owner is Degree & 0 otherwise) 0.574
JHS Dummy (1 if highest educational level of owner is JHS & 0 otherwise) 0.014
Marital Status:
Single Dummy (1 if marital status of owner is Never married & 0 otherwise) 0.464
Married Dummy (1 if marital status of owner is Married & 0 otherwise) 0.490
Divorced Dummy (1 if marital status of owner is Divorced & 0 otherwise) 0.030
Widow Dummy (1 if marital status of owner is Widow & 0 otherwise) 0.160
Religion:
Christian Dummy (1 if religious status of owner is Christian & 0 otherwise) 0.814
Moslem Dummy (1 if religious status of owner is Moslem & 0 otherwise) 0.178
Traditionalist Dummy (1 if religious status of owner is Traditionalist & 0 otherwise) 0.008
Inability to adopt technology Dummy (1 if inability to adopt technology does not favour going oversees & 0 otherwise) 0.713
High cost of production Dummy (1 if high cost of production does not favour going oversees & 0 otherwise) 0.916
Inadequate capital Dummy (1 if inadequate capital does not favour going oversees & 0 otherwise) 0.914
International regulation Dummy (1 if international regulations does not favour going oversees & 0 otherwise) 0.463
Cultural Practices Dummy (1 if cultural practices does not favour going oversees & 0 otherwise) 0.451
Governmental Policy Dummy (1 if government policy favour going oversees & 0 otherwise) 0.726
International competition Dummy (1 if international competitions favour going oversees & 0 otherwise) 0.631
Access to funds Dummy (1 if MSMEs lack access to funds to go oversees & 0 otherwise) 0.599
Language barriers Dummy (1 if language does not favour going oversee & 0 otherwise) 0.401
Political Stability Dummy (1 if there is political instability in oversee countries & 0 otherwise) 0.589
Tax rates Dummy (1 if tax rate in oversee countries is higher & 0 otherwise) 0.609
Business licensing and permit Dummy (1 if business license and permit is expensive oversees & 0 otherwise) 0.529
Corruption Dummy (1 if corruption is a problem & 0 otherwise) 0.643
Risk Preference: Index of risk-taking behaviour of MSMEs owners
Low Risk taking Ranges from 1 to 3 0.139
Risk-taking medium (3-7) Ranges from 4 to 7 0.531
Risk-taking High (8-10) Ranges from 8 to 10 0.330
Source: Authors computation from field survey (2019)
101
The study also shows that the 1.4% of the MSMEs owners had Junior High School as their highest
level of formal classroom education whereas bachelor’s degree was the most represented educational
qualification (57%) of responding SME entrepreneurs in the study. None of the owners of the MSMEs
interviewed was an illiterate or had a master’s or PhD degrees. Also, the analysis presented in Table 1,
clearly shows that there were more married (49%) owners the MSMEs interviewed followed by
individuals who were single (46.4%), widowed (1.6%) and divorced MSMEs owners (3%). In terms of
religion, the result clearly shows that 81% of the SME owners are Christian while approximately 1% of
the SME owners belong to the African Traditional religion.
Other descriptive statistics shows that 71%, 92% and 91% of the SME owners indicated that they were
not able to adopt new technology, their production cost was high, and they did not have adequate capital
respectively. From Table 1, 46% indicated that international regulation influences their decision to go
international whereas 45% and 73% stated of cultural practices and government policy as determinant of
internationalisation respectively. Again 63% of responding SME owners indicated that international
competition was an important deciding factor to go international. It was also noticed from Table 1, that
more than half of the MSMEs indicated that political instability in neighbouring countries (59%), tax rate
for going international (61%), and the business licensing and permit (53%) were important variables that
influence their decision to enter into the international market. The analysed data shows that 64% of the
responding owners of MSMEs opined that corruption was a major barrier to their company entering the
international market. The study reveals that in terms of risk taking, approximately 14% of responding
owners classify themselves as low risk takers, 53% were medium risk takers and the remaining 33% were
high risk takers.
4.2 Motive for Internationalisation of MSMEs and Start-ups
The reason for going international was re-classified into proactive and reactive factor. The responses
are presented in Table 2. The responses show that 80% of MSMEs moved into the international market
because of the profit and growth goal motive. The most important goal for going international according
to the responses was the identification of foreign market opportunities or market information. The finding
further shows that the least reasons for going international was proximity to international customers,
unsolicited foreign order and economies of scales.
Table 2: Motives for going international
Responses Percent (%)
Proactive (average responses) 48.889%
Profit and growth goals 80.000%
Managerial urge 33.333%
Technology competence / unique product 36.000%
Foreign market opportunities / market information 82.667%
Economies of scale 24.000%
Tax benefits 37.333%
Reactive Factors (average responses) 32.889%
Competitive pressures 45.333%
Domestic market: small and saturated 50.667%
Overproduction / excess capacity 28.667%
Unsolicited foreign orders 24.000%
Extend sales of seasonal products 24.667%
Proximity to international customers /psychological distance 24.000%
Source: Authors computation from field survey (2019)
Other reasons for internationalisation among firms include small and saturated domestics market
(50.67%); competitive pressures (45.33%), tax benefit (37.33%) and overproduction or excess capacity
(28.67%). Averagely the reason for going international were more proactive (approximately 49%) than
reactive (approximately 33%). The motives stated in Table 2 confirms the Uppsala model that
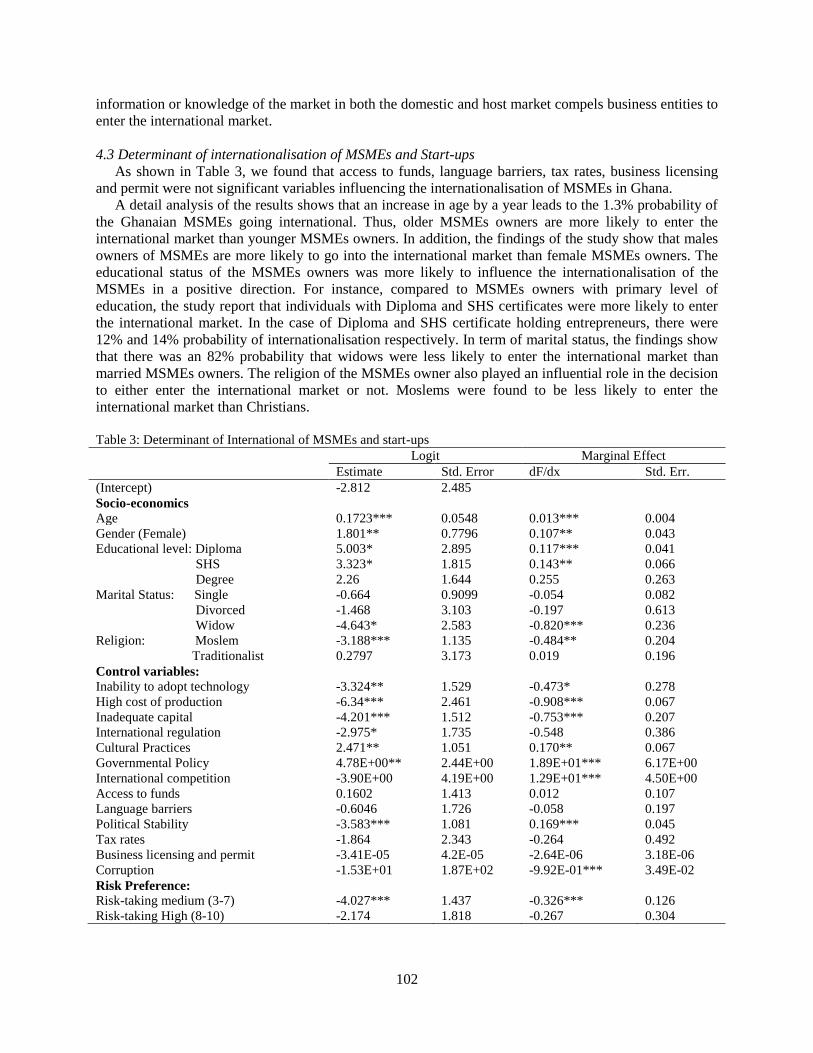
102
information or knowledge of the market in both the domestic and host market compels business entities to
enter the international market.
4.3 Determinant of internationalisation of MSMEs and Start-ups
As shown in Table 3, we found that access to funds, language barriers, tax rates, business licensing
and permit were not significant variables influencing the internationalisation of MSMEs in Ghana.
A detail analysis of the results shows that an increase in age by a year leads to the 1.3% probability of
the Ghanaian MSMEs going international. Thus, older MSMEs owners are more likely to enter the
international market than younger MSMEs owners. In addition, the findings of the study show that males
owners of MSMEs are more likely to go into the international market than female MSMEs owners. The
educational status of the MSMEs owners was more likely to influence the internationalisation of the
MSMEs in a positive direction. For instance, compared to MSMEs owners with primary level of
education, the study report that individuals with Diploma and SHS certificates were more likely to enter
the international market. In the case of Diploma and SHS certificate holding entrepreneurs, there were
12% and 14% probability of internationalisation respectively. In term of marital status, the findings show
that there was an 82% probability that widows were less likely to enter the international market than
married MSMEs owners. The religion of the MSMEs owner also played an influential role in the decision
to either enter the international market or not. Moslems were found to be less likely to enter the
international market than Christians.
Table 3: Determinant of International of MSMEs and start-ups
Logit Marginal Effect
Estimate Std. Error dF/dx Std. Err.
(Intercept) -2.812 2.485
Socio-economics
Age 0.1723*** 0.0548 0.013*** 0.004
Gender (Female) 1.801** 0.7796 0.107** 0.043
Educational level: Diploma 5.003* 2.895 0.117*** 0.041
SHS 3.323* 1.815 0.143** 0.066
Degree 2.26 1.644 0.255 0.263
Marital Status: Single -0.664 0.9099 -0.054 0.082
Divorced -1.468 3.103 -0.197 0.613
Widow -4.643* 2.583 -0.820*** 0.236
Religion: Moslem -3.188*** 1.135 -0.484** 0.204
Traditionalist 0.2797 3.173 0.019 0.196
Control variables:
Inability to adopt technology -3.324** 1.529 -0.473* 0.278
High cost of production -6.34*** 2.461 -0.908*** 0.067
Inadequate capital -4.201*** 1.512 -0.753*** 0.207
International regulation -2.975* 1.735 -0.548 0.386
Cultural Practices 2.471** 1.051 0.170** 0.067
Governmental Policy 4.78E+00** 2.44E+00 1.89E+01*** 6.17E+00
International competition -3.90E+00 4.19E+00 1.29E+01*** 4.50E+00
Access to funds 0.1602 1.413 0.012 0.107
Language barriers -0.6046 1.726 -0.058 0.197
Political Stability -3.583*** 1.081 0.169*** 0.045
Tax rates -1.864 2.343 -0.264 0.492
Business licensing and permit -3.41E-05 4.2E-05 -2.64E-06 3.18E-06
Corruption -1.53E+01 1.87E+02 -9.92E-01*** 3.49E-02
Risk Preference:
Risk-taking medium (3-7) -4.027*** 1.437 -0.326*** 0.126
Risk-taking High (8-10) -2.174 1.818 -0.267 0.304
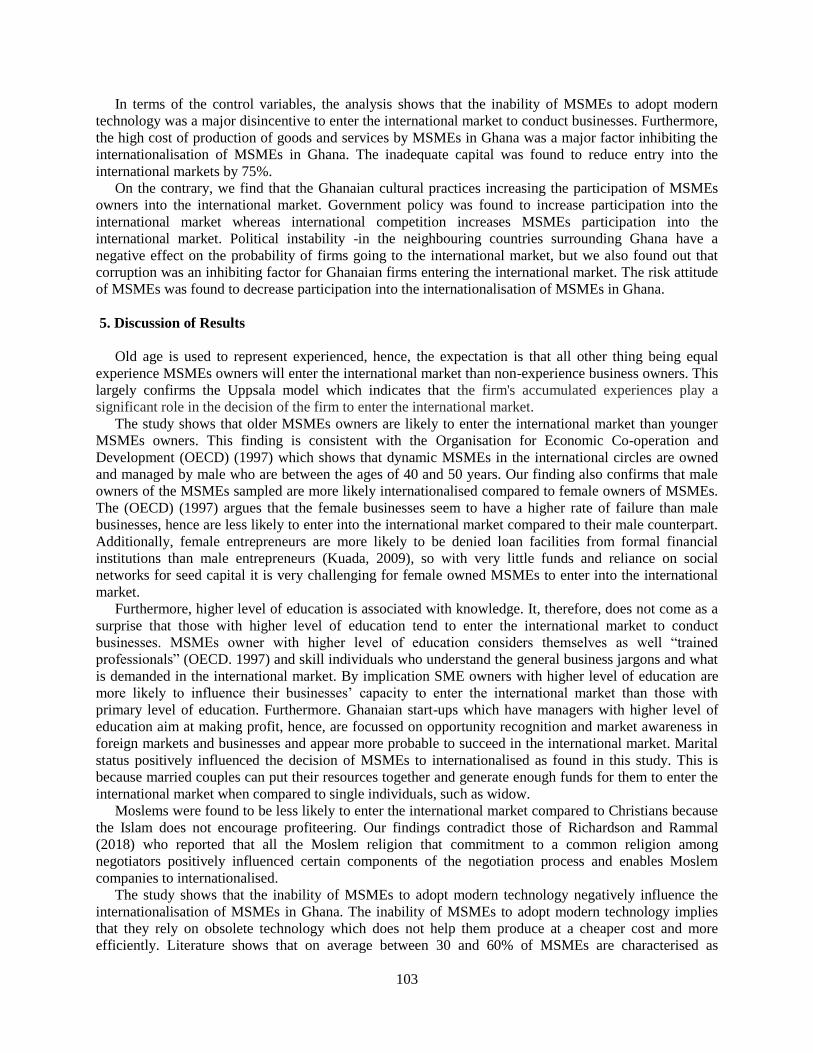
103
In terms of the control variables, the analysis shows that the inability of MSMEs to adopt modern
technology was a major disincentive to enter the international market to conduct businesses. Furthermore,
the high cost of production of goods and services by MSMEs in Ghana was a major factor inhibiting the
internationalisation of MSMEs in Ghana. The inadequate capital was found to reduce entry into the
international markets by 75%.
On the contrary, we find that the Ghanaian cultural practices increasing the participation of MSMEs
owners into the international market. Government policy was found to increase participation into the
international market whereas international competition increases MSMEs participation into the
international market. Political instability -in the neighbouring countries surrounding Ghana have a
negative effect on the probability of firms going to the international market, but we also found out that
corruption was an inhibiting factor for Ghanaian firms entering the international market. The risk attitude
of MSMEs was found to decrease participation into the internationalisation of MSMEs in Ghana.
5. Discussion of Results
Old age is used to represent experienced, hence, the expectation is that all other thing being equal
experience MSMEs owners will enter the international market than non-experience business owners. This
largely confirms the Uppsala model which indicates that the firm's accumulated experiences play a
significant role in the decision of the firm to enter the international market.
The study shows that older MSMEs owners are likely to enter the international market than younger
MSMEs owners. This finding is consistent with the Organisation for Economic Co-operation and
Development (OECD) (1997) which shows that dynamic MSMEs in the international circles are owned
and managed by male who are between the ages of 40 and 50 years. Our finding also confirms that male
owners of the MSMEs sampled are more likely internationalised compared to female owners of MSMEs.
The (OECD) (1997) argues that the female businesses seem to have a higher rate of failure than male
businesses, hence are less likely to enter into the international market compared to their male counterpart.
Additionally, female entrepreneurs are more likely to be denied loan facilities from formal financial
institutions than male entrepreneurs (Kuada, 2009), so with very little funds and reliance on social
networks for seed capital it is very challenging for female owned MSMEs to enter into the international
market.
Furthermore, higher level of education is associated with knowledge. It, therefore, does not come as a
surprise that those with higher level of education tend to enter the international market to conduct
businesses. MSMEs owner with higher level of education considers themselves as well “trained
professionals” (OECD. 1997) and skill individuals who understand the general business jargons and what
is demanded in the international market. By implication SME owners with higher level of education are
more likely to influence their businesses’ capacity to enter the international market than those with
primary level of education. Furthermore. Ghanaian start-ups which have managers with higher level of
education aim at making profit, hence, are focussed on opportunity recognition and market awareness in
foreign markets and businesses and appear more probable to succeed in the international market. Marital
status positively influenced the decision of MSMEs to internationalised as found in this study. This is
because married couples can put their resources together and generate enough funds for them to enter the
international market when compared to single individuals, such as widow.
Moslems were found to be less likely to enter the international market compared to Christians because
the Islam does not encourage profiteering. Our findings contradict those of Richardson and Rammal
(2018) who reported that all the Moslem religion that commitment to a common religion among
negotiators positively influenced certain components of the negotiation process and enables Moslem
companies to internationalised.
The study shows that the inability of MSMEs to adopt modern technology negatively influence the
internationalisation of MSMEs in Ghana. The inability of MSMEs to adopt modern technology implies
that they rely on obsolete technology which does not help them produce at a cheaper cost and more
efficiently. Literature shows that on average between 30 and 60% of MSMEs are characterised as
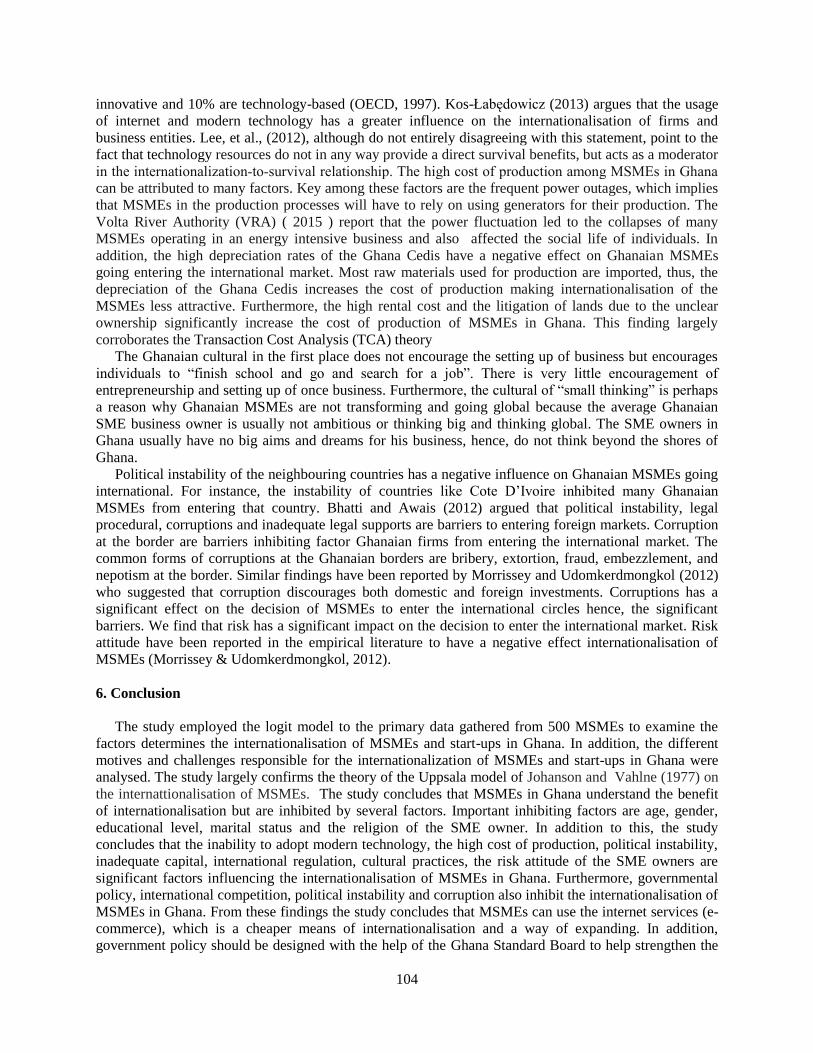
104
innovative and 10% are technology-based (OECD, 1997). Kos-Łabędowicz (2013) argues that the usage
of internet and modern technology has a greater influence on the internationalisation of firms and
business entities. Lee, et al., (2012), although do not entirely disagreeing with this statement, point to the
fact that technology resources do not in any way provide a direct survival benefits, but acts as a moderator
in the internationalization‐to‐survival relationship. The high cost of production among MSMEs in Ghana
can be attributed to many factors. Key among these factors are the frequent power outages, which implies
that MSMEs in the production processes will have to rely on using generators for their production. The
Volta River Authority (VRA) ( 2015 ) report that the power fluctuation led to the collapses of many
MSMEs operating in an energy intensive business and also affected the social life of individuals. In
addition, the high depreciation rates of the Ghana Cedis have a negative effect on Ghanaian MSMEs
going entering the international market. Most raw materials used for production are imported, thus, the
depreciation of the Ghana Cedis increases the cost of production making internationalisation of the
MSMEs less attractive. Furthermore, the high rental cost and the litigation of lands due to the unclear
ownership significantly increase the cost of production of MSMEs in Ghana. This finding largely
corroborates the Transaction Cost Analysis (TCA) theory
The Ghanaian cultural in the first place does not encourage the setting up of business but encourages
individuals to “finish school and go and search for a job”. There is very little encouragement of
entrepreneurship and setting up of once business. Furthermore, the cultural of “small thinking” is perhaps
a reason why Ghanaian MSMEs are not transforming and going global because the average Ghanaian
SME business owner is usually not ambitious or thinking big and thinking global. The SME owners in
Ghana usually have no big aims and dreams for his business, hence, do not think beyond the shores of
Ghana.
Political instability of the neighbouring countries has a negative influence on Ghanaian MSMEs going
international. For instance, the instability of countries like Cote D’Ivoire inhibited many Ghanaian
MSMEs from entering that country. Bhatti and Awais (2012) argued that political instability, legal
procedural, corruptions and inadequate legal supports are barriers to entering foreign markets. Corruption
at the border are barriers inhibiting factor Ghanaian firms from entering the international market. The
common forms of corruptions at the Ghanaian borders are bribery, extortion, fraud, embezzlement, and
nepotism at the border. Similar findings have been reported by Morrissey and Udomkerdmongkol (2012)
who suggested that corruption discourages both domestic and foreign investments. Corruptions has a
significant effect on the decision of MSMEs to enter the international circles hence, the significant
barriers. We find that risk has a significant impact on the decision to enter the international market. Risk
attitude have been reported in the empirical literature to have a negative effect internationalisation of
MSMEs (Morrissey & Udomkerdmongkol, 2012).
6. Conclusion
The study employed the logit model to the primary data gathered from 500 MSMEs to examine the
factors determines the internationalisation of MSMEs and start-ups in Ghana. In addition, the different
motives and challenges responsible for the internationalization of MSMEs and start-ups in Ghana were
analysed. The study largely confirms the theory of the Uppsala model of Johanson and Vahlne (1977) on
the internattionalisation of MSMEs. The study concludes that MSMEs in Ghana understand the benefit
of internationalisation but are inhibited by several factors. Important inhibiting factors are age, gender,
educational level, marital status and the religion of the SME owner. In addition to this, the study
concludes that the inability to adopt modern technology, the high cost of production, political instability,
inadequate capital, international regulation, cultural practices, the risk attitude of the SME owners are
significant factors influencing the internationalisation of MSMEs in Ghana. Furthermore, governmental
policy, international competition, political instability and corruption also inhibit the internationalisation of
MSMEs in Ghana. From these findings the study concludes that MSMEs can use the internet services (e-
commerce), which is a cheaper means of internationalisation and a way of expanding. In addition,
government policy should be designed with the help of the Ghana Standard Board to help strengthen the
105
coordinating between MSMEs and Ghana Export and Promotion Council. This will help to develop an
elaborate SME support to MSMEs enter the international market and manufacture products of
international standard. Finally, the study recommends attitudinal and cultural changes as it will encourage
SME owners to enter the international market.
7. Acknowledgments
We would like to acknowledge all the research assistants who helped in the collection of the data for
this study. References
Acs, Z. J., & Preston, L. (1997). Small and medium-sized enterprises, technology, and globalization: Introduction to
a special issue on small and medium-sized enterprises in the global economy. . Small Business Economics,
9(1), 1-6.
Agarwal, S., & Ramaswami, S. N. (1992). Choice of foreign market entry mode: Impact of ownership, location and
internalization factors. Journal of International business studies, 23(1), 1-27.
Anderson, E., & Coughlan, A. T. (1987). International market entry and expansion via independent or integrated
channels of distribution. Journal of marketing, 51(1), 71-82.
Beck, T., Demirguc-Kunt, A., & Maksimovic, V. (2002). Financing Patterns Around the World: The Role of
Institutions. Washington, D C: World Bank.
Bhatti, D., & Awais, M. (2012). Internationalization factors and entrepreneurial perception: Indication from Yemen
SMEs. Far East Journal of Psychology and Business, 6(1), 1-21.
Brouthers, K. D., & Hennart, J. F. (2007). Boundaries of the Firm: Insights From International Entry Mode
Research. Journal of Management , 33(3), 33(3):.
Brouthers, K. D., & Hennart, J. F. (2007). Boundaries of the firm: Insights from international entry mode research. .
Journal of management, 33(3), 395-425.
Brouthers, K. D., Brouthers, L. E., & Werner, S. (1996). Dunning's eclectic theory and the smaller firm: The impact
of ownership and locational advantages on the choice of entry-modes in the computer software industry.
International Business Review, 5(4), 377-394.
Butler, J. E., Doktor, R., & Lins, F. A. (2010). Linking international entrepreneurship to uncertainty, opportunity
discovery and cognition. Journal of International Entrepreneurship, 8, 121-134.
Davis, P. S., Desai, A. B., & Francis, J. D. (2000). Mode of international entry: An isomorphism perspective.
Journal of International Business Studies, 31(2), 239-258.
DiMaggio, P. J., & Powell, W. W. (1983). The iron cage revisited: Institutional isomorphism and collective
rationality in organizational fields. . American sociological review, 147-160.
Dunning, J. H. (1995). Reappraising the Eclectic Paradigm in an Age of Alliance Capitalism, University of Reading.
Journal of international Business Studies, United Kingdom.
Dwyer, F. R., & Oh, S. (1988). A Transaction Cost Perspective on Vertical Contractual Structure and Interchannel
Competitive Strategies. Journal of Marketing, 52(2), 21-34.
Fowowe, B. (2017). Access to finance and firm performance: Evidence from African countries. Review of
Development Finance, 7, 6–17.
Gockel, A. F., & Akoena, S. K. (2002). Financial Intermediation for the Poor: Credit Demand by Micro Small and
Medium Scale Enterprises in Ghana: a Further Assignment for Financial Sector Policy? Geneva: ILO.
Guadagnoli, E., & Velicer, W. E. (1988). Relation of Sample Size to the Stability of Component Patterns.
Psychological Bulletin, 103(2), 265-275.
Heide, J. B., & John, G. (1988). Do Norms Matter in Marketing Relationships? Journal of Marketing, 56(2), 32-44.
Hennart, J. F. (1989). Can the "New Forms of Investment" Substitute for the "Old Forms?" A Transaction Costs
Perspective.". Journal of International Business Studies, 20(2), 211-234.
Hessels, J., Van Gelderen, M., & Thurik, R. (2008). Entrepreneurial aspirations, motivations, and their drivers.
Small Business Economics, 31(3), 323-339.
Hutchinson, K., Alexander, N., Quinn, B., & Doherty, A. M. (2007). Internationalization motives and facilitating
factors: qualitative evidence from smaller specialist retailers. Journal of International Marketing,, 15(3),
96-122.
International Trade Centre. (2016). SME Competitiveness in Ghana. Geneva: Alliances for Action.
106
Johanson, J., & Vahlne, J. E. (1977). The internationalization process of the firm: a model of knowledge and
increasing foreign market commitment. Journal of International Business Studies, 23-32.
Klein, S. (1989). A transaction cost explanation of vertical control in international markets. Journal of the Academy
of Marketing Science, 17(3), 253-260.
Klein, S., Frazier, G. L., & Roth, V. J. (1990). A transaction cost analysis model of channel integration in
international markets. Journal of Marketing research, 27(2), 196-208.
Knight, G. (2000). Entrepreneurship and marketing strategy: the SME under globalization. . Journal of International
Marketing , 8(2), 12–32.
Kos-Łabędowicz, J. (2013). nfluence of modern technologies on internationalization of small and medium
enterprises. Information Systems in Management, 2(1), 12-22.
Kuada, J. (2009). Gender, social networks, and entrepreneurship in Ghana. Journal of African Business, 10(1), 85-
103.
Lee, H., Kelley, D., Lee, J., & Lee, S. (2012). SME survival: The impact of internationalization, technology
resources, and alliances. . Journal of small business management, 50(1), 1-19.
Liñán, F., Paul, J., & Fayolle, A. (2019). SMEs and entrepreneurship in the era of globalization: advances and
theoretical approaches. . (2019). SMEs and entrepreneurship in the era of globalization: advances and
theoretical approaches. Small Business Economics, , 1-9.
Malhotra, M., Chen, Y., Criscuolo, A., Fan, Q., Hamel, I. I., & Savchenko, Y. (2007). Expanding Access to Finance:
Good Practices and Policies for Micro, Small and Medium Enterprises. Washington, D C: World Bank,.
Morrissey, O., & Udomkerdmongkol, M. (2012). Governance, private investment and foreign direct investment in
developing countries. . World development, 40(3), 437-445.
Organisation for Economic Co-operation and Development. (1997). Small Businesses, Job Creation and Growth:
facts, obstacles and best practices. France : OECD.
Richardson, C., & Rammal, H. G. (2018). Religious Belief and International Business Negotiations: Does Faith
Influence Negotiator Behaviour? International Business Review, 27(2), 401-409.
Rodriguez, C. (2004). Learning in the Internationalisation Process of Firms. International Marketing Review, Vol.
21 No. 1, pp. , 121-124.
Scott, W. R. (1995). Institutions and organizations Thousand Oaks. California : Sage.
Tse, D. K., Pan, Y., & Au, K. Y. (1997). How MNCs choose entry modes and form alliances: The China experience.
. Journal of international business studies, 779-805.
Volta River Authority. ( 2015 ). The Cost of ‘Dum-Sor’ on Ghana's Economy. Accra: VRA.
Wang, Y. (2016). What are the biggest obstacles to growth of SMEs in developing countries? e An empirical
evidence from an enterprise survey. Borsa Istanbul Review , 16(3), 167-176.
Wooldridge, J. M. (2013). Introductory econometrics: A modern approach. (5th ed.). Mason, OH: South-Western.
Yiu, D., & Makino, S. (2002). The choice between joint venture and wholly owned subsidiary: An institutional
perspective. Organization science, 13(6), 667-683.
107
Available online at www.asric.org
ASRIC Journal on Social Sciences & Humanities 1 (2020) 107-119
a Institute for Development Studies, University of Nigeria, Enugu State, Nigeria
b Department of Political Science and International Relations,
Godfrey Okoye University, Enugu, Nigeria
Received 19 December 2019; revised 30 January 2020; accepted 30 January 2020
Abstract
This study examined how partnership between Nigerian government and international private entities shape primary
healthcare development in Nigeria. At the global level, partnership in healthcare between the national governments
and international private entities takes the form of Global Public Private Partnerships (GPPPs) mostly driven by
global capitalist philanthropic foundations whose influence in healthcare funding and agenda-setting has
mushroomed, particularly since the adoption of the Millennium Development Goals (MDGs) and subsequently the
Sustainable Development Goals (SDGs) which articulated specific healthcare targets to be achieved globally. The
study is anchored on the gatekeeper state theory and employed documentary approach to collect secondary data
analyzed via qualitative descriptive method. Two key arguments are presented in the study. First, the study argued
that weak governance structure of Nigeria’s primary healthcare system undermine efficacy of GPPPs in the primary
health system. Second, with specific focus on the philanthropic activities of Bill and Melinda Gates Foundations
(BMGF) in Nigeria’s healthcare, the study argued that the self-serving capitalist interest of philanthropic
foundations involved in GPPPs undergird their episodic and disease-specific interventions in primary healthcare.
This rather enervates the primary healthcare system and undermine the efficient health service delivery through the
primary health system in Nigeria. The Nigerian experience demonstrates that government partnership with
international private capitalist entities is weakened by weak national health governance on the one hand, and the
capitalist interests of the private entities on the other hand. This situation undermined the attainment of ‘health for
all in 2000’, the attainment of MDGs 4, 5 & 6, and also threatens attainment of health components of the SDGs and
Africa’s Agenda 2063.
Keywords: public-private partnership; capitalist philanthropy; healthcare; primary health
1. Introduction
Primary healthcare is the basic unit of healthcare which provides basic preventive and curative health
services and usually serves as the first contact an individual has with a country’s healthcare system. It is
the essential healthcare based on practical, scientifically sound and socially acceptable methods and
technology, made accessible in the community through full community participation and at a cost that the
1 Corresponding author. Email addresses: [email protected] (K.C. Iwuamadi); [email protected], [email protected] (C.R. Okoli)
108
community and country can afford to maintain at every stage of their development to ensure sustainability
(World Health Organisation [WHO], 1978, p. 3). Meanwhile, the poor state of public health service
delivery in Nigeria particularly, at the primary health level occasioned by the failure of the Nigerian state
to finance health services necessitated the search for sustainable alternatives to augment healthcare
provisioning in the country. Hence, public private partnership (PPP) in healthcare provisioning has been
adopted by the government as one of the sustainable solutions to the inadequacies of Nigeria’s health
system especially at the primary healthcare level. Public private partnership involves mobilizing private
sector resources for government functions and development projects. It involves a long-term relationship
between government and private sector in sharing of risks and rewards with private sector agreeing to
specified performance level (African Union Commission, 2015, p. 6). At the global level, PPP takes the
form of Global Public Private Partnership (GPPP). The GPPP is usually consummated within the context
of capitalist philanthropy – a phenomenon that involves the employment of huge sums of private capital
and application of capitalist principles by corporate capitalist entities to address social problems so as to
remodel the public sector and the entire civil society in the image of the private sector. The overarching
objective of capitalist philanthropy is to entrench neoliberal principles through complementarity and
reduction of state intervention and responsibilities, devolution of powers to the non-state actors, and
accentuating hegemony of the philanthropists over the recipient (Morvaridi, 2016; Thompson, 2014;
Morvaridi, 2012).
Three successive global health agenda adopted at three different epochs have shaped the mushrooming
of GPPP in primary healthcare in the global South. The first is the 1978 Alma Ata Declaration, the second
is the Millennium Development Goals of 2000 which identified eight goals, three of which are health
related goals (MDGs 4, 5 & 6) to be achieved by the year 2015. The third is the Sustainable Development
Goals (SDGs) adopted in 2015 with a total 17 goals, six of which are health related goals to be achieved
by the year 2030. Apparently PPP is an important component of the SDGs given that SDG 17
(Partnerships for the Goals) emphasized the need for partnership between governments, private sector and
civil society at the global, regional, national and local level.
The adoption of the MDGs and subsequently, the SDGs has contributed to increasing GPPP
orchestrated by various Global Health Initiatives (GHIs) like the Global Alliance for Vaccines and
Immunisations (GAVI), proliferation of International Non-Governmental Organisations (INGOs) and
capitalist foundations focusing on achieving the health components of these global health agenda.
Consequently, the healthcare sector has emerged as a major area of intervention through the GPPP and
the biggest recipient of philanthropy globally in the last two decades. Within the health sector, primary
healthcare attracts the greatest attention as percentage of total donor commitments for health going to
primary health increased from 60% between 1990-98, to 70% between 1999 – 2004, and 80% between
2005 and 2011. In Africa, Nigeria remains a major destination of healthcare philanthropy, receiving about
528 million dollars in health aid in 2012 alone (Shaw, et al., 2015; Stuckler, Basu and McKee, 2011;
Beatrice, 1993). However, despite the various GPPPs and huge flow of capitalist philanthropy to the
primary health, it remains the weakest link in Nigeria’s health system (Tilley-Gyado, et al., 2016).
Since, the adoption of the MDGs and later SDGs, Nigeria has entered into various PPPs to address the
crisis at the primary healthcare level. The framework for PPP in Nigeria’s health sector is provided by the
2005 National Policy on Public Private Partnership for Health in Nigeria. Meanwhile, the role of GPPPs
especially those orchestrated with global philanthropic foundations in the health sector has been eulogized
and has been rehearsed as deus ex machina. Thus, the proselytization of GPPP as a solution to health
challenge in Africa and as a vehicle to sustainable healthcare provisioning requires more scrutiny. Yet,
existing scholarship focus too often on Public Private Partnerships (PPPs) between national government
and local private entities with little attention paid to the nuances in the outcome of GPPPs between
national government and global local private entities in the health sector. These literature largely
underreport the capitalist motive that undergird most philanthropic entities involved in such GPPPs. This
study therefore intervenes by interrogating the connection GPPPs between the Nigerian state and global
private philanthropic foundations in primary healthcare. Against this backdrop, the motivation of this
study derives from the abysmal performance of the primary health system despite the avalanche of
109
interventions by capitalist philanthropic foundations through GPPPs. Two key issues are highlighted in
the paper: First, weak governance structure of Nigeria’s primary healthcare system engendered by its
gatekeeper character undermines the efficacy GPPPs in the primary health system. Secondly, capitalist
philanthropic foundations involved in GPPPs are driven by their self-serving capitalist interests which
undergird their mode of interventions characterised by episodic and disease-specific interventions in
primary healthcare. This enervates the primary healthcare system and undermines efficient health service
delivery.
The study argues that Nigeria is a gatekeeper state pursuing the healthcare agenda set by external
agents including capitalist philanthropic foundations. This explains its emphasis on PPPs in the healthcare
sector and the perfunctory GPPPs it enters into with global philanthropic entities. It demonstrates that
capitalist philanthropic interventions through GPPPs in the health system of a gatekeeper state cannot
develop the health system to deliver quality health services, given that the health agenda pursued by the
capitalist foundations are shaped by their self-serving capitalist interests. The paper is organised into
seven main sections. Following the introduction is the conceptual review section which is followed
methodology section, the fourth section provides the theoretical perspective on which the argument is
anchored. The fifth section presents results and discussion of the study which provided details of
evolution of the primary health system in Nigeria, it analyzed how adoption of the MDGs and SDGs
contributed to the growth of GPPPs in the health sector, it then examined how health governance structure
impacts on GPPPs in the primary health system and how Nigeria’s GPPP with Bill and Melinda Gates
Foundation (BMGF) affects Nigeria’s primary health system. The sixth section presents conclusion of the
study and the last section proffers policy recommendations based on findings and discussion in the paper.
2. Conceptual Review
This section provides brief review of the basic concepts used in the study with a view to further
clarifying the meaning of the concepts as they have been employed in this study. Health governance
specifies how the different components of the health sector are financed by different institutions or layers
of government.
2.1 Public Private Partnership
In the health sector, PPP involves coming together of the public sector and the private sector including
non-government agencies to augment existing public health system with a view to providing efficient and
affordable health for all (Thadani, 2014). Public private partnership in healthcare may take place at
various levels. At the national level, it may involve partnership between the state and other local private
entities. At the global level, PPP usually takes the form of Global Public Private Partnership (GPPP) and
involves partnership between the state and other international private entities such as corporate
foundations, International Non-governmental Organizations (INGOs) and the likes (Gideon and
Unterhalter, 2017).
2.2 Capitalist Philanthropy
Philanthropy is a multi-faceted concept which implies love for humanity expressed by tangible
(money, materials, properties etc) and intangible (time, care, service, expertise, advice etc) giving to
promote the cause of humanity and address root causes of challenges facing mankind. Philanthropy
targets various aspect man’s life – security, economy, healthcare, education etc. (African Grantmakers
Network [AGN], 2015; Mottiar, 2015). Agents of philanthropy (or philanthropists) can be formal
(foundations, corporate entities, governments, NGOs etc) or informal (individuals, self-help groups,
community based associations etc). However, Morvaridi (2012b), notes that main motivation for
philanthropy is ideological and political because rich philanthropists are only satisfied to be concerned
with poverty in as much as it diverts attention away from their own assets and income and does not
threaten the hegemonic structure from which they benefit.
110
The concept of ‘capitalist philanthropy’ is used describe the devotion of large amount of private
capital by philanthropists for solving social problems using business strategies with the goal of
transforming the public sector in the image of the private capitalist sector in ways that profit the former
(Thompson, 2014).
2.3 Neo-liberalism
Neoliberalism is a political economy ideology which specifies minimal state intervention and
hegemony of self-regulated market. It emerged in the post-World War II era as an antidote to the threats
to capitalism and to provide ideological impetus to the expansionary character of capitalism with a view
to re-establishing conditions necessary for capital accumulation and dominance of economic elites
(Harvey, 2005). Accordingly, the central thrust of neoliberalism is that the state should exist to maintain
institutional frameworks appropriate for liberating individual entrepreneurial freedoms and entrenching
strong private property rights, free markets and free trade. Sue (2001) identified neoliberalism as the
global factor shaping healthcare reform in various states. According to writer, neoliberalism which is
based on the three cardinal principles of individualism, free market via privatization/deregulation and
decentralization has brought about a healthcare system which is akin to a market place that marginalizes
individuals who cannot purchase healthcare since the state cannot provide healthcare for the citizens.
2.4 Health governance
This has to do with the range of policy making and implementation functions in the health sector
carried out by institutions of government in the country. In line with this, USAID (2013), conceptualized
health governance as governance undertaken with the objective to protect and promote the health of the
people and involves setting strategic direction and objectives; making policies, laws, rules, regulations, or
decisions, and raising and deploying resources to accomplish the strategic goals and objectives; and
ensuring that the strategic goals and objectives are accomplished. Extending this definition, the World
Health Organization (WHO) opined that health governance has to do with overseeing and guiding the
health system as a whole, not just the public system, so as to protect the public interest (WHO, 2014).
Health governance involves 10 key components which includes: strategic vision, participation and
consensus orientation, rule of law, transparency, responsiveness, equity and inclusiveness, effectiveness
and efficiency, accountability, intelligence and information, and ethics (Siddiqi et al cited in WHO, 2014,
p. 10).
3. Methodology
This study employed case study design which allows for in-depth study of a specific or small number
of cases in their real-life context and understanding how the cases influence and influenced by their
contexts (Yin, 2009). To this end, the study focused on the PPP between the Nigerian government and the
BMGF with particular focus in the primary health level of care. Further, documentary approach was
adopted for data collection. Documentary method of data collection is considered appropriate for this
study because it is suitable for contextual analysis and is also useful when the task is to glean, illuminate,
interpret and extract valuable information from documents to draw inference from the available evidence
so as to reach a conclusion (Mogalakwe, 2006). Hence, we relied secondary sources from where relevant
data were drawn and analyzed qualitatively to demonstrate the arguments contained in the study.
4. Theoretical Perspective: Explaining capitalist philanthropy in Nigeria’s health sector within the
context of the gatekeeper state theory
The study is anchored on the gatekeeper state theory which explains how the postcolonial African
states have been structured to depend on external agents for articulation and implementation of reform
agenda. Coined by Cooper (2002), the basic proposition of the gatekeeper state theory is that colonialism
has structured postcolonial African states to depend on external agents for recognition, policy direction
111
and support. Hence, the states serve as ‘gates’ which are outward oriented and are not interested in
building institutions necessary for development nor are they able to provide basic services to the masses.
The gatekeeper state theory underpins the recurring crisis of development in Nigeria’s primary health
system where there is acute external dependence on external agencies, particularly capitalist philanthropic
entities in collaboration with other international donor organizations and INGOs for recognition, policy
direction and funding through GPPPs. Apparently, as a gatekeeper state, Nigeria has continued to depend
on ‘development partners’ and global development prescriptions for health policy direction and support,
thereby providing opportunities for capitalist philanthropists to shape the healthcare agenda by
unilaterally deciding which healthcare programme to implement at any point in time. Through GPPPs,
Nigeria has been a destination for healthcare philanthropy implemented under various labels such as
performance-based financing (PBF), funded by various international donors through the Health Results
Innovation Trust Fund (HRITF). However, the PBF is a health programme designed by academics and
professionals from the global North as an innovative approach to improve health sector performance
without input from beneficiary countries like Nigeria but adopted in the country because of donor
pressure (Paul, et al., 2018).
This theory further underscores how the intensification of neoliberalism and the adoption of global
programmes like the MDGs and now the SDGs have accentuated GPPPs in Nigeria thereby deepening the
global relations of dependence of Nigeria on capitalist philanthropists for healthcare agenda setting,
funding and implementation. This entrenches the gatekeeping role of the Nigerian state in the global
political economy. More so, given that the agenda of the capitalist philanthropists in the GPPPs is usually
self-serving, they neglect the most pressing problem of the primary health system which is institutional
capacity building and basic infrastructure required to strengthen the health system and service delivery.
For example, the primary health facilities in Nigeria are used for various routine immunization
programmes, yet much of these primary health facilities do not have functional facilities for storage and
preservation of the vaccines thereby exposing the vaccines to damage before use.
Empirical studies have demonstrated that much of the donor funded health programmes implemented
in developing countries including Nigeria are donor fads disconnected from the existing health system
institutions and fails to entrench effective health institution development (Paul, et al., 2018). This explains
why even where there are medical supplies, the challenge of infrastructure and medical personnel in the
primary health facilities thwart proper administration of the medical supplies to the needy patients. Thus,
the relations of global dependency on capitalist philanthropy for healthcare funding has seen growth in
fund implemented in ways that undermine Health System Strengthening (HSS) of Nigeria’s primary
health system. In line with the SDGs, the BMGF prioritise primary healthcare such as immunization,
family health with little attention to HSS required to sustainably reposition the primary health system for
effective healthcare delivery. Thus, disease-specific and episodic GPPPs between BMGF and the
Nigerian government in the health system only enervates the fledgling primary healthcare system in the
country.
5. Results and Discussion
5.1 Evolution and dynamics of primary health system in Nigeria
Three factors historically explain the evolution and dynamics of primary health system in Nigeria.
First, is the 1978 Alma Ata Declaration, second is the global adoption of the Washington Consensus
(WC) and Post Washington Consensus (PWC), and third is the adoption of the MDGs which has been
modified as SDGs. The 1978 Alma Ata Declaration was anchored on the philosophy of primary
healthcare as a means for actualizing affordable healthcare for all. Obviously, in the spirit of Alma Ata,
primary healthcare was conceived as a comprehensive healthcare system anchored on the principle of
addressing healthcare problem in developing countries by providing affordable health services to all
especially the grassroots people. This philosophy of universal health for all was shaped by the then
prevailing Keynesian political economy orthodoxy which stressed on welfarism. However, by mid 1980s,
the resurgence of liberalism as couched in the Washington Consensus led to the eclipse of institutions like
112
World Health Organisation (WHO) by the World Bank on health related issues. This began to inflect the
philosophy that underpin the primary health, as primary health system and emphasis was placed on
primary health as cost saving health mechanism instead of institution for promoting universal healthcare.
Hence, since the 1980s, the World Bank’s economic reform programmes have continued to shape the
development of primary health in developing countries and has led to deviation from universal health
principle on which the Alma Ata model of primary health was anchored to primary health models
designed mainly as cost-cutting measures to be adopted by developing countries implementing Structural
Adjustment Programmes (SAPs). In line with the neoliberal philosophy of adopting the primary health as
a cost-cutting measure, in 1987 the Bamako Initiative was introduced by the United Nations Children
Emergency Fund (UNICEF) and WHO, and adopted by African Ministers of Health in Bamako, Mali.
The central philosophy guiding the Bamako Initiative was to pass the cost of providing basic health care
to users and communities through the primary health mechanism in the face of dwindling government
healthcare expenditure occasioned by implementation of SAPs. This philosophy gave impetus to the
launching of primary health system in Nigeria for the first time in 1988 through the National Health
Policy. Federal government budgetary allocation to health during the SAP period remained among the
worse in Nigeria’s history, ranging from N0.13billion in 1986, N 0.04 billion in 1987, N 0.42 billion in
1988, N 0.58 billion in 1989, N 0.50 billion in 1990 and N 0.62 billion in 1991 (Central Bank of Nigeria
[CBN], 2015).
By the beginning of the 21st century, the adoption of the MDGs and later the SDGs (in 2015) saw the
enunciation of healthcare goals as global agenda to be actualised through global partnership between
states and various stakeholders including philanthropic foundations. The emphasis on global partnership
and role of non-state actors in actualization of health agenda of the MDGs and SDGs contributed to the
increase in activities of capitalist philanthropic foundations in health system of African countries
particularly the primary health system.
5.2 How did MDGs/SDGS engender GPPP in Nigeria’s primary healthcare?
The last two decades have seen participation of international organisations, donor agencies, states, and
capitalist foundations in articulation, funding and implementation of global health agenda. The MDGs
were adopted by 189 United Nations members in 2000 as a global health agenda to be achieved by the
year 2015. Hence, the MDGs re-energised the spirit of the Alma Ata Declaration by committing nations
to a set of healthcare targets that must be attained by 2015. Three out of the eight MDGs focused on
primary health related issues (MDGs 4, 5 & 6). Meanwhile, the MDGs were framed as end products of
implementing the Poverty Reduction Strategy Papers (PRSP) articulated by the International Monetary
Fund (IMF) and foisted on many African countries as the overarching development strategy of the early
twenty-first century (Weber, 2006). The implication of this is that health crisis in the developing
countries was framed as a challenge to all including the developed countries and there was need for
partnership to mitigate health crisis. The MDGs therefore provided the justificatory marker for capitalist
foundations to intervene directly in healthcare systems of African countries or do so in collaboration with
other INGOs, donor agencies and Bretton Woods institutions under the guise of GPPPs. This has led to
proliferation of new actors and massive resources to the health sector as well as adoption of new
strategies to address health problems (Kruk, 2012).
In Nigeria, the National Economic Empowerment and Development Strategy (NEEDS) was
articulated and adopted in 2004 as the overarching development framework for actualizing the MDGs and
overall development of the country. This was done with the assistance of the Bretton Woods institutions
and in line with the basic principles of the PRSPs. The NEEDS identified improving healthcare delivery
and development of the health sector, especially the primary health system as critical to overall poverty
reduction. The document specifically stated that ‘the plan is to improve the system of healthcare delivery,
with emphasis on HIV/AIDS and other preventable diseases, such as malaria, tuberculosis and
reproductive health-related illness’ (Nigerian National Planning Commission [NPC], 2004, p. xi). More
so, NEEDS was bandied to development partners including philanthropic foundations as a veritable tool
for attaining the MDGs and as a justification for their assistance through philanthropy. Hence, the
113
adoption and articulation of the MDGs into Nigeria’s development framework enlarged the space for
increased intervention of philanthropic organisations in Nigeria’s primary healthcare system.
Similarly, the adoption of the SDGs saw renewed effort to strengthen GPPPs between national
governments and global private entities. This is because, just like the MDGs, the SDGs identified health
related targets (goals 3 and 6) to be achieved by 2030 and also stressed on need for partnerships between
various stakeholders in actualizing the SDGs. Hence, the pursuit of the SDGs has led to intensification of
partnership between Nigeria and various international private agencies in the area of healthcare in order to
achieve the SDGs by 2030. The increasing philanthropic activities of BMGF in primary healthcare is
underscored within this context. Hence, BMGF healthcare philanthropy in Nigeria focus on four key
health related issues which include: polio; improving family health; healthcare system strengthening;
improving child nutrition. More recently, in 2019, the Foundation pledged a whopping $75million dollars
to tackle immunization in the next five years in Nigeria
5.3 Nigeria’s Healthcare Governance Structure and GPPPs in Primary Healthcare
Despite the growth of GPPPs in the primary healthcare, the structure of healthcare governance in
Nigeria weakens the efficacy of the GPPPs in enhancing healthcare provisioning in the country. Nigeria
practices a federal system of government with three levels of government – the federal, state and local
governments. There are 774 local governments, 36 states and Abuja as the federal capital territory. The
health governance structure also reflects the three tier structure of the federal system with the federal
government primarily responsible for tertiary health care, state government responsible for secondary
health care, and local government authority responsible for primary health care. The tertiary healthcare
has to do with specialized consultative healthcare, focusing mainly on curative care usually for inpatients
and those on referral from a primary or secondary health professional, it is also involved in teaching and
research. The secondary healthcare is administered by the state government and provided by
comprehensive health centres and general hospitals supervised by the State Ministry of Health (SMoH).
Other services at the secondary healthcare include curative care, radiological, diagnostic, referral and
emergency medical and surgical services. The primary healthcare is the first level of care provided by
frontline health workers with focus on services that include antenatal care, childbirth care including health
education and promotion, simple laboratory tests and preventive interventions. The local government
authority (LGA) is responsible for managing the health service delivery at the primary level (Federal
Ministry of Health [FMoH], 2011).
Currently, primary healthcare is considered as the foundation of the country’s healthcare system and
all the three tiers of government are involved in the governance of primary healthcare. The federal
government does so through the Federal Ministry of Health and the National Primary Healthcare
Development Agency (NPHCDA) which provides technical and financial support. The state government
intervenes through the State Primary Health Care Development Agency (SPHCDA) and State Ministry of
Health (SMoH) which provide financial and technical support and also coordinates the activities of
primary health facilities in the state. The local government which is the weakest level of government in
the country focuses on provision of services, recruitment, retention and deployment of staff. Figure 1
presents illustration of this multi-stakeholder involvement in primary healthcare management in Nigeria. Obviously, this existence of multiple levels of governance with concurrent and overlapping
responsibility for primary health care constitutes a serious challenge for the primary health system
especially when it comes to coordinating activities of various donor entities involved in different GPPPs
with the three different layers of government in the country.
The framework for PPP in Nigeria is provided by the 2005 National Policy on Public Private
Partnership for Health in Nigeria. The policy recognizes PPP as a collaborative relationship between
government and private sectors including not for profit entities, aimed at harnessing human and material
resources for efficient healthcare provisioning for all in Nigeria. The PPP policy framework recognized
four key partners in the PPP arrangement to include:
i. The public sector players which include the Executive and Legislative bodies in all the three
tiers of government as well as other public institutions including key health parastatals;
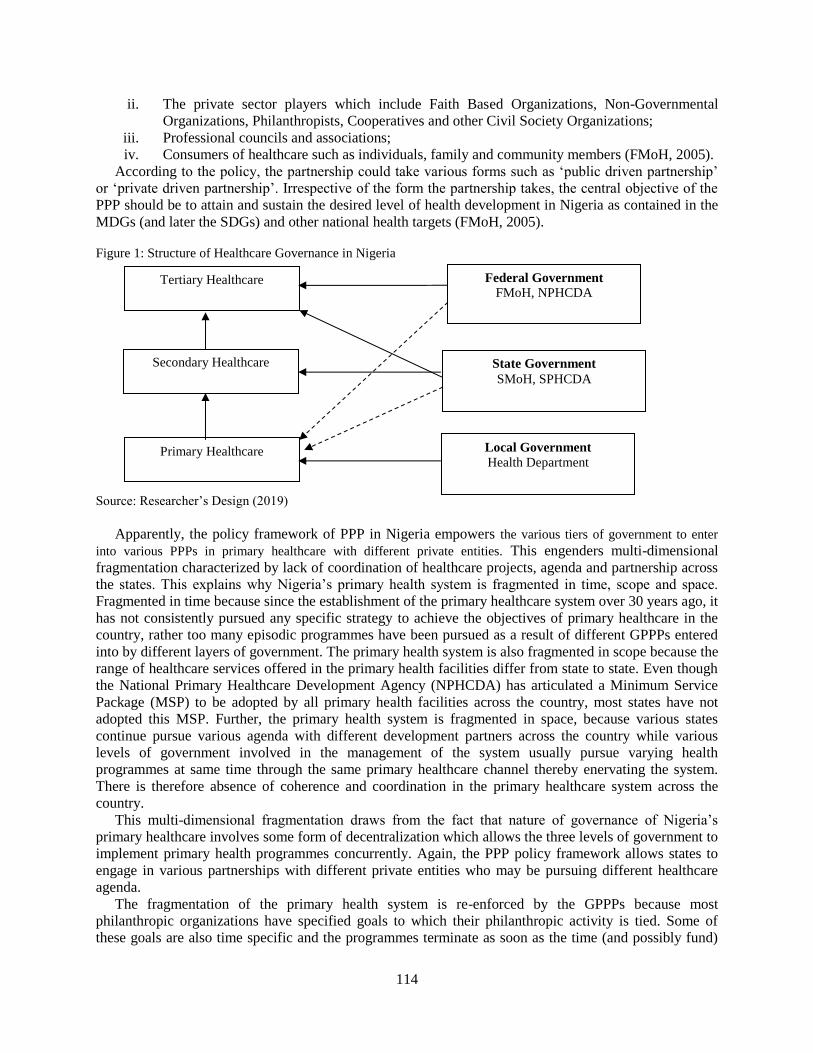
114
ii. The private sector players which include Faith Based Organizations, Non-Governmental
Organizations, Philanthropists, Cooperatives and other Civil Society Organizations;
iii. Professional councils and associations;
iv. Consumers of healthcare such as individuals, family and community members (FMoH, 2005).
According to the policy, the partnership could take various forms such as ‘public driven partnership’
or ‘private driven partnership’. Irrespective of the form the partnership takes, the central objective of the
PPP should be to attain and sustain the desired level of health development in Nigeria as contained in the
MDGs (and later the SDGs) and other national health targets (FMoH, 2005).
Figure 1: Structure of Healthcare Governance in Nigeria
Source: Researcher’s Design (2019)
Apparently, the policy framework of PPP in Nigeria empowers the various tiers of government to enter
into various PPPs in primary healthcare with different private entities. This engenders multi-dimensional
fragmentation characterized by lack of coordination of healthcare projects, agenda and partnership across
the states. This explains why Nigeria’s primary health system is fragmented in time, scope and space.
Fragmented in time because since the establishment of the primary healthcare system over 30 years ago, it
has not consistently pursued any specific strategy to achieve the objectives of primary healthcare in the
country, rather too many episodic programmes have been pursued as a result of different GPPPs entered
into by different layers of government. The primary health system is also fragmented in scope because the
range of healthcare services offered in the primary health facilities differ from state to state. Even though
the National Primary Healthcare Development Agency (NPHCDA) has articulated a Minimum Service
Package (MSP) to be adopted by all primary health facilities across the country, most states have not
adopted this MSP. Further, the primary health system is fragmented in space, because various states
continue pursue various agenda with different development partners across the country while various
levels of government involved in the management of the system usually pursue varying health
programmes at same time through the same primary healthcare channel thereby enervating the system.
There is therefore absence of coherence and coordination in the primary healthcare system across the
country.
This multi-dimensional fragmentation draws from the fact that nature of governance of Nigeria’s
primary healthcare involves some form of decentralization which allows the three levels of government to
implement primary health programmes concurrently. Again, the PPP policy framework allows states to
engage in various partnerships with different private entities who may be pursuing different healthcare
agenda.
The fragmentation of the primary health system is re-enforced by the GPPPs because most
philanthropic organizations have specified goals to which their philanthropic activity is tied. Some of
these goals are also time specific and the programmes terminate as soon as the time (and possibly fund)
Tertiary Healthcare
Secondary Healthcare
Primary Healthcare
Federal Government
FMoH, NPHCDA
State Government
SMoH, SPHCDA
Local Government
Health Department
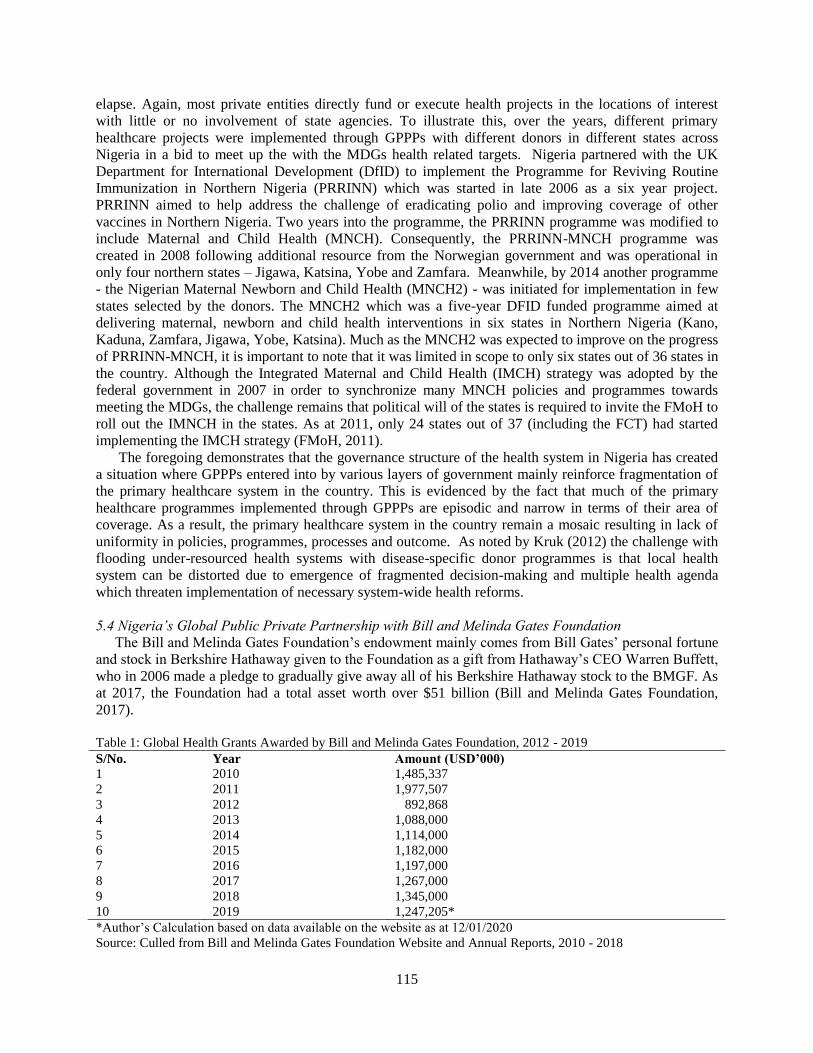
115
elapse. Again, most private entities directly fund or execute health projects in the locations of interest
with little or no involvement of state agencies. To illustrate this, over the years, different primary
healthcare projects were implemented through GPPPs with different donors in different states across
Nigeria in a bid to meet up the with the MDGs health related targets. Nigeria partnered with the UK
Department for International Development (DfID) to implement the Programme for Reviving Routine
Immunization in Northern Nigeria (PRRINN) which was started in late 2006 as a six year project.
PRRINN aimed to help address the challenge of eradicating polio and improving coverage of other
vaccines in Northern Nigeria. Two years into the programme, the PRRINN programme was modified to
include Maternal and Child Health (MNCH). Consequently, the PRRINN-MNCH programme was
created in 2008 following additional resource from the Norwegian government and was operational in
only four northern states – Jigawa, Katsina, Yobe and Zamfara. Meanwhile, by 2014 another programme
- the Nigerian Maternal Newborn and Child Health (MNCH2) - was initiated for implementation in few
states selected by the donors. The MNCH2 which was a five-year DFID funded programme aimed at
delivering maternal, newborn and child health interventions in six states in Northern Nigeria (Kano,
Kaduna, Zamfara, Jigawa, Yobe, Katsina). Much as the MNCH2 was expected to improve on the progress
of PRRINN-MNCH, it is important to note that it was limited in scope to only six states out of 36 states in
the country. Although the Integrated Maternal and Child Health (IMCH) strategy was adopted by the
federal government in 2007 in order to synchronize many MNCH policies and programmes towards
meeting the MDGs, the challenge remains that political will of the states is required to invite the FMoH to
roll out the IMNCH in the states. As at 2011, only 24 states out of 37 (including the FCT) had started
implementing the IMCH strategy (FMoH, 2011).
The foregoing demonstrates that the governance structure of the health system in Nigeria has created
a situation where GPPPs entered into by various layers of government mainly reinforce fragmentation of
the primary healthcare system in the country. This is evidenced by the fact that much of the primary
healthcare programmes implemented through GPPPs are episodic and narrow in terms of their area of
coverage. As a result, the primary healthcare system in the country remain a mosaic resulting in lack of
uniformity in policies, programmes, processes and outcome. As noted by Kruk (2012) the challenge with
flooding under-resourced health systems with disease-specific donor programmes is that local health
system can be distorted due to emergence of fragmented decision-making and multiple health agenda
which threaten implementation of necessary system-wide health reforms.
5.4 Nigeria’s Global Public Private Partnership with Bill and Melinda Gates Foundation
The Bill and Melinda Gates Foundation’s endowment mainly comes from Bill Gates’ personal fortune
and stock in Berkshire Hathaway given to the Foundation as a gift from Hathaway’s CEO Warren Buffett,
who in 2006 made a pledge to gradually give away all of his Berkshire Hathaway stock to the BMGF. As
at 2017, the Foundation had a total asset worth over $51 billion (Bill and Melinda Gates Foundation,
2017).
Table 1: Global Health Grants Awarded by Bill and Melinda Gates Foundation, 2012 - 2019
S/No. Year Amount (USD’000)
1 2010 1,485,337
2 2011 1,977,507
3 2012 892,868
4 2013 1,088,000
5 2014 1,114,000
6 2015 1,182,000
7 2016 1,197,000
8 2017 1,267,000
9 2018 1,345,000
10 2019 1,247,205*
*Author’s Calculation based on data available on the website as at 12/01/2020
Source: Culled from Bill and Melinda Gates Foundation Website and Annual Reports, 2010 - 2018
116
The Foundation has 15 guiding principles driven by the interests and passions of the Gates family and
the annual letter from Mr. Gates setting out the Foundation’s agenda for the year. Currently, BMGF is the
largest private philanthropy in global health, with financing greater than the budget of the entire WHO
(Stuckler, Basu and McKee, 2011). Table 1 presents grants awarded by BMGF under its global health
programmes between 2012 and 2019.
The BMGF philanthropic activities particularly in healthcare funding is influenced by its business
interest in pharmaceutical companies. This is underscored by the level of direct and indirect investment of
the Foundation in pharmaceutical companies that benefit from its healthcare grants for vaccine production
and the number of the Foundation’s management committee members who are serving or previously
board members of such major pharmaceutical companies. Detailed analysis by Stuckler, Basu and
McKee, (2011), has shown that about half of the Foundation’s stock holdings are invested in Berkshire
Hathaway, which is a conglomerate holding company owning several subsidiary companies, including
ownership in leading pharmaceutical companies like GlaxoSmithKline, Johnson & Johnson and Procter &
Gamble. This explains why more than 97 per cent of the Foundation’s healthcare granted are directed to
infectious diseases and a large chunk of the Foundation’s financial transfers in global health are invested
in programmes developing medical technologies from which some the pharmaceutical companies in
which the Foundation is invested benefit. For instance, Johnson & Johnson is reported to have entered a
clinical partnership to develop new HIV-prevention technology which it considers a strong, strategic and
comprehensive relationship with the BMGF (McCoy, et al. cited in Stuckler, Basu and McKee, 2011).
The investment structure and board composition of the BMGF and business interest of the companies in
which the Foundation is invested demonstrates that the concentration of the Foundation’s philanthropic
funding and activities in the health sector is not a creatio ex nihilo. Rather, the funding of healthcare is
informed by the business interest of the Foundation in pharmaceutical companies. Again, by funding
medical technologies and consumable produced by the pharmaceutical companies in which it has business
interest, the Foundation provides global competitive advantage for such pharmaceutical companies and
thereby increasing the revenue accruable to the BMGF.
It is within the context of the capitalist approach of the BMGF that its GPPP with Nigeria in primary
healthcare can be understood. Hence, in line with the overarching capitalist interest of the Foundation, the
Foundation’s philanthropy in Nigeria prioritised the following core areas which are within the primary
healthcare. These focal areas are eradication of polio, improving family health, strengthen healthcare
systems, improving Nutrition.
In terms of their philanthropic strategies in Nigeria, BMGF provides funding for multiple stakeholders
including international donor agencies working in Nigeria, government at the national and subnational
levels, private entities, international non-governmental organisations and domestic agencies to implement
multiple sectoral programmes and projects particularly healthcare programmes.
Evidently, enormous fund has spent by the BMGF on primary health through GPPPs in Nigeria.
However, the primary health system remains weak measured in terms of available of infrastructure and
skilled medical personnel required to deliver healthcare services. It needs to be noted that the health
system comprises of organizations, people and actions whose primary intent is to promote, restore or
maintain health. It consists of six building blocks identified by WHO to include health services, health
workforce, health financing, health information system, leadership and governance, medical products,
vaccines & technologies (World Health Organization [WHO], 2007). Accordingly, Health System
Strengthening (HSS) is the application of technical knowledge and political will in improving these six
health system building blocks and managing their interaction in ways that achieve more equitable and
sustained improvements across health services and health outcomes (WHO, 2007). A well-functioning
primary healthcare system require ‘system-wide’ investments to assure effective priority setting; sound
management, administrative and financial planning; up-to-date ‘health management information systems’
for resource tracking; and appropriate regulatory and accountability Mechanisms (Shaw, et al., 2015).
Much of the healthcare projects funded by the BMGF through GPPP in Nigeria are disease-specific
focusing on one disease or the other like polio, malaria and other infectious diseases. Hence, aside the
117
poor attention to strengthening the health system through investment in human capacity and
infrastructural development, the implementation of multiple and uncoordinated healthcare projects
through various stakeholders fragments and enervates the primary health system.
This fragmented primary health system and lack of uniform healthcare programme across the primary
health facilities in the country explains, why the country has continued to experience different episodes of
infectious diseases in different locations at different periods. Attempts to address this fragmentation in
the primary healthcare programmes through establishment of the Primary Health Care Under One Roof
(PHCUOR) in 2005 has not yielded the desired result as different levels of government continue to
implement different healthcare projects funded by different or the same donors.
The primary health system as a whole still suffers from inadequate skilled medical personnel as issue
of staffing does not receive desired attention in the GPPPs entered into with capitalist philanthropic
foundations including the BMGF. In most cases ad hoc personnel are used to implement specific
programmes like routine immunization and other disease-specific programmes. Not much attention is
being given to enhance the capacity of Community Health Workers (CHEWs) who are regarded as the
‘barefoot doctors’ necessary for successful implementation of primary healthcare programmes. The
importance of the CHEWs in building as sustainable healthcare system cannot be overemphasised.
Again, not much is being done to enhance the management structures of the primary healthcare
system. Most of communities do not have well developed healthcare management mechanisms such as
the recommended Ward Development Committees (WDC) and the Community/Village Development
Committees (CDC), which serve as mechanism for community participation in the management of the
primary healthcare. The implication of this is that the communities who are expected to actively
participate in the management and ownership of the primary health system in their various locations
remain alienated from the system in terms of management and decision making. This alienation of the
community may result in resistance to implementation of healthcare programmes. For example, in 2003
some northern states in Nigeria (particularly, Kano, Zamfara and Kaduna) boycotted immunization and
parents were called upon by community leaders not to allow their children to be immunised on the ground
that the vaccine was contaminated with anti-fertility agents (Jegede, 2007). This boycott could be linked
to be general distrust arising from the non-participation of community leaders in the whole process of
healthcare management. Such boycott may have been averted if the communities had strong mechanisms
for participation in the whole gamut of primary healthcare programmes. Another implication of weak or
absence of strong mechanisms for community participation in primary healthcare management and
programme implementation is that the communities may not sustain projects initiated and implemented
through GPPPs with philanthropic foundations but would perpetually depend on inflow of funding from
philanthropic organization. This is because implementation of new healthcare programmes without
concomitant strengthening of the healthcare system is likely to yield unsustainable health gains and may
even undermine the trust of communities in their health system (Kruk, 2012).
6. Conclusion
The proselytization of PPP as a solution to health challenge in Africa and as a vehicle for sustainable
healthcare provisioning requires more scrutiny. Yet, existing scholarship focus more on PPPs between
national government and local private entities with little attention paid to the nuances in the outcome of
GPPP between national government and global private entities in the health sector. This study has
examined the connection GPPP between the Nigerian state and global private philanthropic foundations
in primary healthcare with specific focus on the BMGF. The study notes that the intensification of
neoliberalism towards the end of the twentieth century with the reformulation of WC into the Post
Washington Consensus (PWC) as the dominant neoliberal ideology saw the glorification of PPPs as a
basic principle sustainable development.
In healthcare, the framing of primary health issues and the mainstreaming of healthcare in the MDGs and
SDGs saw increased intervention by private philanthropic foundations through GPPPs in health systems
of national governments. Hence, a lot of GPPPs have been orchestrated between the Nigerian state and
118
various global private philanthropic foundations. However, the weak healthcare governance structure
which allows the three tiers of government to intervene in the primary health system concurrently
undermines the GPPPs by predisposing the system to fragmentation and simultaneous implementation of
overlapping health programmes. Further, through the GPPPs with various tiers of government, the BMGF
prioritised funding of various episodic and disease-specific primary healthcare programmes implemented
by multiple stakeholders (federal government, state governments, local governments, INGOs and other
development partners). However, while the primary healthcare system was the major healthcare channel
used for implementing most of the health related programmes, not much attention was given to
infrastructural and human capacity development. Consequently, the primary healthcare system has
remained enervated by the multitude of stakeholders implementing healthcare programmes in overlapping
manner occasioned by lack of coordination of the programmes. This has continued to undermine efficient
healthcare service delivery through the primary health system in Nigeria.
7. Policy Recommendations
In the light of findings and discussion contained in this study, the following policy recommendations are
put forward:
i. The Nigerian state should address the governance gap in the health sector by ensuring that all
the 36 states of the federation establish the State Primary Healthcare Development Agencies
(SPHCDA) while the National Primary Health Care Development Agency (NPHCDA)
should be strengthened to coordinate activities of the SPHCDAs across the 36 states
particularly in the area of PPP and implementation of donor projects. This will help in
actualizing the dreams of the Primary Health Care Under One Roof (PHCUOR).
ii. There should also be revised National Primary Health Care Development Policy at the
national level while states should have State Primary Health Care Development Policy in line
with the vision of the national policy. These policies will specify the roles of each tier of
government and the long term health programme and priorities of the government in the area
of primary health care development. This will go a long way in addressing overlap and
fragmentation in the primary healthcare system.
iii. International philanthropic organizations and the private sectors willing to assist the
government in primary healthcare development through PPP must adopt participatory
approach to ensure that the projects are not only needs-based but that the beneficiaries from
their healthcare philanthropy are involved in setting the agenda and implementation strategy
of the healthcare projects in the countries. This will ensure that PPPs and GPPPs are mutually
beneficial and healthcare programmes implemented through such partnerships remain
sustainable.
References
African Grant Makers Network (AGN) (2015). Constructing a developmental and transformational philanthropy in
Africa: Towards a new regulatory common sense. South Africa: South African Trust. Available online at
http://www.southernafricatrust.org/constructing-a-developmental-and-transformational-philanthropy-in-
africa/ (Accessed 01/06/2017)
African Union Commission, (2015). Agenda 2063, the Africa We Want: First Ten-Year Implementation Plan, 2014
– 2023.
Ake, C. (1981). A political economy of Africa. England: Longman Group Limited.
Amin, S. (2014). Understanding the political economy of contemporary Africa. Africa Development, XXXIX(1), 15-
36.
Beatrice, D. F. (1993). The role of philanthropy in health care reform. Health Affairs, 12(2), 185 – 193.
Bill and Melinda Gates Foundation, (2017). Consolidated Financial Statements, December 31, 2017 and 2016.
Bump, J. B. (2015). The long road to universal health coverage: Historical analysis of early decisions in Germany,
the United Kingdom, and the United States. Health Systems & Reforms, 1(1), 28-38.
119
Central Bank of Nigeria (CBN) (2015). 2015 statistical bulletin. accessed 15/05/2019, https://www.cbn.gov.ng,
Central Bank of Nigeria (CBN) (2015). 2015 Statistical Bulletin. Available online at https://www.cbn.org retrieved
16 05 2019.
Cooper, F. (2002). Africa since 1940: The past of the present. Cambridge, UK: Cambridge University Press.
Federal Ministry of Health (FMoH) (2005). National Policy on Public Private Partnership for Health in Nigeria.
Abuja: Federal Ministry of Health.
Federal Ministry of Health (FMoH) (2011). Saving newborn lives in Nigeria: Newborn health in the context of the
integrated maternal, newborn and child health strategy. 2nd
edition. Abuja: Federal Ministry of Health,
Save the Children.
Harvey, D. (2005). A brief history of neoliberalism. New York: Oxford University Press.
Jegede, A. S. (2007). What led to the Nigerian boycott of the polio vaccination campaign? PLoS Med, 4(3), 0417-
0422.
Kruk, M. E. (2012). Globalisation and global health governance: Implications for public health. Global Public
Health, 7(sup1), S54-S62.
Mogalakwe, M. (2006). The Use of Documentary Research Methods in Social Research, African Sociological
Review, 10(1), 221-230
Morvaridi, B. (2012). Capitalist philanthropy and hegemonic partnerships. Third World Quarterly, 33(7), 1191-
1210.
Morvaridi, B. (2016). Does sub-Saharan Africa need capitalist philanthropy to reduce poverty and achieve food
security? Review of African Political Economy, 43(147), 151-159.
Mottiar, S. (2015). Philanthropy and development in Southern Africa: Philanthropy and resource governance.
Southern Africa Trust Research Report. Available online at
http://www.southernafricatrust.org/philanthropy-development-in-southern-africa/ (Accessed 01/06/2017)
Nigeria National Planning Commission (NPC) (2004). Meeting everyone’s needs: National economic empowerment
and development strategy. Abuja: Nigeria National Planning Commission.
Paul, E. Albert, L., Bisala, B. N., Bodson, O., Bonnet, E., Bossyns, P.,…Ridde, V. (2018). Performance-based
financing in low-income and middle-income countries: isn’t it time for a rethink? BMJ Glob Health, 3, pp.
1-7. doi: 10.1136/bmjgh-2017-000664
Reubi, D., Herrick, C. & Brown, T. (2016). The politics of non-communicable diseases in the global South. Health
& Place, 39, 179-187.
Shaw, R. P., Wang, H., Kress, D. & Hovig, D. (2015). Donor and domestic financing of primary health care in low
income countries. Health Systems & Reform, 1(1), 72-88.
Stuckler, D., Basu, S. & McKee, M. (2011). Global health philanthropy and institutional relationships: How should
conflicts of interest be addressed? PLoS Med 8(4), 1-10.
Sue, L. T. M. (2001). Neoliberalism and health care. International Journal of Consumer Studies – Special edition on
Consumers and Health, 25(2), 82-89.
Thompson, C. B. (2014). Philanthrocapitalism: appropriation of Africa’s genetic wealth, Review of African Political
Economy, 41(141), 389-405.
Tilley-Gyado, R., Filani, O., Morhason-Bello, I., & Adewole, I. F. (2016). Strengthening the primary care delivery
system: A catalytic investment toward achieving universal health coverage in Nigeria. Health Systems &
Reforms, 2(2), 227-284.
Weber, H. (2006). A political analysis of the PRSP initiative: Social struggles and the organization of persistent
relations of inequality. Globalizations, 3(2), 187-206.
World Health Organization (WHO) (1978). Alma-Ata 1978: Primary healthcare. Report of the International
Conference on Primary Health Care, Alma-Ata, USSR, 6-12 September 1978. Geneva: WHO
World Health Organization (WHO) (2007). Everybody business: Strengthening health systems to improve health
outcomes: WHO’s framework for action. Geneva, Switzerland: WHO Document Production Services.
World Health Organization [WHO] (2014). Health systems governance for universal health coverage. Geneva,
Switzerland: World Health Organization.
Yin, R. (2009). Case study research: Design and methods (5th edition). London: Sage.
Yip, W. & Hsiao, W. C. (2015). What drove the cycles of Chinese health system reforms? Health Systems &
Reform, 1(1), 52-61.

ii
iii
iv
v
Table of Contents
Yield and Quality of Date Palm (Phoenix dactylifera L.) Product under Deficit Irrigation Regimes in Dry
Conditions ..................................................................................................................................................... 1
Effect of Inter Spaces and Emitter Types on the Hydraulic Performance of Drip Irrigation System ........... 9
Improving Adaptive Water and Nutrient Management in Food Value Chains for Climate Change
Adaptation: A Case of Sensor Technology in Malawi ................................................................................ 17
Performance Evaluation of Small Scale Irrigation Schemes By Using Process and Comparative
Indicators: Case Study on Golina and Kokono Small Scale Irrigation Schemes, North Wollo Zone,
Amhara Region, Ethiopia ............................................................................................................................ 34
Assessing the effect of water management regimes on the growth of Tomatoes in Abeokuta, South West
Nigeria ........................................................................................................................................................ 61
Changing Patterns of Rainfall and Temperature: A potential threat undermining effects of zero hunger and
poverty in Nigeria ....................................................................................................................................... 68
1
Available online at www.asric.org
ASRIC Journal on Water, Energy & Environment 1 (2020) 1-8
a Dept. of Agric. Eng., Faculty of Agriculture, University of Khartoum-Sudan
b Alkharj Center for Date Palm Research, Kingdom of Saudi Arabia
Received 19 December 2019; revised 30 January 2020; accepted 30 January 2020
Abstract
This study was conducted to determine appropriate irrigation amount, fruit quality and water-yield relationship
for date palm under dry conditions. The research work was carried out in Alkharj, Kingdom of Saudi Arabia, for two
consecutive seasons (2016-2017) and (2017-2018). The treatment contained four irrigation water amounts, (ETC
100%, ETC 75% and ETC 50%) of date palm tree water requirement and the amount of water actually used
(control). A mature date palm trees (Segae variety) of the same age (10 years) were selected randomly to perform
the experiment in both seasons. The experiment was organized in Complete Block Design (CBD) and the analysis
was done using SPSS. The measured parameters were water productivity (kg/m3), yield parameter’s (weight of date
fruit /g and productivity kg/tree), and quality parameter’s ( moisture content (%), total soluble solid (TSS %),
Brominated (%) of date fruit and Veneer (%)). Moreover, the quality of irrigation water used, was assessed and
compared with FAO standard for irrigation water. The result showed that the water quality was found within the
permissible level of FAO standard for irrigation water. The result also indicated that the amount of water using in
the study area, is more than the actual amount of water needed by date palm tree (ETc100%) according to the local
weather. Moreover, the water treatment (75% ETc) showed the highest significant differences (P≤ 0.05) of water
productivity, moisture content, and (TSS%). While water treatment (100% ETc) revealed the highest values of
productivity in both seasons followed by (75% ETc). Moreover, the Brominated and Veneer values were found
within the recommended level according to the local standard. However, the water treatment (50% ETc) showed a
high significant difference (P≤ 0.05) in compared with others treatments. This study concluded that date palm can
growth perfectly with high yield and product quality with water regime ETc 75%. Therefore, huge amount of water
can be saved when adopting this regime for date palm production.
Keywords: Deficit irrigation; Date palm; Water productivity; Date palm fruit quality
1. Introduction
The Kingdom of Saudi Arabia, covered an area of 2.15 million km², is by far the largest country on the
Arabian Peninsula. Saudi Arabia lies in the tropical and subtropical desert region. Therefore, it is facing
great challenges due to its limited water resources for agricultural development and sustainability.
Searching for new water resource in Saudi Arabia is too difficult and very expensive process, so the
shortest way to maximize the water use efficiency through optimizing water use and determination the
actual crop water requirements. The overestimation of water requirements result in wastage of precious
1Corresponding author. Email addresses: [email protected], [email protected] (A.W.M. Elamin)
2
water resources and impacts adversely on the economic, social and environmental levels. A correct
estimation of ETc improving water management by changing the volume and frequency of irrigation
based on actual crop water requirements and soil characteristics. Moreover, enhancement of irrigation
systems and water saving regimes identified as a main factors of reducing agricultural water demand
(Horst et. al., 2005).
The date Palm tree is (the tree of life in the desert areas) is the one of the oldest trees known to man
which is cultivated since ancient times. Nowadays, studies and trials are continued to develop agricultural
operations that needed to produce date Palm such as water requirement, fertilization …..etc.
The estimation the numbers of date palm trees in the world is approximately 100 million Palm, there
are 80 million palm trees in the Arab world alone, which is equivalent to 80% of number of palms in the
world, and average annual production of about 3 million tons /year, which is equivalent to 80% of the
world production of dates.
The date palm tree is considered as one of the most important fruit for its high nutritional value, as
well as it is well adapted to harsh arid climate, (Bhat et.al., 2012). The previous studies showed that date
palm tree produces one kg of fruits using about 2 m3 of water. While, Barreveld, (1993), stated that the
water requirements of date palm tree varied according to the climate, crop age and location. The seasonal
gross irrigation requirements for date palm offshoots were 2191 m3/ha/year, while the farmers added
water nine times as much as the actual gross irrigation requirements. (Abdurrahman, et al., 1996).
Therefore, Bhat et.al., ( 2012), reported that in the perennial crops it is essential to know both total and
seasonal water requirements as to tie between plant water requirements with the available water supply.
In KSA, the date palm annual evapotranspiration is approximately 1644 mm, while the crop coefficients
values ranged from 0.56 to 0.70. (Kassem, 2007). The date palm tree is considered one of the most
tolerant plant for water deficit and high temperature but at the end these conditions will affect the quantity
and quality of crop yield. Some differences in dates water requirement according to the climate and
locations has been recorded, which was ranged between 1500 to 3500 mm in Algeria, 2700 to 3600
mm in the United State, 2230 mm in Egypt, 2500 to 3200 mm in Iraq, and 1300 to 2500 mm in South
Africa. In Tunisia the monthly water consumption ranged between 134mm to 165mm. (Liebenbag, and
Zaid, 2002). Alazaba, (2001), estimated date palm crop evapotranspiration theoretically using Penman-
Monteith equation in six different locations to be from 1500 to 5000 mm according to location and
irrigation water quality.
The determination of water quantities are the most important factors that affecting the cultivation of
various crops. Moreover, it helps in improving yield and quality of the products. However, the studies
that held to investigate the effect of water amount on the date palm production under dry condition are
limited. Therefore, for the economic and nutrition value of the date palm this study is designed. The aim
of this study was to determine appropriate irrigation amount and water-yield relationship for date palm
production and its effect on the quality and quantity of the product under dry condition.
2. Material and Methods
The experimental work was carried out at the AL Rajhi farm, at 80 kilometers south of Riyadh town,
Kingdom of Saudi Arabia (47.5º E, 24.17
º N). The region is classified as a semi-arid with great variation
in temperature and rainfall. The soil is sandy clay loam. The experiment was conducted during two
consecutive seasons (2016 and 2017) in an area of 1.5 acre occupied by 200 date palm trees at spacing of
8×8m.
Numbers of mature date palm trees (Segae variety) of the same age (10 years) were selected randomly,
then were divided into four groups each group irrigated by specific amount of water, 100 %, 75 %, 50 %
of date palm tree water requirement and the amount of water that traditionally used in the site. The
experiment was organized in Complete Block Design (CBD) with five replications, while the analysis
was done using SPSS.
Estimation of the date palm water requirement (ETc.) is derived from crop evapotranspiration (crop
water use) which is the product of the reference evapotranspiration ( ETo ) and the crop coefficient ( Kc ).
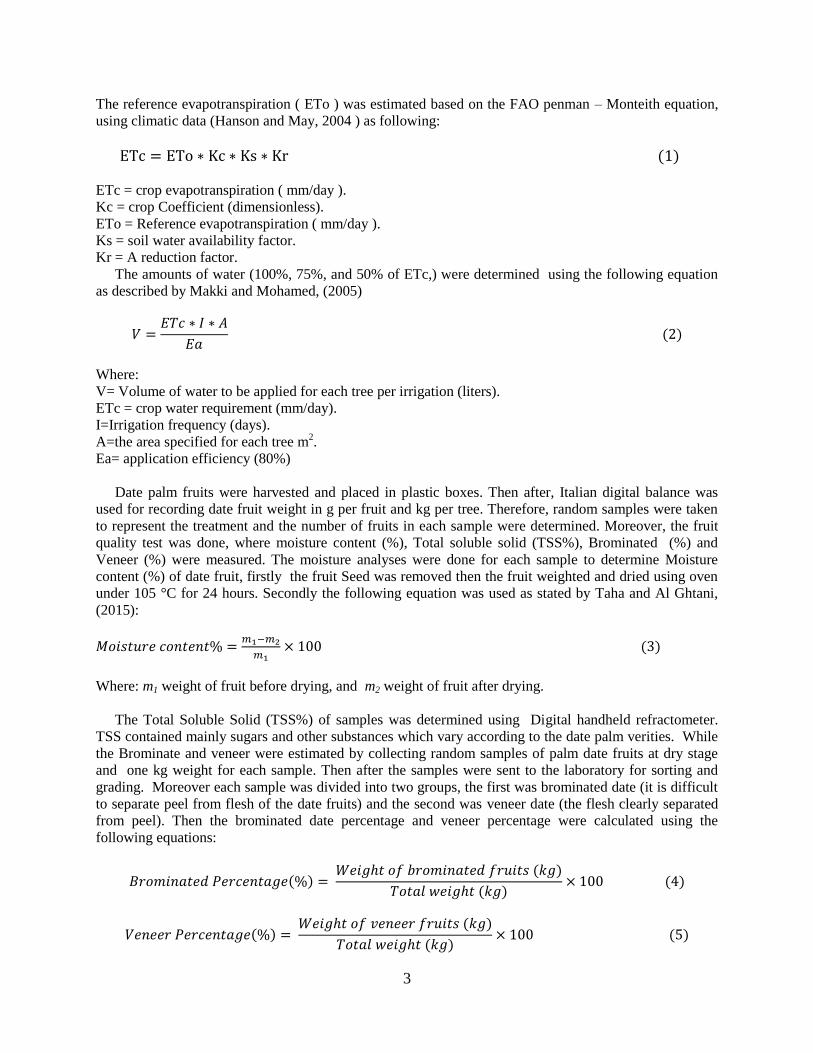
3
The reference evapotranspiration ( ETo ) was estimated based on the FAO penman – Monteith equation,
using climatic data (Hanson and May, 2004 ) as following:
ETc = ETo ∗ Kc ∗ Ks ∗ Kr (1)
ETc = crop evapotranspiration ( mm/day ).
Kc = crop Coefficient (dimensionless).
ETo = Reference evapotranspiration ( mm/day ).
Ks = soil water availability factor.
Kr = A reduction factor.
The amounts of water (100%, 75%, and 50% of ETc,) were determined using the following equation
as described by Makki and Mohamed, (2005)
𝑉 =𝐸𝑇𝑐 ∗ 𝐼 ∗ 𝐴
𝐸𝑎 (2)
Where:
V= Volume of water to be applied for each tree per irrigation (liters).
ETc = crop water requirement (mm/day).
I=Irrigation frequency (days).
A=the area specified for each tree m2.
Ea= application efficiency (80%)
Date palm fruits were harvested and placed in plastic boxes. Then after, Italian digital balance was
used for recording date fruit weight in g per fruit and kg per tree. Therefore, random samples were taken
to represent the treatment and the number of fruits in each sample were determined. Moreover, the fruit
quality test was done, where moisture content (%), Total soluble solid (TSS%), Brominated (%) and
Veneer (%) were measured. The moisture analyses were done for each sample to determine Moisture
content (%) of date fruit, firstly the fruit Seed was removed then the fruit weighted and dried using oven
under 105 °C for 24 hours. Secondly the following equation was used as stated by Taha and Al Ghtani,
(2015):
𝑀𝑜𝑖𝑠𝑡𝑢𝑟𝑒 𝑐𝑜𝑛𝑡𝑒𝑛𝑡% =𝑚1−𝑚2
𝑚1× 100 (3)
Where: m1 weight of fruit before drying, and m2 weight of fruit after drying.
The Total Soluble Solid (TSS%) of samples was determined using Digital handheld refractometer.
TSS contained mainly sugars and other substances which vary according to the date palm verities. While
the Brominate and veneer were estimated by collecting random samples of palm date fruits at dry stage
and one kg weight for each sample. Then after the samples were sent to the laboratory for sorting and
grading. Moreover each sample was divided into two groups, the first was brominated date (it is difficult
to separate peel from flesh of the date fruits) and the second was veneer date (the flesh clearly separated
from peel). Then the brominated date percentage and veneer percentage were calculated using the
following equations:
𝐵𝑟𝑜𝑚𝑖𝑛𝑎𝑡𝑒𝑑 𝑃𝑒𝑟𝑐𝑒𝑛𝑡𝑎𝑔𝑒(%) = 𝑊𝑒𝑖𝑔ℎ𝑡 𝑜𝑓 𝑏𝑟𝑜𝑚𝑖𝑛𝑎𝑡𝑒𝑑 𝑓𝑟𝑢𝑖𝑡𝑠 (𝑘𝑔)
𝑇𝑜𝑡𝑎𝑙 𝑤𝑒𝑖𝑔ℎ𝑡 (𝑘𝑔)× 100 (4)
𝑉𝑒𝑛𝑒𝑒𝑟 𝑃𝑒𝑟𝑐𝑒𝑛𝑡𝑎𝑔𝑒(%) = 𝑊𝑒𝑖𝑔ℎ𝑡 𝑜𝑓 𝑣𝑒𝑛𝑒𝑒𝑟 𝑓𝑟𝑢𝑖𝑡𝑠 (𝑘𝑔)
𝑇𝑜𝑡𝑎𝑙 𝑤𝑒𝑖𝑔ℎ𝑡 (𝑘𝑔)× 100 (5)
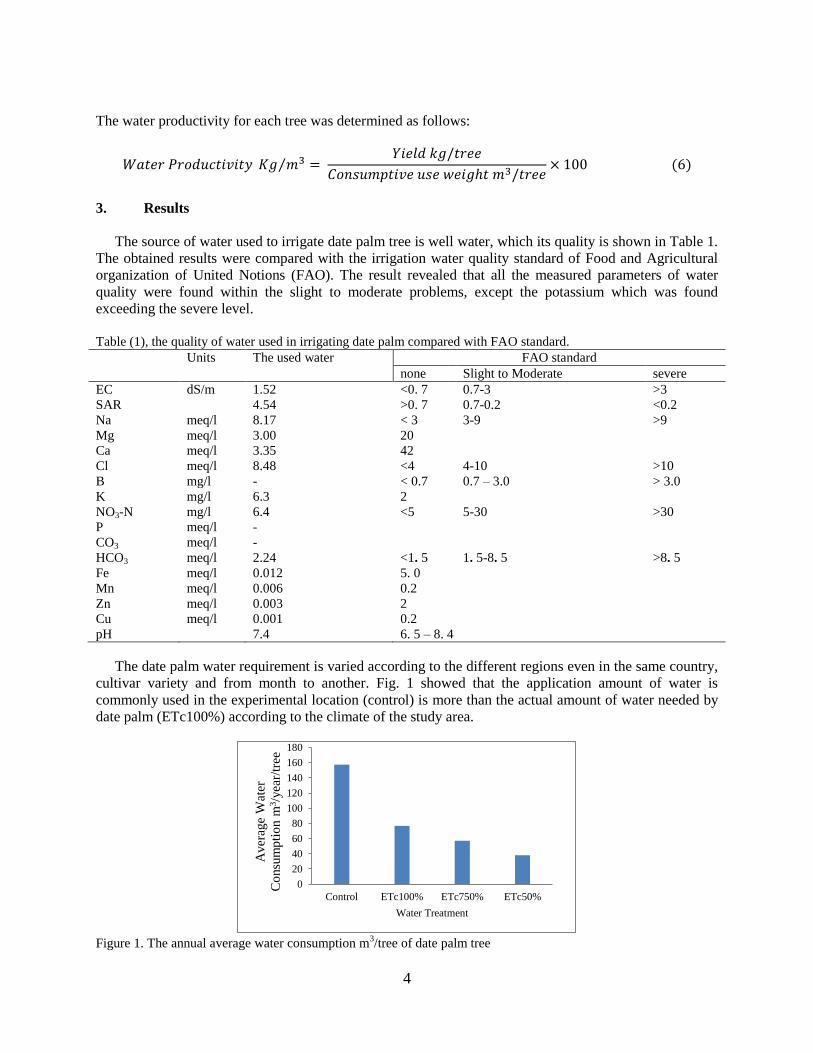
4
The water productivity for each tree was determined as follows:
𝑊𝑎𝑡𝑒𝑟 𝑃𝑟𝑜𝑑𝑢𝑐𝑡𝑖𝑣𝑖𝑡𝑦 𝐾𝑔 𝑚3⁄ = 𝑌𝑖𝑒𝑙𝑑 𝑘𝑔/𝑡𝑟𝑒𝑒
𝐶𝑜𝑛𝑠𝑢𝑚𝑝𝑡𝑖𝑣𝑒 𝑢𝑠𝑒 𝑤𝑒𝑖𝑔ℎ𝑡 𝑚3/𝑡𝑟𝑒𝑒× 100 (6)
3. Results
The source of water used to irrigate date palm tree is well water, which its quality is shown in Table 1.
The obtained results were compared with the irrigation water quality standard of Food and Agricultural
organization of United Notions (FAO). The result revealed that all the measured parameters of water
quality were found within the slight to moderate problems, except the potassium which was found
exceeding the severe level.
Table (1), the quality of water used in irrigating date palm compared with FAO standard. Units The used water FAO standard
none Slight to Moderate severe
EC dS/m 1.52 <0. 7 0.7-3 >3
SAR 4.54 >0. 7 0.7-0.2 <0.2
Na meq/l 8.17 < 3 3-9 >9
Mg meq/l 3.00 20
Ca meq/l 3.35 42
Cl meq/l 8.48 <4 4-10 >10
B mg/l - < 0.7 0.7 – 3.0 > 3.0
K mg/l 6.3 2
NO3-N mg/l 6.4 <5 5-30 >30
P meq/l -
CO3 meq/l -
HCO3 meq/l 2.24 <1. 5 1. 5-8. 5 >8. 5
Fe meq/l 0.012 5. 0
Mn meq/l 0.006 0.2
Zn meq/l 0.003 2
Cu meq/l 0.001 0.2
pH 7.4 6. 5 – 8. 4
The date palm water requirement is varied according to the different regions even in the same country,
cultivar variety and from month to another. Fig. 1 showed that the application amount of water is
commonly used in the experimental location (control) is more than the actual amount of water needed by
date palm (ETc100%) according to the climate of the study area.
Figure 1. The annual average water consumption m
3/tree of date palm tree
0
20
40
60
80
100
120
140
160
180
Control ETc100% ETc750% ETc50%
Aver
age
Wat
er
Co
nsu
mp
tio
n m
3/y
ear/
tree
Water Treatment
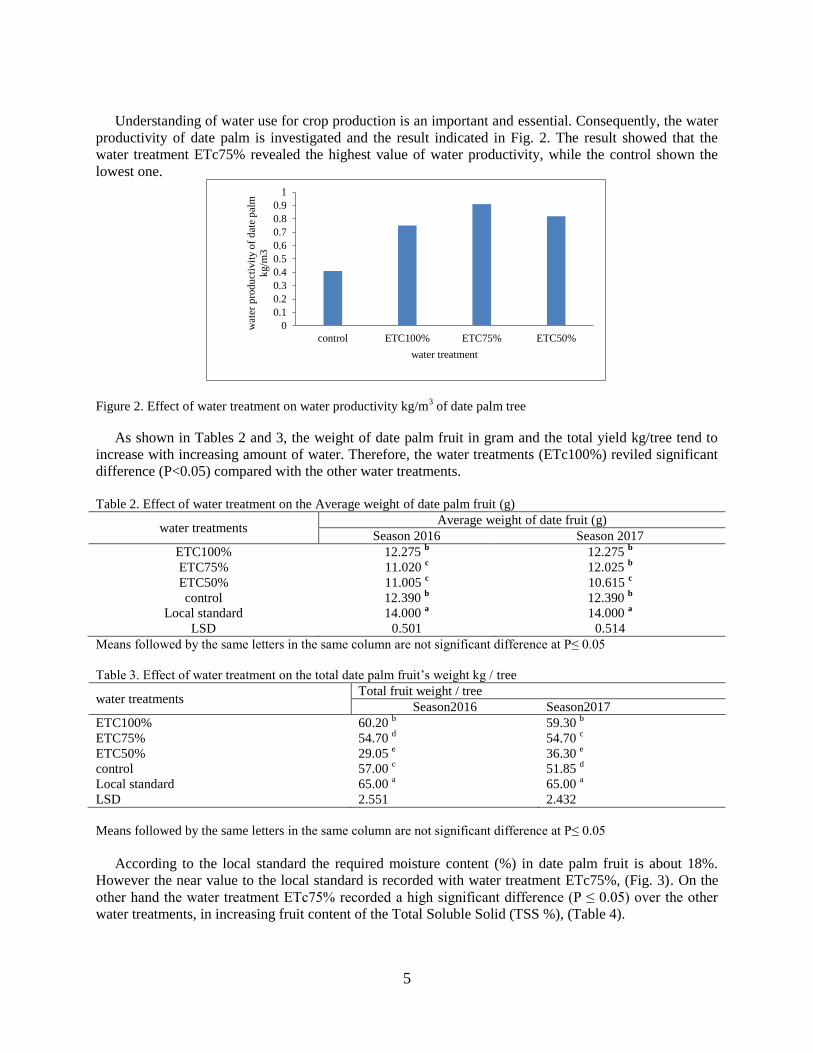
5
Understanding of water use for crop production is an important and essential. Consequently, the water
productivity of date palm is investigated and the result indicated in Fig. 2. The result showed that the
water treatment ETc75% revealed the highest value of water productivity, while the control shown the
lowest one.
Figure 2. Effect of water treatment on water productivity kg/m3 of date palm tree
As shown in Tables 2 and 3, the weight of date palm fruit in gram and the total yield kg/tree tend to
increase with increasing amount of water. Therefore, the water treatments (ETc100%) reviled significant
difference (P<0.05) compared with the other water treatments.
Table 2. Effect of water treatment on the Average weight of date palm fruit (g)
water treatments Average weight of date fruit (g)
Season 2016 Season 2017
ETC100% 12.275 b 12.275
b
ETC75% 11.020 c 12.025
b
ETC50% 11.005 c 10.615
c
control 12.390 b 12.390
b
Local standard 14.000 a 14.000
a
LSD 0.501 0.514
Means followed by the same letters in the same column are not significant difference at P≤ 0.05
Table 3. Effect of water treatment on the total date palm fruit’s weight kg / tree
water treatments Total fruit weight / tree
Season2016 Season2017
ETC100% 60.20 b 59.30
b
ETC75% 54.70 d 54.70
c
ETC50% 29.05 e 36.30
e
control 57.00 c 51.85
d
Local standard 65.00 a 65.00
a
LSD 2.551 2.432
Means followed by the same letters in the same column are not significant difference at P≤ 0.05
According to the local standard the required moisture content (%) in date palm fruit is about 18%.
However the near value to the local standard is recorded with water treatment ETc75%, (Fig. 3). On the
other hand the water treatment ETc75% recorded a high significant difference (P ≤ 0.05) over the other
water treatments, in increasing fruit content of the Total Soluble Solid (TSS %), (Table 4).
0
0.1
0.2
0.3
0.4
0.5
0.6
0.7
0.8
0.9
1
control ETC100% ETC75% ETC50%
wat
er p
rod
uct
ivit
y o
f d
ate
pal
m
kg/m
3
water treatment
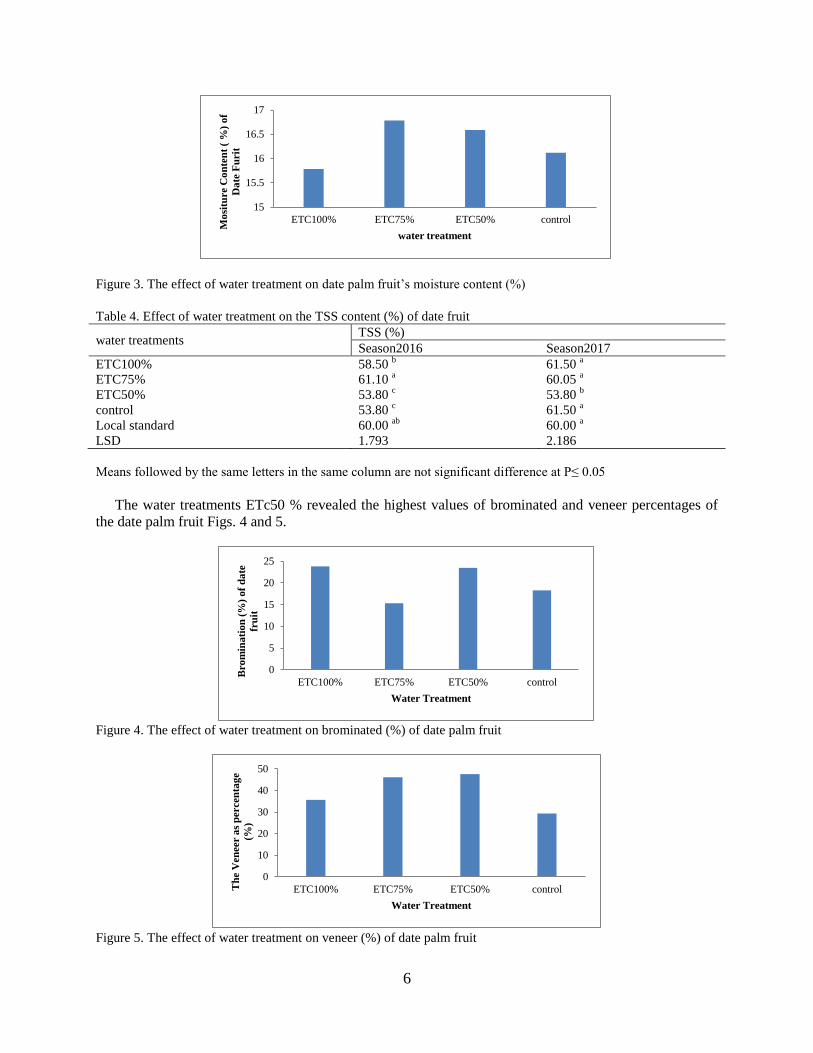
6
Figure 3. The effect of water treatment on date palm fruit’s moisture content (%)
Table 4. Effect of water treatment on the TSS content (%) of date fruit
water treatments TSS (%)
Season2016 Season2017
ETC100% 58.50 b 61.50
a
ETC75% 61.10 a 60.05
a
ETC50% 53.80 c 53.80
b
control 53.80 c 61.50
a
Local standard 60.00 ab
60.00 a
LSD 1.793 2.186
Means followed by the same letters in the same column are not significant difference at P≤ 0.05
The water treatments ETc50 % revealed the highest values of brominated and veneer percentages of
the date palm fruit Figs. 4 and 5.
Figure 4. The effect of water treatment on brominated (%) of date palm fruit
Figure 5. The effect of water treatment on veneer (%) of date palm fruit
15
15.5
16
16.5
17
ETC100% ETC75% ETC50% controlM
osi
ture C
on
ten
t (
%)
of
Da
te F
uri
t water treatment
0
5
10
15
20
25
ETC100% ETC75% ETC50% control
Bro
min
ati
on
(%
) o
f d
ate
fru
it
Water Treatment
0
10
20
30
40
50
ETC100% ETC75% ETC50% controlTh
e V
en
eer a
s p
ercen
tag
e
(%)
Water Treatment
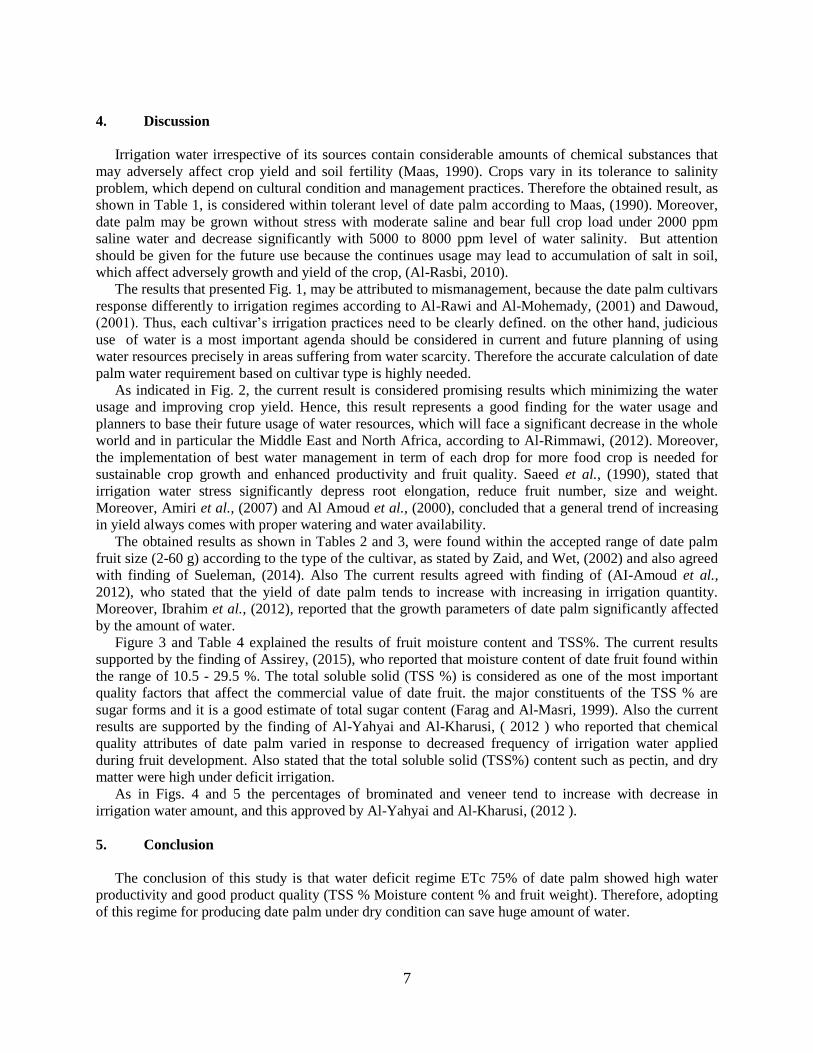
7
4. Discussion
Irrigation water irrespective of its sources contain considerable amounts of chemical substances that
may adversely affect crop yield and soil fertility (Maas, 1990). Crops vary in its tolerance to salinity
problem, which depend on cultural condition and management practices. Therefore the obtained result, as
shown in Table 1, is considered within tolerant level of date palm according to Maas, (1990). Moreover,
date palm may be grown without stress with moderate saline and bear full crop load under 2000 ppm
saline water and decrease significantly with 5000 to 8000 ppm level of water salinity. But attention
should be given for the future use because the continues usage may lead to accumulation of salt in soil,
which affect adversely growth and yield of the crop, (Al-Rasbi, 2010).
The results that presented Fig. 1, may be attributed to mismanagement, because the date palm cultivars
response differently to irrigation regimes according to Al-Rawi and Al-Mohemady, (2001) and Dawoud,
(2001). Thus, each cultivar’s irrigation practices need to be clearly defined. on the other hand, judicious
use of water is a most important agenda should be considered in current and future planning of using
water resources precisely in areas suffering from water scarcity. Therefore the accurate calculation of date
palm water requirement based on cultivar type is highly needed.
As indicated in Fig. 2, the current result is considered promising results which minimizing the water
usage and improving crop yield. Hence, this result represents a good finding for the water usage and
planners to base their future usage of water resources, which will face a significant decrease in the whole
world and in particular the Middle East and North Africa, according to Al-Rimmawi, (2012). Moreover,
the implementation of best water management in term of each drop for more food crop is needed for
sustainable crop growth and enhanced productivity and fruit quality. Saeed et al., (1990), stated that
irrigation water stress significantly depress root elongation, reduce fruit number, size and weight.
Moreover, Amiri et al., (2007) and Al Amoud et al., (2000), concluded that a general trend of increasing
in yield always comes with proper watering and water availability.
The obtained results as shown in Tables 2 and 3, were found within the accepted range of date palm
fruit size (2-60 g) according to the type of the cultivar, as stated by Zaid, and Wet, (2002) and also agreed
with finding of Sueleman, (2014). Also The current results agreed with finding of (AI-Amoud et al.,
2012), who stated that the yield of date palm tends to increase with increasing in irrigation quantity.
Moreover, Ibrahim et al., (2012), reported that the growth parameters of date palm significantly affected
by the amount of water.
Figure 3 and Table 4 explained the results of fruit moisture content and TSS%. The current results
supported by the finding of Assirey, (2015), who reported that moisture content of date fruit found within
the range of 10.5 - 29.5 %. The total soluble solid (TSS %) is considered as one of the most important
quality factors that affect the commercial value of date fruit. the major constituents of the TSS % are
sugar forms and it is a good estimate of total sugar content (Farag and Al-Masri, 1999). Also the current
results are supported by the finding of Al-Yahyai and Al-Kharusi, ( 2012 ) who reported that chemical
quality attributes of date palm varied in response to decreased frequency of irrigation water applied
during fruit development. Also stated that the total soluble solid (TSS%) content such as pectin, and dry
matter were high under deficit irrigation.
As in Figs. 4 and 5 the percentages of brominated and veneer tend to increase with decrease in
irrigation water amount, and this approved by Al-Yahyai and Al-Kharusi, (2012 ).
5. Conclusion
The conclusion of this study is that water deficit regime ETc 75% of date palm showed high water
productivity and good product quality (TSS % Moisture content % and fruit weight). Therefore, adopting
of this regime for producing date palm under dry condition can save huge amount of water.
8
References
Abdurrahman, W.A. and Al-Nabulsi, Y.A. 1996. Irrigation Water Use of Date Palm," Proc. 3
rd Symposium on the
Date Palm, King Faisal University, Date Palm Research Center, Al-Hassa, S. Arabia, 1: 273-280.
Al-amoud, A. I.; Mohammad, F. S.; Al-Hamed, S. A. and Al-abdulkader, A. M. 2012. Reference Evapotranspiration
and Date Palm Water Use in the Kingdom of Saudi Arabia. Agricultural Engineering Dept., College of
Food and Agriculture Sciences, King Saud University, P.O. Box 2460, Riyadh 11451, Saudi Arabia.
Alazaba, A.A. 2001. Theoretical Estimate of Date Palm Water Requirements Using Penman-Monteith Model. A
paper number 012100, 2001 ASAE annual meeting.
Al-Rasbi, S.A.R. 2010. Evaluation of the Growth of Date palm Seedlings Irrigated with Saline Water in Sultanate of
Oman. Ph. D. Thesis, Department of Landscape Ecology and Nature Conservation, University of Kassel,
Germany.
Al-Rawi, A.A.H. and Al-Mohemdy, A.F. 2001. Effect of Water Quality on Growth and Yield of Date Palm
(Phoenix dactylifera L.) Proceedings of the 2nd International Conference on Date Palm, Al-Ain, UAE, pp.
128–136.
Al-Rimmawi, H. 2012. Middle East Chronic Water Problems: Solution Prospects. Energy and Environmental
Research, 3(1): 28-34.
Al-Yahyai, R. and Al-Kharusi, L. 2012. Physical and Chemical Quality Attributes of Freeze Stored Dates. Int. J.
Agric. Biol. 14:97–100.
Amiri, M.E.; Panahi M. and Aghazadeh A. 2007. Comparison of Bubblers, Sprinkler and Basin Irrigation for Date
Palm (Phoenix dactylifera L., cv. Zahdi) Growth in Kish Island, Iran. Journal of Food, Agriculture and
Environment 5(3),185-187.
Assirey E. A. R. 2015. Nutritional Composition of Fruit of 10 Date Palm (Phoenix dactylifera L.) Cultivars Grown
in Saudi Arabia. J. of Taibah University for Science, 9 (1); 75-79.
Barreveld, W.H. 1993. Date Palm Products, FAO Agricultural Services, Bull. No. 101, Rome,
http://www.fao.org/docrep/ t0681E/ t0681e00.ht
Bhat, N.R. V.S.; Suleiman, M.K.; Thomas, B.; Ali, S.I.; George P. and Al-Mulla L. 2012. Estimation of Water
Requirements for Young Date Palms Under Arid Climatic Conditions of Kuwait. ISSN 1817-3047. World
Journal of Agricultural Sciences 8 (5): pp 448-452.
Dawoud, D.H. (2001). Effect of Different Irrigation Intervals on the Growth Rate, Yield and Fruit Quality of MWL
and MWK Date Palm Cultivars. Proceedings of the 2nd International Conference on Date Palm, Al-Ain,
UAE, p. 138. http://www.pubhort.org/datepalm/datepalm2/datepalm2-14.pdf
Farag, K. and Al-Masri, H. 1999. Extending the Khalal Stage of “Khesab” Dates Using New Method of Packaging
and Modified Calcium Formation. Emir. J. Food Agric. 11(1):21- 30.
Hanson, B and May, D. 2007. The Effect of Drip Line Placement on Yield and Quality of Drip-Irrigated Processing
Tomatoes. Irrigation and Drainage System. (21): 109-118.
Horst, M.G.; Shamutalov, S.S.; Pereira, L.S. and Gonc¸alves, J.M. 2005. Field Assessment of the Water Saving
Potential with Furrow Irrigation in Fergana, Aral Sea basin. Agric. Water Manage. 77: 210–231.
Ibrahim, Y. M.; Saeed, A.B. and Mohammed Elamin, A. W. 2012. Effect of Irrigation Water Management on
Growth of Date Palm offshoots (Phoenix dactylifera L) under the River Nile State Conditions. University
of Khartoum J. Agric. Sci. 20(3): 275-285.
Kassem, M.A. 2007. Water Requirement and Crop Coefficient of Date Palm Trees" Sukariah CV". Misr J. Ag. Eng.,
24(2): 339-359.
Liebenbag, P.J. and Zaid, A. 2002. Date Palm Irrigation. FAO Plant Production and Protection Papers- 156 Rev. 1.
Maas E.V. 1990. Crop Salt Tolerance. In: Agriculture Salinity Assessment and Management Manual. K.K. Tanji
(ed), ASCE, New York: 262-304.
Makki, E.K. and Mohamed, A.E. (2005). Wheat Response to Irrigation Scheduling. University of Khartoum Journal
of Agricultural Sciences 13 (1), 53- 67.
Saeed, A.B.; Etewy, H.A. and Hassan, O.S.A. 1990. Watering Requirement and Scheduling of Date Palm. Journal of
Agricultural Mechanization in Asia, Africa and Latin America, 2(4: 49-52.
Sueleman N. M. 2014. Spectroscopic Determination of Some Trace Elements as Pollutants in Fruit Dates Palm and
Agricultural soil at Zilfi Province. J. of Anal. Chem., 2(3): 11-16.
Taha, K. K. and Al Ghtani, F. M. 2015. Determination of the Elemental Contents of Date Palm (Phoenix dactylifera
L.) from Kharj Saudi Arabia. World Scientific News 6: 125-135.
Zaid, A. and de Wet, P.F. 2002. Botanical and Systematic Description of the Date Palm, in: A. Zaid (Ed.), Date
Palm Cultivation, Food and agricultural organization of the United Nations pp. 1–28.
9
Available online at www.asric.org
ASRIC Journal on Water, Energy and Environment 1 (2020) 9-199
1
a Department of Agric. Eng., Faculty of Agriculture, University of Khartoum, Sudan b Agricultural Mechanization, Ministry of Agriculture
Received 19 December 2019; revised 30 January 2020; accepted 30 January 2020
Abstract
This study was conducted at the Demonstration Farm of the Faculty of Agriculture, University of Khartoum –
Shambat, during May 2011 to February 2012, to investigate the effect of inter-space and emitter type on hydraulic
performance of drip irrigation system. The farm lies at E and N and 380 m above mean Sea level. Two
types of emitters were used, online pressure compensation (Eo) and inline labyrinth (Ei) with two different inter
spaces (0.5 and 0.3 m). Factorial design was used to analyze the variation in Discharge (q), Reduction of
discharge(R)%, Coefficient Uniformity (CU)%, Emission Uniformity (EU%) and Clogging percentage (Pclog).
Analysis of variation showed that there were significant differences (P≤ 0.05) among the measured parameters.
Whereas highest values of discharge(q), Coefficient Uniformity (CU)% and Emission Uniformity (EU)% were
recorded by Eo. While the highest values of Clogging percentage (Pclog ) and Reduction of discharge (R) were
recorded by Ei . The 0.5m emitter inter space showed higher values of Discharge (q), Uniformity of
Coefficient(CU)% and Emission Uniformity (EU)% than 0.3m inter space, and at the same time it is showed the
lowest values of Reduction of discharge (R)% and Clogging percentage (Pclog). This study concluded that emitter
types and inter spaces are important factor in drip irrigation system design. Therefore, should be considered when
planning for efficient drip irrigation system.
Keywords: Drip irrigation system; Uniformity parameters; Emitter types; Inter-Spaces.
1. Introduction
The growing scarcity and misuse of available water resources particularly in arid and semi-arid
regions constitute challenges to water demands for various utilities, and major threats are facing
sustainable agricultural development which use about 80-85% of water consumption.
Adequate water demand management necessitates the establishment of structure of incentives
regulations and restrictions that will help guide influence and coordinate how water is used efficiently.
Hence, innovations in irrigation water saving technologies are highly needed. For obtaining high
effectiveness of irrigation water application, drip irrigation is the most appropriate modern technology of
irrigation, Sharma, (2013). It is considered as a method which takes water from source to plant without
water losses. Thus, it is saving for about 70% of used water without affecting significantly the crop yield,
(Pandey, 2005). Also Dutta, (2008) stated that water will be saved with
1 Corresponding author. Email addresses: [email protected], [email protected] (W.A.M Elamin)
10
saving in the quantity and quality of the crop, when using drip irrigation technology. Drip irrigation is some time call trickle irrigation, a name suggested by the American Society of
Agricultural Engineers (ASAE, 1983) or localized irrigation, a name recommended by Food and
Agriculture Organization (FAO, 1980). Drip (or trickle) irrigation refers to the frequent application of
small quantities of water at low flow rates and pressures. The advantage of using drip-irrigation system is
to significantly reduce evaporation losses and increase water use efficiency by creating a low, wet area in
the root zone. Due to water shortages in many parts of the world today, drip irrigation is becoming quite
popular (Sahin et al., 2005; Powell and Wright, 1998;).The high efficiency of drip irrigation results from
two primary factors: The first is that the water soaks into the soil before it can evaporate or run off.
Secondly water is only applied where it is needed, (at the plant's roots) rather than sprayed everywhere.
The emitter or dripper is the core of this technology, which is made of plastic materials, Sne, (2005).
An emitter ( dripper ) is used to transfer water from a pipe or tube to the area required to be irrigated .
Clogging of emitters is considered as one of thoughtful problems facing drip irrigation systems users
(Wei et al., 2008). Emitter clogging can seriously interfere with uniform application of irrigation water
and system-applied fertilizers which leads to reduced crop yield and quality. Clogging can result from
biological growths, physical particles, or chemical precipitates in the drip system. Therefore, this study
aim to evaluate the drip emitters clogging according to, the emitter types and emitters inter spaces.
2. Material and Methods
The experiment was conducted at the demonstration farm of the Faculty of Agriculture, University of
Khartoum –Shambat. The farm lies on the Eastern Bank of the River Nile at 32°E, 15.36° N and 380 m
above mean Sea level . The climate of the area is tropical, which is characterized by low relative
humidity, with average daily maximum and minimum temperatures of about 36°C and 21° C,
respectively.
The system unit components were pump, control unit ( two polyethylene plastic valves, a pressure
gauge disc filter and one valve was fixed at each entry of lateral to control discharge and pressure), main
line (Polyvinyl Chloride (PVC) of 50 mm diameter), sub main line (Polyvinyl Chloride (PVC) of 25mm
diameter), lateral lines (black Linear Low Density Polyethylene (LLDPE) of 16mm inside diameter, they
were divided into two equal groups one has inter emitters spaces of 0.5m and the other has 0.3m inter
spaces) and Emitters (online pressure-compensation, (Eo) and inline-labyrinth, (Ei)), plate (1) .
Plate (1) The system components
Materials of pressure gauge (2bar) of analogue types, meter tape, catch cans, measuring cylinder and
stop watch were used.
A volumetric calibration of the emitters was made by using cans and a graduated measuring cylinder.
Under each emitter there was catch cans located to collect the volume of discharge in specific time. The
collected water was measured using measuring cylinder to determine the volume. The measured volume
was used to calculate Discharge (q), Reduction of Discharge (Rreduction), Coefficient Uniformity
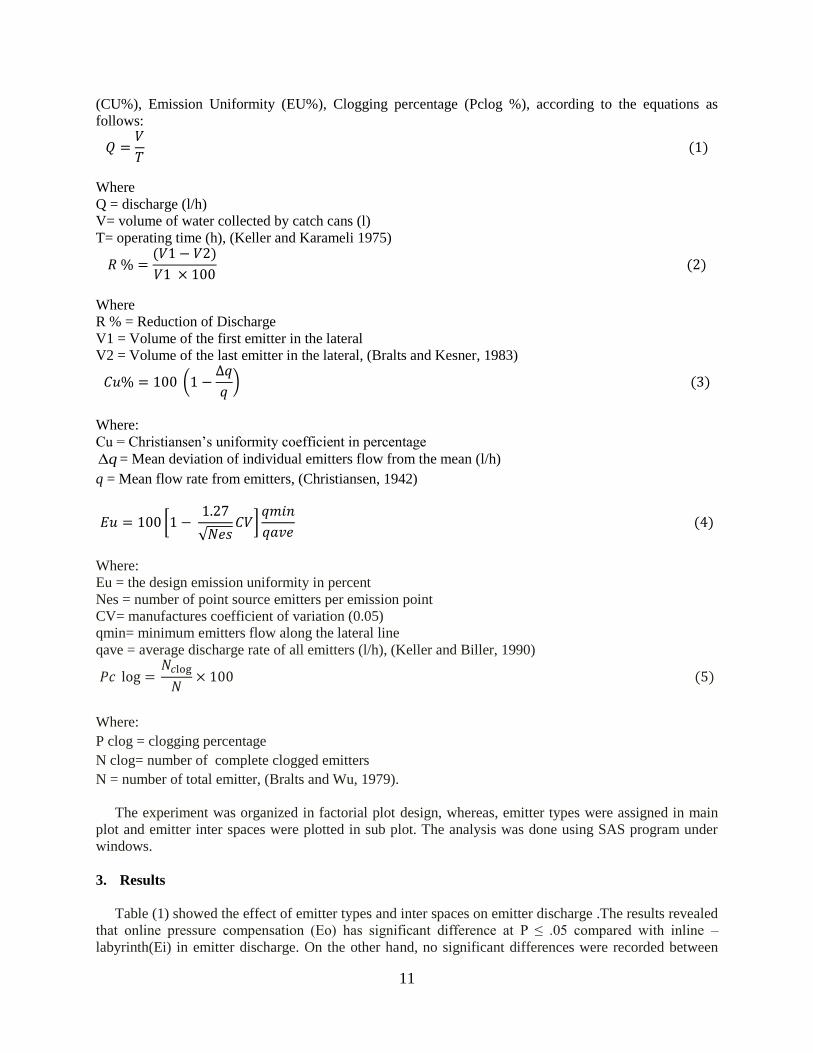
11
(CU%), Emission Uniformity (EU%), Clogging percentage (Pclog %), according to the equations as
follows:
𝑄 =𝑉
𝑇 (1)
Where
Q = discharge (l/h)
V= volume of water collected by catch cans (l)
T= operating time (h), (Keller and Karameli 1975)
𝑅 % =(𝑉1 − 𝑉2)
𝑉1 × 100 (2)
Where
R % = Reduction of Discharge
V1 = Volume of the first emitter in the lateral
V2 = Volume of the last emitter in the lateral, (Bralts and Kesner, 1983)
𝐶𝑢% = 100 (1 −∆𝑞
𝑞) (3)
Where:
Cu = Christiansen’s uniformity coefficient in percentage
= Mean deviation of individual emitters flow from the mean (l/h)
q = Mean flow rate from emitters, (Christiansen, 1942)
𝐸𝑢 = 100 [1 − 1.27
√𝑁𝑒𝑠𝐶𝑉]
𝑞𝑚𝑖𝑛
𝑞𝑎𝑣𝑒 (4)
Where:
Eu = the design emission uniformity in percent
Nes = number of point source emitters per emission point
CV= manufactures coefficient of variation (0.05)
qmin= minimum emitters flow along the lateral line
qave = average discharge rate of all emitters (l/h), (Keller and Biller, 1990)
𝑃𝑐 log = 𝑁𝑐log
𝑁× 100 (5)
Where:
P clog = clogging percentage
N clog= number of complete clogged emitters
N = number of total emitter, (Bralts and Wu, 1979).
The experiment was organized in factorial plot design, whereas, emitter types were assigned in main
plot and emitter inter spaces were plotted in sub plot. The analysis was done using SAS program under
windows.
3. Results
Table (1) showed the effect of emitter types and inter spaces on emitter discharge .The results revealed
that online pressure compensation (Eo) has significant difference at P ≤ .05 compared with inline –
labyrinth(Ei) in emitter discharge. On the other hand, no significant differences were recorded between
q
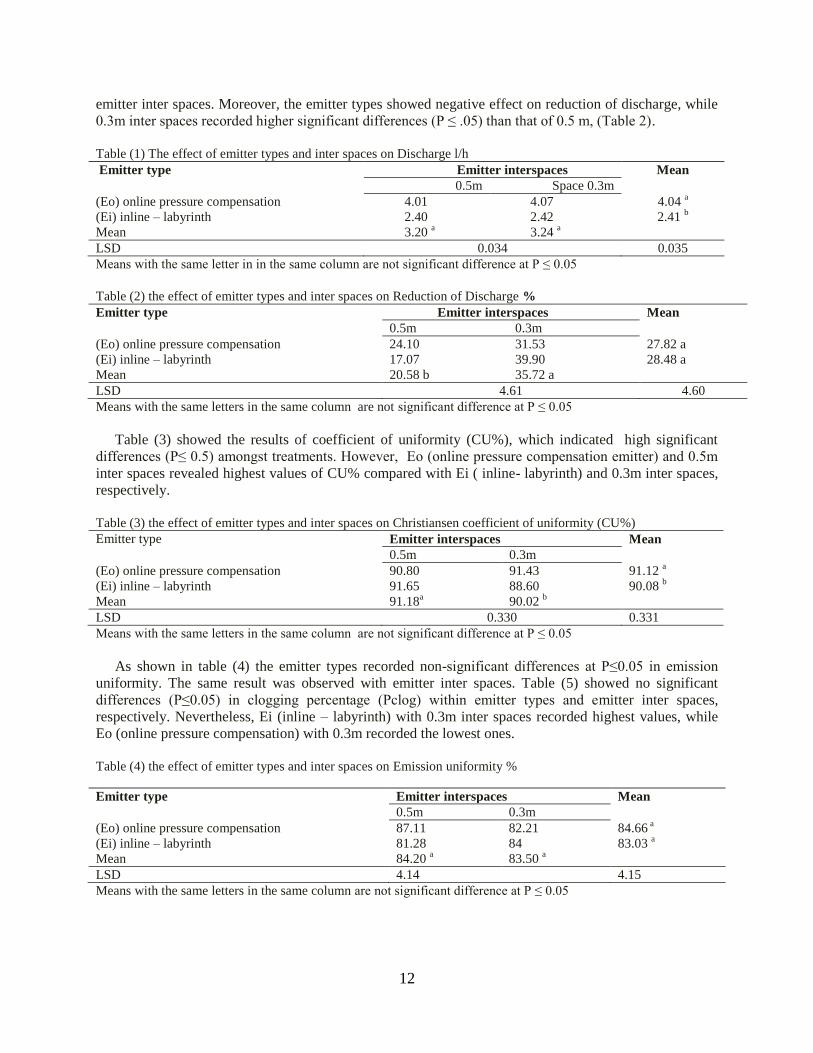
12
emitter inter spaces. Moreover, the emitter types showed negative effect on reduction of discharge, while
0.3m inter spaces recorded higher significant differences (P ≤ .05) than that of 0.5 m, (Table 2).
Table (1) The effect of emitter types and inter spaces on Discharge l/h
Emitter type Emitter interspaces E Mean
0.5m Space 0.3m
(Eo) online pressure compensation 4.01 4.07 4.04 a
(Ei) inline – labyrinth 2.40 2.42 2.41 b
Mean 3.20 a 3.24
a
LSD 0.034 0.035
Means with the same letter in in the same column are not significant difference at P ≤ 0.05
Table (2) the effect of emitter types and inter spaces on Reduction of Discharge %
Emitter type Emitter interspaces Mean
0.5m 0.3m
(Eo) online pressure compensation 24.10 31.53 27.82 a
(Ei) inline – labyrinth 17.07 39.90 28.48 a
Mean 20.58 b 35.72 a
LSD 4.61 4.60
Means with the same letters in the same column are not significant difference at P ≤ 0.05
Table (3) showed the results of coefficient of uniformity (CU%), which indicated high significant
differences (P≤ 0.5) amongst treatments. However, Eo (online pressure compensation emitter) and 0.5m
inter spaces revealed highest values of CU% compared with Ei ( inline- labyrinth) and 0.3m inter spaces,
respectively.
Table (3) the effect of emitter types and inter spaces on Christiansen coefficient of uniformity (CU%)
Emitter type Emitter interspaces Mean
0.5m 0.3m
(Eo) online pressure compensation 90.80 91.43 91.12 a
(Ei) inline – labyrinth 91.65 88.60 90.08 b
Mean 91.18a 90.02
b
LSD 0.330 0.331
Means with the same letters in the same column are not significant difference at P ≤ 0.05
As shown in table (4) the emitter types recorded non-significant differences at P≤0.05 in emission
uniformity. The same result was observed with emitter inter spaces. Table (5) showed no significant
differences (P≤0.05) in clogging percentage (Pclog) within emitter types and emitter inter spaces,
respectively. Nevertheless, Ei (inline – labyrinth) with 0.3m inter spaces recorded highest values, while
Eo (online pressure compensation) with 0.3m recorded the lowest ones.
Table (4) the effect of emitter types and inter spaces on Emission uniformity %
Means with the same letters in the same column are not significant difference at P ≤ 0.05
Emitter type Emitter interspaces Mean
0.5m 0.3m
(Eo) online pressure compensation 87.11 82.21 84.66 a
(Ei) inline – labyrinth 81.28 84 83.03 a
Mean 84.20 a 83.50
a
LSD 4.14 4.15
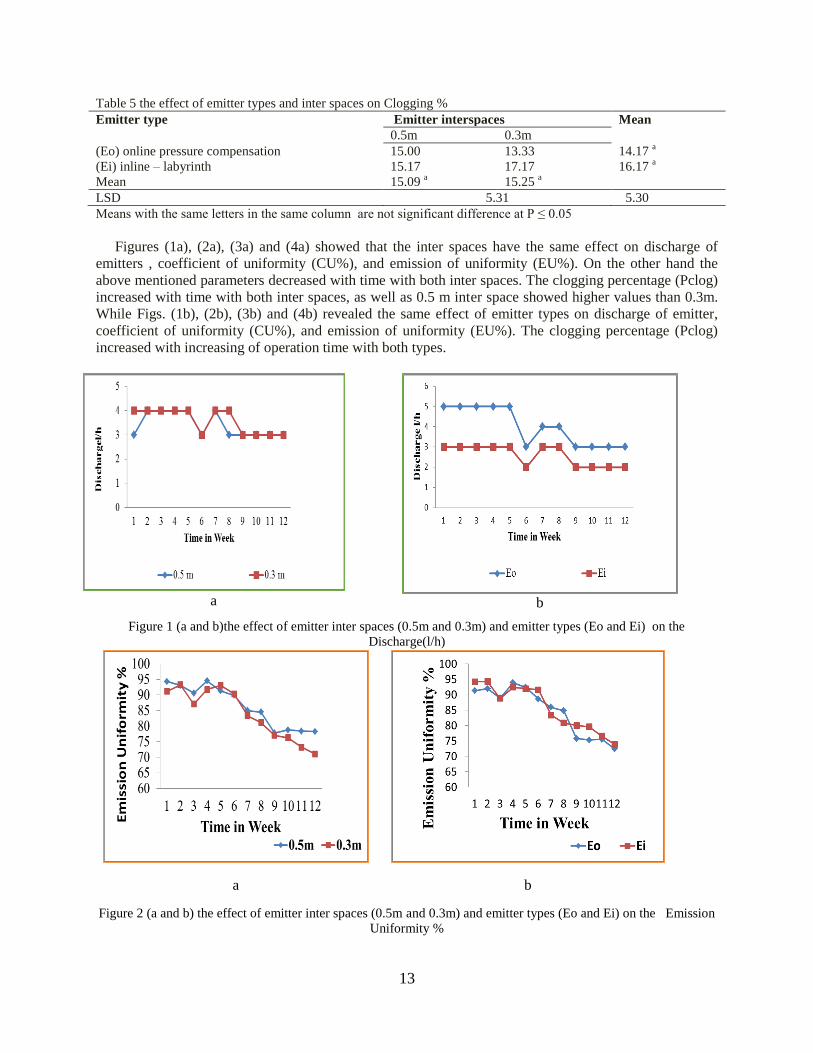
13
Table 5 the effect of emitter types and inter spaces on Clogging %
Emitter type Emitter interspaces Mean
0.5m 0.3m
(Eo) online pressure compensation 15.00 13.33 14.17 a
(Ei) inline – labyrinth 15.17 17.17 16.17 a
Mean 15.09 a 15.25
a
LSD 5.31 5.30
Means with the same letters in the same column are not significant difference at P ≤ 0.05
Figures (1a), (2a), (3a) and (4a) showed that the inter spaces have the same effect on discharge of
emitters , coefficient of uniformity (CU%), and emission of uniformity (EU%). On the other hand the
above mentioned parameters decreased with time with both inter spaces. The clogging percentage (Pclog)
increased with time with both inter spaces, as well as 0.5 m inter space showed higher values than 0.3m.
While Figs. (1b), (2b), (3b) and (4b) revealed the same effect of emitter types on discharge of emitter,
coefficient of uniformity (CU%), and emission of uniformity (EU%). The clogging percentage (Pclog)
increased with increasing of operation time with both types.
a
b
Figure 1 (a and b)the effect of emitter inter spaces (0.5m and 0.3m) and emitter types (Eo and Ei) on the
Discharge(l/h)
a b
Figure 2 (a and b) the effect of emitter inter spaces (0.5m and 0.3m) and emitter types (Eo and Ei) on the Emission
Uniformity %
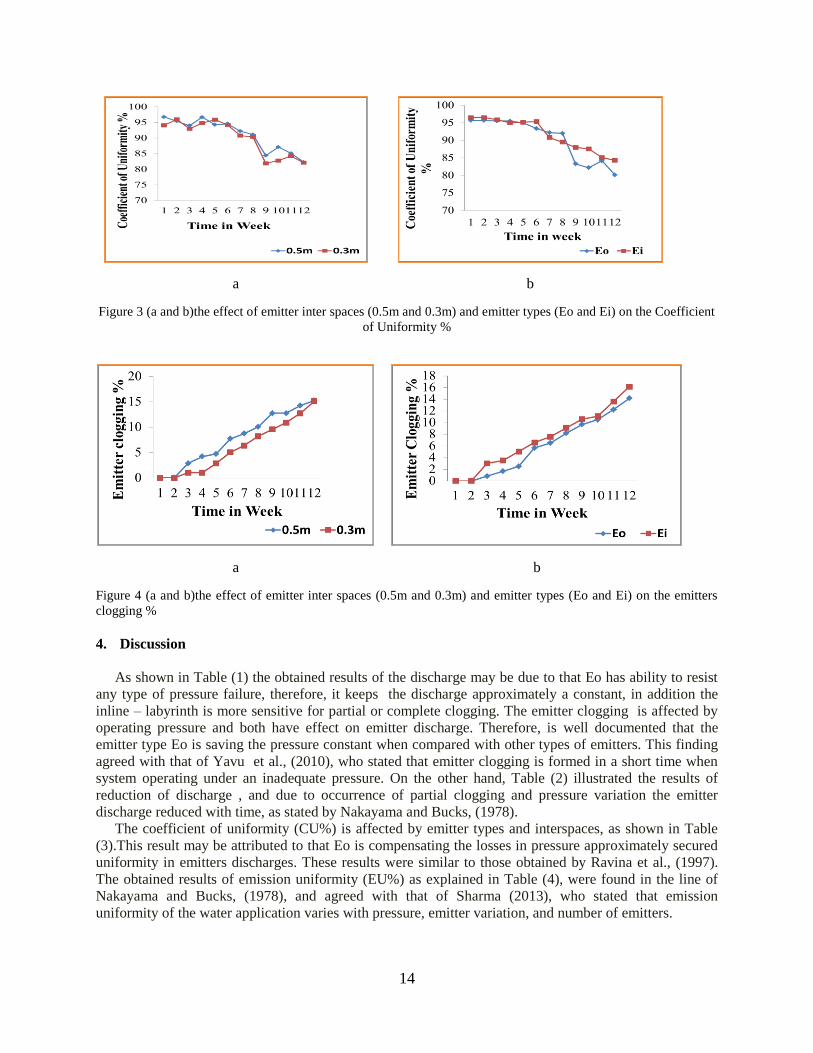
14
a b
Figure 3 (a and b)the effect of emitter inter spaces (0.5m and 0.3m) and emitter types (Eo and Ei) on the Coefficient
of Uniformity %
a b
Figure 4 (a and b)the effect of emitter inter spaces (0.5m and 0.3m) and emitter types (Eo and Ei) on the emitters
clogging %
4. Discussion
As shown in Table (1) the obtained results of the discharge may be due to that Eo has ability to resist
any type of pressure failure, therefore, it keeps the discharge approximately a constant, in addition the
inline – labyrinth is more sensitive for partial or complete clogging. The emitter clogging is affected by
operating pressure and both have effect on emitter discharge. Therefore, is well documented that the
emitter type Eo is saving the pressure constant when compared with other types of emitters. This finding
agreed with that of Yavu et al., (2010), who stated that emitter clogging is formed in a short time when
system operating under an inadequate pressure. On the other hand, Table (2) illustrated the results of
reduction of discharge , and due to occurrence of partial clogging and pressure variation the emitter
discharge reduced with time, as stated by Nakayama and Bucks, (1978).
The coefficient of uniformity (CU%) is affected by emitter types and interspaces, as shown in Table
(3).This result may be attributed to that Eo is compensating the losses in pressure approximately secured
uniformity in emitters discharges. These results were similar to those obtained by Ravina et al., (1997).
The obtained results of emission uniformity (EU%) as explained in Table (4), were found in the line of
Nakayama and Bucks, (1978), and agreed with that of Sharma (2013), who stated that emission
uniformity of the water application varies with pressure, emitter variation, and number of emitters.
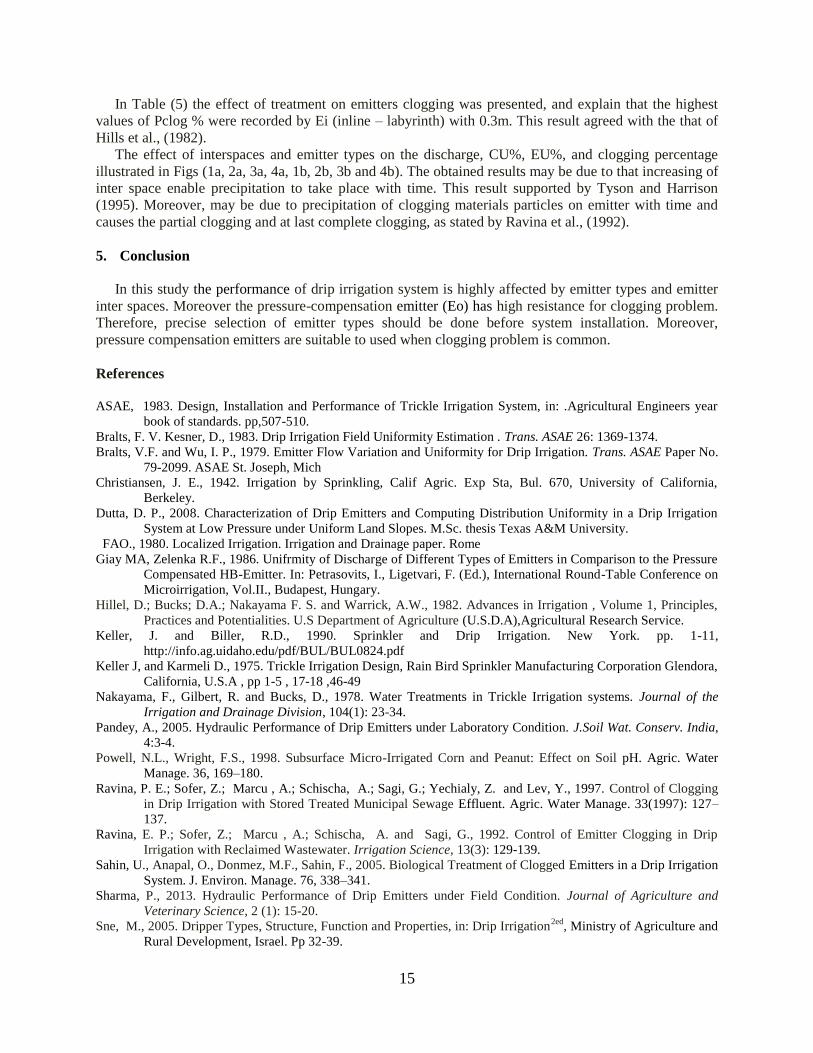
15
In Table (5) the effect of treatment on emitters clogging was presented, and explain that the highest
values of Pclog % were recorded by Ei (inline – labyrinth) with 0.3m. This result agreed with the that of
Hills et al., (1982).
The effect of interspaces and emitter types on the discharge, CU%, EU%, and clogging percentage
illustrated in Figs (1a, 2a, 3a, 4a, 1b, 2b, 3b and 4b). The obtained results may be due to that increasing of
inter space enable precipitation to take place with time. This result supported by Tyson and Harrison
(1995). Moreover, may be due to precipitation of clogging materials particles on emitter with time and
causes the partial clogging and at last complete clogging, as stated by Ravina et al., (1992).
5. Conclusion
In this study the performance of drip irrigation system is highly affected by emitter types and emitter
inter spaces. Moreover the pressure-compensation emitter (Eo) has high resistance for clogging problem.
Therefore, precise selection of emitter types should be done before system installation. Moreover,
pressure compensation emitters are suitable to used when clogging problem is common.
References
ASAE, 1983. Design, Installation and Performance of Trickle Irrigation System, in: .Agricultural Engineers year
book of standards. pp,507-510.
Bralts, F. V. Kesner, D., 1983. Drip Irrigation Field Uniformity Estimation . Trans. ASAE 26: 1369-1374.
Bralts, V.F. and Wu, I. P., 1979. Emitter Flow Variation and Uniformity for Drip Irrigation. Trans. ASAE Paper No.
79-2099. ASAE St. Joseph, Mich
Christiansen, J. E., 1942. Irrigation by Sprinkling, Calif Agric. Exp Sta, Bul. 670, University of California,
Berkeley.
Dutta, D. P., 2008. Characterization of Drip Emitters and Computing Distribution Uniformity in a Drip Irrigation
System at Low Pressure under Uniform Land Slopes. M.Sc. thesis Texas A&M University.
FAO., 1980. Localized Irrigation. Irrigation and Drainage paper. Rome
Giay MA, Zelenka R.F., 1986. Unifrmity of Discharge of Different Types of Emitters in Comparison to the Pressure
Compensated HB-Emitter. In: Petrasovits, I., Ligetvari, F. (Ed.), International Round-Table Conference on
Microirrigation, Vol.II., Budapest, Hungary.
Hillel, D.; Bucks; D.A.; Nakayama F. S. and Warrick, A.W., 1982. Advances in Irrigation , Volume 1, Principles,
Practices and Potentialities. U.S Department of Agriculture (U.S.D.A),Agricultural Research Service.
Keller, J. and Biller, R.D., 1990. Sprinkler and Drip Irrigation. New York. pp. 1-11,
http://info.ag.uidaho.edu/pdf/BUL/BUL0824.pdf
Keller J, and Karmeli D., 1975. Trickle Irrigation Design, Rain Bird Sprinkler Manufacturing Corporation Glendora,
California, U.S.A , pp 1-5 , 17-18 ,46-49
Nakayama, F., Gilbert, R. and Bucks, D., 1978. Water Treatments in Trickle Irrigation systems. Journal of the
Irrigation and Drainage Division, 104(1): 23-34.
Pandey, A., 2005. Hydraulic Performance of Drip Emitters under Laboratory Condition. J.Soil Wat. Conserv. India,
4:3-4.
Powell, N.L., Wright, F.S., 1998. Subsurface Micro-Irrigated Corn and Peanut: Effect on Soil pH. Agric. Water
Manage. 36, 169–180.
Ravina, P. E.; Sofer, Z.; Marcu , A.; Schischa, A.; Sagi, G.; Yechialy, Z. and Lev, Y., 1997. Control of Clogging
in Drip Irrigation with Stored Treated Municipal Sewage Effluent. Agric. Water Manage. 33(1997): 127–
137.
Ravina, E. P.; Sofer, Z.; Marcu , A.; Schischa, A. and Sagi, G., 1992. Control of Emitter Clogging in Drip
Irrigation with Reclaimed Wastewater. Irrigation Science, 13(3): 129-139.
Sahin, U., Anapal, O., Donmez, M.F., Sahin, F., 2005. Biological Treatment of Clogged Emitters in a Drip Irrigation
System. J. Environ. Manage. 76, 338–341.
Sharma, P., 2013. Hydraulic Performance of Drip Emitters under Field Condition. Journal of Agriculture and
Veterinary Science, 2 (1): 15-20.
Sne, M., 2005. Dripper Types, Structure, Function and Properties, in: Drip Irrigation2ed
, Ministry of Agriculture and
Rural Development, Israel. Pp 32-39.

16
Tyson, A. and Harrison, K., 1995. Irrigation for Lawns and Gardens. Univ. of Georgia, College of Agric. and
Environmental Sci, Coo. Ext. Service. Bull 899.
Wei, Q., Shi, Y., Lu, G., Dong, W. and Huang, S., 2008. Rapid Evaluations of Anti-Clogging Performance of Drip
Emitters by Laboratorial Short-Cycle Tests. Journal of Irrigation and Drainage Engineering 134, 298.
Yavuz, M. Y.; Demırel, K.; Erken, B. O. E. and Merve D., 2010. Emitter Clogging and Effects on Drip Irrigation
Systems Performances. African Journal of Agricultural Research, 5 (7) : 532-538. Available online at
http://www.academicjournals.org/AJAR
17
Available online at www.asric.org
ASRIC Journal on Water, Energy and Environment 1 (2020) 17-33
a Department of Agricultural Research Service, Kasinthula Agricultural Research Station, Chikwawa, Malawi.
b CSIRO Agriculture and Food, Australia c Department of Irrigation Service, Lilongwe, Malawi
d Lilongwe University of Agriculture and Natural Resources, Lilongwe, Malawi.
Received 19 December 2019; revised 30 January 2020; accepted 30 January 2020
Abstract
Soil water and nutrient management for climate-smart agriculture by smallholder farmers have typically been by
trial and error. Studies were conducted to adapt the use of sensor farmer–friendly monitoring technology in
measuring soil water and nutrients with the aim of improving the efficiency of resources in the food value chain.
Simple monitoring tools (chameleon and Wetting Front Detector) which were designed to fit the mental model of
African farmers and to give an output that is linked to action were deployed to farmers in nine irrigation schemes in
Malawi. Chameleon illustrates information on soil moisture status by colours - blue, green and red colours
representing adequate moisture, moderate and dry soil status, respectively. The use of colours and not numbers
promoted inclusiveness across illiterate and all gender categories. Farmers participated in sensors’ installation, soil
moisture measurement, data visualization and learning platform to get insights from their participation. The
chameleon was combined with an online communication and learning system to improve adaptive water
management at scheme level. The results indicated that: (1) the tools gave farmers new frames of reference; (2) it
improved farmers on time, labour and water-saving by reducing irrigation intervals; (3) it gave farmers new
reference of experience to change their irrigation traditions; (4) it also reduced conflict for water in irrigation
schemes between users apart from generally improving the efficiency of soil water and nutrient use in various value
chains. Use of sensor technologies became a rigor that made scientists easily communicate science to lay farmers
and initiated the movement of farmers who know how to use water in times of climate change. It can be concluded
that combined use of sensors, online communication and learning system is adaptive and helps to improve climate
change adaptation to water scarcity whilst improving efficiencies in food chain.
Keywords: Irrigation; Soil water; Nutrient; Climate change
1 Corresponding author. Email addresses: [email protected] (I.R. Fandika)
18
1. Introduction
Soil is a media of plant growth and hence fundamental in the food value chain as it acts as a reservoir
of water, gases and nutrients for good plant growth. The soil is greatly reliant on the interactions between
water and gaseous phases which stimulates plant roots access to mineral nutrients (Mengel et al. 2001).
A well-managed soil allows more water and nutrients to be infiltrated and reserved with plant reach by
minimising run-off and less to be leached by permitting a deep rooting zone. For this reason, soil water
must be maximised regardless of the farming system, as it can help optimise the trade between water and
carbon that can improve crop yield at the farm level. Passioura and Angus (2010) accentuated that only
water and nutrients that is transpired and utilised by the crop contribute to crop production. For this
reason, all runoff, direct evaporation from the soil surface, leaching below the root zone, and residual
moisture at harvest reduce crop yield, water and nutrient use efficiency below its potential. Henceforth, if
farmers in Africa want to turn all the soil water and nutrient into crop yield at potential level, there is the
need for them to learn how to manage the soil, crop and other inputs in a way that maximises transpiration
and hence maximised crop yields (Passioura and Angus, 2010). However, soil water and nutrient
management by smallholder farmers especially under irrigation have typically been by trial and error
resulting in great crop yield losses in the sub – Saharan Africa (Guy Sela, 2019).
Consequently, great investment efforts in irrigation have performed poorly as it faces several
constraints among smallholder farmers on water and nutrient management. Sela (2019) concluded that
fertilization and irrigation are the two most important exercises in crop production whose essential
practices and theory need to be adhered to for maximised production. However, most irrigation projects
in sub-Saharan Africa, Malawi inclusive, have been more costly than elsewhere, with a total cost of $14
500/ha compared to $ 6500/ha in the other developing regions due to improper fertilization and irrigation
management. Consequently, they have a lower chance of achieving an adequate return on investment:
56% compared with an average of 72% in the other regions (Inocencio et al. 2007). The impact of climate
change may increase this effect. If African farmers pay attention to sustainable water management,
irrigation would not be more expensive.
Experience shows that there is a long history of measuring soil water and nutrient in the irrigation
industry to control water inputs using sophisticated equipment (gypsum block, tensiometer and neutron
probe), however, most farmers still use tacit knowledge (soil feel) and equipment is just used as a guide as
reported in Australia (Stirzaker et al. 2014; Charlesworth, 2005)). It has been proven in other studies that
prior experiential knowledge is priority over the use of the tools thus adaptive management (Whittenbury
and Davidson, 2010). Meffe et al. (2002) defined adaptive management as ‘the process of treating natural
resource management as an experiment such that the practicality of trial and error is added to the rigour
and explicitness of the scientific experiment, producing learning that is both relevant and valid’. Hsaio et
al. (2007) commended that a learning-by-doing approach that relies on farmers having access to
monitoring tools improves water use efficiency in agricultural systems. Adaptive management assists in
avoiding scientific’ approaches to try completely displace subjective experiences (Whittenbury and
Davidson, 2010). A study was implemented with a hypothesis that simple soil water and nutrient
monitoring tools that provide information that farmers can easily understand are essential for the practice
of adaptive management (AM) in irrigated agriculture. The aim of the study was to adapt the use of
sensor farmer–friendly monitoring technology in measuring soil water and nutrients for improved
efficiency of resources in the food value chain for climate change adaptation.
2. Materials and Methods
Location
The project consisted of on – station experiments and on – farm demonstration trials for adaptation
purposes. The on-station experiments were conducted at Kasinthula Agricultural Research Station (16o
0’S, 34 o
5’ E, 70m asl.,) from 2016 to 2018. On – farm demonstrations trials were implemented at
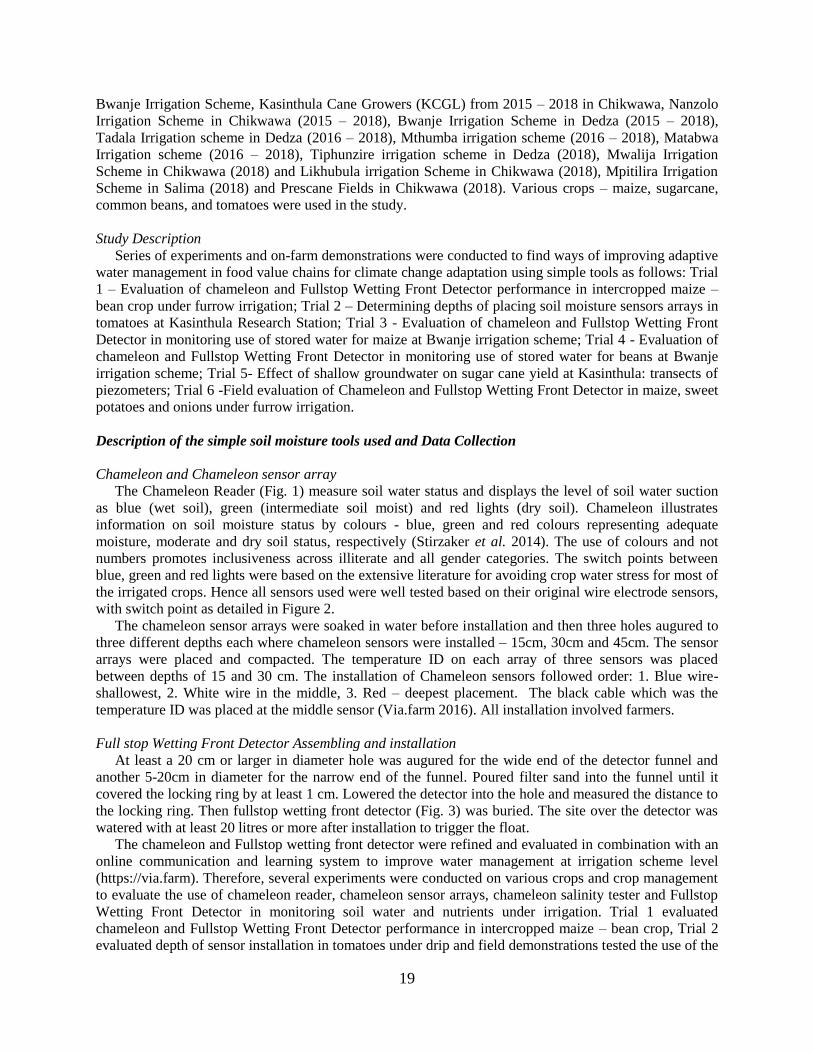
19
Bwanje Irrigation Scheme, Kasinthula Cane Growers (KCGL) from 2015 – 2018 in Chikwawa, Nanzolo
Irrigation Scheme in Chikwawa (2015 – 2018), Bwanje Irrigation Scheme in Dedza (2015 – 2018),
Tadala Irrigation scheme in Dedza (2016 – 2018), Mthumba irrigation scheme (2016 – 2018), Matabwa
Irrigation scheme (2016 – 2018), Tiphunzire irrigation scheme in Dedza (2018), Mwalija Irrigation
Scheme in Chikwawa (2018) and Likhubula irrigation Scheme in Chikwawa (2018), Mpitilira Irrigation
Scheme in Salima (2018) and Prescane Fields in Chikwawa (2018). Various crops – maize, sugarcane,
common beans, and tomatoes were used in the study.
Study Description
Series of experiments and on-farm demonstrations were conducted to find ways of improving adaptive
water management in food value chains for climate change adaptation using simple tools as follows: Trial
1 – Evaluation of chameleon and Fullstop Wetting Front Detector performance in intercropped maize –
bean crop under furrow irrigation; Trial 2 – Determining depths of placing soil moisture sensors arrays in
tomatoes at Kasinthula Research Station; Trial 3 - Evaluation of chameleon and Fullstop Wetting Front
Detector in monitoring use of stored water for maize at Bwanje irrigation scheme; Trial 4 - Evaluation of
chameleon and Fullstop Wetting Front Detector in monitoring use of stored water for beans at Bwanje
irrigation scheme; Trial 5- Effect of shallow groundwater on sugar cane yield at Kasinthula: transects of
piezometers; Trial 6 -Field evaluation of Chameleon and Fullstop Wetting Front Detector in maize, sweet
potatoes and onions under furrow irrigation.
Description of the simple soil moisture tools used and Data Collection
Chameleon and Chameleon sensor array
The Chameleon Reader (Fig. 1) measure soil water status and displays the level of soil water suction
as blue (wet soil), green (intermediate soil moist) and red lights (dry soil). Chameleon illustrates
information on soil moisture status by colours - blue, green and red colours representing adequate
moisture, moderate and dry soil status, respectively (Stirzaker et al. 2014). The use of colours and not
numbers promotes inclusiveness across illiterate and all gender categories. The switch points between
blue, green and red lights were based on the extensive literature for avoiding crop water stress for most of
the irrigated crops. Hence all sensors used were well tested based on their original wire electrode sensors,
with switch point as detailed in Figure 2.
The chameleon sensor arrays were soaked in water before installation and then three holes augured to
three different depths each where chameleon sensors were installed – 15cm, 30cm and 45cm. The sensor
arrays were placed and compacted. The temperature ID on each array of three sensors was placed
between depths of 15 and 30 cm. The installation of Chameleon sensors followed order: 1. Blue wire-
shallowest, 2. White wire in the middle, 3. Red – deepest placement. The black cable which was the
temperature ID was placed at the middle sensor (Via.farm 2016). All installation involved farmers.
Full stop Wetting Front Detector Assembling and installation
At least a 20 cm or larger in diameter hole was augured for the wide end of the detector funnel and
another 5-20cm in diameter for the narrow end of the funnel. Poured filter sand into the funnel until it
covered the locking ring by at least 1 cm. Lowered the detector into the hole and measured the distance to
the locking ring. Then fullstop wetting front detector (Fig. 3) was buried. The site over the detector was
watered with at least 20 litres or more after installation to trigger the float.
The chameleon and Fullstop wetting front detector were refined and evaluated in combination with an
online communication and learning system to improve water management at irrigation scheme level
(https://via.farm). Therefore, several experiments were conducted on various crops and crop management
to evaluate the use of chameleon reader, chameleon sensor arrays, chameleon salinity tester and Fullstop
Wetting Front Detector in monitoring soil water and nutrients under irrigation. Trial 1 evaluated
chameleon and Fullstop Wetting Front Detector performance in intercropped maize – bean crop, Trial 2
evaluated depth of sensor installation in tomatoes under drip and field demonstrations tested the use of the
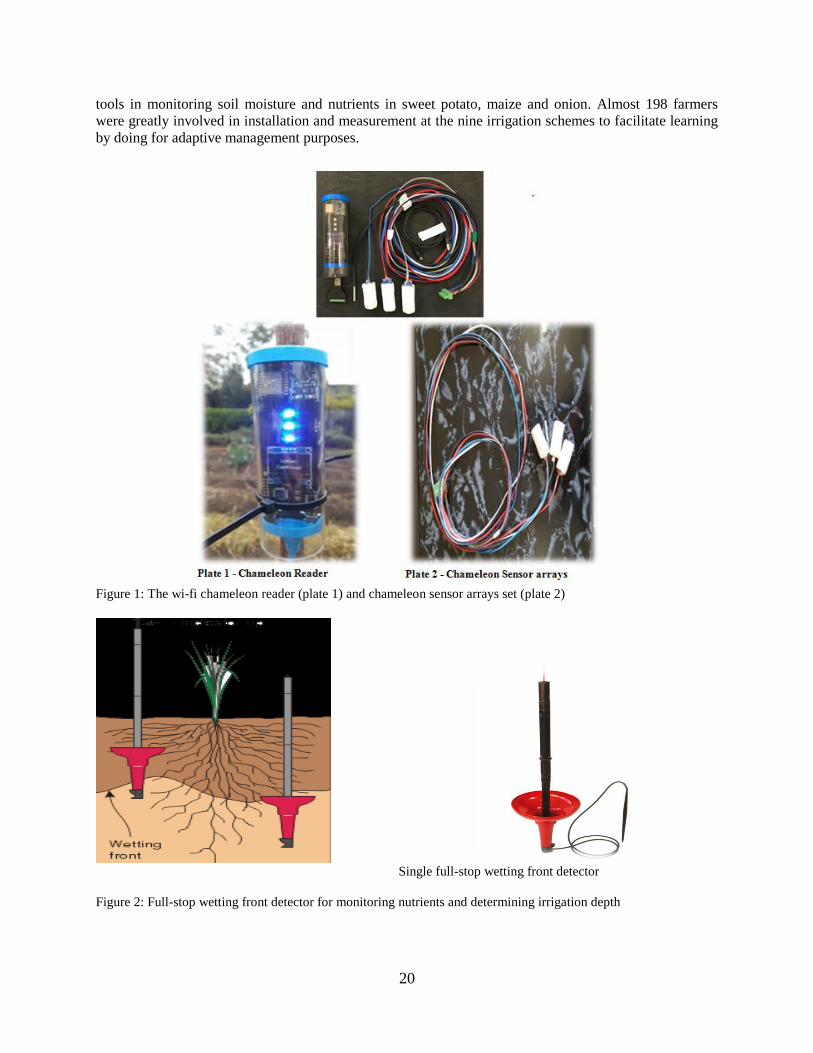
20
tools in monitoring soil moisture and nutrients in sweet potato, maize and onion. Almost 198 farmers
were greatly involved in installation and measurement at the nine irrigation schemes to facilitate learning
by doing for adaptive management purposes.
Figure 1: The wi-fi chameleon reader (plate 1) and chameleon sensor arrays set (plate 2)
Single full-stop wetting front detector
Figure 2: Full-stop wetting front detector for monitoring nutrients and determining irrigation depth
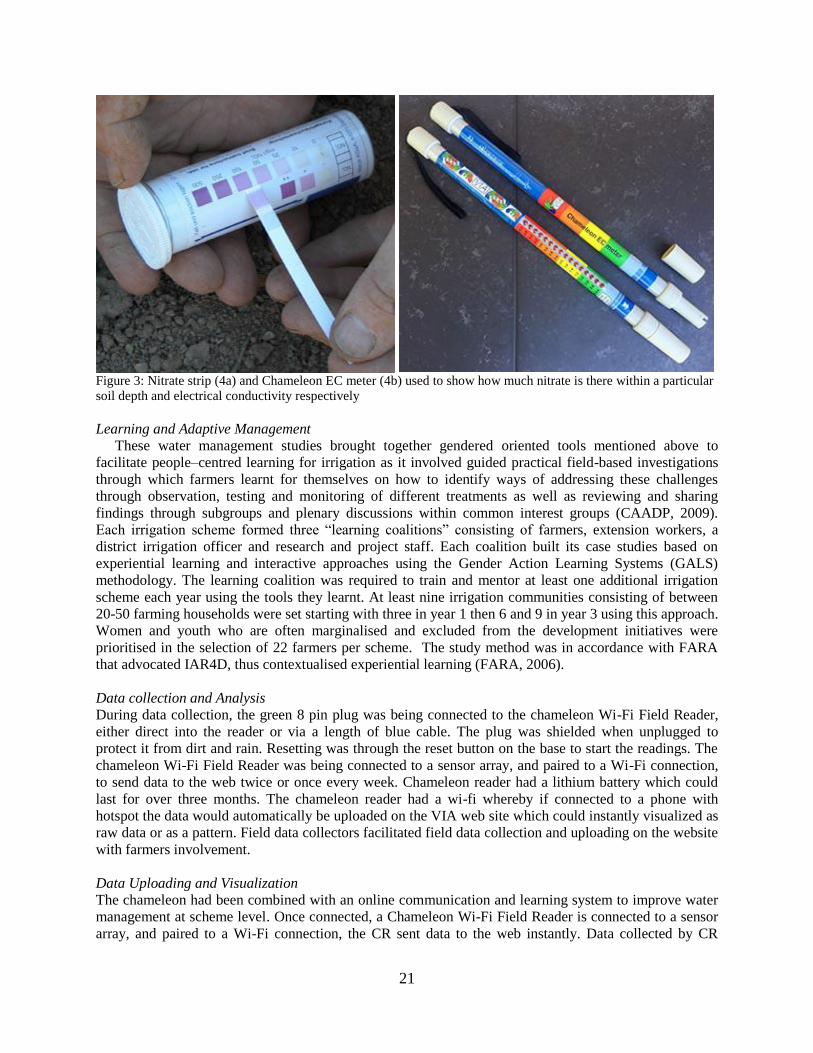
21
Figure 3: Nitrate strip (4a) and Chameleon EC meter (4b) used to show how much nitrate is there within a particular
soil depth and electrical conductivity respectively
Learning and Adaptive Management
These water management studies brought together gendered oriented tools mentioned above to
facilitate people–centred learning for irrigation as it involved guided practical field-based investigations
through which farmers learnt for themselves on how to identify ways of addressing these challenges
through observation, testing and monitoring of different treatments as well as reviewing and sharing
findings through subgroups and plenary discussions within common interest groups (CAADP, 2009).
Each irrigation scheme formed three “learning coalitions” consisting of farmers, extension workers, a
district irrigation officer and research and project staff. Each coalition built its case studies based on
experiential learning and interactive approaches using the Gender Action Learning Systems (GALS)
methodology. The learning coalition was required to train and mentor at least one additional irrigation
scheme each year using the tools they learnt. At least nine irrigation communities consisting of between
20-50 farming households were set starting with three in year 1 then 6 and 9 in year 3 using this approach.
Women and youth who are often marginalised and excluded from the development initiatives were
prioritised in the selection of 22 farmers per scheme. The study method was in accordance with FARA
that advocated IAR4D, thus contextualised experiential learning (FARA, 2006).
Data collection and Analysis
During data collection, the green 8 pin plug was being connected to the chameleon Wi-Fi Field Reader,
either direct into the reader or via a length of blue cable. The plug was shielded when unplugged to
protect it from dirt and rain. Resetting was through the reset button on the base to start the readings. The
chameleon Wi-Fi Field Reader was being connected to a sensor array, and paired to a Wi-Fi connection,
to send data to the web twice or once every week. Chameleon reader had a lithium battery which could
last for over three months. The chameleon reader had a wi-fi whereby if connected to a phone with
hotspot the data would automatically be uploaded on the VIA web site which could instantly visualized as
raw data or as a pattern. Field data collectors facilitated field data collection and uploading on the website
with farmers involvement.
Data Uploading and Visualization
The chameleon had been combined with an online communication and learning system to improve water
management at scheme level. Once connected, a Chameleon Wi-Fi Field Reader is connected to a sensor
array, and paired to a Wi-Fi connection, the CR sent data to the web instantly. Data collected by CR
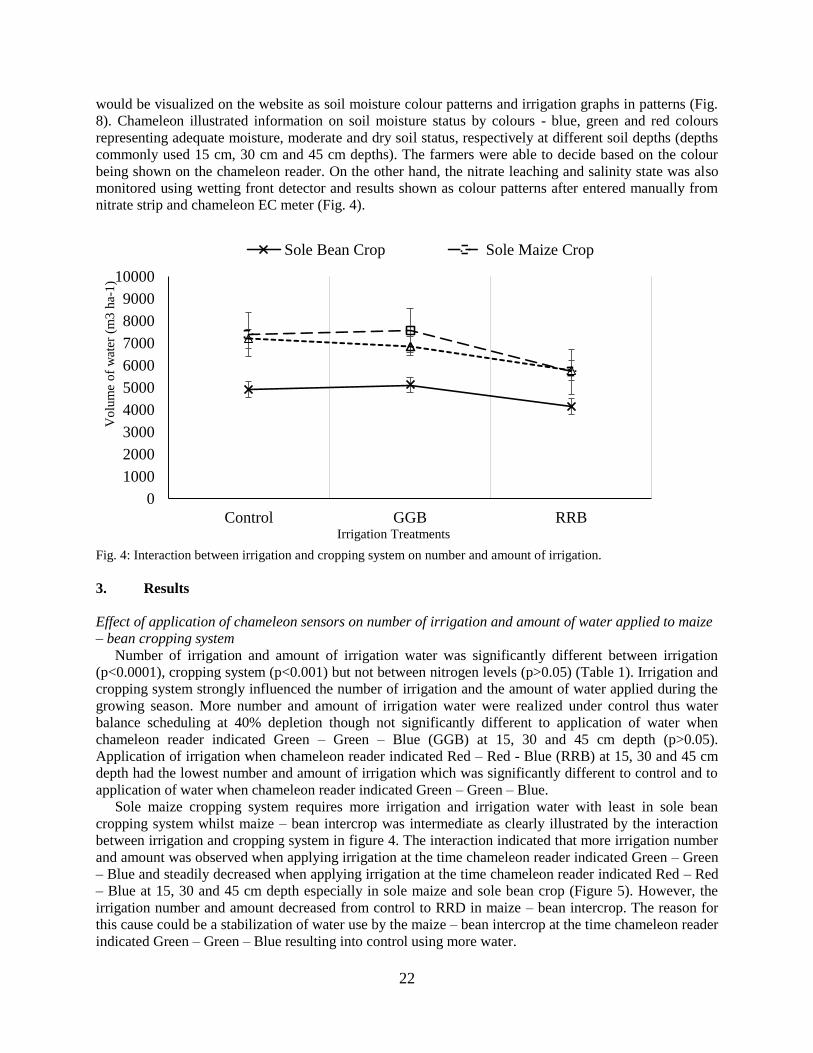
22
would be visualized on the website as soil moisture colour patterns and irrigation graphs in patterns (Fig.
8). Chameleon illustrated information on soil moisture status by colours - blue, green and red colours
representing adequate moisture, moderate and dry soil status, respectively at different soil depths (depths
commonly used 15 cm, 30 cm and 45 cm depths). The farmers were able to decide based on the colour
being shown on the chameleon reader. On the other hand, the nitrate leaching and salinity state was also
monitored using wetting front detector and results shown as colour patterns after entered manually from
nitrate strip and chameleon EC meter (Fig. 4).
Fig. 4: Interaction between irrigation and cropping system on number and amount of irrigation.
3. Results
Effect of application of chameleon sensors on number of irrigation and amount of water applied to maize
– bean cropping system
Number of irrigation and amount of irrigation water was significantly different between irrigation
(p<0.0001), cropping system (p<0.001) but not between nitrogen levels (p>0.05) (Table 1). Irrigation and
cropping system strongly influenced the number of irrigation and the amount of water applied during the
growing season. More number and amount of irrigation water were realized under control thus water
balance scheduling at 40% depletion though not significantly different to application of water when
chameleon reader indicated Green – Green – Blue (GGB) at 15, 30 and 45 cm depth (p>0.05).
Application of irrigation when chameleon reader indicated Red – Red - Blue (RRB) at 15, 30 and 45 cm
depth had the lowest number and amount of irrigation which was significantly different to control and to
application of water when chameleon reader indicated Green – Green – Blue.
Sole maize cropping system requires more irrigation and irrigation water with least in sole bean
cropping system whilst maize – bean intercrop was intermediate as clearly illustrated by the interaction
between irrigation and cropping system in figure 4. The interaction indicated that more irrigation number
and amount was observed when applying irrigation at the time chameleon reader indicated Green – Green
– Blue and steadily decreased when applying irrigation at the time chameleon reader indicated Red – Red
– Blue at 15, 30 and 45 cm depth especially in sole maize and sole bean crop (Figure 5). However, the
irrigation number and amount decreased from control to RRD in maize – bean intercrop. The reason for
this cause could be a stabilization of water use by the maize – bean intercrop at the time chameleon reader
indicated Green – Green – Blue resulting into control using more water.
0
1000
2000
3000
4000
5000
6000
7000
8000
9000
10000
Control GGB RRB
Vo
lum
e o
f w
ater
(m
3 h
a-1
)
Irrigation Treatments
Sole Bean Crop Sole Maize Crop
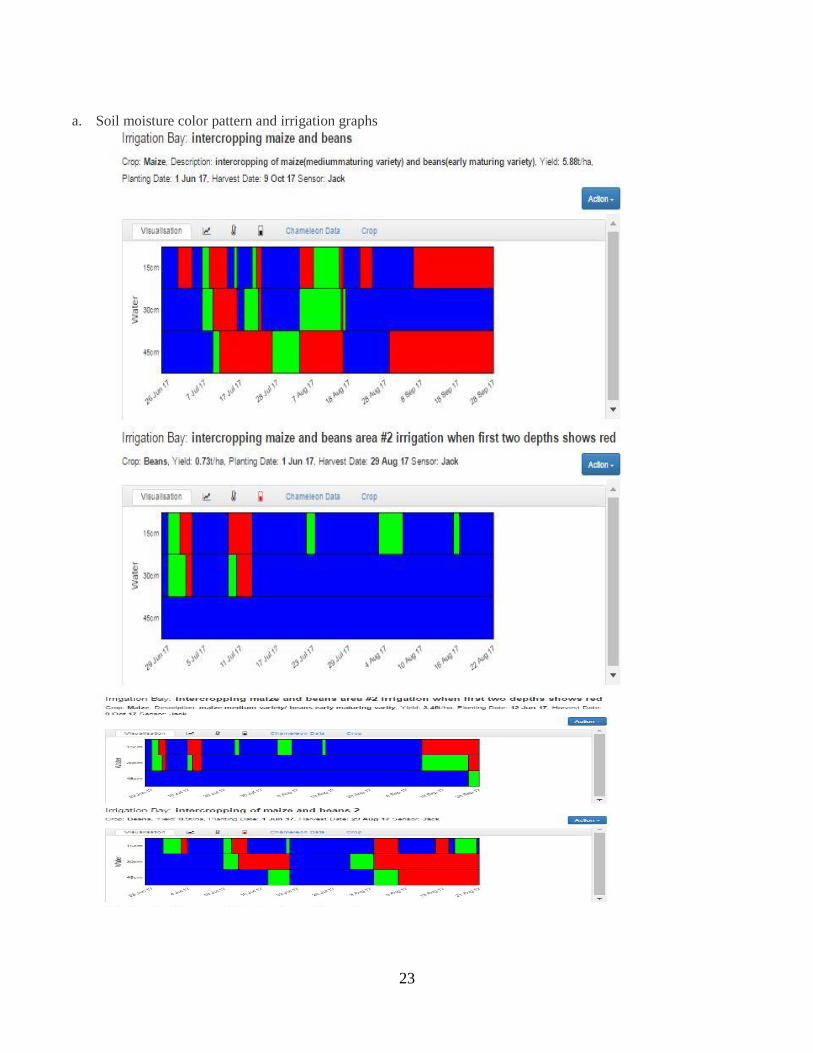
23
a. Soil moisture color pattern and irrigation graphs
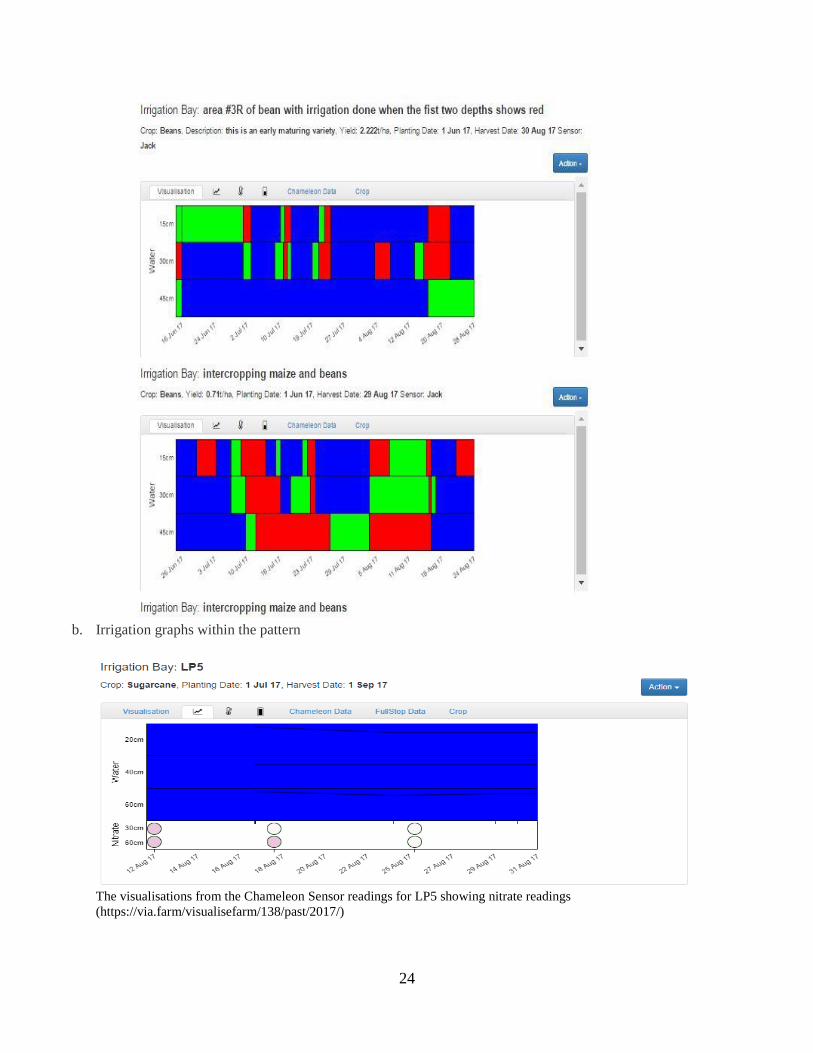
24
b. Irrigation graphs within the pattern
The visualisations from the Chameleon Sensor readings for LP5 showing nitrate readings
(https://via.farm/visualisefarm/138/past/2017/)
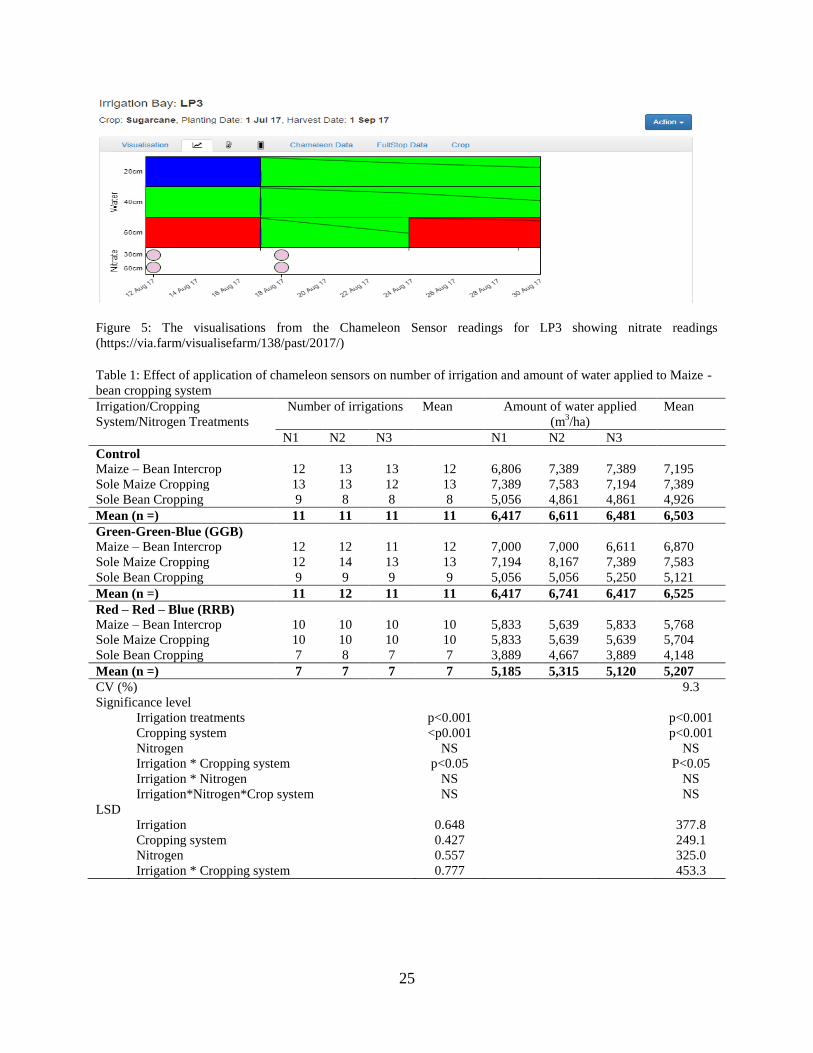
25
Figure 5: The visualisations from the Chameleon Sensor readings for LP3 showing nitrate readings
(https://via.farm/visualisefarm/138/past/2017/)
Table 1: Effect of application of chameleon sensors on number of irrigation and amount of water applied to Maize -
bean cropping system
Irrigation/Cropping
System/Nitrogen Treatments
Number of irrigations Mean Amount of water applied
(m3/ha)
Mean
N1 N2 N3 N1 N2 N3
Control
Maize – Bean Intercrop 12 13 13 12 6,806 7,389 7,389 7,195
Sole Maize Cropping 13 13 12 13 7,389 7,583 7,194 7,389
Sole Bean Cropping 9 8 8 8 5,056 4,861 4,861 4,926
Mean (n =) 11 11 11 11 6,417 6,611 6,481 6,503
Green-Green-Blue (GGB)
Maize – Bean Intercrop 12 12 11 12 7,000 7,000 6,611 6,870
Sole Maize Cropping 12 14 13 13 7,194 8,167 7,389 7,583
Sole Bean Cropping 9 9 9 9 5,056 5,056 5,250 5,121
Mean (n =) 11 12 11 11 6,417 6,741 6,417 6,525
Red – Red – Blue (RRB)
Maize – Bean Intercrop 10 10 10 10 5,833 5,639 5,833 5,768
Sole Maize Cropping 10 10 10 10 5,833 5,639 5,639 5,704
Sole Bean Cropping 7 8 7 7 3,889 4,667 3,889 4,148
Mean (n =) 7 7 7 7 5,185 5,315 5,120 5,207
CV (%) 9.3
Significance level
Irrigation treatments p<0.001 p<0.001
Cropping system <p0.001 p<0.001
Nitrogen NS NS
Irrigation * Cropping system p<0.05 P<0.05
Irrigation * Nitrogen NS NS
Irrigation*Nitrogen*Crop system NS NS
LSD
Irrigation 0.648 377.8
Cropping system 0.427 249.1
Nitrogen 0.557 325.0
Irrigation * Cropping system 0.777 453.3
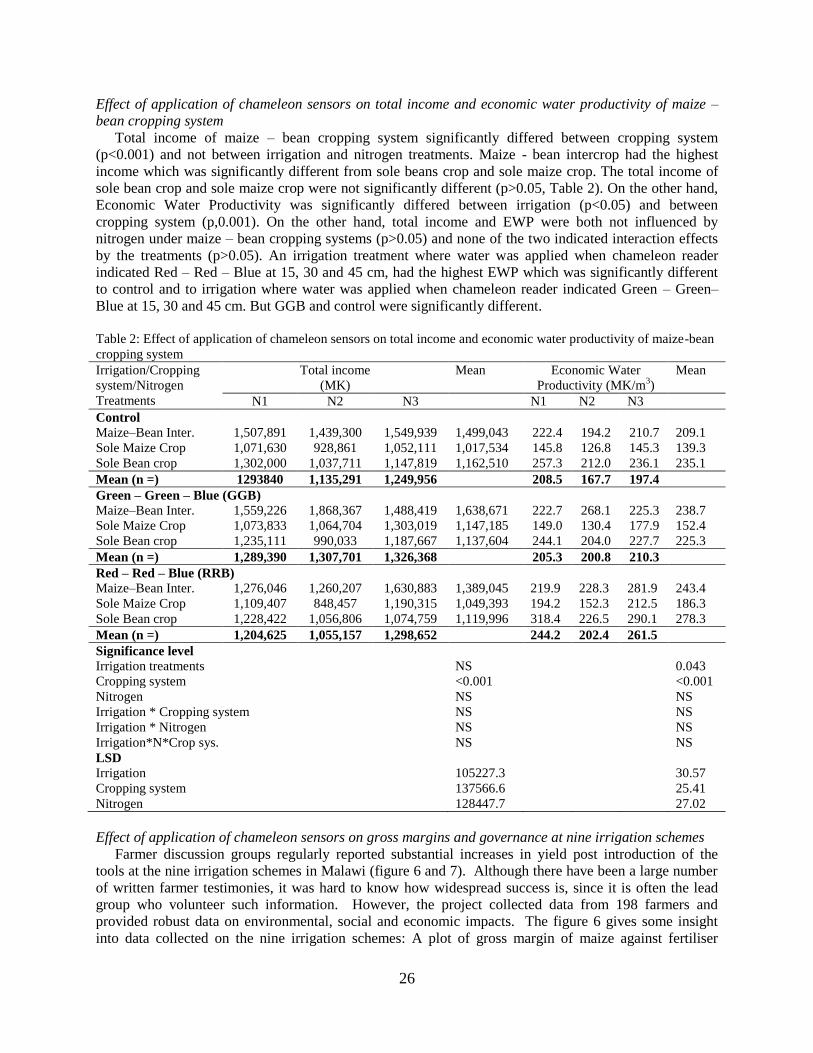
26
Effect of application of chameleon sensors on total income and economic water productivity of maize –
bean cropping system
Total income of maize – bean cropping system significantly differed between cropping system
(p<0.001) and not between irrigation and nitrogen treatments. Maize - bean intercrop had the highest
income which was significantly different from sole beans crop and sole maize crop. The total income of
sole bean crop and sole maize crop were not significantly different (p>0.05, Table 2). On the other hand,
Economic Water Productivity was significantly differed between irrigation (p<0.05) and between
cropping system (p,0.001). On the other hand, total income and EWP were both not influenced by
nitrogen under maize – bean cropping systems (p>0.05) and none of the two indicated interaction effects
by the treatments (p>0.05). An irrigation treatment where water was applied when chameleon reader
indicated Red – Red – Blue at 15, 30 and 45 cm, had the highest EWP which was significantly different
to control and to irrigation where water was applied when chameleon reader indicated Green – Green–
Blue at 15, 30 and 45 cm. But GGB and control were significantly different.
Table 2: Effect of application of chameleon sensors on total income and economic water productivity of maize-bean
cropping system
Irrigation/Cropping
system/Nitrogen
Treatments
Total income
(MK)
Mean Economic Water
Productivity (MK/m3)
Mean
N1 N2 N3 N1 N2 N3
Control
Maize–Bean Inter. 1,507,891 1,439,300 1,549,939 1,499,043 222.4 194.2 210.7 209.1
Sole Maize Crop 1,071,630 928,861 1,052,111 1,017,534 145.8 126.8 145.3 139.3
Sole Bean crop 1,302,000 1,037,711 1,147,819 1,162,510 257.3 212.0 236.1 235.1
Mean (n =) 1293840 1,135,291 1,249,956 208.5 167.7 197.4
Green – Green – Blue (GGB)
Maize–Bean Inter. 1,559,226 1,868,367 1,488,419 1,638,671 222.7 268.1 225.3 238.7
Sole Maize Crop 1,073,833 1,064,704 1,303,019 1,147,185 149.0 130.4 177.9 152.4
Sole Bean crop 1,235,111 990,033 1,187,667 1,137,604 244.1 204.0 227.7 225.3
Mean (n =) 1,289,390 1,307,701 1,326,368 205.3 200.8 210.3
Red – Red – Blue (RRB)
Maize–Bean Inter. 1,276,046 1,260,207 1,630,883 1,389,045 219.9 228.3 281.9 243.4
Sole Maize Crop 1,109,407 848,457 1,190,315 1,049,393 194.2 152.3 212.5 186.3
Sole Bean crop 1,228,422 1,056,806 1,074,759 1,119,996 318.4 226.5 290.1 278.3
Mean (n =) 1,204,625 1,055,157 1,298,652 244.2 202.4 261.5
Significance level
Irrigation treatments NS 0.043
Cropping system <0.001 <0.001
Nitrogen NS NS
Irrigation * Cropping system NS NS
Irrigation * Nitrogen NS NS
Irrigation*N*Crop sys. NS NS
LSD
Irrigation 105227.3 30.57
Cropping system 137566.6 25.41
Nitrogen 128447.7 27.02
Effect of application of chameleon sensors on gross margins and governance at nine irrigation schemes
Farmer discussion groups regularly reported substantial increases in yield post introduction of the
tools at the nine irrigation schemes in Malawi (figure 6 and 7). Although there have been a large number
of written farmer testimonies, it was hard to know how widespread success is, since it is often the lead
group who volunteer such information. However, the project collected data from 198 farmers and
provided robust data on environmental, social and economic impacts. The figure 6 gives some insight
into data collected on the nine irrigation schemes: A plot of gross margin of maize against fertiliser
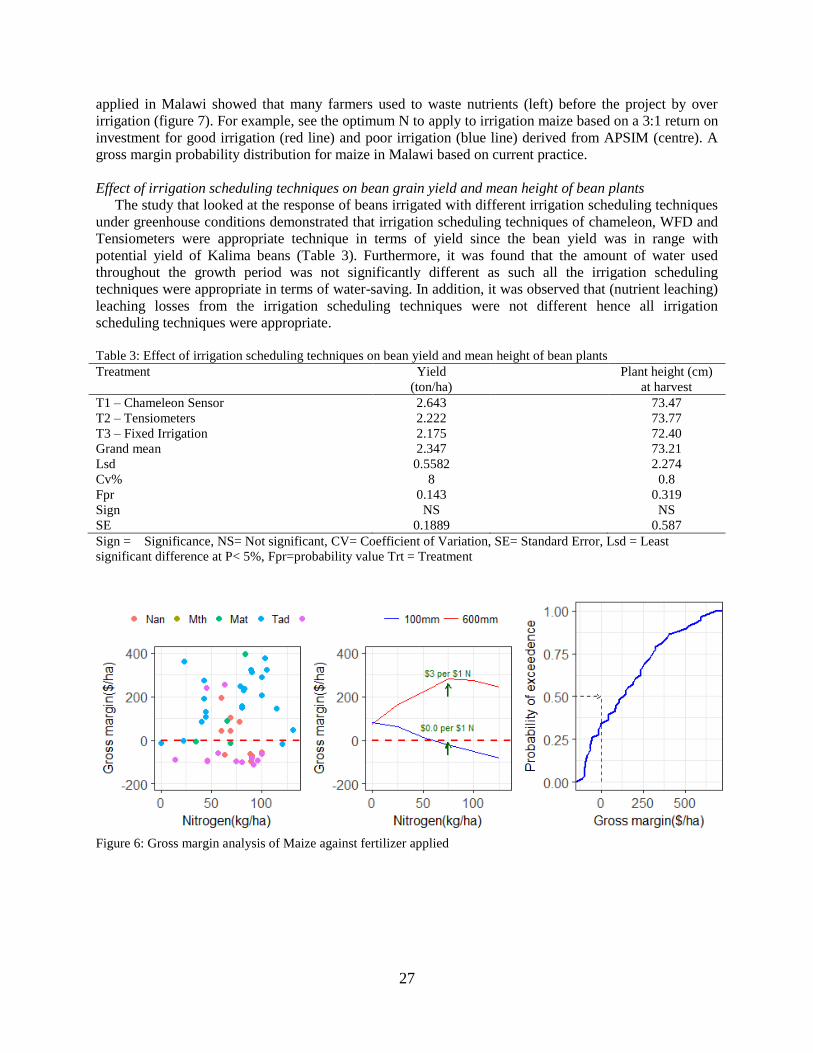
27
applied in Malawi showed that many farmers used to waste nutrients (left) before the project by over
irrigation (figure 7). For example, see the optimum N to apply to irrigation maize based on a 3:1 return on
investment for good irrigation (red line) and poor irrigation (blue line) derived from APSIM (centre). A
gross margin probability distribution for maize in Malawi based on current practice.
Effect of irrigation scheduling techniques on bean grain yield and mean height of bean plants
The study that looked at the response of beans irrigated with different irrigation scheduling techniques
under greenhouse conditions demonstrated that irrigation scheduling techniques of chameleon, WFD and
Tensiometers were appropriate technique in terms of yield since the bean yield was in range with
potential yield of Kalima beans (Table 3). Furthermore, it was found that the amount of water used
throughout the growth period was not significantly different as such all the irrigation scheduling
techniques were appropriate in terms of water-saving. In addition, it was observed that (nutrient leaching)
leaching losses from the irrigation scheduling techniques were not different hence all irrigation
scheduling techniques were appropriate.
Table 3: Effect of irrigation scheduling techniques on bean yield and mean height of bean plants
Treatment
Yield
(ton/ha)
Plant height (cm)
at harvest
T1 – Chameleon Sensor 2.643 73.47
T2 – Tensiometers 2.222 73.77
T3 – Fixed Irrigation 2.175 72.40
Grand mean 2.347 73.21
Lsd 0.5582 2.274
Cv% 8 0.8
Fpr 0.143 0.319
Sign NS NS
SE 0.1889 0.587
Sign = Significance, NS= Not significant, CV= Coefficient of Variation, SE= Standard Error, Lsd = Least
significant difference at P< 5%, Fpr=probability value Trt = Treatment
Figure 6: Gross margin analysis of Maize against fertilizer applied
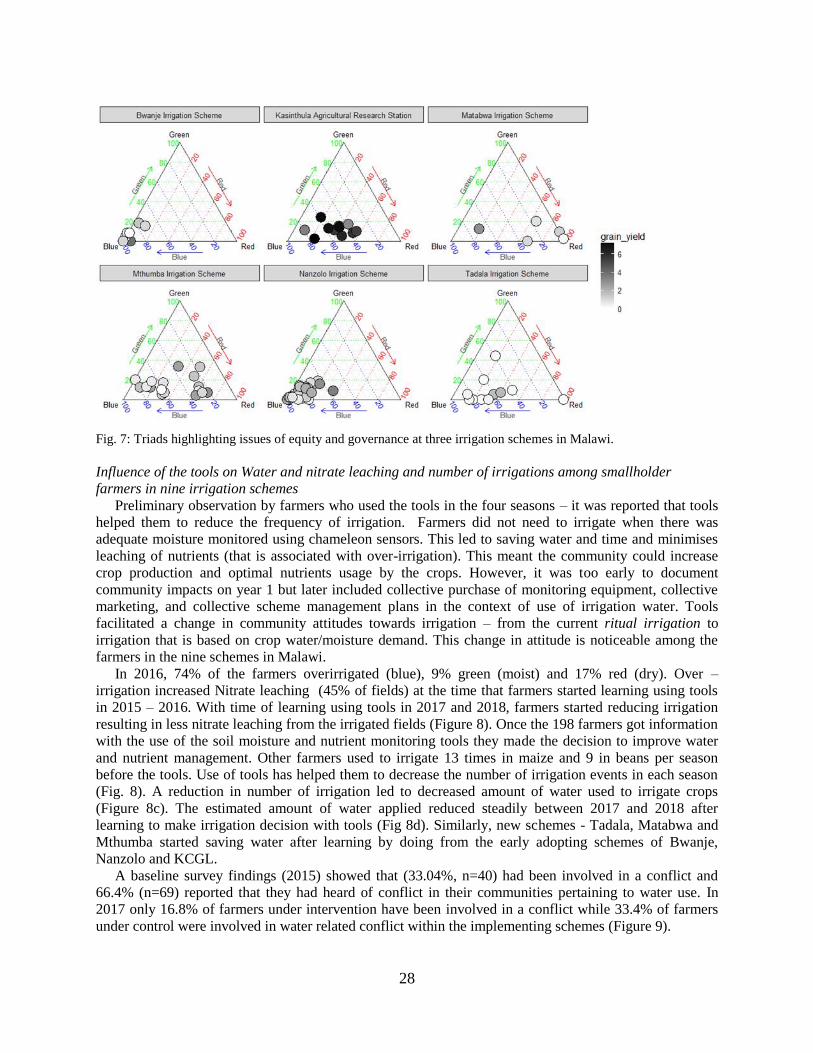
28
Fig. 7: Triads highlighting issues of equity and governance at three irrigation schemes in Malawi.
Influence of the tools on Water and nitrate leaching and number of irrigations among smallholder
farmers in nine irrigation schemes
Preliminary observation by farmers who used the tools in the four seasons – it was reported that tools
helped them to reduce the frequency of irrigation. Farmers did not need to irrigate when there was
adequate moisture monitored using chameleon sensors. This led to saving water and time and minimises
leaching of nutrients (that is associated with over-irrigation). This meant the community could increase
crop production and optimal nutrients usage by the crops. However, it was too early to document
community impacts on year 1 but later included collective purchase of monitoring equipment, collective
marketing, and collective scheme management plans in the context of use of irrigation water. Tools
facilitated a change in community attitudes towards irrigation – from the current ritual irrigation to
irrigation that is based on crop water/moisture demand. This change in attitude is noticeable among the
farmers in the nine schemes in Malawi.
In 2016, 74% of the farmers overirrigated (blue), 9% green (moist) and 17% red (dry). Over –
irrigation increased Nitrate leaching (45% of fields) at the time that farmers started learning using tools
in 2015 – 2016. With time of learning using tools in 2017 and 2018, farmers started reducing irrigation
resulting in less nitrate leaching from the irrigated fields (Figure 8). Once the 198 farmers got information
with the use of the soil moisture and nutrient monitoring tools they made the decision to improve water
and nutrient management. Other farmers used to irrigate 13 times in maize and 9 in beans per season
before the tools. Use of tools has helped them to decrease the number of irrigation events in each season
(Fig. 8). A reduction in number of irrigation led to decreased amount of water used to irrigate crops
(Figure 8c). The estimated amount of water applied reduced steadily between 2017 and 2018 after
learning to make irrigation decision with tools (Fig 8d). Similarly, new schemes - Tadala, Matabwa and
Mthumba started saving water after learning by doing from the early adopting schemes of Bwanje,
Nanzolo and KCGL.
A baseline survey findings (2015) showed that (33.04%, n=40) had been involved in a conflict and
66.4% (n=69) reported that they had heard of conflict in their communities pertaining to water use. In
2017 only 16.8% of farmers under intervention have been involved in a conflict while 33.4% of farmers
under control were involved in water related conflict within the implementing schemes (Figure 9).
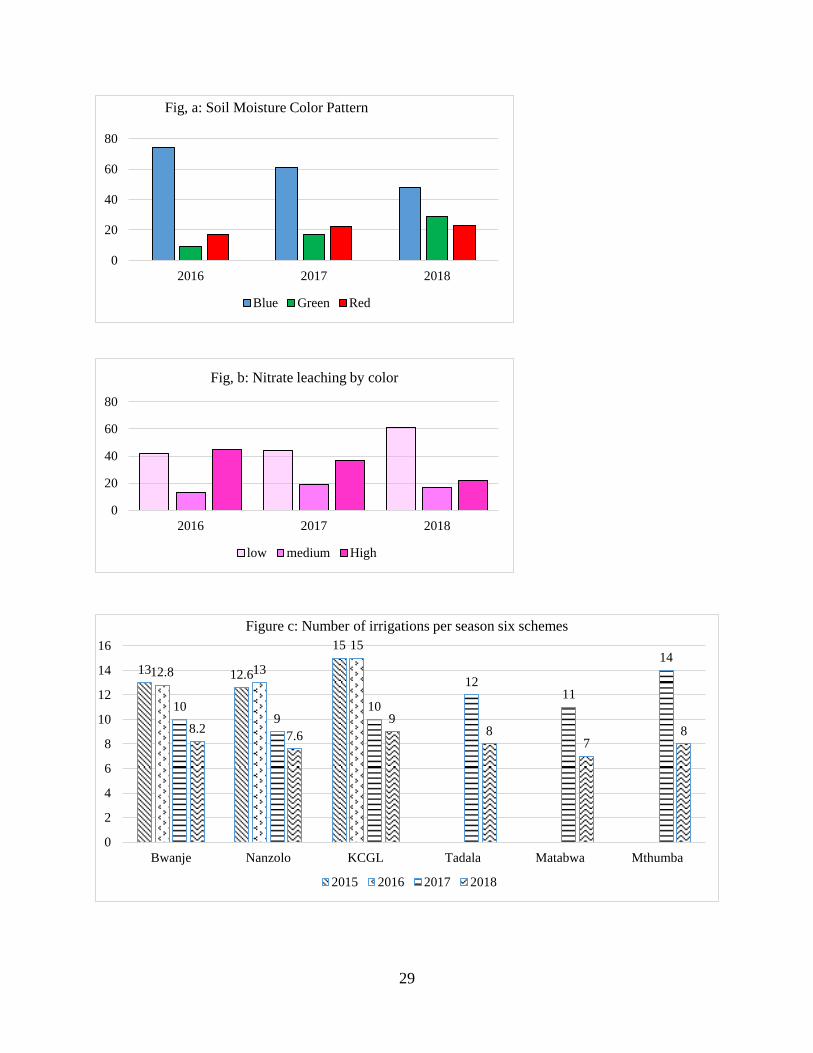
29
0
20
40
60
80
2016 2017 2018
Fig, a: Soil Moisture Color Pattern
Blue Green Red
0
20
40
60
80
2016 2017 2018
Fig, b: Nitrate leaching by color
low medium High
13 12.6
15
12.8 13
15
10 9
10
12 11
14
8.2 7.6
9 8
7 8
0
2
4
6
8
10
12
14
16
Bwanje Nanzolo KCGL Tadala Matabwa Mthumba
Figure c: Number of irrigations per season six schemes
2015 2016 2017 2018
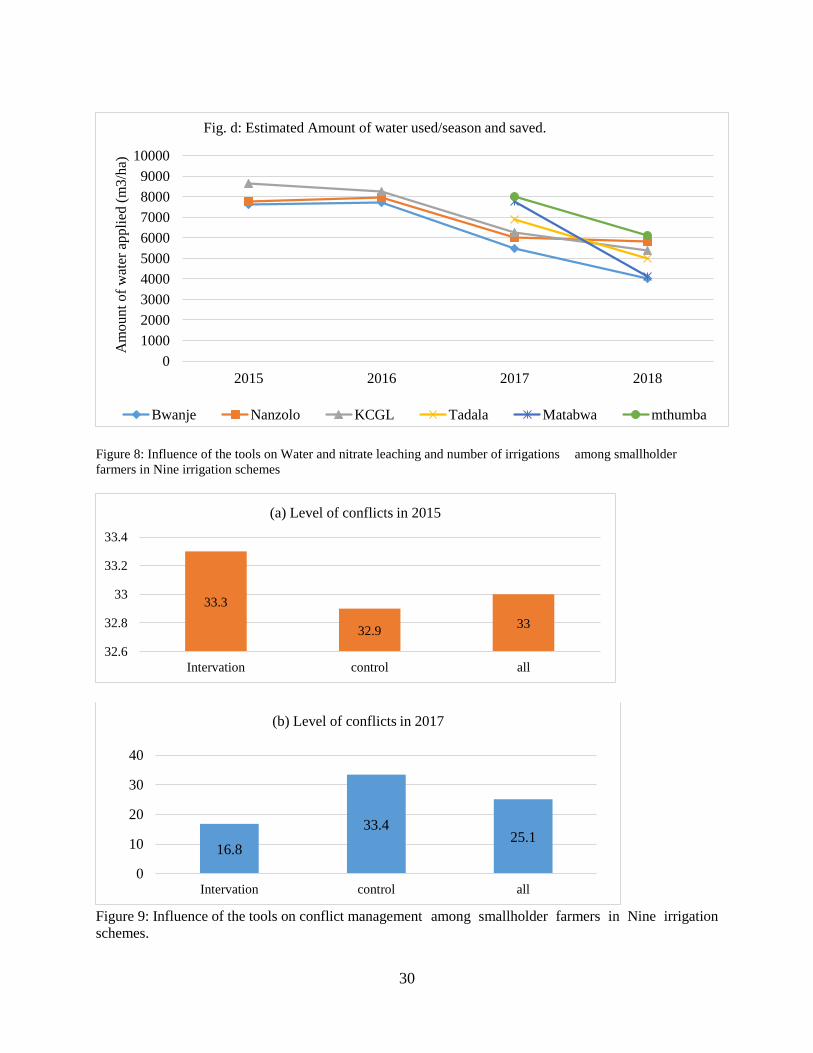
30
Figure 8: Influence of the tools on Water and nitrate leaching and number of irrigations among smallholder
farmers in Nine irrigation schemes
Figure 9: Influence of the tools on conflict management among smallholder farmers in Nine irrigation
schemes.
0
1000
2000
3000
4000
5000
6000
7000
8000
9000
10000
2015 2016 2017 2018
Am
ou
nt
of
wat
er a
pp
lied
(m
3/h
a)
Fig. d: Estimated Amount of water used/season and saved.
Bwanje Nanzolo KCGL Tadala Matabwa mthumba
33.3
32.9 33
32.6
32.8
33
33.2
33.4
Intervation control all
(a) Level of conflicts in 2015
16.8
33.4 25.1
0
10
20
30
40
Intervation control all
(b) Level of conflicts in 2017
31
4. Discussion
This study revealed a great economic, social and environmental benefits that can be realised by
learning by doing at irrigation community level using adaptive water and nutrient management in food
value chains with simple soil moisture and nutrient tools as the focal point of learning. On station and on–
farm trials demonstrated that use of the tools can economically help smallholder farmers to improve crop
yields, reduce amount of irrigation water (water-9olsaving), labour and time to irrigate (time and labour
saving) consequently crops can be grown based on their actual water requirement and limited financial
input for labour and water pumping costs. With such tools, a well-managed soil is realised as it allows
more water and nutrients to be infiltrated and reserved with plant reach by minimising run-off and less to
be leached by permitting a deep rooting zone (Passioura and Angus, 2010). The results for trial 1 on the
effect of the application of chameleon sensors on EWP confirmed that use of chameleon sensors in
monitoring soil moisture improved irrigation water management resulting in increased economic
productivity or water use efficiency (WUE). The EWP result agreed with the result on the effect of
application of chameleon sensors on irrigation amount and number as observed above. In line with on-
farm trials, these results prove that application of chameleon reader and sensor can easily help improve
adaptive water management at farm level for climate change adaptation.
Adaptive water management for climate change adaptation is realised from the knowledge – learnt
from the use of tools that it helped improve crop yields through better management of irrigation water,
soil nutrients, and salt by using simple tools. In the case of trial 1 it was found that Green - Green – Blue
colour pattern (an intuitive) and using the scientific method (objective method) were equivalent whilst
using Red – Red – Blue (an intuitive) at 15, 30 and 45 cm had more saving on irrigation. Therefore
explicit knowledge and implicit knowledge was combined as farmers and scientist learned together that
using chameleon when colour indicates RRB improved irrigation water management resulting in
increased economic productivity in intercropped maize – bean whilst sole maize was found to use more
water than crop diversification itself. A combination of intuitive and objective method during the study
brought great social interaction between farmers, extension workers and irrigation scheme managers that
well managed irrigation and nutrients can result into great social benefits at irrigation community level.
Possibly one of the most unexpected outcomes from the introduction of the tools in the irrigation
schemes is a greater understanding of conflict on the schemes. Well-functioning schemes need
coordinated action – not only for shared responsibilities like paying for water fees and contribution to
canal maintenance but also for coordinated buying on inputs and marketing of produce. The social capital
necessary to underpin such activities is probably our least understood aspect of smallholder schemes. The
use of chameleon sensors in an adaptive way exposed bad management (those denied sufficient water by
the governance system) and also those who break the rules (use water out of turn or take too long to
irrigation thus delaying others access). For example, one farmer reported that “there was favouritism as
far as water distribution is concerned. The authority of water distribution fall in the hands of the Group
Village Headman as such once you crossways with him then you hardly receive water in your field hence
much red was recorded.” Another reported that she “is among farmers who are close to the water hydrant
thus giving her easy access to irrigation water as such getting water for her field was easy hence the blue
being the majority state.”
Use of tools in irrigation water and nutrient management provided a novel way to condense large
amounts of information to give new insights into equity and governance of water and how it relates to
crop yield at scheme level. Each triangle in figure 7 represents an irrigation scheme or research station.
Each circle represents a crop. Each crop is placed in the triad depending on the time and depth-averaged
blue, green and red colours. Hence circles in the bottom left corner denote crops that are predominantly
blue (wet) whereas those on the bottom right are dry. The colour of the circle represents yield, with a
darker colour representing a higher yield. In this way many crops can be compared for their water use
(over–use) and productivity. Not only are the large difference in how wet the soil is between schemes,
there are also large differences within certain schemes, highlighting issues of equity and governance.
32
With such information, adaptive management using the tools can be explored to enhance equity and
governance for climate change adaptation sake.
Similarly, efficient irrigation and nutrient management by the simple tools helped to reduce
environmental impact and promoted sustainable use of resources (Montesano et al. 2015) which is very
important in reducing green gas emission in climate change adaptation. Smallholder farmers avoided
stressing their crops on the one hand and over-irrigation, loss of nutrients and water lodging on the other
when they properly learnt chameleon sensors and wetting front in monitoring irrigation by doing
themselves.
5. Conclusion and Recommendations
The study aimed at improving adaptive water and nutrient management using simple farmer–friendly
monitoring technology in measuring soil water and nutrients for improved efficiency of resources in the
food value chain for climate change adaptation. The study combined objective and subjective knowledge
to generate enough scientific, economic and social testimonies that the use of tools in monitoring soil
moisture from farmers through focus groups and farmer discussion groups improve water management
and crop productivity. The main findings include:
1. Farmers using less water in response to persistent blue colour on the Chameleon. This usually
takes the form of increasing the time between irrigation events.
2. Reduction in conflict over water in the schemes as more water becomes available, particularly to
downstream users.
3. Time saved from not irrigating invested in weeding or off-farm income-generating activities.
4. Greater responses to fertilizer as a function of reduced leaching of nutrients.
5. Higher crop yields (up to double).
6. Greater investment into farm inputs such as seed and fertilizer.
7. Reduced workloads for women and encouragement of youth to enter farming.
The chameleon sensors and WFD gave satisfactory results in monitoring and managing soil water as
the colour patterns helped to show when to irrigate. It can, therefore, be seen as a useful tool in irrigation
water management through continuous soil water monitoring in Malawi. The studied tools (chameleon
reader/sensors and Wetting Front Detectors) were therefore officially recommended for farmer use in
monitoring soil water and nutrients of field irrigated crops for adaptation to the impact of climate change
on water resources.
6. Acknowledgements
We wish to express our heartfelt indebtedness to Department of Agricultural Research Services
(DARS) and Department of Irrigation Services in the Ministry of Agriculture, Irrigation and Water
Development (MoAIWD) for facilitating implementation of the VIA Project, the technical team
comprising of Mr. James Mwepa, Ms. Faith Fandika and Ms. Ellacy Chisale who gave enthusiastic and
motivating technical support during the data collection and analysis. Thanks, Commonwealth for
Scientific and Industrial Research Organization (CSIRO) in Australia, Association for Strengthening
Agricultural Research in East and Central Africa (ASARECA), University of Pretoria and Department of
Agricultural Engineering at LUANAR for mutual and solitary efforts during the VIA project
implementation. Many thanks also go to Irrigation & Drainage Research Attendants and staff of
Kasinthula Agricultural Research Station with whom we shared knowledge and work in many different
ways to accomplish the project objectives.
Finally, I would like to acknowledge ACIAR funding on the “Virtual Irrigation Academy for
improved water productivity in Malawi, Tanzania and Republic of South Africa” that has helped to study
simple soil moisture and nutrient monitoring tool at on–station and on–farm levels at more than nine
different irrigation schemes in Malawi.
33
References
CAADP (2009) Sustainable Land and Water Management The CAADP Pillar I Framework
http://www.caadp.net/pdf/CAADP%20Pillar%201%20Framework.pdf
Charlesworth P (2005) Soil water monitoring. An information package. 2nd Edition Irrigation Insights
number 1http://citeseerx.ist.psu.edu/viewdoc/download?doi=10.1.1.118.567&rep=rep1&type=pdf
Accessed 13 Feb 2014
Guy Sela, (2019). Essentials of Fertilization and Irrigation Management : Theory and best practices. 2019 Edition.
FARA 2006. Agricultural research delivery in Africa: An assessment of the requirements for efficient, effective and
productive national agricultural research systems in Africa. NARS Assessment. 31 pp.
Food and Agriculture Organization (FAO) 2012, Coping with water scarcity. An action framework for agriculture
and food security, FAO Water Reports 38, Food and Agriculture Organization, Rome.
Inocencio, A.; Kikuchi, M.; Tonosaki, M.; Maruyama, A.; Merrey, D.; Sally, H.; de Jong,I. 2007. Costs and performance of
irrigation projects: A comparison of sub-Saharan Africa and other developing regions. Colombo, Sri Lanka:
International Water Management Institute. 81 pp. (IWMI Research Report 109
Mengel K., Kirkby E.A., Kosegarten H., Appel T. (2001) The Soil as a Plant Nutrient Medium. In: Mengel K.,
Kirkby E.A., Kosegarten H., Appel T. (eds) Principles of Plant Nutrition. Springer, Dordrecht
Passioura, J.B., and J.F. Angus. 2010. Improving productivity of crops in water limited environments. Adv.
Agron. 106:37–75.
Stirzaker R. 1999. The problem of irrigated horticulture: matching the biophysical efficiency with the economic
efficiency. Agroforestry Systems, 45: 187-202.
Stirzaker R. 2003. When to turn the water off: scheduling micro-irrigation with a wetting front detector. Irrigation
Science, 22: 177-185.
Stirzaker R. 2005. Managing irrigation with a Wetting Front Detector CSIRO Land and Water ACT 2601 Australia
Stirzaker R, Stevens J, Annandale J, Maeko T, Steyn J, Mpandeli S, Maurobane W, Nkgapele J, Jovanovic N. 2004.
Building capacity in irrigation management with wetting front detectors. Water Research Commission.
Stirzaker R, Steyn J, Annandale J, Adhanom G, Laan M, M'Marete C. 2010. Adapting the wetting front detector to
small-scale furrow irrigation and providing a basis for the interpretation of salt and nutrient measurements
from the water sample. WRC Report.
Stirzaker, R., Car, N., and Chilundu, M., (2014) A traffic light soil water sensor for resource poor farmers: proof of
concept. Final Project Report, ACIAR ABN 34 864 955 427.
Whittenbury K and Davidson P (2010) An Exploratory Study of Irrigators’ DecisionMaking: Day-to-Day
Scheduling Decisions. CRC for Irrigation Futures Technical Report 02/10
34
Available online at www.asric.org
ASRIC Journal on Water, Energy and Environment 1 (2020) 34-60
a Debre Tabor University, Hydraulic and Water Resources Engineering Department,
Debre Tabor, Ethiopia
Received 19 December 2019; revised 30 January 2020; accepted 30 January 2020
Abstract
The study was conducted to evaluate the performance of two small scale irrigation schemes at north Wollo zone,
Amhara regional state using process and comparative performance indicators. The irrigation schemes were Golina
and Kokono with command area of 400ha and 80ha respectively. Primary data collection includes measuring
discharge at diversion weir, soil moisture before and after irrigation and depth of water applied. The secondary data
collection includes determination of crop types, total yields, farm gate prices of irrigated crops, area irrigated per
crop per season, and cost of production. The two schemes were compared using minimum sets of comparative
performance indicators which include agricultural, water use and physical performance indicators. The process
indicators (conveyance, application and storage) were used to check the performance of the two schemes. From the
analyses of the internal performance indicators, the conveyance, application, storage and overall efficiencies were
found to be 76.58%, 52.51%, 48.38% and 40.21% for Golina scheme and 38.02%, 65.93%, 44.89% and 25.07% for
Kokono scheme respectively. From the analysis of comparative indicators, the outputs per cropped area were found
as 1111.67 and 753.38 us$ ha-1
, the value of the outputs per command area of schemes were 2166.37 and 768.44 us$
ha-1
, the output per unit irrigation supply of 0.11 and 0.1us$m-3
, output per water consumed was 0.2 and 0.18 us$ m-3
for Golina and Kokono respectively. The water use performances of the two schemes were compared, RWS found to
be 1 at both schemes and RIS was found as 4 and 1.7 at Golina and Kokono. The irrigation ratio of Golina was
found to be 0.974 and that of Kokono was 0.51. In general, based on the assessment carried out, Golina scheme
performed better than Kokono scheme.
Keywords: Golina; Kokono; Irrigation; Performance; Indicators; Scheme
1. Introduction
Agriculture is regarded as the backbone of Ethiopian economy and a key driver of its long term
growth and food security. It directly supports 85 percent of the population constitutes 45 percent of gross-
1 Corresponding author. Email addresses: (K.F. Ayane)
35
domestic product (GDP), and 85 percent of export value (Tilahun et al., 2011). The majority of
population of Ethiopia is dependent on rain-fed agricultural production for its livelihood. However,
estimated crop production is not close to fulfill the food requirements of the country. One of the best
alternatives to consider for reliable and sustainable food security development is expanding irrigation
development on various scales (whether small, medium or large) and options (diversion, storage, gravity,
pumped, etc.) (Lambisso, 2008).
Irrigation development has been identified as an important tool to stimulate economic growth and rural
development, and is considered as a cornerstone of food security and poverty reduction in Ethiopia.
Increased availability of irrigation and less dependency on rain-fed agriculture is taken as a means to
increase food production and self-sufficiency of the rapidly increasing population of the country
(Awulachew et al., 2010c).
The irrigation development is increased when the construction and the function of irrigation scheme
increased. However, despite water resources and irrigation potential in Ethiopia best owed, the area
developed under irrigation is less than its potential. Even those developed irrigation schemes do not
perform well as planned and expected because of several inter related factors. One of the factors of the
irrigation potential is the performance of conveyance structure is not well functional. Therefore,
improving the performance of the irrigation scheme is one of the issues of development of irrigation in
developing countries and also crucial due to relatively low performances (Awulachew and Ayana, 2011).
Improving the water utilization of the scheme, which requires improving the management skills of the
users, is one challenge to be tackled to ensure the sustainability of the schemes. In the country, water
development for agriculture is a priority, but poorly designed and planned irrigation undermines efforts to
improve livelihoods and exposes people and environment to risks. Recent estimates indicate that the total
irrigated area in Ethiopia is 640,000 ha around 4 to 5 % of the existing cultivated area and 12% of its
irrigation potential (Awulachew et al., 2010c).
Poor management of irrigation water is one of the principal reasons for the low water use efficiency in
irrigation. As available water resources become scarce, more emphasis is given to efficient use of
irrigation water for maximum economic return and water resources sustainability. This requires
measuring how efficiently water is extracted from a water source and used to produce crop yield. The
inadequate and often unreliable water deliveries in the main system cause farmers to face regular
shortages in the water supply, resulting in reduced yields and incomes as well as in much smaller areas
being irrigated than originally planned. At field level, inappropriate field layout and mismanagement also
lead to further water losses and reduced yields. There is a need for research and capacity building to
understand the complex issues of water use and water management, so as to enhance national and local
capacity to deal with water and land management issues to enhance food security, reduce poverty and
speed up national economic development.
2. Materials and Methods
2.1. Description of Study Area
Golina irrigation scheme: Golina Irrigation Scheme is found in Eastern Amhara Regional state under
North Wollo administrative zone, Kobo district. It is located 10 km far from Kobo town in the south
direction and 38 km from Woldiya town in the Northern direction. Geographically, the scheme lies at
12°04′00′′ N to 12°05′30′′ N latitude and 39°37′00′′ E to 39°39′30′′E longitude. The scheme was
implemented to irrigate 400 ha of land.
The diversion weir of this irrigation scheme was constructed on Golina River by Commission for
Sustainable Agriculture and Environmental Rehabilitation in Amhara Region (Co- SAERAR) in 1991
E.C and gave a service for 19 years operational period. The silt excluder, settling basin, and spillways of
the scheme are working properly. Golina irrigation scheme was classified into 5 blocks for operation and
management purpose and there are 5 water user groups.
The length of main canal of this scheme is 2.66 km (the lined main canal is about 1.4 km long while
the unlined main canal is about 1.26 km long). There are 5 earthen secondary canals, 5 division boxes and
36
15 drop structures constructed on the main canal. In the irrigation scheme, flow control gates (metal
sheets) were installed in the whole irrigation system at division boxes or turnouts, but half of them
became un-functional.
Kokono Irrigation Scheme: Like Golina irrigation scheme, Kokono small scale Irrigation Scheme is
found in Eastern Amhara Regional state under North Wollo administrative zone, Habru district, 033 and
034 kebeles. It is located 5 km far from district town and 30 km from zone town. Geographically, the
scheme lies at 𝟏𝟏°𝟑𝟗′𝟒𝟎′′ N to 𝟏𝟏°𝟒𝟎′𝟒𝟎′′ N latitude and 𝟑𝟗°𝟑𝟗′𝟒𝟎′′ E to 𝟑𝟗°𝟒𝟎′𝟓𝟎′′ E longitude and
it covers the area of 80 ha.
The diversion weir were constructed on Kokono River in 1991 E.C by Commission for Sustainable
Agriculture and Environmental Rehabilitation in Amhara Region (Co- SAERAR) having a design area of
80 ha. According to the report of Habru District, the Kokono weir was damaged and re-constructed by
Amhara water works construction enterprise (AWWCE) in 2005 E.C.
The main canal of Kokono small scale irrigation scheme is unlined and has a total length of 1.14 km;
sediment and seepage are the big problem of this scheme. For operation and management purpose the
command area was classified in to 3 water user groups.
2.2. Data Collection Methods
This research was carried out starting from November 2017 to June, 2018 of the two irrigation
seasons. Primary and secondary data have been gathered and engaged for the study purpose. For field data
collection and measurement purposes, Current Meter, Double ring Infiltrometer, Auger, measuring Tape,
Parshall Flume, GPS and Sensitive Balance were used during the study period.
2.2.1. Primary data collection
The primary data were collected through field observations, measurements and laboratory analyses.
Field topography and configurations, water applications and practices related to water management
techniques made by the farmers, measurements of discharge at diversion (intake) points of each irrigation
scheme and also at the initial and final points of main, secondary, tertiary and field canals, soil samples
(for the determination of different soil parameters) and soil infiltration rate test were recorded for both
irrigation schemes.
Additionally GPS data were also recorded to locate the boundary of the command area, actual canals
network and location of canal structures. This was done by walking around the boundary of the command
area and along canals and taking point data. These point data were transferred to map source then
downloaded to GIS software, and then digitized to locate the command area with irrigation canal network
and layout within the boundary on ArcGIS.
2.2.2. Secondary data collection
For each of the selected irrigation schemes, secondary data were collected from Agricultural and Rural
Development Office, Water Resource Offices and irrigation offices at regional, zonal, district levels. The
secondary data included total yields, farm gate prices of irrigated crops, area irrigated per crop per season,
production cost per season, incomes generated by the irrigation associations and cropping pattern.
Climatic data of the irrigation schemes were collected from the nearby meteorological station. For Golina
small scale irrigation scheme, total command area, irrigable area, irrigated area, crop yield and price, were
collected from Kobo district and Weldiya Zone agricultural experts, DA’s reports of Aradom kebele 08
while for Kokono small scale irrigation scheme, Habru district and DA’s reports of kebele 033 and 034.
Key informant interviews with respective stakeholders and group discussions were carried out for
verification of information gathered. A comprehensive field survey has been carried out starting from
November 2017.
2.3. Methods used to measure performance indicators
There are large numbers of indicators proposed by different researchers to evaluate the performance of
irrigation systems (Bos et al., 2005). All performance indicators can however be broadly classified into
37
internal or process indicators and external or comparative indicators (Renault et al., 2007). The purpose of
comparative indicators is to evaluate outputs and impacts of activities related to irrigation management
and interventions across different systems or within the same system over time, while process indicators
are used to assess the actual irrigation performance in relation to system-specific management goals.
2.2.3. Internal performance indicators
These indicators examine the technical or field performance of a project by measuring how close an
irrigation event is to an ideal one. An ideal or reference irrigation is one that can apply the right amount of
water over the entire region of interest (i.e. depth of root zone) uniformly and without losses. Analysis of
the field data allows quantitative definition of the irrigation system performance. The performance of
irrigation practice is determined by the efficiency with which the water is conveyed through the canal,
how irrigation is applied to the field, how adequate the amount is and how the application is uniformly
applied to the field (Feyen and Zerihun, 1999).
a. Conveyance efficiency
Significant volume of water is lost by the networks of the conveyance canals due to seepage and
evaporation depending on the nature of the soil and agro-climatic zone in which the canals are located.
Conveyance efficiency is defined as the ratio of the amount of water that reaches the field to the total
amount of water diverted into the irrigation system and can be expressed as:
Ec = 100 (Qout
Qin) % (1)
Where: Ec is conveyance efficiency (%), 𝑄𝑖𝑛 and 𝑄𝑜𝑢𝑡 are the inflow and outflow discharge in specified
canal reach.
The concept can also be viewed as the evaluation of the water balance of the main, secondary and
tertiary canals and related structures of the irrigation system (Murray-Rust, 1993). It is one of the several
closely related and commonly used output measures of performance that focus on the physical efficiency
of water conveyance by the irrigation system (Bos, 1997). Losses of irrigation water in the conveyance
system can be a major component of the overall water losses particularly for farms located at significant
distances from water sources where the main canals are long and unlined. The amount lost depends on
quality of operation, maintenance and the nature of the soil that affects the seepage rate.
b. Application efficiency
Depending on the type of the source, water is diverted, or pumped to a canal or pipe for conveyance to
the farm for distribution and finally for application to the crops in the field. When water is diverted into
any water application system such as furrows, part of the water infiltrates into the soil for consumptive
use by the crop, while the rest is lost as deep percolation and as runoff. The efficiency terms determine
these components and compare them with the volume of water actually applied to the field is regarded as
application efficiency. The term is an indication of the effectiveness of the system in reducing losses
during an irrigation event.
The Application Efficiency is a term initially formulated by Israelson (1950) and measures the ratio
between the volumes (depth) of water stored in the root zone for use by the plant to the volume (depth) of
water applied to the field. The term has been expressed in different ways over the years to include
different parameters by different authorities. Field irrigation efficiencies are influenced by factors such as
soil type, field application methods, depth of application and climate. Very high values are achieved in
arid climates and where water shortages prevail. However, in the area where the water applied exceeds
water required, indicating an over irrigation, emphases should be given to reduce the amount of irrigation
water (Hailu and Shiberu, 2011). The water application efficiency is defined as:
38
𝐸𝑎 = 100 (𝑤𝑐
𝑤𝑓) (2)
Where: 𝑤𝑓 the water delivered to the field and 𝑤𝑐 is water available for use by the crop.
c. Storage efficiency
The water storage efficiency refers how completely the water needed prior to irrigation has been stored
in the root zone during irrigation. It is the ratio of the quantity of water stored in the root zone during
irrigation event to that intended to be stored in the root zone. The value is important either when the
irrigations tend to leave major portions of the field under-irrigated or where under-irrigation is purposely
practiced to use precipitation as it occurs. This parameter is most directly related to the crop yield since it
will reflect the degree of soil moisture stress. Usually, under-irrigation in high probability rainfall areas is
a good practice to conserve water but the degree of under-irrigation is a difficult question to answer at the
farm level (Hailu and Shiberu, 2011). The total available water in the root zone is the difference between
the water content at field capacity and wilting point (Allen et al., 1998).
TAW = 1000(FC − PWP)Zr (3)
Where: TAW the total available soil water in the root zone [mm], FC the water content at field capacity
[m3 m
-3], PWP the water content at permanent wilting point [m
3 m
-3], 𝑍𝑟 is the rooting depth [m]. TAW is
the amount of water that a crop can extract from its root zone, and its magnitude depends on the type of
soil and the rooting depth. The fraction of TAW that a crop can extract from the root zone without
suffering water stress is the readily available soil water.
RAW = pTAW (4)
Where RAW is the readily available soil water in the root zone [mm], and p is an average fraction of
Total Available Soil Water (TAW) that can be depleted from the root zone before moisture stress
(reduction in ET).
If there are plants growing on the soil, the moisture level continues to drop until it reaches the
"permanent wilting point" (PWP). Soil moisture content near the wilting point is not readily available to
the plant. Hence the term "readily available moisture" has been used to refer to that portion of the
available moisture that is most easily extracted by the plants, approximately 75% of the available
moisture. After that, the plants cannot absorb water from the soil quickly enough to replace water lost by
transpiration (Yusuf, 2004). Therefore, readily available moisture is:
Wn = 75%TAW (5)
Then the storage efficiency is calculated as:
Es =Wd
Wn (6)
Where Wd water stored in the root zone during irrigation event (mm) and Wn is water desired to be
stored in the root zone (mm).
d. Overall scheme efficiency
Irrigation efficiencies are evaluated at scheme or farm level for the purpose of identifying the losses
that occur in the irrigation system starting at the water abstraction point, through the conveyance system
down to water application in the field to determine the overall irrigation efficiency. In addition to design
and other technical factors, the farm efficiency is much regulated by the operation of the main supply
39
system to meet the actual field supply requirements and the skill of the system operators (FAO, 1977).
Burman et al. (1983), defined the overall irrigation efficiency (or farm irrigation efficiency) as the
product of the component terms (Ec, Ea), expressed as ratios.
𝐄𝐨 = 𝐄𝐜 ∗ 𝐄𝐚 (𝟕)
2.2.4. External performance indicators
External performance indicators evaluate irrigation systems based on a relative comparison of absolute
values rather than being referenced to standards or target. Many indicators used for external performance
evaluation can be calculated from secondary data rather than primary data. These set of indicators are
designed to show gross relationship and trends and are useful in indicating where more detailed study
should take place, where a project has done extremely well, or where dramatic changes take place.
According to Bos et al. (1994), external performance indicators are grouped as:
a. Agriculture performance indicators
A number of indicators were developed with regard to irrigated agricultural systems. They are used for
the evaluation of the project performance in terms of the production it results in. It expresses the output of
irrigated area in terms of the gross or net value of production measured at local or world prices. This
addresses the direct impact of operational inputs in terms of such aspects as area actually irrigated and
crop production, over which an irrigation manager may have some but not full responsibility. Four
indicators related to the output of different units were used for the evaluation of agricultural performance.
These indicators were calculated as follows (Malano et al., 2004 and Molden et al., 1998 )
Output per cropped area =Value of production($)
Irrigated Cropped area(ha) (8)
Output per unit Command =Value of production($)
command area(ha) (9)
Output per unit irrigated supply =Value of production($)
Diverted Irrigation supply (m3) (10)
Output per unit water consumed =Value of production($)
volume of water consumed by ET (m3) (11)
Value of production: is the output of the irrigated area (US$) in terms of the gross or net value of
production measured at local or world prices. Irrigated cropped area (ha) is the sum of areas under crops
during the time period of analysis. Command area (ha) is the nominal or design area to be irrigated.
Diverted irrigation supply (m3) is the volume of surface irrigation water diverted to the command area. In
this study production from irrigated agriculture is the principal issue to compare systems. However there
are difficulties when comparing different crops across a system, say onion and tomato, as 1kg of onion is
not readily comparable with 1kg of tomato. When only one irrigation system is considered, or irrigation
systems in a region where prices are similar, production can be measured as the net value of production
and gross value of production using local values. As a result, agricultural output production values were
determined through local price and finally, they were converted to US$; to standardize and to compare the
results relative to other research findings in the world.
b. Water supply indicators
Molden et al. (1998), states that the water supply indicators (relative water supply and relative
irrigation supply) are better suited to place the irrigation system in its physical and management context.
40
Higher values of these indicators indicate a more generous supply of water. In this case, productivity to
land may be more important. Where the water supply indicators show a lower value it indicates a situation
of a more constrained water supply and values of productivity per unit of water are more important.
According to Bos et al. (1994), these indicators deal with the primary task of irrigation
managers in the capture, allocation, and conveyance of water from a source to field by
management of irrigation facilities. Indicators address several aspects of this task: efficiency of conveying
water from one location to another, the extent to which agencies maintain irrigation infrastructure to keep
the system running efficiently, and the service aspects of water delivery which include such concepts as
predictability and equity.
i. Relative water supply (RWS)
According to Levine (1982), Relative water supply indicates the adequacy of water applied to the amount
of water demanded by the crop. It is the ratio of total water supplied by irrigation plus rainfall to total
water demanded by crop i.e. actual crop evapotranspiration (ETc).
Relative water supply =Total water supply
Cropped water demand (12)
Where, Total water supply = diverted water for irrigation plus rainfall (m3), Crop water demand =
potential crop evapotranspiration, or the real evapotranspiration (ETc) when full crop water requirement
is satisfied (m3).
ii. Relative irrigation supply (RIS)
This is the second water supply indicator and described as the ratio of irrigation supply to
irrigation demand. Irrigation water is a scarce resource in many irrigation schemes and it is a major
constraint for production. This indicator is useful to assess the degree of irrigation water
stress/abundance/ in relation to irrigation demand (Molden et al., 1998 and Perry, 1996).
Relative irrigation supply =irrigation supply
irrigation demand (13)
Irrigation supply = only the surface diversion for irrigation (m3), Irrigation demand = the crop ET minus
effective rainfall (m3).
RIS relates irrigation supply to irrigation demand of the irrigation schemes in the production season. The
computed value shows some indication as to the condition of water abundance or scarcity, and how
tightly supply and demand are matched. If the value greater than 1, it indicates irrigation supply was
beyond the irrigation demand; if it is less than 1, the irrigation supply was below the irrigation demand.
While if it is equal to 1, the supplied amount of irrigation was sufficient to demand, i.e. neither surplus
nor deficit. Most of the time it is better to have a RIS near 1 than a higher value.
However, the indicator did not show the monthly relation between irrigation supply and irrigation
demand. Additionally, care must be taken in the interpretation of results; the value 0.8 may not represent a
problem; rather it may provide an indication that farmers are practicing deficit irrigation with a short
water supply to maximize returns on water.
c. Physical performance indicators
Physical indicators are related to changing or losing irrigated land in the command area due to different
reasons. Water scarcity and input availability are the main reasons why lands in command area are not
fully under irrigation in a particular season. From physical performance, two important indicators were
selected to measure the sustainability and irrigation intensities of the system.
41
i. Irrigation Ratio
Sener et al. (2007), developed a relation between currently irrigated areas to the command (nominal)
area to be irrigated to quantify the level of utilization of the potential irrigable area for irrigated
agriculture for a particular production time period. Lower utilization of the given irrigable area may be
due to different constraints; i.e. lack of irrigation infrastructure, shortage of irrigation water, lack of
interest on irrigation due to less return and market problems, and reduced productivity due to (soil
nutrient depletion, lack of improved technologies, lack of inputs and waterlogging) etc.
To compute the indicator information of irrigated areas in the irrigation season and
designed irrigable areas of both schemes were collected from Agricultural and Rural
development Offices. Irrigation ratio is determined as follows (Molden et al., 1998).
Irrigation ratio =Irrigated area
command (nominal) irrigable area (14)
Where, Irrigated area = irrigated area in the irrigation season (ha), Command area = the design (nominal)
irrigable area (ha).
3. Results and Discussion
3.1. Soil Physical Properties
To investigate some of the physical properties of soil in the study area (moisture content at field capacity
(FC) and permanent wilting point (PWP), moisture content before and after irrigation, texture and bulk
density), for the purpose of understanding the general feature of the irrigated soil type, different field
samples were taken and analyzed.
3.1.1. Particle size distribution (texture)
Based on the laboratory analysis of particle size distribution, the textural class of Golina Small scale
irrigation scheme was found to be clay loam at upper and lower and clay at the middle while the particle
size distribution of Kokono Small scale irrigation scheme was clay loam at upper and middle and clay at
lower.
3.1.2. Bulk density, field capacity, PWP and total available water
Bulk density
The bulk densities of the soil of the two small scale irrigation schemes varied between 0.95 and 1.37
gcm−3 at Golina and 1.13 to 1.34 gcm−3 at Kokono scheme. The average bulk density of the soil in the
study area was found to be 1.18 gcm−3 and 1.25 gcm−3 at Golina and Kokono small scale irrigation
schemes respectively. Edelson et al. (1995), recommended the soil bulk density below 1.4 gcm−3 for
clays and 1.6 gcm−3 for sands in order to get better plant growth. The bulk density values of the soils at
both irrigation schemes were low as per the bulk density rating of Van den Akker et al. (2003) indicating
that there was no compaction that could limit infiltration of water into and through the soil and root
penetration.
Field capacity, permanent wilting point, and total available water
Volumetric moisture content retained at field capacity varied from 19-40% and 17-40% at Golina and
Kokono irrigation schemes respectively while the volumetric moisture content at permanent wilting point
varied from 7-20% for soils of both irrigation schemes. Furthermore, the total available water holding
capacity of soils selected fields from Golina scheme ranged from 120-250 mm m−1 and 100-240 mm
m−1 at Kokono. In general soil of both schemes are medium as per available water holding rating
(McIntyre, 1974 and ICE, 1983). The results depict that the relevant soil physical properties measured are
42
not different from a great deal from each other with depth and that the soils of the study area are
homogeneous.
3.1.3. Soil Infiltration Rate
The infiltration rate was measured at the head, middle and tail end of three test plots to determine the
infiltration characteristics of the soil using double ring infiltrometer. Infiltration rate is very rapid at the
start of water application, but it decreases rapidly with the advance of time and eventually approaches a
constant value. The nearly constant infiltration rate that reaches after some elapsed time from the start of
irrigation is termed as the basic infiltration rate.
From the result obtained the average basic infiltration rates of Golina and Kokono Small scale
irrigation schemes were measured as 6 mm/h and 5.4 mm/h respectively. The infiltration rates of both
schemes were between the ranges recommended by FAO. According to Kay (1986), the basic infiltration
rate of soil in the range of 1-10 mm/hr, is classified as soil with low infiltration rate which is the typical
characteristics of clay textured soil. The textural class and average infiltration rate are agreed on the
textural class of the schemes.
3.2. Determination of Reference Evapotranspiration (𝐸𝑇𝑜)
Based on the procedure described in the methodology part, ETo values of the two schemes were
computed. The minimum and maximum daily ETo values of Golina irrigation scheme were 4.13 mm/day
in December and 6.12 mm/day in June. In Kokono the maximum ETo was estimated to be 4.88 mm/day in
the month of May and the minimum was 2.73 mm/day in October. The estimated average daily ETo
values of Golina and Kokono SSI were 5.11 and 4 mm/day, respectively.
3.3. Water Flow Rate Measurement
It was quite difficult to measure water flow rates continuously from intake to farm inlets because there
was a flow fluctuation; the farmer uses rotational scheduling systems. Sometimes, there were water
abstractions in the upstream/illegal water users/ and the absence of reliable and functional flow control
systems at each division boxes. The flow rate at intake, main canals, secondary canals and flow applied to
the field was recorded five times for the purpose of determining conveyance efficiency, application
efficiency and total water demand for irrigation. According to the primary field survey, the average
discharge at the inlet of the intake gate was 394.334 l/s for Golina and 34.325 l/s for Kokono.
3.4.1. Water flow rate measurement at farm inlets
In Golina irrigation scheme the total inflow that came through the main canal got divided into five
secondary canals and then it divided into twenty-seven tertiary canals. The measured observations
indicated that a mean in-flow rate of 9.47 l/s reached the farm inlets. In the case of Kokono SSI scheme
the total inflow that came through the main canal divided into 5 field canals. Measurements in farm inlets
showed that a mean of 4.75 l/s inflow rate reached them.
The above two mean inflow rates were used for the determination of total water delivered to farm
fields at both irrigation schemes. In both SSI scheme farmers have been practicing two irrigation seasons;
the amount of diverted and delivered water in those schemes was the total sum of the two irrigation
seasons for the year 2017/18.
3.4. Crop Water Requirements and Irrigation Requirements
CROPWAT 8.0 model computed the crop water requirements and it needs climatic data for ETo
computation, crop characteristics data and soil description for the determination of crop water
requirements and irrigation water requirements. Crop water requirements are defined as the depth of
water needed to meet the water loss through evapotranspiration. It was determined for the major crops
grown in both irrigation schemes. The major crops grown during the study period have been identified for
both schemes.
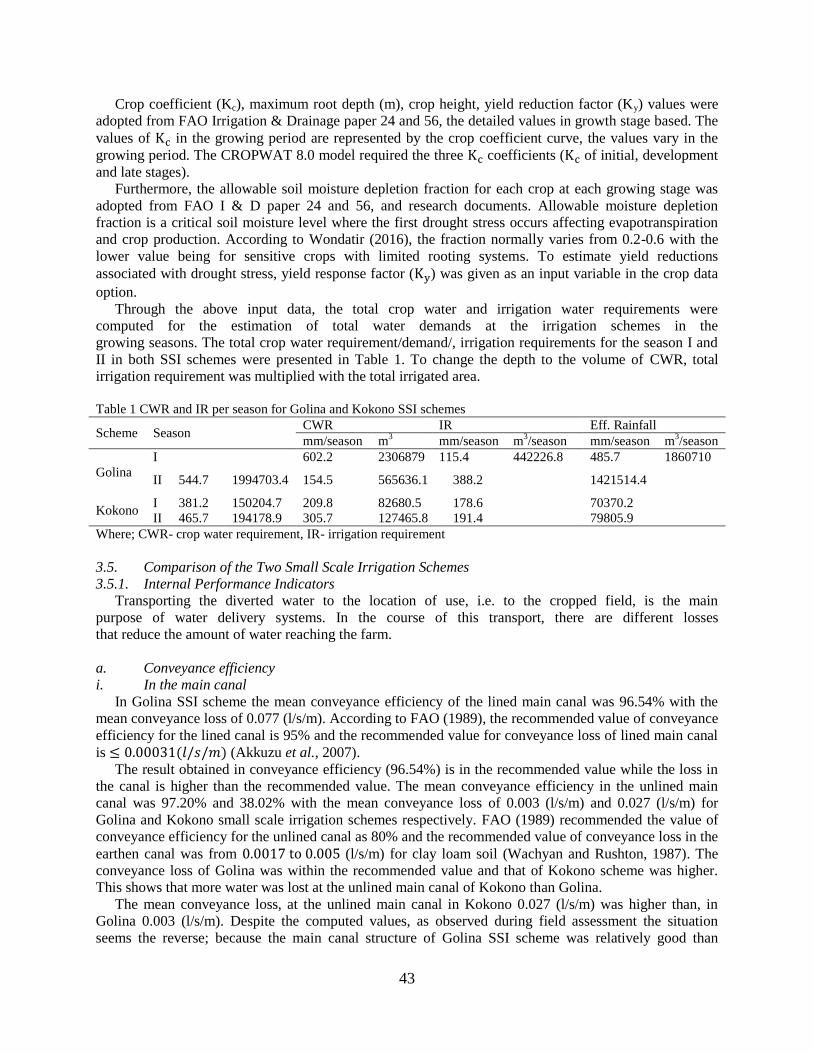
43
Crop coefficient (Kc), maximum root depth (m), crop height, yield reduction factor (Ky) values were
adopted from FAO Irrigation & Drainage paper 24 and 56, the detailed values in growth stage based. The
values of Kc in the growing period are represented by the crop coefficient curve, the values vary in the
growing period. The CROPWAT 8.0 model required the three Kc coefficients (Kc of initial, development
and late stages).
Furthermore, the allowable soil moisture depletion fraction for each crop at each growing stage was
adopted from FAO I & D paper 24 and 56, and research documents. Allowable moisture depletion
fraction is a critical soil moisture level where the first drought stress occurs affecting evapotranspiration
and crop production. According to Wondatir (2016), the fraction normally varies from 0.2-0.6 with the
lower value being for sensitive crops with limited rooting systems. To estimate yield reductions
associated with drought stress, yield response factor (Ky) was given as an input variable in the crop data
option.
Through the above input data, the total crop water and irrigation water requirements were
computed for the estimation of total water demands at the irrigation schemes in the
growing seasons. The total crop water requirement/demand/, irrigation requirements for the season I and
II in both SSI schemes were presented in Table 1. To change the depth to the volume of CWR, total
irrigation requirement was multiplied with the total irrigated area.
Table 1 CWR and IR per season for Golina and Kokono SSI schemes
Scheme Season CWR IR Eff. Rainfall
mm/season m3 mm/season m
3/season mm/season m
3/season
Golina
I 602.2 2306879 115.4 442226.8 485.7 1860710
II 544.7 1994703.4 154.5 565636.1 388.2 1421514.4
Kokono I 381.2 150204.7 209.8 82680.5 178.6 70370.2
II 465.7 194178.9 305.7 127465.8 191.4 79805.9
Where; CWR- crop water requirement, IR- irrigation requirement
3.5. Comparison of the Two Small Scale Irrigation Schemes
3.5.1. Internal Performance Indicators
Transporting the diverted water to the location of use, i.e. to the cropped field, is the main
purpose of water delivery systems. In the course of this transport, there are different losses
that reduce the amount of water reaching the farm.
a. Conveyance efficiency
i. In the main canal
In Golina SSI scheme the mean conveyance efficiency of the lined main canal was 96.54% with the
mean conveyance loss of 0.077 (l/s/m). According to FAO (1989), the recommended value of conveyance
efficiency for the lined canal is 95% and the recommended value for conveyance loss of lined main canal
is ≤ 0.00031(𝑙/𝑠/𝑚) (Akkuzu et al., 2007).
The result obtained in conveyance efficiency (96.54%) is in the recommended value while the loss in
the canal is higher than the recommended value. The mean conveyance efficiency in the unlined main
canal was 97.20% and 38.02% with the mean conveyance loss of 0.003 (l/s/m) and 0.027 (l/s/m) for
Golina and Kokono small scale irrigation schemes respectively. FAO (1989) recommended the value of
conveyance efficiency for the unlined canal as 80% and the recommended value of conveyance loss in the
earthen canal was from 0.0017 to 0.005 (l/s/m) for clay loam soil (Wachyan and Rushton, 1987). The
conveyance loss of Golina was within the recommended value and that of Kokono scheme was higher.
This shows that more water was lost at the unlined main canal of Kokono than Golina.
The mean conveyance loss, at the unlined main canal in Kokono 0.027 (l/s/m) was higher than, in
Golina 0.003 (l/s/m). Despite the computed values, as observed during field assessment the situation
seems the reverse; because the main canal structure of Golina SSI scheme was relatively good than
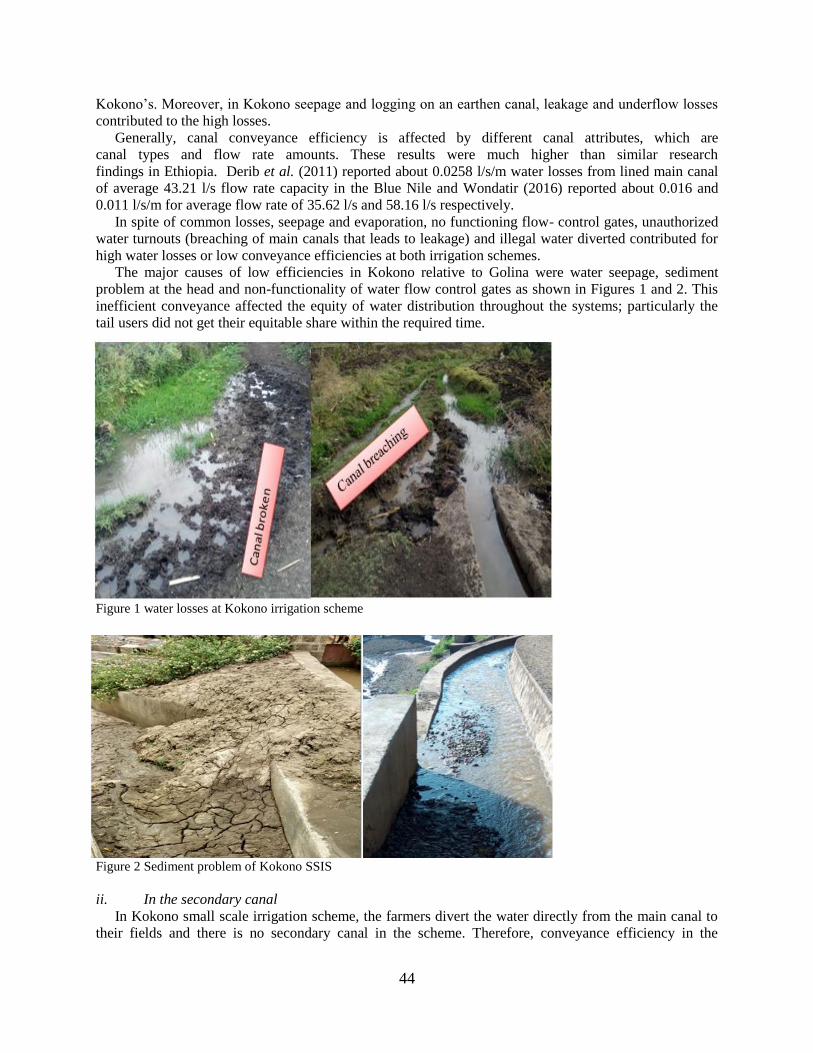
44
Kokono’s. Moreover, in Kokono seepage and logging on an earthen canal, leakage and underflow losses
contributed to the high losses.
Generally, canal conveyance efficiency is affected by different canal attributes, which are
canal types and flow rate amounts. These results were much higher than similar research
findings in Ethiopia. Derib et al. (2011) reported about 0.0258 l/s/m water losses from lined main canal
of average 43.21 l/s flow rate capacity in the Blue Nile and Wondatir (2016) reported about 0.016 and
0.011 l/s/m for average flow rate of 35.62 l/s and 58.16 l/s respectively.
In spite of common losses, seepage and evaporation, no functioning flow- control gates, unauthorized
water turnouts (breaching of main canals that leads to leakage) and illegal water diverted contributed for
high water losses or low conveyance efficiencies at both irrigation schemes.
The major causes of low efficiencies in Kokono relative to Golina were water seepage, sediment
problem at the head and non-functionality of water flow control gates as shown in Figures 1 and 2. This
inefficient conveyance affected the equity of water distribution throughout the systems; particularly the
tail users did not get their equitable share within the required time.
Figure 1 water losses at Kokono irrigation scheme
Figure 2 Sediment problem of Kokono SSIS
ii. In the secondary canal
In Kokono small scale irrigation scheme, the farmers divert the water directly from the main canal to
their fields and there is no secondary canal in the scheme. Therefore, conveyance efficiency in the
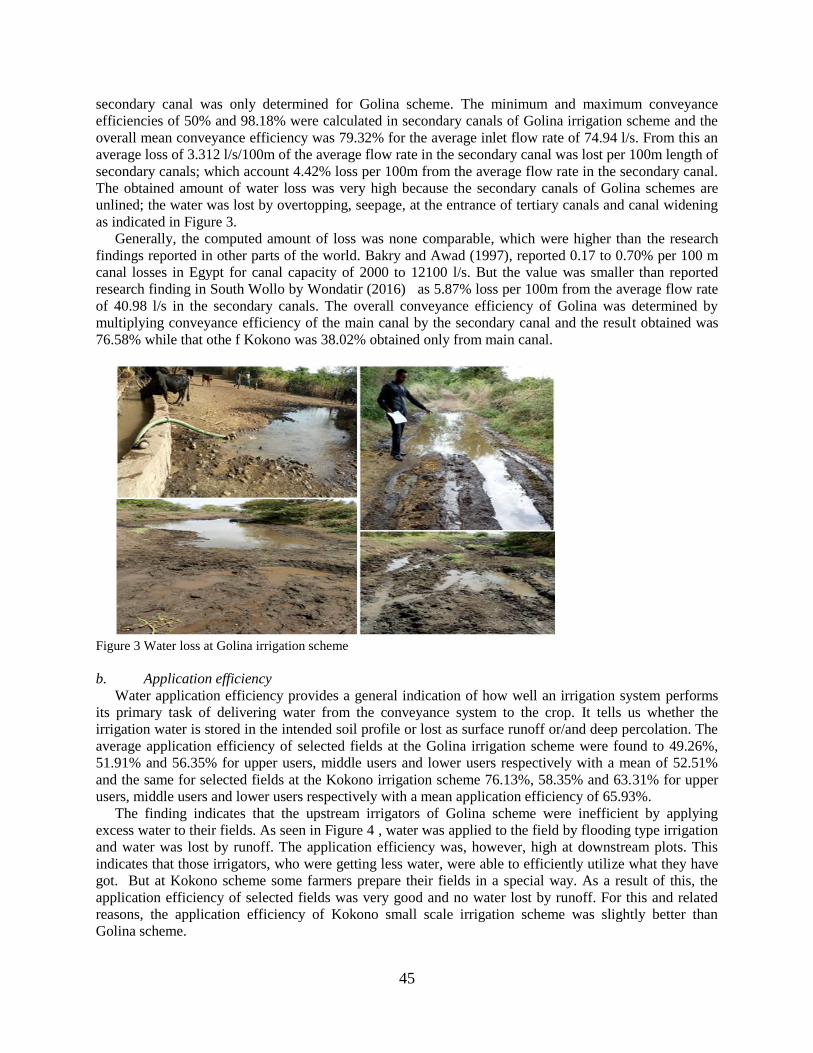
45
secondary canal was only determined for Golina scheme. The minimum and maximum conveyance
efficiencies of 50% and 98.18% were calculated in secondary canals of Golina irrigation scheme and the
overall mean conveyance efficiency was 79.32% for the average inlet flow rate of 74.94 l/s. From this an
average loss of 3.312 l/s/100m of the average flow rate in the secondary canal was lost per 100m length of
secondary canals; which account 4.42% loss per 100m from the average flow rate in the secondary canal.
The obtained amount of water loss was very high because the secondary canals of Golina schemes are
unlined; the water was lost by overtopping, seepage, at the entrance of tertiary canals and canal widening
as indicated in Figure 3.
Generally, the computed amount of loss was none comparable, which were higher than the research
findings reported in other parts of the world. Bakry and Awad (1997), reported 0.17 to 0.70% per 100 m
canal losses in Egypt for canal capacity of 2000 to 12100 l/s. But the value was smaller than reported
research finding in South Wollo by Wondatir (2016) as 5.87% loss per 100m from the average flow rate
of 40.98 l/s in the secondary canals. The overall conveyance efficiency of Golina was determined by
multiplying conveyance efficiency of the main canal by the secondary canal and the result obtained was
76.58% while that othe f Kokono was 38.02% obtained only from main canal.
Figure 3 Water loss at Golina irrigation scheme
b. Application efficiency
Water application efficiency provides a general indication of how well an irrigation system performs
its primary task of delivering water from the conveyance system to the crop. It tells us whether the
irrigation water is stored in the intended soil profile or lost as surface runoff or/and deep percolation. The
average application efficiency of selected fields at the Golina irrigation scheme were found to 49.26%,
51.91% and 56.35% for upper users, middle users and lower users respectively with a mean of 52.51%
and the same for selected fields at the Kokono irrigation scheme 76.13%, 58.35% and 63.31% for upper
users, middle users and lower users respectively with a mean application efficiency of 65.93%.
The finding indicates that the upstream irrigators of Golina scheme were inefficient by applying
excess water to their fields. As seen in Figure 4 , water was applied to the field by flooding type irrigation
and water was lost by runoff. The application efficiency was, however, high at downstream plots. This
indicates that those irrigators, who were getting less water, were able to efficiently utilize what they have
got. But at Kokono scheme some farmers prepare their fields in a special way. As a result of this, the
application efficiency of selected fields was very good and no water lost by runoff. For this and related
reasons, the application efficiency of Kokono small scale irrigation scheme was slightly better than
Golina scheme.
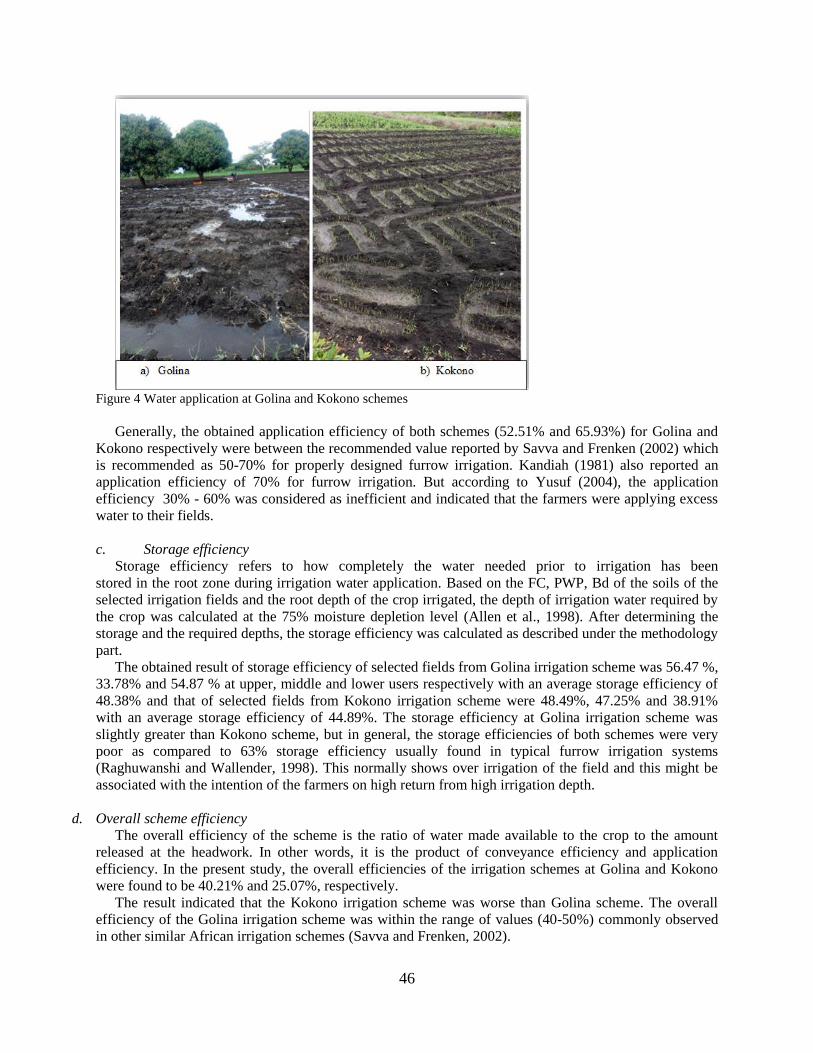
46
Figure 4 Water application at Golina and Kokono schemes
Generally, the obtained application efficiency of both schemes (52.51% and 65.93%) for Golina and
Kokono respectively were between the recommended value reported by Savva and Frenken (2002) which
is recommended as 50-70% for properly designed furrow irrigation. Kandiah (1981) also reported an
application efficiency of 70% for furrow irrigation. But according to Yusuf (2004), the application
efficiency 30% - 60% was considered as inefficient and indicated that the farmers were applying excess
water to their fields.
c. Storage efficiency
Storage efficiency refers to how completely the water needed prior to irrigation has been
stored in the root zone during irrigation water application. Based on the FC, PWP, Bd of the soils of the
selected irrigation fields and the root depth of the crop irrigated, the depth of irrigation water required by
the crop was calculated at the 75% moisture depletion level (Allen et al., 1998). After determining the
storage and the required depths, the storage efficiency was calculated as described under the methodology
part.
The obtained result of storage efficiency of selected fields from Golina irrigation scheme was 56.47 %,
33.78% and 54.87 % at upper, middle and lower users respectively with an average storage efficiency of
48.38% and that of selected fields from Kokono irrigation scheme were 48.49%, 47.25% and 38.91%
with an average storage efficiency of 44.89%. The storage efficiency at Golina irrigation scheme was
slightly greater than Kokono scheme, but in general, the storage efficiencies of both schemes were very
poor as compared to 63% storage efficiency usually found in typical furrow irrigation systems
(Raghuwanshi and Wallender, 1998). This normally shows over irrigation of the field and this might be
associated with the intention of the farmers on high return from high irrigation depth.
d. Overall scheme efficiency
The overall efficiency of the scheme is the ratio of water made available to the crop to the amount
released at the headwork. In other words, it is the product of conveyance efficiency and application
efficiency. In the present study, the overall efficiencies of the irrigation schemes at Golina and Kokono
were found to be 40.21% and 25.07%, respectively.
The result indicated that the Kokono irrigation scheme was worse than Golina scheme. The overall
efficiency of the Golina irrigation scheme was within the range of values (40-50%) commonly observed
in other similar African irrigation schemes (Savva and Frenken, 2002).
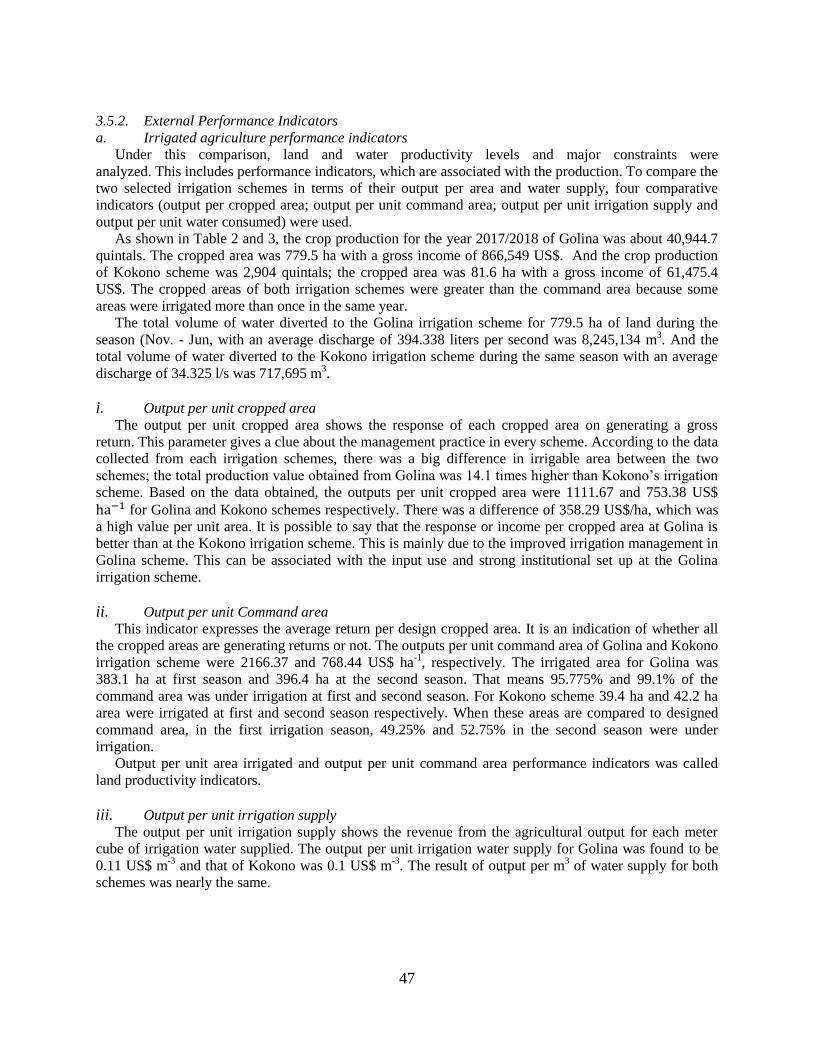
47
3.5.2. External Performance Indicators
a. Irrigated agriculture performance indicators
Under this comparison, land and water productivity levels and major constraints were
analyzed. This includes performance indicators, which are associated with the production. To compare the
two selected irrigation schemes in terms of their output per area and water supply, four comparative
indicators (output per cropped area; output per unit command area; output per unit irrigation supply and
output per unit water consumed) were used.
As shown in Table 2 and 3, the crop production for the year 2017/2018 of Golina was about 40,944.7
quintals. The cropped area was 779.5 ha with a gross income of 866,549 US$. And the crop production
of Kokono scheme was 2,904 quintals; the cropped area was 81.6 ha with a gross income of 61,475.4
US$. The cropped areas of both irrigation schemes were greater than the command area because some
areas were irrigated more than once in the same year.
The total volume of water diverted to the Golina irrigation scheme for 779.5 ha of land during the
season (Nov. - Jun, with an average discharge of 394.338 liters per second was 8,245,134 m3. And the
total volume of water diverted to the Kokono irrigation scheme during the same season with an average
discharge of 34.325 l/s was 717,695 m3.
i. Output per unit cropped area
The output per unit cropped area shows the response of each cropped area on generating a gross
return. This parameter gives a clue about the management practice in every scheme. According to the data
collected from each irrigation schemes, there was a big difference in irrigable area between the two
schemes; the total production value obtained from Golina was 14.1 times higher than Kokono’s irrigation
scheme. Based on the data obtained, the outputs per unit cropped area were 1111.67 and 753.38 US$
ha−1 for Golina and Kokono schemes respectively. There was a difference of 358.29 US$/ha, which was
a high value per unit area. It is possible to say that the response or income per cropped area at Golina is
better than at the Kokono irrigation scheme. This is mainly due to the improved irrigation management in
Golina scheme. This can be associated with the input use and strong institutional set up at the Golina
irrigation scheme.
ii. Output per unit Command area
This indicator expresses the average return per design cropped area. It is an indication of whether all
the cropped areas are generating returns or not. The outputs per unit command area of Golina and Kokono
irrigation scheme were 2166.37 and 768.44 US$ ha-1
, respectively. The irrigated area for Golina was
383.1 ha at first season and 396.4 ha at the second season. That means 95.775% and 99.1% of the
command area was under irrigation at first and second season. For Kokono scheme 39.4 ha and 42.2 ha
area were irrigated at first and second season respectively. When these areas are compared to designed
command area, in the first irrigation season, 49.25% and 52.75% in the second season were under
irrigation.
Output per unit area irrigated and output per unit command area performance indicators was called
land productivity indicators.
iii. Output per unit irrigation supply
The output per unit irrigation supply shows the revenue from the agricultural output for each meter
cube of irrigation water supplied. The output per unit irrigation water supply for Golina was found to be
0.11 US$ m-3
and that of Kokono was 0.1 US$ m-3
. The result of output per m3 of water supply for both
schemes was nearly the same.
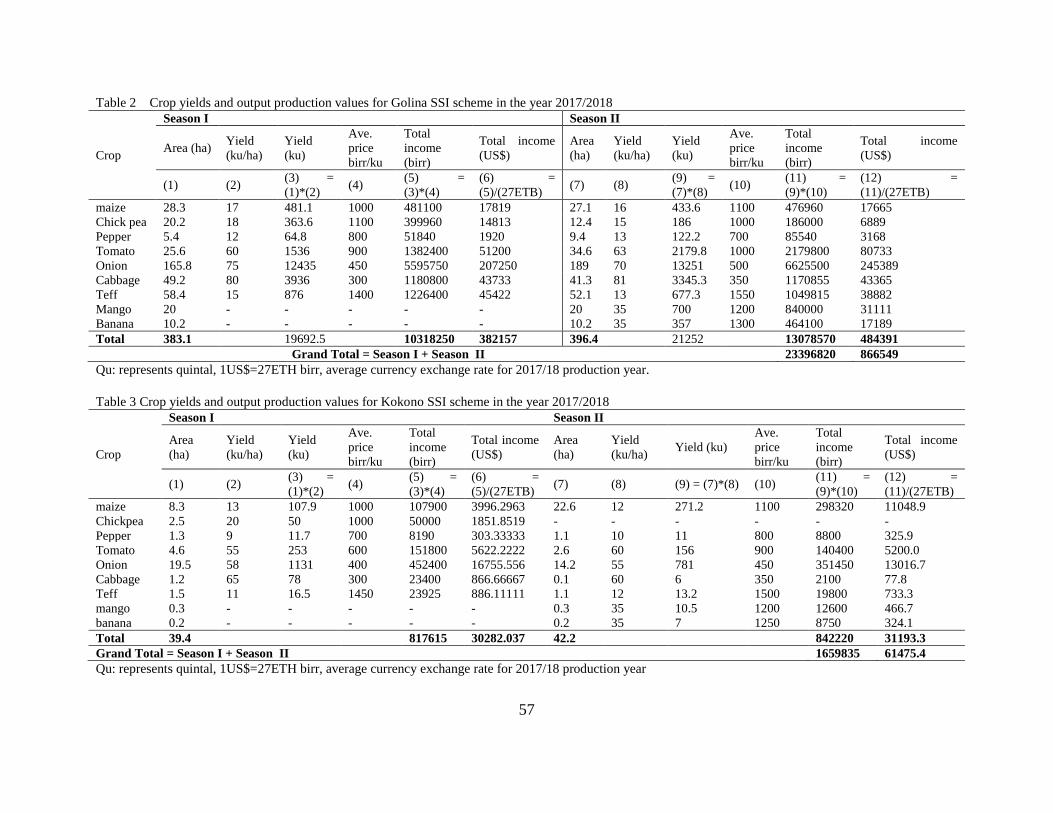
57
Table 2 Crop yields and output production values for Golina SSI scheme in the year 2017/2018
Crop
Season I Season II
Area (ha) Yield
(ku/ha)
Yield
(ku)
Ave.
price
birr/ku
Total
income
(birr)
Total income
(US$)
Area
(ha)
Yield
(ku/ha)
Yield
(ku)
Ave.
price
birr/ku
Total
income
(birr)
Total income
(US$)
(1) (2) (3) =
(1)*(2) (4)
(5) =
(3)*(4)
(6) =
(5)/(27ETB) (7) (8)
(9) =
(7)*(8) (10)
(11) =
(9)*(10)
(12) =
(11)/(27ETB)
maize 28.3 17 481.1 1000 481100 17819 27.1 16 433.6 1100 476960 17665
Chick pea 20.2 18 363.6 1100 399960 14813 12.4 15 186 1000 186000 6889
Pepper 5.4 12 64.8 800 51840 1920 9.4 13 122.2 700 85540 3168
Tomato 25.6 60 1536 900 1382400 51200 34.6 63 2179.8 1000 2179800 80733
Onion 165.8 75 12435 450 5595750 207250 189 70 13251 500 6625500 245389
Cabbage 49.2 80 3936 300 1180800 43733 41.3 81 3345.3 350 1170855 43365
Teff 58.4 15 876 1400 1226400 45422 52.1 13 677.3 1550 1049815 38882
Mango 20 - - - - - 20 35 700 1200 840000 31111
Banana 10.2 - - - - - 10.2 35 357 1300 464100 17189
Total 383.1
19692.5
10318250 382157 396.4
21252
13078570 484391
Grand Total = Season I + Season II 23396820 866549
Qu: represents quintal, 1US$=27ETH birr, average currency exchange rate for 2017/18 production year.
Table 3 Crop yields and output production values for Kokono SSI scheme in the year 2017/2018
Crop
Season I Season II
Area
(ha)
Yield
(ku/ha)
Yield
(ku)
Ave.
price
birr/ku
Total
income
(birr)
Total income
(US$)
Area
(ha)
Yield
(ku/ha) Yield (ku)
Ave.
price
birr/ku
Total
income
(birr)
Total income
(US$)
(1) (2) (3) =
(1)*(2) (4)
(5) =
(3)*(4)
(6) =
(5)/(27ETB) (7) (8) (9) = (7)*(8) (10)
(11) =
(9)*(10)
(12) =
(11)/(27ETB)
maize 8.3 13 107.9 1000 107900 3996.2963 22.6 12 271.2 1100 298320 11048.9
Chickpea 2.5 20 50 1000 50000 1851.8519 - - - - - -
Pepper 1.3 9 11.7 700 8190 303.33333 1.1 10 11 800 8800 325.9
Tomato 4.6 55 253 600 151800 5622.2222 2.6 60 156 900 140400 5200.0
Onion 19.5 58 1131 400 452400 16755.556 14.2 55 781 450 351450 13016.7
Cabbage 1.2 65 78 300 23400 866.66667 0.1 60 6 350 2100 77.8
Teff 1.5 11 16.5 1450 23925 886.11111 1.1 12 13.2 1500 19800 733.3
mango 0.3 - - - - - 0.3 35 10.5 1200 12600 466.7
banana 0.2 - - - - - 0.2 35 7 1250 8750 324.1
Total 39.4
817615 30282.037 42.2
842220 31193.3
Grand Total = Season I + Season II 1659835 61475.4
Qu: represents quintal, 1US$=27ETH birr, average currency exchange rate for 2017/18 production year
58
iv. Output per unit of water consumed
The output per unit of water consumed is used to describe the return on the water actually consumed
by the crop. This indicator gives due attention to the water consumed by each scheme and tells us how
water is efficiently utilized by the scheme from an economic point of view. The outputs per water
consumed for Golina irrigation scheme was 0.2 US$ m-3
and that of Kokono irrigation scheme was about
0.18 US$ m-3
of water. This result shows that the water use efficiency is slightly better at Golina than at
the Kokono irrigation scheme. The reason for this may be institutional set up of Golina which is stronger
than that at the Kokono irrigation scheme.
Through using two indicators, water productivity performances were evaluated at both irrigation
schemes; output per unit irrigation water supplied/diverted/ and output per unit water consumed. At both
irrigation schemes the output per unit water consumed was higher than the output per unit water supplied.
This implied that the consumed amount of irrigation water was more productive than diverted irrigation
water.
b. Water Supply indicators
i. Relative water supply
Relative Water Supply (RWS) showed the availability of water in relation to crop water demand that
means the relative water supply depicts whether or not there is enough irrigation water supplied. Both the
relative water supply and relative irrigation supply relate supply to demand and give some indication as to
the condition of water abundance or scarcity, and how tightly supply and demand are matched. The
relative water supply value below one normally indicates that the water applied is less than the crop
demands. A value of RWS less than one may not represent a problem; rather it may provide an indication
that farmers are practicing deficit irrigation with short water supply to maximize returns on water. And a
value of RWS above one indicates that extra water is added to the root zone beyond plant demands which
means that the total water applied met the crop needs.
Based on equation 12, the indicator was determined for both schemes. In addition to
delivered irrigation amount, total crop water demand, effective rainfall, and crop irrigation demand were
determined by CROPWAT model for a given cropping pattern and irrigation seasons. The relative water
supply values in Golina and Kokono irrigation schemes were 1, which indicated that the supplied water
was sufficient for the crop water demand, i.e. neither surplus nor deficit. This implied that the supplied
water was sufficient for crop water demand for the irrigated land. However, it couldn’t irrigate additional
farmland with this delivery amounts and available effective rainfalls.
ii. Relative irrigation supply
The relative irrigation supply shows whether or not the irrigation demand is satisfied. The
interpretation of the computed value is similar to RWS. At both irrigation schemes, the computed values
of RIS were 4 for Golina and 1.7 for Kokono. These values indicated that there was a generous supply of
water and the sole water provider was irrigation. It is better to have RIS close to 1 than a higher or lower
value (Molden et al., 1998).
c. Physical performance indicators
Physical indicators are related to changing or losing irrigated land in the command area for different
reasons. Irrigation ratio for the Golina irrigation scheme was 0.974, which means that 97.4% of the
command area of the scheme was under irrigation during the study period, but the irrigation ratio of
Kokono irrigation scheme was 0.51 which means about 49% of the command area of the scheme was not
under irrigation during the study period. The main reasons for this were the discharge of the scheme was
decrease because of the new diversion structure was constructed on the upper Kokono River, which is the
source of Kokono irrigation scheme.
59
4. Conclusion
In this study, an attempt was made to evaluate the performance of two small scale irrigation schemes
in Eastern Amhara Regional state under North Wollo administrative zone, Kobo and Habru districts by
using the process and comparative performance indicators. The process performance indicators computed
were conveyance efficiency, application efficiency, storage efficiency, and overall efficiency. The
standardized performance indicators established by the international irrigation management institute
(IIMI) were taken as comparative indicators. The comparative indicators included in this study were
agriculture, water use, and physical performance. Because of data limitation, economic performance was
not included.
The conveyance efficiency of Kokono scheme at the main canal showed low value because the canals
are unlined and due to leakage and lack of management. The conveyance of Golina small scale irrigation
scheme at main, secondary and tertiary canals also low value; But as a general, the conveyance efficiency
of Golina irrigation scheme was more than the recommended value 70 % for unlined poorly managed
canals observed in other African countries. The application efficiency of both schemes was, found to be
good compared to the application efficiency of 50-70% for furrow irrigation observed in other African
countries. But the application efficiency of Kokono scheme was higher than that of Golina irrigation
scheme.
The relative irrigation supply for Golina schemes shows that there is a high ratio, which
implies the amount of water applied during irrigation events was much higher than what was required by
crops. The output per cropped area at Kokono was low as compared to Golina, implying that the irrigation
practice in Kokono was relatively poor. The output per unit command area was also observed to be
relatively low in Kokono. This implies that a large amount of command area was not under irrigation
during the study season in Kokono due to a shortage of water. The returns from the one-meter cube of
irrigation water were almost equal in both schemes. This implies that water utilization in both schemes
was the same.
In general, based on the assessment carried out, it can be concluded that the Golina irrigation scheme
performed better than the Kokono scheme but it cannot be said the Golina scheme does not need
improvement so measures should be taken to improve the performance of both schemes. As there is no
shortage of water, Golina scheme has room to expand and to provide irrigation opportunities to the
surrounding community relying on rain-fed agriculture. The comparison of the performance of irrigation
systems will help to know the present status of these systems.
References
Akkuzu, E., Unal, H. B., Karatas, B. S., Avci, M. & Asik, S. 2007. General Irrigation Planning Performance Of
Water User Associations In The Gediz Basin In Turkey. Journal Of Irrigation And Drainage Engineering,
133, 17-26.
Allen, R., Pereira, L., Raes, D. & Smith, M. 1998. Guidelines For Computing Crop Water Requirements-Fao
Irrigation And Drainage Paper 56, Fao-Food And Agriculture Organisation Of The United Nations, Rome
Fao. Org/docrep) Arpav (2000), La Caratterizzazione Climatic Della Regione Veneto, Quaderni Per.
Geophysics, 156, 178.
Awulachew, S. B. & Ayana, M. 2011. Performance Of Irrigation: An Assessment At Different Scales In Ethiopia.
Experimental Agriculture, 47, 57-69.
Awulachew, S. B., Merrey, D., Van Koppen, B. & Kamara, A. Roles, Constraints And Opportunities Of Small Scale
Irrigation And Water Harvesting In Ethiopian Agricultural Development: Assessment Of Existing
Situation. Ilri Workshop, 2010c. 14-16.
Bakry, M. F. & Awad, A. A. E.-M. 1997. Practical Estimation Of Seepage Losses Along Earthen Canals In Egypt.
Water Resources Management, 11, 197-206.
Bos, M. G. 1997. Performance Indicators For Irrigation And Drainage. Irrigation And Drainage Systems, 11, 119-
137.
60
Bos, M. G., Burton, M. A. & Molden, D. J. 2005. Irrigation And Drainage Performance Assessment: Practical
Guidelines, Cabi Publishing.
Burman, R. D., Cuenca, R. H. & Weiss, A. 1983. Techniques For Estimating Irrigation Water Requirements.
Advances In Irrigation. Elsevier.
Derib, S. D., Descheemaeker, K., Haileslassie, A. & Amede, T. 2011. Irrigation Water Productivity As Affected By
Water Management In A Small-Scale Irrigation Scheme In The Blue Nile Basin, Ethiopia. Experimental
Agriculture, 47, 39-55.
Edelson, R., Krolik, J., Madejski, G., Maraschi, L., Pike, G., Urry, C., Brinkmann, W., Courvoisier, T.-L.,
Ellithorpe, J. & Horne, K. 1995. Multiwavelength Monitoring Of The Bl Lacertae Object Pks 2155-304. 4:
Multiwavelength Analysis. The Astrophysical Journal, 438, 120-134.
Fao 1977. Guidelines For Predicting Crop Water Requirements... Irrigation And Drainage Paper. Fao, Rome.
Fao 1989. Guideline For Designing And Evaluating Surface Irrigation Systems. Irrigation And Drainage Paper. No.
45.Fao, Rome. Climatic Change, 43, 745-788.
Feyen, J. & Zerihun, D. 1999. Assessment Of The Performance Of Border And Furrow Irrigation Systems And The
Relationship Between Performance Indicators And System Variables. Agricultural Water Management, 40,
353-362.
Hailu, H. & Shiberu, E. 2011. Performance Evaluation Of Small Scale Irrigation Schemes In Adami Tullu Jido
Kombolcha Woreda, Central Rift Valley Of Ethiopia. Haramaya University.
Kay, M. 1986. Surface Irrigation Systems And Practice, Cranfield Press.
Lambisso, R. 2008. Assessment Of Design Practices And Performance Of Small Scale Irrigation Structures In South
Region.
Levine, G. 1982. Relative Water Supply: An Explanatory Variable For Irrigation Systems. Technical Report No. 6.
Cornell University.
Malano, H., Burton, M. & Makin, I. 2004. Benchmarking Performance In The Irrigation And Drainage Sector: A
Tool For Change. Irrigation And Drainage: The Journal Of The International Commission On Irrigation
And Drainage, 53, 119-133.
Mcintyre, D. 1974. Water Retention And The Moisture Characteristic. Methods For Analysis Of Irrigated Soils, 108.
Molden, D. J., Sakthivadivel, R., Perry, C. J. & De Fraiture, C. 1998. Indicators For Comparing Performance Of
Irrigated Agricultural Systems, Iwmi.
Murray-Rust, H., W. Bart Snellen 1993. Irrigation System Performance Assessment And Diagnosis, Iwmi.
Raghuwanshi, N. & Wallender, W. 1998. Optimal Furrow Irrigation Scheduling Under Heterogeneous Conditions.
Agricultural Systems, 58, 39-55.
Renault, D., Falcon, T. & Wahaj, R. 2007. Modernizing Irrigation Management: The Masscote Approach--Mapping
System And Services For Canal Operation Techniques, Food & Agriculture Org.
Savva, A. P. & Frenken, K. 2002. Crop Water Requirements And Irrigation Scheduling, Fao Sub-Regional Office
For East And Southern Africa Harare.
Sener, M., Yüksel, A. & Konukcu, F. 2007. Evaluation Of Hayrabolu Irrigation Scheme In Turkey Using
Comparative Performance Indicators.
Tilahun, H., Teklu, E., Michael, M., Fitsum, H. & Awulachew, S. B. 2011. Comparative Performance Of Irrigated
And Rainfed Agriculture In Ethiopia. World Applied Sciences, 14, 235-244.
Van Den Akker, J., Arvidsson, J. & Horn, R. 2003. Introduction To The Special Issue On Experiences With The
Impact And Prevention Of Subsoil Compaction In The European Union. Elsevier.
Wachyan, E. & Rushton, K. 1987. Water Losses From Irrigation Canals. Journal Of Hydrology, 92, 275-288.
Wondatir, S. 2016. Performance Evaluation Of Irrigation Schemes: A Case Study Of Jari And Aloma Small-Scale
Irrigation Schemes, Tehuledere District, Ethiopia. Arba Minch University.
Yusuf, K. 2004. Assessment Of Small-Scale Irrigation Using Comparative Performance Indicators On Two Selected
Schemes In Upper Awash River Valley. Unpublished MSc Thesis, Alemaya University.
61
Available online at www.asric.org
ASRIC Journal on Water, Energy and Environment 1 (2020) 61-67
a Department of Water Resources Management and Agrometeorology,
Federal University of Agriculture Abeokuta, Ogun State, Nigeria
Received 19 December 2019; revised 30 January 2020; accepted 30 January 2020
Abstract
The erratic nature of rainfall pattern in parts of the world, had compelled need for consistent works on
understanding crops response to different environments to enable identification of the varieties of crops with
resistance to drought to ensure food sustainability in drought prone regions. The experiment was conducted in a
screen house at Federal University of Agriculture, Abeokuta (FUNAAB) behind College of Environmental
Resources Management (COLERM) to study the effect of water management regimes on growth of two tomato
varieties. The experimental design was a Complete Randomized Design (CRD) with a 3x2 factorial arrangement in
which there were three water management regimes and two varieties of tomatoes. The two tomato varieties used
were Roma V. F. and Ibadan Local, under different water management regimes such as alternate wetting and drying
(AWD), continuous drying (CD) and continuous flooding (CF). The agronomic parameters were plant height,
number of leaves and leaf area which were monitored on a regular basis. The results showed that there was
significant difference under the different water regimes; growth was best observed under alternate wetting and
drying compared to continuous flooding and continuous drying. The mean plant height under different water
regimes were AWD (29.68cm), CF (21.99cm) and CD (21.92cm). The mean leaf area of the crop was AWD
(25.54cm2), CF (16.45cm
2) and CD (19.27cm
2) while the mean number of leaves of the crops were AWD (36). CF
(27), and CD (25). Tomatoes in AWD moisture availability yielded highest fruit yield of 17.90 kg/ha followed
closely are those under CF with 16.60 kg/ha while the least yield of 14.10 kg/ha was obtained under CD. The
research confirmed that alternate wetting and drying (AWD) favours plant height, leaf area and number of leaf more
than continuous flooding (CF) and continuous drying (CD). Alternate Wetting and Drying is a very good water
management option for the production of Ibadan Local in this environment.
Keywords: Water management regimes, Tomatoes, South West, Nigeria
1. Introduction
Water is an important component of life and is required for all the various biochemical and
physiological processes involved in plant growth and development. Adequate moisture availability is
necessary for optimum leaf development, maintenance of leaf greenness, assimilate production and
partitioning as well as total dry matter yield. Water stress has adverse or deleterious effects on crops; the
1 Corresponding author. Email addresses: [email protected] (M.A. Adekunle), [email protected] (E.A.
Olayiwola), [email protected] (R. Akinola)
62
impact however depends on the severity of the water shortage and the developmental stage of the crop
under stress (Chaves et al., 2002; Jaleel et al., 2008). Water stress has been reported to affect the
meristematic processes during the initial phase of plant growth and establishment which, consequently,
impaired plant growth, as a result of reduction in cell turgidity required for mitotic cell division,
elongation and enlargement (Anjum et al., 2003; Bhatt and Srinivasa Rao, 2005; Jaleel et al., 2008).
Studies are needed to increase the efficiency in the use of available water through appropriate water
management options such as regulated irrigation which is one among many practices that is fast gaining
ground, and appears a very promising option to achieving the goal of more crops per drop of water if
properly adopted (Oiganji et al., 2010). Variations exist on the effects of water regime on crops which
imply that the effects of water regime on a crop vary with location which may be due to climate of the
location and in turn dictates the evaporative demand of the crop (Postel, 2000, Oiganji et al., 2010).
Tomato is one of the most important vegetable crops grown all over Nigeria. It is the world’s largest
vegetable crop after potato and sweet potato but it tops the list of canned vegetables. In Nigeria, tomato is
regarded as the most important vegetable after onions and pepper (Fawusi, 1978). It is an important
condiment in most diets and a very cheap source of vitamins. It also contains a large quantity of water
(%), calcium (%) and Niacin all of which are of great importance in the metabolic activities of man.
Tomato is a good source of vitamins A, C and E and minerals that are very good for body and protect the
body against diseases (Taylor, 1987).
In view of the growing interest in irrigating with different water regime, a practice to improve water
productivity, hence the present study sort to assess the effect of water management regimes on the growth
of tomatoes in south west Nigeria.
2. Materials and Methods
Experimental site
The experiment was conducted in a screen house at Federal University of Agriculture, Abeokuta
(FUNAAB) behind College of Environmental Resources Management (COLERM), located between
Latitude 7º 2
¹ 23
¹¹ N and Longitude 3
º 4
¹ 03
¹¹ E. The study area is characterized by a tropical climate with
distinct wet and dry seasons. The wet season is associated relatively with the prevalence of the moist
maritime southerly monsoon from Atlantic Ocean and the dry season by the continental North Easterly
harmattan winds from the Sahara Desert. The area is located within a region characterized by bimodal
rainfall pattern (April to July being the wettest months, followed by August to October). The annual
rainfall ranges between 1400 and 1500mm in Abeokuta ant its environs. Isolated and scanty rains usually
start in mid-March and steadily increase to reach the peak values in July followed by a short break in
August. The dry season is normally from October to March and often characterized by hot days.
Experimental Procedure
Two Tomato varieties (Roma VF and Ibadan Local) were obtained from National Horticultural
Research Institute (NIHORT), Ibadan. Top soil was collected from the FADAMA wetlands of the
university, and sieved to fine particle before filled into plastic pots. Eighteen (18) plastic pots were used,
they were pierced at the bottom before use to enable free drainage of water. 3kg of sieved soils were
measured to into each plastic pot. The plastic pots containing soil was watered and left for a day. After
that seeds of two (2) tomato varieties (Roma VF and Ibadan Local) were planted in each plastic pot and
they were arranged in a Completely Randomized Design (CRD) with three replicates. Planting of the two
tomato varieties was done on 5th July, 2018. The experiment is 3x2 factors consisting of three water
management regimes and two varieties of tomatoes. The three water regimes are alternate wetting and
drying (AWD) (the plastic pots were alternately flooded and non-flooded for 7 days), continuous flooding
(CF), (the plastic pots were kept flooded throughout the crop growth period) and continuous drying (CD),
Continuous drying (watering was done once every week throughout the crop growth period) while the
two varieties used were Roma V. F. and Ibadan Local. Three weeks after planting the tomato plants were
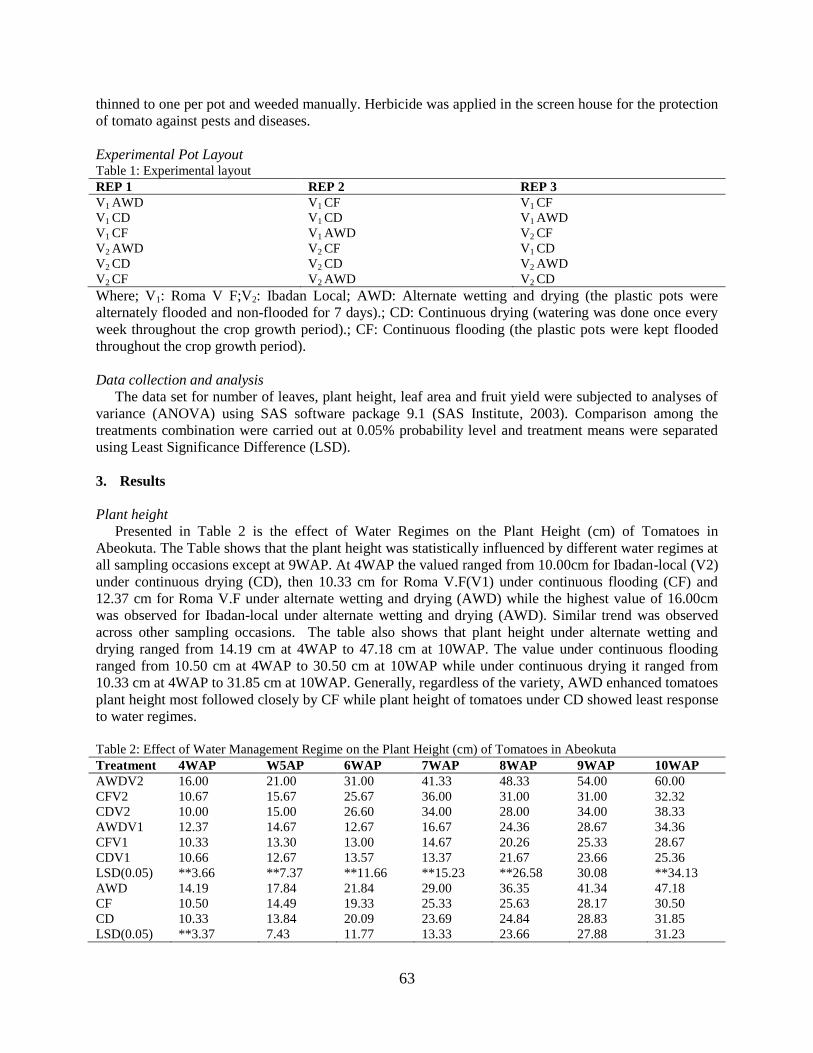
63
thinned to one per pot and weeded manually. Herbicide was applied in the screen house for the protection
of tomato against pests and diseases.
Experimental Pot Layout Table 1: Experimental layout
REP 1 REP 2 REP 3
V1 AWD V1 CF V1 CF
V1 CD V1 CD V1 AWD
V1 CF V1 AWD V2 CF
V2 AWD V2 CF V1 CD
V2 CD V2 CD V2 AWD
V2 CF V2 AWD V2 CD
Where; V1: Roma V F;V2: Ibadan Local; AWD: Alternate wetting and drying (the plastic pots were
alternately flooded and non-flooded for 7 days).; CD: Continuous drying (watering was done once every
week throughout the crop growth period).; CF: Continuous flooding (the plastic pots were kept flooded
throughout the crop growth period).
Data collection and analysis
The data set for number of leaves, plant height, leaf area and fruit yield were subjected to analyses of
variance (ANOVA) using SAS software package 9.1 (SAS Institute, 2003). Comparison among the
treatments combination were carried out at 0.05% probability level and treatment means were separated
using Least Significance Difference (LSD).
3. Results
Plant height
Presented in Table 2 is the effect of Water Regimes on the Plant Height (cm) of Tomatoes in
Abeokuta. The Table shows that the plant height was statistically influenced by different water regimes at
all sampling occasions except at 9WAP. At 4WAP the valued ranged from 10.00cm for Ibadan-local (V2)
under continuous drying (CD), then 10.33 cm for Roma V.F(V1) under continuous flooding (CF) and
12.37 cm for Roma V.F under alternate wetting and drying (AWD) while the highest value of 16.00cm
was observed for Ibadan-local under alternate wetting and drying (AWD). Similar trend was observed
across other sampling occasions. The table also shows that plant height under alternate wetting and
drying ranged from 14.19 cm at 4WAP to 47.18 cm at 10WAP. The value under continuous flooding
ranged from 10.50 cm at 4WAP to 30.50 cm at 10WAP while under continuous drying it ranged from
10.33 cm at 4WAP to 31.85 cm at 10WAP. Generally, regardless of the variety, AWD enhanced tomatoes
plant height most followed closely by CF while plant height of tomatoes under CD showed least response
to water regimes.
Table 2: Effect of Water Management Regime on the Plant Height (cm) of Tomatoes in Abeokuta
Treatment 4WAP W5AP 6WAP 7WAP 8WAP 9WAP 10WAP
AWDV2 16.00 21.00 31.00 41.33 48.33 54.00 60.00
CFV2 10.67 15.67 25.67 36.00 31.00 31.00 32.32
CDV2 10.00 15.00 26.60 34.00 28.00 34.00 38.33
AWDV1 12.37 14.67 12.67 16.67 24.36 28.67 34.36
CFV1 10.33 13.30 13.00 14.67 20.26 25.33 28.67
CDV1 10.66 12.67 13.57 13.37 21.67 23.66 25.36
LSD(0.05) **3.66 **7.37 **11.66 **15.23 **26.58 30.08 **34.13
AWD 14.19 17.84 21.84 29.00 36.35 41.34 47.18
CF 10.50 14.49 19.33 25.33 25.63 28.17 30.50
CD 10.33 13.84 20.09 23.69 24.84 28.83 31.85
LSD(0.05) **3.37 7.43 11.77 13.33 23.66 27.88 31.23
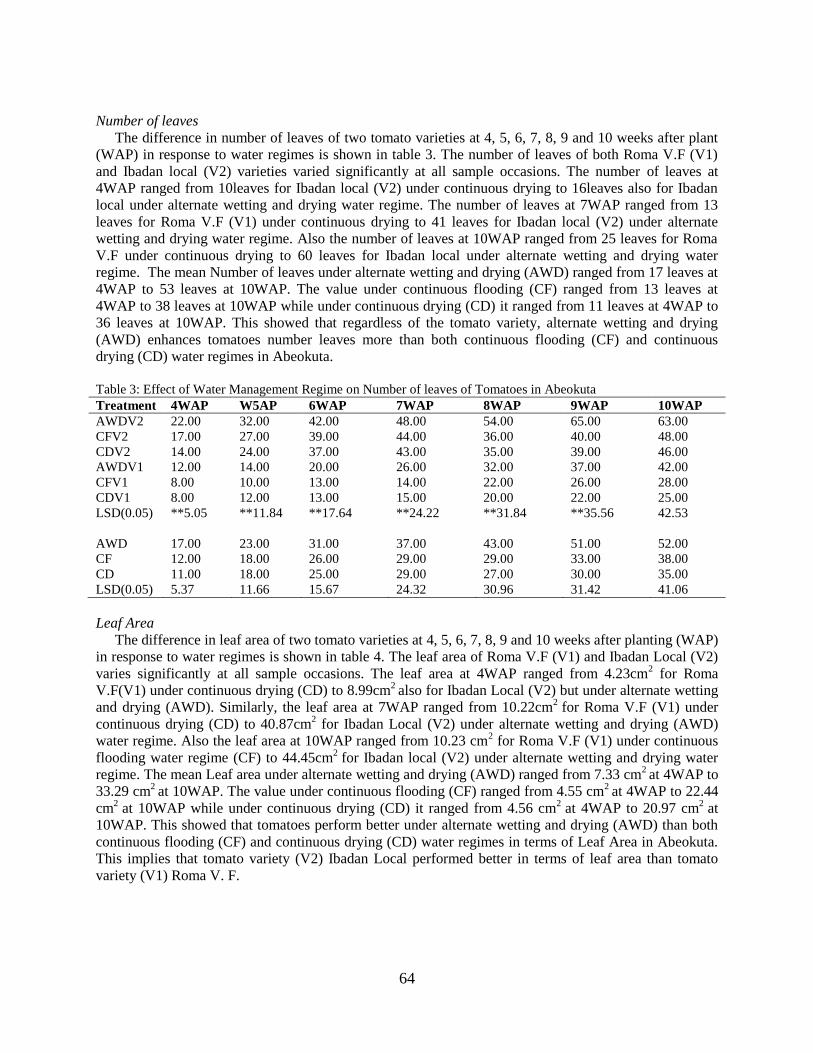
64
Number of leaves
The difference in number of leaves of two tomato varieties at 4, 5, 6, 7, 8, 9 and 10 weeks after plant
(WAP) in response to water regimes is shown in table 3. The number of leaves of both Roma V.F (V1)
and Ibadan local (V2) varieties varied significantly at all sample occasions. The number of leaves at
4WAP ranged from 10leaves for Ibadan local (V2) under continuous drying to 16leaves also for Ibadan
local under alternate wetting and drying water regime. The number of leaves at 7WAP ranged from 13
leaves for Roma V.F (V1) under continuous drying to 41 leaves for Ibadan local (V2) under alternate
wetting and drying water regime. Also the number of leaves at 10WAP ranged from 25 leaves for Roma
V.F under continuous drying to 60 leaves for Ibadan local under alternate wetting and drying water
regime. The mean Number of leaves under alternate wetting and drying (AWD) ranged from 17 leaves at
4WAP to 53 leaves at 10WAP. The value under continuous flooding (CF) ranged from 13 leaves at
4WAP to 38 leaves at 10WAP while under continuous drying (CD) it ranged from 11 leaves at 4WAP to
36 leaves at 10WAP. This showed that regardless of the tomato variety, alternate wetting and drying
(AWD) enhances tomatoes number leaves more than both continuous flooding (CF) and continuous
drying (CD) water regimes in Abeokuta.
Table 3: Effect of Water Management Regime on Number of leaves of Tomatoes in Abeokuta
Treatment 4WAP W5AP 6WAP 7WAP 8WAP 9WAP 10WAP
AWDV2 22.00 32.00 42.00 48.00 54.00 65.00 63.00
CFV2 17.00 27.00 39.00 44.00 36.00 40.00 48.00
CDV2 14.00 24.00 37.00 43.00 35.00 39.00 46.00
AWDV1 12.00 14.00 20.00 26.00 32.00 37.00 42.00
CFV1 8.00 10.00 13.00 14.00 22.00 26.00 28.00
CDV1 8.00 12.00 13.00 15.00 20.00 22.00 25.00
LSD(0.05) **5.05 **11.84 **17.64 **24.22 **31.84 **35.56 42.53
AWD 17.00 23.00 31.00 37.00 43.00 51.00 52.00
CF 12.00 18.00 26.00 29.00 29.00 33.00 38.00
CD 11.00 18.00 25.00 29.00 27.00 30.00 35.00
LSD(0.05) 5.37 11.66 15.67 24.32 30.96 31.42 41.06
Leaf Area
The difference in leaf area of two tomato varieties at 4, 5, 6, 7, 8, 9 and 10 weeks after planting (WAP)
in response to water regimes is shown in table 4. The leaf area of Roma V.F (V1) and Ibadan Local (V2)
varies significantly at all sample occasions. The leaf area at 4WAP ranged from 4.23cm2 for Roma
V.F(V1) under continuous drying (CD) to 8.99cm2 also for Ibadan Local (V2) but under alternate wetting
and drying (AWD). Similarly, the leaf area at 7WAP ranged from 10.22cm2
for Roma V.F (V1) under
continuous drying (CD) to 40.87cm2 for Ibadan Local (V2) under alternate wetting and drying (AWD)
water regime. Also the leaf area at 10WAP ranged from 10.23 cm2 for Roma V.F (V1) under continuous
flooding water regime (CF) to 44.45cm2
for Ibadan local (V2) under alternate wetting and drying water
regime. The mean Leaf area under alternate wetting and drying (AWD) ranged from 7.33 cm2 at 4WAP to
33.29 cm2 at 10WAP. The value under continuous flooding (CF) ranged from 4.55 cm
2 at 4WAP to 22.44
cm2
at 10WAP while under continuous drying (CD) it ranged from 4.56 cm2
at 4WAP to 20.97 cm2
at
10WAP. This showed that tomatoes perform better under alternate wetting and drying (AWD) than both
continuous flooding (CF) and continuous drying (CD) water regimes in terms of Leaf Area in Abeokuta.
This implies that tomato variety (V2) Ibadan Local performed better in terms of leaf area than tomato
variety (V1) Roma V. F.
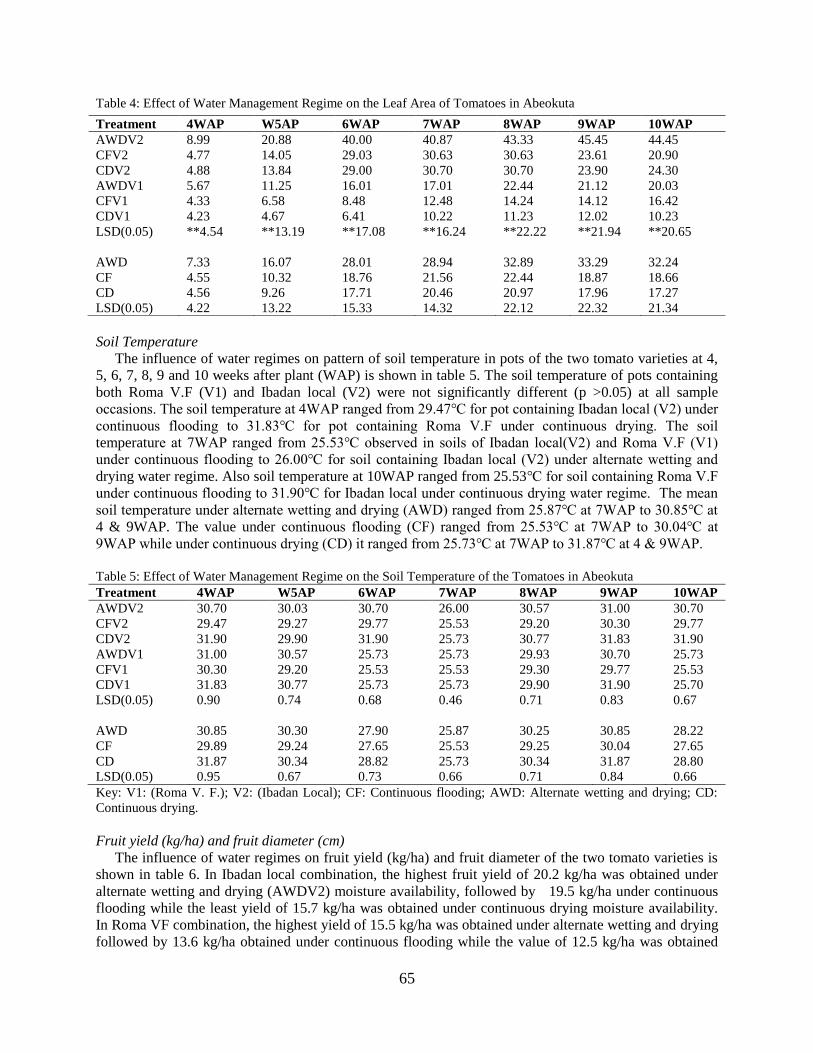
65
Table 4: Effect of Water Management Regime on the Leaf Area of Tomatoes in Abeokuta
Soil Temperature
The influence of water regimes on pattern of soil temperature in pots of the two tomato varieties at 4,
5, 6, 7, 8, 9 and 10 weeks after plant (WAP) is shown in table 5. The soil temperature of pots containing
both Roma V.F (V1) and Ibadan local (V2) were not significantly different (p >0.05) at all sample
occasions. The soil temperature at 4WAP ranged from 29.47℃ for pot containing Ibadan local (V2) under
continuous flooding to 31.83℃ for pot containing Roma V.F under continuous drying. The soil
temperature at 7WAP ranged from 25.53℃ observed in soils of Ibadan local(V2) and Roma V.F (V1)
under continuous flooding to 26.00℃ for soil containing Ibadan local (V2) under alternate wetting and
drying water regime. Also soil temperature at 10WAP ranged from 25.53℃ for soil containing Roma V.F
under continuous flooding to 31.90℃ for Ibadan local under continuous drying water regime. The mean
soil temperature under alternate wetting and drying (AWD) ranged from 25.87℃ at 7WAP to 30.85℃ at
4 & 9WAP. The value under continuous flooding (CF) ranged from 25.53℃ at 7WAP to 30.04℃ at
9WAP while under continuous drying (CD) it ranged from 25.73℃ at 7WAP to 31.87℃ at 4 & 9WAP.
Table 5: Effect of Water Management Regime on the Soil Temperature of the Tomatoes in Abeokuta
Treatment 4WAP W5AP 6WAP 7WAP 8WAP 9WAP 10WAP
AWDV2 30.70 30.03 30.70 26.00 30.57 31.00 30.70
CFV2 29.47 29.27 29.77 25.53 29.20 30.30 29.77
CDV2 31.90 29.90 31.90 25.73 30.77 31.83 31.90
AWDV1 31.00 30.57 25.73 25.73 29.93 30.70 25.73
CFV1 30.30 29.20 25.53 25.53 29.30 29.77 25.53
CDV1 31.83 30.77 25.73 25.73 29.90 31.90 25.70
LSD(0.05) 0.90 0.74 0.68 0.46 0.71 0.83 0.67
AWD 30.85 30.30 27.90 25.87 30.25 30.85 28.22
CF 29.89 29.24 27.65 25.53 29.25 30.04 27.65
CD 31.87 30.34 28.82 25.73 30.34 31.87 28.80
LSD(0.05) 0.95 0.67 0.73 0.66 0.71 0.84 0.66
Key: V1: (Roma V. F.); V2: (Ibadan Local); CF: Continuous flooding; AWD: Alternate wetting and drying; CD:
Continuous drying.
Fruit yield (kg/ha) and fruit diameter (cm)
The influence of water regimes on fruit yield (kg/ha) and fruit diameter of the two tomato varieties is
shown in table 6. In Ibadan local combination, the highest fruit yield of 20.2 kg/ha was obtained under
alternate wetting and drying (AWDV2) moisture availability, followed by 19.5 kg/ha under continuous
flooding while the least yield of 15.7 kg/ha was obtained under continuous drying moisture availability.
In Roma VF combination, the highest yield of 15.5 kg/ha was obtained under alternate wetting and drying
followed by 13.6 kg/ha obtained under continuous flooding while the value of 12.5 kg/ha was obtained
Treatment 4WAP W5AP 6WAP 7WAP 8WAP 9WAP 10WAP
AWDV2 8.99 20.88 40.00 40.87 43.33 45.45 44.45
CFV2 4.77 14.05 29.03 30.63 30.63 23.61 20.90
CDV2 4.88 13.84 29.00 30.70 30.70 23.90 24.30
AWDV1 5.67 11.25 16.01 17.01 22.44 21.12 20.03
CFV1 4.33 6.58 8.48 12.48 14.24 14.12 16.42
CDV1 4.23 4.67 6.41 10.22 11.23 12.02 10.23
LSD(0.05) **4.54 **13.19 **17.08 **16.24 **22.22 **21.94 **20.65
AWD 7.33 16.07 28.01 28.94 32.89 33.29 32.24
CF 4.55 10.32 18.76 21.56 22.44 18.87 18.66
CD 4.56 9.26 17.71 20.46 20.97 17.96 17.27
LSD(0.05) 4.22 13.22 15.33 14.32 22.12 22.32 21.34
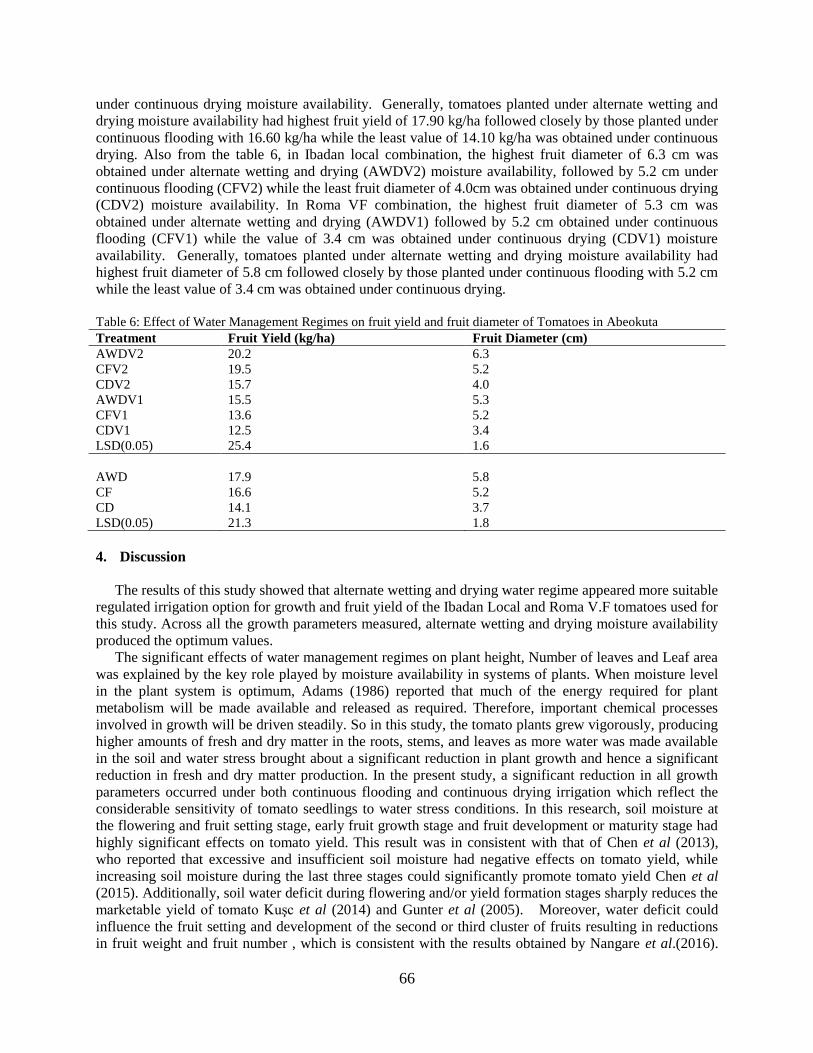
66
under continuous drying moisture availability. Generally, tomatoes planted under alternate wetting and
drying moisture availability had highest fruit yield of 17.90 kg/ha followed closely by those planted under
continuous flooding with 16.60 kg/ha while the least value of 14.10 kg/ha was obtained under continuous
drying. Also from the table 6, in Ibadan local combination, the highest fruit diameter of 6.3 cm was
obtained under alternate wetting and drying (AWDV2) moisture availability, followed by 5.2 cm under
continuous flooding (CFV2) while the least fruit diameter of 4.0cm was obtained under continuous drying
(CDV2) moisture availability. In Roma VF combination, the highest fruit diameter of 5.3 cm was
obtained under alternate wetting and drying (AWDV1) followed by 5.2 cm obtained under continuous
flooding (CFV1) while the value of 3.4 cm was obtained under continuous drying (CDV1) moisture
availability. Generally, tomatoes planted under alternate wetting and drying moisture availability had
highest fruit diameter of 5.8 cm followed closely by those planted under continuous flooding with 5.2 cm
while the least value of 3.4 cm was obtained under continuous drying.
Table 6: Effect of Water Management Regimes on fruit yield and fruit diameter of Tomatoes in Abeokuta
Treatment Fruit Yield (kg/ha) Fruit Diameter (cm)
AWDV2 20.2 6.3
CFV2 19.5 5.2
CDV2 15.7 4.0
AWDV1 15.5 5.3
CFV1 13.6 5.2
CDV1 12.5 3.4
LSD(0.05) 25.4 1.6
AWD 17.9 5.8
CF 16.6 5.2
CD 14.1 3.7
LSD(0.05) 21.3 1.8
4. Discussion
The results of this study showed that alternate wetting and drying water regime appeared more suitable
regulated irrigation option for growth and fruit yield of the Ibadan Local and Roma V.F tomatoes used for
this study. Across all the growth parameters measured, alternate wetting and drying moisture availability
produced the optimum values.
The significant effects of water management regimes on plant height, Number of leaves and Leaf area
was explained by the key role played by moisture availability in systems of plants. When moisture level
in the plant system is optimum, Adams (1986) reported that much of the energy required for plant
metabolism will be made available and released as required. Therefore, important chemical processes
involved in growth will be driven steadily. So in this study, the tomato plants grew vigorously, producing
higher amounts of fresh and dry matter in the roots, stems, and leaves as more water was made available
in the soil and water stress brought about a significant reduction in plant growth and hence a significant
reduction in fresh and dry matter production. In the present study, a significant reduction in all growth
parameters occurred under both continuous flooding and continuous drying irrigation which reflect the
considerable sensitivity of tomato seedlings to water stress conditions. In this research, soil moisture at
the flowering and fruit setting stage, early fruit growth stage and fruit development or maturity stage had
highly significant effects on tomato yield. This result was in consistent with that of Chen et al (2013),
who reported that excessive and insufficient soil moisture had negative effects on tomato yield, while
increasing soil moisture during the last three stages could significantly promote tomato yield Chen et al
(2015). Additionally, soil water deficit during flowering and/or yield formation stages sharply reduces the
marketable yield of tomato Kuşc et al (2014) and Gunter et al (2005). Moreover, water deficit could
influence the fruit setting and development of the second or third cluster of fruits resulting in reductions
in fruit weight and fruit number , which is consistent with the results obtained by Nangare et al.(2016).
67
Furthermore, sufficient water supply at these two stages is crucial to meet the demand of water for high-
intensity. Evapotranspiration induced by high temperatures and flourishing leaf area, and vital for
enlargement of fruit cells and metabolism of fruit nutritional substances; therefore, single fruit weight
increased in treatments with sufficient water supply compared with those exposed under soil moisture
deficit.
5. Conclusion
In conclusion, the result showed that water management regimes have major impacts on tomato
varieties. The research also confirmed that under different water management regimes, alternate wetting
and drying (AWD) favours plant height, number of leaves and leaves area more than continuous flooding
(CF) and continuous drying (CD. Regardless of water management option, Ibadan Local (V2) shows
more productivity or better performance in terms of plant height, number of leaves and leaf area more
than Roma V. F. (V1). Alternate Wetting and Drying is a very good water management option for the
production of Ibadan Local in this environment, the savannah-forest transition zone of south west Nigeria
References
Adams, P., 1986. Mineral Nutrition. In: The Tomato Crop, Atherton, J.G. and J. Rudich (Eds.). Chapman and Hall
Publishes, New York, pp: 281-324.
Anjum, F., Yaseen, M., Rasul, E., Wahid, A. & Anjum, S. 2003. Water stress in barley (Hordeumvulgare L.). I.
Effect on morphological characters. Pakistan J. Agric. Sci., 40: 43-44.
Bhatt, R.M. & Srinivasa, Rao N.K. 2005. Influence of pod load response of okra to water stress. Indian J. Plant
Physiol, 10: 54-59
Chaves, M.M., Pereira, J.S., Maroco, J., Rodriques, M.L., Ricardo, C.P.P., Osório, M.L., Carvalho, I., Faria, T. &
Pinheiro, C. 2002. How plants cope with water stress in the field photosynthesis and growth. Ann. Bot., 89:
907-916
Chen J.L., Kang S.Z., Du T.S., Qiu R.J., Guo P., Chen R.Q., 2013. Quantitative response of greenhouse tomato yield
and quality to water deficit at different growth stages. Agric. Water Manag. 129, 152–162.
Chen S, Zhou Z J, Andersen, M N, Hu T T. (2015) Tomato yield and water use efficiency—coupling effects
between growth stage specific soil water deficits. Acta Agriculturae Sciendinavica, Section BSoil & Plant
Science, 65(5): 460–469
Fawusi M.O.A. 1978. Emergence and seedling growth of Pepper as influenced by soil compaction nutrient status
and moisture regime.Soc. Hortic., 9: 329-335.
Gunter C C, Francis D. (2005) Effect of Supplemental Potassium on Yield and Quality of Processing Tomato.
Hortscience, 216, 1073.
Jaleel, C.A., R. Gopi, B. Sankar, M. Gomathinayagam and R.Panneerselvam, 2008. Differential responses in water
use efficiency in two varieties of Catharanthus roseus under drought stress. Comp.Rend. Biol., 331: 42–47
Jensen, R., Battilani, A., Plauborg, F., Psarras, G., Chartzoulakis, K., Janowiak, F., Stikic, R., Jovanovic, Z., Li, G.,
Qi, X., Lui, F., Jacobsen, S., Andersen, M. 2010. Deficit irrigation based on drought tolerance and root
signalling in potatoes and tomatoes. Agricultural Water Management, v.98, p.403-413.
Kuşc¸u H, Turhan A, Demir A O. (2014) The response of processing tomato to deficit irrigation at various
phenological stages in a sub-humid environment. Agricultural Water Management 133: 92–103.
Monte, J., de Carvalho, D., Medic, L., da Silva, L., Pimentel, C. 2013. Growth analysis and yield of tomato crop
under different irrigation depths. Engineering Agriculture Ambiental, v,17 p.926-931
Nangare D D, Singh Y, Kumar P S, Minhas P S. (2016) Growth, fruit yield and quality of tomato (Lycopersicon
esculentum Mill.) as affected by deficit irrigation regulated on phenological basis. Agricultural Water
Management 171: 73–79.
Oiganji, E.; A.A Ramalan; H.E Igbadun . 2010. Yields and Soil Water Balance of Onion Under Mulch and Deficit
Irrigation: Unpublished MSC Department of Agricultural Engineering, Ahmadu Bello University Zaria.
Postel, S. 2000. Entering an Era of Water Scarcity: The Challenges Ahead. Ecology. Appl.
SAS Institute.2003. SAS for Windows. V.9.1 SAS Institute. Cary, NC
Taylor J.H 1987. Text of lectures delivered at the national workshop on fruit and vegetable seedlings production
held at NIHORT 9-13
68
Available online at www.asric.org
ASRIC Journal on Water, Energy and Environment 1 (2020) 68-81
a Department of Agronomy, Faculty of Agriculture and Forestry, Cross River University of Technology,
Obubra Campus, Nigeria b Department of Soil Science, Faculty of Agriculture, University of Abuja, Abuja Nigeria
Received 19 December 2019; revised 30 January 2020; accepted 30 January 2020
Abstract
Meteorological factors that mostly influence food production of any Nation are rainfall and temperature. Their
extremes are significant and observable indices of evidences of negative climate change scenarios and adequate
knowledge of extreme events will help in policy making to save the nation of future losses due to their extremes.
With the advent of climate change, rainfall and temperature patterns are potential threats to achieving the SDG’s of
zero hunger and poverty eradication, coupled with the ever growing world population and development.
This paper x-rays rainfall and temperature regimes of Northern Nigeria over a 47 years period and its trend
within 13 states as it has affected farming activities and caused massive migration of herders to more favourable and
conducive areas that usually lead to incessant herder- farmer’s crisis in Nigeria.
Keywords: Climate change extreme events, Rainfall and temperature.
1. Introduction
Climate change impact on flora is receiving increasing attention around the world (Fuhrer, 2003).
Climate change projections may result in reductions of average annual discharge (productivity) of up to
50%, which poses a great challenge to the whole socio-economic model that is based largely on water
demanding activities: recreation, tourism and food production (Iglesias and Garrote, 2015). Rainfall and
temperature are two very important climatic variables that determine the nature of any environment
whether for crop production or human habitation and these are the defining variables for classifying any
area as either temperate or tropical. They are also the two most important climatic variables directly
affecting the growth and yield of plant and crop for both man and animal consumption and their high
variability is a great threat to food security of any nation and the world in general.
The world around us is changing; there is growing awareness of the state of the environment, and
concern due to the over-exploitation of natural resources by mankind. Reduction of water and food
resources combined with population growth can lead to hunger and poverty.
1 Corresponding author. +2348069275007 Email addresses: [email protected] (E.E. Tangban)
69
The expected changes in temperature over the next 30−50 years are predicted to be in the range of
2−3 °C (IPCC) (2007). Heat waves or extreme temperature conditions are projected to become more
intense, more frequent, and would last longer than what has been currently observed in recent years
(Meehl et al., 2007). Extreme temperature conditions may have short-term durations of a few days with
temperature increases of over 5 °C above the normal temperatures. Extreme events occurring during the
dry season would have the most dramatic impact on plant productivity; however, there has been little
research conducted to document these effects as found by (Kumudini et al. 2014). Rate of plant
growth and development is dependent upon the temperature surrounding the plant and each species has a
specific temperature range represented by a minimum, maximum, and optimum. These values were
summarized by Hatfield et al., 2008, Hatfield et al., (2011) for a number of crop species typically for
grain and fruit production. A recent review by Barlow et al. (2015) on the effect of temperature extremes,
frost and heat, in wheat (Triticum aestivum L.) production revealed that frost caused sterility and abortion
of formed grains while excessive heat caused reduction in grain number and duration of the grain-filling
period.
While Rainfall is usually seen as beneficial to crops and fields, but there is an “ideal” amount of
rainfall in any given growing season for most crops. If the average rainfall is much lower or higher than
the ideal, it can lead to significant problems, from drowned crops to lower yields which would militate
against the actualisation of the SDG of zero hunger in 2030. (sigfox.com, 2018). Rainfall seasonal
variability greatly affects soil water availability to crops, and thus poses crop production and food security
risks.
Increase in one of these two variables causes the other to decrease and they are all much needed for
optimum growth and yield of food crops. Their extremes are detrimental to growth of plant for food
production. While very low temperatures would prevent seed germination, excessively high temperature
will also scorch young plants and prolonged high temperatures causes’ rapid loss of soil moisture which
poses threat of soil aridity and desert encroachment resulting to immigration of herders to areas with
lower temperatures and higher rainfall that can sustain the growth of grasses and plants for their animals
all year round hence leading to continuous herders-farmers clashes during such periods and conditions
and hence threatening food production in this areas .
Meehl et al. (2007) in their analysis revealed that daily minimum temperatures will increase more
rapidly than daily maximum temperatures leading to the increase in the daily mean temperatures and a
greater likelihood of extreme events and these changes could have detrimental effects on food production.
If these changes in temperature and rainfall are expected to occur over the next 30 years then
understanding their trends will help in planning and developing adaptation strategies to offset the impacts
that may be caused by their variability and changes anticipated. Hence the objective of this paper is to x-
ray rainfall and temperature regimes of Northern Nigeria over a period of 40 years.
2. Methods/Techniques
2.1 Geo-Informatics
A geographic information system (GIS) is a methodology for handling all geographic and geo-
referenced data. Its application allows for large scale analyses of the Earth's surface and at the same time,
provides increasingly detailed knowledge on many planetary variables and improved understanding of its
functioning (CREAF, 2016).
The mean rainfall result obtained from the assessment were interpolated in a GIS environment (QGIS
2.18.24) to delineate, classify and produce the rainfall and temperature maps of Northern Nigeria (Fig. 1).
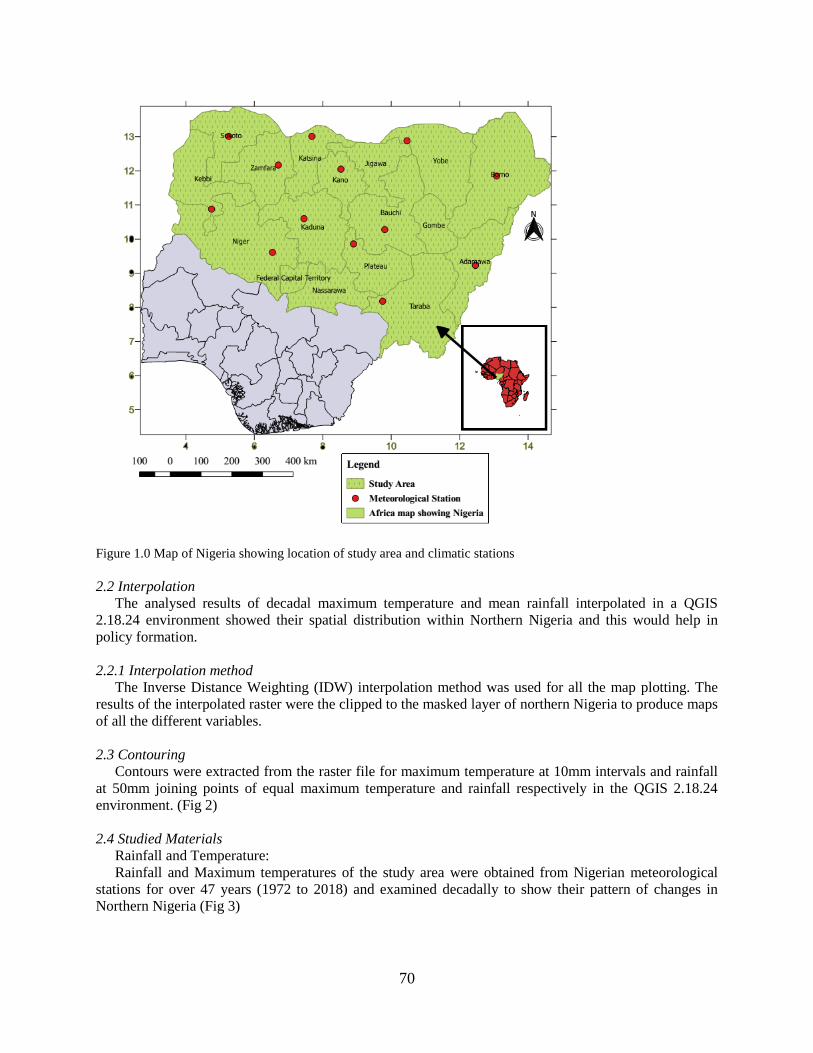
70
Figure 1.0 Map of Nigeria showing location of study area and climatic stations
2.2 Interpolation
The analysed results of decadal maximum temperature and mean rainfall interpolated in a QGIS
2.18.24 environment showed their spatial distribution within Northern Nigeria and this would help in
policy formation.
2.2.1 Interpolation method
The Inverse Distance Weighting (IDW) interpolation method was used for all the map plotting. The
results of the interpolated raster were the clipped to the masked layer of northern Nigeria to produce maps
of all the different variables.
2.3 Contouring
Contours were extracted from the raster file for maximum temperature at 10mm intervals and rainfall
at 50mm joining points of equal maximum temperature and rainfall respectively in the QGIS 2.18.24
environment. (Fig 2)
2.4 Studied Materials
Rainfall and Temperature:
Rainfall and Maximum temperatures of the study area were obtained from Nigerian meteorological
stations for over 47 years (1972 to 2018) and examined decadally to show their pattern of changes in
Northern Nigeria (Fig 3)
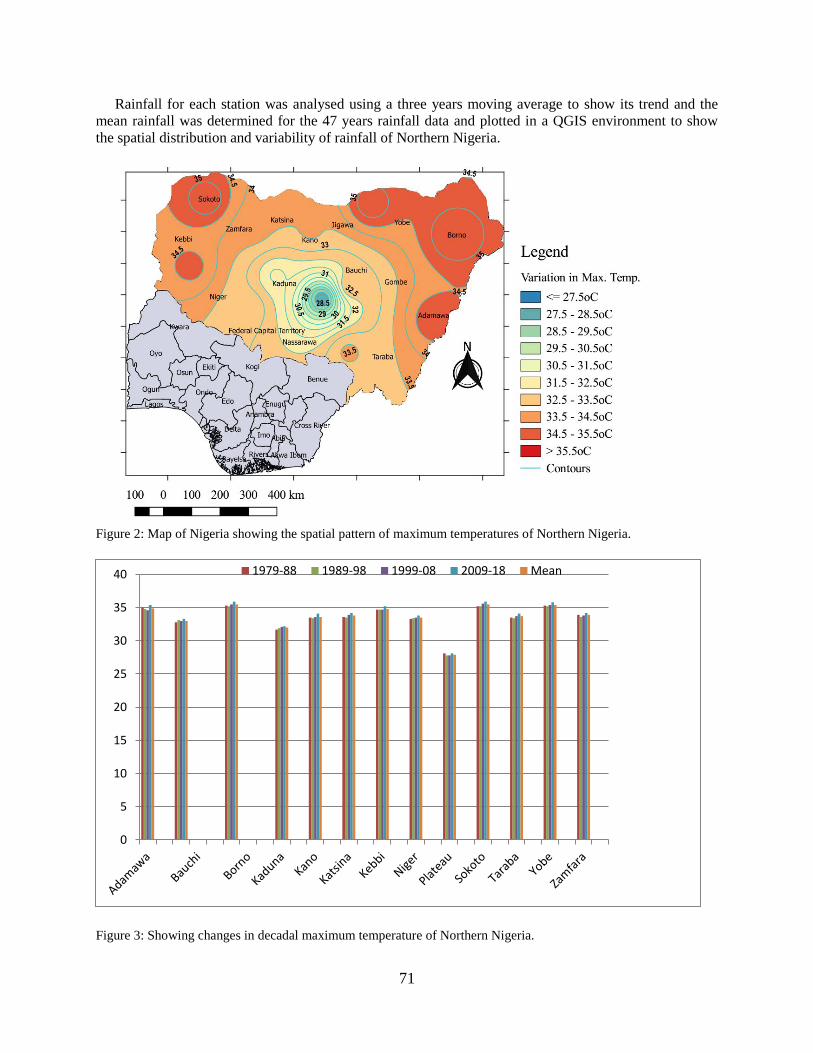
71
Rainfall for each station was analysed using a three years moving average to show its trend and the
mean rainfall was determined for the 47 years rainfall data and plotted in a QGIS environment to show
the spatial distribution and variability of rainfall of Northern Nigeria.
Figure 2: Map of Nigeria showing the spatial pattern of maximum temperatures of Northern Nigeria.
Figure 3: Showing changes in decadal maximum temperature of Northern Nigeria.
0
5
10
15
20
25
30
35
40 1979-88 1989-98 1999-08 2009-18 Mean
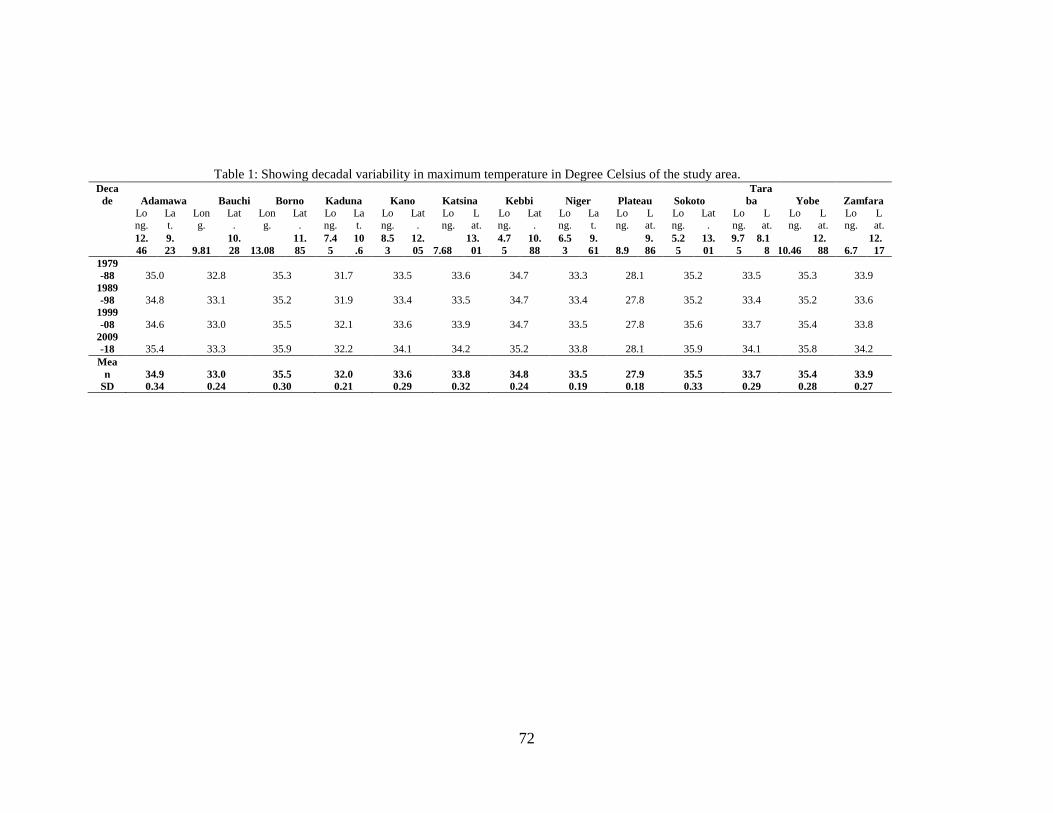
72
Table 1: Showing decadal variability in maximum temperature in Degree Celsius of the study area. Deca
de Adamawa Bauchi Borno Kaduna Kano Katsina Kebbi Niger Plateau Sokoto
Tara
ba Yobe Zamfara
Long.
Lat.
Long.
Lat.
Long.
Lat.
Long.
Lat.
Long.
Lat.
Long.
Lat.
Long.
Lat.
Long.
Lat.
Long.
Lat.
Long.
Lat.
Long.
Lat.
Long.
Lat.
Long.
Lat.
12.
46
9.
23 9.81
10.
28 13.08
11.
85
7.4
5
10
.6
8.5
3
12.
05 7.68
13.
01
4.7
5
10.
88
6.5
3
9.
61 8.9
9.
86
5.2
5
13.
01
9.7
5
8.1
8 10.46
12.
88 6.7
12.
17
1979
-88 35.0 32.8 35.3 31.7 33.5 33.6 34.7 33.3 28.1 35.2 33.5 35.3 33.9
1989
-98 34.8 33.1 35.2 31.9 33.4 33.5 34.7 33.4 27.8 35.2 33.4 35.2 33.6
1999
-08 34.6 33.0 35.5 32.1 33.6 33.9 34.7 33.5 27.8 35.6 33.7 35.4 33.8
2009
-18 35.4 33.3 35.9 32.2 34.1 34.2 35.2 33.8 28.1 35.9 34.1 35.8 34.2
Mea
n 34.9 33.0 35.5 32.0 33.6 33.8 34.8 33.5 27.9 35.5 33.7 35.4 33.9
SD 0.34 0.24 0.30 0.21 0.29 0.32 0.24 0.19 0.18 0.33 0.29 0.28 0.27
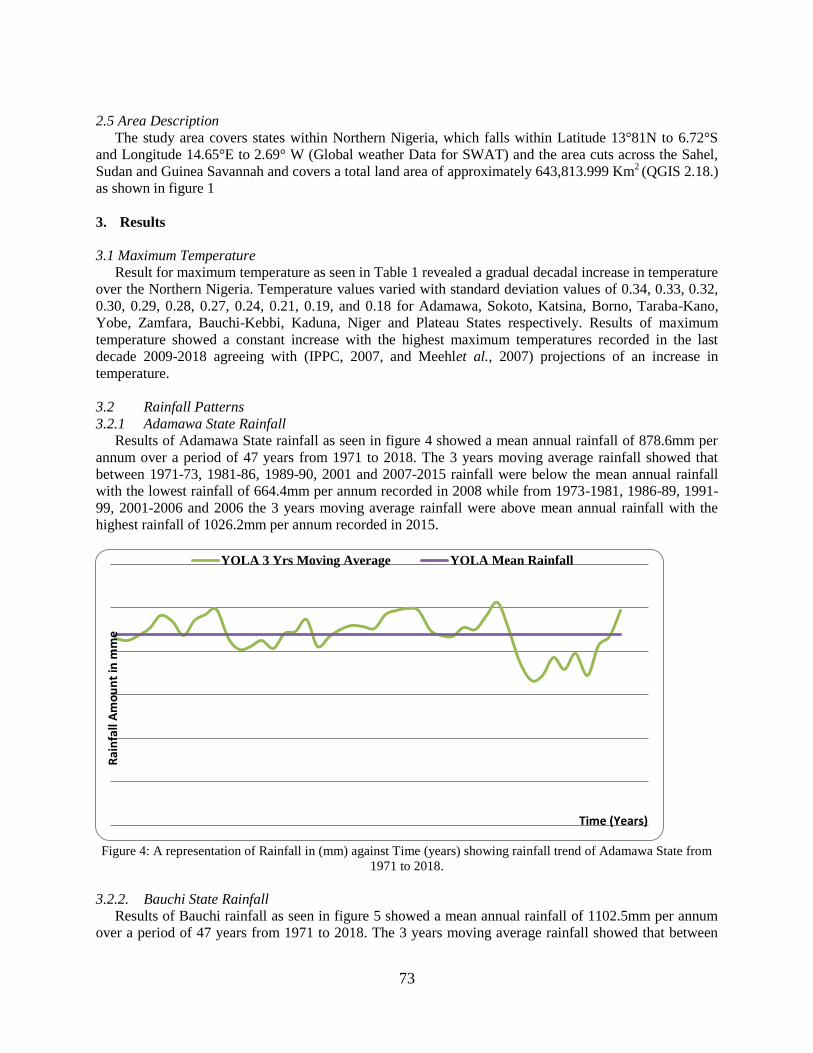
73
2.5 Area Description
The study area covers states within Northern Nigeria, which falls within Latitude 13°81N to 6.72°S
and Longitude 14.65°E to 2.69° W (Global weather Data for SWAT) and the area cuts across the Sahel,
Sudan and Guinea Savannah and covers a total land area of approximately 643,813.999 Km2 (QGIS 2.18.)
as shown in figure 1
3. Results
3.1 Maximum Temperature
Result for maximum temperature as seen in Table 1 revealed a gradual decadal increase in temperature
over the Northern Nigeria. Temperature values varied with standard deviation values of 0.34, 0.33, 0.32,
0.30, 0.29, 0.28, 0.27, 0.24, 0.21, 0.19, and 0.18 for Adamawa, Sokoto, Katsina, Borno, Taraba-Kano,
Yobe, Zamfara, Bauchi-Kebbi, Kaduna, Niger and Plateau States respectively. Results of maximum
temperature showed a constant increase with the highest maximum temperatures recorded in the last
decade 2009-2018 agreeing with (IPPC, 2007, and Meehlet al., 2007) projections of an increase in
temperature.
3.2 Rainfall Patterns
3.2.1 Adamawa State Rainfall
Results of Adamawa State rainfall as seen in figure 4 showed a mean annual rainfall of 878.6mm per
annum over a period of 47 years from 1971 to 2018. The 3 years moving average rainfall showed that
between 1971-73, 1981-86, 1989-90, 2001 and 2007-2015 rainfall were below the mean annual rainfall
with the lowest rainfall of 664.4mm per annum recorded in 2008 while from 1973-1981, 1986-89, 1991-
99, 2001-2006 and 2006 the 3 years moving average rainfall were above mean annual rainfall with the
highest rainfall of 1026.2mm per annum recorded in 2015.
Figure 4: A representation of Rainfall in (mm) against Time (years) showing rainfall trend of Adamawa State from
1971 to 2018.
3.2.2. Bauchi State Rainfall
Results of Bauchi rainfall as seen in figure 5 showed a mean annual rainfall of 1102.5mm per annum
over a period of 47 years from 1971 to 2018. The 3 years moving average rainfall showed that between
Rai
nfa
ll A
mo
un
t in
mm
e
Time (Years)
YOLA 3 Yrs Moving Average YOLA Mean Rainfall
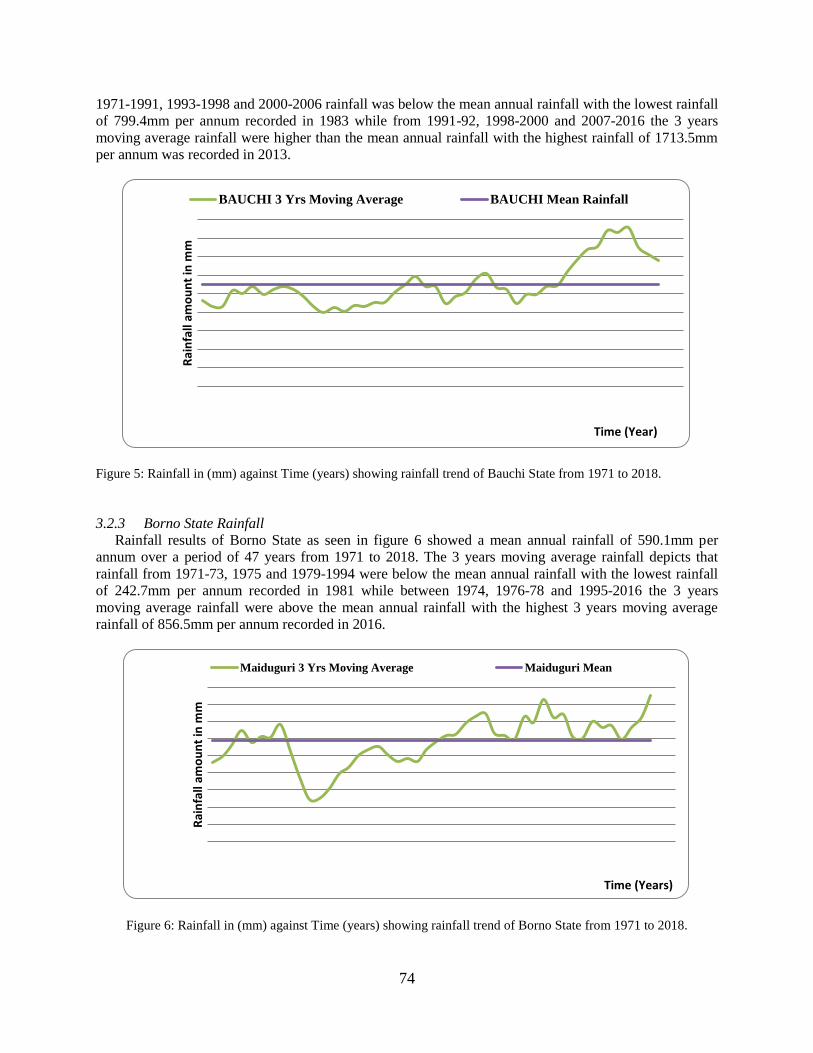
74
1971-1991, 1993-1998 and 2000-2006 rainfall was below the mean annual rainfall with the lowest rainfall
of 799.4mm per annum recorded in 1983 while from 1991-92, 1998-2000 and 2007-2016 the 3 years
moving average rainfall were higher than the mean annual rainfall with the highest rainfall of 1713.5mm
per annum was recorded in 2013.
Figure 5: Rainfall in (mm) against Time (years) showing rainfall trend of Bauchi State from 1971 to 2018.
3.2.3 Borno State Rainfall
Rainfall results of Borno State as seen in figure 6 showed a mean annual rainfall of 590.1mm per
annum over a period of 47 years from 1971 to 2018. The 3 years moving average rainfall depicts that
rainfall from 1971-73, 1975 and 1979-1994 were below the mean annual rainfall with the lowest rainfall
of 242.7mm per annum recorded in 1981 while between 1974, 1976-78 and 1995-2016 the 3 years
moving average rainfall were above the mean annual rainfall with the highest 3 years moving average
rainfall of 856.5mm per annum recorded in 2016.
Figure 6: Rainfall in (mm) against Time (years) showing rainfall trend of Borno State from 1971 to 2018.
Rai
nfa
ll am
ou
nt
in m
m
Time (Year)
BAUCHI 3 Yrs Moving Average BAUCHI Mean RainfallR
ain
fall
amo
un
t in
mm
Time (Years)
Maiduguri 3 Yrs Moving Average Maiduguri Mean
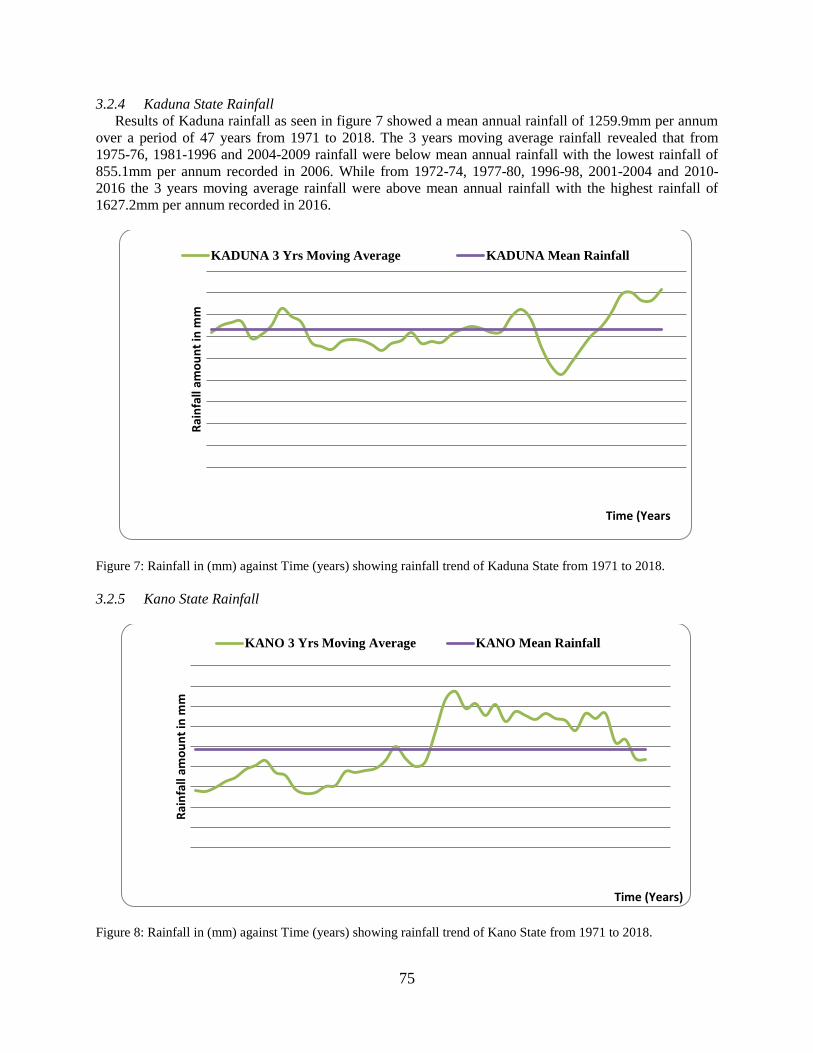
75
3.2.4 Kaduna State Rainfall
Results of Kaduna rainfall as seen in figure 7 showed a mean annual rainfall of 1259.9mm per annum
over a period of 47 years from 1971 to 2018. The 3 years moving average rainfall revealed that from
1975-76, 1981-1996 and 2004-2009 rainfall were below mean annual rainfall with the lowest rainfall of
855.1mm per annum recorded in 2006. While from 1972-74, 1977-80, 1996-98, 2001-2004 and 2010-
2016 the 3 years moving average rainfall were above mean annual rainfall with the highest rainfall of
1627.2mm per annum recorded in 2016.
Figure 7: Rainfall in (mm) against Time (years) showing rainfall trend of Kaduna State from 1971 to 2018.
3.2.5 Kano State Rainfall
Figure 8: Rainfall in (mm) against Time (years) showing rainfall trend of Kano State from 1971 to 2018.
Rai
nfa
ll am
ou
nt
in m
m
Time (Years
KADUNA 3 Yrs Moving Average KADUNA Mean Rainfall
Rai
nfa
ll am
ou
nt
in m
m
Time (Years)
KANO 3 Yrs Moving Average KANO Mean Rainfall
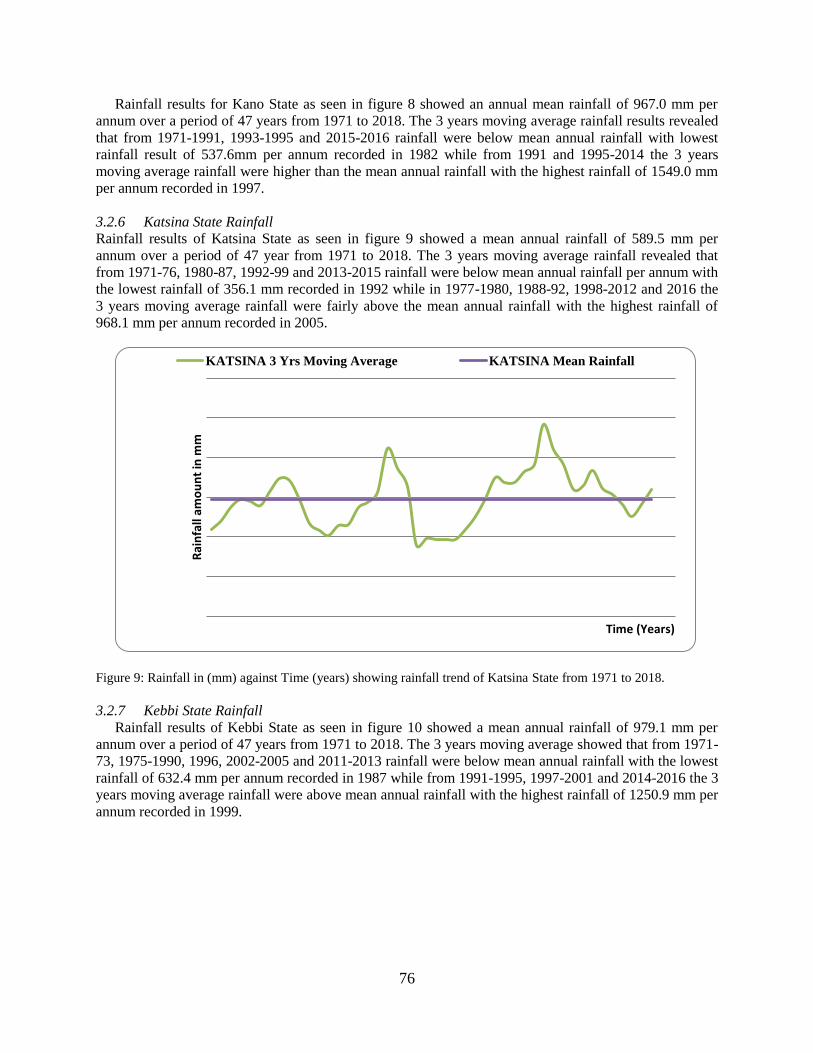
76
Rainfall results for Kano State as seen in figure 8 showed an annual mean rainfall of 967.0 mm per
annum over a period of 47 years from 1971 to 2018. The 3 years moving average rainfall results revealed
that from 1971-1991, 1993-1995 and 2015-2016 rainfall were below mean annual rainfall with lowest
rainfall result of 537.6mm per annum recorded in 1982 while from 1991 and 1995-2014 the 3 years
moving average rainfall were higher than the mean annual rainfall with the highest rainfall of 1549.0 mm
per annum recorded in 1997.
3.2.6 Katsina State Rainfall
Rainfall results of Katsina State as seen in figure 9 showed a mean annual rainfall of 589.5 mm per
annum over a period of 47 year from 1971 to 2018. The 3 years moving average rainfall revealed that
from 1971-76, 1980-87, 1992-99 and 2013-2015 rainfall were below mean annual rainfall per annum with
the lowest rainfall of 356.1 mm recorded in 1992 while in 1977-1980, 1988-92, 1998-2012 and 2016 the
3 years moving average rainfall were fairly above the mean annual rainfall with the highest rainfall of
968.1 mm per annum recorded in 2005.
Figure 9: Rainfall in (mm) against Time (years) showing rainfall trend of Katsina State from 1971 to 2018.
3.2.7 Kebbi State Rainfall
Rainfall results of Kebbi State as seen in figure 10 showed a mean annual rainfall of 979.1 mm per
annum over a period of 47 years from 1971 to 2018. The 3 years moving average showed that from 1971-
73, 1975-1990, 1996, 2002-2005 and 2011-2013 rainfall were below mean annual rainfall with the lowest
rainfall of 632.4 mm per annum recorded in 1987 while from 1991-1995, 1997-2001 and 2014-2016 the 3
years moving average rainfall were above mean annual rainfall with the highest rainfall of 1250.9 mm per
annum recorded in 1999.
Rai
nfa
ll am
ou
nt
in m
m
Time (Years)
KATSINA 3 Yrs Moving Average KATSINA Mean Rainfall
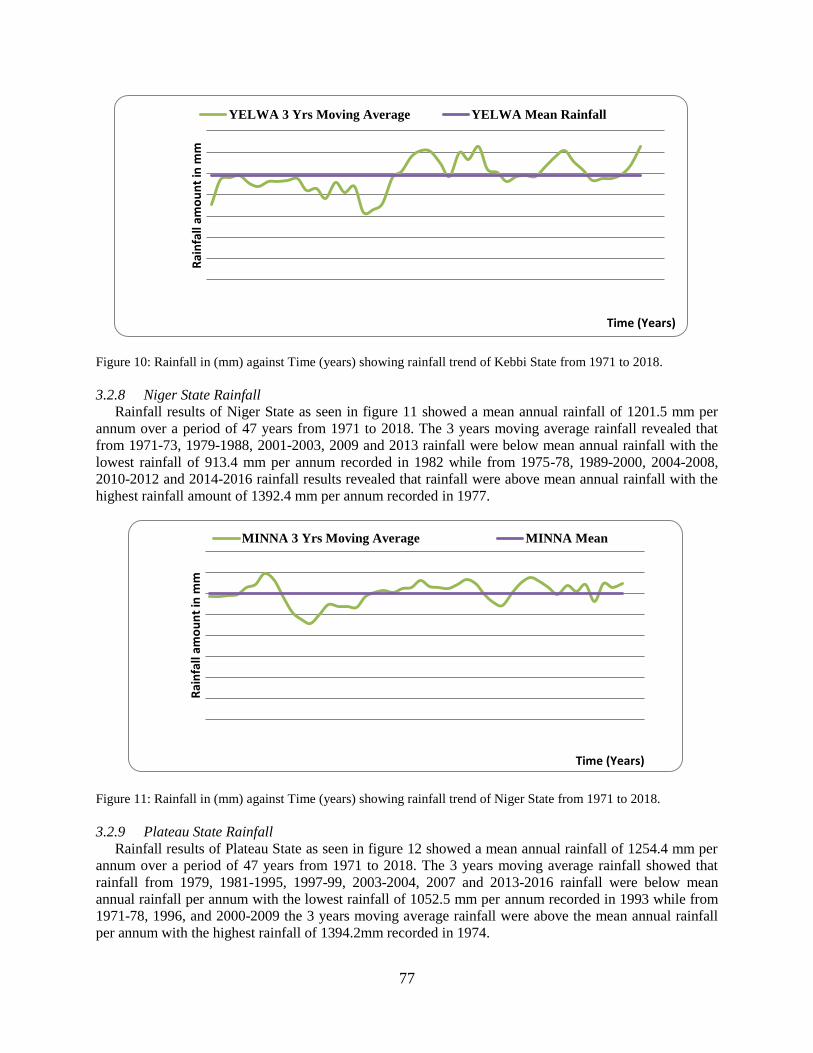
77
Figure 10: Rainfall in (mm) against Time (years) showing rainfall trend of Kebbi State from 1971 to 2018.
3.2.8 Niger State Rainfall
Rainfall results of Niger State as seen in figure 11 showed a mean annual rainfall of 1201.5 mm per
annum over a period of 47 years from 1971 to 2018. The 3 years moving average rainfall revealed that
from 1971-73, 1979-1988, 2001-2003, 2009 and 2013 rainfall were below mean annual rainfall with the
lowest rainfall of 913.4 mm per annum recorded in 1982 while from 1975-78, 1989-2000, 2004-2008,
2010-2012 and 2014-2016 rainfall results revealed that rainfall were above mean annual rainfall with the
highest rainfall amount of 1392.4 mm per annum recorded in 1977.
Figure 11: Rainfall in (mm) against Time (years) showing rainfall trend of Niger State from 1971 to 2018.
3.2.9 Plateau State Rainfall
Rainfall results of Plateau State as seen in figure 12 showed a mean annual rainfall of 1254.4 mm per
annum over a period of 47 years from 1971 to 2018. The 3 years moving average rainfall showed that
rainfall from 1979, 1981-1995, 1997-99, 2003-2004, 2007 and 2013-2016 rainfall were below mean
annual rainfall per annum with the lowest rainfall of 1052.5 mm per annum recorded in 1993 while from
1971-78, 1996, and 2000-2009 the 3 years moving average rainfall were above the mean annual rainfall
per annum with the highest rainfall of 1394.2mm recorded in 1974.
Rai
nfa
ll am
ou
nt
in m
m
Time (Years)
YELWA 3 Yrs Moving Average YELWA Mean Rainfall
Rai
nfa
ll am
ou
nt
in m
m
Time (Years)
MINNA 3 Yrs Moving Average MINNA Mean
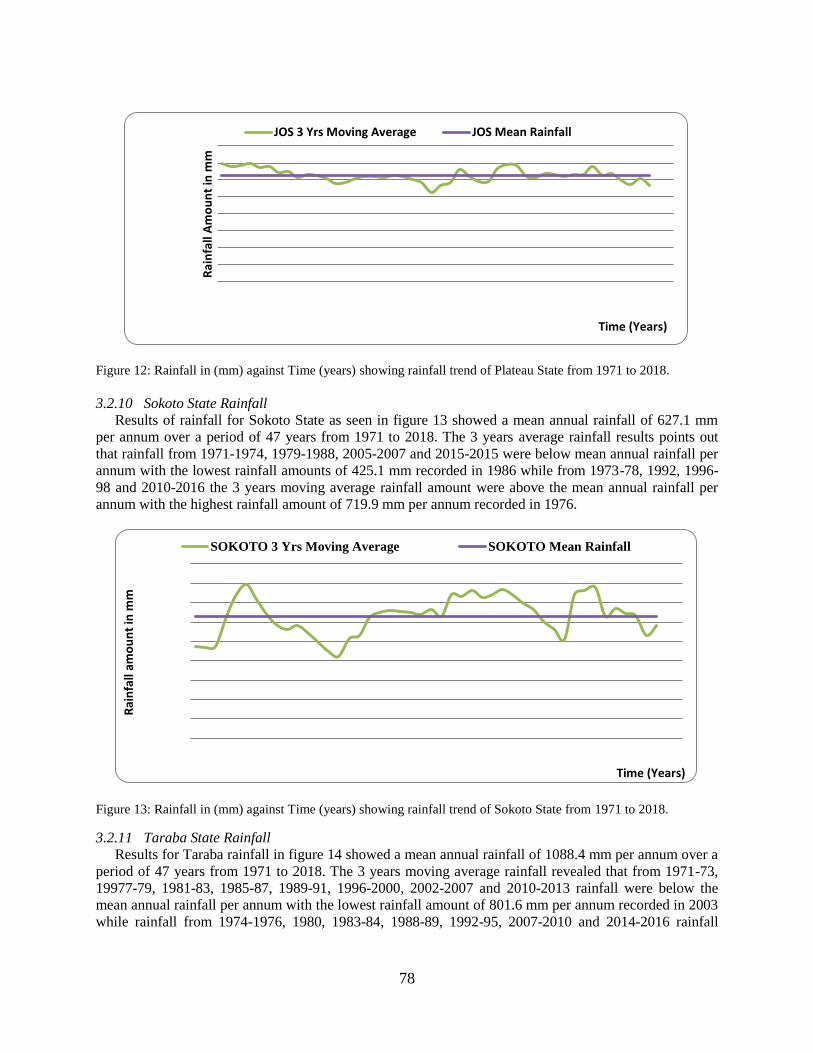
78
Figure 12: Rainfall in (mm) against Time (years) showing rainfall trend of Plateau State from 1971 to 2018.
3.2.10 Sokoto State Rainfall
Results of rainfall for Sokoto State as seen in figure 13 showed a mean annual rainfall of 627.1 mm
per annum over a period of 47 years from 1971 to 2018. The 3 years average rainfall results points out
that rainfall from 1971-1974, 1979-1988, 2005-2007 and 2015-2015 were below mean annual rainfall per
annum with the lowest rainfall amounts of 425.1 mm recorded in 1986 while from 1973-78, 1992, 1996-
98 and 2010-2016 the 3 years moving average rainfall amount were above the mean annual rainfall per
annum with the highest rainfall amount of 719.9 mm per annum recorded in 1976.
Figure 13: Rainfall in (mm) against Time (years) showing rainfall trend of Sokoto State from 1971 to 2018.
3.2.11 Taraba State Rainfall
Results for Taraba rainfall in figure 14 showed a mean annual rainfall of 1088.4 mm per annum over a
period of 47 years from 1971 to 2018. The 3 years moving average rainfall revealed that from 1971-73,
19977-79, 1981-83, 1985-87, 1989-91, 1996-2000, 2002-2007 and 2010-2013 rainfall were below the
mean annual rainfall per annum with the lowest rainfall amount of 801.6 mm per annum recorded in 2003
while rainfall from 1974-1976, 1980, 1983-84, 1988-89, 1992-95, 2007-2010 and 2014-2016 rainfall
Rai
nfa
ll A
mo
un
t in
mm
Time (Years)
JOS 3 Yrs Moving Average JOS Mean RainfallR
ain
fall
amo
un
t in
mm
Time (Years)
SOKOTO 3 Yrs Moving Average SOKOTO Mean Rainfall
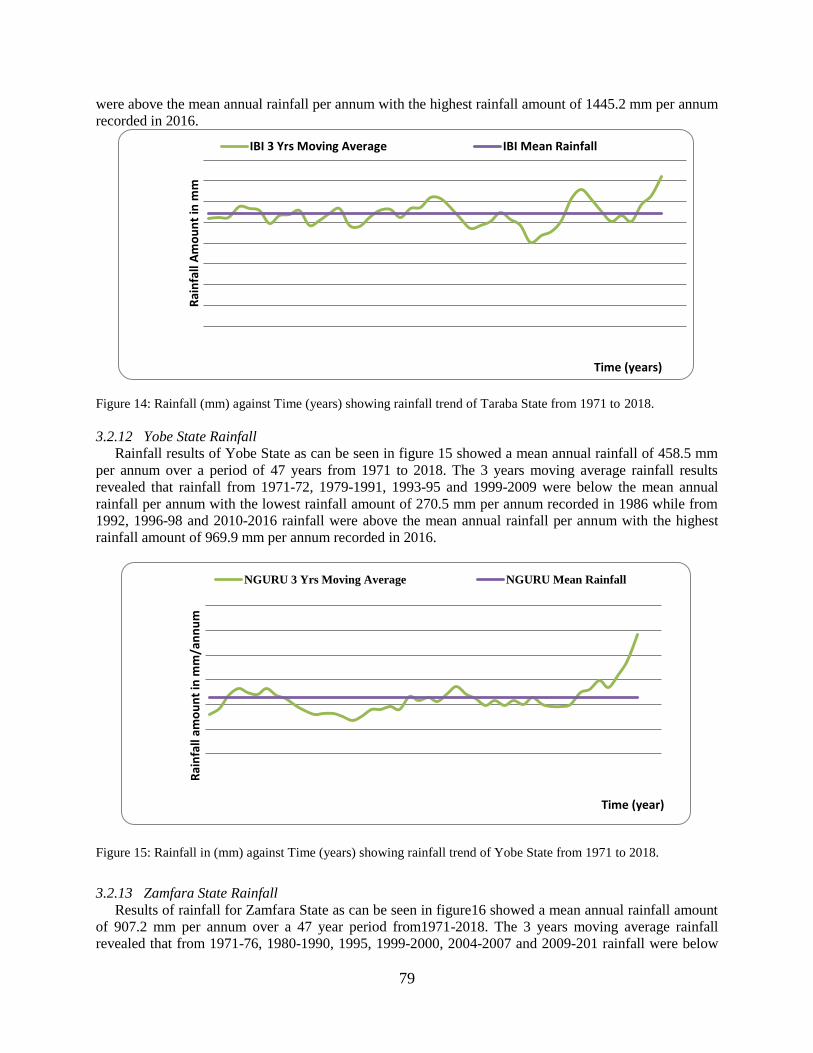
79
were above the mean annual rainfall per annum with the highest rainfall amount of 1445.2 mm per annum
recorded in 2016.
Figure 14: Rainfall (mm) against Time (years) showing rainfall trend of Taraba State from 1971 to 2018.
3.2.12 Yobe State Rainfall
Rainfall results of Yobe State as can be seen in figure 15 showed a mean annual rainfall of 458.5 mm
per annum over a period of 47 years from 1971 to 2018. The 3 years moving average rainfall results
revealed that rainfall from 1971-72, 1979-1991, 1993-95 and 1999-2009 were below the mean annual
rainfall per annum with the lowest rainfall amount of 270.5 mm per annum recorded in 1986 while from
1992, 1996-98 and 2010-2016 rainfall were above the mean annual rainfall per annum with the highest
rainfall amount of 969.9 mm per annum recorded in 2016.
Figure 15: Rainfall in (mm) against Time (years) showing rainfall trend of Yobe State from 1971 to 2018.
3.2.13 Zamfara State Rainfall
Results of rainfall for Zamfara State as can be seen in figure16 showed a mean annual rainfall amount
of 907.2 mm per annum over a 47 year period from1971-2018. The 3 years moving average rainfall
revealed that from 1971-76, 1980-1990, 1995, 1999-2000, 2004-2007 and 2009-201 rainfall were below
Rai
nfa
ll A
mo
un
t in
mm
Time (years)
IBI 3 Yrs Moving Average IBI Mean Rainfall
Rai
nfa
ll am
ou
nt
in m
m/a
nn
um
Time (year)
NGURU 3 Yrs Moving Average NGURU Mean Rainfall
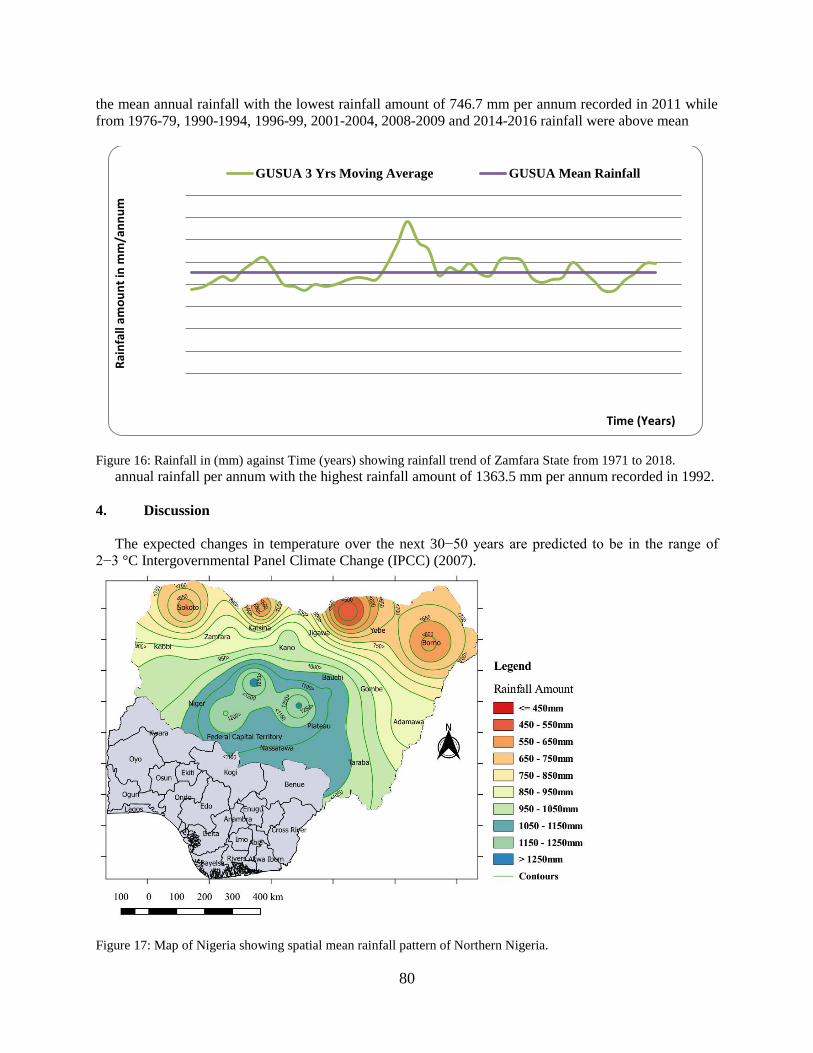
80
the mean annual rainfall with the lowest rainfall amount of 746.7 mm per annum recorded in 2011 while
from 1976-79, 1990-1994, 1996-99, 2001-2004, 2008-2009 and 2014-2016 rainfall were above mean
Figure 16: Rainfall in (mm) against Time (years) showing rainfall trend of Zamfara State from 1971 to 2018.
annual rainfall per annum with the highest rainfall amount of 1363.5 mm per annum recorded in 1992.
4. Discussion
The expected changes in temperature over the next 30−50 years are predicted to be in the range of
2−3 °C Intergovernmental Panel Climate Change (IPCC) (2007).
Figure 17: Map of Nigeria showing spatial mean rainfall pattern of Northern Nigeria.
Rai
nfa
ll am
ou
nt
in m
m/a
nn
um
Time (Years)
GUSUA 3 Yrs Moving Average GUSUA Mean Rainfall
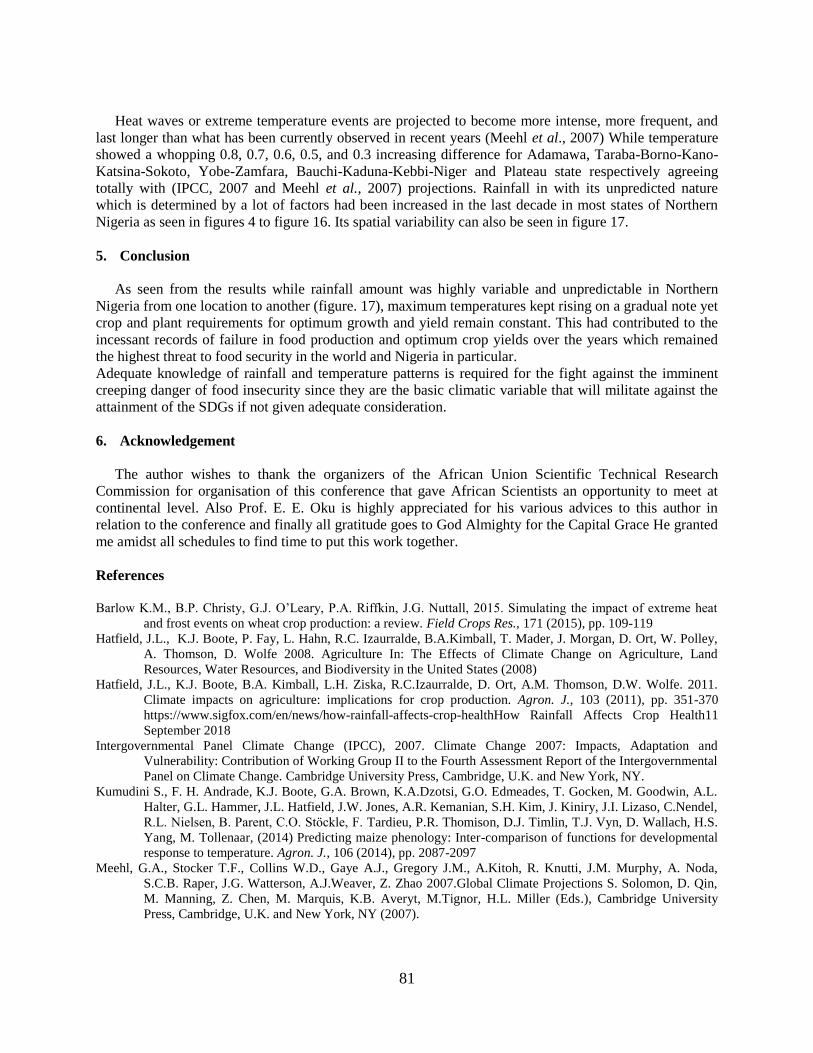
81
Heat waves or extreme temperature events are projected to become more intense, more frequent, and
last longer than what has been currently observed in recent years (Meehl et al., 2007) While temperature
showed a whopping 0.8, 0.7, 0.6, 0.5, and 0.3 increasing difference for Adamawa, Taraba-Borno-Kano-
Katsina-Sokoto, Yobe-Zamfara, Bauchi-Kaduna-Kebbi-Niger and Plateau state respectively agreeing
totally with (IPCC, 2007 and Meehl et al., 2007) projections. Rainfall in with its unpredicted nature
which is determined by a lot of factors had been increased in the last decade in most states of Northern
Nigeria as seen in figures 4 to figure 16. Its spatial variability can also be seen in figure 17.
5. Conclusion
As seen from the results while rainfall amount was highly variable and unpredictable in Northern
Nigeria from one location to another (figure. 17), maximum temperatures kept rising on a gradual note yet
crop and plant requirements for optimum growth and yield remain constant. This had contributed to the
incessant records of failure in food production and optimum crop yields over the years which remained
the highest threat to food security in the world and Nigeria in particular.
Adequate knowledge of rainfall and temperature patterns is required for the fight against the imminent
creeping danger of food insecurity since they are the basic climatic variable that will militate against the
attainment of the SDGs if not given adequate consideration.
6. Acknowledgement
The author wishes to thank the organizers of the African Union Scientific Technical Research
Commission for organisation of this conference that gave African Scientists an opportunity to meet at
continental level. Also Prof. E. E. Oku is highly appreciated for his various advices to this author in
relation to the conference and finally all gratitude goes to God Almighty for the Capital Grace He granted
me amidst all schedules to find time to put this work together.
References
Barlow K.M., B.P. Christy, G.J. O’Leary, P.A. Riffkin, J.G. Nuttall, 2015. Simulating the impact of extreme heat
and frost events on wheat crop production: a review. Field Crops Res., 171 (2015), pp. 109-119
Hatfield, J.L., K.J. Boote, P. Fay, L. Hahn, R.C. Izaurralde, B.A.Kimball, T. Mader, J. Morgan, D. Ort, W. Polley,
A. Thomson, D. Wolfe 2008. Agriculture In: The Effects of Climate Change on Agriculture, Land
Resources, Water Resources, and Biodiversity in the United States (2008)
Hatfield, J.L., K.J. Boote, B.A. Kimball, L.H. Ziska, R.C.Izaurralde, D. Ort, A.M. Thomson, D.W. Wolfe. 2011.
Climate impacts on agriculture: implications for crop production. Agron. J., 103 (2011), pp. 351-370
https://www.sigfox.com/en/news/how-rainfall-affects-crop-healthHow Rainfall Affects Crop Health11
September 2018
Intergovernmental Panel Climate Change (IPCC), 2007. Climate Change 2007: Impacts, Adaptation and
Vulnerability: Contribution of Working Group II to the Fourth Assessment Report of the Intergovernmental
Panel on Climate Change. Cambridge University Press, Cambridge, U.K. and New York, NY.
Kumudini S., F. H. Andrade, K.J. Boote, G.A. Brown, K.A.Dzotsi, G.O. Edmeades, T. Gocken, M. Goodwin, A.L.
Halter, G.L. Hammer, J.L. Hatfield, J.W. Jones, A.R. Kemanian, S.H. Kim, J. Kiniry, J.I. Lizaso, C.Nendel,
R.L. Nielsen, B. Parent, C.O. Stӧckle, F. Tardieu, P.R. Thomison, D.J. Timlin, T.J. Vyn, D. Wallach, H.S.
Yang, M. Tollenaar, (2014) Predicting maize phenology: Inter-comparison of functions for developmental
response to temperature. Agron. J., 106 (2014), pp. 2087-2097
Meehl, G.A., Stocker T.F., Collins W.D., Gaye A.J., Gregory J.M., A.Kitoh, R. Knutti, J.M. Murphy, A. Noda,
S.C.B. Raper, J.G. Watterson, A.J.Weaver, Z. Zhao 2007.Global Climate Projections S. Solomon, D. Qin,
M. Manning, Z. Chen, M. Marquis, K.B. Averyt, M.Tignor, H.L. Miller (Eds.), Cambridge University
Press, Cambridge, U.K. and New York, NY (2007).

82