vmu-c em - eta
TRANSCRIPT

VMU-C EM
Web Server system for energy
monitoring
Instruction manual
Version A6

VMU-C
VMU-C Instruction manual 2
TABLE OF CONTENTS 1 INSTALLATION .................................................................................................................................. 4
1.1 PRELIMINARY REMARKS ............................................................................................................ 4 1.2 PACKAGE CONTENT ................................................................................................................... 4 1.3 TECHNICAL FEATURES ............................................................................................................... 5 1.4 INSTALLATION AND CONNECTIONS............................................................................................ 6
2 GENERAL OVERVIEW ........................................................................................................................ 8
2.1 VMU-C EM ................................................................................................................................ 8 2.2 ACCESS TO THE SYSTEM ............................................................................................................. 8 2.3 HOME PAGE ............................................................................................................................ 10
2.3.1 NAVIGATION MENU ............................................................................................................ 13
3 SETTINGS ........................................................................................................................................ 14
3.1 SYSTEM CONFIGURATION........................................................................................................ 14 3.1.1 PLANT DATA SETTING ......................................................................................................... 15 3.1.2 LAN SETTING ....................................................................................................................... 17 3.1.3 NTP SERVER SETTING .......................................................................................................... 19 3.1.4 DP SERVICE SETTING ........................................................................................................... 20 3.1.5 FTP SERVICE CONFIGURATION ............................................................................................. 23 3.1.6 MODBUS TCP ...................................................................................................................... 25 3.1.7 THE VMU-W MODEM.......................................................................................................... 28 3.1.8 ALARM SENDING CONFIGURATION ..................................................................................... 32 3.1.9 PLANNING CONFIGURATION ............................................................................................... 34 3.1.10 E-MAIL (OUTGOING MAIL SERVER) CONFIGURATION ...................................................... 37 3.1.11 UPDATING THE VMU-C FIRMWARE ................................................................................. 38 3.1.12 TOOLS............................................................................................................................. 42 3.1.13 LANGUAGE SETTING ....................................................................................................... 45
3.2 PLANT CONFIGURATION .......................................................................................................... 46 3.2.1 COM SETUP ........................................................................................................................ 46 3.2.2 DRIVERS .............................................................................................................................. 47 3.2.3 PLANT SETTING ................................................................................................................... 48 3.2.4 CONFIGURATION OF THE VMU-O MODULES (VMU-O EM) ................................................... 50 3.2.5 ENERGY METER CONFIGURATION ....................................................................................... 52 3.2.6 COUNTERS CONFIGURATION ............................................................................................... 56 3.2.7 ENERGY METER DELETION .................................................................................................. 58
3.3 VMU-P MODULE CONFIGURATION .......................................................................................... 59 3.3.1 ALARM CONFIGURATION ON VMU-P MODULES .................................................................. 60
3.4 VMU-O MODULE OUTPUT MANUAL COMMAND CONFIGURATION ........................................... 62 3.5 CONFIGURATION OF THE VMU-M EM MODULES ...................................................................... 63 3.6 CONFIGURATION OF THE VMU-C EM MODULE ......................................................................... 65 3.7 SENDING THE SYSTEM CONFIGURATION .................................................................................. 67
3.7.1 RESUME (SYSTEM) CONFIGURATION ................................................................................... 68 3.7.2 IMPORT (SYSTEM CONFIGURATION) .................................................................................... 68
3.8 “OTHER VARIABLES” SETTING .................................................................................................. 69
4 HOME PAGE .................................................................................................................................... 71
5 MONITOR - METER DATA ANALYSIS ................................................................................................ 73
5.1 “CURRENTS” CHART ................................................................................................................ 76 5.2 “POWER FACTORS” CHART ...................................................................................................... 77 5.3 ”VOLTAGES” CHART ................................................................................................................ 78 5.4 “POWER” CHART ..................................................................................................................... 79 5.5 “ANALOGUE VARIABLES” CHART .............................................................................................. 80 5.6 DC MAIN METER CHARTS ......................................................................................................... 82

VMU-C
VMU-C Instruction manual 3
6 PLANT DATA CHARTS ...................................................................................................................... 83
6.1 ENERGY DATA ......................................................................................................................... 84 6.1.1 MAIN METER ...................................................................................................................... 84 6.1.2 ENERGY METERS (PARTIAL) ................................................................................................. 87
6.2 COUNTERS (GENERIC FROM DIGITAL INPUTS) .......................................................................... 88 6.3 TRENDS ................................................................................................................................... 92
6.3.1 Trends Editing ..................................................................................................................... 92 6.3.2 Trends Displaying ................................................................................................................ 94
6.4 REAL TIME VARIABLES ............................................................................................................. 95 6.5 OTHER VARIABLES ................................................................................................................... 97
6.5.1 ANALOGUE INPUT ............................................................................................................... 97 6.5.2 TEMPERATURE .................................................................................................................... 99 6.5.3 PULSE RATE INPUT ............................................................................................................ 100
7 GENERAL CHART FEATURES .......................................................................................................... 102
7.1 ZOOM FEATURE .................................................................................................................... 102 7.2 REFRESH FEATURE ................................................................................................................. 103 7.3 PRINT FEATURE ..................................................................................................................... 103
8 ALARMS ........................................................................................................................................ 105
8.1 COMMANDS ......................................................................................................................... 107
9 ECONOMIC ANALYSIS ................................................................................................................... 109
10 INFORMATION .............................................................................................................................. 111
10.1 VMU-C STATUS...................................................................................................................... 112 10.2 PLANT CHARACTERISTICS .............................................................................................................. 113
11 DATA EXPORT ............................................................................................................................... 114
12 ACCOUNT...................................................................................................................................... 117
12.1 ACCOUNT MANAGEMENT ..................................................................................................... 117 12.2 ADDING A NEW ACCOUNT ..................................................................................................... 117 12.3 UPDATING AN ACCOUNT ....................................................................................................... 118 12.4 DELETING AN ACCOUNT ........................................................................................................ 119 12.5 LOGGING OFF AN ACCOUNT .................................................................................................. 119 12.6 HISTORY OF ACCESSES TO THE SYSTEM .................................................................................. 119
13 DATA BACK-UP ............................................................................................................................. 120
13.1 RESTORING THE CONFIGURATION FROM BACK-UP (FROM FILE) ............................................. 124 13.2 RESTORING THE DATA-BASE FROM BACK-UP (DISASTER RECOVERY) ....................................... 125
13.2.1 CONFIGURATION RESTORE............................................................................................ 125 13.2.2 DATABASE RESTORE (Disaster Recovery) ....................................................................... 126

VMU-C
VMU-C Instruction manual 4
1 INSTALLATION
1.1 PRELIMINARY REMARKS
This manual provides a comprehensive guide to VMUC-C EM (WebServer) installation, configuration and commissioning; it is addressed to technical staff members having an average knowledge of IT and of TCP/IP networking basic principles. VMUC is a web server and provides a comprehensive monitoring system for devices like power analysers (WM series), electric power meters (EM series), water/gas meters and environmental sensors. The software and all the components needed for panel operation require no installation of additional software components.
1.2 PACKAGE CONTENT
VMU-C EM is supplied in its package, along with the following items:
VMU-C Web Server
Installation manual

VMU-C
VMU-C Instruction manual 5
1.3 TECHNICAL FEATURES
VMUC-EM is micro PC, totally fanless and without any moving components, providing WebServer functions; thanks to the use of industrial hardware, to its extremely small size and to its low energy consumption it is ideal for monitoring applications requiring features like sturdiness and reliability along time; it can be installed in both technical and residential environments, without requiring any special caution during installation, usage and maintenance. The following table provides a summary list of the product characteristics:
Ports and connections
1 X 12 to 28Vdc power supply (A1+ and A2-)
2 X RS-485 (COM1 and COM2) :
COM1
Data – (A-)
Data + (B+)
GND
COM2
Data – (A-)
Data + (B+)
GND
1 X RJ-45 connector for 10/100 Base-T Ethernet [Communication]
[ Communication port – Default IP: 192.168.1.110 ]
Pin 1 TX+
Pin 2 TX-
Pin 3 Rx+
Pin 6 Rx-
1 X standard USB
1 X mini USB (through a dedicated driver it allows to access the system through the IP address 192.168.254.254)
1 X slot for micro SD or SDHC memory card
Absorption 5W Max.
Operating conditions -25°C to 40°C
COM port termination
Both COM ports are internally terminated with a value of 150Ω and polarised with two 511Ω resistors (from “B+” to +5V and from “A-“ to GND). As a consequence no other external connection is required.

VMU-C
VMU-C Instruction manual 6
Fig. 1 – Eos-Box dimensions
1.4 INSTALLATION AND CONNECTIONS
To install VMU-C EM you need to perform the following steps:
Connect the DC 24Vdc power supply (12Vdc to 28Vdc) through an appropriately sized feeder (recommended feeders: CG, SPM or SPD series)
COM1: communication port for the connection to the RS-485 bus for VMUM-EM temperature measurement master devices (Pt100 or Pt1000; 2 or 3 wires), analogue inputs (mV or mA) or for digital input status monitoring (open/closed).
You may connect up to 10 VMU-M EM systems with the relevant VMU-P EM and/or VMU-O EM modules.

VMU-C
VMU-C Instruction manual 7
All the VMU-M EM devices connected to the COM1 port will have to be set to the same baud rate.
COM2: communication port for the connection on RS-485 bus of the electric
power meters. The cascade-connected devices can communicate ad different
baud rates (communication speeds) while using different communication
addresses.
You may connect up to 32 instruments (meters and/or analysers).
The following figure lists the compatible instruments as of the current date:
List of the available energy meter drivers
The log data recorded throughout the day shall be available to be shown in graphical form for 6 months.
The daily data, that is the summary values of each day shall be available to be shown in graphical form for 10 years.
Connect the system to the data network through a standard Ethernet cable, using the LAN communication port configured with the default static IP address 192.168.1.110
Connect the GPRS/EDGE/UMTS/HSDPA modem by means of the VMU-W module through inner bus (optional).
Once power is supplied to the VMU-C EM, the following LEDs will light up on the front panel: green “ON” LED (indicating the machine is powered), orange “BUS” LED (indicating inner BUS activity), orange “COM1” and COM2 LEDs (indicating COM door activity), blue “USB” LED (indicating the presence of an USB device) and red “AL” LED (indicating the presence of any alarm condition); when connecting the network cable, the Ethernet port LEDS will light up as well.
After connecting and powering the VMU-C, access its configuration Web pages as described in the next chapter.

VMU-C
VMU-C Instruction manual 8
2 GENERAL OVERVIEW
2.1 VMU-C EM
VMU-C is conventional energy monitoring Web server based on Web technology. Once properly set up, the VMU-C EM software can be used through the net – both LAN and Internet – through any PC or device equipped with a common Internet browser. As VMU-C EM is based on the Web technology, it can be used as an ordinary Web site; the data and status display function for the devices installed in the plant (analysers, meters, environmental sensors) is based on the innovative AJAX technology, allowing to send and receive information without having to reload the graphical pages.
2.2 ACCESS TO THE SYSTEM
To access the system, you first need to establish a network connection between your PC and VMU-C EM, using the LAN port existing on the device; you have the following options:
Directly connect the two devices (VMU-C EM and PC) through a network cable
Connect both devices (VMU-C EM and PC) to your local network
Directly connect the two devices (VMU-C EM and PC) through a USB/mini-USB cable.
The VMU-C EM default address is 192.168.1.110; in any connection configuration; this
implies that, in order to be able to communicate with VMU-C, your PC must belong to the same sub-network; that means its IP address must be “192.168.1.x”, where “x” must be a number ranging between 1 and 254, other than 100. Technical support operators can also communicate with the VMU-C EM through the same LAN port, using the address 192.168.253.254 (this address is fixed and cannot be changed). If using a mini-USB cable to connect the devices, use the address 192.168.254.254. If your network setting is different (the first 3 number are not the prescribed ones) you need to temporarily modify your network setting as specified above; then, as described below, after accessing the software you can modify the VMU-C EM network parameters, to ensure that it is compatible with your network, and finally restore your original network setting. After configuring your IP address, open an Internet browser and type the following address:
http://192.168.1.110

VMU-C
VMU-C Instruction manual 9
The system will display the following access page:
Fig.– System access page
Clicking the “SIGN-IN” button will access the Login page.
The following are the default username and password:
Username Password Name Level
admin admin admin administrator
To prevent any undesired access to the system, we recommend that you change the default password, particularly if you use Internet connectivity.

VMU-C
VMU-C Instruction manual 10
2.3 HOME PAGE
The figure below shows the VMU-C EM home page:
Home Page
In particular, we have highlighted the following items, which are always available while using the software:
a) Main Menu: it includes the "Navigation Menu"
b) Lh frame: starting from the top:
Plant status. . The system reports the overall status and a synoptic showing the alert status for each category (alarms, anomalies, events, commands) and the relevant counters. The COM ports status is also displayed .
Alerts section
Production data (automatic data update).
Lh frame
Main menu

VMU-C
VMU-C Instruction manual 11
1) Instantaneous AC Power (active and reactive)– Instant power (kW,kvar) measured by the energy meter. The piece of data comes from the reference Energy meter (real or virtual), depending on the settings included in the “Energy Meters Configuration”.
2) Total AC Energy – Total Energy (active and reactive)measured by the energy meter. The piece of data comes from the reference Energy meter (real or virtual), depending on the settings included in the “Energy Meters Configuration”.
Costs section.
Energy costs, calculated at yearly, monthly and daily level, starting from the energy consumption measured by the main meter and the tariff profiled set-up in the relevant configuration section
Rh frame: from the top:
Log-off button Click the button to log off of the VMU-C EM and return to the access page.
Username
PC's date and time.
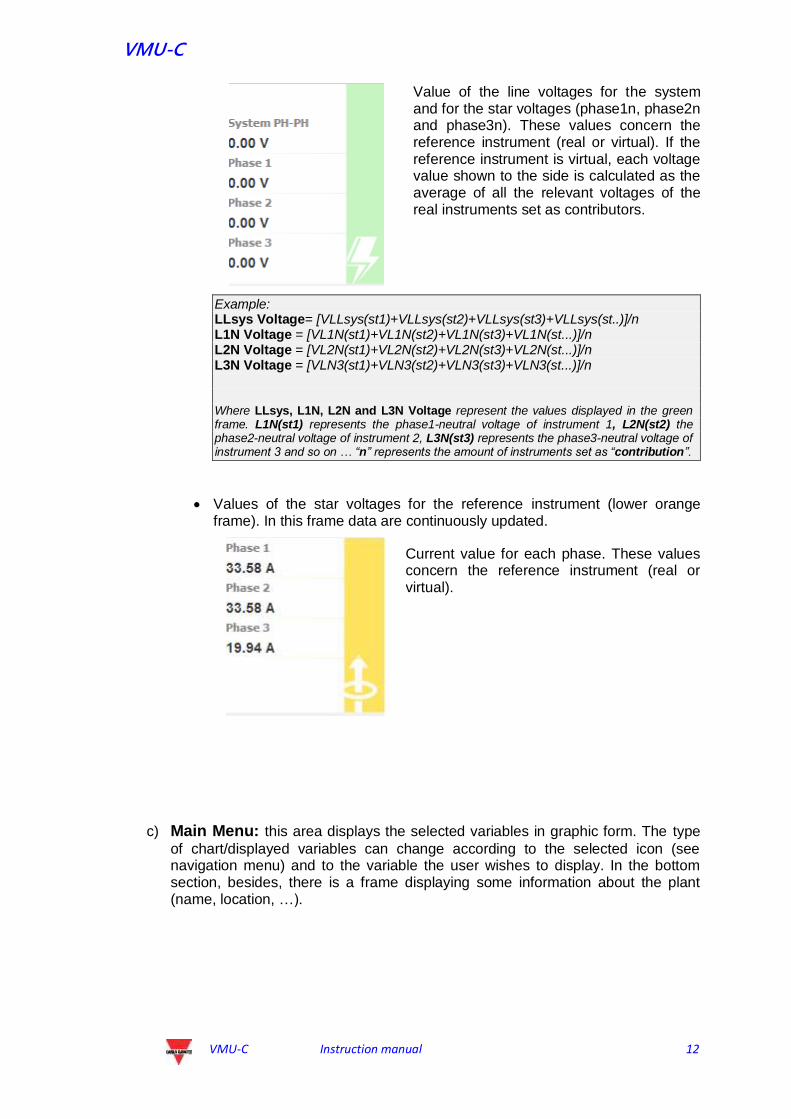
Values of the voltages for the main meter (green frame). In this frame data are continuously updated.
VMU-C
VMU-C Instruction manual 12
Value of the line voltages for the system and for the star voltages (phase1n, phase2n and phase3n). These values concern the reference instrument (real or virtual). If the reference instrument is virtual, each voltage value shown to the side is calculated as the average of all the relevant voltages of the real instruments set as contributors.
Example: LLsys Voltage= [VLLsys(st1)+VLLsys(st2)+VLLsys(st3)+VLLsys(st..)]/n L1N Voltage = [VL1N(st1)+VL1N(st2)+VL1N(st3)+VL1N(st...)]/n L2N Voltage = [VL2N(st1)+VL2N(st2)+VL2N(st3)+VL2N(st...)]/n L3N Voltage = [VLN3(st1)+VLN3(st2)+VLN3(st3)+VLN3(st...)]/n Where LLsys, L1N, L2N and L3N Voltage represent the values displayed in the green frame. L1N(st1) represents the phase1-neutral voltage of instrument 1, L2N(st2) the phase2-neutral voltage of instrument 2, L3N(st3) represents the phase3-neutral voltage of instrument 3 and so on … “n” represents the amount of instruments set as “contribution”.
Values of the star voltages for the reference instrument (lower orange frame). In this frame data are continuously updated.
Current value for each phase. These values concern the reference instrument (real or virtual).
c) Main Menu: this area displays the selected variables in graphic form. The type
of chart/displayed variables can change according to the selected icon (see navigation menu) and to the variable the user wishes to display. In the bottom section, besides, there is a frame displaying some information about the plant (name, location, …).

VMU-C
VMU-C Instruction manual 13
2.3.1 NAVIGATION MENU
Hover your mouse over the different icons to display the relevant meaning in text form. Click on the icon to access the relevant section which will be displayed in the Main Frame.
Home
It allows to return to the main page.
Monitor
It allows to display in graphic form the main reference instrument data, like currents, voltages (VLL and VLN), power (kW and kvar), power factor (PF) and, if available, the analogue variables (°C and/or mA and/or mV).
Plant
It allows to display in graphical form all the acquired system data.
Alarms
It allows to display the alarms that have been raised in the plant.
Economy
It allows to display in graphic form the economic countervalues from consumption monitoring.
Information
A tab displaying the plant characteristics.
Export
It allows to stored data to xls format.
Setting (Only available for Administrator users)
It allows to access the system configuration menu.
Account (Only available for Administrator users)
It allows to access the Account management question.
Help
It opens the online Help remotely hosted on Carlo Gavazzi’s servers

VMU-C
VMU-C Instruction manual 14
3 SETTINGS
Click on the “Configuration” icon in the Navigation Menu (Fig. 6) to access the whole system Configuration section.
System Settings
Three main configuration menus (SYSTEM, PLANT and OTHER VARIABLES) will be
displayed on the screen:
3.1 SYSTEM CONFIGURATION
Clicking on the “SYSTEM” menu will display the following sub-menus:

VMU-C
VMU-C Instruction manual 15
3.1.1 PLANT DATA SETTING
Accessing the “PLANT DATA” menu will open the plant description page.
3.1.1.1 DESCRIPTION SETTING Clicking on the “DESCRIPTION” menu will display the main page providing a plant
description:
Plant Data Configuration
The “Plant description” section (see the hatched area “A”) allows to enter the general plant data (name, location, date of installation, …) to simplify the management of the plant itself. In the “Currency” box the user can specify the reference currency for VMU-C EM (€, £, $, …).
The “Contract highlights” section (see the hatched area “B”) displays economy
information, concerning the type of contract signed with the energy provider utility (fixed costs, unit costs, contractual limits, etc.). These data must be edited using the point “.” as decimal mark (should you use the comma“,” edited data will not be saved).
Note: when configuring the economic data (see frame “B”) we recommend that you refer to the contract signed with the relevant utility.
In section “Tariff Calendar Configuration” (see the hatched area “C”) the user can define which weekdays shall be considered as holidays (by exclusion, non-selected days shall be considered as working days).

VMU-C
VMU-C Instruction manual 16
For working days, besides, the user will be able to define two tariffs (T1 and T2) for which
the individual kWh cost will be different. Within the working day the user will be able to define two periods to be associated with tariff “T1”.
Note: any rime periods not included in tariff “T1” will be automatically included in tariff T2. For holidays, the T2 tariff shall always be used.
Press “Save setting” to store the data into VMU-C EM.

VMU-C
VMU-C Instruction manual 17
3.1.2 LAN SETTING
Clicking on “LAN SETTING” will grant access to the page shown below.
Network settings
g
This page consists of three sections:
1) Network setting
To configure the LAN port, you can choose between two options: Get an IP address automatically (DHCP) (see “A” area) : the address is
automatically acquired when switching on the VMU-C EM from a DHCP server, which must exist inside the network the device is connected to. The IP address will be dynamic and not known in advance. In this case you can reach VMU-C from within the same network by typing on the browser the Machine Name assigned to it (e.g. VMU-C01).
Use the following IP address (Static routing) (see “B” area): you need to
manually specify an IP address along with a network mask and a default gateway. In the absence of a network administrator who can provide the correct network parameters, assign an address belonging to the same class as those of the other devices existing on the same network, and indicate “255.255.255.0” as the network mask. The default gateway is only mandatory if you plan to access VMU-C EM through the Internet using the LAN connection; in this case, indicate in this field the IP address of the ADSL router.
“A” area
”B” area
“C” area
“D” area

VMU-C
VMU-C Instruction manual 18
Finally, you can manually specify the addresses of the preferred and alternative DNS servers to be used to access the Internet by selecting (Use the following DNS server addresses) (see “C” area); as an
alternative, if the LAN port is set to DHCP mode, you can allow VMU-C EM to acquire the DNS server address from the DHCP server, by enabling the option (Get DNS server address Automatically)..
Press the “Save setting” button to store the network setting. To apply the new settings, VMU-C needs a restart, which is performed automatically; wait until the count-down is over; then you'll routed back to the home page.
The system requires to have access to the Internet for the following services:
- To send e-mails to the configured SMTP server.
- To synchronise the date and time settings through the NTP service (if configured).
Note: to ensure that VMU-C EM is accessible from the outside through a
LAN connection, it needs to be appropriately re-routed to the ADSL Modem or Router (NAT- Port forwarding) to which it is connected. The ports to be re-routed are: 80 and 52325.
2) Dynamic public IP address management Should you not have at your disposal a static public IP address allowing to reach the VMU-C from the Internet, but should you have to use any public IP addresses dynamically assigned by your ISP (Internet Service Provider), you may resort to DNS server managers keeping the dynamic public IP address constantly synchronised with a domain name (see “D” area). The managers with which VMU-C EM is compliant are DynDns.org, DynDns.it and No-ip.com. To access the service you need to connect to http://www.dyndns.org/
(or http://www.dyndns.it/ or http://www.No-ip.com/), register by creating an account and finally create a new “Dynamic DNS host”. The term "Dynamic DNS host" indicates a domain address which shall then be typed into the browser's address bar to reach VMU-C. (E.g. VMUC.No-ip.com). When registering to DynDNS.org (or to an equivalent site), please provide a Username and a Password that VMU-C will use to authenticate with the server. To enable the management of the dynamic public IP address you need to:
Check “Enable dynamic DNS”. Type the name of the chosen Dynamic DNS host. Type the Username and Password provided during account
registration. Click on “Save setting”
Note: Carlo Gavazzi has no commercial or technical agreement with any
Dynamic DNS service provider; the above compliancy is meant as a tool to allow customer to use some of the major dynamic DNS infrastructure available in the market

VMU-C
VMU-C Instruction manual 19
Dynamic public IP address management
The service will be available after about 6 minutes.
Note: Resorting to this service is often necessary when the Internet
connection is established through a GPRS/UMTS modem or when you don't have any static IP address on your ADSL line. Mobile providers typically don't provide a static IP address.
3.1.3 NTP SERVER SETTING
Clicking on “NTP SERVER” will grant access to the page shown below:
NTP Server setting
You can set up to two NTP servers. Enabling this server type allows to constantly
synchronise the DATE and TIME data.

VMU-C
VMU-C Instruction manual 20
3.1.4 DP SERVICE SETTING
The DP service is the highly secure and efficient protocol that VMU-C uses to exchange information with Eos-Server and VMU-Y. The protocol is based on a Web-Service oriented architecture based on HTTP. Please check Em2-Server and VMU-Y documentation for information about those systems. Both Em2-Server and VMU-Y allow users to build distributed systems where VMU-C EM is a gateway in a charge of gathering data from the plant and route information to a centralized database (Em2-Server /VMU-Y)
Em
2-Server architecture
DP Service Menu

VMU-C
VMU-C Instruction manual 21
3.1.4.1 DP SERVICE SETTINGS By selecting the Setting submenu it is possible to access the DP Service configuration page.
DP Service configuration
The parameters to set to successfully join the Em2-Server /VMU-Y are:
Parameter Description
Server Address It is the internet address of the Em2-Server / VMU-Y
GPS coordinates The GPS coordinates of the VMU-C; they may be set manually or by using the Map on the bottom
Upload time interval It is the time interval between two distinct data upload transactions from VMU-C to Em2-Server /VMU-Y It depends on available bandwidth (on both sides), amount of data to push, Internet congestion. Typically “10 minutes” is a good compromise
Command Processing interval
It is the time interval between two distinct request-for-commands transactions from VMU-C to Em2-Server /VMU-Y; VMU-C asks Em2-Server / VMU-Y for commands at scheduled intervals and processes them accordingly. Typically it is equal to “Upload time interval”
The available commands are:
Command Description
Test Connection It allows to check if the configured parameters are good, and it is possible to establish a connection between VMU-C and Em2-Server /VMU-Y
Send It allows to send from VMU-C to Em2-Server /VMU-Y:
Full configuration (after having finalized the VMU-C’s configuration)
Partial configuration (after having updated the

VMU-C
VMU-C Instruction manual 22
VMU-C’s configuration)
Command request (to force VMU-C to check if there are any pending commands on Em2-Server /VMU-Y)
Save setting To save the configuration
Notes:
1) It is always advisable to fully finalize the VMU-C configuration before sending it to Eos-Server
2) VMU-C can successfully join Em2-Server only if the necessary license plan has been installed in the target server
3.1.4.2 DP SERVICE LOGS Two sets of Logs are available within the data push section:
Logs of transactions successfully completed
Logs of transaction with errors In both cases, up to 500 records are stored.
Data push logs
VMU-C
VMU-C Instruction manual 23
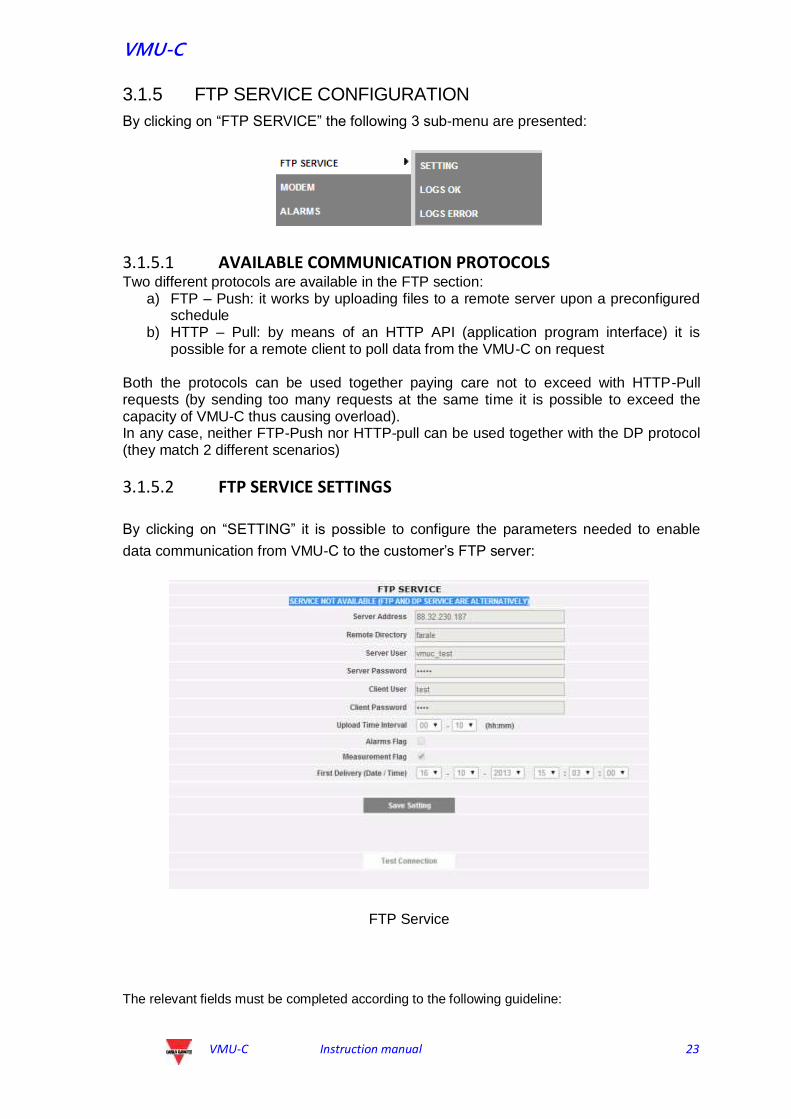
3.1.5 FTP SERVICE CONFIGURATION
By clicking on “FTP SERVICE” the following 3 sub-menu are presented:
3.1.5.1 AVAILABLE COMMUNICATION PROTOCOLS Two different protocols are available in the FTP section:
a) FTP – Push: it works by uploading files to a remote server upon a preconfigured schedule
b) HTTP – Pull: by means of an HTTP API (application program interface) it is possible for a remote client to poll data from the VMU-C on request
Both the protocols can be used together paying care not to exceed with HTTP-Pull requests (by sending too many requests at the same time it is possible to exceed the capacity of VMU-C thus causing overload). In any case, neither FTP-Push nor HTTP-pull can be used together with the DP protocol (they match 2 different scenarios)
3.1.5.2 FTP SERVICE SETTINGS
By clicking on “SETTING” it is possible to configure the parameters needed to enable
data communication from VMU-C to the customer’s FTP server:
FTP Service
The relevant fields must be completed according to the following guideline:

VMU-C
VMU-C Instruction manual 24
“Enable FTP Service”: to be checked to enable data communication (both by FTP-push and HTTP-pull); both HTTP-pull and FTP-push are available at the same time.
In the case FTP communication is needed, the following fields must be completed:
“Server Address”: it is the Internet address of the FTP server to which VMU-C will upload data
“Remote directory”: the remote FTP server’s directory to which data will be uploaded
“Server user”: the user name authorized to access the remote FTP server’s directory
“Server password”: the password to be used together with the “Server user” to access the remote directory
“Upload time interval” (hh:mm) : the interval time between two successive FTP upload actions (in the range 10 minutes – 24 hours)
“Alarms Flag”: to be checked to enable the VMU-C’s alarms upload to the FTP server
“Measurements Flag”: to be checked to enable the VMU-C’s measurement upload to the FTP server
“First Delivery” (date/time): date and time of the first upload action to the FTP server In the case it is needed to exchange data using HTTP-pull, the VMU-C will send its response to an HTTP query sent by the remote system (automated HTTP client); for security reasons an authentication is needed to poll data, and the following fields must be completed prior to be able to perform HTTP requests:
“Client User”: user name to authenticate on VMU-C while executing a query
“Client Password”: password to authenticate on VMU-C while executing a query Press “Save Configuration” to confirm configuration changes. After having completed the relevant fields for FTP communication it is suggested to push “Test connection” so as to check that everything is working correctly
3.1.5.3 FTP SERVICE LOGS By clicking on the “LOGs OK” item, the following screenshot will appear, reporting a ll the FTP transactions completed correctly
The same is valid on the LOGS ERROR menu.

VMU-C
VMU-C Instruction manual 25
3.1.6 MODBUS TCP
Clicking on “MODBUS TCP” will display a sub-menu, “SLAVE”, which allows setting the MODBUS TCP communication through the Ethernet port.
Fill in the fields according to the following specifications:
“Modbus TCP Enabling”: check the relevant box to enable this function.
“Port”: set the relevant Ethernet port. 502 is the standard for Modbus TCP. Press “Save setting” key to store enabling and port settings. Press “Modbus TCP Mapping” key to enter the Modbus TCP configuration page, where the runtime configuration (the last saved configuration) is shown. In case some modifications are carried out to the configuration but not saved, next time the “Modbus TCP mapping” page is accessed, by pressing the “Resume Configuration” key, you can proceed with the interrupted modification process.
3.1.6.1 Modbus TCP Mapping In the “Modbus TCP Mapping” page all the energy meters installed on the Modbus RTU bus (as defined in the Plant Configuration Wizard) are listed, ordered by serial address. Their tag name are shown in the Description field. The table also shows the relevant Modbus TCP address, whenever correctly assigned (green LED). A red LED shows if the relevant configuration is not correct (i.e. the selected TCP address is already used). A yellow LED shows if the instrument is disabled in the Modbus TCP mapping. The list includes the VMU-C itself: if equipped with analogue/temperature input modules, these variables can be retransmitted by Modbus TCP.

VMU-C
VMU-C Instruction manual 26
Press the “Create map” key to save the modifications and create the Modbus TCP map in VMU-C. Press the “Export PDF map” or “Export XML map” to create the map in PDF format or as an XML files to be exported to implement the Modbus TCP map in the relevant master. Press the “Reset TCP map” to reset and regenerate all the maps: in the latter case all the variables added in a second time will be re-aligned with the other ones.
3.1.6.2 Modbus TCP Configuration Press the “Setup” key close to the meter description to set its Modbus TCP parameters by means of the following page.
Fill in the fields according to the following specifications:

VMU-C
VMU-C Instruction manual 27
“Enable Modbus TCP Mapping”: check the relevant box to enable the selected
meter in the Modbus TCP map.
“Modbus TCP address”: set the relevant Modbus TCP address (1 to 247) “Variables Available”: check the variables that must be retransmitted among the
list of all the available ones. A set of keys allow to help in the variable selection: “All” key to select all the available variables, “None” key to unselect all the variables, “Filter” key to enable/disable (toggle button) the variables described in the above combo box. In the example picture above, pressing “Filter” will enable/disable all the Reactive Power variables (system and single phase var). In case a variable is deleted or added in a second time, please refer to next paragraph. Press “Save” key to store the modifications, “Back” to go back to the previous page without saving.
3.1.6.3 Notes about Modbus TCP Mapping in VMU-C EM The data format is IEEE754 (even if differently managed by the meter, e.g. INT 32) for all the instantaneous variables; it is INT64 with 0,1 kWh (or m3) resolution for all the meters or utility counters. The web server and the Modbus TCP slave communication work at the same time over the Ethernet port of VMU-C EM. When the Modbus TCP map is created, the variable are listed following a predefined order. In case a variable is deleted in a second time, the relevant Modbus memory address will be left empty. In this case the floating point value FFFF FFFFh (meaning “NaN”, “not a number”) or the UINT64 value FFFF FFFF FFFF FFFFh can be read in this memory address. In case a variable is added in a second time, the relevant Modbus memory address will be automatically assigned after the existing ones. If variables are added and removed so many times to fill all the available addresses in the map, a message will appear asking to reset and regenerate all the maps with the relevant command (see above).

VMU-C
VMU-C Instruction manual 28
3.1.7 THE VMU-W MODEM
3.1.7.1 INSTALLING AND CONFIGURING THE VMU-W MODEM
Connecting the VMU-W module To connect the Modem (VMU-W) to VMU-C you will have to perform the following steps:
Make sure the VMU-C and the VMU-W are not powered.
Connect the VMU-W to the VMU-C through the auxiliary bus on the left side of the VMU-C.
Make sure the SIM is not protected by a PIN code (should that be the case,
disable the protection).
Insert the SIM into the VMU-W modem through the special slot.
Connect the antenna and put it in a place assuring proper signal reception.
Restore the power supply of both devices (VMU-C and VMU-W).
Make sure that both devices are located in a dry place, protected against rain and dust.
On the front side of VMU-W there are two LEDs, whose meaning is the following: 1) Green LED: Steadily on => the equipment is powered. 2) Blue LED: Off => no power supply. Fast blinking => searching for the cover
signal / not registered / switching off. Slow blinking => Service is registered and signal is available. Steadily on => communication under way.
VMU-W modem

VMU-C
VMU-C Instruction manual 29
By clicking on “MODEM” it is possible to access the configuration of the parameters which allow VMU-W based communication. It is needed to complete all the fields from the following form:
Modem configuration
The web page includes 5 areas: a) MODEM CONNECTION STATUS
Signal = Modem’s signal level (RX)
Model = full Modem’s part number
Network registration = Mobile network to which the modem is connected
Data connection = connection status
IP address = IP address assigned to the device by the mobile network b) MODEM CONFIGURATION
Modem Enabling = to be checked to enable the VMU-W modem
Internet Connection Enabling= to be checked to enable data communication over Internet
SMS Enabling= to be checked to enable SMS alarm dispatching c) MODEM SETTING FOR INTERNET CONNECTION
Provider = APN provider for data connection d) SMS COMMANDS
Password = numeric password to be set to allow user to send SMS commands to the VMU-W (see the relevant section below)
Confirm password = field used to confirm the password above e) MODEM WATCHDOG
See section below

VMU-C
VMU-C Instruction manual 30
3.1.7.2 MODEM WATCHDOG
Modem Watchdog
It is possible to overcome common issues in mobile communication by means of 3 different mechanisms:
1) Ping Reboot: if enabled, VMU-C + VMU-W sends a PING to the defined IP address (to be chosen as a reliable always ON server on Internet). In the case of repeated lost answer from the PING, the system reboots
2) Scheduled reboot: the system reboots each interval time (chosen in the relevant parameter field)
3) SMS command: see next section
3.1.7.3 SMS COMMANDS
SMS COMMANDS SETTINGS
The following command are available by sending SMS to the VMU-W’s SIM number:
Command Syntax Notes
VMU-C Reboot REBOOT PASSWORD (e.g. REBOOT 1234)
Password defined by the user in the relevant section in the page above; the system sends an acknowledge to the calling phone (REBOOT OK)
Data communication ON
DATA MODEM ON PASSWORD (e.g. DATA MODEM ON 1234)
Password defined by the user in the relevant section in the page above; the system sends an acknowledge to the calling phone (DATA MODEM ON OK)
Data communication OFF
DATA MODEM OFF PASSWORD (e.g. DATA MODEM OFF 1234)
Password defined by the user in the relevant section in the page above; the system sends an acknowledge

VMU-C
VMU-C Instruction manual 31
to the calling phone (DATA MODEM OFF OK)
Public IP inquiry IP PASSWORD (e.g. IP 1234)
Password defined by the user in the relevant section in the page above; the system sends the IP address by SMS to the calling phone

VMU-C
VMU-C Instruction manual 32
3.1.8 ALARM SENDING CONFIGURATION
Clicking on “ALARMS” will grant access to the page shown below.
Outgoing mail configuration
VMU-C can send alert emails and/or SMS to more recipients at the same time and according to predefined rules. This page contains two separate configuration screens, in order to create two separate users groups to send communications to. In “Send for” selection field, alarm messages can be filtered to be sent to the relevant receivers. Fill in the fields in both screens according to the following specifications:
Field Description
Recipients addresses Email addresses of the alarm messages’ recipients Note: Addresses must be separated by semicolon ( ; ) with no space.
Object Email’s Subject
Action Send Mail: to send the alerts by email
Send SMS: to send the alerts by SMS (to the phone number on the right)
Phone number Recipient’s phone number including international prefix code
Send for: It is possible to choose which category of alerts must be delivered to recipients among Alarms, anomalies, events, commands (more information on the alarms section) .
“Alarms”: High-priority alerts.
“Warning”: Low-Medium priority alerts.
“Events”: Opening/Closing of digital inputs and
outputs

VMU-C
VMU-C Instruction manual 33
“Commands”: Change of parameters on Eos-
Array
VMU-C
VMU-C Instruction manual 34
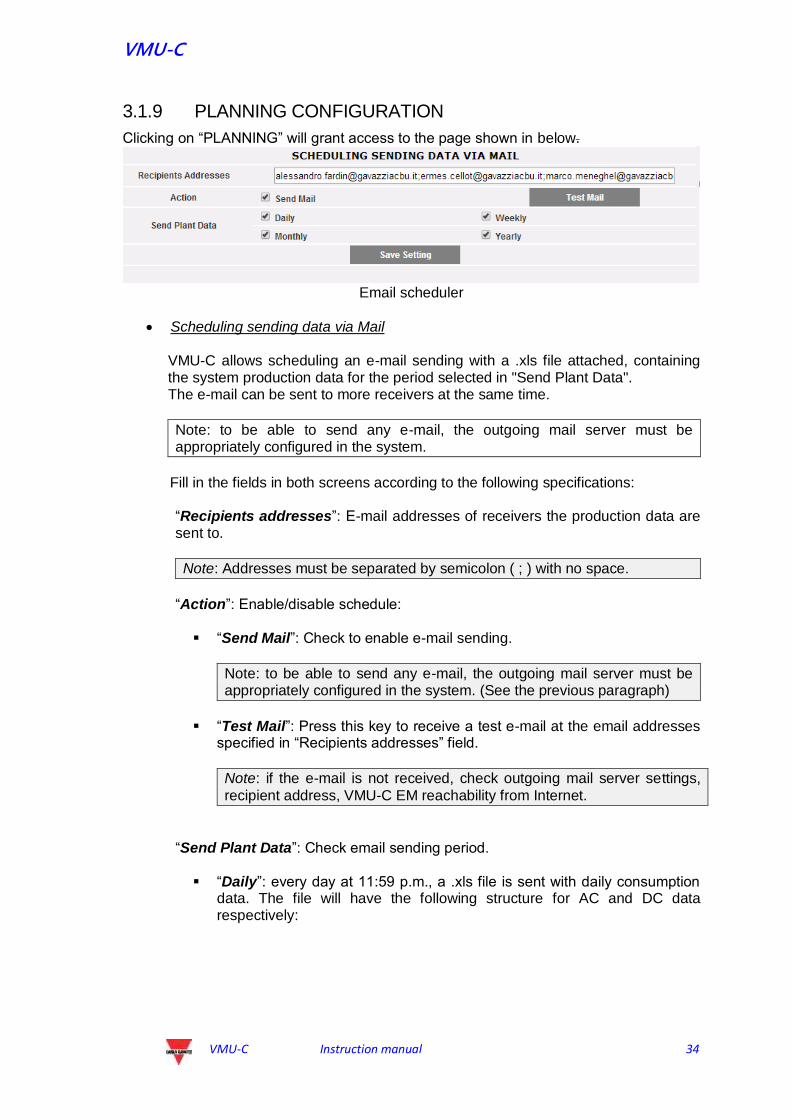
3.1.9 PLANNING CONFIGURATION
Clicking on “PLANNING” will grant access to the page shown in below.
Email scheduler
Scheduling sending data via Mail VMU-C allows scheduling an e-mail sending with a .xls file attached, containing the system production data for the period selected in "Send Plant Data". The e-mail can be sent to more receivers at the same time.
Note: to be able to send any e-mail, the outgoing mail server must be appropriately configured in the system.
Fill in the fields in both screens according to the following specifications: “Recipients addresses”: E-mail addresses of receivers the production data are sent to.
Note: Addresses must be separated by semicolon ( ; ) with no space.
“Action”: Enable/disable schedule:
“Send Mail”: Check to enable e-mail sending.
Note: to be able to send any e-mail, the outgoing mail server must be appropriately configured in the system. (See the previous paragraph)
“Test Mail”: Press this key to receive a test e-mail at the email addresses
specified in “Recipients addresses” field.
Note: if the e-mail is not received, check outgoing mail server settings,
recipient address, VMU-C EM reachability from Internet.
“Send Plant Data”: Check email sending period.
“Daily”: every day at 11:59 p.m., a .xls file is sent with daily consumption data. The file will have the following structure for AC and DC data respectively:

VMU-C
VMU-C Instruction manual 35
“Daily” file format
“Weekly”: an .xls file containing the consumption data of each day of the
week that just ended is sent at 11:59 p.m. of each Sunday. The file will have the following structure for the AC data and similar for the DC data:
“Weekly” file format
“Monthly”: on the last day of the month at 11:59 p.m., a .xls file is sent
with detailed consumption data (daily definition) for every day of the month. The file will have the following structure for the AC data and similar for the DC data:
“Monthly” file format

VMU-C
VMU-C Instruction manual 36
“Yearly”: on December 31st at 11:59 p.m., a .xls file is sent with the consumption data (individual month definition) for every day of the year. The file will have the following structure for the AC data and similar for the DC data:
“Yearly” file format

VMU-C
VMU-C Instruction manual 37
3.1.10 E-MAIL (OUTGOING MAIL SERVER) CONFIGURATION
Clicking on the “E-MAIL” item will grant access to the page shown below
Outgoing mail configuration
The outgoing mail server configuration is necessary to send alarm or history data e-mails from the plant. If configuration is incomplete or incorrect, VMU-C EM cannot send any communications by e-mail. Fill in the fields according to the following specifications:
“Sender address”: e-mail address associated with VMU-C EM. If the address is invalid, the e-mails sent by VMU-C EM might be considered as SPAM.
“Sender name”: sender name. (From)
“Server SMTP": Address of SMTP server for outgoing mail.
“Username Server SMTP": username for access authentication to SMTP server.
“Password Server SMTP": password for access authentication to SMTP server. Press “Save setting” key to store settings.
Note: to ensure proper operation of email message sending, refer to “Alarm
configuration” paragraph.
Note: should you use a mail server not requiring the configuration of the “UserName”
and “Password” fields, when configuring VMU-C the two fields in question shall not be filled in.

VMU-C
VMU-C Instruction manual 38
3.1.11 UPDATING THE VMU-C FIRMWARE
Clicking on the “FIRMWARE” item will grant access to the page shown below.
Firmware update
This page is split in 2 areas relevant to 2 ways of updating the VMU-C:
a) Manual update b) Automatic update
3.1.11.1 MANUAL UPDATE
Manual update allows to upgrade the current firmware release by uploading and installing a new firmware package file (provided by Carlo Gavazzi organization) by means of a PC. Pressing the “Browse” button will open a window allowing to specify where the firmware update file has been saved; as soon as you select the file, VMU-C will display the above window again, replacing the “Browse” caption with “OK” (the update file must be obtained from the Carlo Gavazzi technical support. Pressing the “Load” button will open a window prompting user to confirm the firmware update operation. As soon as the update operation is confirmed, the system will prompt you to confirm the operation under way.
FIRMWARE update confirmation
As soon as user gives OK to proceed with the firmware update operation the system will display the screen shown below:

VMU-C
VMU-C Instruction manual 39
Firmware update splash screen
Time to finalize installation depends on the actual VMU-C load (in tems of connected devices), Internet connection speed and size and complexity of the update package.
Note: the time necessary to the system for loading the update depends on the speed of the Internet/LAN connection between the PC and VMU-C and could last for several minutes, particularly in connection with cellular modem. Wait for the report to confirm the successful download.
Notes: updating operation cannot be interrupted after launching the Update
command. Do not launch a new update before the system has completed the first one.
Notes: Major updates introducing brand new important features need time to be
finalized.
3.1.11.2 AUTOMATIC UPDATE The automatic update is managed by the following subsection of the main Firmware Update page:
Automatic update
The process is menu – driven, and it is thus error-proof; the three steps are:
Button Action
Check Checks if a new updating package is ready on Carlo Gavazzi’s servers

VMU-C
VMU-C Instruction manual 40
Download Enabled if CHECK is successful; it starts the package download from Carlo Gavazzi’s servers; at the end of the download step it is possible both to start installation and also to check again (the latter chance is useful in the case the download has not been followed by Install and time has passed by
Install Enabled if DOWNLOAD is successfully finalized; it starts the package installation
Note: the time necessary to the system for loading the update depends on the speed of the Internet/LAN connection between the PC and VMU-C and could last for several minutes, particularly in connection with cellular modem. Wait for the report to confirm the successful download.
Notes: Major updates introducing brand new important features need time to be
finalized.
3.1.11.3 FIRMWARE UPDATE – SERVER SETTINGS After having been officially authorized by Carlo Gavazzi, an user could setup a firmware update server in its own IT infrastructure. This is useful in the case of complex organizations needing to apply special firmware deployment policies. In this case it is possible to configure an alternate server, under the user responsibility, to be accessed as the VMU-C firmware repository.
Firmware Update –custom FTP server
By the relevant fields it is possible to configure the client so as to communicate with the FTP server :
FTP server address: IP or Internet address of the target FTP server
Remote directory: directory where the firmware packages are stored within the FTP server
Server user: user name to access the above directory
Server password: password to access the above directory Note: setting up a custom FTP repository needs special training on the relevant procedures to allow firmware package deployment. Please contact Carlo Gavazzi Support for further information.

VMU-C
VMU-C Instruction manual 41
Note: setting up a custom FTP repository needs special training on the relevant procedures to allow firmware package deployment. Please contact Carlo Gavazzi Support for further information.

VMU-C
VMU-C Instruction manual 42
3.1.12 TOOLS
The TOOLS menu
By the tools menu it is possible to:
a) Reboot VMU-C b) Setting up Time and Date c) Resetting VMU-C
3.1.12.1 VMU-C REBOOT VMU-C can be restarted through the “REBOOT” button.
After issuing the command you will be prompted to confirm that you wish to proceed,
then a countdown will displayed. When it is completed, you will be addressed back to the home page .

VMU-C
VMU-C Instruction manual 43
Note: during update and restart, web pages can show error messages as VMU-C cannot
be temporarily reached. Wait for a few seconds before restoring connection.
3.1.12.2 DATE,TIME AND VMU-M CONFIGURATION By pressing the “Set” button you can set the VMU-C internal date and time on all the VMU-M devices connected to VMU-C. If you select the “Synchronise with …” function the date and time sent to the VMU-C and as a consequence to the VMU-M devices connected to it will be those of the PC in use .
3.1.12.3 RESETTING SYSTEM DATA VMU-C provides 5 different Reset commands :
1) Yield data reset: it will reset all the production data stored in the internal memory of VMU-C and in the VMU-M devices connected to it (if a memory card has been installed in VMU-C, it is not affected by the Reset command).
2) Events reset: it will reset all the events stored in VMU-C and in the VMU-M devices connected to it (if a memory card has been installed in VMU-C, it is not affected by the Reset command).
3) Eos-Array, environmental sensor and meter reset: it will reset all the environmental sensor data recorded in VMU-C and in the VMU-M devices connected to it (temperatures, radiance and wind speed), as well as the values of the plant kWh meters (if a memory card has been installed in VMU-C, it is not affected by the Reset command).
4) Yield data and plant settings reset: It combines the three Reset commands described above; it also resets the plant configuration (it doesn't reset the data concerning the IP address, the SMTP mail server data and all the previously input e-mail addresses).

VMU-C
VMU-C Instruction manual 44
5) Restore Factory Settings: it performs the reset operations described at point
4; it also resets all the settings like IP address, SMTP server and alarm management by e-mail (if a memory card has been installed in VMU-C, it is not affected by the Reset command). Default data (factory settings) will be restored.
Note: to be able to execute any of the reset commands described above , you first need
to enter the Administrator “Password”.

VMU-C
VMU-C Instruction manual 45
3.1.13 LANGUAGE SETTING
Hovering the mouse cursor over “SYSTEM” will display a drop-down menu; click on “LANGUAGE”; the relevant section will be displayed. From the drop-down menu select the desired language. The system will also display the date and time formats currently in use. “Decimal Separator” box allows the choice between “.” and “,” as decimal separator in all the file which will be exported by VMU-C.
Language setting
You will also have to provide the following information: - Geographic area - City
This information is required for time management inside VMU-C EM.

VMU-C
VMU-C Instruction manual 46
3.2 PLANT CONFIGURATION
Hovering the mouse over “PLANT” will display a drop-down menu consisting of three items: “COM SETUP” , “DRIVER” and “SETTING”
Plant Configuration Menu
3.2.1 COM SETUP Hovering the mouse over “COM Setup” will grant access to the page shown below, relevant to COM1 port according to the relevant RS485 parameters. The configuration of the “COM 2” port must be carried out during the configuration of the energy meters / inverters connected to VMU-C.
COM port Setup
Note: The communication port RS485 (COM 1) is specifically designed for the communication with the VMU-M belonging to the system and controlled by VMU-C.
Define the following parameters in this page:
- Baud-rate (selectable values are: 9600, 19200, 38400 and 115200 bps) - Parity (selectable values are: none, odd or even) - Data bits (selectable values are 8 or 7 bits) - Stop bits (selectable values are 1 or 2 bits)
Press “Save setting” to store data.

VMU-C
VMU-C Instruction manual 47
3.2.2 DRIVERS
Hovering the mouse cursor over “DRIVERS” will display two items: LIST and IMPORT.
Clicking the LIST item will grant access to the page shown below listing (in alphabetical order) all the drivers of the compatible energy meters in VMU-C EM.
Driver list
Driver Import
Clicking on the "IMPORT" item will grant access to the page shown above, allowing to import any new drivers made available by “Carlo Gavazzi Controls” .. Once the new driver(s) loading procedure is completed, press the “Activate” button to actually enable the driver.
Note: due to the complexity of the implemented functions, some driver require that some low-level firmware functions are enabled at the same time. In this case you may have to update the whole VMU-C firmware.

VMU-C
VMU-C Instruction manual 48
3.2.3 PLANT SETTING
When hovering the mouse over “Setting”, the system will display the two items WIZARD and SAVE CONFIGURATION .
If the VMU-C configuration has already been completed, clicking on the SAVE CONFIGURATION item will allow to export it to a file with “DB” extension and to save it to one's PC, allowing it to be uploaded to the present or different VMU-C at a later time.
Clicking on the WIZARD item will grant access to the page shown below, displaying four new sub-menus:
Detect Connected Instruments
Manual configuration
Restore Configuration
Import
Plant Configuration Wizard
Clicking on the “Find Connected Devices” item will grant access to the page shown in
above; through the “Start Scanning” command, it allows to launch the procedure of “self -detection” of the modules connected to the auxiliary bus of VMU-C and of the devices connected to the COM1 communication port (VMU-M and relevant modules).
Note: before starting the configuration procedure described below, the relevant Mod-BUS address (Mod-BUS node number) must have been assigned for all the VMU-M modules. There must not be two devices having the same node number on the same communication bus.
Note: the scanning operation can only detect the devices which are properly connected and powered. The self-detection operation only refers to the COM1 communication bus. Any devices existing on COM2 shall be configured manually.
VMU-C setting

VMU-C
VMU-C Instruction manual 49
Once the procedure for the automatic detection of the connected devices is completed, the system will display the page shown below listing the amount of the devices detected for the COM1 port and for the COM Aux port of the VMU-C EM. If all the devices connected to the ports (COM1 e COM Aux) have been detected, you can stop the automatic scanning procedure through the “Stop scanning”
command.
VMU-C EM setting
If the scanning procedure has been successfully completed, save the resulting information by pressing the “Save Configuration” button
VMU-C EM setting
Clicking on the “Save Configuration” item will grant access to the page shown
below Clicking on the “Manual setup” item will grant access to the manual configuration section shown below . From now on the configuration of the whole system will start. Note: the user will be able to ADD, MODIFY or REMOVE any VMU-M EM devices even after they have been automatically detected.
Manual setup
Note: The LED on the left in figure 32 can take on 3 different colours, having the
following meanings: - GREEN: configuration OK and serial communication enabled - YELLOW: configuration OK but serial communication not enabled.
- RED: error in configuration data. Communication with the relevant module will
be impossible.

VMU-C
VMU-C Instruction manual 50
Clicking on the “Modify” button allows to display and modify the structure of the VMU-C EM and of each individual VMU-M EM adding or removing any VMU-x modules.
You can modify the serial communication address of the specific VMU-M EM module.
You can assign a specific group description (this way it might be easier to identify the board during monitoring)
You can also associate a further descriptive note with the specific VMU-M EM module.
The command “Enable VMU-M EM COM1 communication” allows to enable the communication between the VMU-C EM master and the relevant VMU-M EM. Should communication be disabled, during the scanning procedure the master VMU-C EM will not query the specific VMU-M EM.
VMU-C EM setting
Clicking on the “Next” button from the “Manual setup” page will grant access to the configuration of the individual devices, like energy meters, VMU modules and relevant sensors.
3.2.4 CONFIGURATION OF THE VMU-O MODULES (VMU-O EM)
If during the “device auto-detection” stage one or more VMU-O modules have been identified (there may be up to 3 VMU-O modules for each VMU-C EM e/o VMU-M EM), the system will display the screen shown below . The procedure for the auto-detection of the modules connected to COM1 scans all the devices existing on this port, stores their position and displays the current configuration.

VMU-C
VMU-C Instruction manual 51
VMU-O module configuration mask
The system will automatically display the information concerning the source base module (VMU-C EM or VMU-M EM) and the location of the VMU-O module within the system. Indicate for each of the two outputs (Output1 and Output2) the function to be applied (Remote, Alarm, Clock):
VMU-O usage modes
Remote: Activation and deactivation are performed through a special command
sent by the operator through VMU-C.
Alarm: The output is associated with an alarm condition coming from local VMU
modules connected by local bus to the target VMU_O (i.e. temperature setpoint on the VMU-P): in this case the alarm management is made locally by the VMU-M master This selection also allows to define the initial state of the relay (Normally closed or Normally open).
Clock: Activation and deactivation are carried out at the time set in VMU-C.
Global: The output is associated with an alarm condition coming from VMU-C (i.e.
an Energy meter voltage setpoint): in this case the alarm management is made remotely by the VMU-C. This selection also allows to define the initial state of the relay (Normally closed or Normally open).
Clicking on the “Next” button from the “Manual setup” page (Fig. 32) will grant access to the EM (Energy Meter) configuration page .

VMU-C
VMU-C Instruction manual 52
3.2.5 ENERGY METER CONFIGURATION
Clicking on the “Next” button again from the “Manual setup” page will grant access to the Energy Meter configuration page
Energy meter configuration
3.2.5.1 ENERGY METER ADDITION Clicking on the “Add” button will display the mask allowing to select the configuration model .
Energy meter addition
Click on the “Modify” button to access the detailed Energy Meter configuration .
Energy meter configuration

VMU-C
VMU-C Instruction manual 53
Through the drop-down menu of the “Brand” field select the name of the Energy Meter manufacturer
Select the specific model of the energy meter you are configuring through the drop-down menu of the “Model” field
Compatible EM models list
Complete the Energy Meter configuration by configuring the following fields:
a) Address (Modbus): specify the address configured on the Energy Meter.
Note: within the same RS-485 network there may be no two energy meters (or
other devices) having the same address. The presence of two or more instruments having the same address prevents communication with them.
b) Description: label to be assigned to the Energy Meter. We recommend that you
name instruments in progressive order to easily identify them during data or alarm search.
Note: we recommend that you assign a different “Description” to the
instruments.
c) Energy meter COM 2 communication enabling: it enables the serial
communication of the instrument with VMU-C EM d) Define as main meter: the instrument being configured will be considered as the
reference main instrument (there can be a main meter for AC energy and 1 main meter for DC energy).

VMU-C
VMU-C Instruction manual 54
e) Enable contribution to the virtual main meter: if no main instrument has been
defined (from the configured instrument list), VMU-C EM will automatically create a virtual instrument (one for AC energy and one for DC energy). It will represent the sum of all the real instrument having this option enabled.
f) Notes: notes field. g) Baud rate (bps): specify the communication rate (9600, 19200, 38400 or 115200)
previously set on the instrument. h) Data bits: specify the data format used by the instrument (7 or 8 bits). i) Parity: specify the communication parity type (no parity, even parity, odd parity); it
shall match the values set on the instrument. j) Stop bits: specify the number of stop bits (1 or 2 bits); it shall match the values
set on the instrument.
Pressing the “Save” button will add the energy meter to the list
Note: the “Description” field box can take on 3 different colours, having three different
meanings: - GREY : configuration OK and serial communication enabled - YELLOW: configuration OK but serial communication not enabled. - RED: error in configuration data. Communication with the relevant module will be impossible.
Click on the “Add” button again to add other energy meters.
3.2.5.2 CONFIGURING SET-POINTS Press the “Configure Set-Points” button to access the alarm configuration page.
Button granting access to the alarm configuration page
It grants access to the configuration page allowing to configure up to 8 different alarms for each instrument.

VMU-C
VMU-C Instruction manual 55
alarm configuration page
The following fields need to be configured for each alarm:
Enabled variables: from the drop-down menu you can choose a variable among the ones included in the list displayed by the system:
Enabled variables
In case of DC energy meter, the available variable list is limited to current, voltage, power and DC energy.
Set-Point1: it indicates the alarm activation value (MAXIMUM alarm with Set-
Point1 ≥ Set-Point2; MINIMUM alarm with Set-Point1 < Set-Point2)

VMU-C
VMU-C Instruction manual 56
Set-Point2: specify the alarm activation value. (MAXIMUM alarm with Set-Point1
≥ Set-Point2; MINIMUM alarm with Set-Point1 < Set-Point2)
On-time delay (s): specify the delay in seconds associated with the alarm
activation (waiting time during which the variable stays above or below the Set-Point1 value before the alarm condition is signalled).
Alarm type: specify the type of alarm you wish to manage. Up to three options may be available: Disable, Virtual or Real.
a) Disabled: though configured, the overstepping of the set threshold will not
generate any message or alarm action.
b) Virtual: the overstepping of the set threshold will generate an alarm message
which will not result in the activation of any digital outputs.
c) Position …. : this option will only be available when there is at least a VMU-O
module connected to the internal bus of the VMU-C EM and at least one of the two available outputs is set for remote control. When the alarm threshold is overstepped, the alarm message will be sent, and in addition the status of the selected digital output will change.
3.2.6 COUNTERS CONFIGURATION
Press the “Counters configuration” button to access the page allowing to configure the digital input meters (of any) of the energy meters.
Button granting access to the meter configuration page
You will access the configuration page allowing to set for each digital input a description, the engineering unit, the amount of digits after the decimal point and the relevant enabling.
Digital input meter configuration page

VMU-C
VMU-C Instruction manual 57
Description: label to be assigned to the Meter (like GAS Meter, WATER Meter,
etc.) for easier searching.
Engineering units: the engineering unit referring to the digital input meters.
Decimal position: number of digits after the point. The point position is defined by
the instrument.
Enabled: it specifies whether the meter is enabled or disabled. If it is not enabled, the value and the label will not be displayed.
Press the “Save” button to confirm the newly entered settings.

VMU-C
VMU-C Instruction manual 58
3.2.7 ENERGY METER DELETION
Press the “Remove” button to delete an instrument from the list of the configured energy meters.
Energy Meter insertion/removal mask
The system will display a message prompting to confirm the operation .
Press ‘YES’ to confirm deletion or “NO” to cancel. If you press “YES” the Energy Meter will be removed from the Inserted Meter list. All data acquired from VMU-C EM up to that moment on the deleted Energy Meter will be definitively eliminated.
Note: energy meter insertions, modifications and deletions will come into effect only
after the new plant configuration is sent through the specific command. The machine
doesn't need to be restarted.

VMU-C
VMU-C Instruction manual 59
3.3 VMU-P MODULE CONFIGURATION
if one or more VMU-P modules are identified during the “auto-detection” procedure, the system will display the screen shown below (for each VMU- M EM there may be no more than 1 VMU-P module; VMU-C EM can manage up to 11 VMU-P modules). The procedure for the auto-detection of the VMU-M EM scans all the devices existing on the COM1 port, stores their position and displays the current configuration.
VMU-P module configuration mask
In the area marked by the dots the system will automatically display the information concerning the source base module (VMU-C EM or VMU-M EM) and the location of the VMU-P module within the system. Specify for each module which temperature measurements shall be monitored (Temperature of channel1, of channel 2 or both) and the type of sensor to be used (Pt100 or Pt1000 probes, 3 wires or 2 wires). For each module you can also enable (or disable) the measurements from the analogue inputs and from the frequency input (pulse input).

VMU-C
VMU-C Instruction manual 60
3.3.1 ALARM CONFIGURATION ON VMU-P MODULES
Each VMU-P module can manage specific alarms for each of the monitored dimensions :
Channel 1 temperature
Channel 2 temperature
Analogue input (mV or mA)
Pulse rate input
VMU-P alarm configuration mask
For each alarm you can define the activation thresholds and the relevant usage mode:
- Rising alarm: Threshold1 ≥ Threshold2 - Dropping alarm: Threshold1 < Threshold2
Each alarm can be disabled, or be enabled as a Virtual Alarm, or you can link each individual alarm to a digital output
VMU-P alarm configuration mask
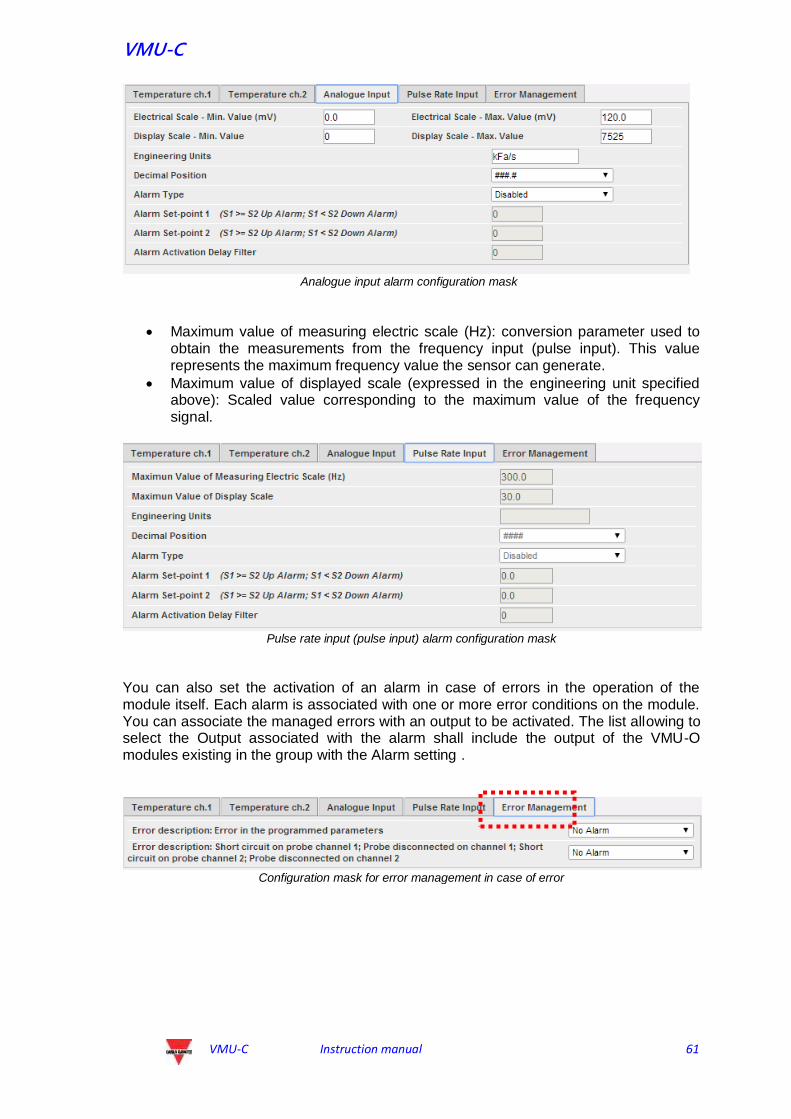
Each alarm can be associated with a different “Alarm activation delay filter” value (a value expressed in seconds, which can range between 0 and 3600). To configure the alarm triggered by the “analogue input” and by the frequency input (pulse input), besides the alarm thresholds Threshold1 and Threshold2 you also need to set the data specific to the installed sensor:
Electric scale – Minimum Value (mV): parameter related to the electrical input (minimum value of the input signal).
Electric scale – Maximum Value (mV): parameter related to the electrical input (maximum value of the input signal).
Displayed scale – Minimum Value: Minimum value (expressed in the engineering unit specified above) at the minimum input value (mV).
Displayed scale – Maximum value (expressed in the engineering unit specified above) at the maximum input value (mV).
VMU-C
VMU-C Instruction manual 61
Analogue input alarm configuration mask
Maximum value of measuring electric scale (Hz): conversion parameter used to obtain the measurements from the frequency input (pulse input). This value represents the maximum frequency value the sensor can generate.
Maximum value of displayed scale (expressed in the engineering unit specified above): Scaled value corresponding to the maximum value of the frequency signal.
Pulse rate input (pulse input) alarm configuration mask
You can also set the activation of an alarm in case of errors in the operation of the module itself. Each alarm is associated with one or more error conditions on the module. You can associate the managed errors with an output to be activated. The list allowing to select the Output associated with the alarm shall include the output of the VMU-O modules existing in the group with the Alarm setting .
Configuration mask for error management in case of error

VMU-C
VMU-C Instruction manual 62
3.4 VMU-O MODULE OUTPUT MANUAL
COMMAND CONFIGURATION
Pressing the “NEXT” button again will grant access to the screen allowing to configure the manual commands of the relay outputs on the VMU-O modules . Through this function, by using a manual command, you'll be able to remotely activate or deactivate (via Ethernet/through the Internet) the digital outputs of the VMU-O modules installed on-field.
Note: To be able to use this function, the outputs on the VMU-O modules must be set to
REMOTE control.
Note: you can create up to 20 manual commands.
VMU-O output manual command configuration mask
In the “Description” column you can associate each command with a label
identifying the function the command in question will activate (for example “Outdoor lighting switch-on”).
The “Base module” column allows to associate the descriptive label (see the above paragraph) with the digital output defined for the purpose. Opening the drop-down menu will display the list of all the outputs previously set to REMOTE command .

VMU-C
VMU-C Instruction manual 63
3.5 CONFIGURATION OF THE VMU-M EM
MODULES
Pressing the “NEXT” button again will grant access to the screen allowing to configure the VMUM-EM modules connected to VMU-C EM.
VMU-M module configuration mask
Besides the label defined above, the top section displays the ModBus address for the specific VMU-M EM module.
The bottom section is used for the configuration of the digital or temperature inputs and for other general alarms. Two sections are described below:
A. Inputs: Define the use of the inputs existing on the VMU-M EM module:
NONE: the module inputs will have no use. For TEMPERATURE reading (on one or two channels; probe type:
Pt100 or Pt1000, 2 or 3 wires). DIGITAL: digital input “1” shall be used to read the status
(Open/Closed) of a digital contact (for example to detect whether the DC protection has tripped or not).
Note: when inputs are used for temperature reading, define whether you wish to
manage the ALARM function for each channel.. In this case to set the values of “Threshold 1” and of “Threshold 2” (for values of “T1” exceeding or equal to those of “T2” you will get a MAXIMUM alarm; for values of “T1” lower than those of “T2” you will get an alarm with MINIMUM operation). You also have to define whether the alarm must be VIRTUAL or REAL (associated with a relay output of VMU-O).
B. Other alarms group:
Set the use of a further alarm managed by VMU-M EM

VMU-C
VMU-C Instruction manual 64
Other alarms group configuration mask
Note: should VMU-C EM find that the VMU-M EM programming is inconsistent with the
modules connected to it, you may choose whether the error should not be managed or whether an alarm should be activated on a physical output.
Note: repeat the VMU-M EM MODULE CONFIGURATION procedure for each of the
VMU-M EM modules connected to the VMU-C EM.

VMU-C
VMU-C Instruction manual 65
3.6 CONFIGURATION OF THE VMU-C EM
MODULE
Pressing the “NEXT” button again will grant access to the screen allowing to fully configure the VMU-C EM module.
VMU-C EM configuration mask
The paragraphs below describe the individual pages allowing to configure the available functions:
GENERAL: it allows to set a password whose function is protecting the device against unwanted configuration changes or reset commands.
Note: the password described above refers to all the VMU-M EM modules
connected to the “COM1” communication port. It shall be identical and shared by all the connected VMU-M EM modules.
ENGINEERING UNIT: it allows to set the engineering units for temperature
measurements (°C or °F).
Engineering unit configuration mask
–
DATA LOGGING: It allows to activate the Data Logging function and to define the relevant storage interval
Data logging time configuration mask
Note: available values for the storage interval range between 5 and 60 minutes.
Intervals may be: 5min – 10min – 15min – 30min – 60 min.

VMU-C
VMU-C Instruction manual 66
OTHER ALARMS GROUP (VMU-C EM): this section allows to configure the Other general alarms (Fig. 63):
o Communication Alarm on Port COM1 and/or COM2: should a device
connected to the COM1 and/or COM2 communication ports stop communicating for more the 30 sec. (if set), the system will trigger the alarm.
Other alarms group configuration mask
Note: To be able to associate a physical output with these Other alarms, the VMU-O
module must belong to the VMU-C EM group.

VMU-C
VMU-C Instruction manual 67
3.7 SENDING THE SYSTEM
CONFIGURATION
Once system configuration is completed, the system will display the relevant screen (Fig. 64): all data can be loaded into the MASTER VMU-C EM module. Only after the user has issued the “Send plant data” command shall the data be operational.
Configuration has been completed and is ready to be sent to VMU-C EM
While the configuration transfer is under way, the system will display the screen shown below:
The configuration is being loaded into VMU-C EM
Once data transfer is completed the system will display a confirmation message. After having acknowledged by pushing the OK button, the user will be re-addressed to the Home Page

VMU-C
VMU-C Instruction manual 68
3.7.1 RESUME (SYSTEM) CONFIGURATION
If you exit the setup wizard before it is completed, you'll be able to resume the procedure through the “Resume configuration” command
Resume configuration
3.7.2 IMPORT (SYSTEM CONFIGURATION)
If the configuration of a plant has been exported using the “SAVE CONFIGURATION”
command ,
Configuration export command
you can import the configuration using the “IMPORT” command, then you can reload it into the same system or into a new one, thus avoiding having to re-enter all the configuration data.
Configuration has been successfully completed

VMU-C
VMU-C Instruction manual 69
3.8 “OTHER VARIABLES” SETTING
When hovering the mouse over “OTHER VARIABLES” the system will display a drop-down menu showing the list of the variables which can be managed by VMU-C EM through the VMUP-EM module(s):
- ANALOGUE INPUT measurements (“mV” and/or “mA”); 1 channel - TEMPERATURE measurements (from Pt100 and/or Pt1000, 2 or 3 wires); 2
channels - Measurements from PULSE RATE INPUT (from pulse input for speed or flow
measurements)
"Other variables" configuration
VMU-C EM can, through the VMUP-EM module, manage three different measurement types:
Analogue output sensors, “120mV” and “20mA”
Temperature sensors (Pt100 and Pt1000, 2/3 wires)
Speed or flow measurement sensors
Clicking on one of the buttons corresponding to the individual types of managed sensors (Analogue, Temperature or frequency input), you can display more information about each sensor type:

VMU-C
VMU-C Instruction manual 70
You can define for each sensor a description which will help you identify, during reading, the sensor from which the measurement comes. The system will also display the following details:
o VMU-M address (or VMU-C address): ModBus address of the VMU-M or
VMU-C module the sensor is connected to; o VMU-P position: it indicates the position of the VMU-P module within the
group; o Channel: it indicates the position of the sensor inside the VMU-P module;
Press the “Reset” button to cancel the newly entered changes; you can also press “Cancel” to cancel the newly entered changes; unlike the “Reset”; with this operation the user shall exit the “Sensor details page”. Save the newly specified sensor settings by pressing the “Save” button.

VMU-C
VMU-C Instruction manual 71
4 HOME PAGE
Clicking on the “Home” icon in the Navigation menu will grant access to the screen showing the trend of power absorbed by the system during the current and the previous days, with a 5-minute sample resolution.
Home page
The chart can be displayed in “Line” or “Area” mode
On the abscissa axis the chart displays the hours of the day from 00:00 to 23:55, while on the ordinate axis it displays the power in kW; the maximum ordinate value is set automatically by an auto-range function.
The chart is automatically updated every 5 minutes. Hovering the mouse cursor over the chart area will display the relevant power value
You can also select 3 different chart types:
- On a daily basis (DAY): the system displays the charts referring to the trend of the
current day and of the previous one.
- On a weekly basis (WEEK): the system displays the histograms referring to the
trend of the current week and of the previous one (always from Monday to Sunday)
- On a monthly basis (MONTH): the system displays the histograms referring to the trend of the current month and of the previous one (always from the first to the last day of the month)
- Note: for the daily chart you can choose between line or area display. Only
histogram display is available for weekly and monthly charts.

VMU-C
VMU-C Instruction manual 72
System weekly “AC” power
System Monthly “AC” power
Print chart
By clicking on the Print button located in the lower right corner of the chart area, you can select which printer shall be used to print the chart.

VMU-C
VMU-C Instruction manual 73
5 MONITOR - METER DATA ANALYSIS
This section is devoted to the meter data analysis and allows to display in the main chart the trend of the main variables, like Current/Power Factor for each individual phase, System voltage (star and line), Power (active and reactive system power), analogue variables like Temperature, signal from pulse and analogue input (when available and anyway coming from VMU-P EM modules). Click on the “Monitor” icon in the Navigation menu to access the screen shown below:
Production data analysis
It is possible to select both the target meter and the variables’ trend; the available trends are:
Trend Variables
A
the VMU-C displays the three tracks referring to the three phase currents
AL1, AL2, AL3
PF,Hz
the VMU-C displays the three tracks referring to the three individual phase power factors, and the system’s PF and frequency
PF L1, PF L2, PF L3, PF Sys, Hz
VLL
the VMU-C displays the tracks referring to the voltages (line to line voltages).
V12 V23 V31 VLL sys
VLN
the VMU-C displays the tracks referring to the voltages (star voltages).
VL1N VL2N VL3N VLNsys
kW kW1 KW2 kW3

VMU-C
VMU-C Instruction manual 74
Trend Variables
Active Power (system) Reactive power (System)
kvar kvar1 Kvar2 kvar3 Active Power (system) Reactive power (System)
Analogue variables VMU-P environmental variables (note that disconnected environmental channels are marked with an asterisk)
a) Graphic functions
Charts consist of an X-axis, showing day hours from 00:00 a.m. to 11:55 p.m., and of as many Y-axes as the number of dimensions to be shown. Each Y axis has a scale of its own, automatically sized according to the magnitude it refers to. To enable or disable (hide) a track, just click on the variable name (located under the X axis). The curve is displayed or removed right away, without having to refresh the page. Hovering the mouse cursor over the chart area will open a window showing the numerical value of each displayed variable. Print chart
Clicking on the “Print” button located in the bottom right of the chart area you can specify which printer shall be used to print the chart .
b) Historical data analysis and graphic display
By means of the calendar tool it is possible to select the desired time interval to be displayed:
Date interval selection
Select the desired day and press “Refresh chart” button.
Note: the date field cannot be edited; date can only be selected through the
relevant calendar.

VMU-C
VMU-C Instruction manual 75
Note: If chart is not displayed and a white area with the caption “No data to
display” appears, it means that no data is available for the selected day.

VMU-C
VMU-C Instruction manual 76
5.1 “CURRENTS” CHART
Main meter Currents chart (AL1, AL2 and AL3)
The chart displays the three phase currents. These currents refer to the instrument of choice (real or virtual according to the system configuration settings). Data may be displayed on a daily, monthly or yearly basis.
Note: in charts the sampling frequency (current values for each phase), depends on the
storage interval set on VMU-C, which must be equal to 5,10,15,30,60 minutes.

VMU-C
VMU-C Instruction manual 77
5.2 “POWER FACTORS” CHART
Power factors chart (for each individual phase)
The Chart allows to compare the 3 individual phase Power Factors (PF1, PF2 and PF3), the system PF and frequency. These values refer to the instrument of choice(real or virtual according to the system configuration settings). Data may be displayed on a daily, monthly or yearly basis.
Note: in charts the sampling frequency (current values for each phase), depends on the
storage interval set on VMU-C, which must be equal to 5,10,15,30,60 minutes.

VMU-C
VMU-C Instruction manual 78
5.3 ”VOLTAGES” CHART
Voltage trend chart
The Chart compares the 2 voltage sets of data (VLNsys: star system voltage and VLLsys: line system voltage). These values refer to the instrument of choice (real or virtual according to the system configuration settings). Should the reference instrument be virtual, the voltages shown in the chart represent the average value of the voltages measured by each individual real instrument. Data may be displayed on a daily, monthly or yearly basis.
Note: in charts the sampling frequency (current values for each phase), depends on the
storage interval set on VMU-C, which must be equal to 5,10,15,30,60 minutes.

VMU-C
VMU-C Instruction manual 79
5.4 “POWER” CHART
System power trend chart (kW and kvar)
The chart compares the 2 system power magnitudes (kW: active system power; kvar: reactive system power). These values refer to the nstrument of choice (real or virtual according to the system configuration settings). Should the reference instrument be virtual, the powers shown in the chart represent the sum of the system powers (kW and kvar) measured by each individual real instrument. Data may be displayed on a daily, monthly or yearly basis.
Note: in charts the sampling frequency (current values for each phase), depends on the
storage interval set on VMU-C, which must be equal to 5,10,15,30,60 minutes.

VMU-C
VMU-C Instruction manual 80
5.5 “ANALOGUE VARIABLES” CHART
Analogue variables
By selecting “Analogue variables” you can display the 4 magnitudes listed below: a. “Temperature 1 (channel 1 of the VMUP) °C” b. “Temperature 2 (channel 2 of the VMUP) °C”
Note: these inputs (channel 1 and 2) for temperature measurement can read data from
“Pt100” or “Pt1000” probes with 2 or 3 wires.
c. “Pulse rate input (VMUP pulse input)”
Note: the pulse frequency input allows to measure a frequency signal for flow or speed
measurements.
d. “Analogue input (analogue input “mV” or “mA” of the VMUP)”
Note: the “mV” type analogue input is available on the module VMUP2TIWXSEM …. The “mA” type input is available on the module VMUP2TCWXSEM.
The box shown below allows to select the master to which the VMUP is connected: This selection allows to set whether the displayed variables belong to the VMU-P directly connected to the VMU-C EM or to one of the VMU-M EM connected by RS485 to the VMU-C EM itself. Variables relevant to disconnected sensors are marked with an asterisk and not shown by default.

VMU-C
VMU-C Instruction manual 81
Note: the sampling frequency in charts (analogue variables, temperature and pulse signal), depends on the storage interval set on VMU-C, which may be equal to 5,10,15,30,60 minutes.

VMU-C
VMU-C Instruction manual 82
5.6 DC MAIN METER CHARTS
By the selection AC/DC put on the top right of the page
the display can be changed from the AC main meter (virtual or real) to the DC main meter (virtual or real). In this case the only available graph compares the 3 DC main variables: voltage, current power.

VMU-C
VMU-C Instruction manual 83
6 PLANT DATA CHARTS
This section displays in graphical form all the data acquired by VMU-C EM and read by the different devices (energy meters and VMU-P modules for analogue variables). Click on the “Plant” icon in the Navigation menu to access the following page :
Production data charts
At the top there is the menu allowing to access the following sections:
1. “ENERGY DATA”: section devoted to the reading (in graphical form) of the
energy and power value from the Energy Meters (EM). 2. “COUNTERS”: section devoted to the reading (in graphical form) of the values
from external meters, like water meter, gas meter, etc, collected by the Energy Meters (EM) through pulse inputs.
3. “REAL-TIME VARIABLES”: section devoted to the real-time reading of the
variables read through the Energy Meters (EM). 4. “OTHER VARIABLES”: section devoted to the reading (in graphical form) of the
analogue values (temperature, speed/flow, generic from analogue input) read through the VMU-P EM modules.

VMU-C
VMU-C Instruction manual 84
6.1 ENERGY DATA
Hovering the mouse cursor over “ENERGY DATA” will display the items “MAIN METER AC”, “ENERGY METERS AC”, “MAIN METER DC”, “ENERGY METERS DC” .
6.1.1 MAIN METER
The power/energy curve represents the sum of all the contributions from the energy meters (EM), respectively AC or DC, monitored by the system in the selected time interval. In building this curve the system only takes into account the instrument which is identified as “Main meter”
If the “Main meter” is of virtual type (being the result of the contribution of multiple
real instruments the displayed curve will be built as the sum of all the instruments whose contribution to the virtual instrument has been enabled.
Note: if no instrument has been set as “Main meter” and at the same time none
of the installed instruments has been set to contribute to the virtual instrument, the page “Main meter” will include no chart.
Note: in charts the sampling frequency (for Power and Energy), depends on the
storage interval set on VMU-C. It can be: 5,10,15,30,60 minutes.
Main meter chart
This page consists of two sections:
Section A for search and selection (in the top section of the page) display type selection buttons:

VMU-C
VMU-C Instruction manual 85
Daily: it shows the daily trend of power or energy on the selected day.
(To choose the day use the special calender which can be accessed through the button next to the date field)
Monthly: it shows the average daily power or the total measured
energy, for each day of the selected month. To choose the month and year use the special selection menus next to the field.
Annual: it shows the average monthly power or the total measured
energy, for each month of the selected year. To choose the year use the special selection menu next to the field.
Note: only the line view is available for the daily Power and Energy charts. In
the monthly and yearly view, the Power trend chart can be displayed both in line and bar (histogram) form; the energy chart can only be displayed in bar form (histograms).
Note: in daily charts the sampling frequency depends on the storage interval
set on VMU-C. It can be: 5,10,15,30,60 minutes.
The (A) section also includes the buttons allowing to select the variable to be displayed: Energy (kWh) or Power (kW).
Section B. On the abscissa axis (X) the chart displays time. The relevant resolution (hours, days, months) will depend on the selected view type (daily, monthly, yearly). On the ordinate axis(Y) the chart displays the power value in kW or the energy value in kWh, with an automatically sized scale (with auto-range function).

VMU-C
VMU-C Instruction manual 86
In the top left of this section there is a menu allowing to select the graphical display mode: "Line" (a continuous line) or "Bar" (for histograms).
Note: we recommend that you use the “Line” display for the daily Power data and the "Bar" mode (for histograms) for the monthly and yearly energy data.
Displaying a value in the chart
Hovering the mouse cursor over the chart area will open a window with the relevant variable value .
Displaying of a value
Print chart
Clicking on the “Print” icon located in the bottom right corner of the chart area you can select the printer you wish to use.

VMU-C
VMU-C Instruction manual 87
6.1.2 ENERGY METERS (PARTIAL)
Hovering the mouse cursor on “ENERGY DATA” and selecting the “ENERGY METERS” item will grant access to a window displaying the daily trend of the power measured by each energy meter of the plant. Each curve has a different colour and can be identified by the legend on chart bottom. Use the “Energy meter name” menu to display the production curve of a specific instrument, as well.
ENERGY METERS – PARTIAL METERS chart
This page is divided into two sections:
A. Section A, for search and selection (on the TOP)
It allows to select the display type, using the dark grey buttons:
Daily: daily trend of power or energy on the selected day. To select the day use the calendar, which can be accessed by pressing the button next to the date field.
Monthly: average daily power or total produced energy, for each day of the
selected month. To select the day use the calendar, which can be accessed by pressing the button next to the date field.
Annual: average daily power or total produced energy, for each month of the
selected year. To select the day use the calendar, which can be accessed by pressing the button next to the date field.
After selecting the display type press the “Refresh Chart” button.
The light grey buttons on the left you can select the type of magnitude to be shown: Power or Energy.
The energy meter selection menu is displayed in light grey. The list contains:

VMU-C
VMU-C Instruction manual 88
The list of all the names assigned to the energy meters included in VMU-C EM; when selecting an individual meter, only the relevant curve will be displayed.
The “ALL” item, allowing to simultaneously display all the energy meters configured and existing in the plant.
The “EM_VIRTUAL” item displays the data associated with the virtual instrument, which, depending on the configuration page settings, represents the sum of two or more real instruments (or anyway of all the instruments for which the check box “contribution to the virtual instrument” has been enabled.
Note: comparing the trends of the measurements of the different energy meters
allows to easily identify any anomalies in the consumptions of the individual plant instruments.
Note: all keys and selections outside the dark grey area do not need the
“Refresh chart” function. After a few moments the chart will refresh automatically.
B. “Section B” contains the charts (on the BOTTOM)
On the abscissa axis (X) the chart displays the time references; the resolution (hours, days, months) depends on the selected display type (daily, monthly, yearly). On the ordinate axis(Y) the chart displays the power value in kW or the energy value in kWh, with an automatically sized scale (with auto-range function). In the top left of this section there is a menu allowing to select the graphical display mode: "Line" (a continuous line) or "Bar" (for histograms). On the abscissa axis (X) the chart displays time; the resolution (hours, days, months) depends on the selected display type (daily, monthly, yearly). On the ordinate axis (Y) the chart displays power in kW or energy in kWh, with a scale automatically sized according to the plant peak power.
Note: we recommend that you use the “Line” or “Area” display for the daily
Power data and the “Bar” display (for histograms) for the monthly and yearly energy data.
6.2 COUNTERS (GENERIC FROM DIGITAL
INPUTS)
Hovering the mouse cursor on “COUNTERS” and then clicking on the “ENERGY METERS” item will grant access to the generic meter screen (counting the pulses collected by the digital inputs of the Energy meters installed on the system, Fig. 98).
Generic counter (H2O, GAS, …) access selection

VMU-C
VMU-C Instruction manual 89
As soon as the user accesses the page, the system displays the daily trend of the monitored meters installed in the specific plant. To simplify the identification of each individual track, every individual curve/line has a different colour and can be identified through the legend in the bottom section of the chart. The “Description” menu allows to select and display the meter trend from the specific instruments.
Fig. 99 – Generic meters (H2O, GAS, …)
This page consists of two sections:
"Section A" for search and selection (in the top section of the page)
It allows to select the display type, using the dark grey buttons:
Daily: it displays the daily trend of the meters for the selected day. To choose the day use the special calender which can be accessed through the button next to the date field.
Monthly: it displays the daily average of the meters, for each day of the
selected month. To choose the month and year use the special selection menus next to the field.
Annual: it displays the meter trend (on a monthly basis) for each month of the
selected year. To choose the year use the special selection menu next to the field.
After selecting the display type press the “Refresh Chart” button.
On the right there is a menu allowing to select the Energy Meter the digital inputs refer to. The list includes all the instruments, with the enabled meters from digital instruments.
Section B
Section A

VMU-C
VMU-C Instruction manual 90
Note: all keys and selections outside the dark grey area do not need the
“Refresh chart” function. After a few moments the chart will refresh automatically.

VMU-C
VMU-C Instruction manual 91
C. “Section B”, displaying in graphical form the trend of the different meters from the digital inputs.
On the abscissa axis (X) the chart displays the time references; the relevant resolution (hours, days, months) depends on the selected display type (daily, monthly, annual). On the ordinate axis (Y) the chart displays the numerical references (automatically scaled) for each meter. For this type of view only the “Line” track is available (the “bar” button is not enabled).
Generic meters (H2O, GAS, …) - monthly display
Note: for monthly and yearly data we recommend that you use the “Bar” display
(for histograms).

VMU-C
VMU-C Instruction manual 92
6.3 TRENDS
6.3.1 Trends Editing
Customized trends management page
By means of the “TREND” submenu it is possible to create and save customized trends of groups of variables chosen from the available set. Any mix of variables from any energy meter or VMU-P module may be chosen. By the “TRENDS CONFIGURATION” page it is possible to:
Function How to
Add new trends By means of the “Add” button
Remove an existing trend By means of the “Remove” button
Modify an existing trend’s settings By means of the “Modify” button

VMU-C
VMU-C Instruction manual 93
Customized trends management page - Modify
By the “Modify” page it is possible to:
Function How to
Add a new Name to the customized trend
By means of the “Label” field
Select an Instrument By means of the “Instrument” drop-down list (Disabled instrument are marked with an asterisk)
Select a module (relevant to the instrument of choice)
By means of the “Module” drop-down list (i.e. it is possible to select a VMU-P module from a VMU-C instrument)
Select a variable (relevant to the instrument and module of choice)
By means of the “Variables” drop-down list The following variables’ types are marked with an asterisk:
Variables of disabled instruments
Variables not available (i.e. temperatures from VMU-P modules without temperature sensors physically connected)
Select the type of the trend, chosen by average, maximum, minimum values
By means of the “Type” drop-down list
Selecting the color of the trend By means of the relevant color selection control
Add notes By means of the “Notes” field
By pushing “Save” it is possible to store the trend

VMU-C
VMU-C Instruction manual 94
6.3.2 Trends Displaying
Customized trends management page - CHARTS
By choosing CHARTS in the TRENDS menu it is possible to display the trend of choice. Trend selection is made by the DESCRIPTION drop-down list

VMU-C
VMU-C Instruction manual 95
6.4 REAL TIME VARIABLES
Hovering the mouse cursor over “REALTIME VARIABLES” and then over “ENERGY METERS AC” or “ENERGY METERS DC” will grant access to the following screen:
Page for real-time variable reading
Section A
Section B

VMU-C
VMU-C Instruction manual 96
This page consists of two sections:
A. “Section A”, on the TOP, allowing to make searches and to select the refresh time.
Energy meter name: select the instrument from which you wish to read the variables in real time.
Refresh time: select the refresh time for the displayed data (5, 10, 30 or 60 seconds).
B. “Section B”,on the BOTTOM, displaying all the values refreshed according to the
interval selected above. In case of DC energy meter, the available set of variables is limited to current, voltage, power and DC energy.
Note: The “Energy meter name” item allow to select a different instrument through
the drop-down menu; the relevant data will then be immediately updated.

VMU-C
VMU-C Instruction manual 97
6.5 OTHER VARIABLES
Hovering the mouse cursor over “OTHER VARIABLES” will display the following screen:
"Other variables" menu
6.5.1 ANALOGUE INPUT
As soon as the user accesses the “ANALOGUE INPUT” page, the system will display the data from the VMU-P EM modules, and more precisely from the “mV” or “mA” inputs of the module itself. Accessing this page will display the daily trend of the variable monitored by the above-mentioned analogue input.
Analogue input variable trend
This page consists of two sections:
"Section A" for search and selection (in the top section of the page).
It allows to select the display type, using the dark grey buttons:

VMU-C
VMU-C Instruction manual 98
Daily: it displays the daily trend of the variable for the selected day. To
choose the day use the special calender which can be accessed through the button next to the date field.
Monthly: it displays the daily average of the value monitored by the analogue
input, for every day of the selected month. To choose the month and year use the special selection menus next to the field.
Annual: it displays the trend of the average (monthly) value monitored by the
analogue input, for each month of the selected year. To choose the year use the special selection menu next to the field.
After selecting the display type press the “Refresh Chart” button.
On the right there is the menu allowing to select the analogue input. The list shall include all enabled analogue inputs.
Note: all keys and selections outside the dark grey area do not need the
“Refresh chart” function. After a few moments the chart will refresh automatically.
D. “Section B” displays in graphical form the trend of the selected variable, (in the
bottom section of the page).
On the ordinate axis (Y) the chart shows the scaled value for the monitored value (with auto-range function).
Two display types are available: “Line” track or “Area” track.
Note: in daily charts the sampling frequency depends on the storage interval set on
VMU-C EM; it can be: 5,10,15,30,60 minutes.

VMU-C
VMU-C Instruction manual 99
6.5.2 TEMPERATURE
As soon as the user accesses the “TEMPERATURE” page, the system displays the data coming from the VMU-P EM modules, and more precisely from the inputs for temperature measurement (from Pt100 and/or Pt1000) of the module itself. Accessing this page will display the daily trend of the variable monitored by the above-mentioned analogue input.
Temperature input variable trend
This page consists of two sections:
"Section A" for search and selection (in the top section of the page)
It allows to select the display type, using the dark grey buttons:
Daily: it displays the daily trend of the variable for the selected day. To choose the day use the special calender which can be accessed through the button next to the date field.
Monthly: it displays the daily average of the value monitored by the temperature input, for every day of the selected month. To choose the month and year use the special selection menus next to the field.
Annual: it displays the trend of the average (monthly) value monitored by the temperature input, for each month of the selected year. To choose the year use the special selection menu next to the field.
After selecting the display type press the “Refresh Chart” button.
On the right there is the menu allowing to select the temperature input. The list shall include all enabled inputs.
Note: all keys and selections outside the dark grey area do not need the
“Refresh chart” function. After a few moments the chart will refresh automatically.

VMU-C
VMU-C Instruction manual 100
E. “Section B” (on the bottom) displays in graphical form the trend of the selected
variable.
On the ordinate axis (Y) the chart shows the scaled value for the monitored value (with auto-range function).
Two display types are available: “Line” track or “Area” track.
Note: in daily charts the sampling frequency depends on the storage interval set on
VMU-C EM. It can be: 5,10,15,30,60 minutes.
6.5.3 PULSE RATE INPUT
As soon as the user accesses the “PULSE RATE INPUT” page, the system displays the data coming from the VMU-P EM modules, and more precisely from the inputs for digital input measurement (for frequency/speed measurement) of the module itself. Accessing this page will display the daily trend of the variable monitored by the above-mentioned digital input.
Digital input variable trend
This page consists of two sections:
"Section A" for search and selection (in the top section of the page)
It allows to select the display type, using the dark grey buttons:
Daily: it displays the daily trend of the variable for the selected day. To choose the day use the special calendar which can be accessed through the button next to the date field.
Monthly: it displays the daily average of the value monitored by the digital input, for every day of the selected month. To choose the month and year use the special selection menus next to the field.
Annual: it displays the trend of the average (monthly) value monitored by the
digital input, for each month of the selected year. To choose the year use the special selection menu next to the field.

VMU-C
VMU-C Instruction manual 101
After selecting the display type press the “Refresh Chart” button.
On the right there is the menu allowing to select the digital input. The list shall include all enabled inputs.
Note: all keys and selections outside the dark grey area do not need the
“Refresh chart” function. After a few moments the chart will refresh automatically.
F. “Section B” displays in graphical form the trend of the selected variable.
On the ordinate axis (Y) the chart shows the scaled value for the monitored value (with auto-range function).
Two display types are available: “Line” track or “Area” track.
Note: in daily charts the sampling frequency depends on the storage interval set on
VMU-C EM. It can be: 5,10,15,30,60 minutes.

VMU-C
VMU-C Instruction manual 102
7 GENERAL CHART FEATURES
7.1 ZOOM FEATURE
You can use the ZOOM function in any Chart display page, it allows you to zoom a particular area of the graph for further analysis. The ZOOM function is fast and easy. The picture below shows the sequence of operations to perform: Example of a graph that you want to further analyze. In particular, we want to analyze the area highlighted with the orange dotted area:
Move your mouse pointer “ ” to point “A” and using the mouse hold down the left mouse button drag the pointer to point “B” :
Zoom Function
As soon as the left mouse button is released, the zoomed area is highlighted the performance of the charts can be further analysed:
A
B

VMU-C
VMU-C Instruction manual 103
Zoomed area
The zoom function is available for all chart types (histogram and area charts). By the RESET ZOOM button it is possible to come back to the initial scaling.
7.2 REFRESH FEATURE
By the refresh button, available in each chart in bottom-left position, it is possible to refresh the displayed view
7.3 PRINT FEATURE
By the PRINT button, available in each chart in bottom-right position, it is possible to print the present chart

VMU-C
VMU-C Instruction manual 104

VMU-C
VMU-C Instruction manual 105
8 ALARMS This section is devoted to the management and display of the alarms which have occurred during installation. Clicking on the “Alarm” icon in the Navigation menu will grant access to the alerts content
Alarms
This table shows the list of alarms stored in VMU-C EM in chronological order, starting from the most recent.
Note: alarm classification cannot be changed by user.
Alarms are divided into three categories, each one with a different colour assigned to it.
“Alarms” include all the warnings associated with the temperature measurements and with the measurements from analogue and digital inputs (from the VMU-M EM and/or VMU-P EM). Any alarm due to the overstepping of the thresholds set in the VMU-C EM for the energy meter instruments causes a warning inside the “ALARM” category. This type of event generally inform the user of a situation which needs to be resolved quickly in the monitored system.
“Anomalies” include all the statuses from the monitored devices and signalling an incorrect operation of the temperature probes (short-circuited or disconnected probe), or any notifications of communication problems on the internal bus or on one of the two RS485 buses (should a device installed and enabled for
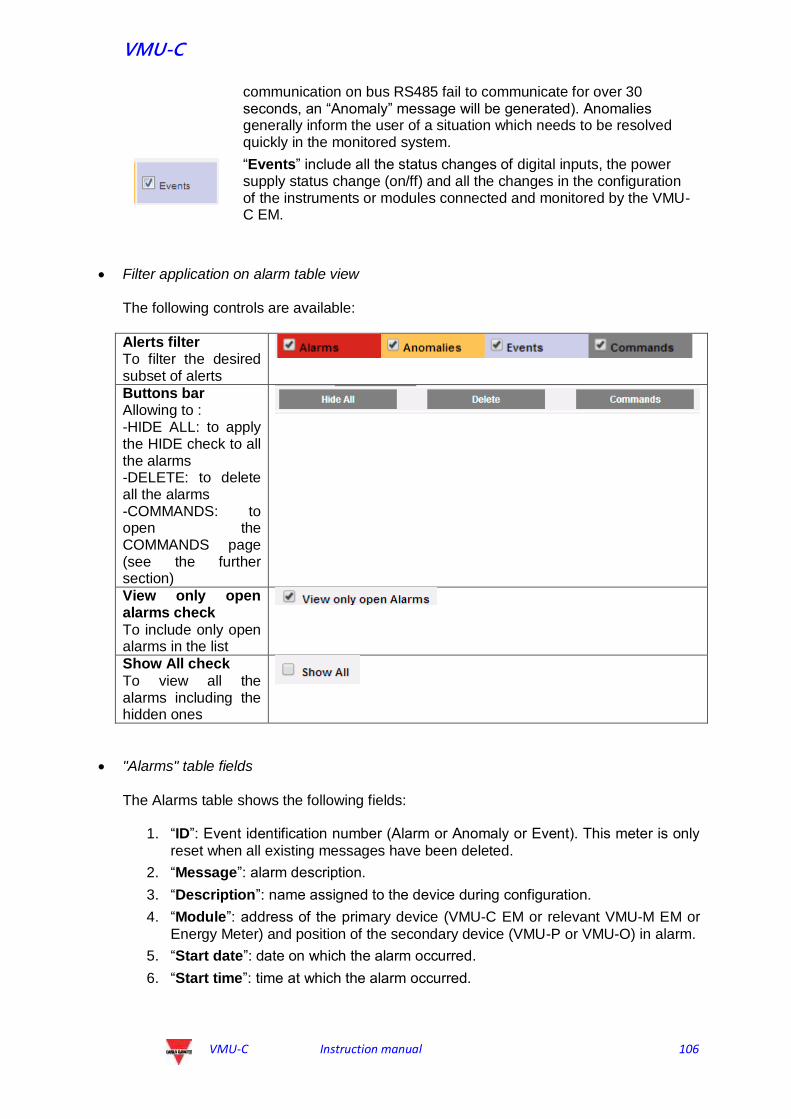
VMU-C
VMU-C Instruction manual 106
communication on bus RS485 fail to communicate for over 30 seconds, an “Anomaly” message will be generated). Anomalies generally inform the user of a situation which needs to be resolved quickly in the monitored system.
“Events” include all the status changes of digital inputs, the power supply status change (on/ff) and all the changes in the configuration of the instruments or modules connected and monitored by the VMU-C EM.
Filter application on alarm table view The following controls are available:
Alerts filter To filter the desired subset of alerts
Buttons bar Allowing to : -HIDE ALL: to apply the HIDE check to all the alarms -DELETE: to delete all the alarms -COMMANDS: to open the COMMANDS page (see the further section)
View only open alarms check
To include only open alarms in the list
Show All check
To view all the alarms including the hidden ones
"Alarms" table fields
The Alarms table shows the following fields:
1. “ID”: Event identification number (Alarm or Anomaly or Event). This meter is only
reset when all existing messages have been deleted.
2. “Message”: alarm description.
3. “Description”: name assigned to the device during configuration.
4. “Module”: address of the primary device (VMU-C EM or relevant VMU-M EM or
Energy Meter) and position of the secondary device (VMU-P or VMU-O) in alarm.
5. “Start date”: date on which the alarm occurred.
6. “Start time”: time at which the alarm occurred.

VMU-C
VMU-C Instruction manual 107
7. “End date”: date on which the alarm ceased. If alarm still exists, the field will be
blank.
8. “End time”: time at which the alarm ceased. If alarm still exists, the field will be
blank.
9. “Hide”: if checked, the alarm row will be automatically hidden.
Note: To view all alarms, including the hidden ones, check “Show all” in the top
right section of the screen. If the option is selected, a hidden alarm can be viewed again by simply unchecking “Hide”.
8.1 COMMANDS
Commands setup
The COMMANDS setup page is opened by the relevant PUSH button in the Alarms section. By this page it is possible to change explicitly the ON or OFF status of the relevant output configured in the VMU-O module (see the relevant instructions in the Configuration Wizard section)

VMU-C
VMU-C Instruction manual 108

VMU-C
VMU-C Instruction manual 109
9 ECONOMIC ANALYSIS This section is devoted to the economic analysis of the installation. It allows to calculate the costs of the consumed AC energy. Clicking on the “Economy” icon in the Navigation menu will grant access to the relevant content .
Economic analysis
As soon as the user accesses the page, the chart displays, for the current month (with a daily resolution), the total cost in € of the amount of energy consumed, taking into account the two tariffs (T1 and T2) previously set by the user. To select another month or a yearly time interval, use the dark grey section on top and press the “Refresh chart” button. The chart displayed above provides 4 different selections (Section “A”), referring to the total energy consumption in the selected month, or just to the active or reactive energy. A further selection is also available to display, for each tariff, the date on which the highest consumption has occurred.
Total: each histogram represents the total consumption (for each tariff) of the day. The value takes into account both the consumed active energy value (kWh) and the reactive component (kvarh). The fixed monthly cost is also considered in calculating the daily values.
kWh: each histogram represents the total consumption (for each tariff) of the day. The value only takes into account the consumed active energy value (kWh).
kvarh: each histogram represents the contribution (for each tariff) due to the reactive energy (kvarh) injected into the network for the day.
kWmax: this chart allows to identify the day of the month in question on which the maximum power absorption (kWmax for each time band) has occurred. This value is only displayed in case it should exceed the contract power threshold

VMU-C
VMU-C Instruction manual 110
previously set by the user. The value is expressed in the currency set in the setup page.
Note: for the four chart types described above, the value expressed on the Y axis must
always refer to the cost expressed in the currency set during programming.
In the “B” section area, with reference to the selections made in section “A”, the system will display the total values for each time band (T1 and T2) and the relevant total.

VMU-C
VMU-C Instruction manual 111
10 INFORMATION This section displays the data and characteristics of the monitored plant. Clicking on the “Information” icon in the Navigation menu will grant access to the relevant content
Plant characteristics
There are 2 sub-selections available from the information page:
1. VMU-C Status 2. Plant characteristics

VMU-C
VMU-C Instruction manual 112
10.1 VMU-C STATUS
By this page it is possible to check in real time the main configuration settings relevant to the VMU-C device.
VMU-C Status
Parameter Description
VMU-C Serial Number It is the unique S/N of the VMU-C MAC Address It is the unique MAC address of the VMU-
C’s Ethernet port
Firmware version The present firmware version in use in the VMU-C
Connected VMU-M The connected VMU-M’s count (on COM1)
Connected AC Meters The connected Energy Meters’ count (on COM1)
Ethernet Status The Ethernet status (RED in the case of issues)
Modem Status The VMU-W modem status (RED in the case of issues)
Server Sync Status The status of data synchronization with the remote Eos-Server or VMU-Y in the case one of those systems is in use (RED in the case of issues)

VMU-C
VMU-C Instruction manual 113
10.2 Plant characteristics
Plant characteristics
This page consists of three sections:
1. “Description”: it displays the plant identification data (name, place and date of installation, etc. …).
2. “Contract highlights”: for each tariff the section specifies the fixed costs, the unit
cost for both active (kWh) and reactive (kvarh) energy, the maximum contract power value for each individual tariff, and finally any additional cost (for each kW), should the maximum contract power be exceeded.
3. “Tariff calendar configuration”: it displays the start/end time for each tariff. It also
specifies the week days which shall be considered as holidays.
Note: any time periods not included in tariff “T1” are automatically included in tariff "T2".
Days defined as “holidays” shall be entirely counted in tariff “T2”.

VMU-C
VMU-C Instruction manual 114
11 DATA EXPORT
This section allows to export the data stored in VMU-C EM to an Excel file. Clicking on the “Export” icon in the Navigation menu grants access the following screen
Exporting stored data
This area allows to choose the type of data to be exported and the relevant period. To generate the file press the “Export data” button.
File can be open or saved on one's own PC. Data can be exported according to three different time frames:
Interval: it allows to define the first and last day of the data export period. The period cannot exceed 8 days.
Monthly: it allows to define the month for data export.
Yearly: it allows to define the year for data export. The types of data which can be exported to an EXCEL file are:
“Alarms”: A .xls file is generated, containing the history of all alarms which have occurred in the system, organized according to the same graphic layout as the

VMU-C
VMU-C Instruction manual 115
“Alarms” web section. The saved file name will be of the following type: “ALARMS_dd_mm_yyyy.xls”
“Energy meter AC” or “Energy meter DC”: the system will export the electric values acquired by the instruments (AC or DC energy meters) connected to the VMU-C EM. The instrument whose values have to be exported must be selected from the relevant drop-down menu; also define the type of data to be exported (Average, Maximum or Minimum). The generated Excel files contains the main values from the selected instrument. The generated file will have the following structure:
Exported data table - data from EM instrument
“Temperature”: the selection allows to export the temperature values of all system sensors configured as active (“Enable”). In the generated Excel file, the first two columns contain the date and time; they are followed by as many columns as the amount of temperature sensors (for each individual recording interval, the file shall provide for each probe the average value calculated over the time interval).
“Analogue input”: the selection allows to export the values measured through the analogue inputs “mV” and/or “mA”. In the generated Excel file, the first two columns contain the date and time; they are followed by as many columns as the amount of analogue inputs configured as active (Enable). For each recording interval and for each analogue input, the file shall provide the average value calculated over the time interval.
The generated file will have the following structure:
“Pulse rate input”: the selection allows to export the speed and/or flow values measured through the digital inputs of the VMU-P modules. The first two columns of the generated Excel file will contain the date and time; they will be followed by as many columns as the amount of digital inputs enabled for this function.
The generated file will have the following structure:

VMU-C
VMU-C Instruction manual 116

VMU-C
VMU-C Instruction manual 117
12 ACCOUNT
Clicking on the “Account” icon in the Navigation menu will grant access to the Account configuration section devoted to users management for access to system.
Account Menu
12.1 ACCOUNT MANAGEMENT
Accesses to the system are managed by creating two user types with different privileges. A. The “Administrator” type account has access to all software areas: “System
configuration”, “Account configuration”, “Data display”.
B. The “User” type account is only allowed to access the “Data display” area.
The system has a default Administrator type user, with these characteristics:
Username Password Name
admin admin Administrator
It is recommended to modify the default user during the first configuration.
Note: An Administrator type user must always exist in the system; in its absence,
access to System configuration and Account configuration areas will no longer be allowed. To restore the Administrator user, contact Carlo Gavazzi technical assistance.
To know which users are online just refer to the list displayed in the dotted area in Fig. 115. Logged-in users are shown in green and are marked with “Logged-in”; other users are shown in red and are marked with “Not logged-in”.
12.2 ADDING A NEW ACCOUNT

VMU-C
VMU-C Instruction manual 118
Press the “Add account” button. The following screen will be displayed in the bottom
section of the page:
add account
Fill in the fields according to the following specifications:
“Name”: Name of the user.
Note: We recommended that you never assign the same “Name” to two
different users.
“USERNAME”: Username for access to the system.
Note: Two users with the same “Username” cannot be entered.
“PASSWORD”: Password for access to the system.
“LEVEL”: user level: User/Administrator.
Press “Reset” key to delete the contents of various fields; “Cancel” to cancel operation.
Press “Add” key to enter account and add it to the list.
12.3 UPDATING AN ACCOUNT
Select the account to be modified from the "Inserted accounts" list (Fig. 115). Press the “Update account” button. The following screen will be displayed in the bottom section of
the page:
Update Account

VMU-C
VMU-C Instruction manual 119
Modify the settings as already described in paragraph "New account insertion" above, taking into account that the Username field cannot be edited. Press the “Reset” button to cancel the modifications; “Cancel” to cancel the operation. Press the “Save” button to modify the account.
12.4 DELETING AN ACCOUNT
Select the account to be deleted from the list shown in Fig. 150. Press the “Delete account” button. The confirmation message appears on the centre of the page. Press
“OK” key to confirm deletion or “Cancel operation” to cancel.
12.5 LOGGING OFF AN ACCOUNT
The administrator user can disconnect a user included in the list by a forced log-off operation. To disconnect a user, displayed in green and with the “Logged-in” indication next to it, press the “Log-off user” button. All the users connected with that Username will
disconnected and re-routed to the home page.
12.6 HISTORY OF ACCESSES TO THE
SYSTEM
Clicking on “Users Log” will open a window containing the history of the accesses to VMU-C-Box, including date and time . Rows in green show the users which are currently online.
Access LOG
The chronology keeps access data for a week; date and time refer to login phase. Click on the captured IP address to find the user's origin area.

VMU-C
VMU-C Instruction manual 120
13 DATA BACK-UP
Data back-up on external memory (optional)
Using a “Micro SD” or “SDHC” memory card appropriately inserted in the relevant slot or a PenDrive directly connected to the USB port , you can back up the data existing in the VMU-C EM database.
Note: the Micro SD card is not supplied with VMU-C. VMU-C supports Micro SD or PenDrive cards whose capacity doesn't exceed 16GB.
Micro SD installation
1. Open the flap located on the front section of VMU-C EM. Identify the slot specifically designed for the insertion of the “Micro SD” memory
Slot for Micro SD cards
2. Insert the Micro SD card, making sure it is not write-protected and it is properly formatted (FAT32).
3. Close the flap back. Warning: if the flap is not properly closed VMU-C EM will not enable any writing or reading operation (flap closing is controlled by a micro switch located under the flap).
4. As soon as the flap is closed, VMU-C EM will install the newly inserted memory card and transfer the BACK-UP data. As long as the installation and writing operations are under way, the front “ON” LED (green) will blink. Warning: opening the flap during the writing stage will stop the data transfer process and might damage the Micro SD memory.

VMU-C
VMU-C Instruction manual 121
Pen-drive installation
1. Identify the USB port specifically designed for the insertion of the “Pen Drive” memory ,
Slot for Micro SD cards
2. Insert the Pen-drive, making sure it is not write-protected and it is properly formatted (FAT32).
3. As soon as you have inserted the Pen-drive, VMU-C EM will install the memory and transfer the BACK-UP data. As long as the installation and writing operations are under way, the front “USB” LED (blue) will blink. Warning: disconnecting the Pen-drive during the writing stage will stop the data transfer process and might damage the memory.
The Back-up operation starts as soon as the memory device (micro SD or Pen Drive) is inserted. At the end of the operation, the memory device will contain a folder named VMUC_”VMU-C name” fig. 122), whose content is described below:
VMU-C’ s backup folder content
Note: The name of the folder VMU-C EM automatically creates at switch-on (or when
the memory device is inserted) consists of a fixed part “VMU-C, automatically followed by the name assigned to the VMU-C itself. For example, the folder name might be something like VMUC_BELLUNO. This operation, which VMU-C EM

VMU-C
VMU-C Instruction manual 122
performs automatically, will prevent the databases of different VMU-C from being overwritten.
Folder “cfg” Folder “db” Folder “DriverWin_USB_Eth” File “ipAddress” EXCEL file “VMUCDATA week_......”
The “cfg” folder contains two files:
1) EWgeneral.db: it contains the general system configuration, the IP address, the scheduled operations, the e-mail addresses for the sending of scheduled messages or in case of alarm, etc.
2) EWplant.db: it contains the plant configuration (the system configuration, installed modules, RS485 network addresses, threshold settings, etc.).
The “db” folder contains the whole VMU-C EM database. This folder contains all
the data stored in VMU-C EM and updated as of 24:00 of the previous day. Should the VMU-C EM get damaged and have to be replaced, this folder allows to move the whole Database and the relevant configuration from the damaged instrument to the new one through a “Disaster-Recovery”-type function.
“DriverWin_USB_Eth” folder it contains a Windows driver allowing to connect
the VMU-C EM to the PC through the mini USB communication port. In this case the reference address (fixed and not editable) is 192.168.254.254. To access the VMU-C EM through the mini USB port use a USB => mini USB cable and type through the browser in use the address 192.168.254.254; the log-in page will be displayed again. “ipAddress” file: it contains the IP addresses of the connected devices.
Note: we recommend that you use “Notepad” to display this file.
EXCEL file “VMUCDATA week_......”: a file containing all the data logged by VMUC_EM in the last 7 days. The file (Fig. 123) will contain the following variables:
o Total active energy read by the reference energy meter (kWh) o Average active power over the period read by the reference energy meter
(kW) o Total reactive energy read by the reference energy meter (kvarh) o Average reactive power over the period read by the reference energy
meter (kvar)
Note: For all the variables mentioned above, the period corresponds to the logging
interval set on VMU-C. This interval can be of: 5,10,15,30,60 minutes.
Excel backup file

VMU-C
VMU-C Instruction manual 123
If the memory device (micro SD or Pen Drive) is left inserted into VMU-C EM, at 12:00 a.m. o'clock VMU-C adds on a daily basis a new file containing the data of the just expired day (with the same formatting as the previous file).
New daily backup file

VMU-C
VMU-C Instruction manual 124
13.1 RESTORING THE CONFIGURATION
FROM BACK-UP (FROM FILE)
If the VMU-C configuration has previously been saved on a PC, it can be re-imported by simply following the procedure described below:
Click on the “SETUP” icon => Click on the “PLANT” button => Click on the “SETTING” button => Click on the “WIZARD” button => Click on the “IMPORT”
button The system will display the “Load configuration from file …” mask ,
Configuration import
To select the file you wish to import, use the “Browse” button to retrieve the configuration file previously saved on the PC. As soon as the file has been selected, the “Import” item will be enabled.

VMU-C
VMU-C Instruction manual 125
13.2 RESTORING THE DATA-BASE FROM
BACK-UP (DISASTER RECOVERY)
If a memory pen or a micro SD memory card was inserted in VMU-C the following screen will be displayed:
Database Restore
The screen in question allows to access two distinct operations:
- Import Plant Configuration - Disaster Recovery
13.2.1 CONFIGURATION RESTORE
Performing this operation is equivalent to “Restoring the configuration from back-up”. When an external memory device (Pen-drive or micro-SD) is inserted into VMU-C EM, a copy of the system configuration (Arrays modules and Energy Meters) is automatically created; the copy in question can then be imported through a special command.
Configuration Restore

VMU-C
VMU-C Instruction manual 126
13.2.2 DATABASE RESTORE (Disaster Recovery)
This operation allows to import into a VMU-C EM the Database of another VMU-C EM (this function can be very useful in case the device should have to be replaced as a consequence of a failure). The “Disaster Recovery” function imports into the new device all the data previously saved in the VMU-C EM which has failed (data-logger + events). This function is only available if the back-up memory (Pen-drive or micro-SD) remains constantly inserted into the VMU-C EM.
Database Restore