vivaldi merger arbitrage fund - vivaldi asset … vivaldi funds each a series of investment managers...
TRANSCRIPT

Vivaldi Asset Management, LLC | 225 W. Wacker Dr. | Suite 2100 | Chicago, IL 60606 | P: 312.248.8300
Vivaldi Merger Arbitrage FundClass A Shares – VARAXClass I Shares – VARBX
Vivaldi Multi-Strategy FundClass A Shares – OMOAXClass I Shares – OMOIX
WV Concentrated Equities FundClass A Shares – WVCAXClass I Shares - WVCIX
ANNUAL REPORTSEPTEMBER 30, 2017

The Vivaldi Funds Each a series of Investment Managers Series Trust II
This report and the financial statements contained herein are provided for the general information of the shareholders of the Vivaldi Funds. This report is not authorized for distribution to prospective investors in the Funds unless preceded or accompanied by an effective prospectus.
www.vivaldifunds.com
Table of Contents
Shareholder Letter ........................................................................................................................................ 1
Fund Performance ...................................................................................................................................... 13
Schedule of Investments ............................................................................................................................. 19
Statements of Assets and Liabilities ........................................................................................................... 40
Statements of Operations ........................................................................................................................... 42
Statements of Changes in Net Assets ......................................................................................................... 43
Statement of Cash Flows ............................................................................................................................ 46
Financial Highlights ..................................................................................................................................... 47
Notes to Financial Statements .................................................................................................................... 53
Report of Independent Registered Public Accounting Firm ....................................................................... 70
Supplemental Information .......................................................................................................................... 71
Expense Examples ....................................................................................................................................... 78

Annual Letter to Shareholders
Past performance is not indicative of future results.
Executive-Level Overview The following management discussion of fund performance pertains to the following time periods:
Vivaldi Merger Arbitrage Fund (10/1/2016 – 9/30/2017)
Vivaldi Multi-Strategy Fund (3/1/2017-9/30/2017)
WV Concentrated Equities Fund (4/28/2017-9/30/2017)
Market Commentary and Overview:
To begin, we would like to expound, briefly, on the current state of the market and some potential trends we see going forward. The first, and perhaps most noticeable, characteristic of today’s broader market is the unrelenting grind higher of the S&P 500. We would like to highlight less that the market has continued to rise and instead focus on the way in which it has risen. Specifically, the market has trended up with an unprecedentedly low level of downside volatility. The worst drawdown YTD that the S&P 500 Index has experienced was -2.58%, which is on record as the second smallest intra-year drawdown in history (1995 being the smallest at -2.55%). It is likely that most non-professional investors wouldn’t even notice those inter-month moves given they were recaptured by the month-ends. That exceedingly low level of volatility may seem as though it should be accepted as a new norm. We, on the other hand, are skeptical of that view.
As many investors are becoming accustomed to the lack of volatility, we would like to highlight one trend that may be getting overlooked. Specifically, the correlation between equities, which is a key factor of the opportunity set for fundamentally-focused, active managers, including many of the managers we utilize in our products. By way of background, there have been time periods in recent years where stocks have, for the most part, traded in lockstep with each other. Those “high correlation” environments can be typified by sector and other factor rotations driving stock returns more than the fundamental results of a business. As shown in the chart to the right, the KCJ Index, which tracks the implied correlation between stocks in the S&P 500, recently touched a 10-year low of 14.4. This low correlation, high dispersion equity market backdrop bodes well for fundamental stock pickers looking to generate excess returns through company selection. We were encouraged to see our fundamentals-focused managers have a strong showing in regards to both absolute and relative performance as the market environment and breadth has improved. As always, we pay a great deal of attention to these broader macro-level factors not in an effort to time them but instead because they have predictive value for underlying strategy returns. Understanding those headwinds and tailwinds helps
-2.58%-2.11%
-6.0%
-4.0%
-2.0%
0.0%
1/3/
2017
1/27
/201
7
2/20
/201
7
3/16
/201
7
4/9/
2017
5/3/
2017
5/27
/201
7
6/20
/201
7
7/14
/201
7
8/7/
2017
8/31
/201
7
9/24
/201
7
Underwater Drawdown (2017)
S&P 500
14.40
20
40
60
80
100
120
1/3/
2007
9/3/
2007
5/3/
2008
1/3/
2009
9/3/
2009
5/3/
2010
1/3/
2011
9/3/
2011
5/3/
2012
1/3/
2013
9/3/
2013
5/3/
2014
1/3/
2015
9/3/
2015
5/3/
2016
1/3/
2017
9/3/
2017
KCJ Index (Jan 2007 - Oct 2017)
Source: CBOE
Source: Bloomberg
1

Annual Letter to Shareholders
Past performance is not indicative of future results.
us discern manager performance within the broader portfolio context. It is important to us to continue to view performance from more than just an absolute or purely volatility-adjusted perspective. Looking forward, we see a landscape that is largely bereft of outsized risk premiums. While many market observers are cautious on overall risk asset valuation levels, few see near-term drivers of downside risk on the fundamental front. While we could enumerate a laundry list of geopolitical risks, that is nearly always the case. What we see instead is a market that has continued to grind higher while credit spreads and risk premiums continue to tighten due to continued global central bank intervention to push investors out on the risk curve. While these environments are typically constructive for returns, our focus is always limiting the extent to which we depend on the continuation of these conducive market forces for positive performance.
Vivaldi Merger Arbitrage Fund (10/1/2016 – 9/30/2017) Investment Strategies and Techniques Used by Fund’s Investment Advisor
Under normal market conditions, the Vivaldi Merger Arbitrage Fund (the “Fund”) invests primarily in equity securities (publicly-traded common stock and preferred stock) of companies that are involved in a significant corporate event, and, in particular, a merger or acquisition. The Fund may invest in equity securities of any market capitalization, often investing in event-driven transactions as small as $100 million in transaction value, without limitation as to industry or sector. While the Fund may invest in both U.S. and non-U.S. securities, the Fund invests primarily in securities of U.S. and Canadian issuers. The basic idea behind the strategy is to capture the spread between the current price of a stock and the value offered via an acquisition. Typically, the target company’s stock price is expected to increase relative to the offer price while the share price of the acquiring company is expected to decline.
Key Performance Indicators (Financial and Non-Financial)
For the fiscal year ending September 30, 2017, the Vivaldi Merger Arbitrage Fund I Share (“VARBX”) returned +3.95% net of fees and +5.45% gross of fees while the A-Share (“VARAX”) returned +3.67% net of fees. The Fund showed a consistently positive return stream over the past fiscal year, demonstrated by the fact that a negative return was observed in only one month over that trailing twelve-month period. Over the same period, the S&P 500 Total Return Index (“SPXT”) gained +18.61% and the Fund’s benchmark, the Bloomberg Barclays US Aggregate Bond Index (the “Barclays Aggregate”), returned +0.07%. Also noteworthy and, as intended, the Fund’s return stream has continued to be highly uncorrelated with both the SPXT and the Barclays Aggregate Index. Exhibit(1), Exhibit(2), and Exhibit(3) show correlation to indices (TTM), risk statistics to indices (TTM), and historical returns respectively. A chart has also been added to show the volume of mergers and acquisitions for the past fiscal year as this effectively represents the opportunity set for the Fund.
2

Annual Letter to Shareholders
Past performance is not indicative of future results.
Performance quoted represents past performance and does not guarantee future results. Performance shown includes the performance of the unregistered Predecessor Fund (Incepted 4/1/2000) which converted its assets and performance into the Vivaldi Merger Arbitrage Fund on 10/01/2015. Investment return and principal value will fluctuate so that shares, when redeemed, may be worth more or less than their original cost. Current performance may be lower or higher than that shown here. The performance history is net of all fees and reflects the impact of the Contractual Waiver Agreement. If the Contractual Waiver Agreement were not in place, the Fund’s performance would be reduced. Performance data current to the most recent month-end is available at (877) 779-1999.
Current Portfolio Positioning (As of 9/30/2017)
The portfolio finished the fiscal year with approximately $531MM assets under management (“AUM”) and is currently positioned with a gross exposure of 101.05% along with a sizeable cash position set aside for newly-announced merger transactions. The remaining gross exposure of 101.1% is invested across 19 deals with the fund holding a long position in
RISK AND RETURN SUMMARY
VARBX BCS_AGG SPXT
Annualized Ret. 3.95% 0.07% 18.61%
Volatility 1.45% 3.16% 5.45%
Return/Risk 2.72 0.02 3.42
Worst Month -0.77% -2.37% -1.82%
Best Month 0.87% 0.90% 3.97%
Average Month 0.32% 0.01% 1.45%
Median Month 0.37% 0.17% 1.66%
Max Drawdown -1.84% -3.28% -1.82%
Positive Months 11 7 11
Negative Months 1 5 1
Exhibit 2
3

Annual Letter to Shareholders
Past performance is not indicative of future results.
all nineteen target companies and a short position in nine of the nineteen acquiring companies. As an aside, our merger arbitrage team hedges out the equity component of deals that include stock consideration via a straight short position on the acquirer company at the exact ratio present within the deal terms. The long positions that do not include a short pair are all-cash merger payments. In aggregate, these long, short, and cash positions put net exposure just shy of 81% net long. From a sector perspective, the overall gross long exposure is dominated by Healthcare; 29.04%, and Communications; 22.51% with a sharp decrease in density by sector from there. The top three holdings in the Fund, excluding cash, are Level 3 Communications (LVLT; 12.3%), C. R. Bard, Inc. (BCR; 10.0%), and NXP Semiconductors N.V (NXPI; 9.4%). It is important to note that VARBX has taken both sides of the trade in the LVLT and BCR deals by initiating a short position in the potential acquirer of LVLT, CenturyLink, (CTL; -5.8%) and a short position in the potential acquirer of BCR, Becton, Dickinson and Company (BDX; -3.0%). On the market cap spectrum, nine of the deals were $10bn+ in market cap with the remaining deals smaller in size. The fund owns nine small-cap, sub-$1bn (market cap) merger transactions.
Top Contributor
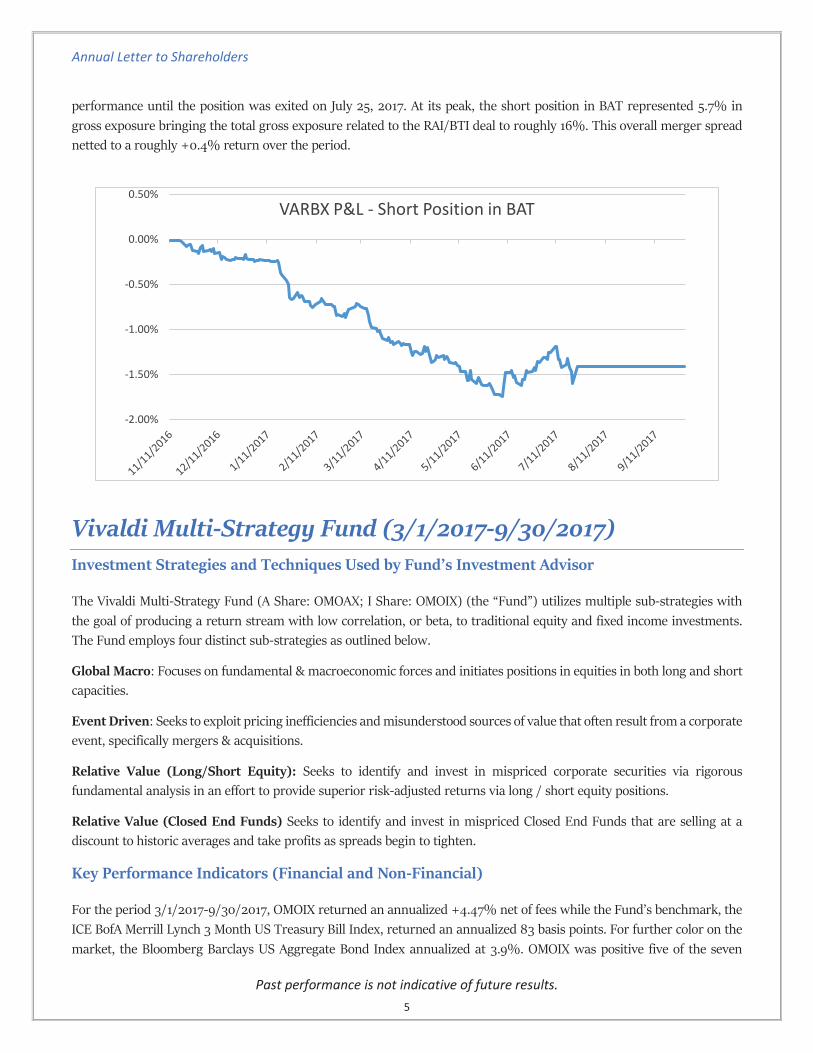
The top contributor to performance for the fiscal year ended 9/30/2017 was a long position in Reynolds American Inc (RAI). RAI is a tobacco company that received a cash and stock bid from British American Tobacco (BAT) to acquire the remaining 57.8% of RAI that BAT did not already own. The offer was announced at .5502 shares of BAT and $29.44 in cash per share of RAI. We initiated a position in mid-November of 2016 and held the shares until completion of the deal on July 25, 2017 generating +1.77% of attribution for the Fund. The position in RAI represented an approximate 10% gross exposure in the Fund at its peak size.
Top Detractor
The top detractor over the same fiscal year period was the corresponding short position we took in British American Tobacco (BAT), which produced a -1.4% return and negated much of the earnings from the long position in Reynolds American Inc. (RAI). The short position in BAT was initiated in mid-November of 2016 and detracted from Fund
0.00%
0.50%
1.00%
1.50%
2.00%
2.50%
VARBX P&L - Long Position in RAI
4
Annual Letter to Shareholders
Past performance is not indicative of future results.
performance until the position was exited on July 25, 2017. At its peak, the short position in BAT represented 5.7% in gross exposure bringing the total gross exposure related to the RAI/BTI deal to roughly 16%. This overall merger spread netted to a roughly +0.4% return over the period.
Vivaldi Multi-Strategy Fund (3/1/2017-9/30/2017) Investment Strategies and Techniques Used by Fund’s Investment Advisor
The Vivaldi Multi-Strategy Fund (A Share: OMOAX; I Share: OMOIX) (the “Fund”) utilizes multiple sub-strategies with the goal of producing a return stream with low correlation, or beta, to traditional equity and fixed income investments. The Fund employs four distinct sub-strategies as outlined below.
Global Macro: Focuses on fundamental & macroeconomic forces and initiates positions in equities in both long and short capacities.
Event Driven: Seeks to exploit pricing inefficiencies and misunderstood sources of value that often result from a corporate event, specifically mergers & acquisitions.
Relative Value (Long/Short Equity): Seeks to identify and invest in mispriced corporate securities via rigorous fundamental analysis in an effort to provide superior risk-adjusted returns via long / short equity positions.
Relative Value (Closed End Funds) Seeks to identify and invest in mispriced Closed End Funds that are selling at a discount to historic averages and take profits as spreads begin to tighten.
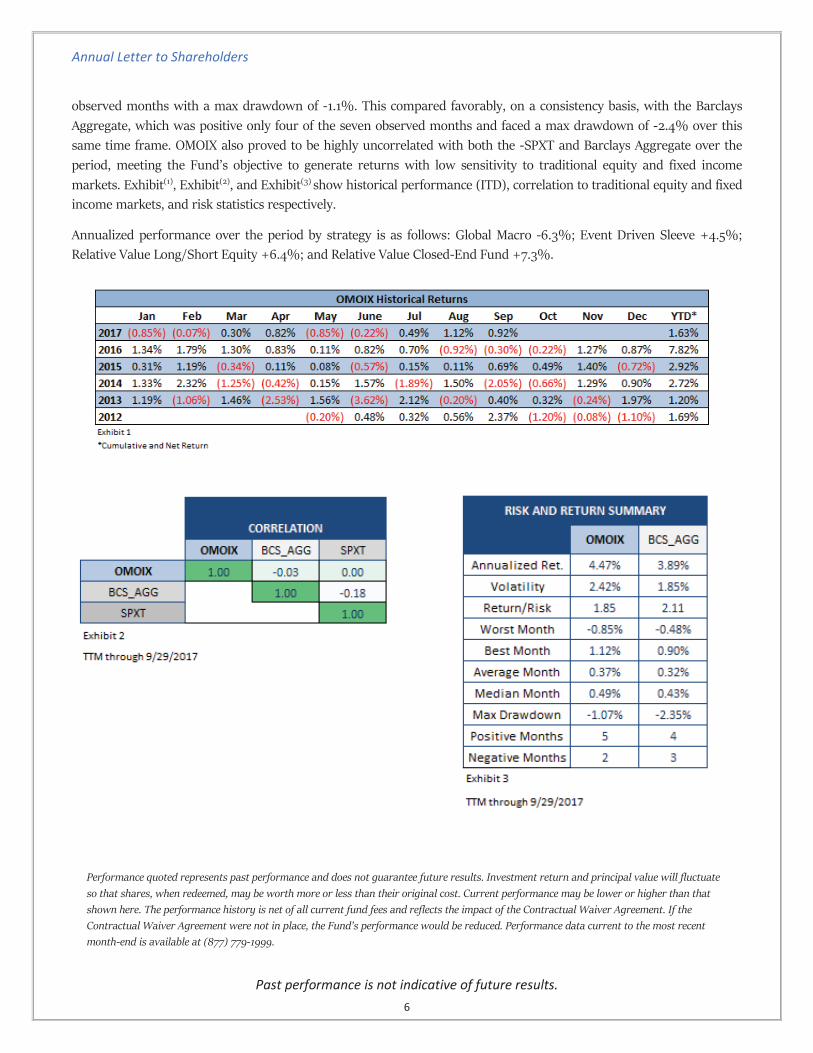
Key Performance Indicators (Financial and Non-Financial)
For the period 3/1/2017-9/30/2017, OMOIX returned an annualized +4.47% net of fees while the Fund’s benchmark, the ICE BofA Merrill Lynch 3 Month US Treasury Bill Index, returned an annualized 83 basis points. For further color on the market, the Bloomberg Barclays US Aggregate Bond Index annualized at 3.9%. OMOIX was positive five of the seven
-2.00%
-1.50%
-1.00%
-0.50%
0.00%
0.50%VARBX P&L - Short Position in BAT
5
Annual Letter to Shareholders
Past performance is not indicative of future results.
observed months with a max drawdown of -1.1%. This compared favorably, on a consistency basis, with the Barclays Aggregate, which was positive only four of the seven observed months and faced a max drawdown of -2.4% over this same time frame. OMOIX also proved to be highly uncorrelated with both the -SPXT and Barclays Aggregate over the period, meeting the Fund’s objective to generate returns with low sensitivity to traditional equity and fixed income markets. Exhibit(1), Exhibit(2), and Exhibit(3) show historical performance (ITD), correlation to traditional equity and fixed income markets, and risk statistics respectively.
Annualized performance over the period by strategy is as follows: Global Macro -6.3%; Event Driven Sleeve +4.5%; Relative Value Long/Short Equity +6.4%; and Relative Value Closed-End Fund +7.3%.
Performance quoted represents past performance and does not guarantee future results. Investment return and principal value will fluctuate so that shares, when redeemed, may be worth more or less than their original cost. Current performance may be lower or higher than that shown here. The performance history is net of all current fund fees and reflects the impact of the Contractual Waiver Agreement. If the Contractual Waiver Agreement were not in place, the Fund’s performance would be reduced. Performance data current to the most recent month-end is available at (877) 779-1999.
6

Annual Letter to Shareholders
Past performance is not indicative of future results.
Current Portfolio Positioning (As of 9/30/2017)
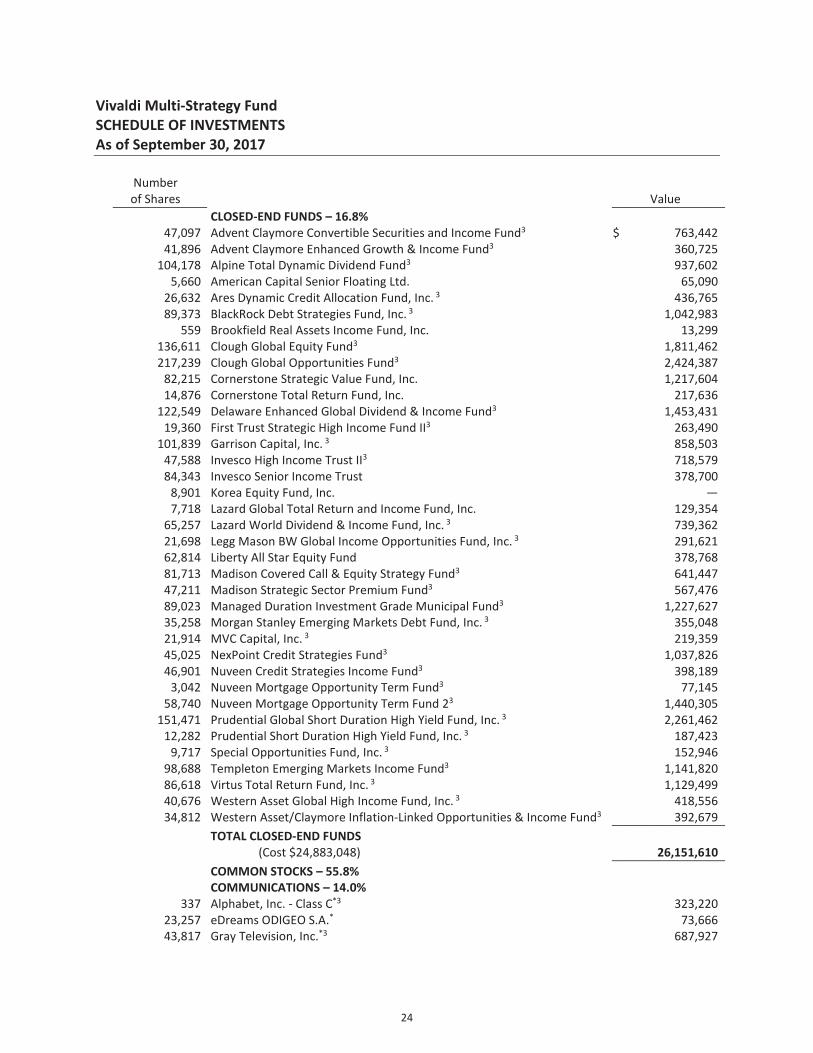
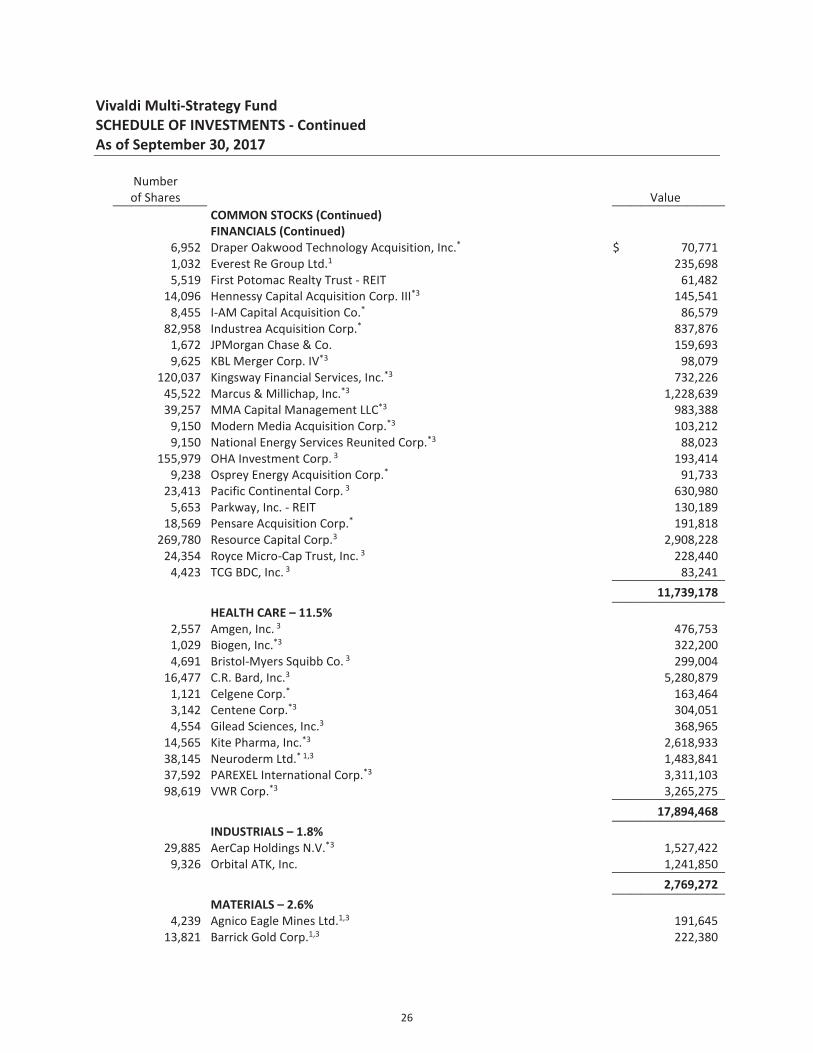
The Vivaldi Multi-Strategy Fund ended the period with approximately $156 million assets under management (“AUM”) and is currently positioned with a gross exposure of 109.3% and a net exposure of 40.56%. The remaining gross exposure is spread between 275+ positions across the sub-strategies mentioned above. The top three largest positions by gross exposures, excluding cash, are Level 3 Communications (LVLT; 4.1%), C R Bard Inc (BCR; 3.4%), and NXP Semiconductors NV (NXPI; 2.7%). The current allocation to each sub-strategy is outlined to the right. It is important to note that each sub-strategy may also hold a certain level of investment as cash within their allocation.
Top Contributor
The Fund’s top contributor over the period outlined in this report was Vishay Precision Group, Inc (VPG). The Fund’s relative value long/short equity manager sourced and allocated to VPG. The position was initiated in July of 2015 with its peak gross exposure of 2.9% being reached in November 2016. Gross exposure to VPG stands at 1.9% as of 9/30/2017 and over this fiscal period has generated +0.75% in performance.
Top Detractor
The Fund’s top detractor over the period outlined in this report was Quintis Ltd. (tickers: QIN AU & TFC AU). The Fund’s relative value long/short equity manager sourced and allocated to Quintis Ltd. The company traded under the two aforementioned tickers over the most recent fiscal period and represented upwards of 1.5% of the Fund’s gross exposure. The position(s) detracted, in aggregate, -67bps of P&L for the Fund. (See table below for more information.)
7

Annual Letter to Shareholders
Past performance is not indicative of future results.
WV Concentrated Equities Fund (4/28/2017-9/30/2017) Investment Strategies and Techniques Used by Fund’s Investment Advisor
The WV Concentrated Equities Fund (A Share: WVCAX; I Share: WVCIX) is a high-conviction portfolio, unconstrained by benchmarks, and is designed to grow wealth over the long-term. The Fund’s investment strategy is built upon the premise that deep fundamental research, a long-term investment horizon, and the use of a disciplined, intrinsic value framework leads to attractive investment returns.
-0.35%-0.30%-0.25%-0.20%-0.15%-0.10%-0.05%0.00%0.05%
OMOIX - Long Position in TFC AU
-0.50%
-0.40%
-0.30%
-0.20%
-0.10%
0.00%
0.10%3/1/2017 4/1/2017 5/1/2017 6/1/2017 7/1/2017 8/1/2017 9/1/2017
OMOIX P&L - Long Position in QIN AU
8

Annual Letter to Shareholders
Past performance is not indicative of future results.
Key Performance Indicators (Financial and Non-Financial)
For the period 04/28/2017-9/30/2017, WVCIX returned an annualized -1.23% with an annualized volatility of 9.2% while the S&P 500 Total Return Index returned an annualized 16.38% with an annualized volatility of 7.19% and the Russell 2500 Index returned an annualized 15.21% with an annualized volatility of 9.93%. One metric to note is the higher, and intended, level of correlation that the Fund exhibits to both the SPXT and Russell 2500 Index. Exhibit(1), Exhibit(2), and Exhibit(3) show the risk statistics, historical return, and correlation of the Fund and benchmarks from 4/28/2017-9/30/2017. It should also be noted the short time frame this performance covers – it is difficult to make meaningful extrapolations from such a small number of data points.
Current Portfolio Positioning (As of 9/30/2017)
The Fund ended the period with approximately $210 million assets under management (“AUM”) and is currently positioned with a gross exposure of 116.4%, 16.8% of which is held in cash, and a net exposure of 89.4%. The remaining gross exposure is spread across 47 positions, comprised of 34 long positions and 13 short positions. The top three largest long positions by gross exposure are in Resource Capital Corp (RSO; 5.6%), Berkshire Hathaway A-Share (BRK/A; 5.2%),
Performance quoted represents past performance and does not guarantee future results. Investment return and principal value will fluctuate so that shares, when redeemed, may be worth more or less than their original cost. Current performance may be lower or higher than that shown here. The performance history is net of all current fund fees and reflects the impact of the Contractual Waiver Agreement. If the Contractual Waiver Agreement were not in place, the Fund’s performance would be reduced. Performance data current to the most recent month-end is available at (877) 779-1999.
9

Annual Letter to Shareholders
Past performance is not indicative of future results.
and Potbelly Corp (PBPB; 5.2%). The top three largest short positions by gross exposure are the Canadian Dollar (CAD; -1.9%), BofI Holding, Inc. (BOFI; -1.4%), and Teladoc Inc (TDOC; -1.4%).
Top Contributor
The top performer for the period outlined in this report was Generac Holdings (GNRC). The position represented roughly 3% of the total book and was sold on September 21, 2017. The position generated +62bps for the Fund over its holding period.
Top Detractor
The single largest detractor for the Fund over this reporting period was a long position in Dicks Sporting Goods (DKS). The position represented as much as 4.0% of the portfolio’s gross exposure but was subsequently trimmed down from May through August. Our portfolio management team ultimately exited DKS on September 21, 2017. The stock detracted -1.6% from the Fund over the specified period.
-0.20%
-0.10%
0.00%
0.10%
0.20%
0.30%
0.40%
0.50%
0.60%
0.70%
4/28/2017 5/28/2017 6/28/2017 7/28/2017 8/28/2017
WVCIX - Long Position in GNRCV
-1.80%-1.60%-1.40%-1.20%-1.00%-0.80%-0.60%-0.40%-0.20%0.00%0.20%
4/28/2017 5/28/2017 6/28/2017 7/28/2017 8/28/2017
WVCIX P&L - Long Position in DKS
10

Annual Letter to Shareholders
Past performance is not indicative of future results.
As always, we thank you for your continued support and intend to work hard to maintain it.
Kind Regards,
Michael Peck, CFA Brian R. Murphy President & Co-Chief Investment Officer Portfolio Manager
The views were those of the Portfolio Fund Managers as of September 30, 2017, and may not reflect their views on the date this material is first published or anytime thereafter. These views are intended to assist the shareholders of the Funds in understanding their investments and do not constitute investment advice. This material may contain discussions about investments that may or may not be held by the Funds as of the date of this material. All current and future holdings are subject to risk and to change. Mutual fund investing involves risk. Principal loss is possible. Investments in companies that are the subject of a publicly announced transaction carry the risk that the proposed or expected transaction may not be completed or may be completed on less favorable terms than originally expected, which may lower the Funds’ performance. Investments in foreign securities involve greater volatility and political, economic, and currency risks and difference in accounting methods. These risks are greater for emerging markets. Investments in small and medium sized companies involve additional risks such as limited liquidity or greater volatility. Derivatives involve special risks including correlation, counterparty, liquidity, operational, accounting and tax risks. These risks, in certain cases, may be greater than the risks presented by more traditional investments. The Funds may make short sales of securities, which involves the risk that losses may exceed the original amount invested. The Funds may use leverage which may exaggerate the effect of any securities or the Net Asset Value of the Funds, and money borrowed will be subjected to interest costs. In the case of an investment in a potential acquisition target, if the proposed merger, exchange offer or cash tender offer appears likely not to be consummated, in fact is not consummated, or is delayed, the market price of the security to be tendered or exchanged will usually decline sharply, resulting in a loss to the Funds. If a put or call option purchased by one of the Funds expires without being sold or exercised, the Fund will lose the premium it paid for the option. The risk involved in writing a covered call option is the lack of liquidity for the option. The Funds are non-diversified, meaning they may concentrate their assets in fewer individual holdings than a diversified fund. Therefore, the Funds are more exposed to individual stock volatility than a diversified fund. The Funds may invest in mortgage backed securities that include additional risks that investors should be aware of such as credit risk, prepayment risk, possible illiquidity and default, as well as increased susceptibility to adverse economic developments. Multi-investment management styles may lead to higher transaction expenses compared to a single investment management styles. Outcomes depend on the skill of the sub-advisers and Funds (ETFs), which may trade at a discount to the aggregate value of the underlying securities, and, although expense ratios for ETFs are generally low, frequent trading of ETFs by the Fund can generate brokerage expenses. If an acquisition that meets the requirements for the SPAC is not completed within a pre-established period of time, the invested funds are returned to the entity’s shareholders, less certain permitted expenses, and any warrants issued by the SPAC will expire worthless. For a complete description of risks please read the prospectus.
11

Annual Letter to Shareholders
Past performance is not indicative of future results.
On 10/01/2015 the Highland Capital Management Institutional Fund, LLC, a Delaware limited liability company which commenced operations on April 1, 2000 (the "Predecessor Fund"), converted into the Vivaldi Merger Arbitrage Fund (1940 Act registered fund) pursuant to which the Predecessor Fund transferred substantially all of its assets into the Fund. The Fund's objectives, policies, guidelines and restrictions are, in all material respects, substantially the same as those of the Predecessor Fund. The Predecessor Fund was not registered under the 1940 Act and, therefore, was not subject to certain restrictions imposed by the 1940 Act on registered investment companies and by the Internal Revenue Code of 1986, as amended, on regulated investment companies, such as the Fund. Please review the prospectus for additional details.
The Funds’ investment objectives, risks, charges, and expenses must be considered carefully before investing. The summary or statutory prospectus contains this and other important information, and it may be obtained by calling 312.248.8300 or visiting vivaldifunds.com. Read the prospectus carefully before investing. Vivaldi Asset Management LLC is the Advisor to the Vivaldi Merger Arbitrage Fund, the Vivaldi Multi-Strategy Fund and the WV Concentrated Equities Fund which are distributed by IMST Distributors, LLC.
INDEX DEFINITIONS S&P 500 Index - The S&P 500 Index includes a representative sample of 500 leading companies in leading industries
of the U.S. economy.S&P 500 Total Return Index – The S&P 500 Total Return Index includes a representative sample of 500 leading
companies in leading industries of the U.S economy and assumes any dividends are reinvested back into the index.Bloomberg Barclays U.S. Aggregate Bond Index - The index is market capitalization weighted and includes Treasury
securities, Government agency bonds, Mortgage backed bonds and Corporate bonds. It excludes Municipal bonds andTreasury Inflation-Protected securities because of tax treatment.
Russell 2500 Index – A market cap weighted index featuring 2,500 stocks that cover small and mid-cap marketcapitalization companies.
ICE BofA Merrill Lynch 3 Month US Treasury Bill Index – An index which tracks the performance of the U.S. Dollardenominated U.S. Treasury Bills publicly issued in the U.S. Domestic Market with a remaining term to final maturityof less than 3 months.
GLOSSARYAlpha - The excess returns of a fund relative to the return of a benchmark index is the fund's alpha.Basis Points (bps) - one hundredth of one percent, used chiefly in expressing differences of interest rates.Beta - represents the systematic risk of a portfolio and measures its sensitivity to a benchmark.Correlation - represents the systematic risk of a portfolio and measures its sensitivity to a benchmark.Max Drawdown - is the maximum loss from a peak to a trough of a portfolio, before a new peak is attained and is an
indicator of downside risk over a specified period.Sharpe Ratio - a measure that uses standard deviation and excess return to determine reward per unit of risk. The
greater a fund’s Sharpe ratio, the better its risk-adjusted performance has been.Standard Deviation – the measure of how closely two securities perform in relation to one another.
12
.

Vivaldi Merger Arbitrage Fund FUND PERFORMANCE at September 30, 2017 (Unaudited)
This graph compares a hypothetical $500,000 investment in the Fund’s Class I shares, made at its inception, with a similar investment in the Bloomberg Barclays US Aggregate Bond Index and the S&P 500 Total Return Index. The performance graph above is shown for the Fund Class I shares, Class A shares performance may vary. Results include the reinvestment of all dividends and capital gains.
The Bloomberg Barclays US Aggregate Bond Index is market capitalization weighted and includes Treasury securities, Government agency bonds, Mortgage backed bonds and Corporate bonds. It excludes Municipal bonds and Treasury Inflation-Protected securities because of tax treatment. The S&P 500 Total Return Index includes a representative sample of 500 leading companies in leading industries of the U.S. economy and assumes any dividends are reinvested back into the index. These indices do not reflect expenses, fees or sales charge, which would lower performance. The indices are unmanaged and they are not available for investment.
Average Annual Total Returns as of September 30, 2017 1 Year 5 Years
10 Years Since
Inception Inception
Date Before deducting maximum sales charge Class A¹ 3.67% 3.77% 5.91% 10.48% 04/01/00 Class I² 3.95% 4.06% 6.19% 10.76% 04/01/00 After deducting maximum sales charge Class A¹ -2.33% 2.54% 5.29% 10.10% 04/01/00 Bloomberg Barclays US Aggregate Bond Index 0.07% 2.06% 4.27% 5.11% 04/01/00 S&P 500 Total Return Index 18.61% 14.22% 7.44% 5.04% 04/01/00 1 Maximum sales charge for Class A shares is 5.75%. 2 Class I shares do not have any initial or deferred sales charge. The performance data quoted here represents past performance and past performance is not a guarantee of future results. Investment return and principal value will fluctuate so that an investor’s shares, when redeemed, may be worth more or less than their original cost. Current performance may be lower or higher than the performance information quoted. The most recent month end performance may be obtained by calling (877) 779-1999. The Fund commenced investment operations on October 1, 2015, after the reorganization of Highland Capital Management Institutional Fund, LLC, a Delaware limited liability company which commenced operations on April 1, 2000 (the “Predecessor Fund”), into the Fund, pursuant to which the Predecessor Fund transferred substantially
$911,943
$759,803
$1,024,422
$300,000$400,000$500,000$600,000$700,000$800,000$900,000
$1,000,000$1,100,000
Performance of a $500,000 Investment
Vivaldi Merger Arbitrage Fund - Class I Bloomberg Barclays US Aggregate Bond IndexS&P 500 Total Return Index
13

Vivaldi Merger Arbitrage Fund FUND PERFORMANCE at September 30, 2017 (Unaudited) – Continued
all of its assets into the Fund. As a result of the reorganization, the Fund is the accounting successor of the Predecessor Fund. The Predecessor Fund was not registered under the 1940 Act and, therefore, was not subject to certain restrictions imposed by the 1940 Act on registered investment companies and by the Internal Revenue Code of 1986, as amended, on regulated investment companies such as the Fund. Performance results shown in the graph and the performance table above for the period prior to October 1, 2015 reflect the performance of the Predecessor Fund. Gross and net expense ratios for Class A shares were 2.78% and 2.62%, respectively, and for Class I shares were 2.47% and 2.31%, respectively, which were the amounts stated in the current prospectus dated February 1, 2017. For the Fund’s current one year expense ratios, please refer to the Financial Highlights section of this report. While the Fund’s advisor has contractually agreed to waive its fees and/or pay for operating expenses of the Fund to ensure that total annual fund operating expenses do not exceed 1.85% and 1.55% of the average daily net assets of the Fund’s Class A and Class I shares, respectively, such fee waiver of expense absorption was not necessary for the year ended September 30, 2017, as the annual fund expenses fell below its threshold. This agreement is in effect until January 31, 2018, and it may be terminated before that date only by the Trust’s Board of Trustees. In the absence of such waivers, the Fund’s returns would have been lower. Returns reflect the reinvestment of distributions made by the Fund, if any. The graph and the performance table shown do not reflect the deduction of taxes that a shareholder would pay on Fund distributions or the redemption of Fund shares. Shares redeemed within 30 days of purchase will be charged a redemption fee of 1.00%.
14

Vivaldi Multi-Strategy Fund FUND PERFORMANCE at September 30, 2017 (Unaudited)
This graph compares a hypothetical $100,000 investment in the Fund’s Class I shares, made at its inception, with a similar investment in the ICE BofA Merrill Lynch 3-Month U.S. Treasury Bill Index. The performance graph above is shown for the Fund Class I shares, Class A shares performance may vary. Results include the reinvestment of all dividends and capital gains.
The ICE BofA Merrill Lynch 3-Month U.S. Treasury Bill Index tracks the performance of the U.S. Dollar denominated U.S. Treasury Bills publicly issued in the U.S. Domestic Market with a remaining term to final maturity of less than 3 months. This index does not reflect expenses, fees or sales charges, which would lower performance. The index is unmanaged and it is not available for investment.
Average Annual Total Returns as of September 30, 2017 1 Year 3 Years
5 Years Since
Inception Inception
Date Before deducting maximum sales charge Class A¹ 3.26% 4.30% 2.43% 2.88% 04/30/12 Class I² 3.59% 4.64% 2.75% 3.20% 04/30/12 After deducting maximum sales charge Class A¹ -1.88% 2.53% 1.39% 1.91% 04/30/12 ICE BofA Merrill Lynch 3-Month U.S. Treasury Bill Index 0.66% 0.32% 0.22% 0.21% 04/30/12 1 Maximum sales charge for Class A shares is 5.00%. 2 Class I shares do not have any initial or deferred sales charge. The performance data quoted here represents past performance and past performance is not a guarantee of future results. Investment return and principal value will fluctuate so that an investor’s shares, when redeemed, may be worth more or less than their original cost. Current performance may be lower or higher than the performance information quoted. The most recent month end performance may be obtained by calling (877) 779-1999. The Fund commenced investment operations on December 16, 2016, after the reorganization of Vivaldi Orinda Macro Opportunities Fund, which commenced operations on April 30, 2012 (the “Predecessor Fund”), into the Fund, pursuant to which the Predecessor Fund transferred substantially all of its assets into the Fund. As a result of the reorganization, the Fund is the accounting successor of the Predecessor Fund. Performance results shown in
$118,623
$101,159
$60,000
$80,000
$100,000
$120,000
$140,000Performance of a $100,000 Investment
Vivaldi Multi-Strategy Fund - Class I ICE BofA Merrill Lynch 3-Month U.S. Treasury Bill Index
15

Vivaldi Multi-Strategy Fund FUND PERFORMANCE at September 30, 2017 (Unaudited) – Continued
the graph and the performance table above for the period prior to December 16, 2016 reflect the performance of the Predecessor Fund. The Fund’s expense ratios were 3.74% and 3.44% for Class A shares and Class I shares, respectively, which were the amounts stated in the current prospectus dated July 1, 2017. For the Fund’s current one year expense ratios, please refer to the Financial Highlights section of this report. The Fund’s advisor has contractually agreed to waive its fees and/or pay for operating expenses of the Fund to ensure that total annual fund operating expenses do not exceed 2.25% and 1.95% of the average daily net assets of the Fund’s Class A and Class I shares, respectively. This agreement is in effect until December 16, 2018, and it may be terminated before that date only by the Trust’s Board of Trustees. In the absence of such waivers, the Fund’s returns would have been lower. Returns reflect the reinvestment of distributions made by the Fund, if any. The graph and the performance table shown do not reflect the deduction of taxes that a shareholder would pay on Fund distributions or the redemption of Fund shares.
16

WV Concentrated Equities Fund FUND PERFORMANCE at September 30, 2017 (Unaudited)
This graph compares a hypothetical $500,000 investment in the Fund’s Class I shares, made at its inception, with a similar investment in the Russell 2500 Index and the S&P 500 Total Return Index. The performance graph above is shown for the Fund Class I shares, Class A shares performance may vary. Results include the reinvestment of all dividends and capital gains.
The Russell 2500 Index is a market cap weighted index featuring 2,500 stocks that cover small and mid-cap market capitalization companies. The S&P 500 Total Return Index includes a representative sample of 500 leading companies in leading industries of the U.S. economy and assumes any dividends are reinvested back into the index. These indices do not reflect expenses, fees or sales charges, which would lower performance. The indices are unmanaged and they are not available for investment.
Total Returns as of September 30, 2017 3 Months (Actual)
Since Inception
(Cumulative)
Inception
Date Before deducting maximum sales charge Class A¹ 0.89% -0.60% 04/28/17 Class I² 0.93% -0.52% 04/28/17 After deducting maximum sales charge Class A¹ -4.90% -6.33% 04/28/17 Russell 2500 Index 4.74% 6.16% 04/28/17 S&P 500 Total Return Index 4.48% 6.61% 04/28/17 1 Maximum sales charge for Class A shares is 5.75%. 2 Class I shares do not have any initial or deferred sales charge. The performance data quoted here represents past performance and past performance is not a guarantee of future results. Investment return and principal value will fluctuate so that an investor’s shares, when redeemed, may be worth more or less than their original cost. Current performance may be lower or higher than the performance information quoted. The most recent month end performance may be obtained by calling (877) 779-1999.
$497,400
$530,790 $533,060
$400,000
$450,000
$500,000
$550,000
$600,000Performance of a $500,000 Investment
WV Concentrated Equities Fund - Class I Russell 2500 Index S&P 500 Total Return Index
17

WV Concentrated Equities Fund FUND PERFORMANCE at September 30, 2017 (Unaudited) – Continued
The Fund’s expense ratios were 1.43% and 1.18% for Class A shares and Class I shares, respectively, which were the amounts stated in the current prospectus dated April 28, 2017. For the Fund’s current one year expense ratios, please refer to the Financial Highlights section of this report. The Fund’s advisor has contractually agreed to waive its fees and/or pay for operating expenses of the Fund to ensure that total annual fund operating expenses do not exceed 1.45% and 1.20% of the average daily net assets of the Fund’s Class A and Class I shares, respectively. This agreement is in effect until April 30, 2018, and it may be terminated before that date only by the Trust’s Board of Trustees. In the absence of such waivers, the Fund’s returns would have been lower. Returns reflect the reinvestment of distributions made by the Fund, if any. The graph and the performance table shown do not reflect the deduction of taxes that a shareholder would pay on Fund distributions or the redemption of Fund shares.
18

Vivaldi Merger Arbitrage Fund SCHEDULE OF INVESTMENTS As of September 30, 2017
Number of Shares Value __________ ____________
COMMON STOCKS – 80.8%
AEROSPACE/DEFENSE-EQUIPMENT – 2.6%
104,840 Orbital ATK, Inc. $ 13,960,494 ____________ COMMERCIAL BANKS-WESTERN US – 1.0%
197,128 Pacific Continental Corp.3 5,312,600 ____________ COMPUTER AIDED DESIGN – 0.9%
207,413 Exa Corp.* 5,015,246 ____________ COMPUTERS-INTEGRATED SYSTEMS – 2.2%
735,338 Silver Spring Networks, Inc.* 11,890,415 ____________ CONSULTING SERVICES – 2.2%
217,608 Advisory Board Co.* 11,669,229 ____________ DIAGNOSTIC EQUIPMENT – 4.7%
758,910 VWR Corp.*3 25,127,510 ____________ DIAMONDS/PRECIOUS STONES – 2.7%
996,682 Dominion Diamond Corp.1,3 14,132,951 ____________ DISPOSABLE MEDICAL PRODUCTS – 10.0%
165,854 C.R. Bard, Inc.3 53,156,207 ____________ MEDICAL-BIOMEDICAL/GENERICS – 5.2%
154,703 Kite Pharma, Inc.* 27,817,146 ____________ MEDICAL-DRUGS – 2.8%
381,242 Neuroderm Ltd.* 1,3 14,830,314 ____________ MULTIMEDIA – 8.4%
435,989 Time Warner, Inc. 44,667,073 ____________ OIL COMP-EXPLORATION & PRODUCTION – 4.8%
884,689 Rice Energy, Inc.* 25,602,900 ____________ OIL REFINING & MARKETING – 2.6%
535,562 Western Refining Logistics LP 13,817,500 ____________ REITS-OFFICE PROPERTY – 0.4%
54,582 First Potomac Realty Trust - REIT 608,044
61,747 Parkway, Inc. - REIT 1,422,033 ____________ 2,030,077 ____________ RESEARCH & DEVELOPMENT – 6.3%
377,646 PAREXEL International Corp.*3 33,263,060 ____________ RETAIL-DISCOUNT – 0.5%
67,959 HSN, Inc. 2,653,799 ____________ SEMICON COMPONENTS-INTEGRATED CIRCUITS – 9.4%
439,958 NXP Semiconductors N.V.* 1 49,754,850 ____________ TELECOM SERVICE – 14.1%
1,221,546 Level 3 Communications, Inc.*3 65,096,186
19

Vivaldi Merger Arbitrage Fund SCHEDULE OF INVESTMENTS - Continued As of September 30, 2017
Number of Shares Value __________ ____________
COMMON STOCKS (Continued) TELECOM SERVICE (Continued) 53,979 Straight Path Communications, Inc. - Class B*3 $ 9,752,386 ____________ 74,848,572 ____________
TOTAL COMMON STOCKS (Cost $419,391,174) 429,549,943 ____________
Number
of Contracts __________ PURCHASED OPTIONS CONTRACTS – 0.0%
CALL OPTIONS – 0.0%
AT&T, Inc.
598
Exercise Price: $39.00, Notional Amount: $2,332,200, Expiration Date: January 19, 2018 74,750
NXP Semiconductors N.V.
371
Exercise Price: $110.00, Notional Amount: $4,081,000, Expiration Date: October 20, 2017 122,430 ____________
TOTAL CALL OPTIONS (Cost $151,206) 197,180 ____________
PUT OPTIONS – 0.0%
NXP Semiconductors N.V.
319
Exercise Price: $110.00, Notional Amount: $3,509,000, Expiration Date: December 15, 2017 25,520 ____________
TOTAL PUT OPTIONS (Cost $60,622) 25,520 ____________
TOTAL PURCHASED OPTIONS CONTRACTS (Cost $211,828) 222,700 ____________
Number of Shares __________
SHORT-TERM INVESTMENTS – 21.9%
116,292,274
Morgan Stanley Institutional Liquidity Fund - Government Portfolio -
Institutional Class, 0.89%2,3 116,292,274 ____________
TOTAL SHORT-TERM INVESTMENTS (Cost $116,292,274) 116,292,274 ____________
TOTAL INVESTMENTS – 102.7% (Cost $535,895,276) 546,064,917
Liabilities in Excess of Other Assets – (2.7)% (14,215,402) ____________ TOTAL NET ASSETS – 100.0% $ 531,849,515 ________________________ SECURITIES SOLD SHORT – (20.1)%
COMMON STOCKS – (20.1)%
COMMERCIAL BANKS-WESTERN US – (1.0)%
(126,753) Columbia Banking System, Inc. $ (5,337,569) ____________
20

Vivaldi Merger Arbitrage Fund SCHEDULE OF INVESTMENTS - Continued As of September 30, 2017
Number of Shares Value __________ ____________
SECURITIES SOLD SHORT (Continued) COMMON STOCKS (Continued) ENTERPRISE SOFTWARE/SERVICE – (0.1)%
(20,042) Evolent Health, Inc. - Class A* $ (356,748) ____________ MEDICAL PRODUCTS – (3.1)%
(84,216) Becton, Dickinson and Co. (16,502,125) ____________ OIL COMP-EXPLORATION & PRODUCTION – (4.0)%
(327,335) EQT Corp. (21,355,335) ____________ PIPELINES – (2.6)%
(280,260) Andeavor Logistics LP (14,029,816) ____________ RETAIL-CATALOG SHOPPING – (0.5)%
(112,008) Liberty Interactive Corp. QVC Group - Class A* (2,640,028) ____________ TELEPHONE-INTEGRATED – (8.8)%
(352,984) AT&T, Inc. (13,826,383)
(1,745,101) CenturyLink, Inc. (32,982,409) ____________ (46,808,792) ____________
TOTAL COMMON STOCKS (Proceeds $109,089,828) (107,030,413) ____________
TOTAL SECURITIES SOLD SHORT (Proceeds $109,089,828) $ (107,030,413) ________________________
Number
of Contracts __________ WRITTEN OPTIONS CONTRACTS – 0.0%
CALL OPTIONS – 0.0%
Straight Path Communications, Inc. (116)
Exercise Price: $180.00, Notional Amount: $(2,088,000), Expiration Date: November 17, 2017* $ (21,750)
(52)
Exercise Price: $180.00, Notional Amount: $(936,000), Expiration Date: December 15, 2017* (13,650)
(82)
Exercise Price: $180.00, Notional Amount: $(1,476,000), Expiration Date: October 20, 2017* (11,685) ____________
TOTAL CALL OPTIONS (Proceeds $42,688) (47,085) ____________
TOTAL WRITTEN OPTIONS CONTRACTS (Proceeds $42,688) $ (47,085) ________________________
LP – Limited Partnership REIT – Real Estate Investment Trust * Non-income producing security. 1 Foreign security denominated in U.S. Dollars. 2 The rate is the annualized seven-day yield at period end.
21

Vivaldi Merger Arbitrage Fund SCHEDULE OF INVESTMENTS - Continued As of September 30, 2017 3 All or a portion of this security is segregated as collateral for securities sold short and written options contracts.
See accompanying Notes to Financial Statements.
22

Vivaldi Merger Arbitrage Fund SUMMARY OF INVESTMENTS As of September 30, 2017
Security Type/Sector Percent of Total
Net Assets Common Stocks
Telecom Service 14.1% Disposable Medical Products 10.0% Semicon Components-Integrated Circuits 9.4% Multimedia 8.4% Research & Development 6.3% Medical-Biomedical/Generics 5.2% Oil Comp-Exploration & Production 4.8% Diagnostic Equipment 4.7% Medical-Drugs 2.8% Diamonds/Precious Stones 2.7% Aerospace/Defense-Equipment 2.6% Oil Refining & Marketing 2.6% Computers-Integrated Systems 2.2% Consulting Services 2.2% Commercial Banks-Western US 1.0% Computer Aided Design 0.9% Retail-Discount 0.5% REITS-Office Property 0.4% __________
Total Common Stocks 80.8% Purchased Options Contracts 0.0% Short-Term Investments 21.9% __________Total Investments 102.7% Liabilities in Excess of Other Assets (2.7)% __________Total Net Assets 100.0% ____________________
See accompanying Notes to Financial Statements.
23
Vivaldi Multi-Strategy Fund SCHEDULE OF INVESTMENTS As of September 30, 2017
Number of Shares Value __________ ____________
CLOSED-END FUNDS – 16.8%
47,097 Advent Claymore Convertible Securities and Income Fund3 $ 763,442
41,896 Advent Claymore Enhanced Growth & Income Fund3 360,725
104,178 Alpine Total Dynamic Dividend Fund3 937,602
5,660 American Capital Senior Floating Ltd. 65,090
26,632 Ares Dynamic Credit Allocation Fund, Inc. 3 436,765
89,373 BlackRock Debt Strategies Fund, Inc. 3 1,042,983
559 Brookfield Real Assets Income Fund, Inc. 13,299
136,611 Clough Global Equity Fund3 1,811,462
217,239 Clough Global Opportunities Fund3 2,424,387
82,215 Cornerstone Strategic Value Fund, Inc. 1,217,604
14,876 Cornerstone Total Return Fund, Inc. 217,636
122,549 Delaware Enhanced Global Dividend & Income Fund3 1,453,431
19,360 First Trust Strategic High Income Fund II3 263,490
101,839 Garrison Capital, Inc. 3 858,503
47,588 Invesco High Income Trust II3 718,579
84,343 Invesco Senior Income Trust 378,700
8,901 Korea Equity Fund, Inc. —
7,718 Lazard Global Total Return and Income Fund, Inc. 129,354
65,257 Lazard World Dividend & Income Fund, Inc. 3 739,362
21,698 Legg Mason BW Global Income Opportunities Fund, Inc. 3 291,621
62,814 Liberty All Star Equity Fund 378,768
81,713 Madison Covered Call & Equity Strategy Fund3 641,447
47,211 Madison Strategic Sector Premium Fund3 567,476
89,023 Managed Duration Investment Grade Municipal Fund3 1,227,627
35,258 Morgan Stanley Emerging Markets Debt Fund, Inc. 3 355,048
21,914 MVC Capital, Inc. 3 219,359
45,025 NexPoint Credit Strategies Fund3 1,037,826
46,901 Nuveen Credit Strategies Income Fund3 398,189
3,042 Nuveen Mortgage Opportunity Term Fund3 77,145
58,740 Nuveen Mortgage Opportunity Term Fund 23 1,440,305
151,471 Prudential Global Short Duration High Yield Fund, Inc. 3 2,261,462
12,282 Prudential Short Duration High Yield Fund, Inc. 3 187,423
9,717 Special Opportunities Fund, Inc. 3 152,946
98,688 Templeton Emerging Markets Income Fund3 1,141,820
86,618 Virtus Total Return Fund, Inc. 3 1,129,499
40,676 Western Asset Global High Income Fund, Inc. 3 418,556
34,812 Western Asset/Claymore Inflation-Linked Opportunities & Income Fund3 392,679 ____________
TOTAL CLOSED-END FUNDS (Cost $24,883,048) 26,151,610 ____________
COMMON STOCKS – 55.8%
COMMUNICATIONS – 14.0%
337 Alphabet, Inc. - Class C*3 323,220
23,257 eDreams ODIGEO S.A.* 73,666
43,817 Gray Television, Inc.*3 687,927
24

Vivaldi Multi-Strategy Fund SCHEDULE OF INVESTMENTS - Continued As of September 30, 2017
Number of Shares Value __________ ____________
COMMON STOCKS (Continued) COMMUNICATIONS (Continued) 90,548 IMAX Corp.*3 $ 2,050,912
119,435 Level 3 Communications, Inc.*3 6,364,691
91,238 Liberty Global PLC LiLAC - Class A*3 2,167,815
18,321 Liberty Global PLC LiLAC - Class C*3 426,879
131,526 National CineMedia, Inc.3 918,052
27,323 Nexstar Broadcasting Group, Inc.3 1,702,223
88 Priceline Group, Inc.* 161,112
7,115 Straight Path Communications, Inc. - Class B*3 1,285,467
32,385 TEGNA, Inc. 3 431,692
38,161 Time Warner, Inc. 3,909,594
38,400 Twenty-First Century Fox, Inc. 3 1,012,992
15,355 Twitter, Inc.* 259,039 ____________ 21,775,281 ____________ CONSUMER DISCRETIONARY – 4.2%
21,025 Advisory Board Co.* 1,127,466
32,479 DR Horton, Inc. 1,296,886
222,416 Drive Shack, Inc. 802,922
10,345 Francesca's Holdings Corp.* 76,139
3,928 General Motors Co. 158,613
7,849 HSN, Inc. 306,503
355,067 Imvescor Restaurant Group, Inc. 3 1,055,697
5,208 MDC Holdings, Inc. 172,958
116,904 Potbelly Corp.*3 1,449,610
3,954 Toll Brothers, Inc. 163,972 ____________ 6,610,766 ____________ CONSUMER STAPLES – 1.4%
121,965 Darling Ingredients, Inc.*3 2,136,827 ____________ ENERGY – 3.5%
7,546 Cabot Oil & Gas Corp. 3 201,856
27,900 Kinder Morgan Canada Ltd. 387,264
77,298 Rice Energy, Inc.* 2,237,004
64,250 Silver Spring Networks, Inc.* 1,038,922
4,413 SolarEdge Technologies, Inc.* 125,991
17,027 Transocean Ltd.* 1 183,211
50,421 Western Refining Logistics LP 1,300,862 ____________ 5,475,110 ____________ FINANCIALS – 7.5%
20,416 Andina Acquisition Corp. II* 207,427
26,258 Ares Capital Corp. 3 430,369
8,451 Atlantic Acquisition Corp.* 86,876
6 Berkshire Hathaway, Inc. - Class A*3 1,648,440
7,531 Constellation Alpha Capital Corp.*3 76,816
25
Vivaldi Multi-Strategy Fund SCHEDULE OF INVESTMENTS - Continued As of September 30, 2017
Number of Shares Value __________ ____________
COMMON STOCKS (Continued) FINANCIALS (Continued) 6,952 Draper Oakwood Technology Acquisition, Inc.* $ 70,771
1,032 Everest Re Group Ltd.1 235,698
5,519 First Potomac Realty Trust - REIT 61,482
14,096 Hennessy Capital Acquisition Corp. III*3 145,541
8,455 I-AM Capital Acquisition Co.* 86,579
82,958 Industrea Acquisition Corp.* 837,876
1,672 JPMorgan Chase & Co. 159,693
9,625 KBL Merger Corp. IV*3 98,079
120,037 Kingsway Financial Services, Inc.*3 732,226
45,522 Marcus & Millichap, Inc.*3 1,228,639
39,257 MMA Capital Management LLC*3 983,388
9,150 Modern Media Acquisition Corp.*3 103,212
9,150 National Energy Services Reunited Corp.*3 88,023
155,979 OHA Investment Corp. 3 193,414
9,238 Osprey Energy Acquisition Corp.* 91,733
23,413 Pacific Continental Corp. 3 630,980
5,653 Parkway, Inc. - REIT 130,189
18,569 Pensare Acquisition Corp.* 191,818
269,780 Resource Capital Corp.3 2,908,228
24,354 Royce Micro-Cap Trust, Inc. 3 228,440
4,423 TCG BDC, Inc. 3 83,241 ____________ 11,739,178 ____________ HEALTH CARE – 11.5%
2,557 Amgen, Inc. 3 476,753
1,029 Biogen, Inc.*3 322,200
4,691 Bristol-Myers Squibb Co. 3 299,004
16,477 C.R. Bard, Inc.3 5,280,879
1,121 Celgene Corp.* 163,464
3,142 Centene Corp.*3 304,051
4,554 Gilead Sciences, Inc.3 368,965
14,565 Kite Pharma, Inc.*3 2,618,933
38,145 Neuroderm Ltd.* 1,3 1,483,841
37,592 PAREXEL International Corp.*3 3,311,103
98,619 VWR Corp.*3 3,265,275 ____________ 17,894,468 ____________ INDUSTRIALS – 1.8%
29,885 AerCap Holdings N.V.*3 1,527,422
9,326 Orbital ATK, Inc. 1,241,850 ____________ 2,769,272 ____________ MATERIALS – 2.6%
4,239 Agnico Eagle Mines Ltd.1,3 191,645
13,821 Barrick Gold Corp.1,3 222,380
26

Vivaldi Multi-Strategy Fund SCHEDULE OF INVESTMENTS - Continued As of September 30, 2017
Number of Shares Value __________ ____________
COMMON STOCKS (Continued) MATERIALS (Continued) 7,157 Detour Gold Corp.* 1,3 $ 79,013
101,284 Dominion Diamond Corp.1,3 1,436,207
1,662 Eagle Materials, Inc. 177,335
9,803 Fortuna Silver Mines, Inc.* 1,3 42,937
17,656 Goldcorp, Inc.1 228,822
23,428 Hecla Mining Co.3 117,609
24,828 IAMGOLD Corp.* 1 151,451
29,510 Kinross Gold Corp.* 1,3 125,122
17,600 Kirkland Lake Gold Ltd.1,3 227,392
9,647 Newmont Mining Corp. 3 361,859
10,851 Pan American Silver Corp.1,3 185,010
2,312 Randgold Resources Ltd. – ADR3 225,790
22,874 SSR Mining, Inc.* 1,3 242,693
12,298 Tahoe Resources, Inc.1 64,811 ____________ 4,080,076 ____________ TECHNOLOGY – 7.8%
1,076 Adobe Systems, Inc.* 160,518
1,523 Apple, Inc. 3 234,725
2,864 Check Point Software Technologies Ltd.* 1,3 326,553
18,070 Exa Corp.* 436,933
1,313 F5 Networks, Inc.* 158,295
7,376 Fortinet, Inc.*3 264,356
3,530 Imperva, Inc.* 153,202
11,128 Infosys Ltd. - ADR 162,358
4,299 Juniper Networks, Inc. 3 119,641
32,457 Loral Space & Communications, Inc.*3 1,606,621
3,515 Microsoft Corp. 3 261,832
37,727 NXP Semiconductors N.V.* 1 4,266,546
1,949 Palo Alto Networks, Inc.* 280,851
1,459 Red Hat, Inc.* 161,745
24,108 TTM Technologies, Inc.* 370,540
122,581 Vishay Precision Group, Inc.*3 2,990,976
1,650 VMware, Inc. - Class A* 180,164 ____________ 12,135,856 ____________ UTILITIES – 1.5%
65,095 Atlantica Yield PLC3 1,282,372
473,916 Maxim Power Corp.*3 1,014,069 ____________ 2,296,441 ____________
TOTAL COMMON STOCKS (Cost $80,581,366) 86,913,275 ____________
27

Vivaldi Multi-Strategy Fund SCHEDULE OF INVESTMENTS - Continued As of September 30, 2017
Number of Shares Value __________ ____________
PREFERRED STOCKS – 1.8%
FINANCIALS – 1.8%
15,000 B. Riley Financial, Inc.
7.500%, 5/31/273 $ 384,000
9,932 B. Riley Financial, Inc.
7.500%, 10/31/21 256,941
2,402 Capitala Finance Corp.
5.750%, 5/31/22 59,954
2,700 Great Elm Capital Corp.
8.250%, 6/30/203 67,689
5,893 Harvest Capital Credit Corp.
6.125%, 9/15/22 149,682
16,752 KCAP Financial, Inc.
6.125%, 9/30/22 418,465
6,407 Stellus Capital Investment Corp.
5.750%, 9/15/22 163,058
2,964 THL Credit, Inc.
6.750%, 12/30/223 76,471
1,824 THL Credit, Inc.
6.750%, 11/15/213 45,929
38,139 TICC Capital Corp.
6.500%, 3/30/24 997,716
6,972 TriplePoint Venture Growth BDC Corp.
5.750%, 7/15/22 176,252 ____________ 2,796,157 ____________
TOTAL PREFERRED STOCKS (Cost $2,728,504) 2,796,157 ____________
Number
of Contracts __________ PURCHASED OPTIONS CONTRACTS – 0.0%
CALL OPTIONS – 0.0%
AT&T, Inc.
52
Exercise Price: $39.00, Notional Amount: $202,800, Expiration Date: January 19, 2018 6,500
NXP Semiconductors N.V.
37
Exercise Price: $110.00, Notional Amount: $407,000, Expiration Date: October 20, 2017 12,210 ____________
TOTAL CALL OPTIONS (Cost $14,733) 18,710 ____________
PUT OPTIONS – 0.0%
NXP Semiconductors N.V.
30
Exercise Price: $110.00, Notional Amount: $330,000, Expiration Date: December 15, 2017 2,400
28

Vivaldi Multi-Strategy Fund SCHEDULE OF INVESTMENTS - Continued As of September 30, 2017
Number
of Contracts Value __________ ____________ PURCHASED OPTIONS CONTRACTS (Continued) PUT OPTIONS (Continued) SPDR Bloomberg Barclays High Yield Bond ETF
248
Exercise Price: $37.00, Notional Amount: $917,600, Expiration Date: January 19, 2018 $ 15,500
VanEck Vectors Semiconductor ETF
220
Exercise Price: $88.00, Notional Amount: $1,936,000, Expiration Date: November 17, 2017 21,780 ____________
TOTAL PUT OPTIONS (Cost $141,608) 39,680 ____________
TOTAL PURCHASED OPTIONS CONTRACTS (Cost $156,341) 58,390 ____________
Number of Shares __________
RIGHTS – 0.0%
225 Reaves Utility Income Fund, Expiration Date: October 4, 2017* 84 ____________
TOTAL RIGHTS (Cost $28) 84 ____________
WARRANTS – 0.0%
9,150 National Energy Services Reunited Corp., Expiration Date: June 5, 2022* 4,573 ____________
TOTAL WARRANTS (Cost $5,033) 4,573 ____________
SHORT-TERM INVESTMENTS – 27.1%
42,126,780
Morgan Stanley Institutional Liquidity Fund - Government Portfolio -
Institutional Class, 0.89%2,3 42,126,780 ____________
TOTAL SHORT-TERM INVESTMENTS (Cost $42,126,780) 42,126,780 ____________
TOTAL INVESTMENTS – 101.5% (Cost $150,481,100) 158,050,869
Liabilities in Excess of Other Assets – (1.5)% (2,358,655) ____________ TOTAL NET ASSETS – 100.0% $ 155,692,214 ________________________ SECURITIES SOLD SHORT – (33.2)%
COMMON STOCKS – (25.4)%
COMMUNICATIONS – (4.9)%
(30,882) AT&T, Inc. $ (1,209,648)
(29,018) Beasley Broadcast Group, Inc. (339,511)
(30,900) Blucora, Inc.* (781,770)
(170,624) CenturyLink, Inc. (3,224,794)
(16,692) Criteo S.A.* (692,718)
(890) Netflix, Inc.* (161,401)
(3,130) Saga Communications, Inc. (142,728)
29

Vivaldi Multi-Strategy Fund SCHEDULE OF INVESTMENTS - Continued As of September 30, 2017
Number of Shares Value __________ ____________
SECURITIES SOLD SHORT (Continued) COMMON STOCKS (Continued) COMM N CATIONS (Continued)
(9,500) Tribune Media Co. $ (388,170)(16,224) TrueCar, Inc.* (256,177)
(7,140) Tucows, Inc.* (418,047) ____________ (7,614,964) ____________
CONSUMER DISCRETIONARY – (4.3)%(10,222) Aaron's, Inc. (445,986)
(943) Alibaba Group Holding Ltd. - ADR* (162,865)(273) AutoZone, Inc.* (162,465)
(4,219) Avis Budget Group, Inc.* (160,575)(3,265) Cavco Industries, Inc.* (481,751)(1,834) Domino's Pizza, Inc. (364,141)
(11,371) Freshpet, Inc.* (177,956)(7,096) Hertz Global Holdings, Inc.* (158,666)
(12,950) Liberty Interactive Corp. QVC Group - Class A* (305,231)(12,674) Matthews International Corp. (788,956)
(1,556) McDonald's Corp. (243,794)(2,649) Nutrisystem, Inc. (148,079)
(561) O'Reilly Automotive, Inc.* (120,823)(5,703) Oxford Industries, Inc. (362,369)(4,800) Papa John's International, Inc. (350,736)(8,078) Restaurant Brands International, Inc. (516,023)(5,500) RH* (386,760)(3,335) Royal Caribbean Cruises Ltd. (395,331)(1,117) Tesla Motors, Inc.* (381,009)
(19,059) Wingstop, Inc. (633,712) ____________ (6,747,228) ____________
CONSUMER STAPLES – (1.0)%(19,265) Blue Buffalo Pet Products, Inc.* (546,163)
(2,254) Colgate-Palmolive Co. (164,204)(1,052) Costco Wholesale Corp. (172,833)(1,509) Hershey Co. (164,738)
(640) J&J Snack Foods Corp. (84,032)(2,447) Kellogg Co. (152,619)(1,970) Kraft Heinz Co. (152,773)(3,806) Mondelez International, Inc. - Class A (154,752) ____________
(1,592,114) ____________ENERGY – (2.0)%
(26,385) Andeavor Logistics LP (1,320,833)(28,600) EQT Corp. (1,865,864) ____________
(3,186,697) ____________
30
IU
Vivaldi Multi-Strategy Fund SCHEDULE OF INVESTMENTS - Continued As of September 30, 2017
Number of Shares Value __________ ____________
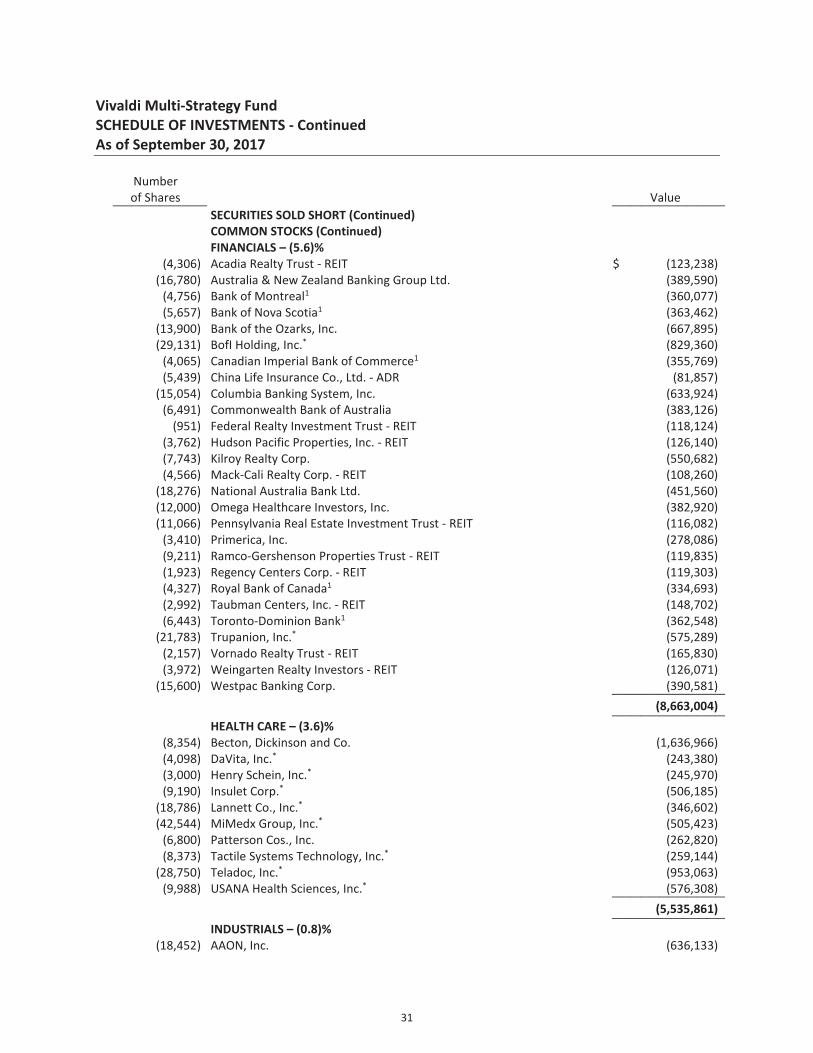
SECURITIES SOLD SHORT (Continued) COMMON STOCKS (Continued) FINANCIALS – (5.6)%
(4,306) Acadia Realty Trust - REIT $ (123,238)
(16,780) Australia & New Zealand Banking Group Ltd. (389,590)
(4,756) Bank of Montreal1 (360,077)
(5,657) Bank of Nova Scotia1 (363,462)
(13,900) Bank of the Ozarks, Inc. (667,895)
(29,131) BofI Holding, Inc.* (829,360)
(4,065) Canadian Imperial Bank of Commerce1 (355,769)
(5,439) China Life Insurance Co., Ltd. - ADR (81,857)
(15,054) Columbia Banking System, Inc. (633,924)
(6,491) Commonwealth Bank of Australia (383,126)
(951) Federal Realty Investment Trust - REIT (118,124)
(3,762) Hudson Pacific Properties, Inc. - REIT (126,140)
(7,743) Kilroy Realty Corp. (550,682)
(4,566) Mack-Cali Realty Corp. - REIT (108,260)
(18,276) National Australia Bank Ltd. (451,560)
(12,000) Omega Healthcare Investors, Inc. (382,920)
(11,066) Pennsylvania Real Estate Investment Trust - REIT (116,082)
(3,410) Primerica, Inc. (278,086)
(9,211) Ramco-Gershenson Properties Trust - REIT (119,835)
(1,923) Regency Centers Corp. - REIT (119,303)
(4,327) Royal Bank of Canada1 (334,693)
(2,992) Taubman Centers, Inc. - REIT (148,702)
(6,443) Toronto-Dominion Bank1 (362,548)
(21,783) Trupanion, Inc.* (575,289)
(2,157) Vornado Realty Trust - REIT (165,830)
(3,972) Weingarten Realty Investors - REIT (126,071)
(15,600) Westpac Banking Corp. (390,581) ____________ (8,663,004) ____________ HEALTH CARE – (3.6)%
(8,354) Becton, Dickinson and Co. (1,636,966)
(4,098) DaVita, Inc.* (243,380)
(3,000) Henry Schein, Inc.* (245,970)
(9,190) Insulet Corp.* (506,185)
(18,786) Lannett Co., Inc.* (346,602)
(42,544) MiMedx Group, Inc.* (505,423)
(6,800) Patterson Cos., Inc. (262,820)
(8,373) Tactile Systems Technology, Inc.* (259,144)
(28,750) Teladoc, Inc.* (953,063)
(9,988) USANA Health Sciences, Inc.* (576,308) ____________ (5,535,861) ____________ INDUSTRIALS – (0.8)%
(18,452) AAON, Inc. (636,133)
31
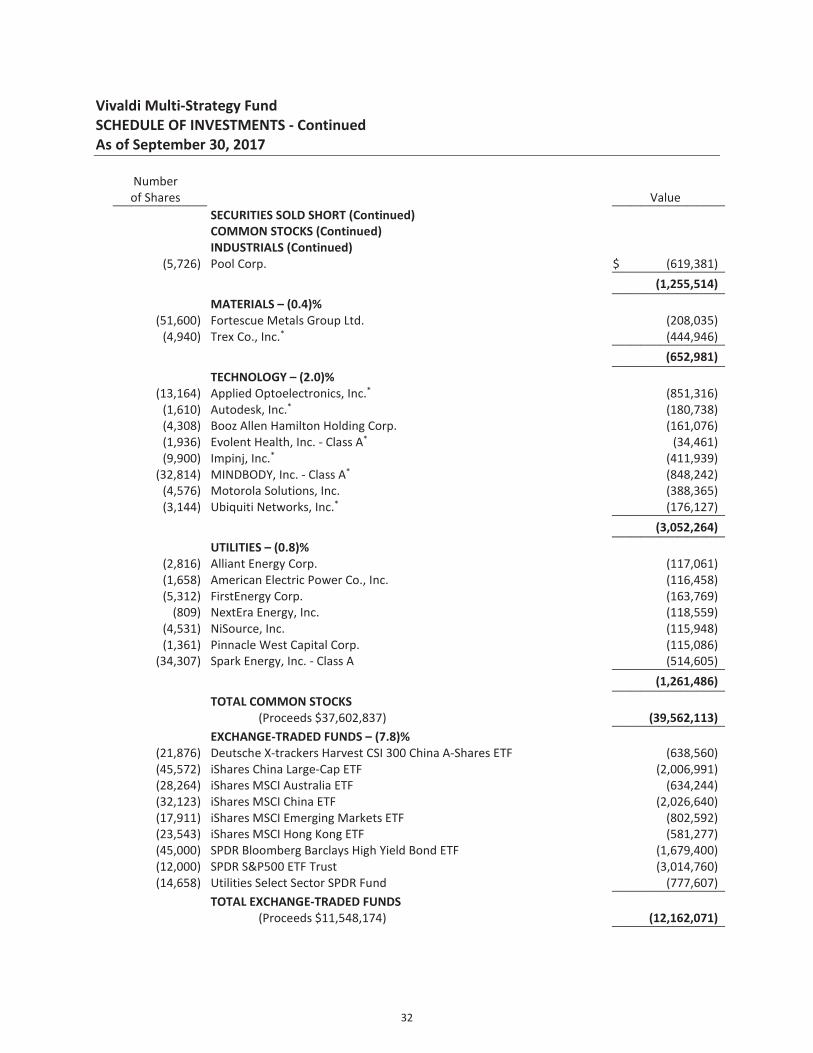
Vivaldi Multi-Strategy Fund SCHEDULE OF INVESTMENTS - Continued As of September 30, 2017
Number of Shares Value __________ ____________
SECURITIES SOLD SHORT (Continued) COMMON STOCKS (Continued) INDUSTRIALS (Continued) (5,726) Pool Corp. $ (619,381) ____________ (1,255,514) ____________ MATERIALS – (0.4)%
(51,600) Fortescue Metals Group Ltd. (208,035)
(4,940) Trex Co., Inc.* (444,946) ____________ (652,981) ____________ TECHNOLOGY – (2.0)%
(13,164) Applied Optoelectronics, Inc.* (851,316)
(1,610) Autodesk, Inc.* (180,738)
(4,308) Booz Allen Hamilton Holding Corp. (161,076)
(1,936) Evolent Health, Inc. - Class A* (34,461)
(9,900) Impinj, Inc.* (411,939)
(32,814) MINDBODY, Inc. - Class A* (848,242)
(4,576) Motorola Solutions, Inc. (388,365)
(3,144) Ubiquiti Networks, Inc.* (176,127) ____________ (3,052,264) ____________ UTILITIES – (0.8)%
(2,816) Alliant Energy Corp. (117,061)
(1,658) American Electric Power Co., Inc. (116,458)
(5,312) FirstEnergy Corp. (163,769)
(809) NextEra Energy, Inc. (118,559)
(4,531) NiSource, Inc. (115,948)
(1,361) Pinnacle West Capital Corp. (115,086)
(34,307) Spark Energy, Inc. - Class A (514,605) ____________ (1,261,486) ____________
TOTAL COMMON STOCKS (Proceeds $37,602,837) (39,562,113) ____________
EXCHANGE-TRADED FUNDS – (7.8)%
(21,876) Deutsche X-trackers Harvest CSI 300 China A-Shares ETF (638,560)
(45,572) iShares China Large-Cap ETF (2,006,991)
(28,264) iShares MSCI Australia ETF (634,244)
(32,123) iShares MSCI China ETF (2,026,640)
(17,911) iShares MSCI Emerging Markets ETF (802,592)
(23,543) iShares MSCI Hong Kong ETF (581,277)
(45,000) SPDR Bloomberg Barclays High Yield Bond ETF (1,679,400)
(12,000) SPDR S&P500 ETF Trust (3,014,760)
(14,658) Utilities Select Sector SPDR Fund (777,607) ____________
TOTAL EXCHANGE-TRADED FUNDS (Proceeds $11,548,174) (12,162,071) ____________
32

Vivaldi Multi-Strategy Fund SCHEDULE OF INVESTMENTS - Continued As of September 30, 2017
Number
of Contracts Value __________ ____________ SECURITIES SOLD SHORT (Continued)
TOTAL SECURITIES SOLD SHORT (Proceeds $49,151,011) $ (51,724,184) ____________
WRITTEN OPTIONS CONTRACTS – 0.0%
CALL OPTIONS – 0.0%
Straight Path Communications, Inc. (11)
Exercise Price: $180.00, Notional Amount: $(198,000), Expiration Date: November 17, 2017* (2,063)
(5)
Exercise Price: $180.00, Notional Amount: $(90,000), Expiration Date: December 15, 2017* (1,312)
(8)
Exercise Price: $180.00, Notional Amount: $(144,000), Expiration Date: October 20, 2017* (1,140) ____________
TOTAL CALL OPTIONS (Proceeds $4,077) (4,515) ____________
TOTAL WRITTEN OPTIONS CONTRACTS (Proceeds $4,077) $ (4,515) ________________________
ADR – American Depository Receipt ETF – Exchange Traded Fund LP – Limited Partnership PLC – Public Limited Company REIT – Real Estate Investment Trust * Non-income producing security. 1 Foreign security denominated in U.S. Dollars. 2 The rate is the annualized seven-day yield at period end. 3 All or a portion of this security is segregated as collateral for securities sold short.
See accompanying Notes to Financial Statements.
33

As of September 30, 2017
FUTURES CONTRACTS
Number of UnrealizedContracts Expiration Value at Value at Appreciation
Long (Short) Description Date Trade Date September 30, 2017 (Depreciation)
(16) Australian Dollar Currency Futures December 2017 (1,280,518)$ (1,253,760)$ 26,758$ (10) BP Currency Futures December 2017 (827,461) (839,937) (12,476) (8) Brent Crude Futures November 2017 (455,415) (454,320) 1,095
(10) Canadian Dollar Currency Futures December 2017 (797,861) (802,550) (4,689) (6) Copper Futures December 2017 (439,852) (443,250) (3,398)
(13) Euro FX Currency Futures December 2017 (1,952,781) (1,927,981) 24,800 (8) Euro-Bund Futures December 2017 (1,534,077) (1,522,373) 11,704 12 Gold Futures December 2017 1,555,548 1,541,760 (13,788) (1) Japanese 10-Year Bond Futures December 2017 (1,342,097) (1,336,147) 5,950
(10) Japanese Yen Currency Futures December 2017 (1,164,086) (1,115,000) 49,086 5 Natural Gas Futures June 2018 145,796 147,700 1,904 (7) New Zealand Dollar Currency Futures December 2017 (503,343) (504,840) (1,497) 8 Silver Futures December 2017 663,572 667,040 3,468
(13) U.S. 10-Year Treasury Note Futures December 2017 (1,631,258) (1,629,063) 2,195 9 WTI Crude Futures November 2017 460,367 467,550 7,183
TOTAL FUTURES CONTRACTS (9,103,466)$ (9,005,171)$ 98,295$
Vivaldi Multi-Strategy FundSCHEDULE OF INVESTMENTS - Continued
See accompanying Notes to Financial Statements.
34

Vivaldi Multi-Strategy Fund SUMMARY OF INVESTMENTS As of September 30, 2017
Security Type/Sector Percent of Total
Net Assets Closed-End Funds 16.8% Common Stocks
Communications 14.0% Health Care 11.5% Technology 7.8% Financials 7.5% Consumer Discretionary 4.2% Energy 3.5% Materials 2.6% Industrials 1.8% Utilities 1.5% Consumer Staples 1.4% __________
Total Common Stocks 55.8% Preferred Stocks 1.8% Purchased Options Contracts 0.0% Rights 0.0% Warrants 0.0% Short-Term Investments 27.1% __________Total Investments 101.5% Liabilities in Excess of Other Assets (1.5)% __________Total Net Assets 100.0% ____________________ See accompanying Notes to Financial Statements.
35

WV Concentrated Equities Fund SCHEDULE OF INVESTMENTS As of September 30, 2017
Number of Shares Value __________ ____________
COMMON STOCKS – 84.4%
COMMUNICATIONS – 25.3%
8,450 Alphabet, Inc. - Class C*1 $ 8,104,479
242,238 Gray Television, Inc.* 3,803,136
380,549 IMAX Corp.* 8,619,435
372,929 Liberty Global PLC LiLAC - Class A* 1 8,860,793
80,066 Liberty Global PLC LiLAC - Class C* 1,865,538
533,499 National CineMedia, Inc. 3,723,823
152,596 Nexstar Broadcasting Group, Inc. 9,506,731
160,063 TEGNA, Inc. 2,133,640
253,300 Twenty-First Century Fox, Inc.1 6,682,054 ____________ 53,299,629 ____________ CONSUMER DISCRETIONARY – 13.4%
83,883 Beacon Roofing Supply, Inc.* 4,299,004
155,757 DR Horton, Inc. 6,219,377
667,388 Drive Shack, Inc. 2,409,271
1,467,441 Imvescor Restaurant Group, Inc. 4,363,044
877,213 Potbelly Corp.* 10,877,441 ____________ 28,168,137 ____________ CONSUMER STAPLES – 4.9%
594,012 Darling Ingredients, Inc.* 1 10,407,090 ____________ FINANCIALS – 24.0%
85,700 American International Group, Inc.1 5,261,123
40 Berkshire Hathaway, Inc. - Class A*1 10,989,600
174,583 Blackhawk Network Holdings, Inc. - Class A*1 7,646,735
200,000 Industrea Acquisition Corp.* 2,020,000
630,890 Kingsway Financial Services, Inc.* 3,848,429
194,157 Marcus & Millichap, Inc.* 1 5,240,298
149,039 Outfront Media, Inc. 3,752,802
1,085,024 Resource Capital Corp.1 11,696,559 ____________ 50,455,546 ____________ HEALTH CARE – 1.6%
41,532 AmerisourceBergen Corp. 3,436,773 ____________ INDUSTRIALS – 3.2%
129,641 AerCap Holdings N.V.* 1 6,625,952 ____________ MATERIALS – 1.3%
125,470 KapStone Paper and Packaging Corp. 2,696,350 ____________ TECHNOLOGY – 8.2%
134,615 Donnelley Financial Solutions, Inc.* 1 2,902,299
147,374 Loral Space & Communications, Inc.* 1 7,295,013
115,609 TTM Technologies, Inc.* 1,776,910
217,454 Vishay Precision Group, Inc.* 1 5,305,878 ____________ 17,280,100 ____________
36

WV Concentrated Equities Fund SCHEDULE OF INVESTMENTS - Continued As of September 30, 2017
Number of Shares Value __________ ____________
COMMON STOCKS (Continued) UTILITIES – 2.5%
262,359 Atlantica Yield PLC1 $ 5,168,472 ____________
TOTAL COMMON STOCKS (Cost $147,440,600) 177,538,049 ____________
PREFERRED STOCKS – 1.6%
FINANCIALS – 1.6%
B. Riley Financial, Inc. 85,000 7.500%, 5/31/272 2,176,000
49,551 7.500%, 10/31/211,2 1,281,885 ____________ 3,457,885 ____________
TOTAL PREFERRED STOCKS (Cost $3,363,790) 3,457,885 ____________
SHORT-TERM INVESTMENTS – 17.2%
36,096,366
Morgan Stanley Institutional Liquidity Fund - Government Portfolio -
Institutional Class, 0.89%1,3 36,096,366 ____________
TOTAL SHORT-TERM INVESTMENTS (Cost $36,096,366) 36,096,366 ____________
TOTAL INVESTMENTS – 103.2% (Cost $186,900,756) 217,092,300
Liabilities in Excess of Other Assets – (3.2)% (6,768,535) ____________ TOTAL NET ASSETS – 100.0% $ 210,323,765 ________________________ SECURITIES SOLD SHORT – (11.5)%
COMMON STOCKS – (11.5)%
CONSUMER DISCRETIONARY – (4.2)%
(7,598) Domino's Pizza, Inc. (1,508,583)
(31,039) Restaurant Brands International, Inc. (1,982,771)
(12,814) Royal Caribbean Cruises Ltd. (1,518,972)
(4,675) Tesla Motors, Inc.* (1,594,642)
(70,522) Wingstop, Inc. (2,344,857) ____________ (8,949,825) ____________ CONSUMER STAPLES – (1.1)%
(81,408) Blue Buffalo Pet Products, Inc.* (2,307,917) ____________ FINANCIALS – (3.2)%
(32,500) Bank of the Ozarks, Inc. (1,561,625)
(104,542) BofI Holding, Inc.* (2,976,311)
(30,768) Kilroy Realty Corp. (2,188,220) ____________ (6,726,156) ____________ HEALTH CARE – (1.4)%
(86,045) Teladoc, Inc.* (2,852,391) ____________
37

WV Concentrated Equities Fund SCHEDULE OF INVESTMENTS - Continued As of September 30, 2017
Number of Shares Value __________ ____________
SECURITIES SOLD SHORT (Continued) COMMON STOCKS (Continued) INDUSTRIALS – (1.6)%
(50,000) AAON, Inc. $ (1,723,750)
(15,200) Pool Corp. (1,644,184) ____________ (3,367,934) ____________
TOTAL COMMON STOCKS (Proceeds $21,829,888) (24,204,223) ____________
TOTAL SECURITIES SOLD SHORT (Proceeds $21,829,888) $ (24,204,223) ________________________
PLC – Public Limited Company * Non-income producing security. 1 All or a portion of this security is segregated as collateral for securities sold short. 2 Callable. 3 The rate is the annualized seven-day yield at period end. See accompanying Notes to Financial Statements.
38

WV Concentrated Equities Fund SUMMARY OF INVESTMENTS As of September 30, 2017
Security Type/Sector Percent of Total
Net Assets Common Stocks
Communications 25.3% Financials 24.0% Consumer Discretionary 13.4% Technology 8.2% Consumer Staples 4.9% Industrials 3.2% Utilities 2.5% Health Care 1.6% Materials 1.3% __________
Total Common Stocks 84.4% Preferred Stocks 1.6% Short-Term Investments 17.2% __________Total Investments 103.2% Liabilities in Excess of Other Assets (3.2)% ) __________Total Net Assets 100.0% ____________________ See accompanying Notes to Financial Statements.
39

STATEMENTS OF ASSETS AND LIABILITIESAs of September 30, 2017
Assets:Investments, at cost $ 535,683,448 $ 150,324,759 $ 186,900,756 Purchased options contracts, at cost 211,828 156,341 - Foreign currency, at cost - 67,867 - Investments, at value $ 545,842,217 $ 157,992,479 $ 217,092,300 Purchased options contracts, at value 222,700 58,390 - Foreign currency, at value - 68,170 - Unrealized appreciation on futures contracts - 134,143 - Cash deposited with brokers for securities sold short 103,862,544 53,741,297 22,203,013 Cash deposited with brokers for futures contracts - 164,425 - Due from Custodian 8,807,051 880,814 - Receivables: Investment securities sold 8,709,629 2,108,881 - Fund shares sold 689,021 60,941 - Dividends and interest 90,879 120,053 172,274 Prepaid expenses 56,731 38,378 19,823 Prepaid offering costs - 6,044 11,432 Total assets 668,280,772 215,374,015 239,498,842
Liabilities:Securities sold short, proceeds $ 109,089,828 $ 49,151,011 $ 21,829,888 Written options contracts, proceeds 42,688 4,077 - Foreign currency due to custodian, proceeds - 2,370,554 4,110,806 Securities sold short, at value $ 107,030,413 $ 51,724,184 $ 24,204,223 Written options contracts, at value 47,085 4,515 - Foreign currency due to custodian, at value - 2,484,811 4,110,904 Unrealized depreciation on futures contracts - 35,848 - Due to Custodian - - 5,478 Payables: Investment securities purchased 28,374,966 5,085,092 437,713 Fund shares redeemed 257,126 25,840 - Advisory fees 558,421 182,895 199,252 Shareholder servicing fees (Note 8) 39,414 37,505 48,624 Distribution fees (Note 7) 17,487 5,702 - Fund administration fees 24,934 - 56,239 Fund accounting fees 18,348 - - Auditing fees 15,017 15,000 14,806 Transfer agent fees and expenses 5,017 - 12,085 Custody fees 2,439 - 4,720 Legal fees 1,825 515 1,951 Trustees' fees and expenses 784 158 488 Chief Compliance Officer fees 295 2,739 408 Dividends and Interest on securities sold short 12 74,034 27,718 Offering costs - - 836 Accrued other expenses 37,674 2,963 49,632 Total liabilities 136,431,257 59,681,801 29,175,077
Net Assets $ 531,849,515 $ 155,692,214 $ 210,323,765
Components of Net Assets:Paid-in capital (par value of $0.01 per share with an unlimited number of shares authorized) $ 515,410,844 $ 148,905,930 $ 182,919,287 Accumulated net investment loss (156,286) (17,348) - Accumulated net realized gain (loss) on investments,
purchased options contracts, securities sold short,written options contracts, futures contracts and foreign currency transactions 4,370,298 1,823,106 (412,303)
Net unrealized appreciation (depreciation) on:Investments 10,158,769 7,667,720 30,191,544 Purchased options contracts 10,872 (97,951) - Securities sold short 2,059,415 (2,573,173) (2,374,335) Written options contracts (4,397) (438) - Futures contracts - 98,295 - Foreign currency translations - (113,927) (428)
Net Assets $ 531,849,515 $ 155,692,214 $ 210,323,765
VivaldiMerger Arbitrage Fund
Vivaldi Multi-Strategy Fund*
WVConcentrated Equities Fund
See accompanying Notes to Financial Statements.
40

STATEMENTS OF ASSETS AND LIABILITIES - ContinuedAs of September 30, 2017
Class A Shares: Net assets applicable to shares outstanding $ 86,739,691 $ 27,016,298 $ 994 Shares of beneficial interest issued and outstanding 8,160,803 1,003,460 40 Redemption price per share** 10.63 26.92 24.85 Maximum sales charge (5.75%/5.00% of offering price)*** 0.65 1.42 1.52 Maximum offering price to public $ 11.28 $ 28.34 $ 26.37
Class I Shares: Net assets applicable to shares outstanding $ 445,109,824 $ 128,675,916 $ 210,322,771 Shares of beneficial interest issued and outstanding 41,598,703 4,695,523 8,456,785 Redemption price $ 10.70 $ 27.40 $ 24.87
* Fiscal year end changed to September 30, effective July 20, 2017.** No sales charge applies on investments of $1 million or more.
***
Vivaldi Vivaldi WVMerger Arbitrage Fund Multi-Strategy Fund* Concentrated Equities Fund
On sales of $25,000 or more, the sales charge will be reduced.
Maximum Offering Price per Share:
See accompanying Notes to Financial Statements.
41

STATEMENTS OF OPERATIONSFor the Periods Ended September 30, 2017
Vivaldi Vivaldi Vivaldi WVMerger Arbitrage Fund Multi-Strategy Fund* Multi-Strategy Fund** Concentrated Equities Fund***
Investment Income:Dividends (net of foreign withholding taxes of $16,760, $6,874, $15,046 and $10,988, respectively) 11,428,254$ 2,645,905$ 1,252,000$ 1,228,633$ Interest 253,310 178,313 238,016 91,911
Total investment income 11,681,564 2,824,218 1,490,016 1,320,544
Expenses:Advisory fees 5,865,791 1,419,550 1,558,779 1,087,277 Dividends on securities sold short (net of foreign withholding taxes of $3,478, $0, $0 and $0, respectively) 4,043,373 643,163 503,783 90,459 Interest on securities sold short 1,479,838 618,889 - 67,648 Shareholder servicing fees - Class I (Note 8) 322,779 71,706 56,613 - Fund administration fees 282,564 27,702 146,949 84,325 Interest expense (Note 15) 214,166 - 592,594 - Distribution fees (Note 7) 184,502 42,385 85,207 - Registration fees 168,413 23,343 54,308 22,013 Transfer agent fees and expenses 116,495 13,540 59,117 20,607 Fund accounting fees 110,615 23,298 - 26,000 Shareholder servicing fees - Class A (Note 8) 87,123 25,449 51,125 - Shareholder reporting fees 68,192 23,294 15,848 3,500 Miscellaneous 52,062 12,609 7,001 33,627 Custody fees 38,348 3,444 21,849 11,288 Legal fees 19,002 41,165 19,730 8,383 Auditing fees 15,002 14,999 15,001 14,806 Trustees' fees and expenses 9,501 3,811 10,973 3,144 Chief Compliance Officer fees 8,001 15,830 16,087 2,320 Insurance fees 4,850 2,345 1,854 1,093 Shareholder servicing fees (Note 8) - - - 122,807 Offering costs - 16,373 4,575 8,298
Total expenses 13,090,617 3,042,895 3,221,393 1,607,595 Advisory fees recovered/waived and other expenses absorbed 56,534 - (42,251) - Fees paid indirectly (Note 3) (11,061) - - -
Net expenses 13,136,090 3,042,895 3,179,142 1,607,595 Net investment loss (1,454,526) (218,677) (1,689,126) (287,051)
Realized and Unrealized Gain (Loss) on Investments, Purchased Options Contracts, Securities Sold Short, Written Options Contracts, Futures Contracts and Foreign Currency:
Net realized gain (loss) on:Investments 11,000,042 4,787,387 6,589,422 4,225,317 Purchased options contracts (747,899) (708,848) (758,776) - Securities sold short (3,577,521) (2,304,488) (3,315,843) (2,700,676) Written options contracts 291,086 81,812 69,249 224,447 Futures contracts - (207,037) 600,083 - Foreign currency transactions (1,457) (84,867) 5,952 (52,553)
Net realized gain 6,964,251 1,563,959 3,190,087 1,696,535 Net change in unrealized appreciation/depreciation on:
Investments 9,732,717 2,751,834 3,558,595 (3,669,278) Purchased options contracts 10,812 151,600 (192,796) - Securities sold short 3,260,720 (475,175) (2,553,760) (1,076,868) Written options contracts (4,397) (7,624) 7,187 - Futures contracts - 198,463 (142,497) - Foreign currency translations - (91,948) (37,373) (428)
12,999,852 2,527,150 639,356 (4,746,574) Reimbursement by affiliate (Note 3) 11,641 - - -
Net realized and unrealized gain (loss) on investments, purchased options contracts,securities sold short, written options contracts, futures contracts and foreign currency 19,975,744 4,091,109 3,829,443 (3,050,039)
Net Increase (Decrease) in Net Assets from Operations 18,521,218$ 3,872,432$ 2,140,317$ (3,337,090)$
**Fiscal year ended February 28, 2017.***Fund commenced operations on May 1, 2017.
Net change in unrealized appreciation/depreciation
*Fiscal year end changed to September 30, effective July 20, 2017.
See accompanying Notes to Financial Statements.
42

Vivaldi Merger Arbitrage FundSTATEMENTS OF CHANGES IN NET ASSETS
For the For the Year Ended Year Ended
September 30, 2017 September 30, 2016Increase (Decrease) in Net Assets from:Operations:
Net investment loss (1,454,526)$ (2,537,659)$ Net realized gain 6,964,251 1,445,060 Net change in unrealized appreciation/depreciation on investments, purchased options contracts, securities sold short and written options contracts 12,999,852 (775,193) Net increase from reimbursement by affiliate (Note 3) 11,641 - Net increase (decrease) in net assets resulting from operations 18,521,218 (1,867,792)
Distributions to Shareholders:From net realized gain: Class A (49,463) (1,907) Class I (207,776) (11,163) Total distributions to shareholders (257,239) (13,070)
Capital Transactions:Net proceeds from shares sold: Class A 56,999,638 100,412,526 Class A - Reorganization - 500 Class I 239,961,325 322,408,524 Class I - Reorganization - 3,057,075 Reinvestment of distributions: Class A 47,170 1,876 Class I 203,650 11,163 Cost of shares redeemed: Class A1 (55,215,135) (17,375,491) Class I2 (122,192,847) (12,853,576) Net increase in net assets from capital transactions 119,803,801 395,662,597
Total increase in net assets 138,067,780 393,781,735
Net Assets:Beginning of period 393,781,735 - End of period 531,849,515$ 393,781,735$
Accumulated net investment loss (156,286)$ (70,206)$
Capital Share Transactions:Shares sold: Class A 5,443,908 9,722,359 Class A - Reorganization - 50 Class I 23,002,801 31,180,038 Class I - Reorganization - 307,301 Shares reinvested: Class A 4,571 187 Class I 19,657 1,112 Shares redeemed: Class A (5,320,369) (1,689,903) Class I (11,668,204) (1,244,002) Net increase in capital share transactions 11,482,364 38,277,142
1 Net of redemption fee proceeds of $3,763 and $5,970, respectively.2 Net of redemption fee proceeds of $12,044 and $8,016, respectively.
See accompanying Notes to Financial Statements.
43

Vivaldi Multi-Strategy FundSTATEMENTS OF CHANGES IN NET ASSETS
For the PeriodMarch 1, 2017 For the For the
through Year Ended Year EndedSeptember 30, 2017* February 28, 2017 February 29, 2016
Increase (Decrease) in Net Assets from:Operations:
Net investment loss (218,677)$ (1,689,126)$ (847,352)$ Net realized gain 1,563,959 3,190,087 1,636,286 Net change in unrealized appreciation/depreciation on investments, purchased options contracts, securities sold short, written options contracts, futures contracts and foreign currency 2,527,150 639,356 1,049,301 Net increase in net assets resulting from operations 3,872,432 2,140,317 1,838,235
Distributions to Shareholders:From net realized gain: Class A - (334,841) (448,242) Class I - (1,171,528) (974,980) Total distributions to shareholders - (1,506,369) (1,423,222)
Capital Transactions:Net proceeds from shares sold: Class A 3,915,107 29,390,814 26,630,453 Class I 36,431,311 95,685,383 19,288,684 Reinvestment of distributions: Class A - 309,267 414,125 Class I - 1,108,775 932,258 Cost of shares redeemed: Class A1 (8,375,945) (30,357,976) (15,398,812) Class I2 (22,678,627) (13,778,754) (8,054,828) Net increase in net assets from capital transactions 9,291,846 82,357,509 23,811,880
Total increase in net assets 13,164,278 82,991,457 24,226,893
Net Assets:Beginning of period 142,527,936 59,536,479 35,309,586 End of period 155,692,214$ 142,527,936$ 59,536,479$
Accumulated net investment loss (17,348)$ (506,622)$ (48,808)$
Capital Share Transactions:Shares sold: Class A 148,338 1,112,635 1,044,178 Class I 1,356,646 3,561,701 741,216 Shares reinvested: Class A - 11,728 16,512 Class I - 41,403 36,732 Shares redeemed: Class A (316,661) (1,146,048) (594,041) Class I (844,316) (513,031) (307,016) Net increase in capital share transactions 344,007 3,068,388 937,581
1 Net of redemption fee proceeds of $0, $0 and $36, respectively.2 Net of redemption fee proceeds of $0, $0 and $3,462, respectively.
*Fiscal year end changed to September 30, effective July 20, 2017.
See accompanying Notes to Financial Statements.
44

WV CONCENTRATED EQUITIES FUNDSTATEMENT OF CHANGES IN NET ASSETS
For the PeriodMay 1, 2017*
throughSeptember 30, 2017
Increase (Decrease) in Net Assets from:Operations:
Net investment loss (287,051)$ Net realized gain 1,696,535 Net change in unrealized appreciation/depreciation on investments, securities sold short, written options contracts and foreign currency (4,746,574) Net decrease in net assets resulting from operations (3,337,090)
Capital Transactions:Net proceeds from shares sold: Class A - Reorganization 1,000 Class I 290,000 Class I - Reorganization 318,540,019 Cost of shares redeemed: Class I (105,170,164) Net increase in net assets from capital transactions 213,660,855
Total increase in net assets 210,323,765
Net Assets:Beginning of period - End of period 210,323,765$
Capital Share Transactions:Shares sold: Class A - Reorganization 40 Class I 11,647 Class I - Reorganization 12,741,601 Shares redeemed: Class I (4,296,463) Net increase in capital share transactions 8,456,825
* Commencement of operations.
See accompanying Notes to Financial Statements.
45

WV CONCENTRATED EQUITIES FUNDSTATEMENT OF CASH FLOWSFor the Period May 1, 2017* through September 30, 2017
Increase (Decrease) in Cash:Cash flows provided by (used for) operating activities:
Net decrease in net assets resulting from operations (3,337,090)$ Adjustments to reconcile net decrease in net assets from operations to net cash used for operating activities:
Purchases of long-term portfolio investments (499,091,859) Sales of long-term portfolio investments 352,512,774 Proceeds from securities sold short 56,554,491 Cover short securities (37,425,279) Premiums received on written options 707,866 Closed written options (483,419) Purchase of short-term investments, net (36,096,366) Increase in cash held by brokers (22,203,013) Increase in dividends and interest receivables (172,274) Increase in other assets (31,255) Increase in foreign currency payable 4,110,904 Increase in payables for securities purchased 437,713 Increase in unrealized depreciation on open futures contracts 5,478 Increase in payables for dividends on short positions 27,718 Increase in Advisory and Subadvisory fees 199,252 Increase in accrued expenses 189,789 Amortization 12 Net realized gain on investments (1,749,088) Net change in unrealized appreciation/depreciation on investments 4,746,146
Net cash used for operating activities (181,097,500)
Cash flows provided by (used for) financing activities:Proceeds from sale of shares 286,267,664 Redemption of shares, net of redemption fees (105,170,164) Net cash provided by financing activities 181,097,500
Cash:Beginning balance - Ending balance -$
*Commencement of operations.
See accompanying Notes to Financial Statements.
46

Viva
ldi M
erge
r Arb
itrag
e Fu
ndFI
NANC
IAL H
IGHL
IGHT
S Cl
ass A
Per s
hare
ope
ratin
g pe
rform
ance
.Fo
r a ca
pita
l sha
re o
utst
andi
ng th
roug
hout
eac
h pe
riod.
For t
he
For t
he
Year
End
edYe
ar E
nded
Sept
embe
r 30,
201
7Se
ptem
ber 3
0, 2
016
Net
ass
et v
alue
, beg
inni
ng o
f per
iod
10.2
6$
10
.00
$
Inco
me
from
Inve
stm
ent O
pera
tions
:Ne
t inv
estm
ent l
oss1
(0.0
6)
(0.1
9)
Net r
ealiz
ed a
nd u
nrea
lized
gai
n on
inve
stm
ents
, pur
chas
ed o
ptio
ns co
ntra
cts,
secu
ritie
s sol
d sh
ort,
writ
ten
optio
ns co
ntra
cts a
nd fo
reig
n cu
rren
cy0.
44
0.45
Ne
t inc
reas
e fro
m re
imbu
rsem
ent b
y af
filia
te (N
ote
3)-
2-
Tota
l fro
m in
vest
men
t ope
ratio
ns0.
38
0.26
Less
Dist
ribut
ions
:Fr
om n
et re
alize
d ga
in(0
.01)
-
2
Tota
l dist
ribut
ions
(0.0
1)
-
Rede
mpt
ion
fee
proc
eeds
1-
2-
2
Net
ass
et v
alue
, end
of p
erio
d10
.63
$
10.2
6$
Tota
l ret
urn3
3.67
%2.
64%
Ratio
s and
Sup
plem
enta
l Dat
a:Ne
t ass
ets,
end
of p
erio
d (in
thou
sand
s)86
,740
$
82
,393
$
Ratio
of e
xpen
ses t
o av
erag
e ne
t ass
ets (
inclu
ding
div
iden
ds o
n se
curit
ies s
old
shor
tan
d in
tere
st e
xpen
se):
Befo
re fe
es re
cove
red/
wai
ved
and
expe
nses
abs
orbe
d3.
03%
42.
78%
4
Afte
r fee
s rec
over
ed/w
aive
d an
d ex
pens
es a
bsor
bed
3.04
%4
2.62
%4
Ratio
of n
et in
vest
men
t los
s to
aver
age
net a
sset
s (in
cludi
ng d
ivid
ends
on
secu
ritie
s sol
d sh
ort a
nd in
tere
st e
xpen
se):
Befo
re fe
es re
cove
red/
wai
ved
and
expe
nses
abs
orbe
d(0
.54)
%(2
.00)
%Af
ter f
ees r
ecov
ered
/wai
ved
and
expe
nses
abs
orbe
d(0
.55)
%(1
.84)
%
Port
folio
turn
over
rate
478%
566%
1Ba
sed
on a
vera
ge d
aily
shar
es o
utst
andi
ng fo
r the
per
iod.
2Am
ount
repr
esen
ts le
ss th
an $
0.01
per
shar
e.3 4
Tota
lret
urns
wou
ldha
vebe
enlo
wer
had
expe
nses
notb
een
wai
ved
orab
sorb
edby
the
Advi
sor.
Retu
rns
show
nin
clude
Rule
12b-
1fe
esof
upto
0.25
%an
ddo
notr
efle
ctth
ede
duct
ion
ofta
xes
that
ash
areh
olde
rw
ould
pay
onFu
nddi
strib
utio
nsor
the
rede
mpt
ion
ofFu
ndsh
ares
.Ret
urns
show
ndo
noti
nclu
depa
ymen
tofs
ales
load
of5.
75%
ofof
ferin
gpr
icew
hich
isre
duce
don
sale
sof$
25,0
00or
mor
e.If
the
sale
scha
rge
was
inclu
ded
tota
l ret
urns
wou
ld b
e lo
wer
.If
inte
rest
and
divi
dend
son
secu
ritie
ssol
dsh
orta
ndin
tere
stex
pens
eha
dbe
enex
clude
d,th
eex
pens
era
tiosw
ould
have
been
low
ered
by1.
22%
fort
heye
aren
ded
Sept
embe
r30,
2017
and
0.80
%fo
rthe
year
ende
dSe
ptem
ber 3
0, 2
016.
See
acco
mpa
nyin
g N
otes
to F
inan
cial S
tate
men
ts.
47

Viva
ldi M
erge
r Arb
itrag
e Fu
ndFI
NANC
IAL H
IGHL
IGHT
S Cl
ass I
Per s
hare
ope
ratin
g pe
rform
ance
.Fo
r a ca
pita
l sha
re o
utst
andi
ng th
roug
hout
eac
h pe
riod.
For t
he
For t
he
Year
End
edYe
ar E
nded
Sept
embe
r 30,
201
7Se
ptem
ber 3
0, 2
016
Net
ass
et v
alue
, beg
inni
ng o
f per
iod
10.3
0$
10
.00
$
Inco
me
from
Inve
stm
ent O
pera
tions
:Ne
t inv
estm
ent l
oss1
(0.0
3)
(0.1
6)
Net r
ealiz
ed a
nd u
nrea
lized
gai
n on
inve
stm
ents
, pur
chas
ed o
ptio
ns co
ntra
cts,
secu
ritie
s sol
d sh
ort,
writ
ten
optio
ns co
ntra
cts a
nd fo
reig
n cu
rren
cy0.
44
0.46
Ne
t inc
reas
e fro
m re
imbu
rsem
ent b
y af
filia
te (N
ote
3)-
2-
Tota
l fro
m in
vest
men
t ope
ratio
ns0.
41
0.30
Less
Dist
ribut
ions
:Fr
om n
et re
alize
d ga
in(0
.01)
-
2
Tota
l dist
ribut
ions
(0.0
1)
-
Rede
mpt
ion
fee
proc
eeds
1-
2-
2
Net
ass
et v
alue
, end
of p
erio
d10
.70
$
10.3
0$
Tota
l ret
urn3
3.95
%3.
04%
Ratio
s and
Sup
plem
enta
l Dat
a:Ne
t ass
ets,
end
of p
erio
d (in
thou
sand
s)44
5,11
0$
311,
389
$
Ratio
of e
xpen
ses t
o av
erag
e ne
t ass
ets (
inclu
ding
div
iden
ds o
n se
curit
ies s
old
shor
tan
d in
tere
st e
xpen
se):
Befo
re fe
es re
cove
red/
wai
ved
and
expe
nses
abs
orbe
d2.
74%
42.
47%
4
Afte
r fee
s rec
over
ed/w
aive
d an
d ex
pens
es a
bsor
bed
2.75
%4
2.31
%4
Ratio
of n
et in
vest
men
t los
s to
aver
age
net a
sset
s (in
cludi
ng d
ivid
ends
on
secu
ritie
s sol
d sh
ort a
nd in
tere
st e
xpen
se):
Befo
re fe
es re
cove
red/
wai
ved
and
expe
nses
abs
orbe
d(0
.25)
%(1
.69)
%Af
ter f
ees r
ecov
ered
/wai
ved
and
expe
nses
abs
orbe
d(0
.26)
%(1
.53)
%
Port
folio
turn
over
rate
478%
566%
1Ba
sed
on a
vera
ge d
aily
shar
es o
utst
andi
ng fo
r the
per
iod.
2Am
ount
repr
esen
ts le
ss th
an $
0.01
per
shar
e.3 4
Tota
lret
urns
wou
ldha
vebe
enlo
wer
had
expe
nses
not
been
wai
ved
orab
sorb
edby
the
Advi
sor.
Retu
rns
show
ndo
not
refle
ctth
ede
duct
ion
ofta
xes
that
ash
areh
olde
rw
ould
pay
onFu
nddi
strib
utio
nsor
the
rede
mpt
ion
of F
und
shar
es.
Ifin
tere
stan
ddi
vide
ndso
nse
curit
iess
old
shor
tand
inte
rest
expe
nse
had
been
exclu
ded,
the
expe
nse
ratio
swou
ldha
vebe
enlo
wer
edby
1.22
%fo
rthe
year
ende
dSe
ptem
ber3
0,20
17an
d0.
80%
fort
heye
aren
ded
Sept
embe
r 30,
201
6.
See
acco
mpa
nyin
g N
otes
to F
inan
cial S
tate
men
ts.
48

Viva
ldi M
ulti-
Stra
tegy
Fun
dFI
NANC
IAL H
IGHL
IGHT
S Cl
ass A
*
Per s
hare
ope
ratin
g pe
rfor
man
ce.
For a
capi
tal s
hare
out
stan
ding
thro
ugho
ut e
ach
perio
d.
For t
he P
erio
dFo
r the
Per
iod
Mar
ch 1
, 201
7Fo
r the
For t
heFo
r the
For t
heAp
ril 3
0, 2
012*
**th
roug
hYe
ar E
nded
Year
End
edYe
ar E
nded
Year
End
edth
roug
hSe
ptem
ber 3
0, 2
017*
*Fe
brua
ry 2
8, 2
017
Febr
uary
29,
201
6Fe
brua
ry 2
8, 2
015
Febr
uary
28,
201
4Fe
brua
ry 2
8, 2
013
Net a
sset
val
ue, b
egin
ning
of p
erio
d26
.28
$
25
.88
$
26
.07
$
26
.31
$
25
.22
$
25
.00
$
In
com
e fr
om In
vest
men
t Ope
ratio
ns:
Net i
nves
tmen
t los
s1(0
.08)
(0
.54)
(0
.17)
(0
.56)
(0
.56)
(0
.32)
Ne
t rea
lized
and
unr
ealiz
ed g
ain
on in
vest
men
ts0.
72
1.38
1.25
0.61
1.70
0.56
Tota
l fro
m in
vest
men
t ope
ratio
ns0.
64
0.84
1.08
0.05
1.14
0.24
Less
Dist
ribut
ions
:Fr
om n
et re
alize
d ga
in-
(0.4
4)
(1.2
7)
(0.2
9)
(0.0
5)
(0.0
2)
Tota
l dist
ribut
ions
-
(0
.44)
(1
.27)
(0
.29)
(0
.05)
(0
.02)
Rede
mpt
ion
fee
proc
eeds
1-
-
-
2-
2-
2-
Net a
sset
val
ue, e
nd o
f per
iod
26.9
2$
26.2
8$
25.8
8$
26.0
7$
26.3
1$
25.2
2$
Tota
l ret
urn3
2.40
%4
3.22
%4.
30%
0.21
%4.
54%
0.96
%4
Ratio
s and
Sup
plem
enta
l Dat
a:Ne
t ass
ets,
end
of p
erio
d (in
thou
sand
s)27
,016
$
30,8
00$
30
,888
$
18,9
49$
20
,932
$
17,3
47$
Ratio
of e
xpen
ses t
o av
erag
e ne
t ass
ets (
inclu
ding
div
iden
ds o
n se
curit
ies s
old
shor
tan
d in
tere
st e
xpen
se):
Befo
re fe
es w
aive
d an
d ex
pens
es a
bsor
bed
3.67
%5,
63.
71%
64.
66%
63.
89%
64.
42%
65.
49%
5,6
Afte
r fee
s wai
ved
and
expe
nses
abs
orbe
d3.
67%
5,6
3.66
%6
4.02
%6
3.26
%6
3.74
%6
3.80
%5,
6
Ratio
of n
et in
vest
men
t los
s to
aver
age
net a
sset
s (in
cludi
ng d
ivid
ends
on
secu
ritie
s sol
d sh
ort a
nd in
tere
st e
xpen
se):
Befo
re fe
es w
aive
d an
d ex
pens
es a
bsor
bed
(0.4
9)%
5(2
.08)
%(3
.31)
%(2
.52)
%(3
.10)
%(4
.20)
%5
Afte
r fee
s wai
ved
and
expe
nses
abs
orbe
d(0
.49)
%5
(2.0
3)%
(2.6
7)%
(1.8
9)%
(2.4
2)%
(2.5
1)%
5
Port
folio
turn
over
rate
198%
432
3%39
3%36
0%27
0%20
5%4
* **Fi
scal
yea
r end
chan
ged
to S
epte
mbe
r 30,
effe
ctiv
e Ju
ly 2
0, 2
017
.**
*Co
mm
ence
men
t of o
pera
tions
.1
Base
d on
ave
rage
dai
ly sh
ares
out
stan
ding
for t
he p
erio
d.2
Amou
nt re
pres
ents
less
than
$0.
01 p
er sh
are.
3 4No
t ann
ualiz
ed.
5An
nual
ized.
6
Fina
ncia
l inf
orm
atio
n fro
m A
pril
30, 2
012
thro
ugh
Dece
mbe
r 18,
201
6 is
for t
he V
ival
di O
rinda
Mac
ro O
ppor
tuni
ties F
und,
whi
ch w
as re
orga
nize
d in
to th
e Vi
vald
i Mul
ti-St
rate
gy F
und
as o
f the
clo
se o
f bus
ines
s Dec
embe
r 18,
201
6.
Tota
lret
urns
wou
ldha
vebe
enlo
wer
had
expe
nses
notb
een
wai
ved
orab
sorb
edby
the
Advi
sor.
Retu
rns
show
nin
clude
Rule
12b-
1fe
esof
upto
0.25
%an
ddo
notr
efle
ctth
ede
duct
ion
ofta
xest
hata
shar
ehol
derw
ould
pay
onFu
nddi
strib
utio
ns o
r the
rede
mpt
ion
of F
und
shar
es. R
etur
ns sh
own
do n
ot in
clude
pay
men
t of s
ales
load
of 5
.00%
of o
fferin
g pr
ice w
hich
is re
duce
d on
sale
s of $
50,0
00 o
r mor
e. If
the
sale
s cha
rge
was
inclu
ded
tota
l ret
urns
wou
ld b
e lo
wer
.
Ifin
tere
stex
pens
ean
ddi
vide
ndso
nse
curit
iess
old
shor
thad
been
exclu
ded,
the
expe
nse
ratio
swou
ldha
vebe
enlo
wer
edby
1.42
%fo
rthe
perio
den
ded
Sept
embe
r30,
2017
.For
the
prio
rper
iods
,the
ratio
swou
ldha
vebe
enlo
wer
edby
1.2
0%, 1
.22%
, 0.5
8%, 0
.81%
and
0.8
4%, r
espe
ctiv
ely.
See
acco
mpa
nyin
g No
tes t
o Fi
nanc
ial S
tate
men
ts.
49

Viva
ldi M
ulti-
Stra
tegy
Fun
dFI
NANC
IAL H
IGHL
IGHT
S Cl
ass I
*
Per s
hare
ope
ratin
g pe
rfor
man
ce.
For a
capi
tal s
hare
out
stan
ding
thro
ugho
ut e
ach
perio
d.
For t
he P
erio
dFo
r the
Per
iod
Mar
ch 1
, 201
7Fo
r the
For t
heFo
r the
For t
heAp
ril 3
0, 2
012*
**th
roug
hYe
ar E
nded
Year
End
edYe
ar E
nded
Year
End
edth
roug
hSe
ptem
ber 3
0, 2
017*
*Fe
brua
ry 2
8, 2
017
Febr
uary
29,
201
6Fe
brua
ry 2
8, 2
015
Febr
uary
28,
201
4Fe
brua
ry 2
8, 2
013
Net a
sset
val
ue, b
egin
ning
of p
erio
d26
.71
$
26
.21
$
26
.29
$
26
.45
$
25
.28
$
25
.00
$
In
com
e fr
om In
vest
men
t Ope
ratio
ns:
Net i
nves
tmen
t los
s1(0
.03)
(0
.47)
(0
.51)
(0
.41)
(0
.50)
(0
.16)
Ne
t rea
lized
and
unr
ealiz
ed g
ain
on in
vest
men
ts0.
72
1.41
1.70
0.54
1.72
0.46
Tota
l fro
m in
vest
men
t ope
ratio
ns0.
69
0.94
1.19
0.13
1.22
0.30
Less
Dist
ribut
ions
:Fr
om n
et re
alize
d ga
in-
(0.4
4)
(1.2
7)
(0.2
9)
(0.0
5)
(0.0
2)
Tota
l dist
ribut
ions
-
(0
.44)
(1
.27)
(0
.29)
(0
.05)
(0
.02)
Rede
mpt
ion
fee
proc
eeds
1-
-
-
2-
2-
2-
Net a
sset
val
ue, e
nd o
f per
iod
27.4
0$
26.7
1$
26.2
1$
26.2
9$
26.4
5$
25.2
8$
Tota
l ret
urn3
2.58
%4
3.56
%4.
69%
0.52
%4.
85%
1.20
%4
Ratio
s and
Sup
plem
enta
l Dat
a:Ne
t ass
ets,
end
of p
erio
d (in
thou
sand
s)12
8,67
6$
111,
728
$
28
,648
$
16,3
60$
20
,190
$
12,8
75$
Ratio
of e
xpen
ses t
o av
erag
e ne
t ass
ets (
inclu
ding
div
iden
ds o
n se
curit
ies s
old
shor
tan
d in
tere
st e
xpen
se):
Befo
re fe
es w
aive
d an
d ex
pens
es a
bsor
bed
3.37
%5,
63.
41%
64.
45%
63.
58%
64.
12%
65.
77%
5,6
Afte
r fee
s wai
ved
and
expe
nses
abs
orbe
d3.
37%
5,6
3.36
%6
3.74
%6
2.95
%6
3.44
%6
3.46
%5,
6
Ratio
of n
et in
vest
men
t los
s to
aver
age
net a
sset
s (in
cludi
ng d
ivid
ends
on
secu
ritie
s sol
d sh
ort a
nd in
tere
st e
xpen
se):
Befo
re fe
es w
aive
d an
d ex
pens
es a
bsor
bed
(0.1
9)%
5(1
.78)
%(3
.21)
%(2
.19)
%(2
.80)
%(4
.41)
%5
Afte
r fee
s wai
ved
and
expe
nses
abs
orbe
d(0
.19)
%5
(1.7
3)%
(2.5
0)%
(1.5
6)%
(2.1
2)%
(2.1
0)%
5
Port
folio
turn
over
rate
198%
432
3%39
3%36
0%27
0%20
5%4
* **Fi
scal
yea
r end
chan
ged
to S
epte
mbe
r 30,
effe
ctiv
e Ju
ly 2
0, 2
017
.**
*Co
mm
ence
men
t of o
pera
tions
.1
Base
d on
ave
rage
dai
ly sh
ares
out
stan
ding
for t
he p
erio
d.2
Amou
nt re
pres
ents
less
than
$0.
01 p
er sh
are.
3 4No
t ann
ualiz
ed.
5An
nual
ized.
6
Fina
ncia
l inf
orm
atio
n fro
m A
pril
30, 2
012
thro
ugh
Dece
mbe
r 18,
201
6 is
for t
he V
ival
di O
rinda
Mac
ro O
ppor
tuni
ties F
und,
whi
ch w
as re
orga
nize
d in
to th
e Vi
vald
i Mul
ti-St
rate
gy F
und
as o
f the
clo
se o
f bus
ines
s Dec
embe
r 18,
201
6.
Tota
lret
urns
wou
ldha
vebe
enlo
wer
had
expe
nses
notb
een
wai
ved
orab
sorb
edby
the
Advi
sor.
Retu
rns
show
ndo
notr
efle
ctth
ede
duct
ion
ofta
xes
that
ash
areh
olde
rwou
ldpa
yon
Fund
dist
ribut
ions
orth
ere
dem
ptio
nof
Fund
shar
es.
Ifin
tere
stex
pens
ean
ddi
vide
ndso
nse
curit
iess
old
shor
thad
been
exclu
ded,
the
expe
nse
ratio
swou
ldha
vebe
enlo
wer
edby
1.42
%fo
rthe
perio
den
ded
Sept
embe
r30,
2017
.For
the
prio
rper
iods
,the
ratio
swou
ldha
vebe
enlo
wer
edby
1.20
%, 1
.27%
, 0.5
7%, 0
.81%
and
0.8
0%, r
espe
ctiv
ely.
See
acco
mpa
nyin
g No
tes t
o Fi
nanc
ial S
tate
men
ts.
50

WV
CONC
ENTR
ATED
EQ
UITI
ES F
UND
FINA
NCIA
L HIG
HLIG
HTS
Clas
s A
Per s
hare
ope
ratin
g pe
rform
ance
.Fo
r a ca
pita
l sha
re o
utst
andi
ng th
roug
hout
the
perio
d.
For t
he P
erio
dM
ay 1
, 201
7*
thro
ugh
Sept
embe
r 30,
201
7N
et a
sset
val
ue, b
egin
ning
of p
erio
d25
.00
$
Inco
me
from
Inve
stm
ent O
pera
tions
:Ne
t inv
estm
ent l
oss1
(0.0
5)
Ne
t rea
lized
and
unr
ealiz
ed lo
ss o
n in
vest
men
ts, s
ecur
ities
sold
shor
t, w
ritte
n op
tions
cont
ract
s and
fore
ign
curr
ency
(0.1
0)
To
tal f
rom
inve
stm
ent o
pera
tions
(0.1
5)
Net
ass
et v
alue
, end
of p
erio
d24
.85
$
Tota
l ret
urn2
(0.6
0)%
3
Ratio
s and
Sup
plem
enta
l Dat
a:Ne
t ass
ets,
end
of p
erio
d (in
thou
sand
s)1
$
Ratio
of e
xpen
ses t
o av
erag
e ne
t ass
ets (
inclu
ding
div
iden
ds o
n se
curit
ies s
old
shor
tan
d in
tere
st e
xpen
se)
1.51
%4,
5
Ratio
of n
et in
vest
men
t los
s to
aver
age
net a
sset
s (in
cludi
ng d
ivid
ends
on
secu
ritie
s sol
d sh
ort a
nd in
tere
st e
xpen
se)
(0.4
8)%
4
Port
folio
turn
over
rate
84%
3
*Co
mm
ence
men
t of o
pera
tions
.1
Base
d on
ave
rage
dai
ly sh
ares
out
stan
ding
for t
he p
erio
d.2 3
Not a
nnua
lized
. 4
Annu
alize
d.5
Retu
rns s
how
n in
clude
Rul
e 12
b-1
fees
of u
p to
0.2
5% a
nd d
o no
t ref
lect
the
dedu
ctio
n of
taxe
s tha
t a sh
areh
olde
r wou
ld p
ay o
n Fu
nd d
istrib
utio
ns o
r the
rede
mpt
ion
of F
und
shar
es.
If in
tere
st a
nd d
ivid
ends
on
secu
ritie
s sol
d sh
ort a
nd in
tere
st e
xpen
se h
ad b
een
exclu
ded,
the
expe
nse
ratio
s wou
ld h
ave
been
low
ered
by
0.12
% fo
r the
per
iod
ende
d Se
ptem
ber 3
0, 2
017.
See
acco
mpa
nyin
g N
otes
to F
inan
cial S
tate
men
ts.
51

WV
CONC
ENTR
ATED
EQ
UITI
ES F
UND
FINA
NCIA
L HIG
HLIG
HTS
Clas
s I
Per s
hare
ope
ratin
g pe
rform
ance
.Fo
r a ca
pita
l sha
re o
utst
andi
ng th
roug
hout
the
perio
d.
For t
he P
erio
dM
ay 1
, 201
7*
thro
ugh
Sept
embe
r 30,
201
7N
et a
sset
val
ue, b
egin
ning
of p
erio
d25
.00
$
Inco
me
from
Inve
stm
ent O
pera
tions
:Ne
t inv
estm
ent l
oss1
(0.0
2)
Ne
t rea
lized
and
unr
ealiz
ed lo
ss o
n in
vest
men
ts, s
ecur
ities
sold
shor
t, w
ritte
n op
tions
cont
ract
s and
fore
ign
curr
ency
(0.1
1)
To
tal f
rom
inve
stm
ent o
pera
tions
(0.1
3)
Net
ass
et v
alue
, end
of p
erio
d24
.87
$
Tota
l ret
urn2
(0.5
2)%
3
Ratio
s and
Sup
plem
enta
l Dat
a:Ne
t ass
ets,
end
of p
erio
d (in
thou
sand
s)21
0,32
3$
Ratio
of e
xpen
ses t
o av
erag
e ne
t ass
ets (
inclu
ding
div
iden
ds o
n se
curit
ies s
old
shor
tan
d in
tere
st e
xpen
se)
1.26
%4,
5
Ratio
of n
et in
vest
men
t los
s to
aver
age
net a
sset
s (in
cludi
ng d
ivid
ends
on
secu
ritie
s sol
d sh
ort a
nd in
tere
st e
xpen
se)
(0.2
3)%
4
Port
folio
turn
over
rate
84%
3
*Co
mm
ence
men
t of o
pera
tions
.1
Base
d on
ave
rage
dai
ly sh
ares
out
stan
ding
for t
he p
erio
d.2 3
Not a
nnua
lized
. 4
Annu
alize
d.5
Retu
rns s
how
n do
not
refle
ct th
e de
duct
ion
of ta
xes t
hat a
shar
ehol
der w
ould
pay
on
Fund
dist
ribut
ions
or t
he re
dem
ptio
n of
Fun
d sh
ares
.
If in
tere
st a
nd d
ivid
ends
on
secu
ritie
s sol
d sh
ort a
nd in
tere
st e
xpen
se h
ad b
een
exclu
ded,
the
expe
nse
ratio
s wou
ld h
ave
been
low
ered
by
0.12
% fo
r the
per
iod
ende
d Se
ptem
ber 3
0, 2
017.
See
acco
mpa
nyin
g N
otes
to F
inan
cial S
tate
men
ts.
52

Vivaldi Funds NOTES TO FINANCIAL STATEMENTS September 30, 2017 Note 1 – Organization Vivaldi Merger Arbitrage Fund (the ‘‘Merger Arbitrage Fund’’), Vivaldi Multi-Strategy Fund (the “Multi-Strategy Fund”) and WV Concentrated Equities Fund (the “Concentrated Equities Fund”) (each a “Fund” and collectively the ‘‘Funds’’) are organized as a series of Investment Managers Series Trust II, a Delaware statutory trust (the “Trust”) which is registered as an open-end management investment company under the Investment Company Act of 1940, as amended (the “1940 Act”). The Multi-Strategy Fund is a diversified fund. The Merger Arbitrage Fund and the Concentrated Equities Fund are non-diversified funds. The Merger Arbitrage Fund seeks returns that are largely uncorrelated with the returns of the general stock market and capital appreciation. The Fund commenced investment operations on October 1, 2015 with Class A and Class I shares. Prior to that date, its only activity was the receipt of a $1,000 investment from principals of the Fund’s advisor and a transfer of 307,251 newly issued shares of the Fund’s Class I in exchange for the net assets of the Highland Capital Management Institutional Fund, LLC, a Delaware limited liability company (the “Company”) valued at $3,073,511. This exchange was nontaxable. The primary assets received by the Fund were cash, interest receivable and securities of the Company with a fair value of $2,249,946 (identified cost of investments transferred were $2,271,450), totaling $3,073,511. For financial reporting purposes, assets received and shares issued by the Fund were recorded at fair value; however, the cost basis of the investments received from the Company was carried forward to align ongoing reporting of the Fund’s realized and unrealized gains and losses with amounts distributable to shareholders for tax purposes. The Multi-Strategy Fund seeks to achieve long-term capital appreciation by pursuing positive absolute returns across market cycles. In pursuing its objective, the Fund seeks to generate attractive long-term returns with low sensitivity to traditional equity and fixed-income indices. The Fund commenced investment operations on April 30, 2012, with two classes of shares, Class A and Class I. Effective July 20, 2017, the Fund changed fiscal year ends from February 28th to September 30th. The WV Concentrated Equities Fund seeks growth of capital over the long term. The Fund commenced investment operations on May 1, 2017 with Class A and Class I shares. Prior to that date, its only activity was the receipt of a $2,000 investment from principals of the Fund’s advisor and a transfer of 12,741,561 shares of the Fund’s Class I shares in exchange for the net assets of the WHI Growth Fund, L.P. (the “Company”), a Delaware limited partnership, and WHI Growth Q.P., L.P. (the “Master Fund”), an Illinois limited partnership valued at $318,539,019. This exchange was nontaxable. The primary assets received by the Fund were cash, receivables and securities of the Company with a fair value of $278,318,635 (identified cost of investments transferred were $245,755,280), totaling $318,539,019. For financial reporting purposes, assets received and shares issued by the Fund were recorded at fair value; however, the cost basis of the investments received from the Company was carried forward to align ongoing reporting of the Fund’s realized and unrealized gains and losses with amounts distributable to shareholders for tax purposes. The shares of each class of each Fund represent an interest in the same portfolio of investments of each particular Fund and have equal rights as to voting, redemptions, dividends and liquidation, subject to the approval of the Trustees. Income, expenses (other than expenses attributable to a specific class) and realized and unrealized gains and losses on investments are allocated to each class of shares in proportion to their relative shares outstanding. Shareholders of a class that bears distribution and service expenses under the terms of a distribution plan have exclusive voting rights to that distribution plan. Each Fund is an investment company and accordingly follows the investment company accounting and reporting guidance of the Financial Accounting Standards Board (FASB) Accounting Standard Codification Topic 946 “Financial Services—Investment Companies.”
53

Vivaldi Funds NOTES TO FINANCIAL STATEMENTS - Continued September 30, 2017 Note 2 – Accounting Policies The following is a summary of the significant accounting policies consistently followed by the Funds in the preparation of their financial statements. The preparation of financial statements in conformity with accounting principles generally accepted in the United States of America (“GAAP”) requires management to make estimates and assumptions that affect the reported amounts and disclosures in the financial statements. Actual results could differ from these estimates. (a) Valuation of Investments The Funds value equity securities at the last reported sale price on the principal exchange or in the principal over the counter (“OTC”) market in which such securities are traded, as of the close of regular trading on the NYSE on the day the securities are being valued or, if the last-quoted sales price is not readily available, the securities will be valued at the last bid or the mean between the last available bid and ask price. Securities traded on the NASDAQ are valued at the NASDAQ Official Closing Price (“NOCP”). Options are valued at the mean between the last available bid and asked prices used. Debt securities are valued by utilizing a price supplied by independent pricing service providers. The independent pricing service providers may use various valuation methodologies including matrix pricing and other analytical pricing models as well as market transactions and dealer quotations. These models generally consider such factors as yields or prices of bonds of comparable quality, type of issue, coupon, maturity, ratings and general market conditions. If a price is not readily available for a portfolio security, the security will be valued at fair value (the amount which the Funds might reasonably expect to receive for the security upon its current sale) as determined in good faith by the Funds’ advisor, subject to review and approval by the Valuation Committee, pursuant to procedures adopted by the Board of Trustees. The actions of the Valuation Committee are subsequently reviewed by the Board at its next regularly scheduled board meeting. The Valuation Committee meets as needed. The Valuation Committee is comprised of all the Trustees, but action may be taken by any one of the Trustees. (b) Foreign Currency Translation The Funds’ records are maintained in U.S. dollars. The value of securities, currencies and other assets and liabilities denominated in currencies other than U.S. dollars are translated into U.S. dollars based upon foreign exchange rates prevailing at the end of the reporting period. The currencies are translated into U.S. dollars by using the exchange rates quoted as of 4:00 PM Eastern Standard Time. Purchases and sales of investment securities, income and expenses are translated on the respective dates of such transactions. The Funds do not isolate that portion of their net realized and unrealized gains and losses on investments resulting from changes in foreign exchange rates from the impact arising from changes in market prices. Such fluctuations are included with net realized and unrealized gain or loss from investments and foreign currency. Net realized foreign currency transaction gains and losses arise from sales of foreign currencies, currency gains or losses realized between the trade and settlement dates on securities transactions, and the differences between the amounts of dividends, interest, and foreign withholding taxes recorded on the Funds’ books and the U.S. dollar equivalent of the amounts actually received or paid. Net unrealized foreign currency translation gains and losses arise from changes in the value of assets and liabilities, other than investments in securities, resulting from changes in the exchange rates. (c) Short Sales Short sales are transactions under which the Funds sell a security they do not own in anticipation of a decline in the value of that security. To complete such a transaction, the Funds must borrow the security to make delivery to the buyer. The Funds then are obligated to replace the security borrowed by purchasing the security at market price at the time of replacement. The price at such time may be more or less than the price at which the security
54

Vivaldi Funds NOTES TO FINANCIAL STATEMENTS - Continued September 30, 2017 was sold by the Funds. When a security is sold short, a decrease in the value of the security will be recognized as a gain and an increase in the value of the security will be recognized as a loss, which is potentially limitless. Until the security is replaced, the Funds are required to pay the lender amounts equal to dividend or interest that accrue during the period of the loan which is recorded as an expense. To borrow the security, the Funds also may be required to pay a premium or an interest fee, which are recorded as interest expense. Cash or securities are segregated for the broker to meet the necessary margin requirements. The Funds are subject to the risk that they may not always be able to close out a short position at a particular time or at an acceptable price. (d) Options The Funds may write or purchase options contracts primarily to enhance the Funds’ returns or reduce volatility. In addition, the Funds may utilize options in an attempt to generate gains from option premiums or to reduce overall portfolio risk. When a Fund writes or purchases an option, an amount equal to the premium received or paid by a Fund is recorded as a liability or an asset and is subsequently adjusted to the current market value of the option written or purchased. Premiums received or paid from writing or purchasing options which expire unexercised are treated by a Fund on the expiration date as realized gains or losses. The difference between the premium and the amount paid or received on effecting a closing purchase or sale transaction, including brokerage commissions, is also treated as a realized gain or loss. If an option is exercised, the premium paid or received is added to the cost of the purchase or proceeds from the sale in determining whether a Fund has realized a gain or a loss on investment transactions. A Fund, as a writer of an option, may have no control over whether the underlying securities may be sold (call) or purchased (put) and as a result bears the market risk of an unfavorable change in the price of the security underlying the written option. (e) Exchange Traded Funds (“ETFs”) ETFs typically trade on securities exchanges and their shares may, at times, trade at a premium or discount to their net asset values. In addition, an ETF may not replicate exactly the performance of the benchmark index it seeks to track for a number of reasons, including transaction costs incurred by the ETF, the temporary unavailability of certain index securities in the secondary market or discrepancies between the ETF and the index with respect to the weighting of securities or the number of securities held. Investing in ETFs, which are investment companies, may involve duplication of advisory fees and certain other expenses. As a result, Fund shareholders indirectly bear their proportionate share of these acquired expenses. Therefore, the cost of investing in the Fund will be higher than the cost of investing directly in ETFs and may be higher than other mutual funds that invest directly in securities. Each ETF in which each Fund invests are subject to specific risks, depending on the nature of the ETF. Each ETF is subject to the risks associated with direct ownership of the securities comprising the index on which the ETF is based. These risks could include liquidity risk, sector risk, and risks associated with fixed-income securities. (f) Closed-end Funds (“CEFs”) The Multi-Strategy Fund may invest in shares of CEFs. A CEF is a pooled investment vehicle that is registered under the Investment Company Act of 1940 and whose shares are listed and traded on U.S. national securities exchanges. Investments in CEFs are subject to various risks, including reliance on management’s ability to meet a CEF’s investment objective and to manage a CEF’s portfolio, and fluctuation in the market value of a CEF’s shares compared to the changes in the value of the underlying securities that the CEF owns. In addition, the Fund bears a pro rata share of the management fees and expenses of each underlying CEF, which results in the Fund’s shareholders being subject to higher expenses than if they invested directly in the CEFs.
55

Vivaldi Funds NOTES TO FINANCIAL STATEMENTS - Continued September 30, 2017 (g) Futures Contracts Each Fund may enter into futures contracts (including contracts relating to foreign currencies, interest rates, commodities securities and other financial indexes and other commodities), and purchase and write (sell) related options traded on exchanges designated by the Commodity Futures Trading Commission (“CFTC”) or, consistent with CFTC regulations, on foreign exchanges. A futures contract provides for the future sale by one party and the purchase by the other party of a specified amount of a commodity, such as an energy, financial agricultural or metal commodity, at a specified price, date, time and place. For example, a foreign currency futures contract provides for the future sale by one party and the purchase by the other party of a certain amount of a specified non-U.S. currency at a specified price, date, time and place. Similarly, an interest rate futures contract provides for the future sale by one party and the purchase by the other party of a certain amount of a specific interest rate sensitive financial instrument (e.g., a debt security) at a specified price, date, time and place. Securities, commodities and other financial indexes are capitalization weighted indexes that reflect the market value of the securities, commodities or other financial instruments respectively, represented in the indexes. A futures contract on an index is an agreement to be settled by delivery of an amount of cash equal to a specified multiplier times the difference between the value of the index at the close of the last trading day on the contract and the price at which the agreement is made. The clearing house of the exchange on which a futures contract is entered into becomes the counterparty to each purchaser and seller of the futures contract. A futures contract held by a Fund is valued daily at the official settlement price on the exchange on which it is traded. In computing daily net asset value, the Fund will mark to market its open futures positions. The Fund also is required to deposit and to maintain margin with respect to put and call options on futures contracts written by it. Such margin deposits will vary depending on the nature of the underlying futures contract (and the related initial margin requirements), the current market value of the option and other futures positions held by the Fund. Although some futures contracts call for making or taking delivery of the underlying assets, generally these obligations are closed out prior to delivery by offsetting purchases or sales of matching futures contracts (involving the same exchange, underlying security or index and delivery month). If an offsetting purchase price is less than the original sale price, a Fund realizes a capital gain, or if it is more, the Fund realizes a capital loss. Conversely, if an offsetting sale price is more than the original purchase price, a Fund realizes a capital gain, or if it is less, the Fund realizes a capital loss. The transaction costs also must be included in these calculations. As discussed below, however, the Fund may not always be able to make an offsetting purchase or sale. In the case of a physically settled futures contract, this could result in the Fund being required to deliver, or receive, the underlying physical commodity, which could be adverse to the Fund. At any time prior to the expiration of a futures contract, the Fund may seek to close the position by seeking to take an opposite position, which would operate to terminate the Fund’s existing position in the contract. Positions in futures contracts and options on futures contracts may be closed out only on the exchange on which they were entered into (or through a linked exchange). No secondary market for such contracts exists. Although the Fund may enter into futures contracts only if there is an active market for such contracts, there is no assurance that an active market will exist at any particular time. Most futures exchanges limit the amount of fluctuation permitted in futures contract prices during a single trading day. Once the daily limit has been reached in a particular contract, no trades may be made that day at a price beyond that limit or trading may be suspended for specified periods during the day. It is possible that futures contract prices could move to the daily limit for several consecutive trading days with little or no trading, thereby preventing prompt liquidation of futures positions at an advantageous price and subjecting the Fund to substantial losses. In such event, and in the event of adverse price movements, the Fund would be required to make daily cash payments of variation margin. In such situations, if the Fund had insufficient cash, it might have to sell assets to meet daily variation margin requirements at a time when it would be disadvantageous to do so. In addition, if the transaction is entered into for hedging purposes, in such circumstances the Fund may realize a loss on a futures contract or option that is not offset by an increase in the
56
Vivaldi Funds NOTES TO FINANCIAL STATEMENTS - Continued September 30, 2017 value of the hedged position. Losses incurred in futures transactions and the costs of these transactions will affect the Fund’s performance. (h) Short-Term Investments The Multi-Strategy Fund invests a significant amount (27.1% as of September 30, 2017) in the Morgan Stanley Institutional Liquidity Fund – Government Portfolio (“MVRXX”). MVRXX invests exclusively in a portfolio of short-term U.S. Treasury securities, as well as repurchase agreements collateralized fully by U.S. Treasury securities. The Fund may also hold cash. MVRXX files complete Semi-Annual and Annual Reports with the U.S. Securities and Exchange Commission for semi-annual and annual periods of each fiscal year on Form N-CSR. The Forms N-CSR are available on the website of the U.S. Securities and Exchange Commission at www.sec.gov, and may also be viewed and copied at the Commission’s Public Reference Room in Washington, DC. Information on the operation of the Public Reference Room may be obtained by calling 1-800-SEC-0330. The net expense ratio per April 30, 2017 Semi-Annual report of Morgan Stanley Institutional Liquidity Fund – Government Portfolio was 0.17%. (i) Investment Transactions, Investment Income and Expenses Investment transactions are accounted for on the trade date. Realized gains and losses on investments are determined on the identified cost basis. Dividend income is recorded net of applicable withholding taxes on the ex-dividend date and interest income is recorded on an accrual basis. Withholding taxes on foreign dividends, if applicable, are paid (a portion of which may be reclaimable) or provided for in accordance with the applicable country’s tax rules and rates and are disclosed in the Statement of Operations. Withholding tax reclaims are filed in certain countries to recover a portion of the amounts previously withheld. The Fund records a reclaim receivable based on a number of factors, including a jurisdiction’s legal obligation to pay reclaims as well as payment history and market convention. Discounts or premiums on debt securities are accreted or amortized to interest income over the lives of the respective securities using the effective interest method. Expenses incurred by the Trust with respect to more than one Fund are allocated in proportion to the net assets of each Fund except where allocation of direct expenses to each Fund or an alternative allocation method can be more appropriately made. The Multi-Strategy Fund incurred offering costs of approximately $26,993, which are being amortized over a one-year period from December 19, 2016. The Concentrated Equities Fund incurred offering costs of approximately $19,730, which are being amortized over a one-year period from May 1, 2017. (j) Federal Income Taxes The Funds intend to comply with the requirements of Subchapter M of the Internal Revenue Code applicable to regulated investment companies and to distribute substantially all of its net investment income and any net realized gains to its shareholders. Therefore, no provision is made for federal income or excise taxes. Due to the timing of dividend distributions and the differences in accounting for income and realized gains and losses for financial statement and federal income tax purposes, the fiscal year in which amounts are distributed may differ from the year in which the income and realized gains and losses are recorded by the Funds. Accounting for Uncertainty in Income Taxes (the “Income Tax Statement”) requires an evaluation of tax positions taken (or expected to be taken) in the course of preparing a Fund’s tax returns to determine whether these positions meet a “more-likely-than-not” standard that, based on the technical merits, have a more than fifty percent likelihood of being sustained by a taxing authority upon examination. A tax position that meets the “more-likely-than-not” recognition threshold is measured to determine the amount of benefit to recognize in the financial
57

Vivaldi Funds NOTES TO FINANCIAL STATEMENTS - Continued September 30, 2017 statements. The Funds recognize interest and penalties, if any, related to unrecognized tax benefits as income tax expense in the Statements of Operations. The Income Tax Statement requires management of the Funds to analyze tax positions taken in the prior three open tax years, if any, and tax positions expected to be taken in the Funds’ current tax year, as defined by the IRS statute of limitations for all major jurisdictions, including federal tax authorities and certain state tax authorities. As of September 30, 2017 and during the prior three open tax years, the Funds did not have a liability for any unrecognized tax benefits. The Funds have no examination in progress and are not aware of any tax positions for which it is reasonably possible that the total amounts of unrecognized tax benefits will significantly change in the next twelve months. (k) Distributions to Shareholders The Funds will make distributions of net investment income, per the table below and capital gains, if any, at least annually. Distributions to shareholders are recorded on the ex-dividend date. The amount and timing of distributions are determined in accordance with federal income tax regulations, which may differ from GAAP.
Distribution Frequency of Net Investment Income
Merger Arbitrage Fund Annually Multi-Strategy Fund Annually Concentrated Equities Fund Annually
The character of distributions made during the year from net investment income or net realized gains may differ from the characterization for federal income tax purposes due to differences in the recognition of income, expense and gain (loss) items for financial statement and tax purposes. Note 3 – Investment Advisory and Other Agreements The Trust, on behalf of the Funds, entered into an Investment Advisory Agreement (the “Agreement”) with Vivaldi Asset Management, LLC (the “Advisor”). Under the terms of the Agreement, the Funds pay a monthly investment advisory fee to the Advisor. The annual rates are listed by Fund in the table below. The Advisor has contractually agreed to waive its fee and/or pay for operating expenses (excluding any taxes, leverage interest, acquired fund fees and expenses (as determined in accordance with Form N-1A), dividend and interest expense on short sales, brokerage commissions, expenses incurred in connection with any merger or reorganization and extraordinary expenses such as litigation expenses) in order to limit total annual operating expenses (an “Expense Cap”) for the Merger Arbitrage Fund and Multi-Strategy Fund. This agreement is in effect until January 31, 2018 for the Merger Arbitrage Fund and is in effect until December 16, 2018 for the Multi-Strategy Fund. Both agreements may be terminated before these dates only by the Trust’s Board of Trustees. The table below contains the Expense Cap by Fund and by Class.
Investment Total Limit on Annual Total Limit on Annual Advisory Operating Expenses Operating Expenses
Fees Class A Shares† Class I Shares† Merger Arbitrage Fund 1.25% 1.85% 1.55% Multi-Strategy Fund 1.60% 2.25% 1.95% Concentrated Equities Fund 0.85% 1.45% 1.20%
58
Vivaldi Funds NOTES TO FINANCIAL STATEMENTS - Continued September 30, 2017 †The total limit on annual operating expenses is calculated based on each Fund’s average daily net assets. The Advisor has engaged Crescat Portfolio Management, LLC and RiverNorth Capital Management, LLC, (each, a "Sub-Advisor" and together, the “Sub-Advisors”) to manage the assets of the Multi-Strategy Fund and pays the Sub-Advisors from its advisory fees. For the period ended September 30, 2017, the Advisor recovered $56,534 of its previously waived advisory fees and other absorbed expenses for the Merger Arbitrage Fund. Other than the Voluntary Limitations, the Advisor may recover from each Fund’s fees and/or expenses previously waived and/or absorbed, if the Fund’s expense ratio, including the recovered expenses, falls below the expense limit at which they were waived. The Advisor is permitted to seek reimbursement from the Fund, subject to certain limitations, of fees waived or payments made to the Fund for a period ending three full fiscal years after the date of the waiver or payment. This reimbursement may be requested from the Fund if the reimbursement will not cause the Fund’s annual expense ratio to exceed the lesser of (a) the expense limitation amount in effect at the time such fees were waived or payments made, or (b) the expense limitation amount in effect at the time of the reimbursement. At September 30, 2017, the amount of these potentially recoverable expenses was $196,628. The Advisor may recapture all or a portion of this amount no later than September 30, 2019. For the period ended September 30, 2017, the Advisor did not waive its fees or absorb other expenses for the Multi-Strategy Fund. The Advisor may recover from the Fund fees and/or expenses previously waived and/or absorbed, if the Fund’s expense ratio, including the recovered expenses, falls below the expense at which they were waived. The Fund’s advisor is permitted to seek reimbursement from the Fund, subject to certain limitations, of fees waived or payments made to the Fund for a period ending three full fiscal years after the date of the waiver or payment. This reimbursement may be requested from the Fund if the reimbursement will not cause the Fund’s annual expense ratio to exceed the lesser of (a) the expense limitation amount in effect at the time such fees were waived or payments made, or (b) the expense limitation amount in effect at the time of the reimbursement. At September 30, 2017, the amount of these potentially recoverable expenses was $0. Prior to the close of business on December 18, 2016, the investment advisory services were provided to the Multi-Strategy Fund by Orinda Asset Management LLC (the “Previous Advisor”), which received investment management fees for their services pursuant to the terms of the investment advisory agreements for the Fund. The investment advisory fees, which were computed daily and paid monthly, were payable at the following annual rate for the Fund, calculated as a percentage of the Fund’s average daily net assets of 1.75%. The Previous Advisor paid a portion of the fee it received from the Fund to Vivaldi Asset Management, LLC and Crescat Portfolio Management, LLC as compensation for subadvisory services to the Fund. For the year ended February 28, 2017, the Previous Advisor waived its fees and absorbed other expenses totaling $42,251. IMST Distributors, LLC serves as the Funds’ distributor; UMB Fund Services, Inc. (“UMBFS”) serves as the Funds’ fund accountant, transfer agent and co-administrator; and Mutual Fund Administration, LLC (“MFAC”) serves as the Funds’ other co-administrator. UMB Bank, n.a., an affiliate of UMBFS, serves as the Funds’ custodian. The Merger Arbitrage Fund has a fee arrangement with its custodian, UMB Bank, n.a., which provides for custody fees to be reduced by earning credits based on cash balances left on deposit with the custodian. For the period ended September 30, 2017, the total fees reduced by earning credits were $11,061. Such amount is shown as a reduction of expenses, “Fees paid indirectly,” on the Statements of Operations.
59
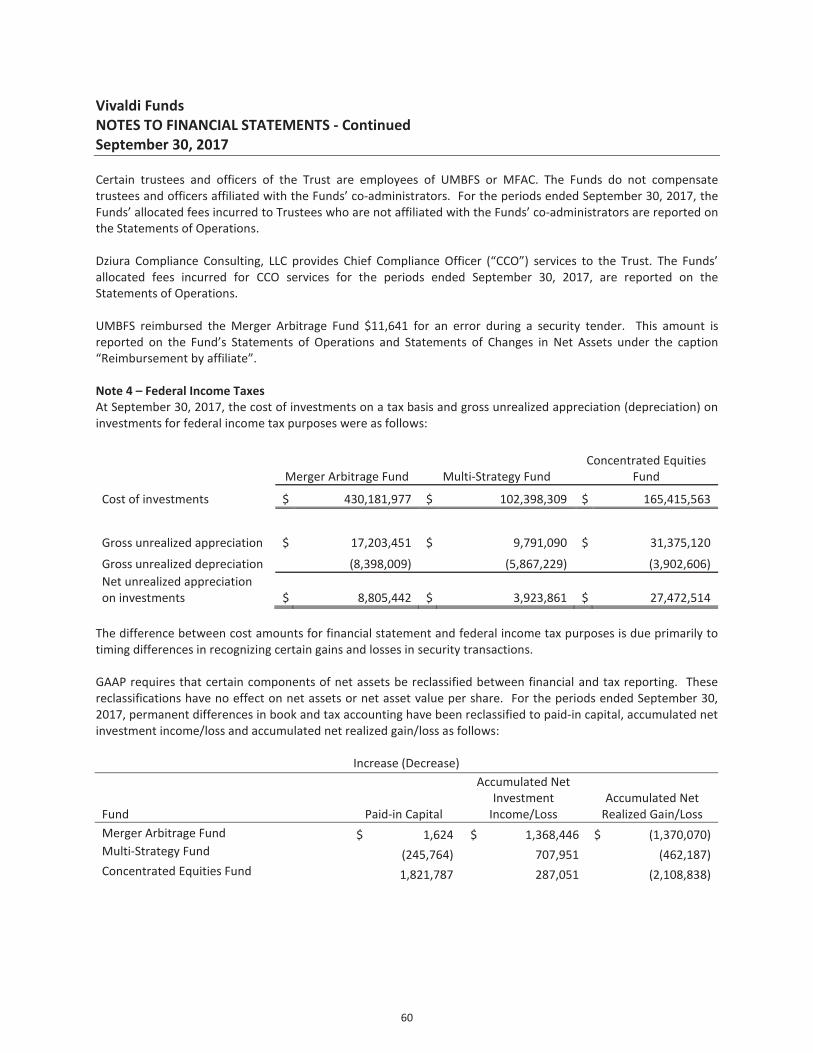
Vivaldi Funds NOTES TO FINANCIAL STATEMENTS - Continued September 30, 2017 Certain trustees and officers of the Trust are employees of UMBFS or MFAC. The Funds do not compensate trustees and officers affiliated with the Funds’ co-administrators. For the periods ended September 30, 2017, the Funds’ allocated fees incurred to Trustees who are not affiliated with the Funds’ co-administrators are reported on the Statements of Operations. Dziura Compliance Consulting, LLC provides Chief Compliance Officer (“CCO”) services to the Trust. The Funds’ allocated fees incurred for CCO services for the periods ended September 30, 2017, are reported on the Statements of Operations. UMBFS reimbursed the Merger Arbitrage Fund $11,641 for an error during a security tender. This amount is reported on the Fund’s Statements of Operations and Statements of Changes in Net Assets under the caption “Reimbursement by affiliate”. Note 4 – Federal Income Taxes At September 30, 2017, the cost of investments on a tax basis and gross unrealized appreciation (depreciation) on investments for federal income tax purposes were as follows:
Merger Arbitrage Fund Multi-Strategy Fund Concentrated Equities
Fund
Cost of investments $ 430,181,977 $ 102,398,309 $ 165,415,563
Gross unrealized appreciation $ 17,203,451 $ 9,791,090 $ 31,375,120 Gross unrealized depreciation (8,398,009) (5,867,229) (3,902,606) Net unrealized appreciation on investments $ 8,805,442 $ 3,923,861 $ 27,472,514
The difference between cost amounts for financial statement and federal income tax purposes is due primarily to timing differences in recognizing certain gains and losses in security transactions. GAAP requires that certain components of net assets be reclassified between financial and tax reporting. These reclassifications have no effect on net assets or net asset value per share. For the periods ended September 30, 2017, permanent differences in book and tax accounting have been reclassified to paid-in capital, accumulated net investment income/loss and accumulated net realized gain/loss as follows:
Increase (Decrease)
Fund
Paid-in Capital
Accumulated Net Investment
Income/Loss Accumulated Net
Realized Gain/Loss Merger Arbitrage Fund $ 1,624 $ 1,368,446 $ (1,370,070) Multi-Strategy Fund (245,764) 707,951 (462,187) Concentrated Equities Fund 1,821,787 287,051 (2,108,838)
60

Vivaldi Funds NOTES TO FINANCIAL STATEMENTS - Continued September 30, 2017 As of September 30, 2017, the components of accumulated earnings (deficit) on a tax basis were as follows:
Merger Arbitrage Fund Multi-Strategy Fund Concentrated Equities
Fund Undistributed ordinary income $ 7,633,229 $ 1,107,765 $ - Undistributed long-term capital gains - 1,868,585 - Accumulated earnings 7,633,229 2,976,350 -
Accumulated capital and other losses - - (67,608) Unrealized appreciation on investments 8,805,442 3,923,861 27,472,514 Unrealized depreciation on foreign currency - (113,927) (428) Total accumulated earnings $ 16,438,671 $ 6,786,284 $ 27,404,478 The tax character of distributions paid during the periods ended September 30, 2017 and September 30, 2016 was as follows:
Merger Arbitrage Fund Multi-Strategy Fund Concentrated Equities Fund
Distribution paid from: 2017 2016 2017 2016 2017 Ordinary income $ 256,827 $ 13,070 $ - $ - $ - Net long-term capital gains 412 - - - -
Total taxable distributions $ 257,239 $ 13,070 $ - $ - $ - At September 30, 2017, the Funds had accumulated capital loss carryforwards as follows:
Post-October capital losses incurred after October 31 and within the taxable year are deemed to arise on the first business day of the Funds’ next taxable year. As of September 30, 2017, the following Funds had Post-October capital losses, which are deferred until October 1, 2018 for tax purposes:
Not Subject to Expiration Fund Short-Term Long-Term Total Merger Arbitrage Fund $ - $ - $ - Multi-Strategy Fund - - - Concentrated Equities Fund 67,608 - 67,608
Post-October Capital Losses Fund Short-Term Long-Term Total Merger Arbitrage Fund $ - $ - $ - Multi-Strategy Fund - - - Concentrated Equities Fund - - -
61

Vivaldi Funds NOTES TO FINANCIAL STATEMENTS - Continued September 30, 2017 Under the Regulated Investment Company Modernization Act of 2010 (the "Act"), the Fund is permitted to carryforward capital losses incurred in taxable years beginning after December 22, 2010, for an unlimited period. However, any losses incurred during those future taxable years will be required to be utilized prior to the losses incurred in pre-enactment taxable years. As a result of this ordering rule, pre-enactment capital loss carryforwards may be more likely to expire unused. Additionally, post-enactment capital losses that are carried forward will retain their character as either short-term or long-term capital losses rather than being considered all short-term as under previous law. Note 5 – Redemption Fee The Merger Arbitrage Fund may impose a redemption fee of 1.00% of the total redemption amount on all shares redeemed within 30 days of purchase. For the year ended September 30, 2017 and for the year ended September 30, 2016, the Fund received $15,807 and $13,986, respectively, in redemption fees. Note 6 – Investment Transactions For the periods ended September 30, 2017, purchases and sales of investments, excluding short-term investments, were as follows:
Purchases Sales
Proceeds from Securities Sold
Short Cover Short Securities
Merger Arbitrage Fund $2,384,595,392 $2,218,467,334 $479,841,822 $446,504,667 Multi-Strategy Fund 240,251,147 245,633,684 111,731,089 101,635,598 Concentrated Equities Fund 219,487,484 349,812,224 32,510,123 37,425,279
Note 7 – Distribution Plan The Trust, on behalf of the Funds, has adopted a Distribution Plan (the “Plan”) pursuant to Rule 12b-1 under the 1940 Act that allows the Funds to pay distribution fees for the sale and distribution of its shares. With respect to Class A, the Plan provides for the payment of distribution fees at the annual rate of up to 0.25% of average daily net assets. Class I does not pay any distribution fees. For the periods ended September 30, 2017, distribution fees incurred are disclosed on the Statements of Operations. Note 8 – Shareholder Servicing Plan The Trust, on behalf of the Merger Arbitrage Fund and Multi-Strategy Fund, has adopted a Shareholder Servicing Plan to pay a fee at an annual rate of up to 0.15% of average daily net assets of Class A shares and 0.10% of average daily net assets of Class I shares serviced by shareholder servicing agents who provide administrative and support services to their customers. The Trust, on behalf of the Concentrated Equities Fund, has adopted a Shareholder Servicing Plan to pay a fee at an annual rate of up to 0.15% of average daily net assets of Class A shares and 0.15% of average daily net assets of Class I shares serviced by shareholder servicing agents who provide administrative and support services to their customers. For the periods ended September 30, 2017, shareholder servicing fees incurred are disclosed on the Statements of Operations.
62

Vivaldi Funds NOTES TO FINANCIAL STATEMENTS - Continued September 30, 2017 Note 9 – Indemnifications In the normal course of business, the Funds enter into contracts that contain a variety of representations which provide general indemnifications. The Funds’ maximum exposure under these arrangements is unknown, as this would involve future claims that may be made against the Funds that have not yet occurred. However, the Funds expect the risk of loss to be remote. Note 10 – Fair Value Measurements and Disclosure Fair Value Measurements and Disclosures defines fair value, establishes a framework for measuring fair value in accordance with GAAP, and expands disclosure about fair value measurements. It also provides guidance on determining when there has been a significant decrease in the volume and level of activity for an asset or a liability, when a transaction is not orderly, and how that information must be incorporated into a fair value measurement. Under Fair Value Measurements and Disclosures, various inputs are used in determining the value of the Funds’ investments. These inputs are summarized into three broad Levels as described below:
Level 1 – Unadjusted quoted prices in active markets for identical assets or liabilities that the Funds have the ability to access.
Level 2 – Observable inputs other than quoted prices included in Level 1 that are observable for the asset or liability, either directly or indirectly. These inputs may include quoted prices for the identical instrument on an inactive market, prices for similar instruments, interest rates, prepayment speeds, credit risk, yield curves, default rates and similar data.
Level 3 – Unobservable inputs for the asset or liability, to the extent relevant observable inputs are not available, representing the Funds’ own assumptions about the assumptions a market participant would use in valuing the asset or liability, and would be based on the best information available.
The availability of observable inputs can vary from security to security and is affected by a wide variety of factors, including for example, the type of security, whether the security is new and not yet established in the marketplace, the liquidity of markets, and other characteristics particular to the security. To the extent that valuation is based on models or inputs that are less observable or unobservable in the market, the determination of fair value requires more judgment. Accordingly, the degree of judgment exercised in determining fair value is greatest for instruments categorized in Level 3. The inputs to measure fair value may fall into different Levels of the fair value hierarchy. In such cases, for disclosure purposes, the Level in the fair value hierarchy within which the fair value measurement falls in its entirety, is determined based on the lowest Level input that is significant to the fair value measurement in its entirety.
63

Vivaldi Funds NOTES TO FINANCIAL STATEMENTS - Continued September 30, 2017 The inputs or methodology used for valuing securities are not an indication of the risk associated with investing in those securities. The following is a summary of the inputs used, as of September 30, 2017, in valuing the Funds’ assets carried at fair value:
Merger Arbitrage Fund Level 1 Level 2 Level 3*** Total Assets Investments
Common Stocks* $ 429,549,943 $ - $ - $ 429,549,943 Purchased Options Contracts 222,700 - - 222,700 Short-Term Investments 116,292,274 - - 116,292,274
Total Assets $ 546,064,917 $ - $ - $ 546,064,917 Liabilities Securities Sold Short
Common Stocks* $ 107,030,413 $ - $ - $ 107,030,413 Written Options Contracts - 47,085 - 47,085
Total Liabilities $ 107,030,413 $ 47,085 $ - $ 107,077,498
Multi-Strategy Fund Level 1 Level 2 Level 3*** Total Assets Investments
Closed-End Mutual Funds $ 26,151,610 $ - $ - $ 26,151,610 Common Stocks* 86,913,275 - - 86,913,275 Preferred Stocks 2,796,157 - - 2,796,157 Purchased Options Contracts 42,890 15,500 - 58,390 Rights 84 - - 84 Warrants 4,573 - - 4,573 Short-Term Investments 42,126,780 - - 42,126,780
Total Assets $ 158,035,369 $ 15,500 $ - $ 158,050,869 Other Financial Instruments1 Futures Contracts $ 134,143 $ - $ - $ 134,143 Liabilities Securities Sold Short
Common Stocks* $ 39,562,113 $ - $ - $ 39,562,113 Exchange-Traded Funds 12,162,071 - - 12,162,071 Written Options Contracts - 4,515 - 4,515
Total Securities Sold Short $ 51,724,184 $ 4,515 $ - $ 51,728,699 Other Financial Instruments1 Futures Contracts $ 35,848 $ - $ - $ 35,848
64

Vivaldi Funds NOTES TO FINANCIAL STATEMENTS - Continued September 30, 2017
*All common stocks held in the Fund are Level 1 securities. For a detailed break-out of common stocks by major industry classification, please refer to the Schedule of Investments. **The Fund did not hold any Level 2 securities at period end. ***The Fund did not hold any Level 3 securities at period end. 1 Other financial instruments are derivative instruments such as futures contracts. Futures contracts are valued at the unrealized appreciation (depreciation) on the instrument. Transfers between levels 1, 2 or 3 are recognized at the end of the reporting period. There were no transfers between Levels at period end. Note 11 – Derivative and Hedging Disclosure Derivatives and Hedging requires enhanced disclosures about the Funds’ derivative and hedging activities, including how such activities are accounted for and their effects on the Funds’ financial position, performance and cash flows. The Funds invested in options contracts, warrants and futures contracts during the periods ended September 30, 2017. The effects of these derivative instruments on the Funds’ financial position and financial performance as reflected in the Statements of Assets and Liabilities and Statements of Operations are presented in the tables below. The fair values of derivative instruments as of September 30, 2017 by risk category are as follows:
Merger Arbitrage Fund Asset Derivatives Liability Derivatives
Derivatives not designated as hedging instruments
Statement of Asset and Liabilities
Location Value
Statement of Asset and Liabilities
Location Value
Equity contracts Purchased options contracts, at value $ 222,700
Written options contracts, at value $ 47,085
Total $ 222,700
$ 47,085
Concentrated Equities Fund Level 1 Level 2** Level 3*** Total Assets Investments
Common Stocks* $ 177,538,049 $ - $ - $ 177,538,049 Preferred Stocks 3,457,885 - - 3,457,885 Short-Term Investments 36,096,366 - - 36,096,366
Total Assets $ 217,092,300 $ - $ - $ 217,092,300 Liabilities Securities Sold Short
Common Stocks* $ 24,204,223 $ - $ - $ 24,204,223 Total Liabilities $ 24,204,223 $ - $ - $ 24,204,223
65

Vivaldi Funds NOTES TO FINANCIAL STATEMENTS - Continued September 30, 2017
Multi-Strategy Fund Asset Derivatives Liability Derivatives
Derivatives not designated as hedging instruments
Statement of Asset and Liabilities
Location Value
Statement of Asset and Liabilities
Location Value
Commodity contracts
Unrealized appreciation on
futures contracts $ 13,650
Unrealized depreciation on
futures contracts $ 17,186
Equity contracts Purchased options contracts, at value 58,390
Written options contracts, at value 4,515
Foreign exchange contracts
Unrealized appreciation on
futures contracts 100,644
Unrealized depreciation on
futures contracts 18,662
Interest rate contracts
Unrealized appreciation on
futures contracts 19,849
Unrealized depreciation on
futures contracts -
Total $ 192,533 $ 40,363 The effects of derivative instruments on the Statements of Operations for the periods ended September 30, 2017 are as follows:
Merger Arbitrage Fund Amount of Realized Gain or (Loss) on Derivatives Recognized in Income
Derivatives not designated as hedging instruments Purchased Options Contracts Written Options Contracts Equity contracts $ (747,899) $ 291,086 Total $ (747,899) $ 291,086
Multi-Strategy Fund Amount of Realized Gain or (Loss) on Derivatives Recognized in Income
Derivatives not designated as hedging instruments Purchased Options Contracts Written Options Contracts Futures Contracts Commodity contracts $ 102,552 $ - $ 10,740 Equity contracts (811,400) 81,812 (67,866) Foreign exchange contracts - - (71,271) Interest rate contracts - - (78,640) Total $ (708,848) $ 81,812 $ (207,037)
Concentrated Equities Fund Amount of Realized Gain or (Loss) on Derivatives Recognized in Income
Derivatives not designated as hedging instruments Written Options Contracts Equity contracts $ 224,447 Total $ 224,447
66

Vivaldi Funds NOTES TO FINANCIAL STATEMENTS - Continued September 30, 2017
Merger Arbitrage Fund
Change in Unrealized Appreciation/Depreciation on Derivatives Recognized in Income Derivatives not designated as hedging instruments
Purchased Options Contracts
Written Options Contracts Total
Equity contracts $ 10,872 $ (4,397) $ 6,475 Total $ 10,872 $ (4,397) $ 6,475
Multi-Strategy Fund
Change in Unrealized Appreciation/Depreciation on Derivatives Recognized in Income
Derivatives not designated as hedging instruments Futures
Contracts
Purchased Options
Contracts
Written Options
Contracts Total Commodity contracts $ (27,783) $ - $ - $ (27,783) Equity contracts - 151,600 (7,624) 143,976 Foreign exchange contracts 82,980 - - 82,980 Interest rate contracts 143,266 - - 143,266 Total $ 198,463 $ 151,600 $ (7,624) $ 342,439 The number of contracts is included on the Schedule of Investments. The quarterly average volumes of derivative instruments as of September 30, 2017 are as follows:
Merger Arbitrage Fund Derivative Quarterly Average Amount Options Contracts - Purchased number of contracts 1,174 Options Contracts - Written number of contracts (582)
Multi-Strategy Fund
Derivative Quarterly Average Amount Options Contracts - Purchased number of contracts 761 Options Contracts - Written number of contracts (524) Futures Contracts - Long number of contracts 60 Futures Contracts - Short number of contracts (113)
Concentrated Equities Fund Derivative Quarterly Average Amount Options Contracts - Written number of contracts (600)
67

Vivaldi Funds NOTES TO FINANCIAL STATEMENTS - Continued September 30, 2017 Note 12 - Disclosures about Offsetting Assets and Liabilities Disclosures about Offsetting Assets and Liabilities requires an entity to disclose information about offsetting and related arrangements to enable users of its financial statements to understand the effect of those arrangements on its financial position. The guidance requires retrospective application for all comparative periods presented. A Fund mitigates credit risk with respect to OTC derivative counterparties through credit support annexes included with International Swaps and Derivative Association, Inc. (“ISDA”) which are the standard contracts governing most derivative transactions between the Fund and each of its counterparties. These agreements allow the Fund and each counterparty to offset certain derivative financial instruments’ payables and/or receivables against each other and/or with collateral, which is generally held by the Fund’s custodian. The amount of collateral moved to/from applicable counterparties is based upon minimum transfer amounts specified in the agreement. To the extent amounts due to the Fund from its counterparties are not fully collateralized contractually or otherwise, the Fund bears the risk of loss from counterparty non-performance. The Multi-Strategy Fund’s Statement of Assets and Liabilities presents financial instruments on a gross basis, therefore there are no net amounts and no offset amounts within the Statement of Assets and Liabilities to present below. Gross amounts of the financial instruments, amounts related to financial instruments/cash collateral not offset in the Statement of Assets and Liabilities and net amounts are presented below:
Amounts Not Offset in Statement of Assets and
Liabilities
Description/Financial Instrument/Statement of Assets and Liabilities Category Counterparty
Gross Amounts Recognized in Statement of
Assets and Liabilities
Financial Instruments*
Cash Collateral** Net Amount
Unrealized appreciation on open futures contacts – asset
R.J. O'Brien $ 134,143 $ (35,848) $ - $ 98,295 Unrealized depreciation on
open futures contacts – liability
R.J. O'Brien 35,848 (35,848) - - *Amounts relate to master netting agreements and collateral agreements (for example, ISDA) which have been determined by the Advisor to be legally enforceable in the event of default and where certain other criteria are met in accordance with applicable offsetting accounting guidance. **Amounts relate to master netting agreements and collateral agreements which have been determined by the Advisor to be legally enforceable in the event of default but where certain other criteria are not met in accordance with applicable offsetting accounting guidance. The collateral amounts may exceed the related net amounts of financial assets and liabilities presented in the Statement of Assets and Liabilities. Where this is the case, the total amount reported is limited to the net amounts of financial assets and liabilities with that counterparty.
68

Vivaldi Funds NOTES TO FINANCIAL STATEMENTS - Continued September 30, 2017 Note 13 – Repurchase-to-Maturity Transactions, Repurchase Financings and Disclosures Repurchase-to-Maturity Transactions, Repurchase Financings, and Disclosures requires an entity to modify accounting for repurchase-to-maturity transactions and repurchase financing arrangements, as well as modify required disclosures for repurchase agreements, securities lending transactions, and repurchase-to-maturity transactions that are accounted for as secured borrowings. Management has evaluated the impact on the financial statement disclosures and determined that there is no effect. Note 14 – Disclosure for Investments in Certain Entities that Calculate Net Asset Value per Share (or Its Equivalent) Disclosure for Investments in Certain Entities that Calculate Net Asset Value per Share (or Its Equivalent) removes the requirement to categorize within the fair value hierarchy investments measured using the net asset value per share ("NAV") practical expedient, as well as removes certain disclosure requirements for investments that qualify, but do not utilize, the NAV practical expedient. Management has evaluated the impact on the financial statement disclosures and determined that there is no effect. Note 15 – Borrowing The Merger Arbitrage Fund has entered into a borrowing agreement with BNP Paribas (acting through its New York Branch). The Fund may borrow amounts up to one-third of the value of its assets. The Fund is charged interest of one-month Libor plus 1.10% for borrowing under this agreement. The average outstanding borrowings and average interest rate on the 62 days with borrowings by the Fund during the year ended September 30, 2017 were $57,722,961 and 2.175%, respectively. As of September 30, 2017, the Fund had no outstanding borrowings. Note 16 – Events Subsequent to the Fiscal Period End The Funds have adopted financial reporting rules regarding subsequent events which require an entity to recognize in the financial statements the effects of all subsequent events that provide additional evidence about conditions that existed at the date of the balance sheet. Management has evaluated the Funds’ related events and transactions that occurred through the date of issuance of the Funds’ financial statements. There were no events or transactions that occurred during this period that materially impacted the amounts or disclosures in the Funds’ financial statements.
69

REPORT OF INDEPENDENT REGISTERED PUBLIC ACCOUNTING FIRM
To the Shareholders of the Vivaldi Funds and the Board of Trustees of Investment Managers Series Trust II We have audited the accompanying statements of assets and liabilities of the Vivaldi Merger Arbitrage Fund, Vivaldi Multi-Strategy Fund and WV Concentrated Equities Fund (the “Funds”), each a series of Investment Managers Series Trust II, including the schedules of investments, as of September 30, 2017, and the related statements of operations for the period then ended, the statements of changes in net assets and the financial highlights for the periods indicated thereon. These financial statements and financial highlights are the responsibility of the Funds’ management. Our responsibility is to express an opinion on these financial statements and financial highlights based on our audits. We conducted our audits in accordance with the standards of the Public Company Accounting Oversight Board (United States). Those standards require that we plan and perform the audits to obtain reasonable assurance about whether the financial statements and financial highlights are free of material misstatement. The Funds are not required to have, nor were we engaged to perform, an audit of their internal control over financial reporting. Our audits included consideration of internal control over financial reporting as a basis for designing audit procedures that are appropriate in the circumstances, but not for the purpose of expressing an opinion on the effectiveness of the Funds’ internal control over financial reporting. Accordingly, we express no such opinion. An audit also includes examining, on a test basis, evidence supporting the amounts and disclosures in the financial statements, assessing the accounting principles used and significant estimates made by management, as well as evaluating the overall financial statement presentation. Our procedures included confirmation of securities owned as of September 30, 2017, by correspondence with the custodian and brokers or by other appropriate auditing procedures where replies were not received. We believe that our audits provide a reasonable basis for our opinion. In our opinion, the financial statements and financial highlights referred to above present fairly, in all material respects, the financial position of the Vivaldi Merger Arbitrage Fund, Vivaldi Multi-Strategy Fund and WV Concentrated Equities Fund as of September 30, 2017, and the results of their operations, the changes in their net assets and financial highlights for the periods indicated thereon, in conformity with accounting principles generally accepted in the United States of America. TAIT, WELLER & BAKER LLP
Philadelphia, Pennsylvania November 29, 2017
70

Vivaldi Funds SUPPLEMENTAL INFORMATION (Unaudited) Qualified Dividend Income For the year ended September 30, 2017, 32.24% of the dividends to be paid from net investment income, including short-term capital gains (if any) from the Merger Arbitrage Fund, are designated as qualified dividend income.
Corporate Dividends Received Deduction For the year ended September 30, 2017, 91.94% of the dividends to be paid from net investment income, including short-term capital gains (if any) from the Merger Arbitrage Fund, are designated as dividends received deduction available to corporate shareholders. Long-Term Capital Gain Designation For the year ended September 30, 2017, the Merger Arbitrage Fund designates long-term capital gain dividends of $412 for Federal income tax purposes. Trustees and Officers Information Additional information about the Trustees is included in the Funds’ Statement of Additional Information which is available, without charge, upon request by calling (877) 779-1999. The Trustees and officers of the Funds and their principal occupations during the past five years are as follows:
Name, Address, Year of Birth and Position(s) held with Trust
Term of Officec and Length of Time Served
Principal Occupation During the Past Five Years and Other Affiliations
Number of
Portfolios in the Fund Complex
Overseen by Trusteed
Other
Directorships Held by Trustee During the Past Five Years
Independent Trustees: Thomas Knipper, CPA a (Born 1957) Trustee
Since September 2013
Vice President and Chief Compliance Officer, Ameritas Investment Partners, a registered investment advisor (1995 – present).
3 None.
Kathleen K. Shkuda a (born 1951) Trustee
Since September 2013
Zigzag Consulting, a financial services consulting firm (2008 – present). Director, Managed Accounts, Merrill Lynch (2007-2008).
3 None.
Larry D. Tashjian a (born 1953) Trustee and Chairman of the Board
Since September 2013
Principal, CAM Capital Advisors, a family office (2001 – present).
3 General Finance Corporation.
John P. Zader a (born 1961) Trustee
Since September 2013
Retired (June 2014 – present). CEO, UMB Fund Services, Inc., a mutual fund and hedge fund service provider, and the transfer agent, fund accountant, and co-administrator for the Fund (December 2006 – June 2014).
3 Investment Managers Series
Trust, a registered investment
company (includes 69 portfolios).
71
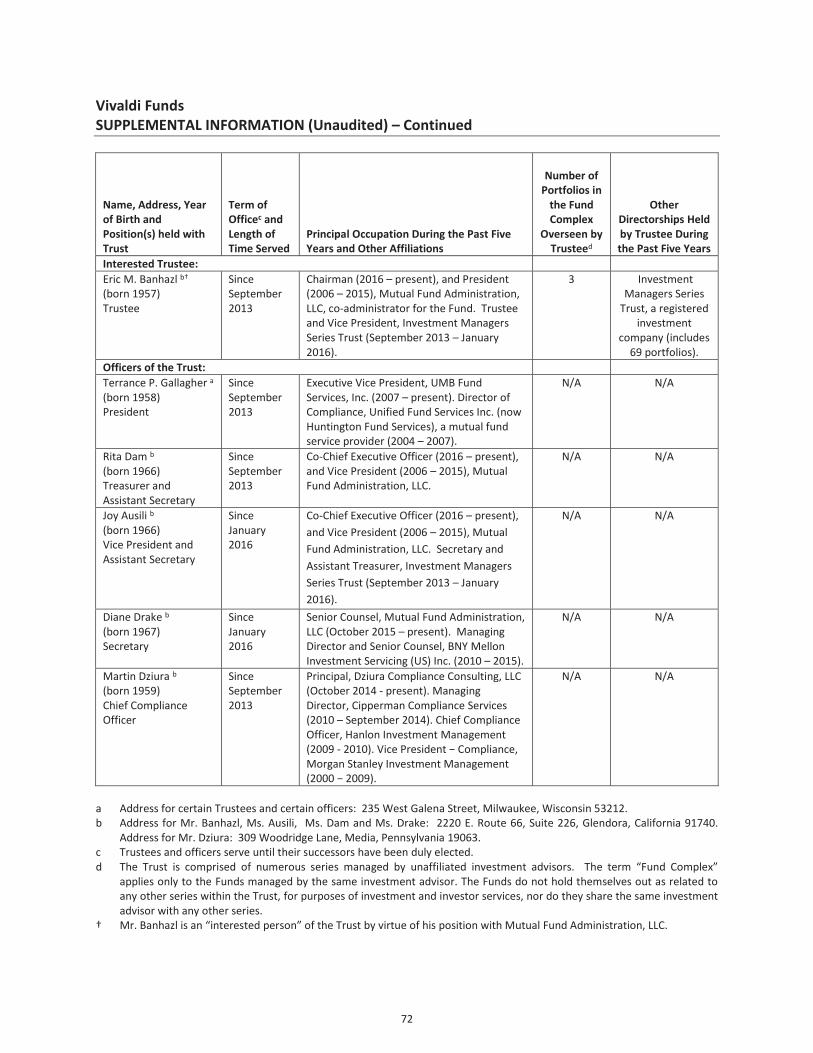
Vivaldi Funds SUPPLEMENTAL INFORMATION (Unaudited) – Continued
Name, Address, Year of Birth and Position(s) held with Trust
Term of Officec and Length of Time Served
Principal Occupation During the Past Five Years and Other Affiliations
Number of
Portfolios in the Fund Complex
Overseen by Trusteed
Other
Directorships Held by Trustee During the Past Five Years
Interested Trustee: Eric M. Banhazl b† (born 1957) Trustee
Since September 2013
Chairman (2016 – present), and President (2006 – 2015), Mutual Fund Administration, LLC, co-administrator for the Fund. Trustee and Vice President, Investment Managers Series Trust (September 2013 – January 2016).
3 Investment Managers Series
Trust, a registered investment
company (includes 69 portfolios).
Officers of the Trust: Terrance P. Gallagher a (born 1958) President
Since September 2013
Executive Vice President, UMB Fund Services, Inc. (2007 – present). Director of Compliance, Unified Fund Services Inc. (now Huntington Fund Services), a mutual fund service provider (2004 – 2007).
N/A N/A
Rita Dam b (born 1966) Treasurer and Assistant Secretary
Since September 2013
Co-Chief Executive Officer (2016 – present), and Vice President (2006 – 2015), Mutual Fund Administration, LLC.
N/A N/A
Joy Ausili b (born 1966) Vice President and Assistant Secretary
Since January 2016
Co-Chief Executive Officer (2016 – present), and Vice President (2006 – 2015), Mutual Fund Administration, LLC. Secretary and Assistant Treasurer, Investment Managers Series Trust (September 2013 – January 2016).
N/A N/A
Diane Drake b (born 1967) Secretary
Since January 2016
Senior Counsel, Mutual Fund Administration, LLC (October 2015 – present). Managing Director and Senior Counsel, BNY Mellon Investment Servicing (US) Inc. (2010 – 2015).
N/A N/A
Martin Dziura b (born 1959) Chief Compliance Officer
Since September 2013
Principal, Dziura Compliance Consulting, LLC (October 2014 - present). Managing Director, Cipperman Compliance Services (2010 – September 2014). Chief Compliance Officer, Hanlon Investment Management (2009 - Morgan Stanley Investment Management
N/A N/A
a Address for certain Trustees and certain officers: 235 West Galena Street, Milwaukee, Wisconsin 53212. b Address for Mr. Banhazl, Ms. Ausili, Ms. Dam and Ms. Drake: 2220 E. Route 66, Suite 226, Glendora, California 91740.
Address for Mr. Dziura: 309 Woodridge Lane, Media, Pennsylvania 19063. c Trustees and officers serve until their successors have been duly elected. d The Trust is comprised of numerous series managed by unaffiliated investment advisors. The term “Fund Complex”
applies only to the Funds managed by the same investment advisor. The Funds do not hold themselves out as related to any other series within the Trust, for purposes of investment and investor services, nor do they share the same investment advisor with any other series.
† Mr. Banhazl is an “interested person” of the Trust by virtue of his position with Mutual Fund Administration, LLC.
72

Vivaldi Merger Arbitrage Fund and WV Concentrated Equities Fund SUPPLEMENTAL INFORMATION (Unaudited) – Continued
Board Consideration of Investment Advisory Agreements At an in-person meeting held on April 27, 2017, the Board of Trustees (the “Board”) of Investment Managers Series Trust II (the “Trust”), including the trustees who are not “interested persons” of the Trust (the “Independent Trustees”) as defined in the Investment Company Act of 1940, as amended (the “1940 Act”), reviewed and unanimously approved the Investment Advisory Agreement (the “Merger Fund Agreement”) between the Trust and Vivaldi Asset Management, LLC (the “Investment Advisor”) with respect to the Vivaldi Merger Arbitrage Fund series of the Trust (the “Merger Fund”) for an additional one-year term from when it otherwise would expire. At the same meeting, the Board and the Independent Trustees also reviewed and unanimously approved the Investment Advisory Agreement (the “WV Fund Agreement”) between the Trust and the Investment Advisor with respect to the WV Concentrated Equities Fund (the “WV Fund”) for an initial two-year term. The Merger Fund Agreement and the WV Fund Agreement are collectively referred to below as the “Fund Advisory Agreements.” In renewing or approving each Fund Advisory Agreement, as applicable, the Board, including the Independent Trustees, determined that such renewal or approval was in the best interests of the applicable Fund and its shareholders. Vivaldi Merger Arbitrage Fund Background In advance of the meeting, the Board received information about the Merger Fund and the Merger Fund Agreement from the Investment Advisor and from Mutual Fund Administration, LLC and UMB Fund Services, Inc., the Trust’s co-administrators, certain portions of which are discussed below. The materials, among other things, included information about the Investment Advisor’s organization and financial condition; information regarding the background, experience and compensation structure of relevant personnel providing services to the Merger Fund; information about the Investment Advisor’s compliance policies and procedures, disaster recovery and contingency planning, and policies with respect to portfolio execution and trading; information regarding the profitability of the Investment Advisor’s overall relationship with the Merger Fund; reports comparing the performance of the Fund with returns of the Bloomberg Barclays U.S. Aggregate Bond Index and a group of comparable funds selected by Morningstar, Inc. (the Merger Fund’s “Peer Group”) from its Market Neutral fund universe (the Merger Fund’s “Fund Universe”) for the one-, three-, five-, and ten-year periods ended January 31, 2017; and reports comparing the investment advisory fee and total expenses of the Merger Fund with those of the Peer Group and Fund Universe. The Board also received a memorandum from legal counsel to the Trust and the Independent Trustees discussing the legal standards under the 1940 Act and other applicable law for their consideration of the proposed renewal of the Merger Fund Agreement. In addition, the Board considered information reviewed by the Board during the year at other Board and Board committee meetings. No representatives of the Investment Advisor were present during the Board’s consideration of the Merger Fund Agreement. In renewing the Merger Fund Agreement, the Board and the Independent Trustees considered a variety of factors, including those discussed below. In their deliberations, the Board and the Independent Trustees did not identify any particular factor that was controlling, and each Trustee may have attributed different weights to the various factors.
73

Vivaldi Merger Arbitrage Fund and WV Concentrated Equities Fund SUPPLEMENTAL INFORMATION (Unaudited) – Continued
Nature, Extent and Quality of Services With respect to the performance results of the Merger Fund, the meeting materials indicated that the annualized total returns of the Merger Fund for the three-, five- and ten-year periods were above the median returns of the Peer Group and Fund Universe, as well as the Bloomberg Barclays U.S. Aggregate Bond Index return; and that the total return of the Merger Fund for the one-year period was below the median returns of the Peer Group and Fund Universe, as well as the Index, by 2.88%, 2.18% and 0.51%, respectively. The Trustees considered the Investment Advisor’s explanation that the Merger Fund’s underperformance was attributed to two particular portfolio holdings which the Fund sold later in the year. The Trustees also noted that performance data prior to October 2015 was based on the performance of the predecessor private fund that reorganized into the Merger Fund. The Board considered the overall quality of services provided by the Investment Advisor to the Merger Fund. In doing so, the Board considered the Investment Advisor’s specific responsibilities in day-to-day management and oversight of the Merger Fund, as well as the qualifications, experience, and responsibilities of the personnel involved in the activities of the Merger Fund. The Board also considered the overall quality of the organization and operations of the Investment Advisor, as well as its compliance structure. The Board and the Independent Trustees concluded that based on the various factors they had reviewed, the nature, overall quality, and extent of the management and oversight services provided by the Investment Advisor to the Merger Fund were satisfactory. Advisory Fee and Expense Ratio With respect to the advisory fee paid by the Merger Fund, the meeting materials indicated that the annual investment advisory fee (gross of fee waivers) was the same as the median advisory fees of the Peer Group but higher than the Fund Universe median by 0.15%. The Trustees noted, however, that the Investment Advisor had waived a portion of its advisory fee for the year ended January 31, 2017. The Trustees also considered that the Investment Advisor manages assets for four other accounts, including one portion of another series of the Trust (the “Multi-Strategy Fund”), with similar investment strategies as those used by the Merger Fund, but that those accounts have different restrictions than the Fund. The Trustees observed that the Merger Fund’s advisory fee was lower than that of the Multi-Strategy Fund, which they noted was a multi-strategy fund with various portfolios managed using different investment strategies. The Trustees also observed that the Merger Fund’s advisory fee was higher than the asset-based fee for three of the accounts, but that those accounts charge an incentive fee in addition to an advisory fee. The Trustees also noted that the Investment Advisor oversees the Merger Fund’s compliance with certain requirements under the 1940 Act that do not apply to the Investment Advisor’s clients that are not registered under the 1940 Act. The meeting materials indicated that the Merger Fund’s total expenses (net of fee waivers) for the Fund’s most recent fiscal year were above the Peer Group and Fund Universe medians by 0.11% and 0.14%, respectively. The Board noted, however, that the average net assets of the Merger Fund were lower than the average net assets of funds in the Peer Group. The Board and the Independent Trustees concluded that based on the factors they had reviewed, the compensation payable to the Investment Advisor under the Merger Fund Agreement was fair and reasonable in light of the nature and quality of the services the Investment Advisor provides to the Merger Fund.
74

Vivaldi Merger Arbitrage Fund and WV Concentrated Equities Fund SUPPLEMENTAL INFORMATION (Unaudited) – Continued
Profitability and Economies of Scale The Board also considered information prepared by the Investment Advisor relating to its costs and profits with respect to the Merger Fund for the year ended January 31, 2017. The Board noted that the Investment Advisor had waived a portion of its advisory fee with respect to the Merger Fund, and determined that the Investment Advisor’s profit level was reasonable. The Board also considered the benefits received by the Investment Advisor as a result of its relationship with the Merger Fund (other than the receipt of its investment advisory fee), including any research received from broker-dealers providing execution services to the Fund, the beneficial effects from the review by the Trust’s Chief Compliance Officer of its compliance program, and the intangible benefits of the Investment Advisor’s association with the Merger Fund generally and any favorable publicity arising in connection with the Fund’s performance. The Trustees also noted that although there were no advisory fee breakpoints, the Merger Fund’s capacity is likely to be constrained and therefore, the Investment Advisor did not expect to realize economies of scale with respect to the Fund. Conclusion Based on these and other factors, the Board and the Independent Trustees concluded that renewal of the Merger Fund Agreement was in the best interests of the Merger Fund and its shareholders and, accordingly, approved renewal of the Merger Fund Agreement. WV Concentrated Equities Fund Background In advance of the meeting, the Board received information about the proposed WV Fund and the WV Fund Agreement from the Investment Advisor and from Mutual Fund Administration, LLC and UMB Fund Services, Inc., the Trust’s co-administrators, certain portions of which are discussed below. The materials, among other things, included information about the organization and financial condition of the Investment Advisor; information regarding the background, experience and compensation structure of relevant personnel who would be providing services to the WV Fund; information about the Investment Advisor’s compliance policies and procedures, disaster recovery and contingency planning, and policies with respect to portfolio execution and trading; information regarding the estimated profitability of the Investment Advisor’s overall relationship with the Fund; a report prepared by Morningstar comparing the proposed advisory fee and total expense ratio for the WV Fund to those of a group of comparable funds selected by Morningstar (the WV Fund’s “Peer Group”) from its Mid-Cap Value fund Universe (the WV Fund’s “Fund Universe”); and the Investment Advisor’s responses to the due diligence questionnaire which, among other things, compared the performance of the WHI Growth Fund Q.P., L.P. (the “Private Fund”), which the Investment Advisor was proposing to convert into the WV Fund, with returns of the S&P 500 Index and the Russell 2000 Index. The Board also received a memorandum from legal counsel to the Trust and the Independent Trustees discussing the legal standards under the 1940 Act and other applicable law for their consideration of the proposed approval of the WV Fund Agreement. In addition, the Board considered information reviewed by the Board regarding the Investment Advisor during the year at other Board and Board committee meetings. No representatives of the Investment Advisor were present during the Board’s consideration of the WV Fund Agreement.
75

Vivaldi Merger Arbitrage Fund and WV Concentrated Equities Fund SUPPLEMENTAL INFORMATION (Unaudited) – Continued
In approving the WV Fund Agreement, the Board and the Independent Trustees considered a variety of factors, including those discussed below. In their deliberations, the Board and the Independent Trustees did not identify any particular factor that was controlling, and each Trustee may have attributed different weights to the various factors. Nature, Extent and Quality of Services With respect to the performance results of the Private Fund, the meeting materials indicated the returns for the one- and three-year periods ended December 31, 2016, significantly underperformed the S&P 500 Index (by 10.7% or less) and Russell 2000 Index (by 20.05% or less), and although for the five- and ten-year periods the Private Fund trailed the S&P 500 Index (by 3.16% and 0.59%, respectively) and Russell 2000 Index (by 2.96% and 0.2%, respectively), the performance results for those longer periods were more in line with the returns of the indices. In considering this performance, the Trustees noted the Investment Advisor’s explanation that a period of significantly poor performance in the Private Fund from June 2015 through February 2016 and sub-optimal position sizing contributed to the Private Fund’s underperformance for all periods. The Trustees noted, however, that the Private Fund produced positive returns for the one-, three-, five- and ten-year periods, and that the Private Fund’s annualized performance over the ten-year period was very close to the performance of both benchmark indices. The Trustees also considered the Investment Advisor’s prior explanation that William Tuebo and another investment professional whose portfolio selections had performed well were still involved in the Private Fund’s portfolio management, while other investment professionals whose portfolio selections had not performed well were no longer involved in management of the Private Fund; and that Kyle Mowery, who had been added as a portfolio manager of the Private Fund in 2016, had managed another portfolio that had performed very well in 2016. The Trustees also considered the Investment Advisor’s belief in the strength of the WV Fund’s investment strategies and the portfolio management team, and their familiarity with the Investment Advisor as the investment advisor to two existing series of the Trust. The Board also considered the services to be provided by the Investment Advisor to the WV Fund. In doing so, the Board considered the qualifications, experience, and responsibilities of the personnel of the Investment Advisor who would be involved in the activities of the WV Fund. The Board also considered the overall quality of the organization and operations, and the compliance structure and compliance procedures, of the Investment Advisor. The Board and the Independent Trustees concluded that based on the various factors they had reviewed, the Investment Advisor would have the capabilities, resources, and personnel necessary to manage the WV Fund, and that the Investment Advisor would provide the Fund with a reasonable potential for good investment results. Advisory Fees and Expense Ratios The Board reviewed information regarding the WV Fund’s proposed advisory fee and estimated total expenses. The meeting materials indicated that the proposed advisory fee to be paid by the WV Fund was higher than the Peer Group and Fund Universe medians by 0.08% and 0.10%, respectively. The Board considered the Investment Advisor’s assertions that the WV Fund’s advisory fee is appropriate in light of the significant fundamental research involved in developing a high conviction portfolio fundamentally designed to preserve and grow wealth. The Trustees also noted that the WV Fund’s advisory fee is lower than the current asset-based advisory fee for the Private Fund, which also charges an incentive fee.
76

Vivaldi Merger Arbitrage Fund and WV Concentrated Equities Fund SUPPLEMENTAL INFORMATION (Unaudited) – Continued
With respect to the WV Fund’s total expenses, the Board observed that the proposed total expenses (net of fee waivers) were above the median total expenses of the Peer Group and Fund Universe by 0.21% and 0.30%, respectively. The Board noted, however, that the estimated average net assets of the WV Fund in its first year of operations were lower than the average net assets of funds in the Fund Universe. The Board also noted the Investment Advisor’s belief that the level of the WV Fund’s expense cap would not impede the marketing of the WV Fund. The Board and the Independent Trustees concluded that the proposed compensation payable to the Investment Advisor under the Advisory Agreement would be fair and reasonable in light of the nature and quality of the services proposed to be provided by the Investment Advisor to the WV Fund. Profitability and Economies of Scale The Board reviewed the estimated profitability to the Investment Advisor of its relationship with the WV Fund in its first year of operations taking into account estimated assets of $275 million. The Board determined that the Investment Advisor’s estimated profitability with respect to the WV Fund was reasonable. The Board also noted that the potential benefits received by the Investment Advisor as a result of its relationship with the WV Fund (other than the receipt of its advisory fee) would include any research made available to the Investment Advisor by broker-dealers providing execution services to the WV Fund, the beneficial effects from the review by the Trust’s Chief Compliance Officer of the Investment Advisor’s compliance program, the intangible benefits of its association with the WV Fund generally and any favorable publicity arising in connection with the WV Fund’s performance. The Board also noted that although the Advisory Agreement did not provide for fee breakpoints, the Investment Advisor represented that any such economies of scale would be considered in the future as the WV Fund’s assets grow. Conclusion Based on these and other factors, the Board and the Independent Trustees concluded that approval of the WV Fund Agreement was in the best interests of the WV Fund and its shareholders and, accordingly, approved the WV Fund Agreement.
77
Vivaldi Funds EXPENSE EXAMPLES For the Periods Ended September 30, 2017 (Unaudited) Expense Examples As a shareholder of the Funds, you incur two types of costs: (1) transaction costs including sales charges (loads) on purchases within certain classes; and (2) ongoing costs, including management fees, distribution and/or service (12b-1) fees (Class A only) and other Fund expenses. The examples below are intended to help you understand your ongoing costs (in dollars) of investing in the Fund and to compare these costs with the ongoing costs of investing in other mutual funds. The Actual Performance examples for the Vivaldi Merger Arbitrage Fund and Vivaldi Multi-Strategy Fund are based on an investment of $1,000 invested at the beginning of the period and held for the entire period from April 1, 2017 to September 30, 2017. The Actual Performance example for the WV Concentrated Equities Fund is based on an investment of $1,000 invested at the beginning of the period and held for the entire since inception period from May 1, 2017 (commencement of operations) to September 30, 2017. The Hypothetical (5% annual return before expenses) example is based on an investment of $1,000 invested at the beginning of the period and held for the entire six month period from April 1, 2017 to September 30, 2017. Actual Expenses The information in the row titled “Actual Performance” of the table below provides actual account values and actual expenses. You may use the information in these columns, together with the amount you invested, to estimate the expenses that you paid over the period. Simply divide your account value by $1,000 (for example, an $8,600 account value divided by $1,000 = 8.6), then multiply the result by the number in the appropriate row under the column titled “Expenses Paid During Period” to estimate the expenses you paid on your account during this period. Hypothetical Example for Comparison Purposes The information in the row titled “Hypothetical (5% annual return before expenses)” of the table below provides hypothetical account values and hypothetical expenses based on the Fund’s actual expense ratios and an assumed rate of return of 5% per year before expenses, which is not the Fund’s actual return. The hypothetical account values and expenses may not be used to estimate the actual ending account balance or expenses you paid for the period. You may use this information to compare the ongoing costs of investing in the Fund and other funds. To do so, compare these 5% hypothetical examples with the 5% hypothetical examples that appear in the shareholder reports of the other funds. Please note that the expenses shown in the table are meant to highlight your ongoing costs only and do not reflect any transaction costs, such as sales charges (load) or contingent deferred sales charges. Therefore, the information in the row titled “Hypothetical (5% annual return before expenses)” is useful in comparing ongoing costs only, and will not help you determine the relative total costs of owning different funds. In addition, if these transactional costs were included, your costs would have been higher.
78

Vivaldi Funds EXPENSE EXAMPLES - Continued For the Periods Ended September 30, 2017 (Unaudited)
Vivaldi Merger Arbitrage Fund Beginning Account Value
Ending Account Value
Expenses Paid During Period*
4/1/17 9/30/17 4/1/17 – 9/30/17 Class A Actual Performance $ 1,000.00 $ 1,025.10 $ 17.79
Hypothetical (5% annual return before expenses) 1,000.00 1,007.50 17.64
Class I Actual Performance 1,000.00 1,025.90 15.86 Hypothetical (5% annual return before expenses) 1,000.00 1,009.41 15.73
*Expenses are equal to the Fund’s annualized expense ratios of 3.50% and 3.12% for the Class A and Class I shares,respectively, multiplied by the average account values over the period, multiplied by 183/365 (to reflect the sixmonth period) for Class A shares and Class I shares. The expense ratios reflect a recovery of previously waived fees.Assume all dividends and distributions were reinvested.
Vivaldi Multi-Strategy Fund Beginning Account Value
Ending Account Value
Expenses Paid During Period*
4/1/17 9/30/17 4/1/17 – 9/30/17 Class A Actual Performance $ 1,000.00 $ 1,021.20 $ 18.69
Hypothetical (5% annual return before expenses) 1,000.00 1,006.57 18.56
Class I Actual Performance 1,000.00 1,022.80 17.17 Hypothetical (5% annual return before expenses) 1,000.00 1,008.09 17.05
*Expenses are equal to the Fund’s annualized expense ratios of 3.69% and 3.39% for the Class A and Class I shares,respectively, multiplied by the average account values over the period, multiplied by 183/365 (to reflect the sixmonth period) for Class A shares and Class I shares. Assume all dividends and distributions were reinvested.
WV Concentrated Equities Fund Beginning Account Value
Ending Account Value
Expenses Paid During Period
5/1/17* 9/30/17 5/1/17* – 9/30/17 Class A Actual Performance** $ 1,000.00 $ 994.00 $ 6.34 Class I Actual Performance** 1,000.00 994.80 5.25
4/1/17 9/30/17 4/1/17 – 9/30/17 Class A Hypothetical (5% annual
return before expenses)^ 1,000.00 1,017.46 7.68 Class I Hypothetical (5% annual
return before expenses)^ 1,000.00 1,018.77 6.36 * Commencement of operations.**Expenses are equal to the Fund’s annualized expense ratios of 1.51% and 1.26% for the Class A and Class I shares,respectively, multiplied by the average account values over the period, multiplied by 153/365 (to reflect the sinceinception period) for Class A shares and Class I shares. Assume all dividends and distributions were reinvested.^Expenses are equal to the Fund’s annualized expense ratios of 1.51% and 1.26% for the Class A and Class I shares,respectively, multiplied by the average account values over the period, multiplied by 183/365 (to reflect the sixmonth period) for Class A shares and Class I shares. Assume all dividends and distributions were reinvested.
79

This page is intentionally left blank
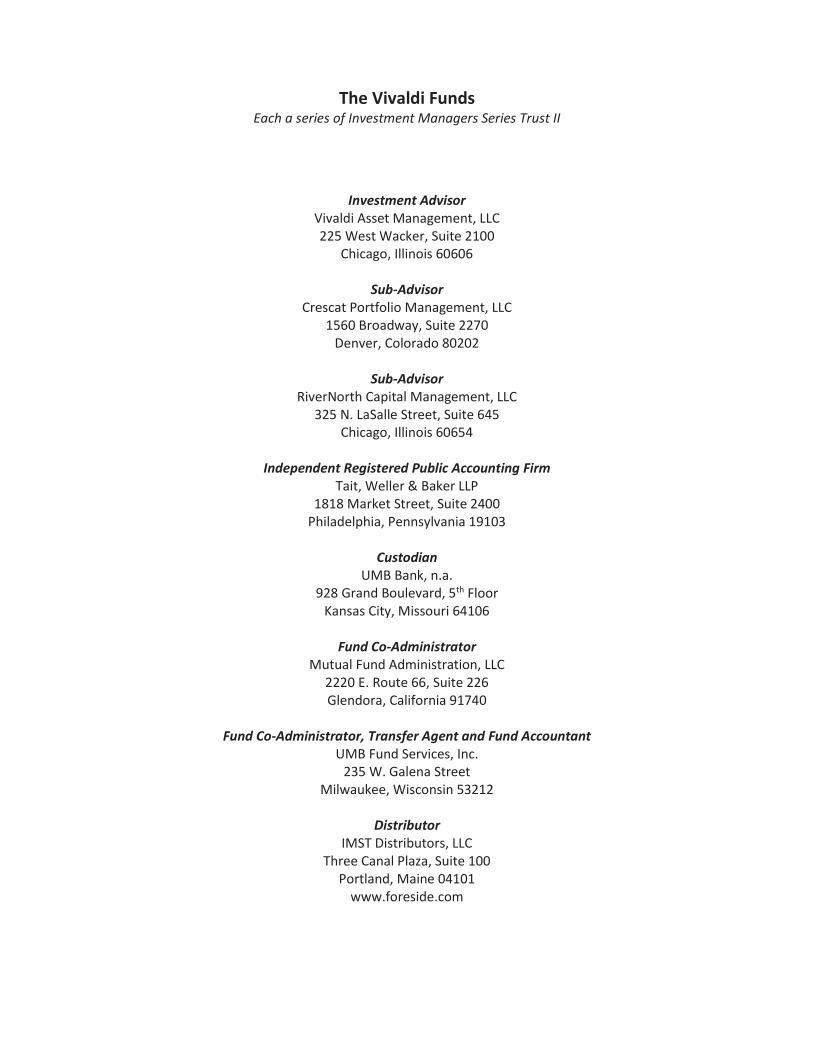
The Vivaldi Funds
Each a series of Investment Managers Series Trust II
Investment Advisor
Vivaldi Asset Management, LLC 225 West Wacker, Suite 2100
Chicago, Illinois 60606
Sub-Advisor Crescat Portfolio Management, LLC
1560 Broadway, Suite 2270 Denver, Colorado 80202
Sub-Advisor
RiverNorth Capital Management, LLC 325 N. LaSalle Street, Suite 645
Chicago, Illinois 60654
Independent Registered Public Accounting Firm Tait, Weller & Baker LLP
1818 Market Street, Suite 2400 Philadelphia, Pennsylvania 19103
Custodian
UMB Bank, n.a. 928 Grand Boulevard, 5th Floor
Kansas City, Missouri 64106
Fund Co-Administrator Mutual Fund Administration, LLC
2220 E. Route 66, Suite 226 Glendora, California 91740
Fund Co-Administrator, Transfer Agent and Fund Accountant
UMB Fund Services, Inc. 235 W. Galena Street
Milwaukee, Wisconsin 53212
Distributor IMST Distributors, LLC
Three Canal Plaza, Suite 100 Portland, Maine 04101
www.foreside.com

FUND INFORMATION
TICKER CUSIP Vivaldi Merger Arbitrage Fund – Class A Vivaldi Merger Arbitrage Fund – Class I Vivaldi Multi-Strategy Fund – Class A Vivaldi Multi-Strategy Fund – Class I WV Concentrated Equities Fund – Class A WV Concentrated Equities Fund – Class I
VARAX VARBX
OMOAX OMOIX WVCAX WVCIX
46141T 877 46141T 869 46141T 687 46141T 679 46141T 646 46141T 638
Privacy Principles of the Vivaldi Funds for Shareholders The Funds are committed to maintaining the privacy of their shareholders and to safeguarding their non-public personal information. The following information is provided to help you understand what personal information the Funds collect, how we protect that information and why, in certain cases, we may share information with select other parties.
Generally, the Funds do not receive any non-public personal information relating to their shareholders, although certain non-public personal information of their shareholders may become available to the Funds. The Funds do not disclose any non-public personal information about their shareholders or former shareholders to anyone, except as permitted by law or as is necessary in order to service shareholder accounts (for example, to a transfer agent or third party administrator).
This report is sent to shareholders of the Vivaldi Funds for their information. It is not a Prospectus, circular or representation intended for use in the purchase or sale of shares of the Funds or of any securities mentioned in this report. Proxy Voting Policies and Procedures A description of the Funds’ proxy voting policies and procedures related to portfolio securities is available without charge, upon request, by calling the Funds at (877) 779-1999 or on the U.S. Securities and Exchange Commission’s (“SEC”) website at www.sec.gov. Proxy Voting Record Information regarding how the Funds voted proxies for portfolio securities, if applicable, during the most recent 12-month period ended June 30, is also available, without charge and upon request by calling the Funds at (877) 779-1999 or by accessing the Funds’ Form N-PX on the SEC’s website at www.sec.gov. Form N-Q Disclosure The Funds file their complete schedule of portfolio holdings with the SEC for the first and third quarters of each fiscal year on Form N-Q. The Funds’ Form N-Q is available on the SEC website at www.sec.gov or by calling the Funds at (877) 779-1999. The Funds’ Form N-Q may also be viewed and copied at the SEC’s Public Reference Room in Washington, DC. Information on the operation of the Public Reference Room may be obtained by calling (800) SEC-0330. Householding The Funds will mail only one copy of shareholder documents, including prospectuses, annual and semi-annual reports and proxy statements, to shareholders with multiple accounts at the same address. This practice is commonly called “householding” and is intended to reduce expenses and eliminate duplicate mailings of shareholder documents. Mailings of your shareholder documents may be householded indefinitely unless you instruct us otherwise. If you do not want the mailing of these documents to be combined with those for other members of your household, please call the Funds at (877) 779-1999.
Vivaldi Funds P.O. Box 2175
Milwaukee, WI 53201 Toll Free: (877) 779-1999