viticultura in teledetectie
DESCRIPTION
Viticulture in remote sensing vita de vie in imagini aeropurate sau de teledetectieTRANSCRIPT
7/18/2019 Viticultura in teledetectie
http://slidepdf.com/reader/full/viticultura-in-teledetectie 1/10
S. Afr. J. Enol. Vitic., Vol. 31, No. 2, 2010
65
Vine Signal Extraction – an Application of Remote Sensing in PrecisionViticultureJ.L. Smit1*, G. Sithole1 and A.E. Strever 2
(1) Geomatics Division, School of Architecture, Planning and Geomatics, University of Cape Town, Private Bag X3, Rondebosch 7701,
South Africa
(2) Department of Viticulture and Oenology, Stellenbosch University, Private Bag X1, Matieland 7602, South Africa
Submitted for publication: November 2009
Accepted for publication: June 2010
Key words: Precision agriculture, precision viticulture, remote sensing, GIS, segmentation, classication
This paper presents a study of precision agriculture in the wine industry. While precision viticulture mostly aims
to maximise yields by delivering the right inputs to appropriate places on a farm in the correct doses and at the
right time, the objective of this study was rather to assess vine biomass differences. The solution proposed in this
paper uses aerial imagery as the primary source of data for vine analysis. The rst objective to be achieved by the
solution is to automatically identify vineyards blocks, vine rows, and individual vines within rows. This is made
possible through a series of enhancements and hierarchical segmentations of the aerial images. The second objective
is to determine the correlation of image data with the biophysical data (yield and pruning mass) of each vine.
A multispectral aerial image is used to compute vegetation indices, which serve as indicators of biophysical measures.
The results of the automatic detection are compared against a test eld, to verify both vine location and vegetation
index correlation with relevant vine parameters. The advantage of this technique is that it functions in environments
where active cover crop growth between vines is evident and where variable vine canopy conditions are present
within a vineyard block.
INTRODUCTION
Remote sensing has been used in the agricultural sector for
many years and recent advances in imaging sensors have led to
a wide array of applications using remotely sensed imagery in
precision agriculture. The wine industry is one example of high-
value crop production that has benetted from remote sensing.Precision viticulture aims to maintain maximum control over
vineyard management by taking cognisance of the fact thatthere is variability within the vineyard (Proft et al ., 2006). It
is in particular the use of multispectral imagery from airborne
sensors that has seen an application in this sphere to allow for the
remote determination of vineyard variability caused by differing
topography, soil characteristics, management practices, plant
health and meso-climates (Bramley, 2003).
The use of vegetation indices, generated from the various
spectral bands of aerial multispectral images, provides a “means
of capitalizing on the contrast that exists between vine biomass
when measured in different wavebands” (Proft et al ., 2006).
Most commonly used are the Normalized Difference Vegetation
Index (NDVI) and the Plant Cell Density (PCD) or Ratio
Vegetation Index (RVI). Both of these indices make use of thefact that healthy, vigorous vines will exhibit strong near-infrared
reectance and very low red reectance (Proft et al ., 2006).
These index formulations are given below in 1 and 2:
(1)
(2)
Once the vegetation index has been calculated it is classiedinto a pseudo-colour index image, whereby distinct colour classes
represent manageable differences in vine variability, as can be
seen in Fig. 1.
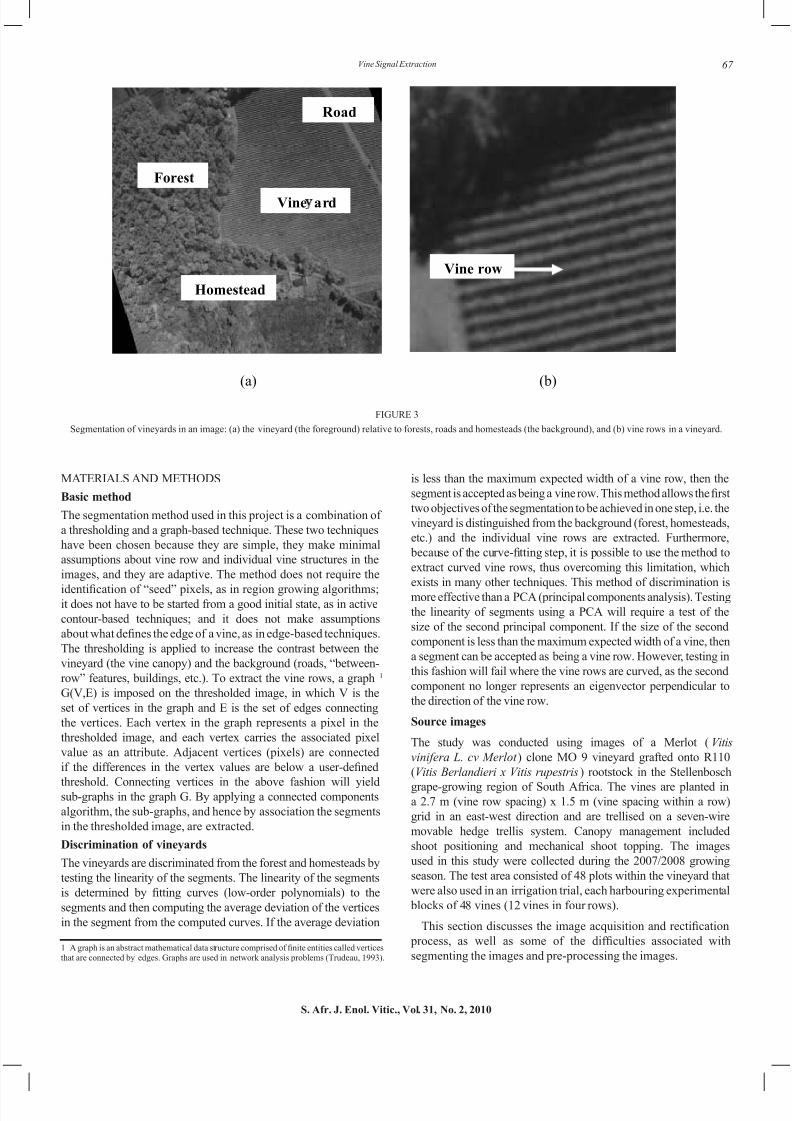
The image analysis of vineyards requires, rstly, thediscrimination of vineyards from neighbouring forests, homesteads
and farm land; secondly, the discrimination of individual rows in
the vineyard; and, lastly, the identication of individual vines inthe rows. All of these operations are typically done manually. It
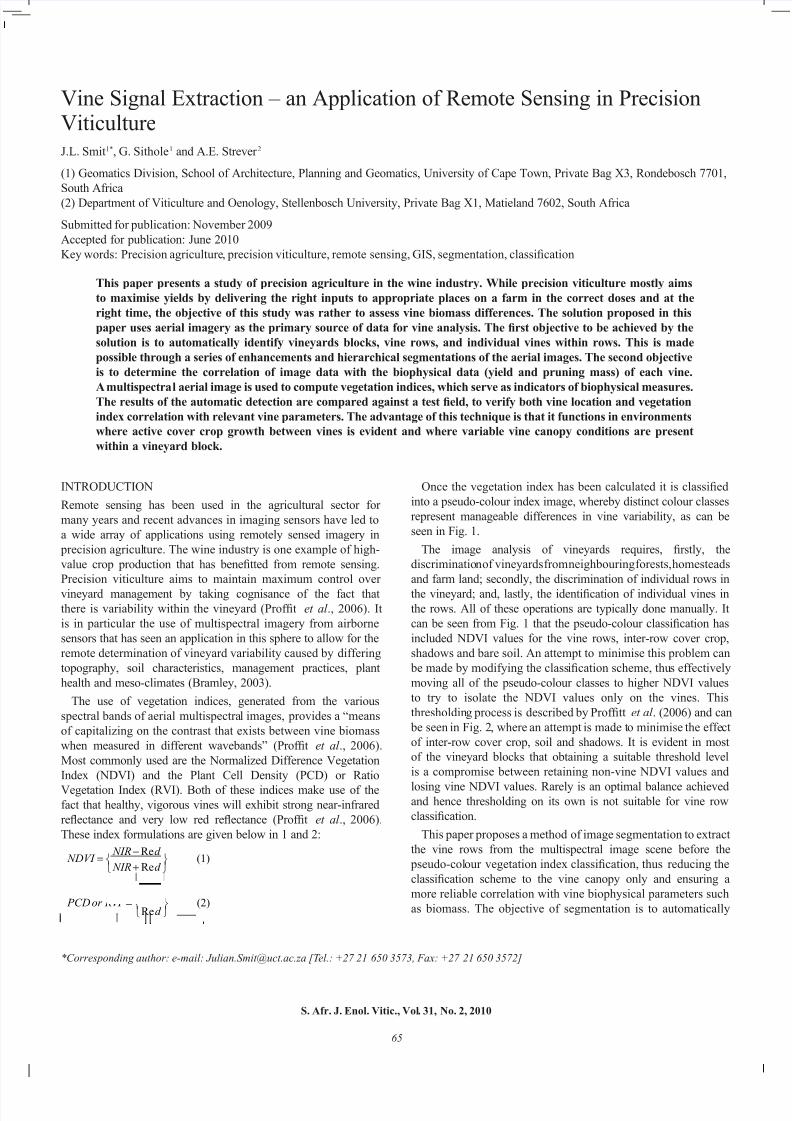
can be seen from Fig. 1 that the pseudo-colour classication hasincluded NDVI values for the vine rows, inter-row cover crop,
shadows and bare soil. An attempt to minimise this problem can
be made by modifying the classication scheme, thus effectivelymoving all of the pseudo-colour classes to higher NDVI values
to try to isolate the NDVI values only on the vines. This
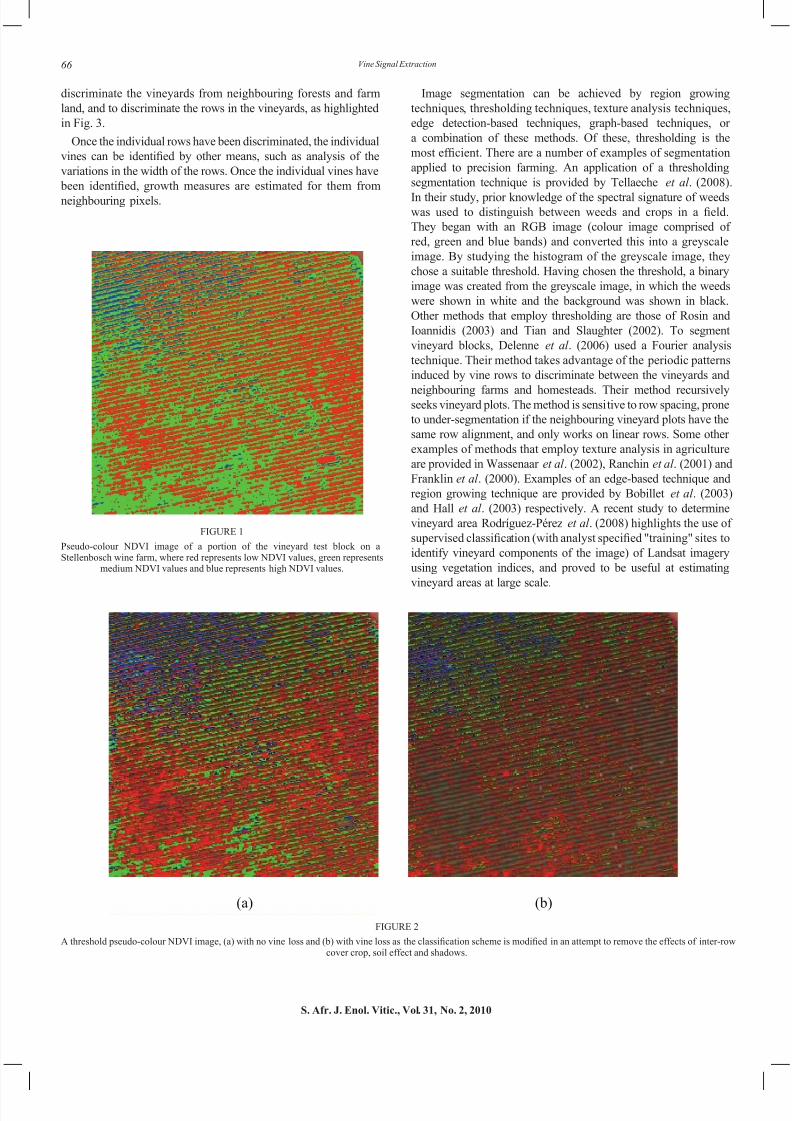
thresholding process is described by Proftt et al . (2006) and can
be seen in Fig. 2, where an attempt is made to minimise the effect
of inter-row cover crop, soil and shadows. It is evident in most
of the vineyard blocks that obtaining a suitable threshold level
is a compromise between retaining non-vine NDVI values and
losing vine NDVI values. Rarely is an optimal balance achievedand hence thresholding on its own is not suitable for vine row
classication.
This paper proposes a method of image segmentation to extract
the vine rows from the multispectral image scene before the
pseudo-colour vegetation index classication, thus reducing theclassication scheme to the vine canopy only and ensuring amore reliable correlation with vine biophysical parameters such
as biomass. The objective of segmentation is to automatically
*Corresponding author: e-mail: [email protected] [Tel.: +27 21 650 3573, Fax: +27 21 650 3572]
d NIR
d NIR NDVI
Re
Re (1)
d
NIR RVI or PCD
Re (2)
7/18/2019 Viticultura in teledetectie
http://slidepdf.com/reader/full/viticultura-in-teledetectie 2/10
66
S. Afr. J. Enol. Vitic., Vol. 31, No. 2, 2010
Vine Signal Extraction
discriminate the vineyards from neighbouring forests and farm
land, and to discriminate the rows in the vineyards, as highlighted
in Fig. 3.
Once the individual rows have been discriminated, the individual
vines can be identied by other means, such as analysis of thevariations in the width of the rows. Once the individual vines have
been identied, growth measures are estimated for them fromneighbouring pixels.
FIGURE 1
Pseudo-colour NDVI image of a portion of the vineyard test block on aStellenbosch wine farm, where red represents low NDVI values, green represents
medium NDVI values and blue represents high NDVI values.
Image segmentation can be achieved by region growing
techniques, thresholding techniques, texture analysis techniques,
edge detection-based techniques, graph-based techniques, or
a combination of these methods. Of these, thresholding is the
most efcient. There are a number of examples of segmentationapplied to precision farming. An application of a thresholding
segmentation technique is provided by Tellaeche et al . (2008).
In their study, prior knowledge of the spectral signature of weedswas used to distinguish between weeds and crops in a eld.They began with an RGB image (colour image comprised of
red, green and blue bands) and converted this into a greyscale
image. By studying the histogram of the greyscale image, they
chose a suitable threshold. Having chosen the threshold, a binary
image was created from the greyscale image, in which the weeds
were shown in white and the background was shown in black.
Other methods that employ thresholding are those of Rosin and
Ioannidis (2003) and Tian and Slaughter (2002). To segment
vineyard blocks, Delenne et al . (2006) used a Fourier analysis
technique. Their method takes advantage of the periodic patterns
induced by vine rows to discriminate between the vineyards and
neighbouring farms and homesteads. Their method recursivelyseeks vineyard plots. The method is sensitive to row spacing, prone
to under-segmentation if the neighbouring vineyard plots have the
same row alignment, and only works on linear rows. Some other
examples of methods that employ texture analysis in agriculture
are provided in Wassenaar et al . (2002), Ranchin et al . (2001) and
Franklin et al . (2000). Examples of an edge-based technique and
region growing technique are provided by Bobillet et al . (2003)
and Hall et al . (2003) respectively. A recent study to determine
vineyard area Rodríguez-Pérez et al . (2008) highlights the use of
supervised classication (with analyst specied "training" sites toidentify vineyard components of the image) of Landsat imagery
using vegetation indices, and proved to be useful at estimating
vineyard areas at large scale.
FIGURE 2
A threshold pseudo-colour NDVI image, (a) with no vine loss and (b) with vine loss as the classication scheme is modied in an attempt to remove the effects of inter-rowcover crop, soil effect and shadows.
(a) (b)
7/18/2019 Viticultura in teledetectie
http://slidepdf.com/reader/full/viticultura-in-teledetectie 3/10
67
S. Afr. J. Enol. Vitic., Vol. 31, No. 2, 2010
Vine Signal Extraction
MATERIALS AND METHODS
Basic method
The segmentation method used in this project is a combination of
a thresholding and a graph-based technique. These two techniques
have been chosen because they are simple, they make minimal
assumptions about vine row and individual vine structures in the
images, and they are adaptive. The method does not require the
identication of “seed” pixels, as in region growing algorithms;it does not have to be started from a good initial state, as in active
contour-based techniques; and it does not make assumptions
about what denes the edge of a vine, as in edge-based techniques.The thresholding is applied to increase the contrast between the
vineyard (the vine canopy) and the background (roads, “between-
row” features, buildings, etc.). To extract the vine rows, a graph 1
G(V,E) is imposed on the thresholded image, in which V is the
set of vertices in the graph and E is the set of edges connecting
the vertices. Each vertex in the graph represents a pixel in the
thresholded image, and each vertex carries the associated pixel
value as an attribute. Adjacent vertices (pixels) are connected
if the differences in the vertex values are below a user-dened
threshold. Connecting vertices in the above fashion will yieldsub-graphs in the graph G. By applying a connected components
algorithm, the sub-graphs, and hence by association the segments
in the thresholded image, are extracted.
Discrimination of vineyards
The vineyards are discriminated from the forest and homesteads by
testing the linearity of the segments. The linearity of the segments
is determined by tting curves (low-order polynomials) to thesegments and then computing the average deviation of the vertices
in the segment from the computed curves. If the average deviation
1 A graph is an abstract mathematical data structure comprised of nite entities called verticesthat are connected by edges. Graphs are used in network analysis problems (Trudeau, 1993).
is less than the maximum expected width of a vine row, then the
segment is accepted as being a vine row. This method allows the rsttwo objectives of the segmentation to be achieved in one step, i.e. the
vineyard is distinguished from the background (forest, homesteads,
etc.) and the individual vine rows are extracted. Furthermore,
because of the curve-tting step, it is possible to use the method toextract curved vine rows, thus overcoming this limitation, which
exists in many other techniques. This method of discrimination is
more effective than a PCA (principal components analysis). Testing
the linearity of segments using a PCA will require a test of the
size of the second principal component. If the size of the second
component is less than the maximum expected width of a vine, then
a segment can be accepted as being a vine row. However, testing in
this fashion will fail where the vine rows are curved, as the second
component no longer represents an eigenvector perpendicular to
the direction of the vine row.
Source images
The study was conducted using images of a Merlot (Vitis
vinifera L. cv Merlot ) clone MO 9 vineyard grafted onto R110
(Vitis Berlandieri x Vitis rupestris) rootstock in the Stellenbosch
grape-growing region of South Africa. The vines are planted ina 2.7 m (vine row spacing) x 1.5 m (vine spacing within a row)
grid in an east-west direction and are trellised on a seven-wire
movable hedge trellis system. Canopy management included
shoot positioning and mechanical shoot topping. The images
used in this study were collected during the 2007/2008 growing
season. The test area consisted of 48 plots within the vineyard that
were also used in an irrigation trial, each harbouring experimental
blocks of 48 vines (12 vines in four rows).
This section discusses the image acquisition and rectication process, as well as some of the difculties associated withsegmenting the images and pre-processing the images.
(a) (b)
Vine ard
Homestead
Forest
Road
FIGURE 3
Segmentation of vineyards in an image: (a) the vineyard (the foreground) relative to forests, roads and homesteads (the background), and (b) vine rows in a vineyard.
Vine row
7/18/2019 Viticultura in teledetectie
http://slidepdf.com/reader/full/viticultura-in-teledetectie 4/10
68
S. Afr. J. Enol. Vitic., Vol. 31, No. 2, 2010
Vine Signal Extraction
Image acquisition
Two digital SLR cameras were used for airborne image
acquisition. These were a Canon 10D (Canon, 2009) with a CMOS
(complementary metal oxide semiconductor) sensor, which was
used to capture the colour images, and a Nikon D100 (Nikon,
2009) with a CCD (charged coupled device) sensor, which was
used for the near-infrared (NIR) image capture. The Nikon D100
had been modied to capture near-infrared light (Maxmax, 2009)and used a Kodak Wratten #89B Opaque IR lter (B&H PhotoVideo, 2009) to block the visible light wavelengths. Both cameras
were tted with Sigma 14 mm f2/8 EX Aspherical (HSM) wide-angle lenses (Photography Review, 2009) in order to optimise the
camera eld-of-view. The aerial photography was carried out ata height of approximately 350 m above the terrain, providing a
nominal image ground pixel size of 20 cm. The stereo pair of
photos was taken as close to midday as possible in an attempt to
minimise the effect of shadows.
Image rectication
Before the ight, both image-sensor systems were calibrated inthe laboratory to determine the interior orientation parameters of
the cameras (including focal length, lens distortion and principal
point offset). These parameters were then used in the correction of
geometric distortions in the imagery.
To obtain reliable geo-referencing of the imagery, a GPS (global
positioning system) survey of the vineyard block was conducted.
This included a survey of the vine row ends (to be used for
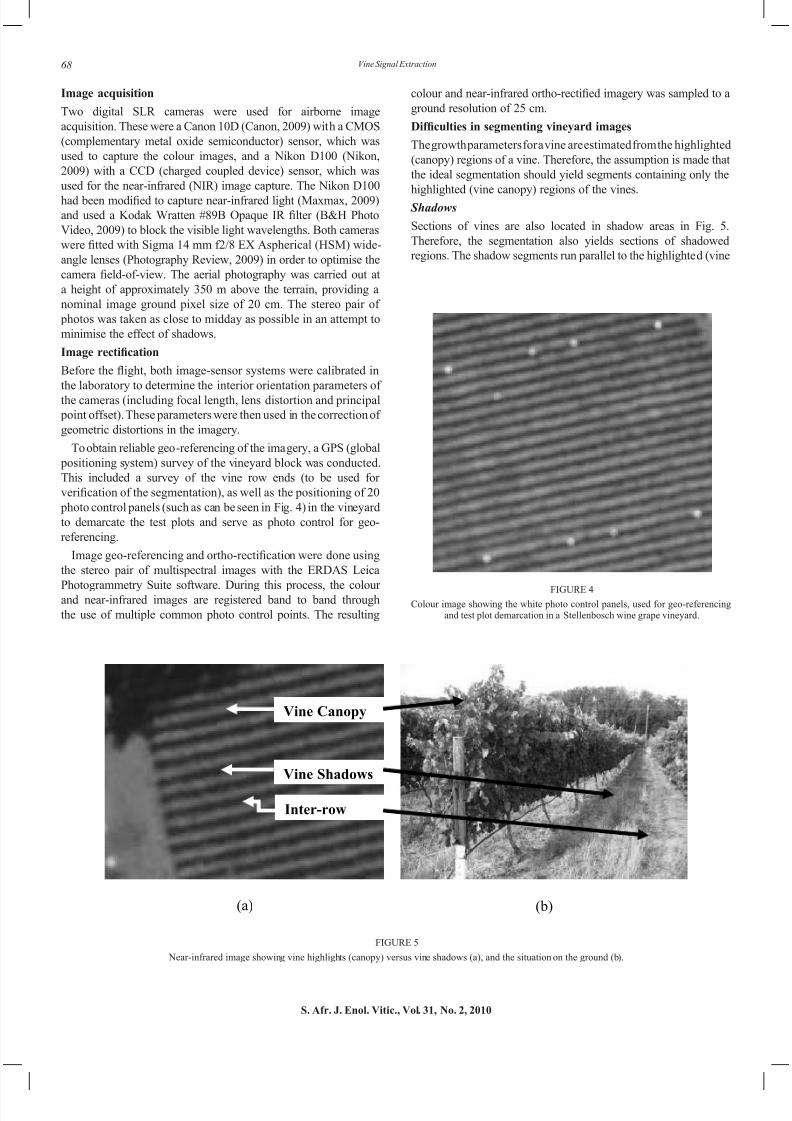
verication of the segmentation), as well as the positioning of 20 photo control panels (such as can be seen in Fig. 4) in the vineyard
to demarcate the test plots and serve as photo control for geo-
referencing.
Image geo-referencing and ortho-rectication were done usingthe stereo pair of multispectral images with the ERDAS Leica
Photogrammetry Suite software. During this process, the colourand near-infrared images are registered band to band through
the use of multiple common photo control points. The resulting
FIGURE 4Colour image showing the white photo control panels, used for geo-referencing
and test plot demarcation in a Stellenbosch wine grape vineyard.
colour and near-infrared ortho-rectied imagery was sampled to aground resolution of 25 cm.
Difculties in segmenting vineyard images
The growth parameters for a vine are estimated from the highlighted
(canopy) regions of a vine. Therefore, the assumption is made that
the ideal segmentation should yield segments containing only the
highlighted (vine canopy) regions of the vines.
Shadows
Sections of vines are also located in shadow areas in Fig. 5.
Therefore, the segmentation also yields sections of shadowed
regions. The shadow segments run parallel to the highlighted (vine
(a) (b)
FIGURE 5
Near-infrared image showing vine highlights (canopy) versus vine shadows (a), and the situation on the ground (b).
Vine Canopy
Vine Shadows
Inter-row
7/18/2019 Viticultura in teledetectie
http://slidepdf.com/reader/full/viticultura-in-teledetectie 5/10
69
S. Afr. J. Enol. Vitic., Vol. 31, No. 2, 2010
Vine Signal Extraction
canopy) segments, which necessitates a post-processing step to
distinguish between the highlighted (vine canopy) and shadowed
segments. This discrimination is achieved by calculating the
average value of the vertices in a segment. Segments with a high
average value are accepted as being highlighted vine rows, and
the remainder are regarded as being shadowed “vine rows”.
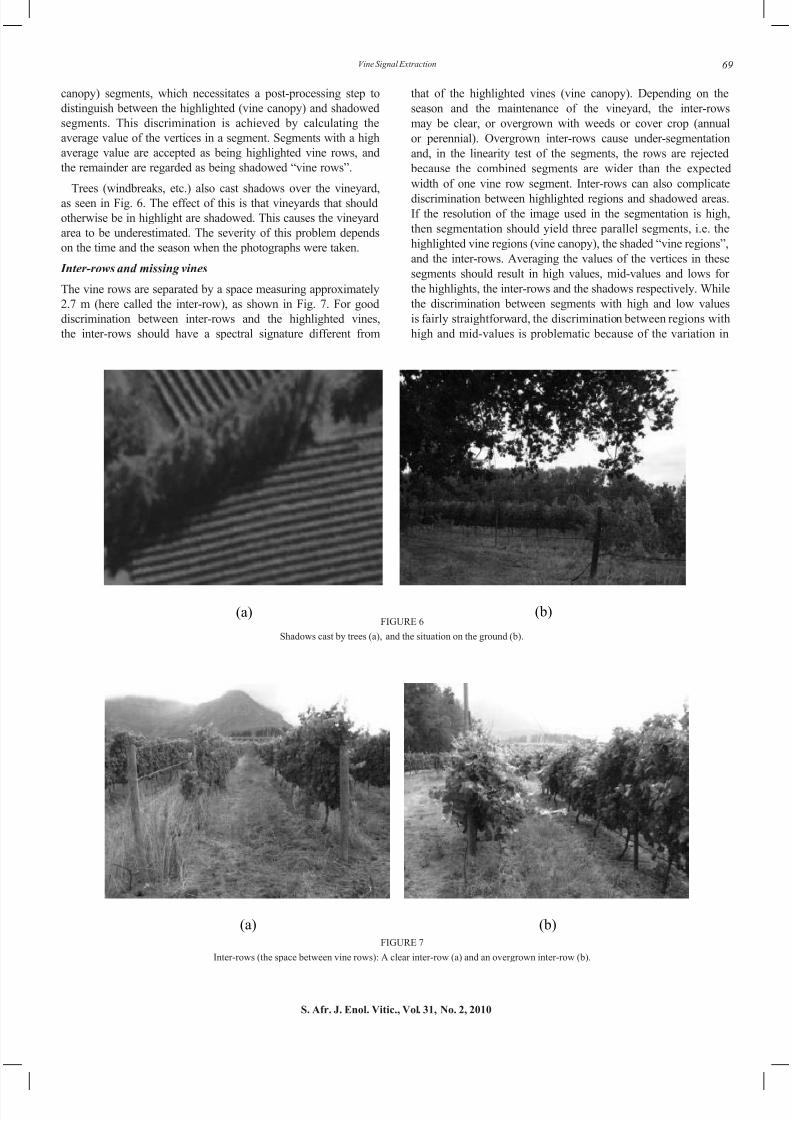
Trees (windbreaks, etc.) also cast shadows over the vineyard,
as seen in Fig. 6. The effect of this is that vineyards that should
otherwise be in highlight are shadowed. This causes the vineyard
area to be underestimated. The severity of this problem depends
on the time and the season when the photographs were taken.
Inter-rows and missing vines
The vine rows are separated by a space measuring approximately
2.7 m (here called the inter-row), as shown in Fig. 7. For good
discrimination between inter-rows and the highlighted vines,
the inter-rows should have a spectral signature different from
that of the highlighted vines (vine canopy). Depending on the
season and the maintenance of the vineyard, the inter-rows
may be clear, or overgrown with weeds or cover crop (annual
or perennial). Overgrown inter-rows cause under-segmentation
and, in the linearity test of the segments, the rows are rejected
because the combined segments are wider than the expected
width of one vine row segment. Inter-rows can also complicate
discrimination between highlighted regions and shadowed areas.If the resolution of the image used in the segmentation is high,
then segmentation should yield three parallel segments, i.e. the
highlighted vine regions (vine canopy), the shaded “vine regions”,
and the inter-rows. Averaging the values of the vertices in these
segments should result in high values, mid-values and lows for
the highlights, the inter-rows and the shadows respectively. While
the discrimination between segments with high and low values
is fairly straightforward, the discrimination between regions with
high and mid-values is problematic because of the variation in
(a) (b)FIGURE 6
Shadows cast by trees (a), and the situation on the ground (b).
(a) (b)FIGURE 7
Inter-rows (the space between vine rows): A clear inter-row (a) and an overgrown inter-row (b).
7/18/2019 Viticultura in teledetectie
http://slidepdf.com/reader/full/viticultura-in-teledetectie 6/10
70
S. Afr. J. Enol. Vitic., Vol. 31, No. 2, 2010
Vine Signal Extraction
the cover crop (this can range from clear to overgrown) of the
inter-rows.
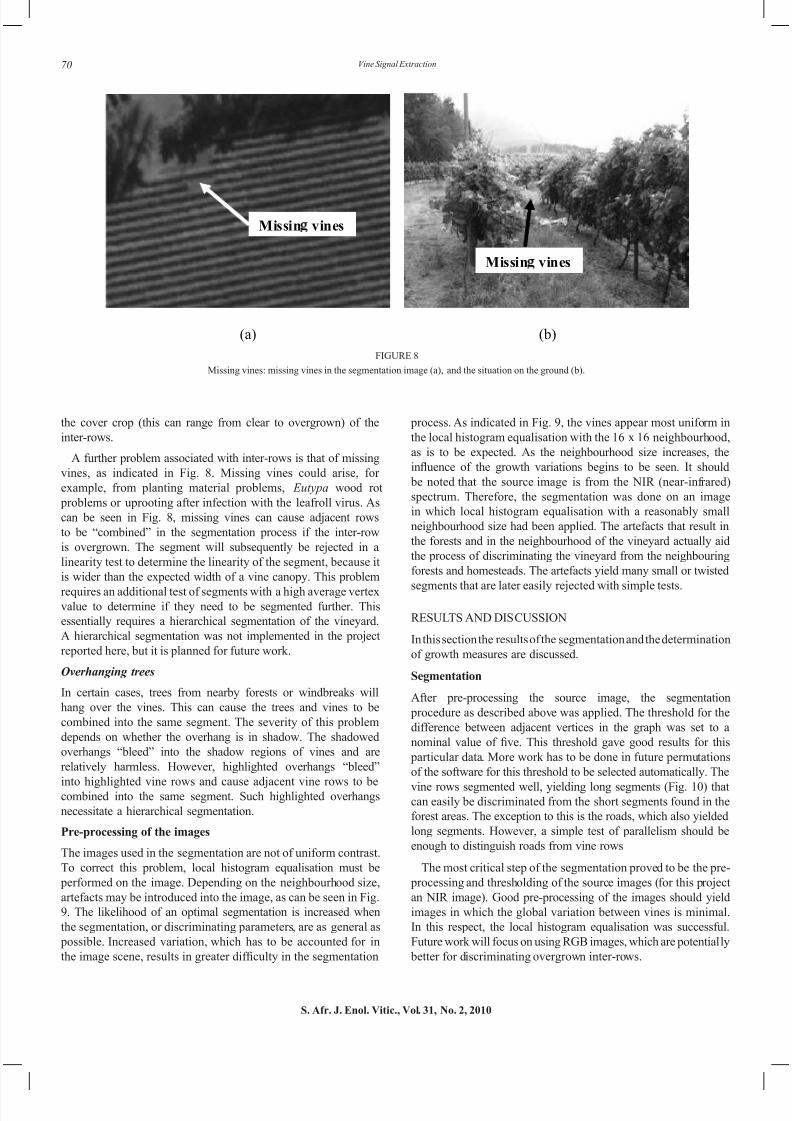
A further problem associated with inter-rows is that of missing
vines, as indicated in Fig. 8. Missing vines could arise, for
example, from planting material problems, Eutypa wood rot
problems or uprooting after infection with the leafroll virus. As
can be seen in Fig. 8, missing vines can cause adjacent rows
to be “combined” in the segmentation process if the inter-row
is overgrown. The segment will subsequently be rejected in a
linearity test to determine the linearity of the segment, because it
is wider than the expected width of a vine canopy. This problem
requires an additional test of segments with a high average vertexvalue to determine if they need to be segmented further. This
essentially requires a hierarchical segmentation of the vineyard.
A hierarchical segmentation was not implemented in the project
reported here, but it is planned for future work.
Overhanging trees
In certain cases, trees from nearby forests or windbreaks will
hang over the vines. This can cause the trees and vines to be
combined into the same segment. The severity of this problem
depends on whether the overhang is in shadow. The shadowed
overhangs “bleed” into the shadow regions of vines and are
relatively harmless. However, highlighted overhangs “bleed”
into highlighted vine rows and cause adjacent vine rows to becombined into the same segment. Such highlighted overhangs
necessitate a hierarchical segmentation.
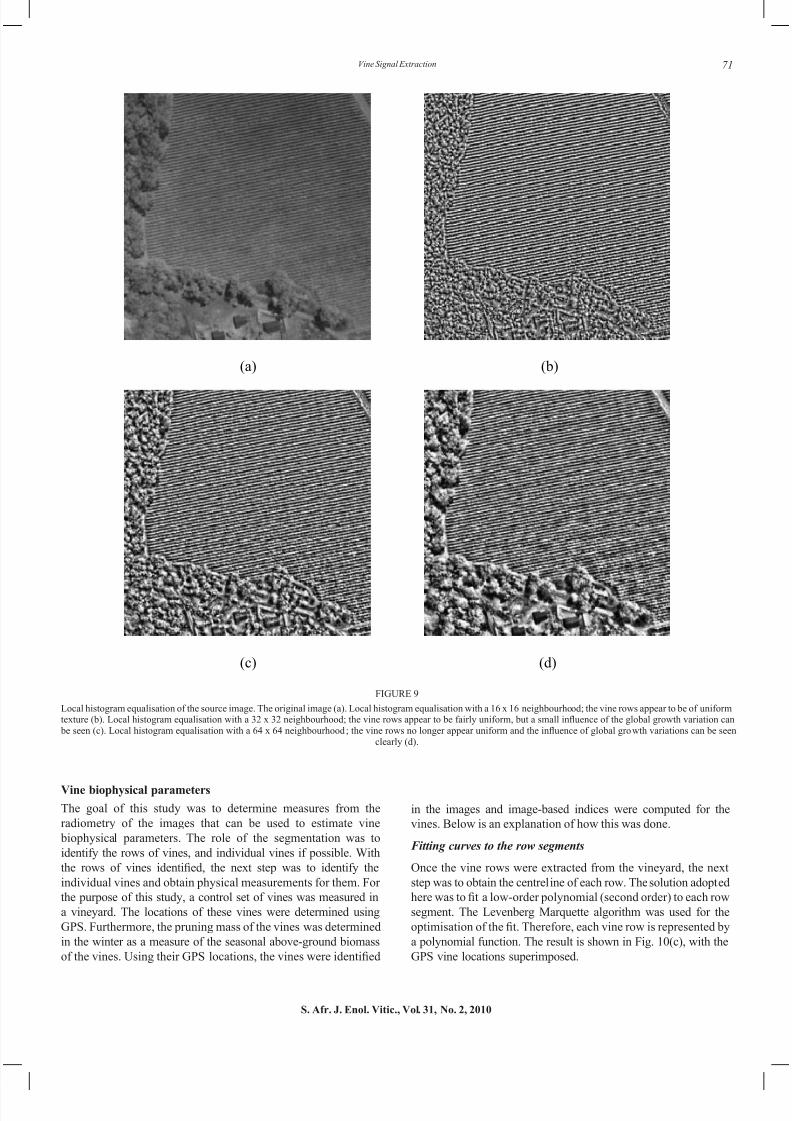
Pre-processing of the images
The images used in the segmentation are not of uniform contrast.
To correct this problem, local histogram equalisation must be
performed on the image. Depending on the neighbourhood size,
artefacts may be introduced into the image, as can be seen in Fig.
9. The likelihood of an optimal segmentation is increased when
the segmentation, or discriminating parameters, are as general as
possible. Increased variation, which has to be accounted for in
the image scene, results in greater difculty in the segmentation
process. As indicated in Fig. 9, the vines appear most uniform in
the local histogram equalisation with the 16 x 16 neighbourhood,
as is to be expected. As the neighbourhood size increases, the
inuence of the growth variations begins to be seen. It should be noted that the source image is from the NIR (near-infrared)
spectrum. Therefore, the segmentation was done on an image
in which local histogram equalisation with a reasonably small
neighbourhood size had been applied. The artefacts that result in
the forests and in the neighbourhood of the vineyard actually aid
the process of discriminating the vineyard from the neighbouring
forests and homesteads. The artefacts yield many small or twisted
segments that are later easily rejected with simple tests.
RESULTS AND DISCUSSION
In this section the results of the segmentation and the determination
of growth measures are discussed.
Segmentation
After pre-processing the source image, the segmentation
procedure as described above was applied. The threshold for the
difference between adjacent vertices in the graph was set to a
nominal value of ve. This threshold gave good results for this particular data. More work has to be done in future permutations
of the software for this threshold to be selected automatically. The
vine rows segmented well, yielding long segments (Fig. 10) thatcan easily be discriminated from the short segments found in the
forest areas. The exception to this is the roads, which also yielded
long segments. However, a simple test of parallelism should be
enough to distinguish roads from vine rows
The most critical step of the segmentation proved to be the pre-
processing and thresholding of the source images (for this project
an NIR image). Good pre-processing of the images should yield
images in which the global variation between vines is minimal.
In this respect, the local histogram equalisation was successful.
Future work will focus on using RGB images, which are potentially
better for discriminating overgrown inter-rows.
(a) (b)
Missin vines
FIGURE 8
Missing vines: missing vines in the segmentation image (a), and the situation on the ground (b).
Missin vines
7/18/2019 Viticultura in teledetectie
http://slidepdf.com/reader/full/viticultura-in-teledetectie 7/10
71
S. Afr. J. Enol. Vitic., Vol. 31, No. 2, 2010
Vine Signal Extraction
Vine biophysical parameters
The goal of this study was to determine measures from the
radiometry of the images that can be used to estimate vine
biophysical parameters. The role of the segmentation was to
identify the rows of vines, and individual vines if possible. With
the rows of vines identied, the next step was to identify theindividual vines and obtain physical measurements for them. For
the purpose of this study, a control set of vines was measured in
a vineyard. The locations of these vines were determined using
GPS. Furthermore, the pruning mass of the vines was determined
in the winter as a measure of the seasonal above-ground biomass
of the vines. Using their GPS locations, the vines were identied
in the images and image-based indices were computed for the
vines. Below is an explanation of how this was done.
Fitting curves to the row segments
Once the vine rows were extracted from the vineyard, the next
step was to obtain the centreline of each row. The solution adopted
here was to t a low-order polynomial (second order) to each rowsegment. The Levenberg Marquette algorithm was used for the
optimisation of the t. Therefore, each vine row is represented bya polynomial function. The result is shown in Fig. 10(c), with the
GPS vine locations superimposed.
(a) (b)
(c) (d)
FIGURE 9
Local histogram equalisation of the source image. The original image (a). Local histogram equalisation with a 16 x 16 neighbourhood; the vine rows appear to be of uniformtexture (b). Local histogram equalisation with a 32 x 32 neighbourhood; the vine rows appear to be fairly uniform, but a small inuence of the global growth variation can be seen (c). Local histogram equalisation with a 64 x 64 neighbourhood; the vine rows no longer appear uniform and the inuence of global growth variations can be seen
clearly (d).
7/18/2019 Viticultura in teledetectie
http://slidepdf.com/reader/full/viticultura-in-teledetectie 8/10
72
S. Afr. J. Enol. Vitic., Vol. 31, No. 2, 2010
Vine Signal Extraction
Detecting and rejecting non-vine segments
Using GPS positions, each vine was located in the image used in
the segmentation. If a vine fell within a vine row segment, then all
pixels in the neighbourhood of the vine, in the NIR image, were
sought. The neighbourhood is dened by the radius, r, where ris half the distance between adjacent vines in a row. Each pixelfound was tested to determine if it was in the same row segment
as the vine. Those pixels that were not in the same row segment
were rejected. The same procedure was repeated with the RGB
image.
Gathering growth values for the vines
From the pixels in the neighbourhood of a vine that cover the
vine canopy (in this test case a 3 x 3 pixel neighbourhood was
used), the following values were calculated: NDVI, PVI, mean
red, mean green, mean blue, mean NIR, the mean distance to the
vine and the mean distance to the vine row. The above process
was repeated for every vine. This is shown in Fig. 10(c) with the
GPS vine locations superimposed. The results were tabulated
together with the pruning mass measurement for each vine. In
Johnson et al . (2003), mention is made of the fact that vine leaf
area is related to many parameters (fruit ripening rate, vine water
status, fruit composition and wine quality), but also that it is not
easy for grape producers to measure it, as direct measurement is
time consuming and destructive. As in many other studies, these
authors also indicated the good relationship between pruning mass
(measured post-season in winter) and leaf area. For this reason, the
measurement of pruning mass can be considered a more practical
and relevant measure of vine biomass, which has been used in
several remote sensing studies (Jonhnson et al ., 1996; Lobitz et
al ., 1997; Strever, 2003).
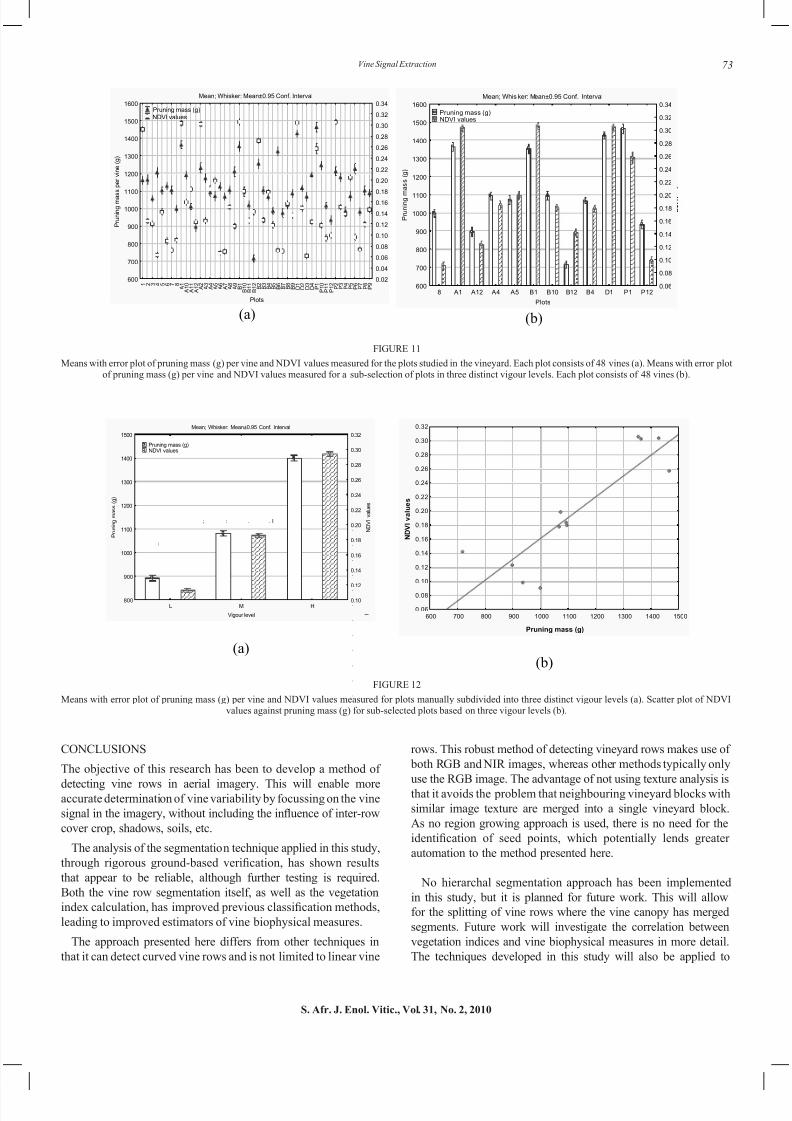
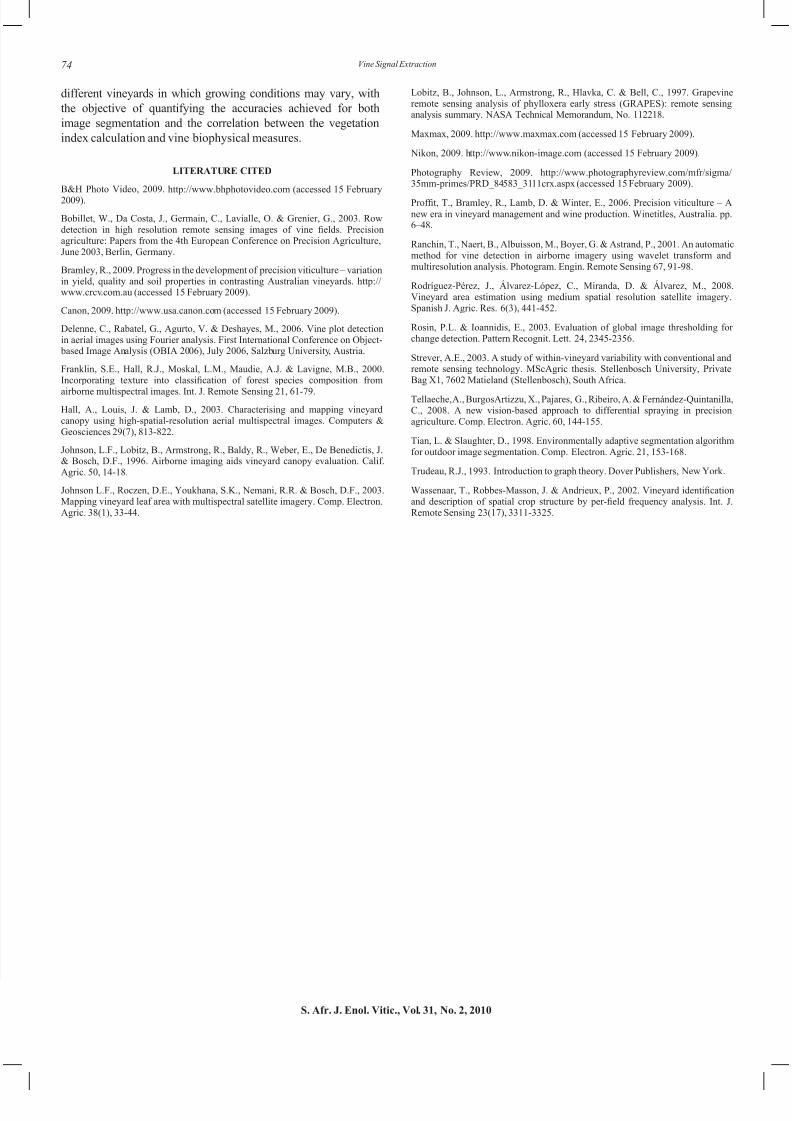
As in Johnson et al . (2003), it was found that the sensitivity
of the NDVI reaction to pruning mass on a plot level (a plot
consisting of four rows of 12 vines grouped together within the
vineyard) varied considerably, as is shown in Fig. 11(a), with
signicant improvement in the correspondence between pruning
mass and NDVI per plot, shown in Fig. 11(b), when the plots weremanually selected from three distinct vigour levels according to
pruning mass values, seen in Fig. 12(a). In general, plot NDVI
and pruning mass correlations (data not shown) were weak
(R 2 = 0.25), but improved signicantly (R 2 = 0.76) when plots of
three distinct varying vigour levels were sub-selected from the
48 plots, as shown in Fig. 11(b) and Fig. 12(a). This may be due
solely to the grouping of the selected vigour levels, as in Fig. 12(b)
(this is comparable to many studies where correlations are made
from sub-grouped vigour levels investigated within vineyards).
The results of the yield to NDVI correlations were similar.
Correlations between row NDVI levels and the pruning mass per
row were highly variable, however, with most plots not showing
any correlations with NDVI values. In addition, single-vine
correlations were not signicant in all the cases evaluated usingthis segmentation method. The poor correlations found with this
method are probably the result of the inability of the method to
incorporate the spatial and spectral features of a vine; i.e. when a
vine is smaller, the segmentation and subsequent pixel evaluation
accounted for the NDVI index values of the pixels surrounding
the vine, but, with the pixels limited to the segmented area, did not
include a parameter to account for the number of pixels segmented.
This “vine size” parameter is deemed to be just as important as the
spectral value of the pixels included in the segmentation, and will
be included in further studies.
(a) (b) (c)
FIGURE 10
Segmentation example. The thresholded, pre-processed image (a). The segmented vine rows extracted from the pre-processed image (b). The vine row centre lines withGPS vine locations superimposed (c).
7/18/2019 Viticultura in teledetectie
http://slidepdf.com/reader/full/viticultura-in-teledetectie 9/10
73
S. Afr. J. Enol. Vitic., Vol. 31, No. 2, 2010
Vine Signal Extraction
Mean; Whisker: Mean±0.95 Conf. Interval
1 2 3 4 5 6 7 8 A 1
A 1 0
A 1 1
A 1 2 A 2 A 3 A 4 A 5 A 6 A 7 A 8 A 9 B 1
B 1 0
B 1 1
B 1 2 B 2 B 3 B 4 B 5 B 6 B 7 B 8 B 9 D 1 D 2 D 3 D 4 P 1
P 1 0
P 1 1
P 1 2 P 2 P 3 P 4 P 5 P 6 P 7 P 8 P 9
Plots
600
700
800
900
1000
1100
1200
1300
1400
1500
1600
P r u n i n g m a s s p e r v i n e ( g )
0.02
0.04
0.06
0.08
0.10
0.12
0.14
0.16
0.18
0.20
0.22
0.24
0.26
0.28
0.30
0.32
0.34
Pruning mass (g) NDVI values
(a)
Mean; Whis ker: Mean±0.95 Conf. Interval
8 A1 A12 A4 A5 B1 B10 B12 B4 D1 P1 P12
Plots
600
700
800
900
1000
1100
1200
1300
1400
1500
1600
P r u n i n g m a s s ( g )
0.06
0.08
0.10
0.12
0.14
0.16
0.18
0.20
0.22
0.24
0.26
0.28
0.30
0.32
0.34
Pruning mass (g) NDVI values
(b)
; : . . I
.
.
.
.
.
.
.
.
.
.
.
.
I
I
Mean; Whisker: Mean±0.95 Conf. Interval
L M H
Vigour level
800
900
1000
1100
1200
1300
1400
1500
P r u n i n g m a s s ( g )
0.10
0.12
0.14
0.16
0.18
0.20
0.22
0.24
0.26
0.28
0.30
0.32
N D V I v a l u e s
Pruning mass (g) NDVI values
(a)
600 700 800 900 1000 1100 1200 1300 1400 1500
Pruning mass (g)
0.06
0.08
0.10
0.12
0.14
0.16
0.18
0.20
0.22
0.24
0.26
0.28
0.30
0.32
N D V I v a l u e s
(b)
CONCLUSIONS
The objective of this research has been to develop a method of
detecting vine rows in aerial imagery. This will enable moreaccurate determination of vine variability by focussing on the vine
signal in the imagery, without including the inuence of inter-rowcover crop, shadows, soils, etc.
The analysis of the segmentation technique applied in this study,
through rigorous ground-based verication, has shown resultsthat appear to be reliable, although further testing is required.
Both the vine row segmentation itself, as well as the vegetation
index calculation, has improved previous classication methods,leading to improved estimators of vine biophysical measures.
The approach presented here differs from other techniques in
that it can detect curved vine rows and is not limited to linear vine
rows. This robust method of detecting vineyard rows makes use of
both RGB and NIR images, whereas other methods typically only
use the RGB image. The advantage of not using texture analysis is
that it avoids the problem that neighbouring vineyard blocks with
similar image texture are merged into a single vineyard block.
As no region growing approach is used, there is no need for the
identication of seed points, which potentially lends greaterautomation to the method presented here.
No hierarchal segmentation approach has been implemented
in this study, but it is planned for future work. This will allow
for the splitting of vine rows where the vine canopy has merged
segments. Future work will investigate the correlation between
vegetation indices and vine biophysical measures in more detail.
The techniques developed in this study will also be applied to
FIGURE 11
Means with error plot of pruning mass (g) per vine and NDVI values measured for the plots studied in the vineyard. Each plot consists of 48 vines (a). Means with error plotof pruning mass (g) per vine and NDVI values measured for a sub-selection of plots in three distinct vigour levels. Each plot consists of 48 vines (b).
FIGURE 12
Means with error plot of pruning mass (g) per vine and NDVI values measured for plots manually subdivided into three distinct vigour levels (a). Scatter plot of NDVIvalues against pruning mass (g) for sub-selected plots based on three vigour levels (b).
7/18/2019 Viticultura in teledetectie
http://slidepdf.com/reader/full/viticultura-in-teledetectie 10/10
74
S. Afr. J. Enol. Vitic., Vol. 31, No. 2, 2010
Vine Signal Extraction
different vineyards in which growing conditions may vary, with
the objective of quantifying the accuracies achieved for both
image segmentation and the correlation between the vegetation
index calculation and vine biophysical measures.
LITERATURE CITED
B&H Photo Video, 2009. http://www.bhphotovideo.com (accessed 15 February2009).
Bobillet, W., Da Costa, J., Germain, C., Lavialle, O. & Grenier, G., 2003. Rowdetection in high resolution remote sensing images of vine elds. Precisionagriculture: Papers from the 4th European Conference on Precision Agriculture,June 2003, Berlin, Germany.
Bramley, R., 2009. Progress in the development of precision viticulture – variationin yield, quality and soil properties in contrasting Australian vineyards. http://www.crcv.com.au (accessed 15 February 2009).
Canon, 2009. http://www.usa.canon.com (accessed 15 February 2009).
Delenne, C., Rabatel, G., Agurto, V. & Deshayes, M., 2006. Vine plot detectionin aerial images using Fourier analysis. First International Conference on Object- based Image Analysis (OBIA 2006), July 2006, Salzburg University, Austria.
Franklin, S.E., Hall, R.J., Moskal, L.M., Maudie, A.J. & Lavigne, M.B., 2000.Incorporating texture into classication of forest species composition from
airborne multispectral images. Int. J. Remote Sensing 21, 61-79.
Hall, A., Louis, J. & Lamb, D., 2003. Characterising and mapping vineyardcanopy using high-spatial-resolution aerial multispectral images. Computers &Geosciences 29(7), 813-822.
Johnson, L.F., Lobitz, B., Armstrong, R., Baldy, R., Weber, E., De Benedictis, J.& Bosch, D.F., 1996. Airborne imaging aids vineyard canopy evaluation. Calif.Agric. 50, 14-18.
Johnson L.F., Roczen, D.E., Youkhana, S.K., Nemani, R.R. & Bosch, D.F., 2003.Mapping vineyard leaf area with multispectral satellite imagery. Comp. Electron.Agric. 38(1), 33-44.
Lobitz, B., Johnson, L., Armstrong, R., Hlavka, C. & Bell, C., 1997. Grapevineremote sensing analysis of phylloxera early stress (GRAPES): remote sensinganalysis summary. NASA Technical Memorandum, No. 112218.
Maxmax, 2009. http://www.maxmax.com (accessed 15 February 2009).
Nikon, 2009. http://www.nikon-image.com (accessed 15 February 2009).
Photography Review, 2009. http://www.photographyreview.com/mfr/sigma/35mm-primes/PRD_84583_3111crx.aspx (accessed 15 February 2009).
Proft, T., Bramley, R., Lamb, D. & Winter, E., 2006. Precision viticulture – Anew era in vineyard management and wine production. Winetitles, Australia. pp.6–48.
Ranchin, T., Naert, B., Albuisson, M., Boyer, G. & Astrand, P., 2001. An automaticmethod for vine detection in airborne imagery using wavelet transform andmultiresolution analysis. Photogram. Engin. Remote Sensing 67, 91-98.
Rodríguez-Pérez, J., Álvarez-López, C., Miranda, D. & Álvarez, M., 2008.Vineyard area estimation using medium spatial resolution satellite imagery.Spanish J. Agric. Res. 6(3), 441-452.
Rosin, P.L. & Ioannidis, E., 2003. Evaluation of global image thresholding forchange detection. Pattern Recognit. Lett. 24, 2345-2356.
Strever, A.E., 2003. A study of within-vineyard variability with conventional andremote sensing technology. MScAgric thesis. Stellenbosch University, PrivateBag X1, 7602 Matieland (Stellenbosch), South Africa.
Tellaeche, A., BurgosArtizzu, X., Pajares, G., Ribeiro, A. & Fernández-Quintanilla,C., 2008. A new vision-based approach to differential spraying in precisionagriculture. Comp. Electron. Agric. 60, 144-155.
Tian, L. & Slaughter, D., 1998. Environmentally adaptive segmentation algorithmfor outdoor image segmentation. Comp. Electron. Agric. 21, 153-168.
Trudeau, R.J., 1993. Introduction to graph theory. Dover Publishers, New York.
Wassenaar, T., Robbes-Masson, J. & Andrieux, P., 2002. Vineyard identicationand description of spatial crop structure by per-eld frequency analysis. Int. J.Remote Sensing 23(17), 3311-3325.