vital signs scorecard of operational performance kpis - …€¦ · · 2010-07-02vital signs...
TRANSCRIPT

Customer Services, Operations, and Safety Committee
Board Information Item IV-A
July 8, 2010
Vital Signs Scorecard of Operational Performance KPIs
Page 29 of 114

Washington Metropolitan Area Transit Authority
Board Action/Information Summary
Action Information MEAD Number:Resolution:
Yes No
TITLE: Vital Signs Scorecard PURPOSE: Report Metro’s actual performance in key areas of safety, security and service reliability. DESCRIPTION: This report analyzes why performance is changing and documents what is working well band what’s not. Areas in need of performance improvement will have specific actions documented that will drive execution toward targets. A companion scorecard appears as an on-line dashboard on Metro’s web page where these key performance indicators and other measures can be accessed by the public at any time. Measuring and reporting on Metro’s performance is an essential part of the overall assessment of how well this region’s primary transit system is delivering service to its customers. FUNDING IMPACT: None RECOMMENDATION: None
Page 30 of 114

Vital Signs Report A Scorecard of Metro’s
Key Performance Indicators (KPI)
Chief Performance Officer
July 2010
Page 31 of 114

2
Page Left Intentionally Blank
Page 32 of 114

3
Table of Contents
Executive Summary .................................................................................... 4
Strategic Framework ................................................................................... 5
Metro Facts at a Glance ............................................................................... 6
KPI’s that Score How Well Metro is Performing:............................................. 8
Bus On-Time Performance .................................................................... 8
Bus Fleet Reliability .............................................................................. 9
Rail On-Time Performance by Line ...................................................... 10
MetroAccess On-Time Performance ..................................................... 11
Escalator System Availability ............................................................... 12
Elevator System Availability ................................................................ 13
Customer Injury Rate (Metrorail & Metrobus) ....................................... 14
MetroAccess Passenger Injury Rate ..................................................... 15
Employee Injury Rate ......................................................................... 16
Crime Rate ........................................................................................ 17
Arrests, Citations and Summonses ...................................................... 18
Other Measures: ....................................................................................... 19
General Manager 6-Month Action Plan ................................................. 19
Jurisdictional Measures ....................................................................... 20
Definitions ............................................................................................... 22
Performance Data ..................................................................................... 24
Page 33 of 114

4
Vital Signs Report – July 2010 Executive Summary
Between April 2010 and May 2010, Metro’s average rail on-time-performance improved and three out of four Metro buses continued to adhere to route schedules. Although faced with increasing temperatures, bus fleet reliability stayed close to on target in May. Escalator and elevator availability declined in May in preparation for Metro to assume maintenance currently being done by a contractor. The transition is being done to improve accountability and performance over time. Prior to the shift, an assessment of the units needed to be completed, requiring some units to be taken out of service. In May, customer injuries decreased on Metro’s bus routes and in Metro’s rail facilities. Similar to last year, the number of worker’s compensation claims increased in May. Overall crime rate increased in May, but fewer crimes occurred in Metro’s parking lots and MTPD’s targeted effort to reduce “snatches” resulted in notable success.
Upcoming Performance Action Highlights:
Complete safety cultural assessment survey;
Participate in safety training provided by the Transportation Safety Institute;
Initiate a summer youth disturbance prevention campaign;
Adjust train schedules and spacing to address crowded platforms;
Increase communication with MetroAccess customers about using fixed route
services;
Take over maintenance of 55 escalators and 8 elevators from private
contractor; and
Progress report on external assessment of elevator and escalator maintenance
programs.
Page 34 of 114

5
Strategic Framework Overview
There are five strategic goals that provide a framework to quantify and measure how well Metro is performing. Each of the goals have underlying objectives intended to guide all employees in the execution of their duties. This report is a scorecard of key performance indicators tracking individual measures, ratios, rates and statistics.
Goal Objective
1 1.1 Improve customer and employee safety and security ("prevention")
1.2 Strengthen Metro’s safety and security response ("reaction")
2 2.1 Improve service reliability
2.2 Increase service and capacity to relieve overcrowding and meet future demand
2.3 Maximize rider satisfaction through convenient, comfortable services and facilities that are in good condition and easy to navigate
2.4 Enhance mobility by improving access to and linkages between transportation options
3 3.1 Manage resources efficiently
3.2 Target investments that reduce cost or increase revenue
4 4.1 Support diverse workforce development through management training and provision of state of the art facilities, vehicles, systems and equipment
5 5.1 Enhance communication with customers, employees, Union leadership, Board, media and other stakeholders
5.2 Promote the region’s economy and livable communities
5.3 Use natural resources efficiently and reduce environmental impacts
5 Goals
12Objectives
Goals 1. Create a Safer Organization
2. Deliver Quality Service
3. Use Every Resource Wisely
4. Retain, Attract and Reward the Best and the Brightest
5. Maintain and Enhance Metro’s Image
Page 35 of 114

6
Metro Facts at a Glance
Metro Service Area
Size 1,500 square miles
Population 3.5 million
Fiscal Year 2009 Actual Ridership
Bus 134 million
Rail 223 million
MetroAccess 2 million
Total 359 million
Fiscal Year 2011 Budget
Operating $1.5 billion
Capital $0.7 billion
Total $2.2 billion
Metrobus General Information
Size 12,000 bus stops
Routes 320
Fiscal Year 2011 Operating Budget $538 million
Average Weekday Boardings 416,148 (May 2010)
Highest Ridership Route in 2009 30’s – Pennsylvania Ave. (16,330 avg. wkdy ridership)
Metrobus Fare* $1.70 cash, $1.50 SmarTrip®
Express Bus Fare* $3.85 cash, $3.65 SmarTrip®
Bus Fleet** 1,482
Buses in Peak Service** 1,242
Bus Fleet by Type** Compressed Natural Gas (459), Electric Hybrid (95), Clean Diesel (116) and All Other (812)
Average Fleet Age** 8.7 years
Bus Garages 9 – 3 in DC, 3 in MD and 3 in VA
*As of June 27, 2010 **As of June 2009
Page 36 of 114

7
Metrorail General Information
Fiscal Year 2011 Operating Budget $822 million
Average Weekday Passenger Trips 750,654 (May 2010)
Highest Ridership Day Obama Inauguration on Jan. 20, 2009 ( 1.1 million)
Busiest Station in 2009 Union Station (34,465 average weekday boardings)
Regular fare (peak)*** Minimum - $1.95; Maximum - $5.00
Reduced fare (non-peak)*** Minimum - $1.60; Maximum - $2.75
1st Segment Opening/Year Farragut North-Rhode Island Avenue (1976)
Newest Stations/Year Morgan Boulevard, New York Avenue, and Largo Town Center (2004)
Rail Cars in Revenue Service**** 1,118
Rail Cars in Peak Service**** 850
Rail Cars by Series**** 1000 Series (288), 2000/3000 (362), 4000 (100), 5000 (184) and 6000 (184)
Lines 5 – Blue, Green, Orange, Red and Yellow
Station Escalators 588
Station Elevators 236
Longest Escalator Wheaton station (230 feet)
Deepest Station Forest Glen (21 stories / 196 feet)
Rail Yards 9 – 1 in DC, 6 in MD and 2 in VA
***As of June 27, 2010; additional changes effective August 1. ****As of April 2010
MetroAccess General Information
Fiscal Year 2011 Operating Budget $104 million
Average Weekday Trips 8,914 (March 2010)
MetroAccess fare***** Within ADA core service area - $3.00; Outside ADA core service area - $2.00 to $4.00 supplemental fare
Paratransit Vehicle Fleet 600
Average Fleet Age 3 years
Paratransit Garages 7 (1 in DC, 4 in MD and 2 in VA)
Contract Provider MV Transportation***** Service outside ADA core service area for grandfathered customers only as of June 27, 2010.
Page 37 of 114
8
KPI’s that Score How Well Metro is Performing:
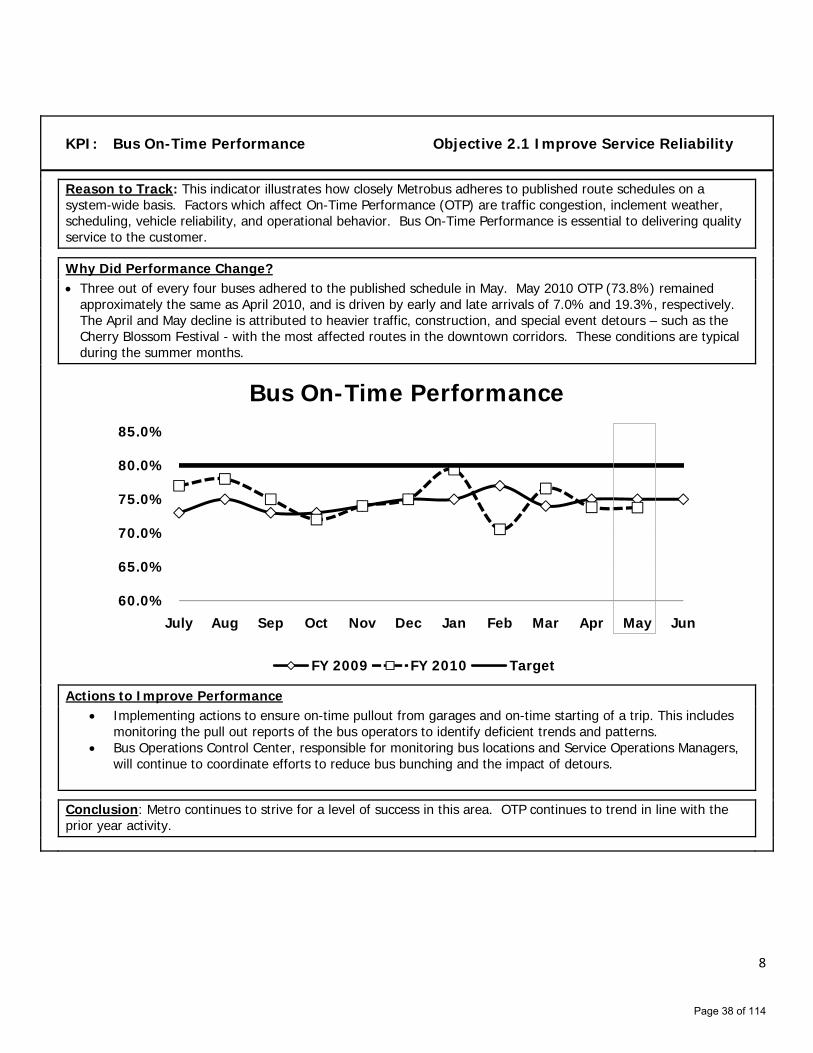
KPI: Bus On-Time Performance Objective 2.1 Improve Service Reliability
Reason to Track: This indicator illustrates how closely Metrobus adheres to published route schedules on a system-wide basis. Factors which affect On-Time Performance (OTP) are traffic congestion, inclement weather, scheduling, vehicle reliability, and operational behavior. Bus On-Time Performance is essential to delivering quality service to the customer.
Why Did Performance Change?
Three out of every four buses adhered to the published schedule in May. May 2010 OTP (73.8%) remained approximately the same as April 2010, and is driven by early and late arrivals of 7.0% and 19.3%, respectively. The April and May decline is attributed to heavier traffic, construction, and special event detours – such as the Cherry Blossom Festival - with the most affected routes in the downtown corridors. These conditions are typical during the summer months.
Actions to Improve Performance
Implementing actions to ensure on-time pullout from garages and on-time starting of a trip. This includes monitoring the pull out reports of the bus operators to identify deficient trends and patterns.
Bus Operations Control Center, responsible for monitoring bus locations and Service Operations Managers, will continue to coordinate efforts to reduce bus bunching and the impact of detours.
Conclusion: Metro continues to strive for a level of success in this area. OTP continues to trend in line with the prior year activity.
60.0%
65.0%
70.0%
75.0%
80.0%
85.0%
July Aug Sep Oct Nov Dec Jan Feb Mar Apr May Jun
Bus On-Time Performance
FY 2009 FY 2010 Target
Page 38 of 114

9
KPI: Bus Fleet Reliability (Mean Distance
Between Failures) Objective 2.1 Improve Service Reliability
Reason to Track: One source of reliability problems are vehicle breakdowns that cause buses to go out of service. This key performance indicator communicates service reliability and is used to monitor trends in vehicle breakdowns and to plan corrective actions. Factors that influence bus fleet reliability are the quality of a maintenance program, vehicle age, original vehicle quality, and road conditions. For this measure higher miles are better, meaning that the vehicle goes farther without breaking down.
Why Did Performance Change?
Bus fleet reliability is virtually on target, although the reliability decreased from the prior month by 368 miles or 5.9%. This slight drop from the prior month is in response to increased temperatures. Electric components tend to be more vulnerable during the summer months. This pattern is consistent with Metro's historical reliability pattern and industry trends.
Actions to Improve Performance
Bus maintenance staff is proactively preparing for the challenges of the summer months. Metro begins in March to prepare for anticipated part failures attributable to the summer heat.
Maintenance will be consistently performed on schedule. See Customer Service, Operations and Safety Committee Meeting April 8, 2010, Action Item D: Bus Fleet Maintenance Comparisons.
Conclusion: Bus reliability outperformed the previous fiscal year for five consecutive months, as a result of the rollout of 203 new buses. May’s MDBF performance differs slightly from the Fiscal Year 2010 monthly average of 6,118 miles by less than 216 miles. Metro’s buses run approximately 144,720 miles during a weekday. The stress levels of the summer heat tend to normalize in late August.
1 The MDBF target decreased from 6,500 to 6,000 to address the delayed delivery of new buses due to acceptance testing taking longer than
expected; the target will be re‐evaluated at the end of 2010.
4,0004,5005,0005,5006,0006,5007,0007,5008,000
July Aug Sep Oct Nov Dec Jan Feb Mar Apr May Jun
Mea
n D
ista
nce
Bet
wee
n F
ailu
res
(M
iles)
Bus Fleet Reliability
FY 2009 FY 2010 Target
Page 39 of 114

10
KPI: Rail On-Time Performance by Line Objective 2.1 Improve Service Reliability
Reason to Track: On-Time Performance measures the adherence to weekday headways, the time between trains. Factors that can affect on-time performance include track conditions resulting in speed restrictions, the number of passengers accessing the system at once, dwell time at stations, equipment failures and delays such as sick passengers or offloads. On-time performance, along with other measures, is a component of customer satisfaction.
Why Did Performance Change?
Average on-time performance continues to improve. Performance on the Red Line, Metro’s oldest line, continued to benefit from completed and on-going track
maintenance work. All lines continue to operate in manual mode, which reduces the maximum achievable on-time performance. Daily availability of trains is made more complex with 1000 Series cars used only in the middle of trains. 1000
Series cars comprise 26% of Metro’s rail car fleet.
Actions to Improve Performance
Evaluate and adjust train schedule and spacing to address crowded platforms during peak periods. For example, a Red Line schedule change will be implemented in July 2010 to better maintain scheduled headways.
Replacement of the 1000 Series railcars is underway (vehicle delivery starts in FY 2013). See Board of Directors Meeting May 27, 2010, Action Item 12: Approval to Award Contract for 7000 Series Railcar Purchase.
Conclusion: System-wide Metrorail on-time performance continues to improve from a low in December 2009. Maintenance of the rail system will continue to be needed to ensure safe and reliable service for Metrorail customers.
75.0%
80.0%
85.0%
90.0%
95.0%
100.0%
Jun-09 Jul-09 Aug-09 Sep-09 Oct-09 Nov-09 Dec-09 Jan-10 Feb-10 Mar-10 Apr-10 May-10
Rail On-Time Performance By Line
Red Line Blue Line Orange Line Green LineYellow Line Average Target
Page 40 of 114

11
Due to contractor reporting cycle, no new data reported for MetroAccess On-Time Performance.
KPI: MetroAccess On-Time Performance Objective 2.1 Improve Service
Reliability
Reason to Track: On-time performance (OTP) is a critical measure of MetroAccess service reliability and customer expectations. Adhering to the customer's scheduled pick-up window is comparable to Metrobus adhering to scheduled timetables. Factors which affect on-time performance are traffic congestion, inclement weather, scheduling, vehicle reliability and operational behavior. MetroAccess on-time performance is essential to delivering quality service to customers.
Why Did Performance Change?
On-time performance has been holding relatively steady around 92% with the exception of February, where the
snow significantly impacted service delivery on secondary roads. An additional impact to OTP is rapidly growing ridership (20% annually).
Actions to Improve Performance
Dispatchers are receiving refresher training on policies and procedures and have been provided new technological tools that allow for enhanced monitoring of projected late trips.
Process to streamline dispatch procedures at the division level is underway to facilitate faster pull-out for vehicles.
Conclusion: MetroAccess delivered 91.1% of trips on-time for April 2010, nearing its target of 92.0%. MetroAccess on-time performance shows consistent delivery of service within customer expectations.
85.0%
90.0%
95.0%
100.0%
July Aug Sep Oct Nov Dec Jan Feb Mar Apr May Jun
MetroAccess On-Time Performance
FY 2009 FY 2010 Target
Page 41 of 114

12
KPI: Escalator System Availability Objective 2.1 Improve Service Reliability
Reason to Track: Riders access Metrorail stations via escalators to the train platform. An out-of-service escalator requires walking up or down a stopped escalator, which can add to the rider's total travel time and may make stations inaccessible to some customers. Escalator availability is a key component of customer satisfaction with Metrorail service.
Why Did Performance Change?
Condition assessments were conducted in May on Schindler-maintained units located at Dupont Circle, Farragut North and Metro Center stations. Fourteen of the 55 units were taken out of service for maintenance in preparation for July 1st transition to Metro maintaining these units.
The outside assessment of escalator/elevator maintenance processes and work order tracking technology is underway. Consultant activities thus far include interviewing staff, examining work orders, monitoring data and visiting two of the stations that will be audited (Woodley Park and Bethesda).
Actions to Improve Performance
On July 1st, Metro will take over maintenance of 55 Schindler escalators (9% of escalators in system). Over time, Metro’s maintenance of these escalators will improve performance. In the short term, Metro anticipates service availability will be impacted as Metro transitions to maintaining these additional units.
Rapid response maintenance teams will begin in July to focus on repairs to units with reliability concerns and units that are heavily used.
Five maintenance employees recently received certification as master technicians. These employees will focus on conducting maintenance inspections that proactively identify maintenance issues, reducing instances of units going out of service unexpectedly.
Complement maintenance activities with an audit program that focuses on quality of work and retraining as needed in order to reduce re-work and improve system availability.
Conclusion: Metrorail escalators were available for 315,934 hours in May (equivalent to an average of 527 out of 588 escalators in operation systemwide). This represents a slight dip from April when an average of 528 units were available.
85.0%
90.0%
95.0%
July Aug Sept Oct Nov Dec Jan Feb Mar Apr May Jun
Escalator System Availability
FY 2009 FY 2010 Target
Page 42 of 114

13
KPI: Elevator System Availability Objective 2.1 Improve Service Reliability
Reason to Track: Metrorail elevators provide an accessible path of travel for persons with disabilities, seniors, customers with strollers, travelers carrying luggage and other riders. When an elevator is out of service, Metro is required to provide alternative services, which may include a bus bridge to another station.
Why Did Performance Change?
Elevators available in May averaged 267 units, compared with 269 in April (out of 277 escalators systemwide). Elevator car door problems notably contributed to reduced system availability. This is most common with street-
level elevators, as pebbles and other debris are tracked from the street and become caught in the door tracks. The outside assessment of escalator/elevator maintenance processes and work order tracking technology is
underway. Consultant activities thus far include interviewing staff, examining work orders, monitoring data and visiting two of the stations that will be audited (Woodley Park and Bethesda).
Actions to Improve Performance
On July 1st, Metro will begin maintaining 8 elevators currently maintained by Schindler (3% of elevators in system).
Due to the small number of elevator units being transitioned to Metro maintenance, no significant impacts are anticipated to elevator system availability.
Conclusion: Metrorail elevators were available for 159,928 hours in May (equivalent to an average of 267 out of 277 elevators in operation systemwide). This is a reduction of 2 units from April when 269 elevators were available.
90.0%
95.0%
100.0%
July Aug Sept Oct Nov Dec Jan Feb Mar Apr May Jun
Elevator System Availability
FY 2009 FY 2010 Target
Page 43 of 114

14
KPI: Customer Injury Rate (Metrorail &
Metrobus) Objective 1.1 Improve Customer and Employee Safety and Security
Reason to Track: Customer safety is the highest priority for Metro and a key measure of quality service. Customers expect a safe and reliable ride each day. The customer injury rate is an indicator of how well the service is meeting this safety objective.
Why Did Performance Change?
The customer injury rate improved slightly from March to April and on average remains lower than in fiscal year 2009.
For fiscal year 2010, Metrorail continues to average less than one injury for every 7 million passenger trips made each month. Metrobus has averaged one injury for every 1 million passenger trips, year to date. Including facilities injuries, the total rate of injury is slightly more at 1.1 injuries per million passenger trips. Rail facility customer safety continued to show normal trends.
Actions to Improve Performance
Metro is participating in safety training provided by the Transportation Safety Institute and funded by the Federal Transit Administration. The training covers areas agency-wide that will improve operating safety and safety for customers.
Metro continues to encourage customer awareness of personal safety through public address messages system-wide.
Conclusion: Metro continues to work every day to improve safety for customers. Rail and bus transit continue to be two of the safest modes of transportation in the Washington region.
0.00
0.50
1.00
1.50
2.00
2.50
3.00
3.50
July Aug Sept Oct Nov Dec Jan Feb Mar Apr May June
Per
Mill
ion
Pas
sen
ger
Trip
s
Customer Injury Rate
FY 2010 FY 2009
Page 44 of 114

15
Due to contractor reporting cycle, April data revised. Preliminary data were presented in the June 2010 Vital Signs Report.
KPI: MetroAccess Passenger Injury Rate
(Per 100,000 Passengers) Objective 1.1 Improve Customer and Employee Safety and Security
Reason to Track: Safely transporting passengers is the highest priority for Metro. MetroAccess transports customers with disabilities who require the most assistance of all of Metro's riders.
Why Did Performance Change?
April 2010 shows a slight increase in the rate of injuries to passengers from the prior month, but still below the
average for the fiscal year. MetroAccess continues to maintain a strong safety record in assisting passengers.
Actions to Improve Performance
MetroAccess operators will receive refresher training on passenger assistance and securement. 66% of April 2010 injuries relate to passenger assistance.
Launch a customer safety awareness campaign and education initiative with the participation of the Accessibility Advisory Committee. The importance of accepting assistance in boarding and alighting vehicles and following safety related customer policies and guidance will be emphasized.
All MetroAccess Road Supervisors will collectively complete a minimum of 400 Safety Conversations per week.
Conclusion: MetroAccess will continue to improve its overall passenger safety performance through greater service monitoring, employee training, and customer education and awareness.
0.00
1.00
2.00
3.00
4.00
5.00
6.00
7.00
July Aug Sept Oct Nov Dec Jan Feb Mar Apr May JunePer
10
0,0
00
Pas
sen
gers
MetroAccess Passenger Injury Rate
FY 2010 FY 2009
April data revised.
Page 45 of 114

16
KPI:
Employee Injury Rate (Worker’s Compensation Claims with Cost of More than $20)
Objective 1.1 Improve Customer and Employee Safety and Security
Reason to Track: Worker's compensation claims are a key indicator of how safe employees are in the workplace. This measure captures all of the types of claims filed where there is a cost of more than $20.
Why Did Performance Change?
Number of claims decreased from April to May in Rail Transportation, Track and Structures System Maintenance,
and Metro Transit Police Department, which had zero claims. Bus Transportation claims increased in May, however the year-to-date claims are below the base year of 2007.
Actions to Improve Performance
Test “work zone” approach to address on-track safety for track inspectors working during operating hours. Increase safety conversation compliance to meet 80% target. Launch Safety Management System (SMS), a new way of reporting, tracking and analyzing incidents.
Deployment and training will begin with Metrobus.
Conclusion: Metro is working on improving workplace safety as a top priority. Progress is being made through improved communications, updated rules and procedures, and increased safety training. Employee injuries on the job are the primary measure of success of these activities.
0
10
20
30
40
50
60
70
80
90
July Aug Sept Oct Nov Dec Jan Feb Mar Apr May JuneNu
mbe
r of
Em
ploy
ee C
laim
s w
ith
Cos
t >
$2
0
Employee Injury Rate
Target 30% Reduction from 2007 FY 2010 FY 2009
Page 46 of 114

17
KPI: Crime Rate (Per Million Passengers) Objective 1.2 Strengthen Metro’s Safety
and Security Response
Reason to Track: This measure provides an indication of the perception of safety and security customers experience when traveling the Metro system. Increases or decreases in crime statistics can have a direct effect on whether customers feel safe in the system.
Why Did Performance Change?
The Metro parking lot crime rate decreased from March to April, attributable to a decrease in larcenies committed in parking lots (stolen auto parts and/or property from unoccupied vehicles). Compared with the same month in 2009, total crimes in parking lots were reduced by half (April 2009 – 104 events, April 2010 – 51 events). This is a result of joint efforts with local jurisdictions to focus attention on crime hot spots.
Although the overall crime rate increased for Metrobus and Metrorail, MTPD’s targeted efforts to reduce robberies classified as “snatches” (theft of property such as cell phones, iPods, cameras, etc.) resulted in a notable decrease: in March, snatches accounted for 62% of all robberies, while in April only 44% of the robberies were classified as snatch cases. Efforts included an education campaign coordinated with Metro’s Marketing department to inform riders about how to protect themselves and their property, including an ad on buses, trains and in stations, an online video to demonstrate how snatches occur, and other crime prevention efforts.
Actions to Improve Performance
Continued deployment of plain clothes crime suppression teams in an effort to combat robberies. Uniform police presence in the Metro system will increase by requiring MTPD administration officials to devote one
day a week to patrol duties. Initiate summer youth disturbance prevention campaign.
Conclusion: The MTPD continues to meet the challenge of decreasing robberies in the Metro system by utilizing deployment resources and strategies from various units within MTPD. In April, the Metrorail crime rate of 5.06 crimes per million passengers is better than the average for the last twelve months (5.43 crimes/million passengers). Significant outreach and partnering activities have been developed throughout Metro to keep the system safe.
-1 2 3 4 5 6 7 8
May-09 Jun-09 July-09 Aug-09 Sept-09 Oct-09 Nov-09 Dec-09 Jan-10 Feb-10 Mar-10 Apr-10Per
Mill
ion
Pas
sen
gers
Crime Rate
Metrobus Metrorail Metro Parking Lots
Page 47 of 114

18
KPI: Arrests, Citations and Summonses Objective 1.2 Strengthen Metro’s Safety
and Security Response
Reason to Track: This measure reflects actions by the Metro Transit Police Department (MTPD) to keep the Metro system safe. This includes arrests of individuals breaking the law within the Metro system and citations/summonses issued by MTPD officers. Examples of citations/summonses include fare evasion and public conduct violations.
Why Did Performance Change?
MTPD arrests, summonses and citations in April were similar with March, with enforcement actions remaining relatively stable during the last twelve months.
Thus far in Fiscal Year 2010, 1,941 arrests have been made compared 1,833 during the same period in Fiscal Year 2009. Citations/summonses are also higher, with a total 6,437 Fiscal Year to date compared with 6,117 for the same period in Fiscal Year 2009.
Actions to Improve Performance
MTPD is working on an immediate plan to address youth disturbances in the Metro system. Metro typically experiences an increase in youth related criminal activity when schools close for the summer.
Deployment of Transit Anti-Crime teams to address increased ridership resulting from growing attendance at Washington Nationals baseball games.
Conclusion: Police enforcement actions remained stable over the last year. Over the next few months, the MTPD anticipates an increase in arrests and citations/summonses due to youth-related crime during school closings and due to increased ridership to Washington Nationals baseball games.
-
100
200
300
400
500
600
700
800
900
May-09 Jun-09 July-09 Aug-09 Sept-09 Oct-09 Nov-09 Dec-09 Jan-10 Feb-10 Mar-10 Apr-10Nu
mbe
r of
En
forc
emen
t A
ctio
ns
Arrests, Citations and Summonses
Arrests Citations/Summonses Issued
Page 48 of 114

19
Other Measures: General Manager 6-Month Action Plan
Apr
May Jun
Jul
Aug
Sep
Oct
Create a Safer OrganizationFill safety department vacancies
Increase safety training
Close out safety-related audit findings
Develop incident tracking, safety management reporting system
Encourage near-miss reporting, publicize employee hotline Strengthen whistleblower protection
Complete new right-of-way worker protection manual
Revise rail safety rules and procedures handbook
Assess safety-related internal controls
Initiate thorough assessment of safety culture
Deliver Quality ServiceIncrease training for front-line employees and supervisors
Create transparent performance tracking & reporting systems Revise inspection & maintenance procedures in operations
New schedule adjustment on Red Line to fix running time.
External assessment of elevator and escalator maintenance and repair programContinually re-emphasize safety and State of Good Repairs as top priorities
Use Every Resource WiselyEducate policymakers, customers, public about funding roles on-going
Implement approved FY2011 budget
Transition to next 6-year capital program
Respond to NTSB recommendations with capital budget impact
Stakeholder discussion on long-term fiscal outlook
Summary of results to date: Scorecard Key -
AccomplishedOn schedule
Requires attention X
Each action has been assigned to specific members of the executive staff. Detailed exection steps have been laid out with clear due-dates. The GM is constantly monitoring the progress being made on each task and maintaining accountability for results.
on-going
on-going
Page 49 of 114

20
Jurisdictional Measures
Jurisdictional Measures FY 09 Actual
Output: Revenue Vehicle Miles (Millions) Metrorail 71.803 Metrobus 41.168
Output: Passengers Per Revenue Vehicle Mile Metrorail 3.10 Metrobus 3.25
Efficiency: Operating Cost Per Revenue Vehicle Mile Metrorail $10.60 Metrobus $12.19
Efficiency: Farebox Recovery Ratio Metrorail 66.5% Metrobus 22.1% MetroAccess 4.2% WMATA Systemwide 49.6%
Efficiency: Operating Cost Per Passenger Trip Metrorail $3.42 Metrobus $3.75 MetroAccess $37.64
Outcome: Annual Ridership (Millions) Metrorail (linked trips) 222.858 Metrobus 133.773 MetroAccess 2.109
Outcome: Maryland Annual Ridership (Millions) Metrorail 43.828 Metrobus 39.266 MetroAccess 1.303
Outcome: District of Columbia Annual Ridership (Millions) Metrorail 127.536 Metrobus 70.407 MetroAccess 0.535
Outcome: Virginia Annual Ridership (Millions) Metrorail 51.494 Metrobus 22.789 MetroAccess 0.266
Page 50 of 114

21
Jurisdictional Measures
FY07 FY08 FY09 FY09 FY10 FY11Actual Actual Estimate Actual Estimate Estimate
Metrobus Routes 87 100 100 91 75 1 75
Trips Originating in Fairfax County 9,272,000 10,040,500 10,140,905 9,440,351 10,445,132 9,629,158Platform Hours 372,266 395,999 407,627 407,844 371,721 395,662Platform Miles 7,065,260 7,310,086 7,564,034 6,565,966 6,662,941 7,330,351
Operating Subsidy $36,723,400 $36,744,578 $44,433,718 $42,761,346 40,219,382$ 40,650,118$ Operating Subsidy/ Platform Mile $5.20 $5.03 $5.87 $6.51 $6.04 $5.55Operating Subsidy/ Platform Hour $98.65 $92.79 $109.01 $104.85 $108.20 $102.74
Operating Subsidy Per Trip $3.96 $3.66 $4.38 $4.53 $3.85 $4.22
Percent Change in Fairfax County Trips 0.0% 8.3% 1.0% -6.0% 3.0% -7.8%
FY07 FY08 FY09 FY09 FY10 FY11Actual Actual Estimate Actual Estimate Estimate
Fairfax County Ridership 28,815,191 28,432,596 29,285,574 29,012,470 30,164,141 29,592,719
Operating Subsidy $17,496,099 $19,266,866 $17,664,683 $17,334,537 $24,137,403 $16,999,647
Operating Subsidy Per Metrorail Passenger
$0.61 $0.68 $0.60 $0.60 $0.80 $0.57
Percent Change in Metrorail Ridership
-3.3% -1.3% 3.0% 2.0% 3.0% 3.0%
1 FY10 Metrobus Routes as of April 2010
Produced by jurisdictional request based on available data.
Metrobus in Fairfax County
Metrorail in Fairfax County
Page 51 of 114

22
Vital Signs Report Definitions for Key Performance Indicators
Bus On-Time Performance – Metrobus adherence to scheduled service. Calculation: For delivered trips, difference between scheduled time and actual time arriving at a time point based on a window of no more than 2 minutes early or 7 minutes late. Sample size of observed time points varies by route. Bus Fleet Reliability (Bus Mean Distance between Failures) – The number of revenue miles traveled before a mechanical breakdown. A failure is an event that requires the bus to be removed from service or deviation from the schedule. Calculation: Number of failures / miles Rail On-Time Performance by Line – Rail on-time performance is measured by line during weekday peak and off-peak periods. During peak service (AM/PM), the percentage of station stops made within the scheduled headway plus two minutes are considered on-time. During non-peak (mid-day and late night), the percentage of station stops made within the scheduled headway plus no more than 50% of the scheduled headway are considered on-time. Calculation: Number of Metrorail station stops made up to the scheduled headway plus 2 minutes / total Metrorail station stops for peak service. Number of Metrorail station stops made up to 150% of the scheduled headway / total Metrorail station stops for off-peak service. MetroAccess On-Time Performance – The number of trips provided within the on-time pick-up window of the trips that were actually dispatched into service (delivered). This includes trips where the vehicle arrived, but the customer was not available to be picked up. Vehicles arriving at the pick-up location after the end of the 30-minute on-time window are considered late. Vehicles arriving more than 30 minutes after the end of the on-time window are regarded as very late. Calculation: The number of vehicle arrivals at the pick-up location within the 30-minute on-time window / the total number of trips delivered. Elevator and Escalator System Availability – Percentage of time that the Metrorail escalator or elevator system is in service during operating hours. Calculation: Hours in service / operating hours. Hours in service = operating hours – hours out of service (both scheduled and unscheduled). Operating hours = revenue hours per unit * number of units. Customer Injury Rate (per Million Passenger Trips) – The number of customers injured and requiring medial transport throughout the rail and bus system for every one million passenger trips. Customer injuries per million passenger trips is used to demonstrate the relative proportion of safe service which is provided. Calculation: Bus passenger injuries, rail passenger injuries, rail facility injuries, including escalator injuries / (passenger trips / 1,000,000).
Page 52 of 114

23
MetroAccess Passenger Injury Rate (per 100,000 Passengers) – The number of passengers injured and requiring medical transport for every one hundred thousand passengers transported by Metro Access. Calculation: Passenger injuries requiring medical transport / total passengers. Employee Injury Rate (Worker’s Compensation Claims with Cost > $20) – The number of worker’s compensation claims made by employees per month. This measure compares the base year of FY 2007 and the target reduction of 30% fewer than the base year number of claims, and is a measure of improving the safe behavior of employees throughout the agency. Calculation: Number of Worker’s Compensation Claims with Cost > $20 per month as compared with the target of 30% less than the number of claims made in FY 2007 by month. Crime Rate (per Million Passengers) – Crimes reported to Metro Transit Police Department on Bus, Rail, or at parking lots, metro facilities, bus stops and other locations in relation to Metro’s monthly passenger trips. Reported by Metrobus, Metrorail, and Metro parking lots. Calculation: Number of crimes / (passenger trips / 1,000,000) Arrests, Citations and Summonses – The number of arrests and citations/summonses issued by the Metro Transit Police Department. Examples of citations/summonses include minor misdemeanors, fare evasion and public conduct violations.
Page 53 of 114

Vital Signs Report Performance Data July 2010
KPI: Bus On-Time Performance / Target = 80%
July Aug Sep Oct Nov Dec Jan Feb Mar Apr May JunAvg.
thru MayFY 2009 73.0% 75.0% 73.0% 73.0% 74.0% 75.0% 75.0% 77.0% 74.0% 75.0% 75.0% 75.0% 74.5%FY 2010 77.0% 78.0% 75.0% 72.0% 74.0% 75.0% 79.4% 70.6% 76.6% 73.8% 73.8% 75.0%
KPI: Bus Fleet Reliability (Bus Mean Distance Between Failures) / Target = 6,000 Miles (Revised in January 2010)
July Aug Sep Oct Nov Dec Jan Feb Mar Apr May JunAvg.
thru MayFY 2009 4,744 5,820 6,153 5,876 7,405 6,601 6,316 6,227 6,292 4,945 4,652 4,503 5,912FY 2010 4,898 5,437 5,325 5,732 6,054 6,700 7,223 6,878 6,882 6,270 5,902 6,118
Bus Fleet Reliability (Bus Mean Distance Between Failure by Fleet Type)Type (~ % of Fleet) July Aug Sep Oct Nov Dec Jan Feb Mar Apr May Jun Avg.CNG (31%) 7,053 7,739 7,851 8,105 7,362 12,258 9,347 8,935 8,853 7,842 7,905 8,477Hybrid (6%) 11,141 8,962 8,520 9,973 10,980 10,167 11,859 10,666 10,546 9,499 8,844 10,105Clean Diesel (8%) 9,400 13,015 11,150 12,345 10,052 11,137 9,806 9,911 11,109 7,990 7,345 10,296All Other (55%) 3,386 3,739 3,679 3,872 4,393 4,187 5,225 4,928 4,804 4,562 4,102 4,262
KPI: Rail On-Time Performance by Line / Target = 95%Jun-09 Jul-09 Aug-09 Sep-09 Oct-09 Nov-09 Dec-09 Jan-10 Feb-10 Mar-10 Apr-10 May-10 Avg.
Red Line 93.2% 78.3% 83.1% 88.0% 92.2% 91.9% 88.5% 89.0% 87.9% 88.9% 90.0% 91.0% 88.5%Blue Line 88.4% 87.2% 86.5% 86.8% 89.6% 90.0% 86.4% 88.2% 87.4% 88.2% 88.9% 88.3% 88.0%Orange Line 92.7% 90.3% 90.4% 92.5% 92.2% 92.4% 87.1% 90.1% 88.7% 92.2% 92.1% 91.4% 91.0%Green Line 92.3% 90.9% 90.1% 89.3% 90.2% 89.8% 86.8% 90.5% 89.4% 91.1% 90.7% 91.0% 90.2%Yellow Line 92.5% 92.0% 89.6% 88.1% 91.0% 91.8% 89.4% 91.6% 91.4% 91.4% 90.4% 90.7% 90.8%Average (All Lines) 92.0% 86.4% 87.0% 88.8% 91.2% 91.2% 87.6% 89.5% 88.6% 90.0% 90.3% 90.6% 89.4%
KPI: MetroAccess On-Time Performance / Target = 92%
July Aug Sep Oct Nov Dec Jan Feb Mar Apr May JunAvg.
thru Apr.FY 2009 92.9% 92.5% 91.1% 91.1% 92.5% 93.1% 94.0% 93.4% 92.5% 91.9% 92.0% 88.7% 92.5%FY 2010 92.1% 91.6% 91.4% 91.7% 91.6% 92.8% 93.5% 87.4% 91.7% 91.1% 91.5%
Page 54 of 114

25
Vital Signs Report Performance Data (cont.) July 2010
KPI: Escalator System Availability / Target = 93%
July Aug Sept Oct Nov Dec Jan Feb Mar Apr May JunAvg.
thru MayFY 2009 92.4% 92.3% 91.0% 90.8% 91.1% 90.4% 91.9% 91.1% 89.4% 90.4% 90.0% 89.4% 91.0%FY 2010 89.6% 89.7% 90.6% 91.1% 91.6% 90.6% 90.0% 89.2% 89.5% 90.5% 89.6% 90.2%
KPI: Elevator System Availability / Target = 97.5%
July Aug Sept Oct Nov Dec Jan Feb Mar Apr May JunAvg.
thru MayFY 2009 97.6% 97.6% 96.9% 96.6% 96.7% 98.3% 98.1% 98.1% 96.9% 97.2% 97.9% 96.8% 97.5%FY 2010 96.1% 96.3% 96.3% 96.3% 96.0% 97.7% 99.0% 97.9% 97.5% 97.3% 96.4% 97.0%
KPI: Customer Injury Rate (per million passenger trips)*
July Aug Sept Oct Nov Dec Jan Feb Mar Apr May JuneAvg.
thru Apr.FY 2009 1.54 1.29 1.36 1.37 0.99 1.57 1.12 0.78 1.12 0.86 1.23 3.26 1.20FY 2010 0.78 1.28 0.89 0.83 0.85 1.08 0.89 2.11 1.23 1.10 1.10*revised to include escalator injuries.
Bus Passenger Injury Rate (per millon passenger trips)
July Aug Sept Oct Nov Dec Jan Feb Mar Apr May JuneAvg.
thru Apr.FY 2009 1.32 1.02 0.67 1.13 1.47 0.86 0.79 0.49 0.71 0.80 1.47 0.89 0.93FY 2010 0.95 1.17 1.24 0.80 1.37 0.78 0.42 1.43 1.49 1.08 1.07
Rail Passenger Injury Rate (per millon passenger trips)
July Aug Sept Oct Nov Dec Jan Feb Mar Apr May JuneAvg.
thru Apr.FY 2009 0.38 0.22 0.39 0.41 0.06 0.18 0.27 0.12 0.26 0.05 0.05 4.04 0.23FY 2010 0.10 0.22 0.17 0.16 0.18 0.00 0.06 0.15 0.10 0.19 0.13
Page 55 of 114

26
Vital Signs Report Performance Data (cont.) July 2010
Rail Transit Facilities Occupant Injury Rate (per millon passenger trips)*
July Aug Sept Oct Nov Dec Jan Feb Mar Apr May JuneAvg.
thru Apr.FY 2009 1.28 1.24 1.43 1.12 0.62 1.83 1.03 0.84 1.10 0.84 1.04 0.55 1.13FY 2010 0.58 1.12 0.50 0.68 0.37 1.25 1.09 2.31 0.99 0.91 0.98*revised to include escalator injuries.
KPI: Metro Access Passenger Injury Rate (per 100,000 passengers)**
July Aug Sept Oct Nov Dec Jan Feb Mar Apr May JuneAvg.
thru Apr.FY 2009 5.52 1.23 3.54 4.95 3.18 4.04 0.63 1.75 1.05 2.03 0.53 4.66 2.79FY 2010 3.03 2.57 2.01 6.24 2.10 4.39 3.14 3.68 2.16 2.70 3.20**revised for April.
KPI: Employee Injury Rate (Workers Compensation Claims with Cost > $20) / Target = 30% Reduction from 2007
July Aug Sept Oct Nov Dec Jan Feb Mar Apr May JuneAvg.
thru MayFY 2007 79 60 67 68 68 55 79 68 64 67 73 74 68FY 2009 61 72 59 60 40 61 48 52 80 44 57 67 58FY 2010 68 70 65 52 56 66 52 71 43 46 59 59
KPI: Crime Rate (per million passenger trips)May-09 Jun-09 July-09 Aug-09 Sept-09 Oct-09 Nov-09 Dec-09 Jan-10 Feb-10 Mar-10 Apr-10 Avg.
Metrobus 1.10 1.06 0.43 0.80 1.24 0.88 1.37 0.89 0.52 0.23 0.74 1.23 0.87 Metrorail 3.60 4.29 5.40 5.03 5.38 5.43 6.78 5.76 7.59 6.11 4.68 5.06 5.43 Metro Parking Lots 3.81 2.59 2.14 2.23 4.32 3.85 6.41 3.63 2.79 2.53 3.05 2.39 3.31
Page 56 of 114

27
Vital Signs Report Performance Data (cont.) July 2010
Crimes by TypeMay-09 Jun-09 July-09 Aug-09 Sept-09 Oct-09 Nov-09 Dec-09 Jan-10 Feb-10 Mar-10 Apr-10 Avg.
Robbery 73 68 73 70 81 96 104 89 122 81 86 91 86 Larceny 57 63 74 52 92 80 110 59 51 27 69 66 67 Motor Vehicle Theft 13 16 15 10 8 10 12 7 6 5 6 9 10 Attempted Motor Vehicle Theft 5 7 2 2 7 6 7 3 1 1 6 9 5 Aggravated Assault 8 6 8 11 9 7 8 7 10 7 7 9 8 Rape 0 0 0 0 0 0 0 0 2 2 0 0 0 Burglary 0 0 0 0 0 0 0 0 1 0 0 0 0 Homicide 0 0 0 0 0 0 1 0 0 0 0 0 0 Arson 0 0 0 0 0 0 0 0 0 0 0 0 0Total 156 160 172 145 197 199 242 165 193 123 174 184 176
KPI: Metro Transit Police Arrests, Citations and SummonsesMay-09 Jun-09 July-09 Aug-09 Sept-09 Oct-09 Nov-09 Dec-09 Jan-10 Feb-10 Mar-10 Apr-10 Avg.
Arrests 130 171 168 164 169 187 160 156 142 100 201 193 162 Citations/Summonses Issued 572 529 770 517 545 575 468 492 543 295 572 559 536 Arrests, Citations and Summonses 702 700 938 681 714 762 628 648 685 395 773 752 698
Metrobus Ridership (millions)
July Aug Sept Oct Nov Dec Jan Feb Mar Apr May JuneAvg.
thru MayFY 2009 12.1 11.7 11.9 12.3 10.2 10.5 10.2 10.2 11.3 11.2 10.9 11.3 11.1FY 2010 11.6 11.1 11.3 11.3 9.5 9.0 9.5 7.0 10.7 10.2 10.2 10.1
Metrorail Ridership (millions)
July Aug Sept Oct Nov Dec Jan Feb Mar Apr May JuneAvg.
thru MayFY 2009 21.0 18.5 18.2 19.7 16.1 16.4 18.5 16.6 19.1 20.3 18.4 20.1 18.4FY 2010 20.5 17.9 17.8 19.0 16.4 16.0 16.5 13.4 20.3 20.8 18.3 17.9
Page 57 of 114

28
Vital Signs Report Performance Data (cont.) July 2010
MetroAccess Ridership (100,000s)
July Aug Sept Oct Nov Dec Jan Feb Mar Apr May JuneAvg.
thru MayFY 2009 1.63 1.62 1.69 1.82 1.57 1.73 1.58 1.72 1.91 1.97 1.90 1.93 1.7FY 2010 1.98 1.95 1.99 2.08 1.90 1.82 1.91 1.36 2.32 2.22 2.0
Page 58 of 114