visualization models - school of computingmiriah/teaching/cs6630/lectures/l22-vis... · wicked...
TRANSCRIPT

cs6630 | November 20 2014
VISUALIZATION MODELSMiriah Meyer

administrivia . . .
2

3
- scalar data assignment due tonight
- transfer function assignment out

last time . . .
4

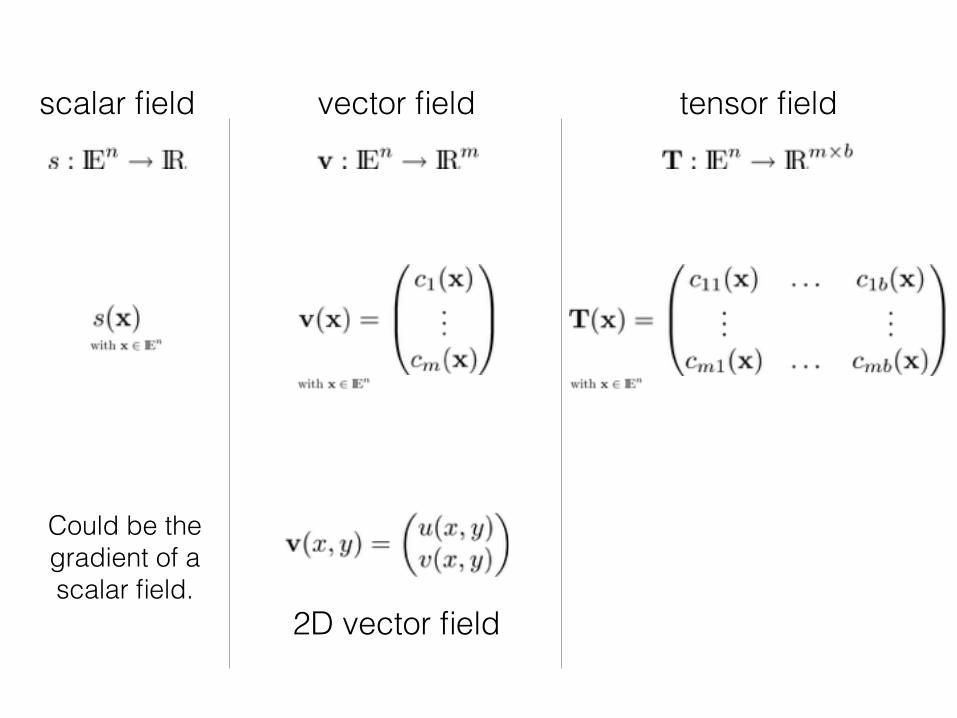
What is a vector field?
scalar field vector field tensor field
m will often be equal to n, but definitely not necessarily

Flow Data• Vector data on a 2D or 3D grid
• Additional scalar data may be defined per grid point
• Can either be on a regular grid (a) or scattered data points (b)

Smoke angel A C-17 Globemaster III from the 14th Airlift Squadron, Charleston Air Force Base, S.C. flies off after releasing flares over the Atlantic Ocean near Charleston, S.C., during a training mission on Tuesday, May 16, 2006. The "smoke angel" is caused by the vortex from the engines. (U.S. Air Force photo/Tech. Sgt. Russell E. Cooley IV)

http://de.wikipedia.org/wiki/Bild:Airplane_vortex_edit.jpg

http://autospeed.com/cms/A_108677/article.htmlhttp://autospeed.com/cms/A_108677/article.html
Wool Tufts
Flow Visualization: Problems and Concepts

scalar field vector field tensor field

scalar field vector field tensor field

scalar field vector field tensor field
2D vector field
scalar field vector field tensor field
2D vector field
Could be the gradient of a scalar field.

vector field

vector field
parameter-independent steady vector field

vector field
parameter-independent
one-parameter-dependent
steady vector field
unsteady vector field

vector field
parameter-independent
one-parameter-dependent
two-parameter-dependent
steady vector field
unsteady vector field

●Divergence of v:
● scalar field
● observe transport of a small ball around a point● expanding volume positive divergence● contracting volume negative divergence● constant volume zero divergence
div v ≡ 0 v is incompressible

20
●Curl of v:
● vector field
● also called rotation (rot) or vorticity
● indication of how the field swirls at a point

streamlines pathlines
streak lines timelines

today . . .
15

16
- software architecture models
- design decision models
- process models

17
BUT FIRST...
visualization is a design process
18

wicked problems
19 [Wicked Problems in Design Thinking, Buchanan 92]

wicked problems- alternative to linear, step-by-step approach to design
- approach: problem definition | problem solution- appealing as a “logical” understanding of design process
19 [Wicked Problems in Design Thinking, Buchanan 92]

wicked problems- alternative to linear, step-by-step approach to design
- approach: problem definition | problem solution- appealing as a “logical” understanding of design process
- Horst Rittel argued in the 1960s that most problems addressed by designers are “wicked”
- “class of social system problems which are ill formulated, where the information is confusing, where there are many clients and decision makers with conflicting values, and where the ramifications in the whole system are thoroughly confusing”
- determinacy versus indeterminacy- linear model: determinate problems have definite conditions
- designer should identify conditions and design solution- wicked model: indeterminate problems have no definitive conditions or limits
- designer must discover or invent a particular subject out of the problem
19 [Wicked Problems in Design Thinking, Buchanan 92]

20
10 properties of a wicked problem

21
SUGGESTED READING

22

22
- software architecture models- focus on the structure of a software system in terms of its programmatic components

22
- software architecture models- focus on the structure of a software system in terms of its programmatic components
- design decision models- describe and capture design decisions

22
- software architecture models- focus on the structure of a software system in terms of its programmatic components
- design decision models- describe and capture design decisions
- process models- describe stages with concrete actions a designer should engage in

23
software architecture models

24
reference model- software architecture pattern
- breaks up visualization (user) process into a series of discrete steps

24
reference model- software architecture pattern
- breaks up visualization (user) process into a series of discrete steps
originally developed by Ed Chi as part of PhD dissertation, called the data state model; showed equivalence to data flow model used in existing toolkits like VTKlater interpreted by Card, Mackinlay, and Shneiderman, dubbing it the information visualization reference model

25

26
- design patterns

26
- design patterns- means of capturing time-tested design solutions and facilitating their reuse

26
- design patterns- means of capturing time-tested design solutions and facilitating their reuse
- software design patterns

26
- design patterns- means of capturing time-tested design solutions and facilitating their reuse
- software design patterns- descriptions of communicating objects and classes that are customized to solve design problems within a particular context

26
- design patterns- means of capturing time-tested design solutions and facilitating their reuse
- software design patterns- descriptions of communicating objects and classes that are customized to solve design problems within a particular context
- specific patterns for visualization- related to: application structure, data handling, graphics, and interaction

27

28

29
design decision models

30
design decision models vs process models
domain problem characterization
data/task abstraction design
encoding/interaction technique design
algorithm design
design decision model: describes levels of design inherent to, and should be considered in, the creation of a tool
nested model

31
domain problem characterization
data/task abstraction design
encoding/interaction technique design
algorithm design
PRECONDITIONpersonal validation
COREinward-facing validation
ANALYSISoutward-facing validation
learn implementwinnow cast discover design deploy reflect write
process model: gives practical advice in how to design and develop a tool
nested model
9-stage framework
design decision models vs process models
design decision model: describes levels of design inherent to, and should be considered in, the creation of a tool

A Nested Model for Visualization Design and Validation
Tamara Munzner University of British Columbia Department of Computer Science

How do you show your system is good?
• so many possible ways! • algorithm complexity analysis • field study with target user population • implementation performance (speed, memory) • informal usability study • laboratory user study • qualitative discussion of result pictures • quantitative metrics • requirements justification from task analysis • user anecdotes (insights found) • user community size (adoption) • visual encoding justification from theoretical principles

34
Contribution
• nested model unifying design and validation
• guidance on when to use what validation method
• different threats to validity at each level of model
• recommendations based on model

35
Four kinds of threats to validity

36
Four kinds of threats to validity
domain problem characterization
• wrong problem • they don’t do that

37
Four kinds of threats to validity
domain problem characterization data/operation abstraction design
• wrong problem • they don’t do that
• wrong abstraction • you’re showing them the wrong thing

38
Four kinds of threats to validity
domain problem characterization data/operation abstraction design encoding/interaction technique design
• wrong problem • they don’t do that
• wrong abstraction • you’re showing them the wrong thing
• wrong encoding/interaction technique • the way you show it doesn’t work

39
Four kinds of threats to validity
domain problem characterization data/operation abstraction design encoding/interaction technique design algorithm design
• wrong problem • they don’t do that
• wrong abstraction • you’re showing them the wrong thing
• wrong encoding/interaction technique • the way you show it doesn’t work
• wrong algorithm • your code is too slow

40
threat: wrong problem threat: bad data/operation abstraction threat: ineffective encoding/interaction technique threat: slow algorithm
• each validation works for only one kind of threat to validity
Match validation method to contributions

41
Analysis examples
justify encoding/interaction design
qualitative result image analysis test on target users, get utility anecdotes
justify encoding/interaction design
measure system time/memory qualitative result image analysis
computational complexity analysis
qualitative/quantitative image analysis
lab study, measure time/errors for operation
Interactive visualization of genealogical graphs. McGuffin and Balakrishnan. InfoVis 2005.
MatrixExplorer. Henry and Fekete. InfoVis 2006.
An energy model for visual graph clustering. (LinLog)Noack. Graph Drawing 2003
Flow map layout. Phan et al. InfoVis 2005.
LiveRAC. McLachlan, Munzner, Koutsofios, and North. CHI 2008.
Effectiveness of animation in trend visualization.Robertson et al. InfoVis 2008.
measure system time/memory qualitative result image analysis
observe and interview target users
justify encoding/interaction design
qualitative result image analysis
observe and interview target users
justify encoding/interaction design
field study, document deployed usage

42
Nested levels in model
domain problem characterization data/operation abstraction design encoding/interaction technique design algorithm design
• output of upstream levelinput to downstream level
• challenge: upstream errors inevitably cascade • if poor abstraction choice made, even perfect technique
and algorithm design will not solve intended problem

43
Characterizing domain problems
• tasks, data, workflow of target users • problems: tasks described in domain terms • requirements elicitation is notoriously hard
problem data/op abstraction enc/interact technique algorithm

44
Designing data/operation abstraction
• mapping from domain vocabulary/concerns to abstraction • may require transformation!
• data types: data described in abstract terms • numeric tables, relational/network, spatial, ...
• operations: tasks described in abstract terms • generic
• sorting, filtering, correlating, finding trends/outliers... • datatype-specific
• path following through network...
problem data/op abstraction enc/interact technique algorithm

45
Designing encoding,interaction techniques
• visual encoding • marks, attributes, ... • extensive foundational work exists
• interaction • selecting, navigating, ordering, ... • significant guidance exists
Semiology of Graphics. Jacques Bertin, Gauthier-Villars 1967, EHESS 1998
problem data/op abstraction enc/interact technique algorithm

46
Designing algorithms
• well-studied computer science problem • create efficient algorithm given clear specification • no human-in-loop questions
problem data/op abstraction enc/interact technique algorithm

47
Immediate vs. downstream validation
threat: wrong problem threat: bad data/operation abstraction threat: ineffective encoding/interaction technique threat: slow algorithm implement system

48
Domain problem validation
threat: wrong problem validate: observe and interview target users threat: bad data/operation abstraction threat: ineffective encoding/interaction technique threat: slow algorithm implement system
• immediate: ethnographic interviews/observations

49
Domain problem validation
threat: wrong problem validate: observe and interview target users threat: bad data/operation abstraction threat: ineffective encoding/interaction technique threat: slow algorithm implement system validate: observe adoption rates
• downstream: adoption (weak but interesting signal)

50
Abstraction validation
threat: wrong problem validate: observe and interview target users threat: bad data/operation abstraction threat: ineffective encoding/interaction technique threat: slow algorithm implement system validate: test on target users, collect anecdotal evidence of utility validate: field study, document human usage of deployed system validate: observe adoption rates
• downstream: can only test with target users doing real work

51
Encoding/interaction technique validation
threat: wrong problem validate: observe and interview target users threat: bad data/operation abstraction threat: ineffective encoding/interaction technique validate: justify encoding/interaction design threat: slow algorithm implement system validate: test on target users, collect anecdotal evidence of utility validate: field study, document human usage of deployed system validate: observe adoption rates
• immediate: justification useful, but not sufficient - tradeoffs

52
Encoding/interaction technique validation
threat: wrong problem validate: observe and interview target users threat: bad data/operation abstraction threat: ineffective encoding/interaction technique validate: justify encoding/interaction design threat: slow algorithm implement system validate: qualitative/quantitative result image analysis validate: test on target users, collect anecdotal evidence of utility validate: field study, document human usage of deployed system validate: observe adoption rates
• downstream: discussion of result images very common

53
Encoding/interaction technique validation
threat: wrong problem validate: observe and interview target users threat: bad data/operation abstraction threat: ineffective encoding/interaction technique validate: justify encoding/interaction design threat: slow algorithm implement system validate: qualitative/quantitative result image analysis validate: lab study, measure human time/errors for operation validate: test on target users, collect anecdotal evidence of utility validate: field study, document human usage of deployed system validate: observe adoption rates
• downstream: studies add another level of rigor (and time)

54
Encoding/interaction technique validation
threat: wrong problem validate: observe and interview target users threat: bad data/operation abstraction threat: ineffective encoding/interaction technique validate: justify encoding/interaction design threat: slow algorithm implement system validate: qualitative/quantitative result image analysis [test on any users, informal usability study] validate: lab study, measure human time/errors for operation validate: test on target users, collect anecdotal evidence of utility validate: field study, document human usage of deployed system validate: observe adoption rates
• usability testing necessary for validity of downstream testing • not validation method itself!

55
Algorithm validation
threat: wrong problem validate: observe and interview target users threat: bad data/operation abstraction threat: ineffective encoding/interaction technique validate: justify encoding/interaction design threat: slow algorithm validate: analyze computational complexity implement system validate: measure system time/memory validate: qualitative/quantitative result image analysis [test on any users, informal usability study] validate: lab study, measure human time/errors for operation validate: test on target users, collect anecdotal evidence of utility validate: field study, document human usage of deployed system validate: observe adoption rates
• immediate vs. downstream here clearly understood in CS

56
threat: wrong problem validate: observe and interview target users threat: bad data/operation abstraction threat: ineffective encoding/interaction technique validate: justify encoding/interaction design threat: slow algorithm validate: analyze computational complexity implement system validate: measure system time/memory validate: qualitative/quantitative result image analysis [test on any users, informal usability study] validate: lab study, measure human time/errors for operation validate: test on target users, collect anecdotal evidence of utility validate: field study, document human usage of deployed system validate: observe adoption rates
Avoid mismatches• can’t validate encoding with wallclock timings

57
threat: wrong problem validate: observe and interview target users threat: bad data/operation abstraction threat: ineffective encoding/interaction technique validate: justify encoding/interaction design threat: slow algorithm validate: analyze computational complexity implement system validate: measure system time/memory validate: qualitative/quantitative result image analysis [test on any users, informal usability study] validate: lab study, measure human time/errors for operation validate: test on target users, collect anecdotal evidence of utility validate: field study, document human usage of deployed system validate: observe adoption rates
Avoid mismatches• can’t validate abstraction with lab study

58
threat: wrong problem validate: observe and interview target users threat: bad data/operation abstraction threat: ineffective encoding/interaction technique validate: justify encoding/interaction design threat: slow algorithm validate: analyze computational complexity implement system validate: measure system time/memory validate: qualitative/quantitative result image analysis [test on any users, informal usability study] validate: lab study, measure human time/errors for operation validate: test on target users, collect anecdotal evidence of utility validate: field study, document human usage of deployed system validate: observe adoption rates
Single paper would include only subset• can’t do all for same project
• not enough space in paper or time to do work

59
threat: wrong problem validate: observe and interview target users threat: bad data/operation abstraction threat: ineffective encoding/interaction technique validate: justify encoding/interaction design threat: slow algorithm validate: analyze computational complexity implement system validate: measure system time/memory validate: qualitative/quantitative result image analysis [test on any users, informal usability study] validate: lab study, measure human time/errors for operation validate: test on target users, collect anecdotal evidence of utility validate: field study, document human usage of deployed system validate: observe adoption rates
Single paper would include only subset• pick validation method according to contribution claims

60
Recommendations: authors
• explicitly state level of contribution claim(s)
• explicitly state assumptions for levels upstream of paper focus • just one sentence + citation may suffice
• goal: literature with clearer interlock between papers • better unify problem-driven and technique-driven work

61
Recommendation: publication venues
• we need more problem characterization • ethnography, requirements analysis
• as part of paper, and as full paper • now full papers relegated to CHI/CSCW
• does not allow focus on central vis concerns
• legitimize ethnographic “orange-box” papers! observe and interview target users

62
Limitations
• oversimplification
• not all forms of user studies addressed
• infovis-oriented worldview
• are these levels the right division?

63
Mike Gleicher BELIV’12

64

65

66

67

68

69

70

71

72

73

The Four-Level Nested Model Revisited: Blocks and Guidelines
74
Miriah Meyer, Michael Selmair, Tamara MunznerBELIV’12
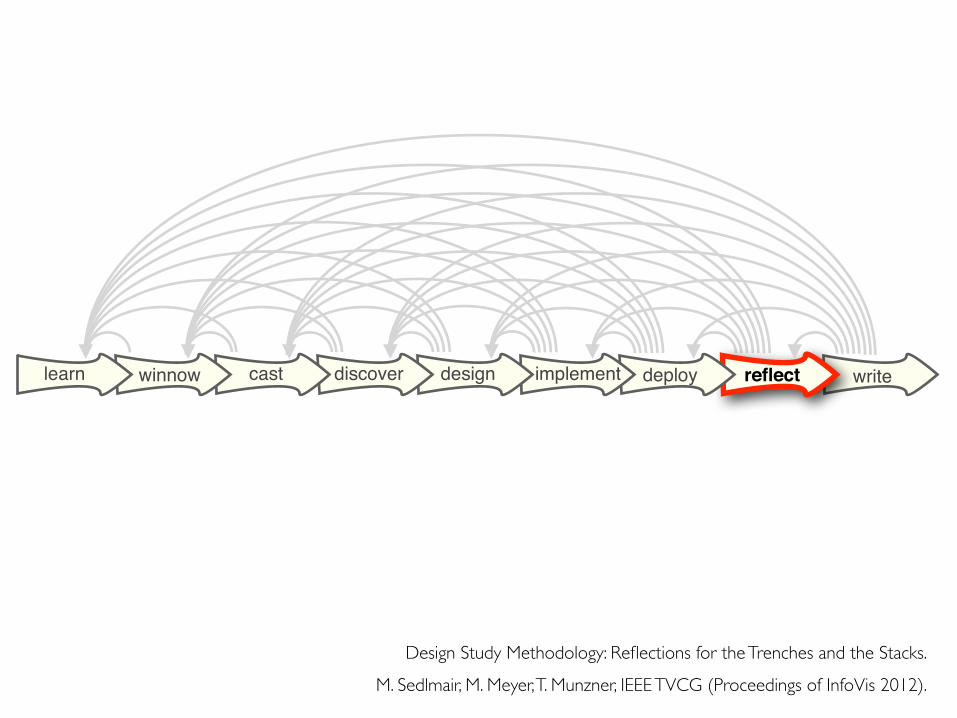
learn implementwinnow cast discover design deploy reflect write
Design Study Methodology: Reflections for the Trenches and the Stacks.
M. Sedlmair, M. Meyer, T. Munzner, IEEE TVCG (Proceedings of InfoVis 2012).

learn implementwinnow cast discover design deploy reflect write
Design Study Methodology: Reflections for the Trenches and the Stacks.
M. Sedlmair, M. Meyer, T. Munzner, IEEE TVCG (Proceedings of InfoVis 2012).
confirm | refine | reject | proposeguidelines

domain problem characterization data/task abstraction design
encoding/interaction technique designalgorithm design
Munzner 2009
NESTED MODEL

dom
ain p
roble
m
abstr
actio
nte
chniq
uealg
orith
m
NESTED BLOCKS AND GUIDELINES
domain problem characterization data/task abstraction design
encoding/interaction technique designalgorithm design
Munzner 2009
NESTED MODEL
[Meyer 2013]

dom
ain p
roble
m
abstr
actio
nte
chniq
uealg
orith
m
NESTED BLOCKS AND GUIDELINES
blocks
domain problem characterization data/task abstraction design
encoding/interaction technique designalgorithm design
Munzner 2009
NESTED MODEL
outcome of a design decision
[Meyer 2013]

dom
ain p
roble
m
abstr
actio
nte
chniq
uealg
orith
m
blocks
domain problem characterization data/task abstraction design
encoding/interaction technique designalgorithm design
Munzner 2009
NESTED MODEL
directed graph
outcome of a design decision
node-link diagram
force-directed layout
NESTED BLOCKS AND GUIDELINES[Meyer 2013]

dom
ain p
roble
m
abstr
actio
nte
chniq
uealg
orith
m
blocks
domain problem characterization data/task abstraction design
encoding/interaction technique designalgorithm design
Munzner 2009
NESTED MODEL
outcome of a design decision
NESTED BLOCKS AND GUIDELINES[Meyer 2013]

dom
ain p
roble
m
abstr
actio
nte
chniq
uealg
orith
m
domain problem characterization data/task abstraction design
encoding/interaction technique designalgorithm design
Munzner 2009
NESTED MODEL
blocksguidelines
statement about relationship between blocks
NESTED BLOCKS AND GUIDELINES[Meyer 2013]

dom
ain p
roble
m
abstr
actio
nte
chniq
uealg
orith
m
domain problem characterization data/task abstraction design
encoding/interaction technique designalgorithm design
Munzner 2009
NESTED MODEL
blocksguidelines
good for categorical data
hue colormap appropriate
categorical data
hue colormap
NESTED BLOCKS AND GUIDELINES[Meyer 2013]

dom
ain p
roble
m
abstr
actio
nte
chniq
uealg
orith
m
domain problem characterization data/task abstraction design
encoding/interaction technique designalgorithm design
Munzner 2009
NESTED MODEL
blocksguidelines
Nocaj 2012 Balzer 2005
faster Voronoi treemap
NESTED BLOCKS AND GUIDELINES[Meyer 2013]

dom
ain p
roble
m
abstr
actio
nte
chniq
uealg
orith
m
domain problem characterization data/task abstraction design
encoding/interaction technique designalgorithm design
Munzner 2009
NESTED MODEL
blocksguidelinesbetween-level guideline
within-level guideline
NESTED BLOCKS AND GUIDELINES[Meyer 2013]


- LOD approach for rendering large graphs- cluster nodes using GPU-based approach- aggregate edges- rendering issues- semantic zooming


dom
ain p
roble
m
abstr
actio
nte
chniq
uealg
orith
m
blocksguidelines
implications-comparing domains via abstractions-generalizing techniques via abstractions-evaluating stacks of blocks
between-level guideline
within-level guideline
NESTED BLOCKS AND GUIDELINES[Meyer 2013]

90
process models

91
domain problem characterization
data/task abstraction design
encoding/interaction technique design
algorithm design
PRECONDITIONpersonal validation
COREinward-facing validation
ANALYSISoutward-facing validation
learn implementwinnow cast discover design deploy reflect write
process model: gives practical advice in how to design and develop a tool
nested model
9-stage framework
design decision models vs process models
design decision model: describes levels of design inherent to, and should be considered in, the creation of a tool

PRECONDITION CORE ANALYSIS
discover reflectcastlearn deploydesign writeimplementwinnow
the nine-stage framework

CORE ANALYSIS
discover reflectcastlearn deploydesign writeimplementwinnow
PRECONDITION
what must be done before starting a project
the nine-stage framework

PRECONDITION ANALYSIS
discover reflectcastlearn deploydesign writeimplementwinnow
CORE
main steps of a design study
the nine-stage framework

PRECONDITION CORE
discover reflectcastlearn deploydesign writeimplementwinnow
ANALYSIS
analytical reasoning at the end
the nine-stage framework

PRECONDITION CORE ANALYSIS
discover reflectcastlearn deploydesign writeimplementwinnow
the nine-stage framework

PRECONDITION CORE ANALYSIS
discover reflectcastlearn deploydesign writeimplementwinnow
the nine-stage framework

L23: Vector and Tensor Fields
REQUIRED READING
98

ii
ii
ii
ii
Arrange Spatial Data
Chapter 8
8.1 The Big Picture
For datasets with spatial semantics, the usual choice for arrangeis to use the given spatial information to guide the layout. In thiscase, the choices of express, separate, order, and align do not applybecause the position channel is not available for directly encodingattributes. The two main spatial data types are geometry, whereshape information is directly conveyed by spatial elements thatdo not necessarily have associated attributes, and spatial fields,where attributes are associated with each cell in the field. (See Fig-ure 8.1.) For scalar fields with one attribute at each field cell, thetwo main visual encoding idiom families are isocontours and directvolume rendering. For both vector and tensor fields, with multipleattributes at each cell, there are four families of encoding idioms:flow glyphs that show local information, geometric approaches thatcompute derived geometry from a sparse set of seed points, textureapproaches that use a dense set of seeds, and feature approacheswhere data is derived with global computations using informationfrom the entire spatial field.
8.2 Why Use Given?
The common case with spatial data is that the given spatial po-sition is the attribute of primary importance because the centraltasks revolve around understanding spatial relationships. In thesecases, the right visual encoding choice is to use the provided spa-tial position as the substrate for the visual layout, rather than tovisually encode other attributes with marks using the spatial posi-tion channel. This choice may seem obvious from common sensealone. It also follows from the effectiveness principle, since the
181

Comparing 2D Vector Field VisualizationMethods: A User Study
David H. Laidlaw, Robert M. Kirby, Cullen D. Jackson, J. Scott Davidson, Timothy S. Miller,Marco da Silva, William H. Warren, and Michael J. Tarr
Abstract—We present results from a user study that compared six visualization methods for two-dimensional vector data. Usersperformed three simple but representative tasks using visualizations from each method: 1) locating all critical points in an image,
2) identifying critical point types, and 3) advecting a particle. Visualization methods included two that used different spatial distributionsof short arrow icons, two that used different distributions of integral curves, one that used wedges located to suggest flow lines, and
line-integral convolution (LIC). Results show different strengths and weaknesses for each method. We found that users performedthese tasks better with methods that: 1) showed the sign of vectors within the vector field, 2) visually represented integral curves, and
3) visually represented the locations of critical points. Expert user performance was not statistically different from nonexpert userperformance. We used several methods to analyze the data including omnibus analysis of variance, pairwise t-tests, and graphical
analysis using inferential confidence intervals. We concluded that using the inferential confidence intervals for displaying the overallpattern of results for each task measure and for performing subsequent pairwise comparisons of the condition means was the best
method for analyzing the data in this study. These results provide quantitative support for some of the anecdotal evidence concerningvisualization methods. The tasks and testing framework also provide a basis for comparing other visualization methods, for creating
more effective methods and for defining additional tasks to further understand the tradeoffs among the methods. In the future, we alsoenvision extending this work to more ambitious comparisons, such as evaluating two-dimensional vectors on two-dimensional surfaces
embedded in three-dimensional space and defining analogous tasks for three-dimensional visualization methods.
Index Terms—User study, vector visualization, fluid flow visualization.
!
1 INTRODUCTION
ONE of the goals of scientific visualization is to display
measurements of physical quantities so the underlying
physical phenomena can be interpreted accurately, quickly,
and without bias. Great care is taken in choosing where
such measurements will be made so that inferences about
the underlying phenomena will be correct. How important
is it to craft visualizations analogously, carefully placing
arrows, curves, or other visual icons that display the data?
What are the best ways to craft visualizations?Many people have addressed, with qualitative or
anecdotal advice, how best to design visualizations [1],
[2], [3]. For example, Ware suggests that vectors placed on a
regular grid are less effective than vectors placed in a
streamline-like (or integral curve) fashion. Analogous
quantitative studies of visualization methods are still very
limited [4], [5], [6], [7], and none address 2D vector
visualization methods. Albeit limited, such quantitative
studies help to form a basis upon which rule-of-thumbconstruction measures for vector visualizations can bepostulated.
An earlier version of the study presented here included
only nonexpert users, did not comparatively include LIC in
the analysis, did not include an analysis of user perfor-
mance as a function of flow speed at the user-chosen critical
point locations, included arbitrarily difficult tasks involving
critical points close to the boundary of the visualization and
reported a pessimistic analysis of counting accuracy [8]; we
address those limitations in this paper with new analyses
that go beyond the initial analyses accomplished for that
version.Our quantitative study of these questions began with a
(naive) hypothesis of the form “When visualizing two-dimensional vector fields, arrows spatially distributedusing method X are more effective than arrows spatiallydistributed using method Y.” We proposed to test thehypothesis with a user study. The first hurdle whichstymied our progress was an understanding of formulat-ing and executing a task-based user study. How does onedefine “more effective?” Can “more effective” be estab-lished in a broad-brush fashion, or is it possible toconstruct tasks in which for task A method X is moreeffective than method Y (in some metric), while for task Bmethod Y is more effective than method X? After muchdeliberation, we decided to define “more effective” viathe performance of users on a set of three tasks derivedfrom examination of common comparison metrics used in
IEEE TRANSACTIONS ON VISUALIZATION AND COMPUTER GRAPHICS, VOL. 11, NO. 1, JANUARY/FEBRUARY 2005 59
. D.H. Laidlaw, C.D. Jackson, J.S. Davidson, T.S. Miller, and M. da Silvaare with the Computer Science Department, Brown University, Provi-dence, RI 02912. E-mail: {dhl, cj, jsdavids, tsm, mds}@cs.brown.edu.
. R.M. Kirby is with the Scientific Computing and Imaging Institute andSchool of Computing, University of Utah, Salt Lake City, UT 84112.E-mail: [email protected].
. W.H. Warren and M.J. Tarr are with the Cognitive and Linguistic SciencesDepartment, Brown University, Providence, RI 02912.E-mail: {Michael_Tarr, William_Warren}@brown.edu.
Manuscript received 3 Sept., 2003; revised 18 Feb. 2004; accepted 19 Feb. 2004.For information on obtaining reprints of this article, please send e-mail to:[email protected], and reference IEEECS Log Number TVCG-0088-0903.
1077-2626/05/$20.00 ! 2005 IEEE Published by the IEEE Computer Society

101