visual search strategy, selective attention, and expertise in soccer
TRANSCRIPT

This article was downloaded by: [North Carolina State University]On: 19 August 2013, At: 21:17Publisher: RoutledgeInforma Ltd Registered in England and Wales Registered Number: 1072954 Registered office: Mortimer House,37-41 Mortimer Street, London W1T 3JH, UK
Research Quarterly for Exercise and SportPublication details, including instructions for authors and subscription information:http://www.tandfonline.com/loi/urqe20
Visual Search Strategy, Selective Attention, andExpertise in SoccerA. M. Williams a & K. Davids ba School of Human Sciences, Liverpool John Moores University, USAb Department of Exercise and Sports Science, Manchester Metropolitan University, USAPublished online: 08 Feb 2013.
To cite this article: A. M. Williams & K. Davids (1998) Visual Search Strategy, Selective Attention, and Expertise in Soccer,Research Quarterly for Exercise and Sport, 69:2, 111-128, DOI: 10.1080/02701367.1998.10607677
To link to this article: http://dx.doi.org/10.1080/02701367.1998.10607677
PLEASE SCROLL DOWN FOR ARTICLE
Taylor & Francis makes every effort to ensure the accuracy of all the information (the “Content”) containedin the publications on our platform. However, Taylor & Francis, our agents, and our licensors make norepresentations or warranties whatsoever as to the accuracy, completeness, or suitability for any purpose of theContent. Any opinions and views expressed in this publication are the opinions and views of the authors, andare not the views of or endorsed by Taylor & Francis. The accuracy of the Content should not be relied upon andshould be independently verified with primary sources of information. Taylor and Francis shall not be liable forany losses, actions, claims, proceedings, demands, costs, expenses, damages, and other liabilities whatsoeveror howsoever caused arising directly or indirectly in connection with, in relation to or arising out of the use ofthe Content.
This article may be used for research, teaching, and private study purposes. Any substantial or systematicreproduction, redistribution, reselling, loan, sub-licensing, systematic supply, or distribution in anyform to anyone is expressly forbidden. Terms & Conditions of access and use can be found at http://www.tandfonline.com/page/terms-and-conditions

Research Quarterly for Exercise and Sport©1998 by the American Alliance for Health,Physical Education, Recreation and DanceVol. 69, No.2, pp. 111-128
Visual Search Strategy, Selective Attention, and Expertisein Soccer
A. M. Williams andK. Davids
This research examined the relationship between visual search strategy, selective attention, and expertise in soccer. Experienced (n= 12) and less experienced (n = 12) soccerplayers moved in response tofilmed offensive sequences. Experiment 1 examineddifferences in search strategy between the two groups, using an eye movement registration system. Experienced players demonstratedsuperior anticipation in 3-on-3 and l-on-I soccersimulations. There were no differences in search strategy in 3-on-3 situations.In l-on-I simulations, the experienced players had a higher search rate, involving morefixations of shorter duration, and fixatedfor longer on the hip region, indicating that this area was important in anticipating an opponent's movements. Experiment 2examined the relationship between visual fixation and selective attention, using a spatial occlusion approach. In 3-on-3 situations, masking information ''Pick up" from areas other than the ball or ball passer had a more detrimental effect on the experienced players' performances, suggesting differences in selective attention. In l-on-L situations, occluding an oncoming dribbler'shead and shoulders, hips, or lower leg and ball region did not affect the experienced players' performances more than the lessexperienced group. The disparities in search strategy observed in Experiment 1 did not directly relate to differences in informationextraction. Experiment 3 used concurrent verbal reports to indicate where participants extracted information from while viewing3-on-3 sequences. Experienced players spent less time attending to the ball or ball passer and more time on other areas of thedisplay. Findings highlight the advantages of integrating eye movements with more direct measures of selective attention.
Key words: perceptual skill, team games
Con temporary research examining skill-based differences in visual search strategy in sport has high
lighted important discriminating characteristics betweenexperts and novices (for a review, see Williams, Davids,Burwitz, & Williams, 1993). For example, expert performers show systematic differences in the location ofocular fixations across the available features of the display, suggesting enhanced selective attention processes(e.g., Ripoll, Kerlirzin, Stein, & Reine, 1995; Vickers,1992; Williams, Davids, Burwitz, & Williams, 1994). Moreover, although findings are equivocal, differences havebeen observed in search rate, with experts typically us-
Submitted: January 6, 1997Accepted: September 22, 1997
A. M. Williams is with the School of Human Sciences at LiverpoolJohnMoores University. K. Davids is with the Department ofExercise andSports Science at Manchester MetropolitanUniversity.
ROES: June 1998
ing a more efficient search pattern involving fewer fixations of longer duration (e.g., Goulet, Bard, & Fleury,1989; Helsen & Pauwels, 1993; Ripoll et al., 1995). Thesedifferences are assumed to be indicative of the expert'smore refined perceptual strategy. Experts have a moreextensive task specific knowledge base, which can beused to interpret events encountered in circumstancessimilar to those previously experienced (see Anderson,1983; Starkes & Allard, 1993). These knowledge structures direct the performer's search strategy towardsmore pertinent areas of the display based on situationalprobabilities (i.e., expectations) and the more effectiveprocessing of contextual information (see Williams,Davids, & Williams, in press).
Although these studies have been successful in identifying important discriminating characteristics, thereare a number of criticisms. Almost without exception itis assumed that visual orientation, as implied from eyefixation characteristics, is directly related to visual attention and information extraction (see Abernethy, 1988;Williams et aI., 1993). However, it is possible that targetobjects in the environment may be fixated without infor-
111
Dow
nloa
ded
by [
Nor
th C
arol
ina
Stat
e U
nive
rsity
] at
21:
17 1
9 A
ugus
t 201
3

Williams andDavids
mation extraction (e.g., Papin, Metges, &Amalberti, 1984;Stager & Angus, 1978; Kundel, Nodine, & Toto, 1984).Thishas been referred to as the difference between "looking,"which implies fixation on the fovea, and "seeing," whichintimates the active pick up and processing of information (Van der Heijden, 1986; Neumann, Van derHeijden, & Allport, 1986). Furthermore, it appears thatattention can be relocated in the visual field without distinctive eye movements to change the point of fixation(see Remington, 1980; Sanders & Houtmans, 1985;Shulman, Remington, & McLean, 1979). Subjects maylook at, or foveate, an object but extract information fromthe periphery. Also, these shifts in attention can occurwithout the loss ofinput information normally associatedwith saccadic eye movements, possibly resulting in participants giving priority to information extraction via theparafovea and periphery in dynamic environments(Abernethy, 1985, 1988). This argument is supported byan increasing body of evidence which suggests that information processed through peripheral vision plays animportant role in perceptuomotor performance (e.g.,Davids, 1984; Paillard, 1982; Williams, Davids, Burwitz,& Williams, 1992).
These criticisms imply that more direct measures ormanipulations of information pick up, such as concurrent verbal reports or spatial occlusion, should be usedin conjunction with eye fixation data when assessing differences in search strategy. Because eye movement registration techniques only provide information regardingfoveal orientation, concurrent verbal report and eventocclusion procedures can clarify the relationship betweenvisual fixation and information extraction and help todevelop our understanding of the role of nonfovealstimulation in the visual search process (for a more detailed review, see Williams et aI., 1993). Despite theseadvantages, fewstudies have attempted to use these methods to address some limitations with eye movement registration techniques (for exceptions, see Abernethy &Russell, 1987a, 1987b; Abernethy, 1990).
Further criticisms include the use of unrealisticstimuli involving static slide presentations and smallscreen displays. Previous studies have tended to use penand paper or verbal response measures rather than attempting to develop more realistic testing conditionswhich require subjects to move in response to action sequences (see Williams et aI., 1992). These simplistic orartificial laboratory tasks may negate the experts' advantage, cause them to function differently by denying themaccess to information they would normally use, or causethem to use different information to solve a particularproblem (Abernethy, Thomas, & Thomas, 1993). Consequently, there is a need to develop meaningful andrealistic protocols which closely replicate the performer'shabitual environment.
Moreover, few studies have examined visual searchstrategy within dynamic "open play" simulations in sport,
112
in which participants are presented with emerging offensive or defensive patterns of play. Due to the difficulties involved in producing realistic film displays whichsimulate the performer's normal view of the action, mostresearch has concentrated on relatively "closed" skillssuch as the tennis serve, the penalty kick in soccer, orputting in golf (e.g., Goulet et aI., 1989; Tyldesley,Bootsma, & Bomhoff, 1982; Vickers, 1992). An exception is a recent study by Williams et aI. (1994) whichexamined differences in visual search strategy using l Ion-Ll soccer action sequences filmed from a defender'sperspective. The results indicated that experienced defenders were less inclined to "ball watch" and showedgreater awareness of the positions and movements ofplayers"off the ball." Further differences were noted insearch rate, with experienced players exhibiting morefixations of shorter duration.
The higher search rates demonstrated by the experienced soccer players contradicted previous research insport (e.g., Goulet et aI., 1989; Helsen & Pauwels, 1993;Ripoll et aI., 1995). Helsen and Pauwels (1993) showedthat expert soccer players used fewer fixations oflongerduration when presented with simulated offensive sequences involving a restricted number of players (i.e.,"set play" situations). Theoretically, because the saccadiceye movements which separate visual fixations are inactive periods of information processing, a more selectiveand efficient strategy should be characterized by fewerfixations oflonger duration (Williams et aI., 1993). Experts would be expected to have lower search rates dueto a reduced information processing load or becausethey require less sensory input to create a coherent perceptual representation of the display (Abernethy, 1990).This expectation has not always been corroborated byresearch findings from the sport and exercise sciences.The inconsistency is due, in part, to the difficulty in comparing directly between research studies because ofdifferences in the operational definition of a fixation andin the sensitivity of the eye movement system employed(Abernethy & Russell, 1987b). Further problems arisebecause of the nature and difficulty of the task, the typeofvisual display presented to observers, and the experimental description and instructions given prior to testing (for a more detailed review, see Abernethy, 1988).
However, this contradiction may also arise becauseparticipants implement different search rates in different situations. For example, games players may be characterized by higher search rates when attempting torecognize patterns of developing play, such as a team'sattacking or defensive structure, whereas lower searchrates may be employed in more specific contexts involving a restricted number of players. Thus far, few studieshave examined how search strategy alters as a functionof task constraints. This is because existing research hastended to employ a "shot gun" approach, preferring toexamine performance on a single task rather than adopt-
ROES: June 1998
Dow
nloa
ded
by [
Nor
th C
arol
ina
Stat
e U
nive
rsity
] at
21:
17 1
9 A
ugus
t 201
3

ing a more pragmatic strategy in which the task constraints have been manipulated as an independent variable (Abernethy et aI., 1993). When defenders areattempting to determine the opposition's general offensive structure, such as in the 1l-on-I 1 film sequences,higher search rates would be required to be aware of themovements and positions ofa large number of players.In these dynamic circumstances, the area ofplay may betoo large for defenders to rely on peripheral vision topick up information from teammates and opponents; instead players are constrained to move the eyes to foveate important areas of the display. In contrast, insituations involving a restricted number ofpotential information sources (e.g., defensive 3-on-3 situations onthe edge of the penalty area in soccer), lower searchrates may be required, enabling players to use nonfovealretinal stimulation (i.e., parafovea and periphery) toextract task specific information. Similar arguments havebeen proposed by Ripoll (1991) who suggested the difference between experts and novices is that the formerdirect their gaze to a position in which many events canbe viewed integratively during one single eye fixation(i.e., synthetic analysis), while novices gaze at eventsaccording to their chronological order of appearance(i.e., analytic analysis). It is therefore reasonable to hypothesize that the experts' synthetic search process is aproduct of their greater reliance on peripheral vision toextract task-specific information. In team sports such assoccer, experts may focus central vision on the ball orthe player in possession of the ball while using peripheral vision to scan the display for relevant information.Although this argument has been proposed by numerousauthors (e.g., Abernethy, 1991; Ripoll, 1991), it hasnot, as yet, been verified empirically. Evidence is required to clarify this issue, because it has important implications for theoretical development and trainingvisual search strategy in sport.
This research had several objectives. First, we examined differences in anticipation and visual search strategy during defensive 3-on-3 and l-on-I situations insoccer. These are typical training situations which mayform the context for players to learn to use eye movements to pick up task-related information. It was hypothesized that, because of their enhanced soccer specificknowledge base, experienced soccer defenders woulddemonstrate superior anticipation and more pertinentvisual search strategies. Second, we examined the relationship between visual fixation and selective attentionin these 3-on-3 and l-on-I situations, using spatial occlusion and concurrent verbal report techniques. We presumed that visual fixation would not be directly relatedto selective attention in these situations because of theinvolvement of the parafovea and periphery in the visual search process. Third, we attempted to examinewhether similar or different scan patterns would be observed in small-sided situations (i.e., 3-on-3, I-on-I) com-
ROES: June 1998
Williams andDavids
pared with previous research undertaken using l l-on11 simulations. Weconsidered that the nature of the taskwould be an important constraint on the type of searchpattern used by team games players. Specifically, we hypothesized that participants would use a less extensivesearch pattern, characterized by lower search rates, insmall-sided situations because of an increased role forperipheral vision in picking up task specific information.A related question was whether these relationships altered as a function of task experience. Finally, the research improved on previous methodology by using arealistic "life size" film display and movement-based response measures to assess differences in anticipation andvisual search strategy in sport. We felt that this more lifelike task would maintain situation specificity and expedite any conceivable differences between theexperienced and less experienced players.
Experiment lA: Anticipation and Visual SearchStrategy in 3-on-3 Situations
Method
Participants
Participants were 12 experienced (M = 24.0 years,SD = 4.1) and 12 less experienced male soccer players(M = 23.3 years, SD = 4.0). The experienced players hadbeen playing soccer for 13.4 years, including an averageof754 (SD = 179.5) competitive matches. They included5 professional soccer players and 7 semiprofessional players. The less experienced group had been playing soccer for an average of4.1 years (SD = 2.5) with an averageof65 matches (SD = 52.7). They were all recreationalplayers. Participants gave their informed consent priorto taking part in these experiments. This research wasconducted according to the guidelines established by theAmerican Psychological Association (1982).
Test Film
Participants were presented with 20 offensive soccersequences. These involved 3-on-3 situations in whichthe participants were required to imagine themselves asa covering defender or "sweeper" playing in a centralposition between the penalty area and center circle.Each sequence included two central defenders markingtwo offensive players and a defensive midfield playermarking an offensive midfield player. The film clipslasted approximately 6 s and included an offensive pattern ofplay ending with one of the following outcomes:(1) a pass being made to the participant's right or leftside; (2) the ball apparently being played over the
113
Dow
nloa
ded
by [
Nor
th C
arol
ina
Stat
e U
nive
rsity
] at
21:
17 1
9 A
ugus
t 201
3

Williams and Davids
participant's head into the space behind; or (3) an offensive player dribbling the ball directly toward the participant. An intertrial interval of 6 s was built into thefilm construction.
The offensive patterns were selected from actualsoccer matches and then realistically simulated by skilledoffensive and defensive players. The simulation wasfilmed at eye level (1.7 m) and from a position behindthe players (6 m) using a video camera (Panasonic F-15),an 8-mm focal length lens, and a SVHS video recorder(Panasonic AG7450; Panasonic, Osaka, Japan). This position provided a visual display most representative ofasweeper or covering defender's view ofthe action. Twelvedifferent soccer players participated in the filming session, thus providing a different combination of offensive and defensive players every trial. Three experiencedsoccer coaches viewed the offensive sequences independently to ensure that each film clip was realistic and representative ofactual game play. Only those film clips onwhich the coaches were in complete agreement wereused in the test film.
Apparatus
An Applied Science Laboratories 4000SU eye movement registration system (Applied Science Laboratories,Bedford, MA)was used to collect visual search data. Thisis a video-based monocular system which measures eyeline ofgaze with respect to a helmet-mounted scene camera. The system works by detecting two features, the pupil and the corneal reflex (reflection of a light sourcefrom the surface of the cornea), in a video image of theeye. The relative position of these features is used to compute visual gaze with respect to the optics. Displacementdata from the left pupil and cornea were recorded by asmall camera, processed by computer, and superimposedas a cursor on the scene camera image to highlight thepoint of gaze. This image was then recorded for furtheranalysis using a video camera. The data were then subjected to a frame-by-frame analysis using a UK standardvideo recorder (Panasonic AG7330; Panasonic, Osaka,Japan) at 50Hz. The accuracy of the system (i.e., the difference between true eye position and measured eyeposition) was ± 1°visual angle. System precision (i.e., theamount of instrument noise in the eye position measurewhen the eye is perfectly stationary) was better than Y2°in both horizontal and vertical directions (for a moredetailed review of the apparatus, see Applied ScienceLaboratories Eye Tracking Systems Handbook'),
Procedure
Prior to presentation of the test film, participants'choice reaction time (CRT) was measured. They werepresented with the same view of the soccer field in thetest film but with no players included in the display. Fol-
114
lowing a random foreperiod, participants responded asquickly and accurately as possible, when a stimulus waspresented. The stimulus was a red circle presented inthe right, left, top, or bottom of the screen. The participants stood on a central pressure pad and respondedby stepping on to the response pad corresponding to theposition of the red circle (i.e., right, left, front, or backresponse pad). These response pads were positioned atright angles, 1 m away from the central pressure pad onwhich the participants were standing. Participants werepresented with 3 practice trials and 18 test trials. CRTwas measured as the time from the stimulus presentation to the completion of the participant's response,recorded using a series of timing circuits and a computer", This task served to familiarize participants withthe response in the anticipation test and provided thebaseline measure ofCRT used as a covariate in the subsequent performance analysis.
The test procedure was then explained and the helmet-mounted optics fitted on the participant's head. Theeye movement recorder was calibrated using a nine-pointreference grid so that the recorded indication of fixation position corresponded to the participant's visualgaze. Previous research (e.g., Williams et al., 1994)showed that the system required only occasionalrecalibration and was checked only after the practice trials and following presentation of the first 10 test trials.Also, participants were asked to fixate on a marker positioned in the center of the projected film image immediately after completing their response, enabling a rapidcalibration check prior to each trial. All participants reported that the helmet was comfortable and did not interfere with performance.
Following initial calibration of the equipment, participants received six practice trials to ensure their familiarity with the testing procedure. In particular, it wasstressed that they should anticipate pass destination asquickly and accurately as possible. No further instructions were given, as search strategy can be modified byexperimental instructions (Yarbus, 1967). The test filmwas projected onto a 3.5-m x 3-m screen using a videoprojection system (GEC Imager LCD 15E; GEC, NewYork, NY). Participants stood 5 m away from the screenso that the film image sub tended a visual angle of approximately 40° in the horizontal and 35° in the vertical direction. This provided a realistic environment,with players' images being presented "life size" onscreen. Participants viewed each pattern of playas itdeveloped and responded as quickly and accurately aspossible by moving right, left, forward, or backward tosimulate the interception of the pass. They were required to step on the same response pads as in the CRTexperiment. Immediately following initiation of their response, the film was occluded to prevent participantsgaining feedback on task performance (maximum occlusion time = 10 ms).
ROES: June 1998
Dow
nloa
ded
by [
Nor
th C
arol
ina
Stat
e U
nive
rsity
] at
21:
17 1
9 A
ugus
t 201
3

Analysis
Four response measures were obtained from theanticipation test:
Initiation Time (IT). This was the time from the startof the film clip to the initiation of the participant's response (in ms). The initiation of response was recordedwhen the participant lifted his foot off the central pressure pad.
Movement Time (MT). This was the time from the initiation of the participant's movement to responsecompletion (in ms). It was the time from the participantlifting his foot off the central pressure pad and steppingon to one of the four response pads positioned on thefloor.
Response Time (RT). This was the time from the startof the film clip to the completion of the participant'sresponse (in ms).
ResponseAccuracy (RA).This was obtained by comparing the participant's response to the actual pass destination (in %).
Because of between-group differences in CR"P andthe relationship between speed (IT, MT, RT) and accuracy (RA) measures," a one-way multivariate analysis ofcovariance (MANCaVA) was used to analyze performance scores. In this analysis, Group (experienced-lessexperienced) was the between-subjects variable, CRT thecovariate, and IT, MT, RT, and RA the four dependentvariables.
Analysis of Visual Search Data
Fixation Order. This was the search sequence ,or pattern, used by the participants. Previous research has indicated that the most important search pattern whenanticipating pass destination in l l-on-11 situations is toalternate fixations between the player in possession oftheball and other potential sources of information in thesimulation (see Williams et aI., 1994). This search strategy is regarded as advantageous in such a highly dynamiccontext, because it enhances the participant's awarenessofother players' positions and movements, thus increasing their appreciation of possible passing options (Williams et aI., 1994). Consequently, the number of times pertrial that participants alternated their fixations betweenthe player in possession of the ball, some other area ofthe display, and then back to the player in possession ofthe ball was taken as the dependent variable. These datawere analyzed using a one-way analysis of variance(ANaVA) in which Group (experienced-less experienced) was the between-subjects factor.
Fixation Location. The dependent variable fixationlocation referred to the areas of the display on which theeye fixated when predicting pass destination. The screenwas divided into four areas: players positioned on theright of the screen; players on the left side of the screen;the upper body (i.e., above the waist) and the lower body
ROES: June 1998
Williams and Davids
(i.e., below the waist and including the ball) of the playerin possession of the ball. This analysis provided percentage values for the mean time spent per trial within eachlocation. These data were analyzed using a factorialANaVA in which Group (experienced-less experienced)was the between-subjects factor and fixation location(player position right-player position left-upper bodylower body and ball) the within-subjects variable.
Search Rate.Search rate was represented by the meannumber ofvisual fixations and the mean fixation duration per trial. Mean fixation duration was the averageofall fixations that occurred during the film trials. A fixation was defined as a condition in which the eye remained stationary for a period equal to, or in excess of,6 video frames (120 ms). Mean fixation duration and thenumber of fixations were analyzed using separate oneway ANavAs in which Group (experienced-less experienced) was the between-subjects factor.
Results
Anticipation Test
MANCaVA showed a significant difference betweenthe two groups on the anticipation test, Wilks' A = .44,F(4, 18) = 5.54, P< .01. The experienced players werebetter at anticipating pass destination than their less experienced counterparts. Follow up discriminant analysisshowed that the IT variable (standard coefficient = -8.41)more clearly distinguished between groups than the RT(standard coefficient = 5.96), RA (standard coefficient =2.11), and MT variables (standard coefficient = -.44).Thiswas supported by separate univariate analysis of the fourdependent variables, which showed a significant difference on the IT, F(I, 21) = 7.36,p < .05 (effect size [ES] =1.09), and RTvariables only, F(I, 21) = 7.68,p < .05 (ES= 1.06). Table 1 displays the mean group performancescores across the dependent variables.
Visual Search Data
Fixation Order. ANaVA showed no significant differences between the two groups in search order, F( 1, 22)= .01,p > .05 (ES = .03). There were no differences inthe frequency of alternation of fixations between theplayer in possession of the ball and other areas of thedisplay. The mean frequency of this search pattern pertrial was similar for the experienced (M = 1.03, SD = .39)and less experienced (M = 1.04; SD = .20) participants.
Fixation Location. Factorial ANaVA revealed no significant main effect for group, F(I, 22) = .08, P> .05.An initial Mauchly's Sphericity test revealed a violationof the sphericity assumption for repeated measuresANaVA, X2(5) = 83.17,p < .001. Consequently, the location main effect and the Group x Location interaction
115
Dow
nloa
ded
by [
Nor
th C
arol
ina
Stat
e U
nive
rsity
] at
21:
17 1
9 A
ugus
t 201
3

Williams andDavids
were analyzed using a MANOVA-type procedure as recommended by Schutz and Gessaroli (1987). This analysis indicated that no Group x Location interaction, Wilks'A = .96, F(3, 66) = .04, P> .05. However, a significantdifference was shown for the location main effect, Wilks'A = .05, F(3, 66) = 24.96, P< .001. Post hoc Scheffe analysis showed that participants spent most time fixating thelower body of the player in possession of the ball or theball itself, p < .001. Also, more time was spent fixatingthe player's upper body and the right side of the screencompared with the left side of the display, p< .05. Thesedifferences are represented in Figure 1.
Search Rate. Separate one-way ANOVAs showed nosignificant differences between groups in mean fixationduration, F(l, 22) = 3.15, p » .05 (ES = .72), or in themean number of fixations per trial, F(l, 22) = 0.21, p>.05 (ES = .19). The mean fixation duration for the ex-
perienced players was 865.83 ms (SD= 145.22) comparedwith 973.50 ms (SD = 151.67) for the less experiencedparticipants. Similarly, the experienced players employed an average of 4.17 (SD = .62) fixations per trialcompared with 4.02 (SD= .90) for their less experiencedcounterparts.
Discussion
The results highlighted the experienced soccer players' superior anticipatory performance. They demonstrated significantly faster ITs and RTsbut were no moreaccurate than the less experienced players. The visualsearch data showed no differences between groups inthe allocation of fixations to display regions, search order, or search rate. Because the experienced players re-
Table 1.Meangroup performance scores for experienced and lessexperienced players onthe 3-on-3 anticipation test
Group CRT (rns] IT(ms) MT(msl RT(msl RA(%lM SO M SO M SO M SO M SO
Experienced(n= 12) 715.0 61.7 3,906.2 292.8 297.5 29.5 4,203.7 295.1 81.3 10.9
Less experienced(n= 12) 638.3 56.1 4,256.5 347.9 280.0 32.2 4,536.5 332.3 78.5 20.8
Note. CRT =choice reaction time;IT=initiation time;MT=movement time; RT =response time; RA =response accuracy; M=mean; SO =standard deviation.
70..-----------------------------------,
60
50
40
30
20
10
o+----'----
Experienced Less Experienced
IOBPA .BPB .Left ORight IFigure 1. Mean distribution of fixation locations as a percentage of total trial timeper group in the 3-on-3 situations. (SPA =upper body ofplayer in possession of the ball; BPB =lower body of player in possession of the ball including the ball; LEFT =left side of the screen;RIGHT =right side of the screen.)
116 ROES: June 1998
Dow
nloa
ded
by [
Nor
th C
arol
ina
Stat
e U
nive
rsity
] at
21:
17 1
9 A
ugus
t 201
3

sponded more quickly to the film sequences, the suggestion is that there were discrepancies between information pick up and visual search strategy, as impliedfrom foveal orientation to the display. The experiencedplayers' superior anticipation may depend less on howthe display is overtly searched through eye movementsand more on their ability to extract better quality information per fixation or their enhanced ability to extracttask specific information through peripheral vision. Thisdistinction between visual orientation and informationextraction highlights the limitations in using eye movement recording alone to provide definitive informationabout selective information pick up. Clearly, more directmeasures of information extraction and cue dependence, such as spatial occlusion or concurrent verbalreports, are also needed to isolate the perceptual strategies employed by performers (cf., Abernethy & Russell,1987a,1987b).
Finally, there were no differences in fixation duration or the number of fixations employed. Previous research involving Ll-on-l l situations (see Williams et al.,1994) was contradicted suggesting that lower search ratesmay be more effective in these 3-on-3 situations. The initial hypothesis, that lower search rates may be preferablebecause of the increased role ofperipheral vision in picking up task specific information, was supported. Furtherevidence to support this conclusion is presented in Experiments 2 and 3.
Experiment 1B:Anticipation and Visual SearchStrategy in 1-on-1 Situations
Method
Participants and Test Film
Participants were the same as those in the 3-on-3condition. Participants were presented with 20 offensivesoccer sequences involving l-on-l simulations in whichparticipants were required to imagine themselves as achallenging defender on the edge of the penalty area.Each sequence involved an offensive player dribbling theball directly toward the participant on screen. The participant was required to anticipate quickly and accuratelywhether the attacker would attempt to dribble past himon his right or left side. Participants were asked to moveas if they were about to tackle or block the attacker. Eachfilm clip lasted approximately 4 s. An intertrial intervalof 6 s was built into the film construction.
The action sequences were filmed from a front-onposition such that the attacking player was dribbling directly toward the camera. This position provided a visualdisplay most representative of a defender's view of the
RaES: June 1998
Williams andDavids
action. While filming the sequences, the attacking players were asked to imagine that the camera was a defender they had to dribble the ball past. No restrictionswere placed on the dribblers with regard to making fainting movements to mislead the participants. The dribblers were highly skilled and included four right- and twoleft-footed players, thus providing some variety in dribbling style and technique. Three experienced soccercoaches viewed the film sequences to ensure they wererealistic and representative of actual game play. Onlythose film clips on which the coaches completely agreedwere used in the test film.
Apparatus and Procedure
The apparatus was the same as in the 3-on-3 condition. Prior to presentation of the test film, participants'CRT was measured. This involved using a similar test asin the 3-on-3 condition but with only two response alternatives. In this test, the stimulus was presented on theright or left side of the screen only. Participants stoodon a central pressure pad and were required to respondby stepping quickly and accurately on to the right or leftresponse pad, as appropriate. Participants were presented with 3 practice trials and 18 test trials. CRT wasmeasured as in the 3-on-3 condition.'
The habituation and calibration procedures werethe same as the 3-on-3 condition. The test film was thenpresented using the same video projector and screen asin the 3-on-3 condition. Participants were required tostep on the right or left response pad as appropriate andthe test film was occluded immediately after the initiation of movement. The entire test session lasted approximately 30 min.
Analysis--Dependent Variables and Visual Search Data
The same four dependent variables recorded during the 3-on-3 condition were measured. These variableswere analyzed as in the 3-on-3 condition."
Fixation Order. Fixation order was initially analyzeddescriptively through a series of transition matrices.These indicated the number of occasions a given fixation location was immediately preceded or followed byfixations from each of the other display areas. Following an inspection of these matrices, the dependent variable fixation order was taken as the number of times pertrial that participants alternated their fixations betweenthe area below the attacker's knees, including the ball,the area between the knees and midchest region, andthen back again to the ball or lower portion of thedribbler's body. These data were analyzed as in the 3on-3 condition.
Fixation Location. Fixation location was obtained bydividing the screen into three areas: the area below theattacker's knees, including the ball; the attacker's torso
117
Dow
nloa
ded
by [
Nor
th C
arol
ina
Stat
e U
nive
rsity
] at
21:
17 1
9 A
ugus
t 201
3

Williams andDavids
(i.e., above the knees and below the shoulders); and theattacker's head and shoulders. Data were analyzed as inthe 3-on-3 condition.
Search Rate. This was analyzed as in the Son-S condition.
Results
Anticipation Test
MANOVA showed a significant difference betweenthe two groups on the anticipation test, Wilks' A = 0.48,F(4, 18) = 4.82, P< .01. The experienced players werebetter at anticipating the direction of an opponent'sdribble than their less experienced counterparts. Discriminant analysis showed that the IT variable (standardcoefficient = -30.88) more clearly discriminated betweengroups than the RT (standard coefficient = 28.70), MT(standard coefficient = -10.03), and RA variables (standard coefficient = .89). However, separate univariateanalysis of the four dependent variables showed a significant difference on the RT, F(l, 21) = 4.55, P< .05(ES = .74), and RAvariables only, F(l, 21) = 7.88, P< .05(ES = 1.17). Table 2 shows the mean group performancescores across the dependent variables.
Visual Search Data
Fixation Order. ANOVA showed no significant differences between the two groups in search order, F(I, 22)= 3.84, p » .05. However, the mean frequency values indicated that the experienced players (M = .28, SD= .20)alternated their fixation between the lower leg-ball region and the area between the knees and midchest morethan the less experienced participants (M= .11, SD= .17)(ES = .94).
Fixation Location. Factorial ANOVA revealed no significant main effect for Group, F( 1, 22) = .43, p» .05, orfor the Group x Location interaction, F(2, 44) = 2.24, P> .05. However, a significant difference was shown forthe location main effect, F(2, 44) = 25.48, p< .0001. Posthoc Scheffe analysis showed that participants spent moretime fixating on the lower body of the offensive player
or the ball, p< .001. More time was spent fixating on thedribbler's torso (i.e., above the knees and below themidchest region) compared with the head and shoulderareas, p< .001. Although there were no significant differences in fixation location between groups, the experienced players fixated longer on the area between thedribbler's knees and shoulders (M = 33.2%, SD = 21.4)compared with the less experienced group (M= 15.7%,SD = 13.6). Moreover, calculation of the effect size (ES= 1.08) showed this was a meaningful difference betweenthe two groups (see Cohen, 1992). The nonsignificantfindings may be explained by the relatively small groupsize and the high standard deviation values. These differences are represented in Figure 2.
SearchRate. Separate one-way ANOVAs showed a significant difference between groups in mean fixationduration, F(l, 22) = 4.32, P< .05 (ES = .85), and in themean number of fixations per trial, F( 1, 22) = 4.71, P<.05 (ES = .91). The experienced players had a lowermean fixation duration (M= 1,104.62, SD= 332.41) compared to the less experienced participants (M = 1555.0,SD = 673.60). The experienced players also employedmore fixations per trial (M = 2.60, SD = .83) than theirless experienced counterparts (M = 1.90, SD = .72).
Discussion
Findings showed that the experienced players werebetter at anticipating the direction of an opponent'sdribble. They had faster RTs and were more accurate intheir decisions compared to the less experienced group.Moreover, there were some interesting differences in visual scanning behavior. First, the experienced playersspent more time (although not statistically significant)fixating on the area between the dribbler's knees andmidchest region (M = 33.5%; SD = 21.5) compared withthe less experienced group (M = 15.7%; SD= 13.5). Although the overall mean frequency values were low, discrepancies were evident in search order, with theexperienced players tending to alternate their fixationsmore frequently between the ball and hip region compared with the less experienced players. The area above
Table 2. Mean group performance scores for experienced and less experienced players onthe l-on-l anticipation test
Group
Experienced (n = 12)Less experienced (n = 12)
CRT [rns]M SO
524.0 48.9518.2 54.3
IT(ms)M SO
2,979.0 105.03,070.6 140.5
MT(ms)M SO
200.8 27.1216.7 49.4
RT(mslM SO
3,179.8 11 0.33,286.3 131.5
RA(%)M SO
92.5 7.576.8 17.4
Note. CRT =choice reaction time; IT=initiation time; MT=movement time; RT =response time; RA =response accuracy; M =mean; SO =standard deviation.
118 ROES: June 7998
Dow
nloa
ded
by [
Nor
th C
arol
ina
Stat
e U
nive
rsity
] at
21:
17 1
9 A
ugus
t 201
3

Williams andDavids
the knees and below the midchest region seems important in anticipating an opponent's movements. Interestingly, other research has identified the hip area as animportant information source in anticipating the direction ofsoccer penalty kicks. Tyldesley et al. (1982) showedthat when experienced soccer players were required toanticipate ball direction from slides of a player in the actof shooting at goal, 60% ofinitial fixations were directedat the hip region. Similarly, Williams and Burwitz (1993)reported that experienced goalkeepers focused on thehip region when attempting to determine the directionof a penalty kick. They suggested that the "opening" ofthe shooter's hips provided important information regarding the placement of the penalty kick. It is possiblethat similar motion invariants are used by the experienced defender to anticipate the direction of anopponent's dribble. The opening of a right-footeddribbler's hips could suggest a move to the right, whereasmovement to the left may be characterized by a more"closed" or central orientation of the hips relative to thedefender. Alternatively, perhaps the experienced playersfocused on the hip region because of its proximity to thedribbler's center of gravity. When the dribbler movesright or left, there must be a displacement in the centerof gravity in the corresponding direction. This transformation may provide the defender with important information regarding the direction ofan opponent's dribble.Focusing on the hip region may be more viable than attempting to pick up information from the dribbler'slower leg or shoulder areas. These areas are often usedby skilled dribblers to provide spurious information, thus
leading to false positives in the language of signal detection theory. It is probably for this reason coaches generally advocate that defenders focus on the ball to theexclusion of other display areas in these situations.
In contrast to the 3-on-3 situations, the experiencedplayers adopted a higher search rate when facing a dribbler. They employed a search strategy which comprisedmore fixations (2.9 vs. 1.9) of shorter duration (1,104.6vs. 1,555.0 ms) than their less experienced counterparts.Thus, experienced players are characterized by highersearch rates, supporting previous research involving 11on-ll simulations (Williams et aI., 1994). The task constraints may necessitate that performers use foveal ratherthan peripheral vision to extract task specific information. Because the approaching dribbler takes up onlyaround 5-10° of their visual field, perhaps the performeris constrained to using foveal vision to pick up information from key parts of the body, resulting in a corresponding increase in search rate.
Experiment 2A: Visual Search Strategy andSelective Attention in 3-on-3 Situations inSoccer
This experiment examined the relationship betweenvisual search strategy and selective attention in 3-on-3and Lon-I situations, using a spatial or event occlusionapproach. The assumption is that if performance deteriorates when a particular area or information source is
80 -y-------------------------------------,
40 .
70 .
0+----
30 .
50 .
20 .
60 .
10 _..
Experienced
I_Mid _Top o Bottom ILess Experienced
Figure 2. Mean distribution of fixation locations as a percentage of total trial time per group in the 1-on-1 situations. (MID = area betweenthe dribbler's knees and mid chest region; TOP =dribbler's head and shoulders; BOnOM =area below the dribbler's knees including the ball.)
ROES: June 1998 119
Dow
nloa
ded
by [
Nor
th C
arol
ina
Stat
e U
nive
rsity
] at
21:
17 1
9 A
ugus
t 201
3

Williams and Davids
occluded, then it can be inferred that this region provides unique information that cannot be picked up elsewhere. The scale of performance decrement is linkedto the systematic removal ofspecific information sourcesvia spatial occlusion techniques (for a more detailed review, see Abernethy, 1985).
Method
Participants and Test Film
Participants were the same as in Experiment 1. Thetest film comprised 10 randomly selected action sequences from Experiment 1. The order of presentationof these film clips was rearranged on a random basis tominimize order effects. Moreover, to further minimizethe possibility of any learning or familiarization effects,Experiment 2 was undertaken some 3 months after thecompletion of Experiment 1. To examine whether anylearning effect had been apparent, performance in thecontrol condition (E1) in this experiment (see Table 3)was compared with that observed under the same conditions in Experiment 1 (see Table 1). The results showedno improvement in performance for either group acrossthe two experiments, indicating that learning or familiarization effects were not apparent.
A spatial occlusion approach was used to obscurerelative amounts ofinformation pick up from areas otherthan the ball or ball passer. This was achieved by blacking out selected areas of the display using a digital production mixer (Panasonic WJ-MX15; Panasonic, Osaka,Japan). The sequences were presented to participantsunder two randomly ordered conditions ofspatial occlusion, thus making a total of 20 film clips. In occlusioncondition E1, irrelevant display areas were masked byestablishing a narrow black border around the entireviewing image. As a result, the film image subtended aviewing angle of 35° in the horizontal and 30° in the vertical direction. Because this was a control condition tocompensate for any confounding effect arising from the
film disruption, care was taken not to obscure any information from the positions and movements of players.The second occlusion condition E2 involved masking allareas of the display other than the ball or ball passer.This was achieved by creating a viewing square that subtended a visual angle of approximately 6° in the horizontal and 5° in the vertical direction.
Procedure andAnalysis
The procedure was as in Experiment 1. To simplifythe analysis and because RT was a combination oflT andMT, only two dependent variables were included,namely: response time (RT) and response accuracy(RA). Because of the between group differences in CRT2and the relationship between speed (RT) and accuracy(RA) measures," a split plot MANCOVA was used in analyzing group performance scores. In this analysis, Group(experienced-less experienced) was the between-subjectsvariable, viewing condition (E1-E2) the within-subjectsfactor, RT and RA the dependent variables and CRT thecovariate.
Results
MANCOVA showed a significant difference in thegroup, Wilks' A = .70, F(2, 20) = 4.17, p « .05, and viewing condition main effects, Wilks' A = .25, F(2, 20) =
29.07, P< .0001. Also, the Group x Viewing conditioninteraction was significant, Wilks' A= .61, F(2,20) = 6.17,P< .01. Discriminant analysis for the group main effectshowed that the RT variable had a higher standard coefficient (standard coefficient = 1.28) than the RA variable (standard coefficient = -.92). This was supported byunivariate analysis which showed a significant differenceon the RT variable only, F(l, 21) = 4.36, P< .05. Moreover, discriminant analysis for the viewing conditionmain effect showed that the RA variable had a higherstandard coefficient (standard coefficient = -1.38) thanthe RT variable (standard coefficient = 1.28). However,
Table 3. Mean group performance scores for experienced and less experienced players under both E1 and E2 occluded viewingconditions onthe 3-on-3 anticipation test
E1 E2Group RT(ms) RA(%) RT(ms) RA(%)
M SO M SO M SO M SO
Experienced (n =12) 4,269.2 269.8 80.8 13.1 4,403.2 196.8 62.5 15.4Less experienced In =12) 4,563.9 276.1 77.5 12.2 4,605.2 268.4 70.0 15.9
Note. RT = response time; RA = response accuracy; E1 = occlusion of irrelevant display areas; E2 = occlusion of areas otherthanthe ballball passer; M=mean; SO =standard deviation.
120 ROES: June 1998
Dow
nloa
ded
by [
Nor
th C
arol
ina
Stat
e U
nive
rsity
] at
21:
17 1
9 A
ugus
t 201
3

univariate analysis revealed that both RT, F(1, 21) = 5.33,P< .05, and RA variables were significantly different, F( 1,21) = 13.36, P< .01. Discriminant analysis on the Groupx Viewing condition interaction showed that RA (-1.36)was more discriminating than the RT variable (standardcoefficient = 1.31). Separate univariate analysis revealedthat neither the RT, F(l, 22) = 1.49, p> .05, or the RAvariables were significantly different on the Group xViewing condition interaction, F(l, 22) = 2.35, P> .05.Post hoc Scheffe analysis showed that the experiencedplayers were more accurate under the El (M = 80.83%,SD = 13.1) compared with E2 viewing conditions (M =
62.5%, SD = 15.4), P< .05 (ES = 1.28). No differenceswere found in RT for the experienced players across thetwo viewing conditions, p » .05 (ES = .56). In contrast,there were no differences in RA (ES = .53) or RT (ES =
.15) for the less experienced participants across the twoviewing conditions, p» .05. Finally, the experienced players showed significantly quicker RT values than the lessexperienced group under both El (ES = 1.08) and E2(ES = .86) viewing conditions, p< .05. These results arehighlighted in Table 3.
Discussion
The results showed that masking areas other thanthe ball or ball passer affected the experienced players'performance more than the less experienced group. Theexperienced players were less accurate under the E2 occlusion compared with the El control condition. In contrast, occluding peripheral areas of the display had noeffect on the less experienced players' performance.Apparently, the experienced players extracted more information from areas other than the ball or ball passerwhen attempting to anticipate pass destination. Masking these areas deprived participants of informationfrom the positions and movements of players "off theball," suggesting that the experienced players madegreater use of these information sources, compared withtheir less experienced counterparts (cf., Williams et al.,1994). Furthermore, because there were no differencesin the orientation of foveal vision to these areas of thedisplay in Experiment 1, it appears that the experiencedplayers made greater use of peripheral vision to extractthis information. Although novices were constrained inthe same way by the 3-on-3 task, they were not skilled atusing peripheral vision to pick up information as evidenced by the fact that the spatial occlusion didn't havea significant influence on performance.
The results showed that the experienced playersdemonstrated better performance under both the Eland E2 viewing conditions. Not only did they use theirperipheral vision more effectively to extract task-specificinformation, but they also derived better quality information per foveal fixation. The experienced players
RQES: June 1998
Williams andDavids
were able to more effectively utilize information emanating from the ball kicker's passing technique to anticipate the ball destination. The ability to extract betterquality information per fixation, coupled with the ability to more effectively acquire information via peripheral vision, contributes to their superior anticipation inthese contexts.
Experiment 28: Visual Search Strategy andSelective Attention in t-en-t Situations inSoccer
Method
Participants and Test Film
Participants were the same as in Experiment 1. Thetest film comprised 10 action sequences from Experiment 1. These trials were selected randomly and included two right- and two left-footed dribblers. Theaction sequences were presented to participants underfour randomly ordered conditions of spatial occlusion,making a total of 40 film clips. To ensure there were nolearning or order effects, performance in the controlcondition (E4) in this experiment (see Table 4) was compared with that observed under the same conditions inExperiment 1 (see Table 2). The results showed no improvement in performance for either group across thetwo experiments, indicating that learning or familiarization effects were not apparent.
The occlusion was achieved by digitally editing anopaque rectangular box over the appropriate displayarea using a digital production mixer (Panasonic ~MXI5; Panasonic, Osaka, Japan). The event occlusionconditions included masking the dribbler's head andshoulders (El), hips (i.e., above the knees and below themid chest region) (E2), lower leg (i.e., below the knees)and ball region (E3), and an irrelevant area of the display (E4). The occlusion of an irrelevant area of the display was intended as a control condition to account forany effects arising from the film disruption and subsequent participant distraction.
Procedure andAnalysis
The procedure was as in Experiment 1. RT and RAwere included in this analysis. Because of the relationship between speed (RT) and accuracy (RA) measures,"a split plot MANOVA was used in analyzing group performance scores. In this analysis, Group (experiencedless experienced) was the between-subjects variable,viewing condition (EI-E2-E3-E4) the within-subjects factor, RT and RA the dependent variables.
121
Dow
nloa
ded
by [
Nor
th C
arol
ina
Stat
e U
nive
rsity
] at
21:
17 1
9 A
ugus
t 201
3

Williams and Davids
Results
MANOVA showed a significant difference betweenthe groups, Wilks' A = .47, F(2, 21) = 11.60, p« .001, andviewing conditions, Wilks' A = 0.41, F(6, 17) = 3.93, P<.05. There was no significant Group x Viewing conditioninteraction, Wilks' A = .74, F(6, 17) = .98, p » .05. Discriminant analysis for the group main effect showed thatthe RT variable had a higher standardized coefficient(standard coefficient = 1.14) than the RA variable (standard coefficient = -1.12). However, univariate analysisshowed a significant difference on both the RT, F(1, 22)= 5.06, P< .05, and RA variables, F( 1, 21) = 4.40, P< .05.Discriminant analysis for the viewing condition maineffect showed that the RT variable for the E2 occlusionhad the highest standardized coefficient (standard coefficient = .95). Furthermore, univariate analysis revealed the RT variable for the E2 occlusion was the onlysignificant variable, F(3, 66) = 6.21, P< .001. Post hocScheffe analysis demonstrated that both groups of participants were quicker in the E1 and E4 viewing conditions compared with E2 and E3, p< .05. There were nodifferences between the E1 and E4 or between the E2and E3 conditions respectively, p» .05. These results arehighlighted in Table 4.
Discussion
The results showed that masking the dribbler's hips(E2) and the lower leg and ball region (E3) had a greatereffect on the experienced and less experienced players'performance than the other occlusions. It seems thatthese areas contained information used by the participants in anticipating the direction of an opponent'sdribble. Findings supported the earlier eye fixation datawhich suggested that the experienced and less experienced players primarily focus on these two display areas.In contrast, occluding the dribbler's head and shoulders(E1) did not affect the players' performance relative to
the E4 control condition, suggesting that these areas donot provide essential information for anticipating anopponent's dribble.
Although the findings supported the eye fixationdata collected in Experiment 1, there were some contentious issues. First, the eye fixation data showed thatboth groups of players predominantly fixated on thelower leg and ball region when attempting to anticipatethe direction of an opponent's dribble. However, masking these areas of the display did not affect their performance any more than the occlusion of the hip region.It appears that either performers utilize informationfrom more than one source to anticipate an opponent'smovements, or that when the lower leg and ball regionsare masked, players are able to obtain useful information from the hip region. Perhaps the two locations provide overlapping and consequently, mutually redundantperceptual invariants in these situations. Second, Experiment 1 suggested that the experienced players madegreater use ofinformation extracted from the hip regionto anticipate the direction of dribble. However, occluding this area of display did not affect their performancemore than the less experienced group. It is possible thatexperienced players were able to acquire the same information from other sources, or that they fixated onthe hip region because it was the most appropriate position to locate foveal vision to enable them to use peripheral vision to extract task specific information.
Experiment 3: Visual Search Strategy,Selective Attention and Information Extractionin 3-on-3 Soccer Situations
To verify the findings obtained using eye movementand spatial occlusion techniques, concurrent verbal reports were employed to examine differences in selectiveattention in the 3-on-3 simulations. Concurrent verbalreport procedures require participants to verbalize the
Table 4. Mean group performance scores for experienced and less experienced players underthe four spatial occlusion conditions onthe 1-on-1 anticipation test
El E2 E3 E4Group RT(ms) RA(%) RT(ms) RA(%) RT(ms) RA(%) RT(ms) RA(%)
M SO M SO M SO M SO M SO M SO M SO M SO
Experienced(n =12) 3,232.5 62.7 90.0 8.5 3,273.7 65.2 90.7 11.8 3,252.6 53.8 92.5 9.6 3,188.1 119.8 90.0 11.2
Less experienced(n= 12) 3,276.7 120.7 81.6 12.3 3,337.2 105.2 78.3 26.0 3,359.3 169.6 85 14.8 3,265.7 78.6 76.0 17.9
Note. RT =response time; RA =response accuracy; E1 =occlusion of head and shoulders; E2 =occlusion of hip region; E3 =occlusion oflower leg and ball; E4 =occlusion of an irrelevant display area; M =mean; SO =standard deviation.
122 ROES: June 1998
Dow
nloa
ded
by [
Nor
th C
arol
ina
Stat
e U
nive
rsity
] at
21:
17 1
9 A
ugus
t 201
3

area of the display they consider particularly informative.Consequently, a more direct measure of attentional allocation and information extraction is provided (Bainbridge,1990; Ericsson & Simon, 1993). Although there have beencriticisms, there is much agreement that verbal reportscan provide valuable insights into higher mental processes (for a detailed review of the arguments, seeBrinkman, 1993; Green, 1995; Williams & Davids, 1997).
Method
Participants and Test Film
Participants were the same as in Experiment 1. Participants were presented with the same film clips used inthe 3-on-3 anticipation test. However, the sequence ofpresentation of film clips was rearranged on a randombasis to minimize order effects. Also, to further minimizethe possibility of any learning or familiarization effects,Experiment 3 was undertaken 1 month after the completion of Experiment 2. In this experiment, the offensivemidfield player who made the eventual pass or dribblewas surrounded by a reference square during the entiretrial to be clearly highlighted. The reference square subtended a visual angle ofapproximately 6° in the horizontal and 5° in the vertical direction. This square did notmask the player'S actions on screen.
Procedure
The same test procedure as in Experiment 1 wasused. Participants viewed each pattern of playas it developed on screen and responded by moving right, left,forward, or backward in relation to the action. Whileeach action sequence unfolded, participants were required to concurrently verbalize the area of the displayfrom which they were extracting information. That is,they were asked to verbalize the area of the screen theywere attending to at that specific moment in time. Tosimplify this process, the screen was divided into threeareas: (l) box-the reference square which highlightedthe player who would make the eventual pass and for alarge portion of the trial the ball; (2) right-right sideof the screen, (3) left-left side of the screen. Participants' verbalizations were recorded using a video camera (Panasonic F15) and recorder (Panasonic AG7450;Panasonic, Osaka, Japan) and were later transcribedverbatim for analysis. The camera was positioned to simultaneously record participants' verbal comments andthe film image displayed on the screen. This enabledparticipants' verbal reports to be coupled with the filmedaction sequences for further analysis. Participants thenreceived 12 practice trials to ensure familiarity with theverbalization procedure. Trials in which there was abreakdown in verbalization processes were discarded. As
ROES: June 7998
Williams andDavids
participants found the verbalization procedure to beuncomplicated, few trials were actually rejected. The testsession lasted for 30 min on average.
Analysis-Dependent Variables and Verbal Report Data
Two dependent measures were obtained: RT and RA.Location of Visual Attention. The location of visual at
tention was regarded as the number ofverbalizations pertrial recorded for each of the three separate locations(i.e., box, right, and left side of the screen) as a percentage of the total number of verbalizations.
Verbal Search Order. This dependent variable was defined as the number of verbalized shifts in attention pertrial from the box to the right or left side of the screenthen back to the box.
Results
Anticipation Test
Performance on the anticipation test was analyzedusing a one way MANCOVA. In this analysis, Experience(experienced-less experienced) was the between-subjectsfactor, RA and RT the dependent variables, and CRT thecovariate. The results showed a significant difference inperformance on the anticipation test across the twogroups, Wilks' A = 0.67, F(2, 20) = 4.74, P< .05. Discriminant analysis revealed that RT had the highest standardized coefficient (standard coefficient = -1.17) andconsequently, discriminated more clearly between groupsthan RA (standard coefficient = 0.26). Furthermore,univariate analyses showed that the experienced soccerplayers had quicker RT values, F(l, 21) = 9.61, P< .01(ES = 1.27), while there were no differences in RA between groups, F(l, 21) = 3.11, r> .05 (ES = .57). Themean RT score for the experienced participants was4,433.45 ms (SD= 325.31) compared to 4,791.88 ms (SD= 228.72) for the less experienced participants, whereasthe mean RA values were 77.52% (SD= 13.76) and 84.2%(SD = 9.39) respectively.
Verbal Reports
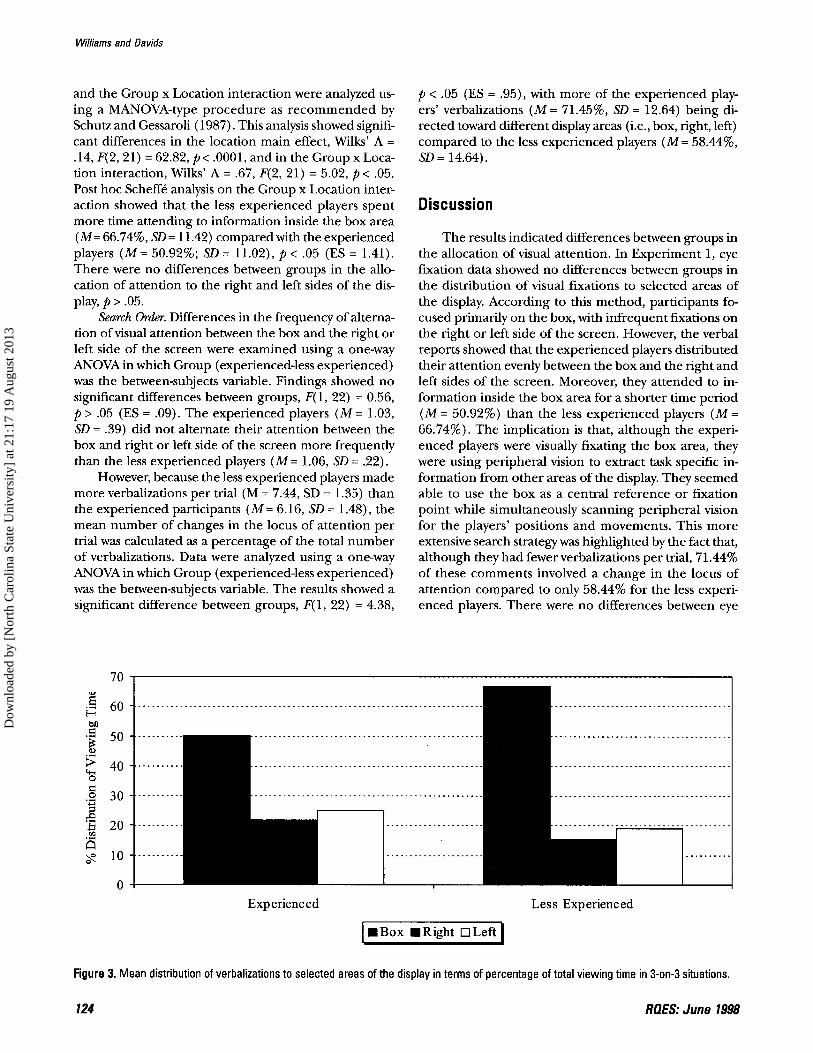
Location of Visual Attention. Differences in the orientation ofvisual attention, as inferred from verbal reports,were examined using a split plotANOVA in which Group(experienced-less experienced) was the between-subjectsvariable and the three locations (box-right-left) thewithin-subjects variables. The results are represented inFigure 3. Findings showed no significant difference between groups, F(l, 22) = 1.77, r> .05. 11. An initialMauchly's Sphericity test revealed a violation of the sphericity assumption for repeated measures ANOVA, X2 (2)= 14.45, P< .001. Consequently, the location main effect
723
Dow
nloa
ded
by [
Nor
th C
arol
ina
Stat
e U
nive
rsity
] at
21:
17 1
9 A
ugus
t 201
3
Williams and Davids
and the Group x Location interaction were analyzed using a MANOVA-type procedure as recommended bySchutz and Gessaroli (1987). This analysis showed significant differences in the location main effect, Wilks' A =
.14, F(2, 21) = 62.82, p< .0001, and in the Group x Location interaction, Wilks' A = .67, F(2, 21) = 5.02, P< .05.Post hoc Scheffe analysis on the Group x Location interaction showed that the less experienced players spentmore time attending to information inside the box area(M= 66.74%, SD= 11.42) compared with the experiencedplayers (M = 50.92%; SD = 11.02), P< .05 (ES = 1.41).There were no differences between groups in the allocation of attention to the right and left sides of the display, r> .05.
Search Order. Differences in the frequency of alternation of visual attention between the box and the right orleft side of the screen were examined using a one-wayANOVA in which Group (experienced-less experienced)was the between-subjects variable. Findings showed nosignificant differences between groups, F(l, 22) = 0.56,r> .05 (ES = .09). The experienced players (M = 1.03,SD = .39) did not alternate their attention between thebox and right or left side of the screen more frequentlythan the less experienced players (M = 1.06, SD = .22).
However, because the less experienced players mademore verbalizations per trial (M = 7.44, SD = 1.35) thanthe experienced participants (M = 6.16, SD = 1.48), themean number of changes in the locus of attention pertrial was calculated as a percentage of the total numberof verbalizations. Data were analyzed using a one-wayANOVAin which Group (experienced-less experienced)was the between-subjects variable. The results showed asignificant difference between groups, F(l, 22) = 4.38,
p < .05 (ES = .95), with more of the experienced players' verbalizations (M = 71.45%, SD = 12.64) being directed toward different display areas (i.e., box, right, left)compared to the less experienced players (M = 58.44%,SD= 14.64) .
Discussion
The results indicated differences between groups inthe allocation of visual attention. In Experiment 1, eyefixation data showed no differences between groups inthe distribution of visual fixations to selected areas ofthe display. According to this method, participants focused primarily on the box, with infrequent fixations onthe right or left side of the screen. However, the verbalreports showed that the experienced players distributedtheir attention evenly between the box and the right andleft sides of the screen. Moreover, they attended to information inside the box area for a shorter time period(M = 50.92%) than the less experienced players (M =
66.74%). The implication is that, although the experienced players were visually fixating the box area, theywere using peripheral vision to extract task specific information from other areas of the display. They seemedable to use the box as a central reference or fixationpoint while simultaneously scanning peripheral visionfor the players' positions and movements. This moreextensive search strategy was highlighted by the fact that,although they had fewer verbalizations per trial, 71.44%of these comments involved a change in the locus ofattention compared to only 58.44% for the less experienced players. There were no differences between eye
70 -.--------------------------------------,
'$. 10
0+---
Experienced
I_Box _Right o Left ILess Experienced
Figure 3. Mean distribution of verbalizations to selected areas of the display in terms of percentage of totalviewing time in 3-on-3 situations.
124 ROES: June 1998
Dow
nloa
ded
by [
Nor
th C
arol
ina
Stat
e U
nive
rsity
] at
21:
17 1
9 A
ugus
t 201
3
movements and verbal reports for the less experiencedplayers, suggesting that visual fixation is indicative of information extraction in these situations. They made lessuse of peripheral vision to extract task specific information, preferring instead to use foveal vision to fixate onthe ball or the player in possession of the ball.
Conclusions and Summary
This research had several objectives. First, we examined skill-based differences in anticipation and visualsearch strategy in the typical micro states encounteredin soccer (3-0n-3 and l-on-l). These situations are greatlyemphasized as coaching contexts in modern practices,because they represent typical subphases of the game(e.g., see Hughes, 1994). It is, as yet, unclear whetherteam games players are constrained to implement thesame search strategies in small-sided practice conditionscompared to full-sided games. Second, the researchaimed to examine the relationship between visual fixation, as inferred from eye movement recording, and selective attention, as implied through spatial occlusionand concurrent verbal report methods. Third, we examined the relationship between task constraints and thevisual search pattern employed to extract task specificinformation. In particular, we were interested in thesearch strategies adopted by experienced and less experienced players in the different micro states of the gamecompared with visual search data collected previouslyusing ll-on-ll simulations. Furthermore, we examinedthe assumption that peripheral visual processing wouldhave a greater emphasis in the micro state simulationsdue to fewer, but highly pertinent, perceptual information sources being concentrated in the simulations.
Anticipation and Visual Search Strategies in theSubphases of Soccer
Previous work had only investigated this relationshipin ll-on-ll simulations, despite the fact that the gamemay be broken down into offensive and defensivesubphases involving smaller units of players. The resultsshowed that the experienced soccer defenders demonstrated superior anticipation in 3-on-3 and l-on-l simulations, supporting previous research involving penaltykick and l l-on-l I simulations (Williams & Burwitz, 1993;Williams et al., 1994). Although alternative theoreticalinterpretations could be proposed based on neural network or dynamical system models (for a detailed review,see Williams, Davids, & Williams, in press), the experienced player'S superior performance is thought to belinked to the organization of task specific knowledge inlong-term memory (see Starkes & Allard, 1993; Anderson, 1983). According to Anderson (1983), experts areable to encode and retrieve task-specific information
ROES: June 1998
Williams and Davids
based on a set of condition-action links called productions. These productions, which are sometimes referredto as "if...then...do" statements (see McPherson & Thomas, 1989), are responsible for initiating an appropriate response under specified conditions. Also importantis the expert's ability to "chunk" separate stimuli (e.g.,individual player positions) into meaningful wholes(e.g., patterns of play). This enhanced ability to recognize meaningful associations between players' positions,results in more rapid identification of playing patternsand the eventual anticipation of pass destination (Williams & Davids, 1995).
The experienced players' superior anticipation wasnot mirrored by differences in visual search strategy inthe 3-on-3 simulations. There were no differences in thelocation of visual fixation, search order, or search rate.Both experienced and less experienced participants predominately fixated on the ball or ball passer with fewerfixations to the left or right of the screen. In contrast,systematic differences in visual search strategy wereshown between groups in the l-on-l simulations. Theexperienced players tended to fixate longer on the hipregion, indicating that this area was important in anticipating the direction of an opponent's dribble. Also, theyemployed more fixations ofshorter duration (i.e., highersearch rates) and tended to alternate their fixations morefrequently between the hip and lower leg or ball regions.
Visual Orientation, Visual Attention, and InformationExtraction
Although significant differences in anticipation wereobserved in the 3-on-3 simulations, it is notable that thesewere not based on different search patterns between theexperienced and less experienced participants. A lackofbetween-group differences in the orientation offovealvision to the display suggested that the experienced players were more sensitive to peripheral visual informationfrom the changes in positions of teammates and opponents. Experiments 2 and 3 were conducted to shedmore light on this specific issue. In Experiment 2, weshowed that occluding areas other than the ball or ballpasser affected the experienced players more significantly than their less experienced counterparts. Furthermore, we demonstrated that the experienced playerswere more successful in picking up information underfull and occluded viewing conditions. This indicated thattheir perceptual skill was based on the quality of information extraction within each fixation and the moreefficient use of peripheral vision to gain accurate information for decision making. The experienced playersused foveal vision to extract more pertinent formationfrom the passing player'S posture (e.g., orientation ofthe hips, shoulders, and lower leg region), while usingperipheral vision to obtain confirmatory informationbased on the movements of the offensive players "off the
125
Dow
nloa
ded
by [
Nor
th C
arol
ina
Stat
e U
nive
rsity
] at
21:
17 1
9 A
ugus
t 201
3

Williams andDavids
ball." This latter suggestion was confirmed by Experiment3, which showed clear discrepancies between the eyemovements used to pick up information and the verbalized "map" of visual attention reported by the experienced players. The experienced players spent less timevisually fixating peripheral areas of the display comparedwith the amount of time they reported visually attending to these areas via concurrent verbal reports. With theless experienced players, "what they see is what they get."That is, a distinct relationship existed between the locusof eye fixation and the locus of attention as reported bythese participants.
Clearly, as experience accrues, skill in "anchoring"the fovea to an appropriate area of the display is constrained by the specific demands of the task leading toan enhanced orientation to important sources of information in the periphery. These findings support the conclusions of the (few) previous studies which haveexamined the relationship between task experience, visual fixation, and the locus of attention in the contextof racquet sports (e.g., Abernethy & Russell, 1987a,1987b; Abernethy, 1990). Previous arguments on thelimitations of eye movement registration techniques inidentifying the important sources of information wereextended, by the current research, to the context of teamball games. Also, the significance of the effects of taskexperience on the skill of orienting the visual systemappropriately to optimize information pick up from theperiphery was verified in a team game situation.
Although both groups sought information from theball and the lower leg of the oncoming dribbler in thel-on-l simulations, the experienced group appeared tobe extracting more information from the hip region. Interestingly, the spatial occlusion technique did not provide evidence to support this suggestion, becauseoccluding the hip region did not affect the experiencedplayers' performance more than their less experiencedcounterparts. The implication is that the experiencedplayers were able to pick up similar information fromother areas of the display, such as the orientation of thelower leg and foot relative to the ball, to which the lessexperienced group were clearly less attuned. When thehip was occluded, perhaps the experienced players acquired comparable information from the lower leg,making information from the hip region somewhat redundant.
Visual Search Strategy and Task Constraints
The third objective was to examine whether thesearch strategy employed was constrained by the tasksituation. Specifically, we compared the search strategiesin subgroup (i.e., 3-on-3) and individual (i.e., l-on-l)task contexts with those obtained in an earlier study employing II-on-11 film simulations (see Williams et al.,1994). In Ll-on-I l simulations, we showed that experi-
126
enced players employed a search strategy comprisingmore fixations (M = 10.30; SD= .97) of shorter duration(M =933.94 ms; SD=99.34) than less experienced players who had fewer fixations (M= 8.72; SD= .94) of longerduration (M = 1163.16 ms; SD = 206.26). This more extensive search strategy is advantageous in the l1-on-11context, because defenders have to be aware of a number of sources of information, including the location ofthe ball, their own position in relation to pitch markingssuch as the edge of the penalty area, the movements ofkey offensive players attempting to penetrate the spacesbetween and behind defenders, and the positions ofteammates attempting to defend the critical areas ofthefield (Hughes, 1994). This extensive number of perceptual information sources, located disparately across alarge area of the field, constrains the experienced observer to utilize more frequent fixations than in the micro state contexts. The task constraints, as expressed bythe number of perceptual information sources, are lesssevere in the 3-on-3 simulations, and this results in agreater emphasis on the role of peripheral vision. Inthese situations, perceptual skill involves employing a"visual pivot" in order to diffuse attention according tothe specific requirements of the task. Experienced players maintain foveal fixation on the player in possessionof the ball while using peripheral vision to move theirattentional focus around the display. This type of approach has several advantages. First, the saccadic eyemovements which separate each foveal fixation are inactive periods of information processing; thus, in timeconstrained circumstances, a search pattern with fewerfoveal fixations may be regarded as a more efficientsearch pattern. Second, previous research suggests it ismuch faster to switch attention from one area of thedisplay to another, covertly using peripheral vision ratherthan overt eye movements (see Nougier, Stein, &Bonnel, 1991; Posner & Raichle, 1994). Also, there isevidence to suggest that we can use peripheral vision toprocess movement related information more rapidlythan foveal vision (Milner & Goodale, 1995).
Finally, in the l-on-I situations, observers need highlyprecise information from the offensive player's movements (i.e., changes to hip, lower leg, and foot orientation) to specify the direction of dribble. Consequently,because the hip and lower leg or ball regions appear toprovide the significant information in these situations,performers need to fixate on these areas to pick up thekey motion invariants. This type of detailed informationmay be provided only poorly by the peripheral visual system, therefore constraining the observer to use fovealvision most of the time.
In sum, this research furthers our understanding ofvisual search behavior in dynamic sports contexts by using soccer-related tasks under naturalistic conditions. Theuse of a verbal report protocol, along with the manipulation ofvarious sources of perceptual information avail-
ROES: June 1998
Dow
nloa
ded
by [
Nor
th C
arol
ina
Stat
e U
nive
rsity
] at
21:
17 1
9 A
ugus
t 201
3

able to the observer, indicated that perceptual skill involves the precise orientation of the visual system priorto information pick up. Empirical evidence was providedto show that experienced performers make more appropriate use of peripheral vision under certain task constraints in team games. The implication is that eyemovement registration techniques are somewhat limitedto indicating the locus offixation and not necessarily thelocus of attention in dynamic team game contexts. Amajor task for researchers is to clarify the relationshipbetween the location of perceptual sources of information, the specific task constraints, and the type of visualbehavior employed by performers. Finally, regarding thedevelopment of experimental protocols, investigatorsneed to create controlled experimental simulationswhich include three-dimensional viewing conditions andsources of perceptual information other than vision, forexample, auditory information from movements, ballcontacts in passing, and vocal information from opponents and teammates.
References
Abernethy, B. (1985). Cue usage in "open" motor skills: A review of available procedures. In D. G. Russell & B.Abernethy (Eds.), Motormemory and control: The Otago symposium (pp.110-122). Dundein, NZ: Human PerformanceAssociates.
Abernethy, B. (1988). Visual search in sport and ergonomics:it's relationship to selective attention and performer expertise. Human Performance, 4, 205-235.
Abernethy, B. (1990). Expertise, visual search, and information pick-up in squash. Perception, 19, 63-77.
Abernethy, B. (1991). Visual search strategies and decisionmaking in sport. InternationalJournal ofSportPsychology, 22,189-210.
Abernethy, B. & Russell, D. G. (1987a). Expert-novice differences in an applied selective attention task. Journal ofSportPsychology, 9, 326-345.
Abernethy, B. & Russell, D. G. (1987b) The relationship between expertise and visual search strategy in a racquetsport. Human Movement Science, 6, 283-319.
Abernethy, B, Thomas, K. T., & Thomas,]. T. (1993). Strategies for improving understanding of motor expertise (ormistakes we have made and things we have learned!!). Inj. L. Starkes & F. Allard (Eds.), Cognitive issues in motorexpertise (pp. 317-356). Amsterdam: Elsevier SciencePublishers.
American Psychological Association (1982). Ethicalprinciples inthe conduct of research with human participants. Washington,DC: Author.
Anderson,]. R. (1983) The architecture of cognition. Cambridge.MA: Harvard University Press.
Bainbridge, L. (1990). Verbal protocol analysis. In]. R. Wilson & E. N. Corlett (Eds.), Evaluation of human work: Apractical ergonomic methodology (pp. 161-179). London:Taylor and Francis.
Williams andDavids
Brinkman,]. A. (1993). Verbal protocol accuracy in fault diagnosis. Ergonomics, 36, 11, 1381-1397.
Cohen,]. (1992). A power primer. Psychological Bulletin, 112,155-159.
Davids, K. (1984). The role of peripheral vision in ball games:Some theoretical and practical notions. Physical EducationReview, 7,26-40.
Ericsson, K. A. & Simon, H. A. (1993). Protocol analysis: Verbalreports as data. Cambridge, Massachusetts: MIT Press.
Goulet, C., Bard, C., & Fleury, M. (1989). Expertise differencesin preparing to return a tennis serve: a visual informationprocessing approach. Journal of Sport and Exercise Psychology, 11,382-398.
Green, A.]. (1995). Verbal protocol analysis. The Psychologist,8(3), 126-129.
Helsen, W. & Pauwels,]. M. (1993). The relationship betweenexpertise and visual information processing in sport. In].L. Starkes & F. Allard (Eds.), Cognitive issues in motorexpertise (pp. 109-134). Amsterdam: North-Holland.
Hughes, C. (1994). TheFootball Association book oftactics and skills.London: Queen Anne Press.
Kundel, H. L., Nodine, C. F., & Toto, L. (1984). Eye movementsand the detection of lung tumors in chest images. In A.G. Gale & F.johnson (Eds.), Theoretical and appliedaspectsof eye movement research (pp. 297-304). Amsterdam: NorthHolland.
Milner, D. A. & Goodale, M. A. (1995). The visual brain in action. Oxford, UK: Oxford University Press.
McPherson, S. L. & Thomas,]. R (1989). Relation of know1edge and performance in boy's tennis: Age and expertise.Journal of Experimental Child Psychology, 48, 190-211.
Neumann, 0., Van der Heijden, A. H. C., & Allport, D. A.(1986). Visual selective attention: Introductory remarks.Psychological Research, 48, 185-188.
Nougier, V., Stein,]. F., & Bonnel, A. M. (1991). Informationprocessing in sport and orienting attention. InternationalJournal of SportPsychology, 22, 307-327.
Paillard,]. (1982). The contribution of peripheral and centralvision to visually guided reaching. In D.]. Ingle, M. A.Goodale, & R]. Mansfield (Eds.), Analysis of visual behavior (pp. 367-385). Cambridge, MA: MIT Press.
Papin,]. M., Metges, P., & Amalberti, R (1984). Use of NACeye mark by radiologists. In A. Gale & F.johnson (Eds.),Theoretical and applied aspects of eye movements research (pp.323-330). Amsterdam: North Holland.
Posner, M. I. & Raichle, M. E. (Eds.) (1994) Images ofmind. N.Y:Scientific American Library.
Remington, R W. (1980). Attention and saccadic eye movements. Journal of Experimental Psychology: Human Perceptionand Performance, 6, 726-744.
Ripoll, H. (1991). The understanding-acting process in sport:The relationship between the semantic and the sensorimotor visual function. InternationalJournal of SportPsychology,22, 221-243.
Ripoll, H., Kerlirzin, Y, Stein,j. F., & Reine, B. (1995). Analysis of information processing, decision making, and visualstrategies in complex problem solving sport situations.Human Movement Science, 14(3), 325-349.
Sanders, A. F. & Houtmans, M.]. M. (1985). Perceptual processing modes in the functional visual field. ActaPsychologica, 58, 251-261.
127
Dow
nloa
ded
by [
Nor
th C
arol
ina
Stat
e U
nive
rsity
] at
21:
17 1
9 A
ugus
t 201
3

Williams andDavids
Schutz, R W. & Gessaroli, M. E. (1987). The analysis of repeatedmeasures designs involving multiple dependent variables.Research Quarterly for Exercise and Sport, 58, 132-149.
Shulman, G. L., Remington, R. w., & McLean,]. P. (1979).Moving attention throughout visual space. Journal of ExperimentalPsychology: Human Perception and Performance, 5,522-526.
Stager, P. & Angus, R (1978). Locating crash sites in a simulated air-to-ground visual search. Human Factors, 20, 453466.
Starkes.]. L. & Allard, F. (1993) (Eds.). Cognitive issues in motorexpertise. Amsterdam: North-Holland.
Tyldesley, D. A., Bootsma, R]., & Bomhoff, G. T. (1982). Skilllevel and eye movement patterns in a sport orientatedreaction time task. In H. Rieder, H., H. Mechling, & KReischle (Eds.), Motor learning and movement behavior: contribution to learning in sports (pp. 290-296). Cologne, Germany: Hoffmann.
Van der Heijden, A. H. C. (1986). On selection in vision. Psychological Research, 48, 211-219.
Vickers,]. N. (1992). Gaze control in putting. Perception, 21,117-132.
Williams, A. M. & Burwitz, L. (1993). Advance cue utilizationin soccer. In T. Reilly,]. Clarys, & A. Stibbe (Eds.), Scienceand football II (pp. 239-244). London: E. & F. N. Spon.
Williams, A. M. & Davids, K (1995). Declarative knowledge insport: A by product of experience or a characteristic of expertise? Journal of Sport and Exercise Psychology, 17(3), 259275.
Williams, A. M. & Davids, K (1997). Assessing cue usage inperformance contexts: A comparison between verbal report and eye movement methods. Behavioral Research Methods, Instruments, and Computers, 29, 364-375.
Williams, A. M., Davids, K, & Williams,]. G. (in press). Visualperception and action in sport. London: E. & F. N. Spon.
Williams, A. M., Davids, K, Burwitz, L., & Williams,]. G. (1992).Perception and action in sport.Journal ofHuman MovementStudies, 22, 147-205.
Williams, A. M., Davids, K Burwitz, L., & Williams,]. G. (1993).Visual search and sports performance. TheAustralianJournal of Science and Medicine in Sport, 22, 55-65.
Williams, A. M., Davids, K, Burwitz, L., & Williams,]. G. (1994).Visual search strategies in experienced and inexperiencedsoccer players. Research QuarterlyforExercise and Sport, 65(2)127-135.
Yarbus, A. L. (1967). Eye movements and vision. New York: Plenum Press.
Notes
1. Available from Applied Science Laboratories, 175Middlesex Turnpike, Bedford, Massachusetts, 01730-1428.2. This CRT variable is actually a combination of decision time (DT) and movement time (MT). Consequently,a more accurate term for this measure would be responsetime (RT). To examine whether there were betweengroup differences in four-choice reaction time (CRT), aone-way MANOVA was conducted whereby Group (ex-
128
perienced-less experienced) was the between-subjectsfactor and DT, MT, and RT the dependent variables. Theresults showed a significant difference in performancebetween groups, Wilks' A = .65, F(3, 20) = 3.58, P< .05.Separate univariate analysis of the three dependent variables revealed a significant difference for DT, F(1, 22) =
6.83, p< .05, and RT,F(1, 22) = 10.15, p« .01. There wereno differences between groups on the MT variable, F(l,22) = .72, r> .05.3. Pearson product-moment correlations revealed thefollowing between the four dependent variables: IT-MT,r(24) = -.38, p» .05; IT-RT, r(24) = .99, p< .0001; IT-ACC,r(24) = .73, P< .0001; MT-RT, r(24) = -.30, P< .05; MTACC, r(24) = -.35, P< .05; RT-ACC, r(24) = .72, P< .0001,and where IT = initiation time, MT = movement time,RT = response time, and RA = response accuracy.4. Differences in performance on the two-choice reaction time (CRT) test were examined using a one-wayMANOVA in which Group (experienced-less experienced) was the between-subjects factor and DT, MT, andRT the dependent variables. The results showed no significant difference in performance between groups,Wilks' A = .96, F(3, 20) = .25, p » .05.5. Pearson product-moment correlations revealed thefollowing correlations between the four dependent variables: IT-MT, r(24) = -.20, p » .05; IT-RT, r(24) = .95, P<.0001; IT-ACC, r(24) = .08, p » .05; MT-RT, r(24) = .11, P> .05; MT-ACC, r(24) = -.16, p» .05; RT-ACC, r(24) = .10,r> .05; and where IT = initiation time, MT = movementtime, RT = response time, and RA = response accuracy.6. Pearson product-moment correlations revealed thefollowing correlations between the dependent variables:El RT-ACC, r(24) = .53, P< .01; E2 RT-ACC, r(24) = .54,P< .01; and where RT = response time, RA = responseaccuracy, El = occlusion of irrelevant display areas, E2 =
occlusion of areas other than the ball-ball passer.7. Pearson product-moment correlations revealed thefollowing correlations between the dependent variables:El RT-ACC, r(24) = .38, p » .05; E2 RT-ACC, r(24) = .61,p< .01; E3 RT-ACC, r(24) = .42, p< .05; E4 RT-ACC, r(24)= .01, p> .05; and where RT = response time, RA = response accuracy, El = occlusion of head and shoulders,E2 = occlusion of hip region, E3 = occlusion of lower legand ball, E4 = occlusion of an irrelevant display area.
Authors' Note
Please address all correspondence concerning this articleto A. M. Williams, Research Institute for Sport and Exercise Science, School of Human Sciences, LiverpoolJohnMoores University, Mountford Building, Byrom Street,Liverpool, L3 3AF, UK.
E-mail: [email protected]
ROES: June 1998
Dow
nloa
ded
by [
Nor
th C
arol
ina
Stat
e U
nive
rsity
] at
21:
17 1
9 A
ugus
t 201
3