visual experience of 3d tv - tu/ealexandria.tue.nl/extra2/200610884.pdfthe introduction of 3d-tv is...
TRANSCRIPT

Visual Experience of 3D TV
Pieter J.H. Seuntiens

The work described in this thesis has been carried out atthe Eindhoven University of Technology and Philips ResearchEindhoven, the Netherlands.
Printing: Eindhoven University Press FacilitiesOmslagontwerp: Oranje VormgeversFoto: Xmoix
c© P.J.H. Seuntiens, 2006.
CIP-DATA LIBRARY TECHNISCHE UNIVERSITEIT EINDHOVEN
Visual Experience of 3D TV / by Petrus Johannes Hendrikus Seuntiens -Eindhoven: Technische Universiteit Eindhoven, 2006. - Proefschrift.-ISBN 90-386-0705-9ISBN 978-90-386-0705-4NUR 778Keywords: 3D television / visual experience / image quality

Visual Experience of 3D TV
PROEFSCHRIFT
ter verkrijging van de graad van doctor aan deTechnische Universiteit Eindhoven, op gezag van deRector Magnificus, prof.dr.ir. C.J. van Duijn, voor een
commissie aangewezen door het College voorPromoties in het openbaar te verdedigen
op dinsdag 13 juni 2006 om 16.00 uur
door
Petrus Johannes Hendrikus Seuntiens
geboren te Eindhoven

Dit proefschrift is goedgekeurd door de promotoren:
prof.dr. D.G. Bouwhuisenprof.dr. I.E.J. Heynderickx
Copromotor:dr. W.A. IJsselsteijn

Contents
1 Introduction 1
1.1 Aim of this thesis . . . . . . . . . . . . . . . . . . . . . . . . 1
1.2 Human Vision . . . . . . . . . . . . . . . . . . . . . . . . . . 2
1.3 3D-TV broadcast system . . . . . . . . . . . . . . . . . . . . 6
1.3.1 Content generation . . . . . . . . . . . . . . . . . . . 6
1.3.2 Compression and transmission . . . . . . . . . . . . 8
1.3.3 Stereoscopic and auto-stereoscopic displays . . . . 9
1.4 Subjective assessment methods . . . . . . . . . . . . . . . . 14
1.4.1 Explorative studies . . . . . . . . . . . . . . . . . . . 15
1.4.2 Direct scaling paradigms . . . . . . . . . . . . . . . 15
1.5 Image Quality . . . . . . . . . . . . . . . . . . . . . . . . . . 17
1.5.1 Image Quality Modeling . . . . . . . . . . . . . . . . 18
1.5.2 Engeldrum’s Image Quality Model . . . . . . . . . . 19
1.5.3 3D Image Quality . . . . . . . . . . . . . . . . . . . . 21
1.6 New concepts . . . . . . . . . . . . . . . . . . . . . . . . . . 22
1.6.1 Presence . . . . . . . . . . . . . . . . . . . . . . . . . 22
1.6.2 Naturalness . . . . . . . . . . . . . . . . . . . . . . . 23
1.6.3 Viewing experience . . . . . . . . . . . . . . . . . . . 24
1.7 Overview of this thesis . . . . . . . . . . . . . . . . . . . . . 25
v

Contents
2 Exploration of new evaluation concepts for 3D-TV 27
2.1 Introduction . . . . . . . . . . . . . . . . . . . . . . . . . . . 28
2.2 Experiment 1 . . . . . . . . . . . . . . . . . . . . . . . . . . . 28
2.2.1 Method . . . . . . . . . . . . . . . . . . . . . . . . . . 29
2.2.2 Results . . . . . . . . . . . . . . . . . . . . . . . . . . 32
2.3 Experiment 2 . . . . . . . . . . . . . . . . . . . . . . . . . . . 34
2.3.1 Method . . . . . . . . . . . . . . . . . . . . . . . . . . 35
2.3.2 Results . . . . . . . . . . . . . . . . . . . . . . . . . . 39
2.3.3 Discussion . . . . . . . . . . . . . . . . . . . . . . . . 42
2.4 Conclusion . . . . . . . . . . . . . . . . . . . . . . . . . . . . 43
3 Perceived quality of JPEG coded 3D images 45
3.1 Introduction . . . . . . . . . . . . . . . . . . . . . . . . . . . 46
3.1.1 Asymmetric coding and perceived image quality . 46
3.1.2 Perceived depth . . . . . . . . . . . . . . . . . . . . . 47
3.1.3 Perceived sharpness . . . . . . . . . . . . . . . . . . 48
3.1.4 Perceived eye-strain . . . . . . . . . . . . . . . . . . 49
3.2 Experiment 3 . . . . . . . . . . . . . . . . . . . . . . . . . . . 49
3.2.1 Method . . . . . . . . . . . . . . . . . . . . . . . . . . 50
3.2.2 Results . . . . . . . . . . . . . . . . . . . . . . . . . . 54
3.2.3 Discussion . . . . . . . . . . . . . . . . . . . . . . . . 65
3.3 Experiment 4 . . . . . . . . . . . . . . . . . . . . . . . . . . . 67
3.3.1 Method . . . . . . . . . . . . . . . . . . . . . . . . . . 67
3.3.2 Results . . . . . . . . . . . . . . . . . . . . . . . . . . 69
3.4 Conclusion . . . . . . . . . . . . . . . . . . . . . . . . . . . . 72
4 Perceptual attributes of crosstalk in 3D images 73
vi

Contents
4.1 Introduction . . . . . . . . . . . . . . . . . . . . . . . . . . . 74
4.2 Experiment 5 . . . . . . . . . . . . . . . . . . . . . . . . . . . 75
4.2.1 Method . . . . . . . . . . . . . . . . . . . . . . . . . . 76
4.2.2 Results . . . . . . . . . . . . . . . . . . . . . . . . . . 79
4.2.3 Discussion . . . . . . . . . . . . . . . . . . . . . . . . 84
4.3 Experiment 6 . . . . . . . . . . . . . . . . . . . . . . . . . . . 87
4.3.1 Method . . . . . . . . . . . . . . . . . . . . . . . . . . 88
4.3.2 Results . . . . . . . . . . . . . . . . . . . . . . . . . . 91
4.4 Conclusion . . . . . . . . . . . . . . . . . . . . . . . . . . . . 95
5 Modeling the added value of 3D 97
5.1 Introduction . . . . . . . . . . . . . . . . . . . . . . . . . . . 98
5.2 Experiment 7 . . . . . . . . . . . . . . . . . . . . . . . . . . . 98
5.2.1 Method . . . . . . . . . . . . . . . . . . . . . . . . . . 98
5.2.2 Results . . . . . . . . . . . . . . . . . . . . . . . . . . 101
5.3 Towards a 3D Visual Experience model . . . . . . . . . . . 106
5.4 Conclusion . . . . . . . . . . . . . . . . . . . . . . . . . . . . 109
6 General Discussion 111
6.1 Main Conclusions . . . . . . . . . . . . . . . . . . . . . . . . 111
6.2 Adapted 3D Visual Experience model . . . . . . . . . . . . 113
6.3 Applicability of the 3D Visual Experience model . . . . . . 115
6.4 Future Research . . . . . . . . . . . . . . . . . . . . . . . . . 115
Bibliography 117
Samenvatting 125
vii

Contents
Summary 129
Acknowledgements 133
Biography 135
viii
Chapter 1
Introduction
1.1 Aim of this thesis
Since the introduction of television, much has been done to improve theoverall experience of viewers. Improvements in color, picture quality,sound quality, and increasing involvement based on larger screen sizeshave contributed to a better overall viewing experience. A logical nextstep is the introduction of three-dimensional television enabling peopleto watch their content in three dimensions. Proponents of 3D-TV have ar-gued that it will bring the viewer a whole new experience, a fundamentalchange in the character of the image, not just an enhancement of quality(IJsselsteijn, 2004; Smith and Dumbreck, 1988).
Comparisons between television sets are done quite regularly on percep-tual and/or technical aspects to determine where to put future invest-ments. The performance of a 3D television system is often evaluatedusing 2D image quality models as proposed by Engeldrum (2000). Ear-lier research in this area defined some dominant perceptual factors af-fecting 2D image quality, for instance, blur, brightness, color, blockiness,or noise. Psychophysical scaling experiments are used to quantify thestrengths of these artefacts. People use perceptual rules to combine themeasured strengths into a prediction of the overall image quality (de Rid-der, 1992). This thesis investigates whether 2D image quality models aresufficiently adequate to measure 3D quality because typical stereoscopicdistortions and the depth reproduction are not incorporated in 2D imagequality models.
1
1. Introduction
The aim of this thesis is to understand, measure and eventually, modeland predict the 3D ’Visual Experience’.
1.2 Human Vision
One of the major functions of our visual system is to construct a 3D repre-sentation of the world surrounding us. According to Marr (1982), ”visionis the process of discovering from images what is present in the world,and where it is”. The images on our retina are patterns of reflected lightfrom our environment, and to discover what is present, the visual systemrelies on internal representations. Since our world is three-dimensionalwe have to perceive all three dimensions in order to acquire a full rep-resentation of these relationships. The problem is however that externalspace is projected onto the retina of both eyes as two-dimensional im-ages. So the question arises, how is this transformation from two retinaltwo-dimensional images with a slightly different perspective to a three-dimensional representation of our environment achieved? The mecha-nism we use to reconstruct the three-dimensional world is referred to asstereopsis.
The sources of depth information can be divided in four categories(Palmer, 1999): ocular information (accommodation and convergence),stereoscopic information (binocular disparity), dynamic information (mo-tion parallax) and pictorial information (occlusion, relative size, etc.)
Ocular information
Two cues for depth perception are the convergence and accommodationof the eye. Convergence is related to the fixation of the eyes (binocu-lar information). If we look at an object nearby the eyes converge morethan they do if we look at an object far away. The accommodation of thelens is the process of focusing on an object (monocular information). Themuscles of the lens are relaxed when focusing on objects far away andcontracted when focusing on objects near by. Muscle tension of the eyein combination with the visual input are essential for depth perception.Although accommodation and convergence are not very strong sourcesof depth information, they are important at close distances for specifying
2

1.2. Human Vision
Figure 1.1: Horizontal separation of the eyes causes an interocular difference inthe relative projections of monocular images onto the left and right retina
the absolute distance of objects. The absolute distance is the perceiveddistance from observer to objects.
Stereoscopic information
Perhaps the richest source of depth information comes from stereopsis.Due to the fact that our eyes are separated by 6.3 cm on average (Dodg-son, 2004), each eye receives a slightly different perspective of the samescene (Figure 1.1). The brain fuses these two images, and because each im-age is slightly displaced with respect to the other - a phenomenon knownas retinal disparity - the relative (perceived distance between objects) andabsolute depths (perceived distance from observer to objects) of objects inspace are perceived. The ability of the brain to perform these computa-tions is referred to as stereopsis.
3

1. Introduction
Dynamic information
Dynamic information occurs with a change in visual structure over timebecause of image motion or optic flow. Depth information about a scenebecomes available when observers move with respect to the scene (mo-tion parallax). The motion parallax cue provides depth information be-cause image points at different distances from the observer move at dif-ferent retinal velocities as the observer moves. Objects that are closer willmove faster than objects that are further away.
Pictorial information
Although ocular, stereoscopic, and dynamic information produce a com-pelling sense of depth, pictorial information is very powerful because itprovides a good depth perception of static and monocularly viewed pic-tures. If you close one eye and keep your head still, the world still looksthree-dimensional.
The most powerful monocular cue is occlusion (Figure 1.2, panel a). Oc-clusion occurs when an object is partly hidden by another object and tellsus that the hidden object is further away. Relative size refers to the factthat objects of similar size produce smaller retinal images when placedfurther away (Figure 1.2, panel b). The height in the visual field cue refersto the fact that objects below the horizon, appear closer to the observer asthey are positioned lower in the visual field. Objects above the horizonappear to be closer as they are positioned higher in the visual field (Fig-ure 1.2, panel b). The shading cue provides information about the shapeof an object and occurs because not all parts of an object reflect the sameamount of light (Figure 1.2, panel c).
The aerial perspective cue arises because the air contains microscopic par-ticles of dust and moisture that make distant objects look less saturatedand less sharp. The more atmospheric particles between the viewer and adistant object the more light that is scattered (Figure 1.3, panel a). Linearperspective refers to the fact that parallel lines, such as railroad tracks,appear to converge with distance, eventually reaching a vanishing pointat the horizon. The more the lines converge, the farther away they appear(Figure 1.3, panel b).
4

1.2. Human Vision
Figure 1.2: Monocular cues providing depth information of objects in a scene:occlusion (a), relative size, height in the visual field (b), and shading (c).
(a) (b)
Figure 1.3: Monocular cues providing depth information of objects in a scene:aerial perspective (a) and linear perspective (b).
5

1. Introduction
So, it may be clear that depth perception is a result of many contribut-ing processes, which vary in their degree of cognitive complexity. Apartfrom the stereopsis mechanism, which can be considered as a relativelylow-level computation producing basic surface layout information, thereare many higher cognitive functions involved in the interpretations of thevarious monocular cues, which also affect the way we perceive depth.Even such high cognitive functions as expectations, reasoning and mem-ory or knowledge about objects and the world affect the way we interpretthe depth of a visual scene (Mansson, 1998).
1.3 3D-TV broadcast system
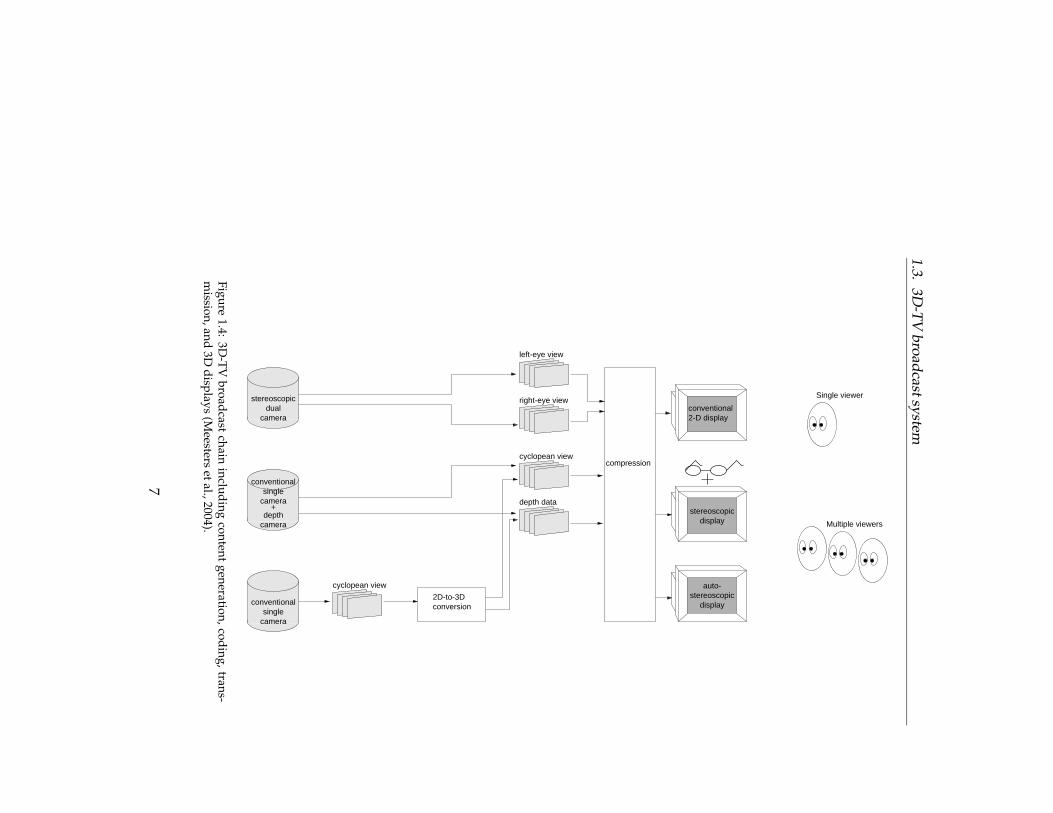
The introduction of 3D-TV is becoming increasingly feasible because ofrecent technologies and breakthroughs in image processing, display de-sign and camera development as well as an improved understandingof 3D human factors. For a successful implementation, the 3D technol-ogy should be backward compatible with existing conventional broadcasttelevision to ensure a gradual transition from one system to the other. Fig-ure 1.4 presents a 3D-TV broadcast chain (IST-ATTEST project approach)starting from content generation and coding schemes for efficient trans-mission to adequate displays presenting a high-quality 3D picture.
1.3.1 Content generation
By far the most 3D material has been shot using a dual-camera configura-tion. In general, two systems can be distinguished: 1) the parallel configu-ration and 2) the toed-in configuration. An important difference betweenboth configurations is that for a parallel camera configuration, depth isconveyed exclusively by crossed disparities (objects appear closer to theviewer compared to the fixation point), because the zero-disparity pointis located at infinity. Therefore, binocular disparities for objects near thecamera (within 2 meters) can be very large and cause visual discomfort.For a toed-in configuration, the zero-disparity point is at a finite distance,so depth is conveyed by both crossed and uncrossed disparities (objectsappear closer and further away compared to the fixation point). Con-sequently, the same depth range is distributed among crossed and un-
6
1.3.3D
-TV
bro
adcast
system
cyclopean view
cyclopean view
left-eye view
right-eye view
Multiple viewers
Single viewer
2D-to-3Dconversion
compression
depth data
conventional2-D display
camerasingle
conventional
+
cameradepth
camera
stereoscopic
conventionalsingle
cameradual
stereoscopic
displaystereoscopic
display
auto-
Fig
ure
1.4:3D
-TV
bro
adcast
chain
inclu
din
gco
nten
tg
eneratio
n,
cod
ing
,tran
s-m
ission
,and
3Dd
isplay
s(M
eesterset
al.,2004).
7

1. Introduction
crossed disparities for the toed-in configuration resulting in a smaller ab-solute disparity compared to the parallel configuration (Stelmach et al.,2003). However, converging cameras introduce keystone distortions ofopposite sign resulting in vertical disparities which are greatest in the cor-ners of the image. So, using a converging camera configuration involvesa trade off between reduced binocular disparities for objects located nearthe camera on the one hand (less visual discomfort) and the introductionof vertical disparities on the other hand (more visual discomfort).
The short-term need for 3D-video content can only partially be satisfiedwith newly recorded material. Therefore, 2D-3D conversion algorithmsare being developed to convert existing 2D-video material into 3D. Con-version of existing 2D video material is a challenging task, because ofproblems with pixel-accurate automatic video segmentation.
1.3.2 Compression and transmission
The storage and transmission of stereoscopic image material involves alarge amount of data because one stereoscopic image consists of multipleviews. Therefore, a considerable research effort is focused on realizingdigital image compression (such as JPEG or MPEG coding) to obtain sav-ings in bandwidth and storage capacity. This is of particular relevancein the case of stereoscopic HDTV, where a single uncompressed HDTVchannel may cost up to one Gbit/s transmission bandwidth, or in thecase of stereoscopic video transmission over low-bandwidth transmissionchannels, such as the Internet (Johanson, 2001). In terms of compatibilitywith current existing broadcast systems, a double bandwidth would beneeded for transmitting the left- and right eye view of a dual camera.The use of a depth range camera (Axi-Vision by NHK, Z-cam by 3DVSystems) registering the RGB image and accompanying depth value perpixel overcomes this bandwidth problem. Although this is a promisingcamera technique, there are still some challenges to recover the left andright-eye view correctly from the RGB-depth video material. The goal isto achieve a video data format that is compatible with traditional codingstandards (MPEG-2/4/7) and 2D TV-sets as well as suited for novel 3DTV applications.
8
1.3. 3D-TV broadcast system
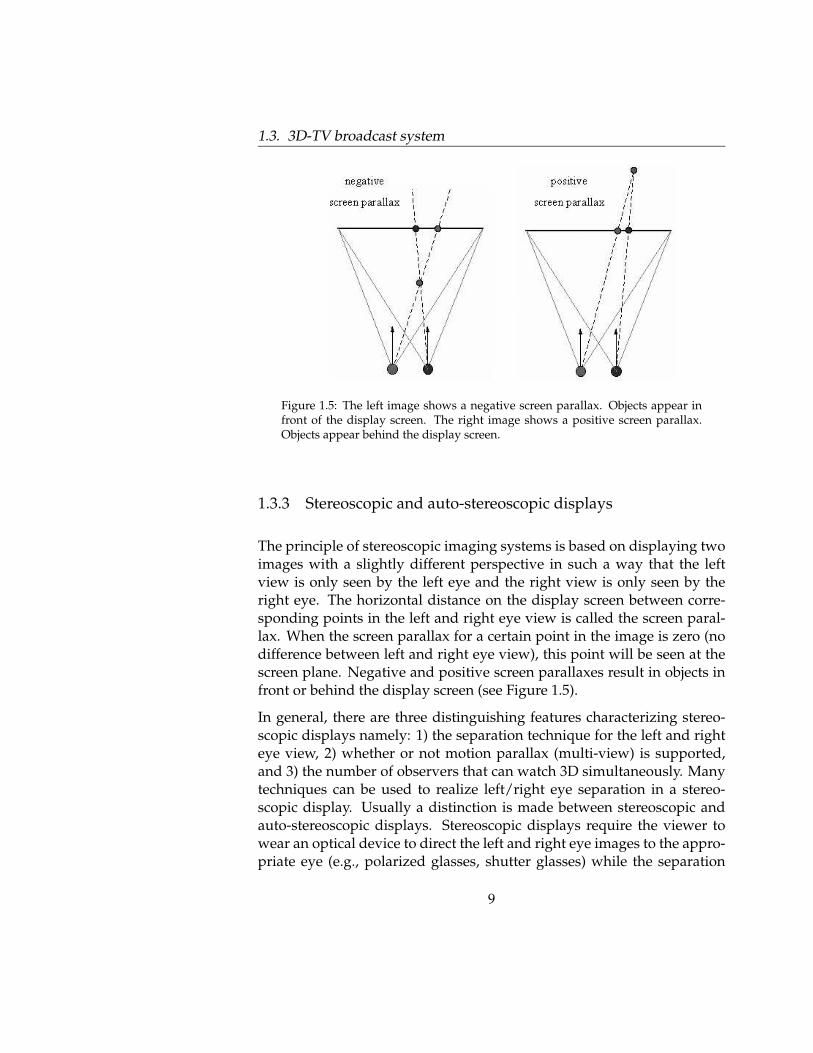
Figure 1.5: The left image shows a negative screen parallax. Objects appear infront of the display screen. The right image shows a positive screen parallax.Objects appear behind the display screen.
1.3.3 Stereoscopic and auto-stereoscopic displays
The principle of stereoscopic imaging systems is based on displaying twoimages with a slightly different perspective in such a way that the leftview is only seen by the left eye and the right view is only seen by theright eye. The horizontal distance on the display screen between corre-sponding points in the left and right eye view is called the screen paral-lax. When the screen parallax for a certain point in the image is zero (nodifference between left and right eye view), this point will be seen at thescreen plane. Negative and positive screen parallaxes result in objects infront or behind the display screen (see Figure 1.5).
In general, there are three distinguishing features characterizing stereo-scopic displays namely: 1) the separation technique for the left and righteye view, 2) whether or not motion parallax (multi-view) is supported,and 3) the number of observers that can watch 3D simultaneously. Manytechniques can be used to realize left/right eye separation in a stereo-scopic display. Usually a distinction is made between stereoscopic andauto-stereoscopic displays. Stereoscopic displays require the viewer towear an optical device to direct the left and right eye images to the appro-priate eye (e.g., polarized glasses, shutter glasses) while the separation
9

1. Introduction
technique used in auto-stereoscopic displays is integrated in the displayscreen. In both stereoscopic and auto-stereoscopic displays, perfect sep-aration of the left and right eye view is one of the major challenges fordisplay designers. An overview of the different types of stereo displaysavailable can be found in Sexton and Surman (1999) and Schreer et al.(2005). In this thesis, three different types of stereoscopic imaging sys-tems are used to carry out the experiments, which will be discussed next.
Philips multi-view auto-stereoscopic display
The first display system is the 20” Philips multi-view auto-stereoscopicdisplay using a lenticular lens to separate the left- and right-eye view(van Berkel and Clarke, 1997). The advantage of this display, besides 3Dviewing without glasses, is the support of motion parallax enabling theviewers to look around objects by moving their head. Figure 1.6 showsthe basic principle of the display system. Figure 1.6a shows an observerwatching a set of objects. The left and right eye both receive a differentview of the scene. By moving their head, observers receive other viewsof the scene enabling them to see a potentially infinite number of views.Figure 1.6b shows the same viewing window, but this time divided intoa finite set of horizontal frames. Each eye receives a view from a singleframe, thereby preserving the effect of motion parallax, but with a re-duced number of views. Nine different views are recorded and integratedin the multi-view auto-stereoscopic display (Figure 1.6c and 1.6d).
A set of nine successive views is called a viewing zone and repetition ofthis viewing zone enables multiple viewers to watch 3D. Figure 1.7 showsthree zones consisting of nine views each. The resolution of the two 3Dmulti-view displays available was 1600x1200 pixels and the optics wereoptimized for a viewing distance of 0.4 and 1.5 meters, respectively.
AEA-Technology polarized stereoscopic display
The second stereoscopic display used in one of the experiments was de-veloped by AEA-Technology (AEAT). The AEAT system consists of twoBarco CPM 2053FS CRT color monitors mounted perpendicular to eachother (see Figure 1.8). The dual monitor system displayed the right andleft image at the same time using a half see-through mirror and a polar-
10

1.3. 3D-TV broadcast system
Figure 1.6: Basic principle of a multi-view auto-stereoscopic display. Panel (a)shows an observer watching a set of objects. The viewing window is dividedin nine different perspective views in panel (b). The nine different views wererecorded using nine different cameras as shown in panel (c). The screen displaysthe nine different views in a viewing zone in panel (d).
11

1. Introduction
Figure 1.7: Three viewing zones consisting of nine different perspective viewseach. The repetition of viewing zones enables multiple viewing.
ization filter in front of each screen. The observers wore polarized glassesin order to provide left-right separation with very little crosstalk in thestereo pair. The linear polarized filters contained less than 0.1% crosstalk(Pastoor and Wopking, 1997). A SUN ISP system provided the CRT mon-itors with a video signal. Custom built software was used to synchronizethe output of the 2 codecs transferring the images.
Screenscope mirror stereoscope
The ScreenscopeTM (mirror stereoscope) was used to direct the left- andright-eye image of a side-by-side displayed stereo pair to the appropri-ate eye. The Screenscope was attached to the computer screen as shownin Figure 1.9. This system is location multiplexed thus containing zerocrosstalk, allowing us to have complete experimental control. This is notthe case with systems based on, e.g., shutter glasses (time-multiplexed) orpolarized glasses (polarization-multiplexed), where crosstalk is intrinsicto the system.
The principle of the Screenscope viewer (see Figure 1.10) is based on theWheatstone stereoscope (Wheatstone, 1838). The only difference between
12

1.3. 3D-TV broadcast system
Figure 1.8: The AEAT system consisting of two Barco CRT monitors displayingthe left and right eye images at the same time. The polarized glasses are used toseparate the left and right views.
Figure 1.9: ScreenscopeTMattached to a PC monitor with a light source in thebackground. The monitor shows a stereoscopic test pattern illustrating the ap-proximate size of the natural stimuli that were employed.
13

1. Introduction
left eye view
2 mirrors2 mirrors
stereoscopic image
Displayright eye view
eyes observer
Figure 1.10: Principle of the ScreenscopeTMstereo viewer based on the Wheat-stone construction. The difference is that this system uses four mirrors insteadof two.
these systems is that a Wheatstone stereoscope uses two mirrors and theScreenscope uses four mirrors. In a traditional Wheatstone set-up, thestereograms must be produced as mirror images on the monitor, whichis not the case with the Screenscope due to the extra set of mirrors. Theviewing distance from the Screenscope to the CRT screen was 30 cm (threetimes stimulus height).
1.4 Subjective assessment methods
Subjective assessment methods for evaluation of 2D and 3D televisionsystems are a necessity to compare competitive systems and monitor ap-plications. Standardized methods to quantify perceptual attributes suchas perceived image quality, depth, and sharpness enable engineers to op-timize their display systems. Subjective assessment methods use a humanbeing as the measuring instrument to determine the quality of a displaysystem. These methods are often viewed as inferior measurement meth-ods compared to objective methods (physical measures). This may be truefrom a precision or accuracy point of view, but it misses the fundamen-tal point that humans are the customers of the imaging systems, so their
14
1.4. Subjective assessment methods
view on image quality is the correct one. Therefore, subjective assessmentmethods for perceptual evaluation of monoscopic and stereoscopic tele-vision pictures, such as described in recommendations of the ITU (2000a)and ITU (2000b), are widely accepted. Assessment methods used to eval-uate new imaging systems like 3D TV can be divided in explorative stud-ies and direct scaling paradigms.
1.4.1 Explorative studies
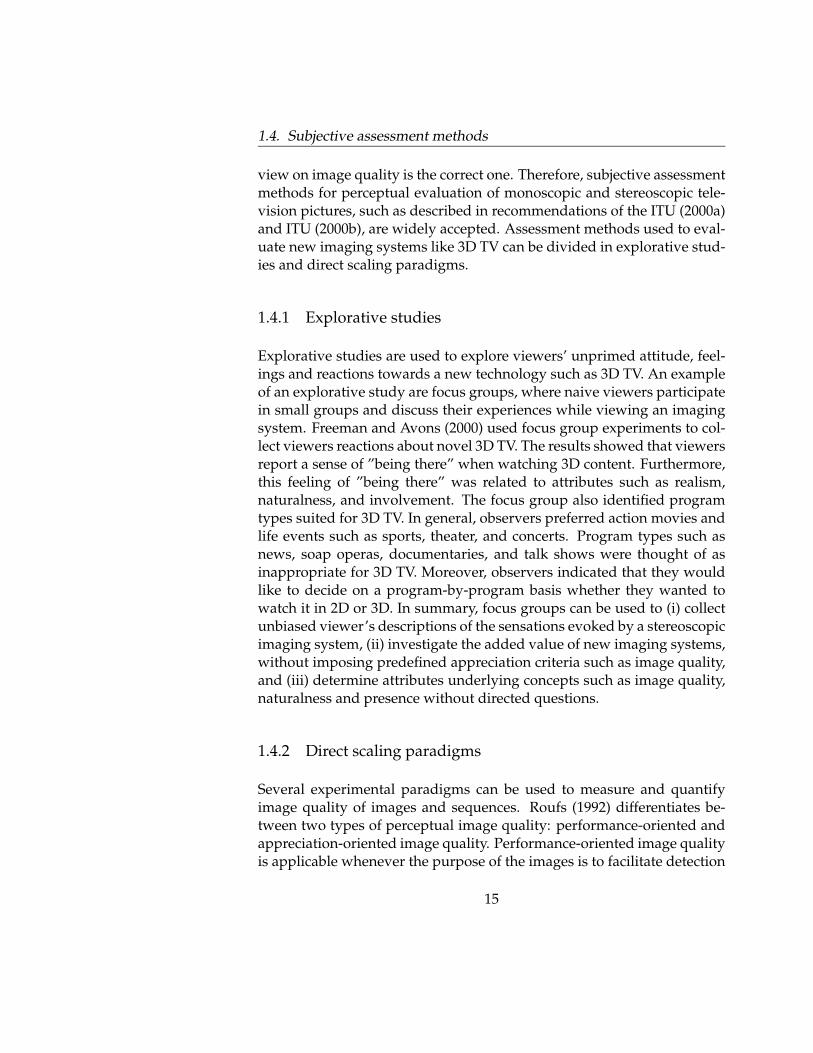
Explorative studies are used to explore viewers’ unprimed attitude, feel-ings and reactions towards a new technology such as 3D TV. An exampleof an explorative study are focus groups, where naive viewers participatein small groups and discuss their experiences while viewing an imagingsystem. Freeman and Avons (2000) used focus group experiments to col-lect viewers reactions about novel 3D TV. The results showed that viewersreport a sense of ”being there” when watching 3D content. Furthermore,this feeling of ”being there” was related to attributes such as realism,naturalness, and involvement. The focus group also identified programtypes suited for 3D TV. In general, observers preferred action movies andlife events such as sports, theater, and concerts. Program types such asnews, soap operas, documentaries, and talk shows were thought of asinappropriate for 3D TV. Moreover, observers indicated that they wouldlike to decide on a program-by-program basis whether they wanted towatch it in 2D or 3D. In summary, focus groups can be used to (i) collectunbiased viewer’s descriptions of the sensations evoked by a stereoscopicimaging system, (ii) investigate the added value of new imaging systems,without imposing predefined appreciation criteria such as image quality,and (iii) determine attributes underlying concepts such as image quality,naturalness and presence without directed questions.
1.4.2 Direct scaling paradigms
Several experimental paradigms can be used to measure and quantifyimage quality of images and sequences. Roufs (1992) differentiates be-tween two types of perceptual image quality: performance-oriented andappreciation-oriented image quality. Performance-oriented image qualityis applicable whenever the purpose of the images is to facilitate detection
15

1. Introduction
tasks, for instance, medical diagnosing. The purpose of those images isto give accurate information. In appreciation-oriented applications, suchas 3D TV, the goal is to display 3D images as ”pleasing” as possible. Forinstance, excessive disparities result in visual discomfort and viewers ex-perience this as unpleasant. The subjective assessment of appreciation-oriented applications, such as 3D TV, is described in the ITU-R BT.1438recommendation for stereoscopic television pictures (ITU, 2000b). Theseassessment methods are adopted from the ITU-R BT500.10 recommen-dation for conventional 2D TV (ITU, 2000a). The proposed methods areused to measure overall image quality and overall image impairment ofdistorted still images and image sequences. The methods can also beapplied to obtain ratings for attributes such as sharpness, depth, eye-strain, naturalness, or presence. In general three different experimentalparadigms are proposed: the double-stimulus methods, single-stimulusmethods and stimulus-comparison methods.
Double stimulus methods
In the double-stimulus-continuous-quality-scale approach (DSCQS), ob-servers assess the overal image quality for a series of image pairs, eachconsisting of an undistorted image (reference) and a distorted image(test). Observers are asked to assess the overall image quality of both(reference and test) resulting eventually in difference scores between ref-erence and test image. In DSCQS, a continuous graphical scale (labeledwith verbal terms excellent - good - fair - poor - bad) is used to avoidforcing observers to answer within too coarse a category. In the double-stimulus-impairment scale method (DSIS), again a series of stereoscopicimages are presented in time (reference + test), however, observers areasked to judge only the impairments in the test image taking in mind thereference. The scale used during impairment scaling is labeled with theverbal terms imperceptible - perceptible, but not annoying - slightly an-noying - annoying - very annoying.
Single stimulus methods
In single-stimulus (SS) methods, the subject assesses each image in thestimulus set individually. In case of a sequence, the subject provides a
16

1.5. Image Quality
score for the entire presentation. Also SS-methods can be applied on bothquality scaling and impairment scaling using corresponding rating scales.
Stimulus comparison methods
Stimulus comparison methods assign a relation between two images orsequences. The comparison scale used during an experiment is labeledwith the verbal terms much worse - worse - slightly worse - the same -slightly better - better - much better.
In the context of 3D-TV, an alternative assessment method (single-stimulus-continuous-quality-evaluation) was proposed to obtain continu-ous quality judgements of longer stereoscopic sequences moving a hand-held slider. IJsselsteijn et al. (1998b) used this method to continuouslyassess observer’s sense of presence, depth and naturalness watching 3D-TV over a longer period of time. This method seems very appropriatebecause normally television is watched for longer periods and it mimicshome viewing conditions.
1.5 Image Quality
Image quality can be regarded as one of the most important considera-tions of customers in purchasing an imaging or display product, alongwith purchase factors such as costs. Achieving good image quality re-quires extensive research in content generation, coding algorithms, trans-mission and display technology. Therefore, it is important to connect thepreferences of customers to the technological parameters of the displaysystem. Perceived 3D image quality is one of the criteria to assess theoverall performance of new media such as 3D-TV. However, subjectivetesting is time-consuming and needs to be repeated for each new param-eter setting. Therefore, quality models are needed to obtain a better un-derstanding of the relationship between technical system parameters andperceived 3D image quality. For conventional imaging systems, imagequality models have been proposed to predict 2D image quality. Nev-ertheless, a better understanding is needed of the relationship betweensystem parameters and perceptual factors contributing to the overall per-ceived 3D image quality. The principles of modeling 2D image quality
17
1. Introduction
can be used to gain insight into the relationship between 3D-TV systemparameters and 3D image quality.
1.5.1 Image Quality Modeling
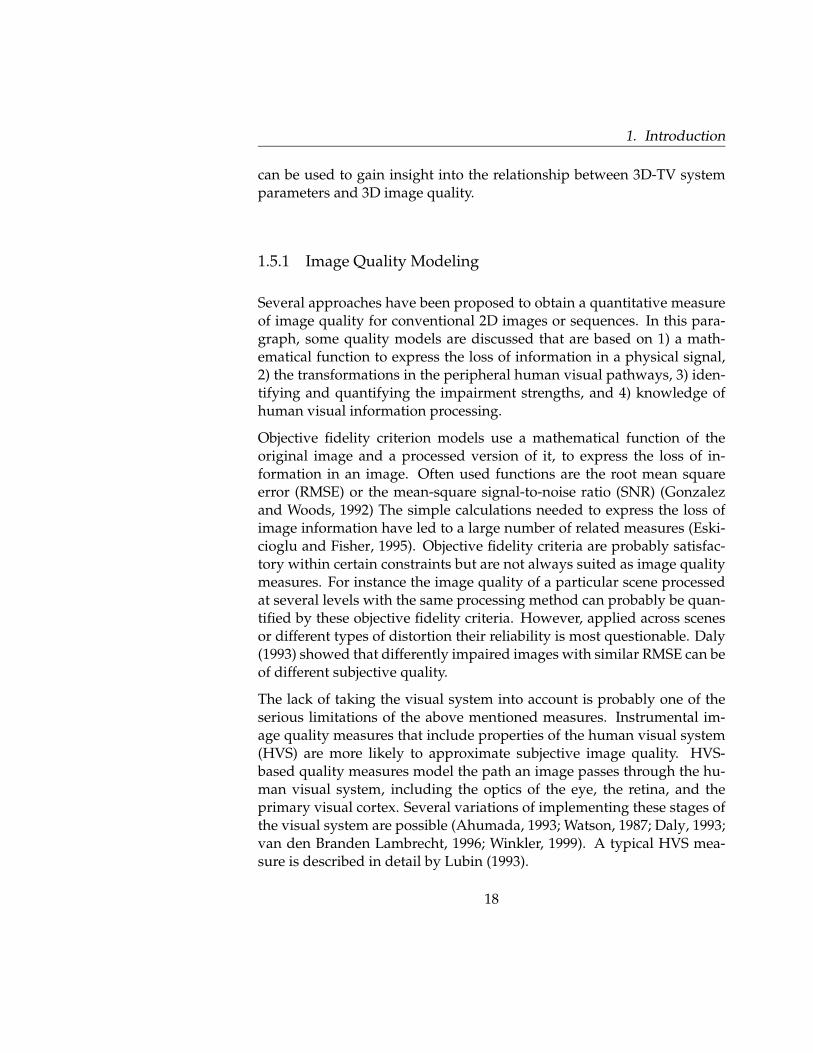
Several approaches have been proposed to obtain a quantitative measureof image quality for conventional 2D images or sequences. In this para-graph, some quality models are discussed that are based on 1) a math-ematical function to express the loss of information in a physical signal,2) the transformations in the peripheral human visual pathways, 3) iden-tifying and quantifying the impairment strengths, and 4) knowledge ofhuman visual information processing.
Objective fidelity criterion models use a mathematical function of theoriginal image and a processed version of it, to express the loss of in-formation in an image. Often used functions are the root mean squareerror (RMSE) or the mean-square signal-to-noise ratio (SNR) (Gonzalezand Woods, 1992) The simple calculations needed to express the loss ofimage information have led to a large number of related measures (Eski-cioglu and Fisher, 1995). Objective fidelity criteria are probably satisfac-tory within certain constraints but are not always suited as image qualitymeasures. For instance the image quality of a particular scene processedat several levels with the same processing method can probably be quan-tified by these objective fidelity criteria. However, applied across scenesor different types of distortion their reliability is most questionable. Daly(1993) showed that differently impaired images with similar RMSE can beof different subjective quality.
The lack of taking the visual system into account is probably one of theserious limitations of the above mentioned measures. Instrumental im-age quality measures that include properties of the human visual system(HVS) are more likely to approximate subjective image quality. HVS-based quality measures model the path an image passes through the hu-man visual system, including the optics of the eye, the retina, and theprimary visual cortex. Several variations of implementing these stages ofthe visual system are possible (Ahumada, 1993; Watson, 1987; Daly, 1993;van den Branden Lambrecht, 1996; Winkler, 1999). A typical HVS mea-sure is described in detail by Lubin (1993).
18

1.5. Image Quality
A different technique to model image quality is based on identifyingthe underlying attributes of image quality and quantifying the perceivedstrengths of each attribute. For this approach, descriptions of the subjec-tive attributes, such as noise, blur or blockiness, as well as their techni-cal characterization are needed (Karunasekera and Kingsbury, 1995; Ka-yargadde and Martens, 1996b; Libert and Fenimore, 1999). To relate theattribute strengths to overall image quality, different combination rulescan be used (de Ridder, 1992). The attribute strengths can be quantifiedfrom the reference image, usually the original, and a processed version ofit (Karunasekera and Kingsbury, 1995). At present, much effort is spenton developing single-ended measures, which quantify the degree of im-pairment directly from the processed image and do not require an originalimage. For example, estimation algorithms based on the Hermite trans-form were used to estimate the perceptual strength of blur and noise orblockiness directly from the processed image (Kayargadde and Martens,1996a; Meesters, 2002).
Another approach is to consider image quality in terms of the adequacyof the image to enable humans to interact with their environment. In thissense image quality is related to terms like usefulness and naturalness, ex-pressing the precision of the internal image representation and its matchto the description stored in memory, respectively. To quantify the imagequality attributes usefulness and naturalness, measures of discriminabil-ity and identifiability were used (Janssen and Blommaert, 2000).
1.5.2 Engeldrum’s Image Quality Model
One of the criteria to evaluate the performance of an imaging system isto assess the perceived image quality. 2D image quality is considered tobe a multidimensional construct and is affected by several technical para-meters. Modeling 2D image quality starts with defining the most impor-tant attributes influencing image quality, for instance, blockiness, bright-ness, noise, color rendering, and blur. Adequate assessment methodsto define such attributes are for instance focus groups. Subsequently,the strength of those attributes is measured with psychophysical scalingmethods as defined by the ITU. People use perceptual combination rulesto combine the strengths of these attributes and finally come to a pre-diction of the overall 2D image quality. This relation between technical
19

1. Introduction
Figure 1.11: Image Quality Circle originally proposed by Engeldrum (2000,2004).
system parameters and the customer’s quality rating is described in theImage Quality Model (Figure 1.11) proposed by Engeldrum (2004), basedon his earlier work in Engeldrum (2000).
The four elements in the Image Quality Circle break down the model inmeasurable and definable steps. Customer quality ratings reflect the cus-tomer’s judgement about the overall image quality. The technologicalparameters are a set of elements that the imaging system designer ma-nipulates to change the image quality. Physical image parameters are themeasurable properties of the display that are normally ascribed to imagequality, such as optical density, spectral reflectance or color. Customerperceptions such as, e.g., sharpness, darkness, and graininess form thebasis of the quality rating or judgment by the customer. The direct linkbetween technological parameters and the customer quality rating (arrow1) is inefficient over time because customers have to judge the quality overand over again every time a technical parameter is changed.
2D image quality models are not adequate to measure 3D visual experi-
20
1.5. Image Quality
ence since depth reproduction, the most important factor in 3D-TV, andtypical stereoscopic distortions (for instance crosstalk, or image ghosting)are not incorporated. So, a 3D visual experience model is required that ismultidimensional, incorporating perceptual factors related to reproduceddepth, 3D image impairments, and visual comfort.
1.5.3 3D Image Quality
No comprehensive 3D visual experience model has been formulated todate, yet it is likely that a diverse set of image attributes contributes tothe overall perceived quality of 3D-TV images. Some attributes will havea positive contribution to the overall image quality (e.g., increased depthsensation, or increased sharpness), while others may have a limiting ornegative effect (e.g., visual discomfort due to exaggerated disparities, orimage distortions). An appropriate 3D visual experience model will ac-count for both positive and negative factors, allowing for a weighting ofthe attributes based on perceptual importance, and for interactions thatmay occur as a consequence of (potentially asymmetric) binocular combi-nations. For example, a 3D distortion like crosstalk becomes more visiblewith increasing left-right image separation, a manipulation that also in-creases perceived depth. In such a case the perceptual benefit of increaseddepth can be nullified by the perceptual cost of increased crosstalk. Theinteractions between such positive and negative contributions, and theirrelative weighting deserve further study, in order to arrive at a more com-plete understanding of 3D visual experience. The 3D visual experience isa trade off between positive and negative factors and should thereforecontain the attributes image quality, depth and visual comfort (see Fig-ure 1.12). The added value of depth needs to be incorporated in a 3Dvisual experience model, especially when 2D picture quality is used asreference (Schreer et al., 2005). IJsselsteijn et al. (2000c) already demon-strated the added value of depth for uncompressed stereoscopic images.Other research, however, showed that when observers were asked to ratethe perceived image quality of MPEG-2 and JPEG compressed images,the image quality results were mainly determined by the introduced im-pairments and not so much by depth (Tam et al., 1998). In this thesis newconcepts are explored and it is investigated wether they respond sensi-tively to the added value of depth when 2D or 3D distortions are presentin the image material. The new concepts are explained in the next section.
21

1. Introduction
3D “Visual Experience”
ImageQuality Depth
VisualComfort
Figure 1.12: Proposed 3D ”Visual Experience” model with underlying attributesimage quality, depth and visual comfort.
1.6 New concepts
1.6.1 Presence
Witmer and Singer (1998) defined the concept presence as the subjectiveexperience of being in one place or environment even when one is sit-uated in another. Presence is also referred to as an unremarked sense of”being there and reacting to” in a mediated environment (IJsselsteijn et al.,2000a; Slater et al., 2002). Today, the construct of presence is of particularinterest because it has potential relevance for the design and evaluation ofinteractive and non-interactive media. For instance, new broadcast anddisplay developments such as 3D-TV give more sensory information tothe viewer than conventional flat 2D-TV. The addition of binocular depthin 3D-TV gives people a higher sense of ”being there” in a displayed 3Dscene. As the sense of presence increases, people become more aware ofthe mediated environment, and less aware of the environment in whichthey are physically located. Freeman and Avons (2000) performed an ex-plorative study, discussed earlier, using focus groups to explore viewers’reactions to conventional 2D-TV and novel 3D-TV. The results showedthat non-expert viewers reported sensations of presence with respect tostereoscopic sequences. Furthermore, this sense of presence was relatedto attributes such as involvement, realism, and naturalness. IJsselsteijnet al. (1998b) first applied the concept of presence to 3D-TV research. They
22

1.6. New concepts
concluded that an increase in sensory information, through the additionof stereoscopic and motion parallax cues, may enhance the viewers’ senseof presence. However, when image material became unnatural the senseof presence directly decreased. Other research revealed that moving se-quences in contrast to still scenes had a large significant effect on presenceratings, however, the significant effect of dimension (2D/3D) on presenceratings was relatively small (IJsselsteijn et al., 2001). Therefore, it seemsthat presence may be a useful concept for measuring the added value of3D stereoscopic moving sequences, at least for distortion-free image ma-terial.
1.6.2 Naturalness
Originally, the term naturalness was introduced to establish a criterionfor determining the perceived quality of color reproduction, especially incolor photography (Fedorovskaya et al., 1997). It has been proposed thatimages of good quality should at least be perceived as natural, implyinga strong relationship between perceived naturalness and the quality ofimages of real-life scenes. As support, a high correlation between qualityand naturalness judgments has been obtained (Fedorovskaya et al., 1997;de Ridder, 1996). This finding is consistent with other data (Laihanenet al., 1994) showing that the impression of naturalness of reproduced skincolors correlates positively with an improvement in image quality. IJssel-steijn et al. (2002) emphasize the relationship between perceived qualityand naturalness in the context of color rendering. They state that per-ceived quality does not necessarily mean a realistic or truthful reproduc-tion. The difference between naturalness and quality as a subjective eval-uation concept lies in the fact that naturalness refers to what observersperceive as a truthful representation of reality (i.e., perceptual realism),whereas perceived quality refers to a subjective preference scale. Researchon image quality in the color domain has shown that observers are able todifferentiate between the two concepts in an experimental situation, andan interesting relation between image quality and naturalness has beendemonstrated. For instance, de Ridder et al. (1995) and de Ridder (1996)found a small but systematic deviation between image quality and natu-ralness. This deviation was interpreted to reflect the observers preferencefor more colorful but, at the same time, somewhat unnatural images.
23

1. Introduction
Results in the area of stereoscopic image evaluation suggested a simi-lar relation between quality and naturalness. Observers preferred (i.e.judged of high quality) a reproduction of stereoscopic depth they alsojudged to be slightly unnatural (IJsselsteijn et al., 1998a, 2000c). In a studyassessing viewers depth and naturalness ratings to stereoscopic video se-quences, IJsselsteijn et al. (1998b) showed that depth and naturalness wererelated, yet could vary independently depending on the scene contentand image parameters (stereo, motion parallax). Not all stereo imageslook realistic because different kinds of distortions can be introduced intoa stereo image. The image may contain exaggerated depth or compres-sion, and the apparent scale of an object may be enlarged or reduced.These effects are the result of variables associated with content genera-tion, coding and displaying techniques. When a view does reproducespatial realism faithfully, it is called an orthoscopic view. When shootingan orthoscopic view, the angular field of view of the camera must matchthe angular field of vision of the observer. The two recorded viewpointsby the camera must be separated by the same distance as the distancebetween a typical observers eyes. Yamanoue et al. (1998) showed in sub-jective tests that stereoscopic images shot under orthostereoscopic condi-tions duplicate the real space at a certain display size. Also 3D programsshot under the same conditions look more natural than those shot usingthe toed-in camera configuration at any display size. In sum, the natural-ness concept seems to be a concept taking into account the added valueof 3D and also image distortions due to content generation, coding or dis-play techniques. In this thesis, the naturalness concept will be exploredfurther as an evaluation criterion for 3D-TV.
1.6.3 Viewing experience
Stereoscopic displays are expected to enhance the user’s viewing experi-ence, however, to date little research has been carried out using viewingexperience as an evaluation criterion. Viewing experience is, just like im-age quality, a complex, multidimensional concept reflecting users’ generalexperience with a certain application. Previous experiences with com-parable applications can affect the strength of viewing experience. Theintensity of emotional sensations (linked with viewing experience) de-creases when the interaction frequency with the application increases. Ahigher degree of imagination is expected to increase the viewing experi-
24
1.7. Overview of this thesis
ence similarly as with presence, i.e., when watching a movie, we know weare not ’in’ the movie, but we nevertheless react in a physical and emo-tional sense to the story. But, when a movie is watched more than once,the intensity of our reactions decrease, both physically as well as emotion-ally, and therefore the viewing experience may decrease. In this thesis, theconcept viewing experience as an attribute to measure the added value ofdepth in stereoscopic imaging systems is explored.
1.7 Overview of this thesis
The central research aim of this thesis is how to understand, measure and,eventually, model and predict the 3D ’Visual Experience’.
It is important to have a clear understanding of the potential added value(depth dimension) and drawbacks (eye-strain) of a 3D-TV broadcast ser-vice. A 3D visual experience model, incorporating perceptual factors re-lated to reproduced depth, image quality, and visual comfort, could con-tribute to a more effective design circle for 3D-TV and the technolog-ical parameters can be optimized to the customer’s quality preference.The users’ experience is evaluated on a perceptual basis by subjective as-sessments methods. Choosing the appropriate criterion that incorporatesdepth, quality and visual comfort is of essential importance for measur-ing the overall 3D visual experience. This thesis explores several newconcepts for the evaluation of 3D content and compares these conceptswith traditional image quality criteria.
Chapter 2 addresses the relative importance of image quality and depthon naturalness, presence and viewing experience. The first experiment ofthis chapter presents a first exploration on assessment criteria for stereo-scopic image material when using different 2D to 3D conversion algo-rithms. Each of these prototype 2D to 3D conversion algorithms gener-ated some 3D (depth artefacts) distortions. In the second experiment, twoassessment criteria with the most discriminating power (resulting fromexperiment 1) were used to investigate the added value of 3D over 2Dstills. The experiment used ’perfect’ 3D content with no conversion ordepth artefacts. Manually, several noise levels were added to the 2D and3D images to degrade image quality. The goal was to investigate whichevaluation term incorporates depth the most in the absence of depth arte-
25

1. Introduction
facts. The best criterion was further used in Chapter 3 and 4 investigatingdifferent 2D (JPEG coding) and 3D (crosstalk) artefacts.
In Chapter 3, the presented work investigates the effect of JPEG coding(typical 2D distortion) in combination with a variation in camera separa-tion (2D/3D) on perceived image quality, perceived sharpness, perceiveddepth and perceived eye-strain of stereoscopic images. The next exper-iment in this chapter investigates whether the added value of depth inJPEG-impaired images (2D distortion) can be measured using the natu-ralness criterion (resulting from Chapter 2).
Chapter 4 addresses the effect of crosstalk (typical 3D distortion) in com-bination with a variation in camera separation (2D/3D) on perceived im-age distortion, perceived depth and perceived visual strain. The secondexperiment investigates whether the added value of depth in crosstalk-impaired images (3D distortion) can be measured using the naturalnesscriterion (resulting from Chapter 2).
Chapter 5 describes an experiment combining both experiments fromChapter 2 measuring the effect of a reduction in image quality in com-bination with the added value of depth on image quality, depth, viewingexperience, and naturalness. In this chapter the viewing experience andnaturalness is predicted in terms of image quality and depth with a linearregression analysis.
In Chapter 6, we will briefly look back on the previous chapters and dis-cuss the most important findings. At the end we redefine the 3D visualexperience model as described in Chapter 1 and discuss the applicabilityof the model.
26

Chapter 2
Exploration of new evaluation concepts for
3D-TV
Abstract
The goal of this chapter is to explore and determine which evaluation criterion ismost appropriate to assess the performance of 3D-display systems. It is assumedthat these evaluation criteria take into account image quality as well as repro-duced depth. The criterion that weighs depth most in addition to image qualityis considered most appropriate. Experiment 1 explores the assessment criteriaimage quality, depth, naturalness, presence and viewing experience. It presentsempirical work on these assessment criteria for stereoscopic image material whenusing different 2D to 3D conversion algorithms. Results show that viewing ex-perience and naturalness have the most discriminating power between the vari-ous algorithms. Hence, the second experiment focuses on these criteria and uses’perfect’ 3D content with no conversion or depth artefacts. Several noise levelswere added to the 2D and 3D images to degrade image quality. The goal is toinvestigate whether viewing experience or naturalness incorporates depth themost in the absence of depth artefacts. Results show that the noise distortion isweighted equally both with viewing experience and naturalness. Naturalness ismore sensitive to depth than viewing experience.
0This chapter is based on Seuntiens et al. (2005a) and Lambooij et al. (2005)
27

2. Exploration of new evaluation concepts for 3D-TV
2.1 Introduction
The main objective of this chapter is to explore and determine which eval-uation criterion is most appropriate to assess 3D quality. It is assumedthat 3D evaluation criteria take into account image quality as well as re-produced depth. The criterion that gives depth the highest weighting inaddition to image quality is considered most appropriate for 3D-TV re-search. Earlier research confirmed that image quality has a relationshipwith presence and naturalness (Fedorovskaya et al., 1997; de Ridder, 1996;IJsselsteijn et al., 2002) and most likely with viewing experience as well.From literature it is known that depth perception is related to presence(IJsselsteijn et al., 1998b) and it is assumed that this is also the case for nat-uralness and viewing experience. So far, the relation between image qual-ity, depth, viewing experience, naturalness, and presence is not known.Therefore, an experiment was performed in which image quality and thedepth percept were assumed to vary, and measured image quality anddepth together with viewing experience, naturalness, and presence (seeChapter 1). For this experiment, (not yet optimal) 2D-3D conversion al-gorithms introducing depth artefacts and a realistic set of test scenes wereused to explore the concepts image quality, depth, viewing experience,naturalness, and presence. The most appropriate assessment concepts re-sulting from the first experiment were used in the second experiment.The second experiment used recorded 3D content (nine cameras) with noconversion or depth artefacts. Manually, several noise levels were addedto the 2D and 3D images to degrade image quality. The goal was to inves-tigate which evaluation term incorporates depth the most in the absenceof depth artefacts.
2.2 Experiment 1
This experiment explores the assessment criteria image quality, depth,naturalness, presence and viewing experience. It presents empirical workon assessment criteria for a realistic set of stereoscopic image materialwhen using different 2D to 3D conversion algorithms.
28

2.2. Experiment 1
2.2.1 Method
Design
The experiment had a within subjects design with Image (ten scenes) andAlgorithm (four conversion algorithms) as independent variables and im-age quality, depth, naturalness, presence, and viewing experience as de-pendent variables.
Observers
Two female and eighteen male naive observers participated in the ex-periment. Three observers were employees in a research environmentand seventeen observers were internal graduate students with a technicalbackground. Their ages ranged from 24 to 32. Four observers had priorexperience with viewing 3D material. All observers had good stereo vi-sion <40 seconds of arc (as tested with the Randot stereo test).
Equipment
A 20” Philips multi-view auto-stereoscopic display was used in this ex-periment as described in Chapter 1, section 1.3.3. The viewing distanceof the observers was 0.4 meters. Nine different views were generated us-ing 2D-3D conversion software (thus, not recorded by nine cameras) andthese nine views were integrated in the multi-view auto-stereoscopic dis-play. Custom-built software (PORT, Perceptie Onderzoek Research Tool)was used to conduct this psychophysical experiment. The custom-builtsoftware enables communication between three different hardware com-ponents. The first component is the PORT console, which is an ”ordinary”PC that displays the user interface to the test leader, controls the experi-ment and gathers the test results. The second component, a notebook, isthe observers’ interface on which the assessment is executed. The thirdcomponent is the video device, which displays the stimuli on the 3D dis-play. All assessments took place on the laptop, except for the session withimage quality and depth. PORT is not able to display two assessmentscales simultaneously, so the assessment was made on paper.
29

2. Exploration of new evaluation concepts for 3D-TV
Stimuli
The image material used in this experiment consisted of ten originalscenes, both moving (10 seconds) and static scenes. The originals con-tained objects, humans, and nature covering a broad range of image ma-terial and various kinds of distortions including depth artefacts due toimperfect 2D-3D conversion algorithms. Figure 2.1 shows the nine im-ages as used in the experiment. The images Fashionshoot, Toys, and Vintageare single frames taken from the sequences, where the Fashionshoot imagewas also used as a static scene in the experiment. Thus, in total sevenstatic scenes and three moving sequences were assessed by the observers.
The ten 2D originals were converted into 3D stimuli with four differentconversion algorithms. All conversion algorithms use single 2D imagesas input for depth map estimation. The output image (1600x1200) con-tains all nine views as generated by the algorithm and can directly bedisplayed on the 20” Philips multi-view autostereoscopic monitor. The’focus’ algorithm estimates the amount of depth based on the assumptionthat blurring is caused by the limited focal depth of the camera. Objectsin-focus are clearly rendered and objects at other distances are blurred.Depth from ’gravity’ relies on the fact that the bottom of most objectsis connected with the object below it, e.g., the ground, a table or chair.The direction of the gravity is regularly downwards, i.e., with the bottomof the image closer to the viewer than the top of the image. The ’lumi-nance’ algorithm assigns depth values based on their luminosity. Darkareas are considered to be far away and light areas closer by. The ’real-time’ algorithm is a combination of the ’focus’, ’gravity’, and ’luminance’algorithms. For all algorithms, the view-offset was set to 1/3 which im-plies that 1/3 of the depth volume was displayed in front of the displayscreen (and 2/3 behind the display screen). The virtual camera distancewas set to 0.01 meters for all images.
Procedure
The 3D content was evaluated by five different evaluation criteria, namelyimage quality, depth, naturalness, presence and viewing experience. The5-point categorical scale for all evaluation criteria was labeled with theadjective terms [bad]-[poor]-[fair]-[good]-[excellent] according to the ITU
30

2.2. Experiment 1
Calista Fashionshoot Time
Motor Fruit Orvis
Wood Vintage Toys
Figure 2.1: Original scenes used in the experiment. Fashionshoot, Toys and Vintageare frames taken from sequences, where Fashionshoot was also used as a still inthe experiment, making a total of 10 stimuli.
31

2. Exploration of new evaluation concepts for 3D-TV
(2000a) recommendation on subjective quality assessment. The criterianaturalness, presence and viewing experience were evaluated in three dif-ferent sessions and image quality and depth were evaluated together inone session. Each session consisted of 80 conditions (4 algorithms x 10scenes x 2 repetitions) randomized for each session to prevent order ef-fects. Prior to the experiment, observers were given a brief introductionon paper about the experiment. Any remaining questions were answeredand subsequently a short training session was conducted.
The training session allowed the observers to get used to the setting aswell as the tasks. The training consisted of two parts. In the first partobservers could scroll back and forth through twelve 3D images (threeimages converted with four algorithms) to get acquainted with viewing3D image material and with the different kind of distortions. The imagecontent used in this first part of the training session was not rated and notused in the actual experiment.
The second part of the training consisted of six 3D images that were alsoused in the rest of the experiment. This second part of the training wasimplemented to make the observers familiar with the assessment methodand again, to make them acquainted with the different kind of distortionsin the images. Subsequently, the actual experiment (80 stimuli) startedand took approximately 45 minutes. The lighting conditions of the roomwere constant for all observers and the level of light in the room was 3lux, measured perpendicular to the display in the direction of the viewer.
2.2.2 Results
Figure 2.2 shows the mean ratings of the five evaluation criteria per con-version algorithm on the y-axis. On the x-axis, four different conversionalgorithms are presented. The lines in the figure represent the five evalu-ation criteria. Connecting lines between data points are used for a moreconvenient and quicker interpretation of the data, but do not indicate anyrelationship.
Looking at figure 2.2, some results catch the eye immediately. First of all,the averaged scores for the 3D images are relatively low for all assessmentcriteria and for all algorithms, indicating that on average observers per-ceived the content as ’fair’. The horizontal trend of the criterion ’depth’
32

2.2. Experiment 1
focus gravity luminance realtime 1
2
3
4
5Assessment criteria
Algorithm
Sco
renatviewpresimqudepth
bad
poor
fair
good
excellent
Figure 2.2: Effect of algorithm on the assessment criteria naturalness, viewingexperience, presence, image quality and depth. The x-axis represents the fourconversion algorithms and the y-axis represents the averaged ratings and thestandard errors for all criteria. The lines in the graph represent the assessmentcriteria.
33

2. Exploration of new evaluation concepts for 3D-TV
indicates that perceived depth is not affected by the different conversionalgorithms. Moreover, the criteria naturalness, viewing experience, pres-ence and image quality were assessed quite similarly for all algorithms.Furthermore, the algorithm luminance shows the lowest averaged scoresfor these criteria.
A MANOVA was performed with Algorithm and Image as independentvariables and the five evaluation criteria as dependent variables. Resultsshow that the evaluation criteria naturalness, image quality, viewing ex-perience, and to a lesser degree presence made similar significant dis-criminations between the four algorithms. The perceived depth was theonly criterion that was not affected by the different algorithms (F(3,734) =2.279, p=0.078). Furthermore, there was a significant effect of Image forall evaluation criteria.
Next, the MANOVA was split up in moving and still scenes. Viewing ex-perience and naturalness were assessed relatively similarly to image qual-ity as a function of the algorithms for both sequences and stills. Presence,however, was assessed differently for stills than for sequences. For thestills, presence revealed a similar behaviour to image quality as a func-tion of the conversion algorithms. Yet, this behaviour is not as strongas the relation between image quality, viewing experience and natural-ness. For sequences, there was no significant effect of algorithm on thepresence scores (F(3,212) = 0.237, p=0.870) and no significant effect on thedepth scores (F(3,212) = 1.974, p=0.119). Thus, the presence ratings resem-bled more the depth scores. Following IJsselsteijn et al. (2001), presenceseems to be a good measurement attribute for evaluating stereoscopicsequences, but maybe less appropriate for evaluating stereoscopic stills,since their results showed that the introduction of motion had a muchhigher impact on presence than the introduction of depth. Therefore, theevaluation criterion presence will not be investigated further.
2.3 Experiment 2
In this experiment, the added value of 3D over 2D stills was investigatedfor viewing experience and naturalness. The experiment contained ’per-fect’ 2D and 3D material with no conversion or depth artefacts givingus full control over the stimulus material (in contrast to Experiment 1).
34
2.3. Experiment 2
The goal was to investigate which evaluation term (viewing experienceor naturalness) is most sensitive to depth in the absence of conversion ordepth artefacts. In addition, our experiment served to calibrate the sen-sitivity of these evaluation concepts in relation to each other in terms oftheir response pattern to increasing levels of noise introduced in the 2Dand 3D images. Yano (1991) performed an experiment quantifying thedifference in image quality, sensation of power, and sensation of depthbetween undistorted 2D and 3D images in terms of a change in image size.In this experiment, the sensitivity to depth of the concepts naturalnessand viewing experience was calibrated trying to quantify the potentialstereoscopic advantage in terms of dB noise-level (distorted).
2.3.1 Method
Design
The experiment had a mixed design with Image (4 images), Dimension(2D, 3D) and Noise (6 levels) as within subject factors, and the two dif-ferent evaluation concepts (naturalness and viewing experience) testedbetween subjects.
Observers
Thirty observers from a research environment were invited to participatein the experiment. Twenty observers participated in the viewing expe-rience experiment and ten observers participated in the naturalness ex-periment. All observers had a visual acuity of ≥ 1 (as tested with theLandolt-C test) and good stereo vision <30 seconds of arc (as tested withthe Randot stereo test).
Equipment
The 2D and 3D images were shown on the 20” Philips multi-view auto-stereoscopic display, described in Chapter 1, section 1.3.3. The viewingdistance was 150 cm. Nine different views were recorded using nine dif-ferent cameras. The 2D situation was simulated by implementing the
35

2. Exploration of new evaluation concepts for 3D-TV
middle view (view five) into all nine views. In this case, the observeralways perceives the same image on both eyes, resulting in a 2D percept.
Stimuli
The image material used in this experiment consisted of four still scenes,Minibeamer, Puzzle, Rose and Shaver, recorded with a nine-camera set-up.The advantage of recording all the views with nine cameras instead ofconverting a 2D image into 9 views, is that all required information isavailable and no distortions due to limited depth information are intro-duced in the 3D material. Displaying the nine views on the multi-viewauto-stereoscopic display resulted in a 3D percept of the image becauseeach eye receives a different view with a different perspective. The 2D sit-uation was simulated by implementing the middle view (view five) intoall nine views. In this case, the observer always perceives the same imageon both eyes, resulting in a 2D percept. The middle view (camera five) ofeach image is shown in Figure 2.3.
Since our main goal was to quantify the added value of depth throughthe concepts viewing experience and naturalness in terms of the afford-able loss in quality, an appropriate image distortion had to be chosen.To avoid effects of image content, additive noise was chosen as the in-troduced artefact. The visibility of artefacts like for instance blurring,blocking and ringing depends on image content. Additive noise howeverseems to manifest itself in the same way over many different systems.Image independent noise can be described by an additive noise model,where the resulting image f(i,j) is the sum of the true image s(i,j) and thenoise n(i,j). The model is shown in Equation 2.1.
f(i, j) = s(i, j) + n(i, j) (2.1)
The noise is modeled with a zero-mean (x) Gaussian distribution de-scribed by its standard deviation (σ), or variance (σ2). This means thateach pixel in the noisy image is the sum of the true pixel value and a ran-dom, Gaussian-distributed noise value. The additive noise is evenly dis-tributed over the frequency domain (i.e., white noise). The white Gaus-sian noise impairment was implemented using the Matlab image noise
36

2.3. Experiment 2
Figure 2.3: The four panels show the original scenes Minibeamer, Puzzle, Rose andShaver.
37

2. Exploration of new evaluation concepts for 3D-TV
Figure 2.4: Noise-impaired scenes (17 dB) Minibeamer, Puzzle, Rose and Shaver.
filter with five levels of noise (x = 0, σ2 = 0.00125, 0.0025, 0.005, 0.01,0.02). An increasing σ2-parameter produced more noise in the images.Figure 2.4 shows the four scenes with additive noise (x = 0 and σ2 = 0.02).
Procedure
The experiment consisted of two sessions: one for measuring viewing ex-perience and one for measuring naturalness. In both sessions exactly thesame set-up was used. The observers were given a brief instruction aboutthe experiment on paper. Any remaining questions were answered andsubsequently a short training session was conducted. The training ses-sion allowed the observers to get used to the setting as well as the tasks.In the training, six still images were presented with different noise levels,including the extremes used in the actual experiment. The rating scale for
38

2.3. Experiment 2
viewing experience and naturalness was labeled with the adjective terms[bad]-[poor]-[fair]-[good]-[excellent] according to the ITU (2000a) recom-mendation on subjective quality assessment. Observers were free to marktheir assessment anywhere on the continuous rating scale. The order inwhich the images appeared was randomized throughout the experimentand each image was evaluated twice. The images were displayed for 10seconds followed by a grey field for 3 seconds. In total, 20 observers wereasked to indicate viewing experience for 4 (images) x 6 (noise impairmentlevels) x 2 (2D and 3D) x 2 (repetition) = 96 images. Exactly the sameset-up was used for the naturalness ratings, only this session was doneby 10 other observers. The lighting conditions of the room were constantfor all observers and the level of light in the room was 25 lux, measuredperpendicular to the display in the direction of the viewer.
2.3.2 Results
Viewing experience
Figure 2.5 shows the mean ratings for viewing experience averaged overthe four images. On the x-axis the different noise levels are presented(increasing noise along the x-axis). The y-axis represents the averagedvalues for viewing experience from bad to excellent. The two lines in thefigure represent the dimensions 2D and 3D. Error bars reflect the standarderror of the mean.
A three-way repeated measures ANOVA (with Noise, Image and Dimen-sion as factors) was carried out on the raw subjective ratings to test themain effects and interactions for statistical significance. The results re-vealed significant main effects of Image (F(3,17) = 6.413, p<.01), Dimen-sion (F(1,19) = 5.251, p<.05) and Noise (F(5,15) = 46.521, p<.001) on theviewing experience ratings. No significant interactions between Image,Dimension and Noise were found. Figure 2.5 clearly shows the main ef-fect of a decreasing viewing experience with increased noise level for both2D and 3D images. The viewing experience of 3D images is rated sys-tematically higher than the viewing experience of 2D images for all noiselevels, explaining the main effect of Dimension. The main effect of Imagewas mainly caused by different parallel shifts in the four images, but themain effects of Noise and Dimension were clearly visible in all images.
39

2. Exploration of new evaluation concepts for 3D-TV
0 (org) 1 (29dB) 2 (26dB) 3 (23dB) 4 (20dB) 5 (17dB)0
1
2
3
4
5Viewing experience
Noise level
Vie
win
g ex
perie
nce
2D3D
Figure 2.5: Viewing experience ratings averaged over all scenes. The x-axis rep-resents the original image (org) and 5 noise-impaired images (PSNR) and they-axis represents the subjective ratings for viewing experience. The lines in thefigure represent Dimension (2D and 3D).
40

2.3. Experiment 2
0 (org) 1 (29dB) 2 (26dB) 3 (23dB) 4 (20dB) 5 (17dB)1
2
3
4
5Naturalness
Noise level
Nat
ural
ness
2D3D
Figure 2.6: Naturalness ratings averaged over all scenes. The x-axis representsthe original image (org) and 5 noise-impaired images (PSNR) and the y-axis rep-resents the subjective ratings for naturalness. The lines in the figure representDimension (2D and 3D).
The difference in viewing experience between 2D and 3D is equivalentto a change in noise level of around 2 dB. Thus, 3D images with 2 dBmore noise than their 2D counterparts result in the same viewing experi-ence. So, the evaluation term viewing experience takes into account theaddition of the stereoscopic cue to the total depth percept, as this is theprimary difference between the 2D and 3D images.
Naturalness
Figure 2.6 shows the mean ratings for naturalness averaged over the fourimages. On the x-axis the different noise levels are presented (increasingnoise along the x-axis). The y-axis represents the averaged values for nat-uralness from bad to excellent. The two lines in the figure represent thedimensions 2D and 3D. Error bars reflect the standard error of the mean.
A three-way repeated measures ANOVA (with Noise, Image and Dimen-
41

2. Exploration of new evaluation concepts for 3D-TV
sion as factors) was carried out on the raw subjective ratings to test themain effects and interactions for statistical significance. The results re-vealed only significant main effects of Dimension (F(1,19) = 9.448, p<.013)and Noise (F(5,15) = 16.285, p<.004) on the naturalness ratings. No sig-nificant interactions between Image, Dimension and Noise were found.Figure 2.6 clearly shows the main effect of a decrease in naturalness withincreasing noise level for both 2D and 3D images. The naturalness of 3Dimages is rated higher than for 2D images for all noise levels explainingthe main effect of Dimension. The difference in naturalness between 2Dand 3D is around 4 dB, when expressed in an equivalent difference innoise level.
Figure 2.5 and Figure 2.6 both show that noise considerably decreasesthe viewing experience and naturalness ratings both for 2D and 3D. Fur-thermore, both figures show a higher score for the 3D-mode than the 2D-mode, which implies that both viewing experience and naturalness takeinto account the added value of depth. The difference between 2D and 3Dis larger for naturalness than for viewing experience, which implies thatnaturalness appears to be more sensitive to the addition of depth thanviewing experience. The fact that the difference between 2D and 3D rat-ings remains constant over all the noise levels implies that the perceiveddepth is independent of the noise level.
2.3.3 Discussion
Our results show that both viewing experience and naturalness are sen-sitive image evaluation concepts when it comes to measuring the addedvalue of stereoscopic depth using impaired 2D and 3D images. Earlierstudies demonstrated that when observers are asked to rate image qual-ity in impaired stereoscopic images, the added value of depth is hardlytaken into account, if at all. However, when asking observers to assessviewing experience or naturalness, they do not only assess the level of im-pairment (in our case, the induced noise level), but also other aspects inthe image, such as depth, which is illustrated by the fact that there are twodistinctive lines for the assessment of 2D and 3D images. So, the addedvalue of depth is taken into account when observers are assessing view-ing experience, and even more so when they are assessing naturalness(see Figure 2.5 and 2.6). The results of the three-way repeated measures
42

2.4. Conclusion
ANOVA tests show that both Noise and Dimension significantly affectviewing experience and naturalness. For viewing experience also Imagehad a significant influence (vertical shift of the 2D and 3D line), but theadded value of depth as measured by viewing experience was clearly rec-ognized in all four images.
The method applied to quantify the added value of depth expressedin noise level yields an appropriate and useful measure. The potentialstereoscopic advantage can thus be quantified in terms of dB noise-level.The difference in viewing experience and naturalness between 2D and3D images expressed in noise level is, respectively, 2dB and 4dB. In otherwords, more noise is allowed in 3D images (respectively 2 dB and 4 dB)for an equal viewing experience and naturalness of 2D and 3D images.
The results in Figure 2.5 and 2.6 show a remarkably linear and thus pre-dictable behavior, while being quite stable (low error) within the chosenstimulus set. Apparently observers are well capable of assessing the im-age impairment and added value of depth in the range used in this exper-iment.
Thus, quantifying naturalness or viewing experience by means of intro-ducing a controlled impairment, such as noise, and expressing the resultsin units of this impairment yields a sensitive and reliable metric.
2.4 Conclusion
In sum, the experiments in Chapter 2 were performed to explore and de-termine which evaluation criterion is most appropriate to assess the per-formance of 3D-display systems. The explorative study in experiment 1 isbased on a realistic set of 3D stimuli generated by new 2D-3D conversiontechniques (not yet optimal). Results show that viewing experience andnaturalness have the most discriminating power between the various 2D-3D conversion algorithms. However, the disadvantage of this experimentis that there was no experimental control over the stimuli at all.
Therefore, Experiment 2 was performed including both ’perfect’ 2D and3D material with no conversion or depth artefacts. Manually, severalnoise degradations were added making the added value of depth quan-tifiable in terms of units of noise impairment. Results show that the differ-
43

2. Exploration of new evaluation concepts for 3D-TV
ence in viewing experience and naturalness between 2D and 3D imagesexpressed in noise level is, respectively, 2dB and 4dB. From this experi-ment, it is concluded that naturalness is the most sensitive metric mea-suring the added value of 3D and will be used in Chapter 3 and Chapter4.
In Chapter 3 and 4 more insight is gained in the behavior of the conceptnaturalness for 2D (JPEG) and 3D (crosstalk) artefacts. Also new knowl-edge and understanding will be build up about the behavior of 2D and3D artefacts in 3D image material. The focus point of both chapters is thedirect comparison between the traditional image quality concept and thenaturalness concept.
44

Chapter 3
Perceived quality of JPEG coded 3D images
Abstract
This chapter describes two experiments to investigate the effects of symmet-ric and asymmetric JPEG coding and camera base distance on several evalua-tion criteria. The first experiment presents results on the effects of camera-basedistance and JPEG-coding on overall image quality, perceived depth, perceivedsharpness and perceived eye-strain. Results show that an increase in JPEG cod-ing artefacts has a negative effect on image quality, sharpness and eye-strain buthas no effect on perceived depth. An increase in camera-base distance increasesperceived depth and reported eye-strain but has no effect on image quality andperceived sharpness. It is concluded that the added value of depth is not takeninto account when using the image quality concept. Results on symmetric andasymmetric JPEG coding of the left- and right-eye view shows that the rela-tionship between perceived image quality and average bit-rate is not straight-forward. In some cases, image quality ratings of a symmetric coded pair can behigher than for an asymmetric coded pair, even if the averaged bit rate for thesymmetric pair is lower than for the asymmetric pair. In experiment 2 the im-age quality concept is compared with the naturalness concept for different JPEGcoding levels and camera base distances. Results show that naturalness weighsmore equally the visibility of the distortion as well as the added value of depthin contrast to image quality.
0This chapter is based on Seuntiens et al. (2005b)
45

3. Perceived quality of JPEG coded 3D images
3.1 Introduction
The transmission and storage of 3D image material involves a largeamount of data due to the multiple views needed for 3D viewing. There-fore, recent research focuses on realizing new 3D coding and transmissionstandards to obtain savings in bandwidth and storage capacity. Develop-ing new flexible formats is of particular relevance in the case of 3D HDTV,where a single uncompressed HDTV channel may cost up to one Gbit/stransmission bandwidth, or in the case of 3D video transmission overlow-bandwidth transmission channels, such as the Internet (Johanson,2001). The same compression techniques used in two-dimensional im-age material can also be applied independently on the left and right viewof a stereoscopic image pair. Image compression may compromise per-ceived image quality however, through loss of detail and the introductionof compression artefacts such as blockiness, blur, or ringing. In order toensure that the applied compression algorithms and levels still yield per-ceptually acceptable results, subjective testing using human viewers hasbeen the only accurate method to date for assessing compressed stereo-scopic video systems.
In this chapter, previous research on perceived image quality, perceiveddepth, perceived sharpness and perceived eye-strain in relation to 3D tele-vision is discussed first. Subsequently, in Experiment 3 the camera-basedistance (B) and JPEG coding level are manipulated and the effects on per-ceived quality, sharpness, depth and eye-strain are measured to obtain abetter understanding of the behavior of a 2D impairment in combinationwith different camera-base distance settings. The JPEG coding was ap-plied in a symmetric (both views have the same compression ratio) andasymmetric (both views have a different compression ratio) way to in-vestigate the concept of mixed JPEG coding. Experiment 4 investigateswhether the added value of depth in JPEG impaired images (2D distor-tion) can be measured using the naturalness criterion.
3.1.1 Asymmetric coding and perceived image quality
Based on theories of binocular suppression, it is assumed that the binoc-ular percept of a stereo image pair is dominated by the high qualitycomponent (Levelt, 1965). Thus, theoretically, when one image of the
46

3.1. Introduction
stereo pair is compressed such that a high quality is maintained, the otherview can be coded more heavily without introducing visible artefacts inthe binocular percept. The mixed resolution concept was introduced byPerkins (1992). Mixed resolution coding assumes that the binocular per-cept is not affected when one view is of high quality and the other viewof lower quality. Perkins (1992) applied low-pass filtering (introducingblur) as compression algorithm resulting in a high-resolution and a low-resolution image for each view of a stereo image pair. The author con-cludes that mixed-resolution coding is easy to implement, and the reduc-tion of the bit rate is significant with respect to a system that employs nocoding.
Stelmach and Tam (1998) and Tam et al. (1998) applied a different com-pression ratio on the left- and right-eye views of a stereoscopic sequenceusing MPEG-2 (introducing blockiness) and low-pass filtering (introduc-ing blur). The results showed that the subjective image quality of a stereosequence was approximately the average of the monoscopic quality of theleft- and right-eye images when MPEG-2 coding was used. Subjective im-age quality of an asymmetric low-pass filtered stereo sequence was dom-inated by the high quality component.
Meegan et al. (2001) studied the binocular combination of asymmetricblur and blockiness impairment images. In the case of asymmetric blur-impaired images the binocular percept was dominated by the high qualitycomponent. The binocular percept of the asymmetric MPEG-2 impairedimages was approximately the average of the two monoscopic compo-nents. From this research it can be concluded that the success of asym-metric coding depends on the type of coding artefacts.
3.1.2 Perceived depth
The use of disparity information produces a compelling sense of depth,which defines the added value of stereoscopic TV. IJsselsteijn et al. (1998b)investigated the perception of depth and the naturalness of depth whenviewing stereoscopic image material. As soon as binocular disparity wasintroduced, the ratings of perceived depth and naturalness of depth in-creased. Research of Westheimer and McKee (1980) documented a largerdecrease in stereo acuity with asymmetric blur that with symmetric blur.Stelmach et al. (2000) investigated the effect of spatial and temporal low-
47
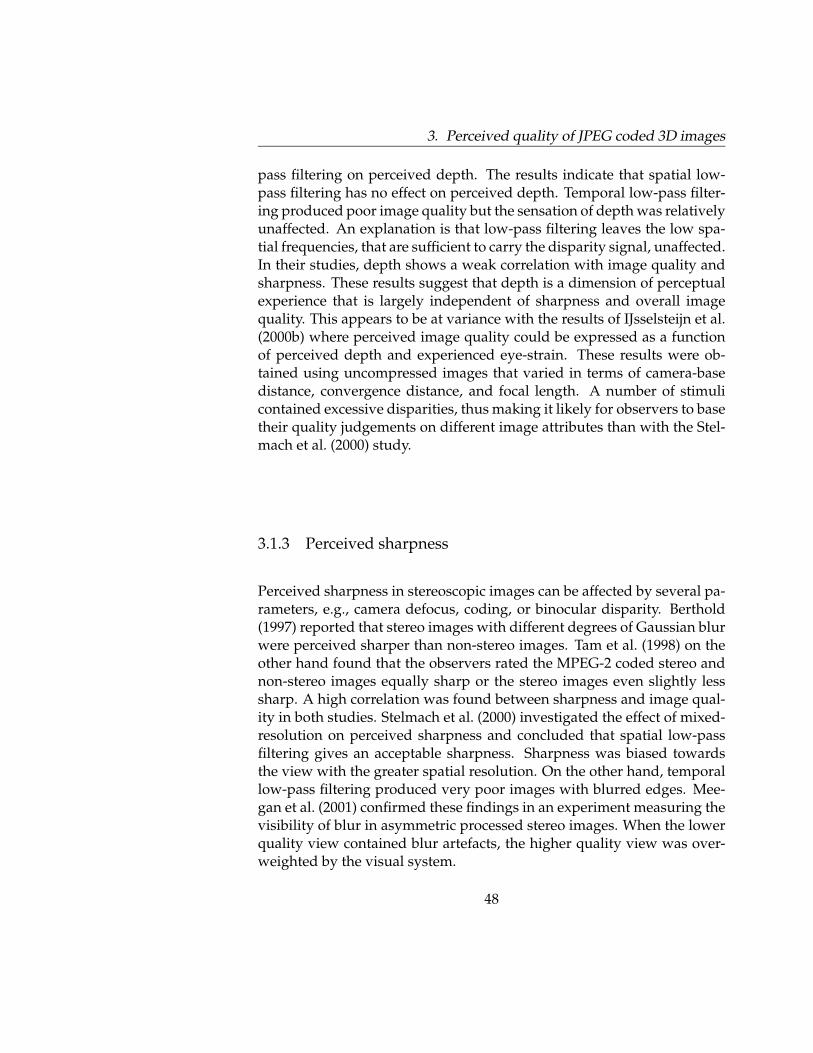
3. Perceived quality of JPEG coded 3D images
pass filtering on perceived depth. The results indicate that spatial low-pass filtering has no effect on perceived depth. Temporal low-pass filter-ing produced poor image quality but the sensation of depth was relativelyunaffected. An explanation is that low-pass filtering leaves the low spa-tial frequencies, that are sufficient to carry the disparity signal, unaffected.In their studies, depth shows a weak correlation with image quality andsharpness. These results suggest that depth is a dimension of perceptualexperience that is largely independent of sharpness and overall imagequality. This appears to be at variance with the results of IJsselsteijn et al.(2000b) where perceived image quality could be expressed as a functionof perceived depth and experienced eye-strain. These results were ob-tained using uncompressed images that varied in terms of camera-basedistance, convergence distance, and focal length. A number of stimulicontained excessive disparities, thus making it likely for observers to basetheir quality judgements on different image attributes than with the Stel-mach et al. (2000) study.
3.1.3 Perceived sharpness
Perceived sharpness in stereoscopic images can be affected by several pa-rameters, e.g., camera defocus, coding, or binocular disparity. Berthold(1997) reported that stereo images with different degrees of Gaussian blurwere perceived sharper than non-stereo images. Tam et al. (1998) on theother hand found that the observers rated the MPEG-2 coded stereo andnon-stereo images equally sharp or the stereo images even slightly lesssharp. A high correlation was found between sharpness and image qual-ity in both studies. Stelmach et al. (2000) investigated the effect of mixed-resolution on perceived sharpness and concluded that spatial low-passfiltering gives an acceptable sharpness. Sharpness was biased towardsthe view with the greater spatial resolution. On the other hand, temporallow-pass filtering produced very poor images with blurred edges. Mee-gan et al. (2001) confirmed these findings in an experiment measuring thevisibility of blur in asymmetric processed stereo images. When the lowerquality view contained blur artefacts, the higher quality view was over-weighted by the visual system.
48

3.2. Experiment 3
3.1.4 Perceived eye-strain
Many studies report a clear preference for stereoscopic images over non-stereoscopic ones. However, viewing stereo images can be more fatigu-ing than viewing conventional two-dimensional images. Because eye-strain can be extremely annoying in stereoscopic displays, it is impor-tant to have an understanding of its subjective magnitude and impact onthe user. IJsselsteijn et al. (2000b) investigated the effect of stereoscopicfilming parameters and display duration on the subjective assessment ofeye-strain. The averaged results of the eye-strain ratings show a clear lin-ear increase with increasing disparities. There was no significant effect ofdisplay duration on the eye-strain scores, but the display durations wererelatively short (1-15 seconds). Mitsuhashi (1996) found that observersexperienced more eye-strain for binocular vision than with the conven-tional television picture, using an objective measure known as the crit-ical flicker frequency (CFF). The critical flicker frequency is the highestfrequency at which a particular person still sees flicker. At any higherfrequency, the subject sees a steady light source. Watching stereoscopictelevision caused a significant CFF decrease within 30 minutes. It wasalso found that the CFF decreases are related to a subjective feeling ofeye-strain. Okuyama (1999) evaluated visual fatigue with visual functiontesting (objective measure) and interviews (subjective measure). Visualfunction testing showed a mismatch between convergence and accom-modation. The interviews reported more eye pain, an ’alien feeling’ inthe eyes and eyes filled with tears. Both evaluations show an increase invisual fatigue. Kooi and Toet (2004) concluded that disparity, crosstalkand blur are the most important parameters that cause eye-strain.
3.2 Experiment 3
In sum, it seems that the mixed resolution concept is appropriate forstereoscopic transmission although the quality of the binocular perceptwill depend on the type of distortion. Previous experiments on asymmet-ric coding, however, did not control camera-base distance. Since it is pos-sible that different camera separation settings influence the visibility ofcoding artefacts, an experiment was performed that was aimed at investi-gating the effects of asymmetric/symmetric coding while using different
49
3. Perceived quality of JPEG coded 3D images
levels of camera separation. The reason for varying camera separation isthat larger separations lead to larger differences between the left and righteye view in terms of view perspective and image content at the borders ofthe image (image information appears and disappears with varying cam-era separation). Thus, image coders (such as JPEG or MPEG) produce dif-ferent artefacts in the left and right eye view in terms of intensity, positionand shape when varying camera separation. So, matching the left andright eye view (based on corresponding points in the images) may resultin a different 3D percept or different perception of the artefacts. Secondly,there is full control for a possible effect of eye dominance, where imagespresented to the dominant eye would potentially contribute more to theoverall stereoscopic percept than images presented to the non-dominanteye. Further, the study of the effects of camera-base distance and com-pression (JPEG coding) on perceived depth, sharpness, image quality andeye-strain is extended.
3.2.1 Method
Design
A mixed design experiment was performed with Image (2 images), Cam-era base distance (0, 8, and 12 cm) and JPEG coding (16 symmetric/asymmetric combinations) as within subject factors, and four different at-tributes (perceived sharpness, perceived depth, perceived image qualityand perceived eye-strain) tested between subjects.
Observers
Forty non-expert observers were paid to participate in this experiment.The observers, mostly students, came from the same age group (18-27years old). All observers had a visual acuity of ≥ 1 (as tested with theLandolt-C chart), good stereo vision <30 seconds of arc (as tested withthe Randot stereo test) and good color vision (as tested with the Ishiharatest). Eye dominance and inter-pupillary distance were also measured.The Finger-Point method was used to determine eye dominance. Ob-servers pointed naturally at an object with both eyes open and the facesquare to the object. The eyes were closed alternately. When the domi-
50
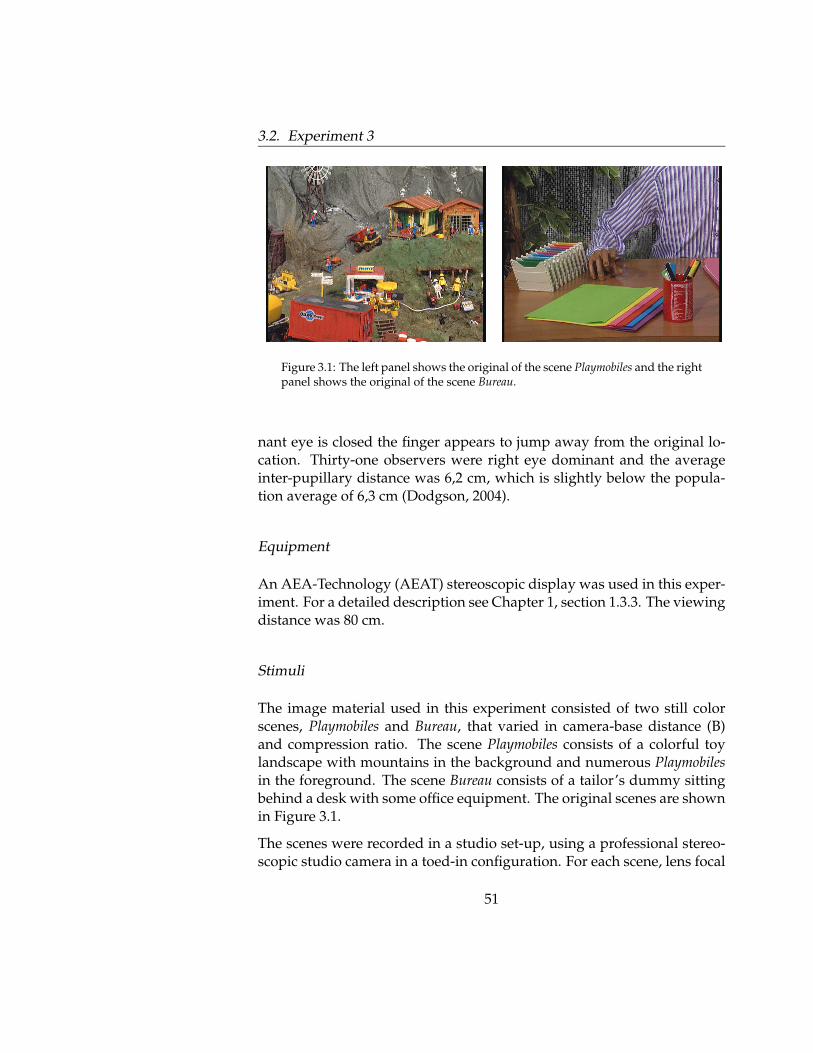
3.2. Experiment 3
Figure 3.1: The left panel shows the original of the scene Playmobiles and the rightpanel shows the original of the scene Bureau.
nant eye is closed the finger appears to jump away from the original lo-cation. Thirty-one observers were right eye dominant and the averageinter-pupillary distance was 6,2 cm, which is slightly below the popula-tion average of 6,3 cm (Dodgson, 2004).
Equipment
An AEA-Technology (AEAT) stereoscopic display was used in this exper-iment. For a detailed description see Chapter 1, section 1.3.3. The viewingdistance was 80 cm.
Stimuli
The image material used in this experiment consisted of two still colorscenes, Playmobiles and Bureau, that varied in camera-base distance (B)and compression ratio. The scene Playmobiles consists of a colorful toylandscape with mountains in the background and numerous Playmobilesin the foreground. The scene Bureau consists of a tailor’s dummy sittingbehind a desk with some office equipment. The original scenes are shownin Figure 3.1.
The scenes were recorded in a studio set-up, using a professional stereo-scopic studio camera in a toed-in configuration. For each scene, lens focal
51

3. Perceived quality of JPEG coded 3D images
length and convergence distance of the cameras to the scene were fixed to20 mm and 1.30 m, respectively. Each scene was recorded at three differ-ent camera-base distances, namely 0 cm (i.e., monoscopic), 8 cm and 12cm. The scenes were created in the European DISTIMA project and werekindly provided to us by CCETT in France.
An increase in camera-base distance results in an increase in disparityvalues and thus perceived depth, while the size of the objects and the fieldof view remains constant. A camera-base distance of 0 cm introduces nodisparity between the left and the right image and thus no perceptiblestereoscopic depth, while depth is highly noticeable with a camera-basedistance of 8 cm and 12 cm.
The stimulus set contained the original, uncompressed version of eachscene and three JPEG coded versions. The Baseline Sequential JPEG com-pression software package of the Independent JPEG Software Group1
with default quantization table was used to generate for each scene dif-ferent versions at various compression rates. The compression rate wasdetermined by the ’Q-parameter’. Images with a high compression ratiowere obtained by low ’Q-values’, and therefore contained the most con-spicuous distortions. The JPEG ’Q-parameters’ used in this experimentwere Q30, Q20 and Q10 for the scenes Playmobiles and Bureau. The cod-ing levels were chosen carefully based on the visibility of artefacts. Stereoimage pairs were formed by symmetric or asymmetric coding of the leftand right eye images. In a symmetric stereoscopic image pair the samecompression ratio is applied to the left- and right-eye view. In asymmet-ric coding the compression ratio of the two views is different. Table 3.1gives the bytes per pixel (bpp) of the symmetric and asymmetric imagepairs, which is the averaged bpp of the left and right eye views.
In order to test a potential effect of eye dominance, each combination ofbit-rates was presented to both eyes. Each JPEG coding level was dis-played an equal number of times to each eye (left and right) and all com-binations of the coding levels were presented once. Thus in total, 2 scenes,3 camera-base distances and 4x4 coding levels were used. This resultedin a stimulus set of 2x3x16 = 96 images.
1http://www.ijg.org
52
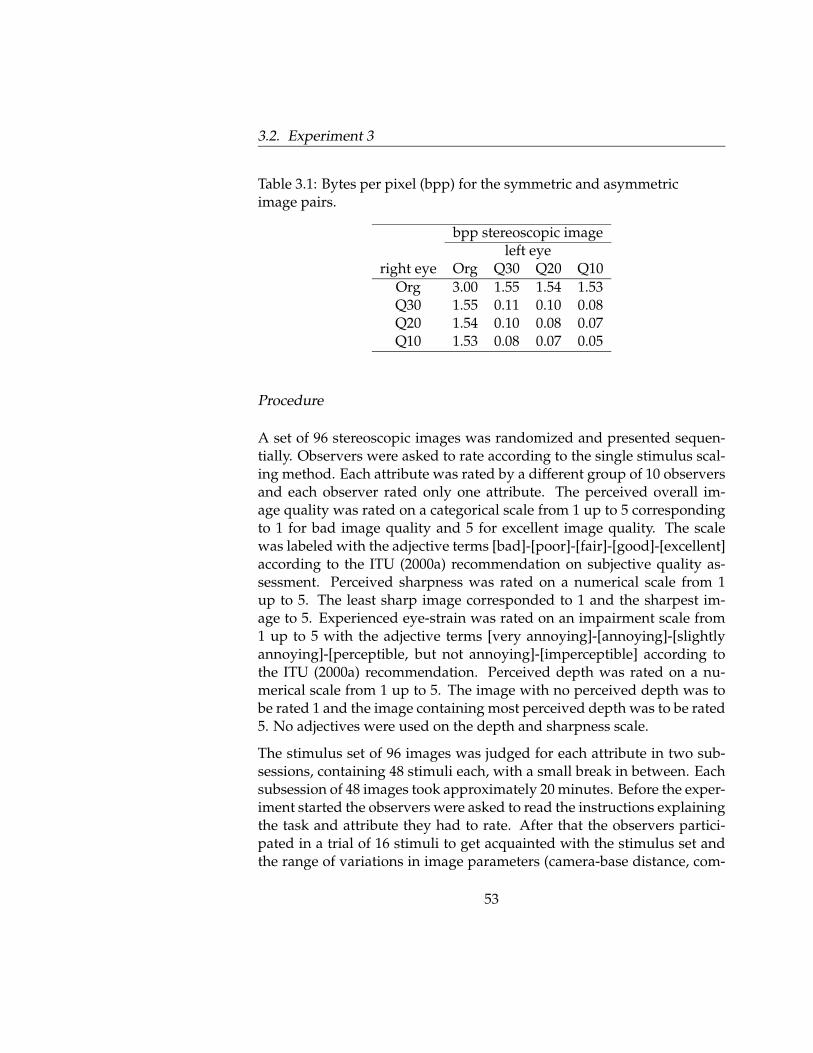
3.2. Experiment 3
Table 3.1: Bytes per pixel (bpp) for the symmetric and asymmetricimage pairs.
bpp stereoscopic imageleft eye
right eye Org Q30 Q20 Q10
Org 3.00 1.55 1.54 1.53Q30 1.55 0.11 0.10 0.08Q20 1.54 0.10 0.08 0.07Q10 1.53 0.08 0.07 0.05
Procedure
A set of 96 stereoscopic images was randomized and presented sequen-tially. Observers were asked to rate according to the single stimulus scal-ing method. Each attribute was rated by a different group of 10 observersand each observer rated only one attribute. The perceived overall im-age quality was rated on a categorical scale from 1 up to 5 correspondingto 1 for bad image quality and 5 for excellent image quality. The scalewas labeled with the adjective terms [bad]-[poor]-[fair]-[good]-[excellent]according to the ITU (2000a) recommendation on subjective quality as-sessment. Perceived sharpness was rated on a numerical scale from 1up to 5. The least sharp image corresponded to 1 and the sharpest im-age to 5. Experienced eye-strain was rated on an impairment scale from1 up to 5 with the adjective terms [very annoying]-[annoying]-[slightlyannoying]-[perceptible, but not annoying]-[imperceptible] according tothe ITU (2000a) recommendation. Perceived depth was rated on a nu-merical scale from 1 up to 5. The image with no perceived depth was tobe rated 1 and the image containing most perceived depth was to be rated5. No adjectives were used on the depth and sharpness scale.
The stimulus set of 96 images was judged for each attribute in two sub-sessions, containing 48 stimuli each, with a small break in between. Eachsubsession of 48 images took approximately 20 minutes. Before the exper-iment started the observers were asked to read the instructions explainingthe task and attribute they had to rate. After that the observers partici-pated in a trial of 16 stimuli to get acquainted with the stimulus set andthe range of variations in image parameters (camera-base distance, com-
53

3. Perceived quality of JPEG coded 3D images
pression ratio).
To check whether there were any negative side effects as a result of watch-ing 45 minutes of stereoscopic images, observers were asked to fill out asymptom checklist before and after the complete experiment. The symp-tom checklist consisted of 6 items which observers had to rate namely (1)General discomfort, (2) Fatigue, (3) Headache, (4) Eye-strain, (5) Difficultyfocussing and (6) Blurred vision.
3.2.2 Results
A way to analyze data obtained by numerical category scaling experi-ments is to transform the data into an interval scale assuming a psy-chologically linear continuum. Thurstone’s law of categorical judgementcan be used for such a transformation (Thurstone, 1927). The Thurstonemodel assumes that the attribute strength is measured on an internal psy-chological scale, i.e., an interval scale with Gaussian noise distribution.For all observers, the raw category scaling data obtained in the experi-ment were transformed to a Thurstone scale using the software packageThurcatD (Boschman, 2000). As input, the program ThurcatD needs fre-quency distributions per category for each stimulus that was presentedin the experiment. From the input frequency distributions of ratings overthe categories, ThurcatD calculates the stimulus scale values in standarddeviation units and, also, the interval borders that define the intervals onthe psychometrical scale. Equal distances on the scale correspond withequal differences in the percept judged because the Thurstone scale is atrue interval scale. The Thurstone values are scaled back to the originalscale using a linear transform function.
Eye dominance
The effect of eye dominance was tested for the asymmetric combinationsbetween ratings of left-eye dominant (averaged over 9) and right-eyedominant (averaged over 31) observers for each attribute. As tested witha Wilcoxon Signed Rank Test, which is a conservative test, there wereno significant differences between the ratings of left-eye dominant andright-eye dominant observers for all asymmetrical combinations and at-tributes. Therefore, the data of the left- and right-eye dominant observers
54
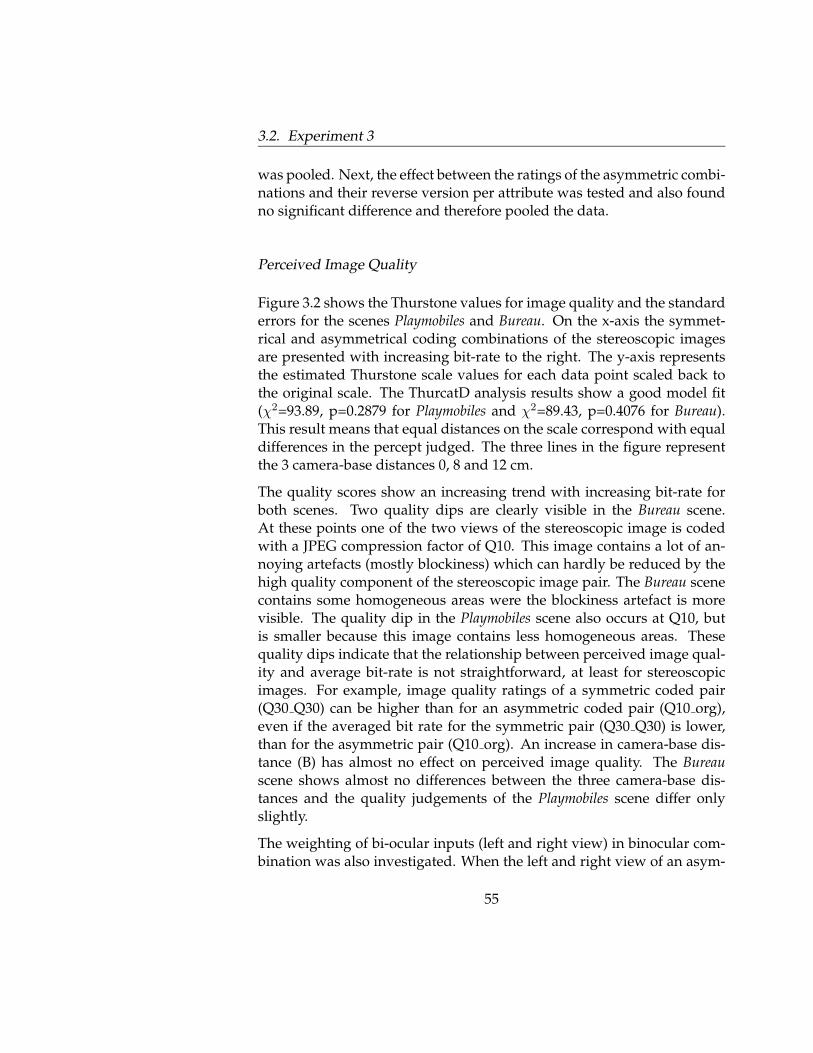
3.2. Experiment 3
was pooled. Next, the effect between the ratings of the asymmetric combi-nations and their reverse version per attribute was tested and also foundno significant difference and therefore pooled the data.
Perceived Image Quality
Figure 3.2 shows the Thurstone values for image quality and the standarderrors for the scenes Playmobiles and Bureau. On the x-axis the symmet-rical and asymmetrical coding combinations of the stereoscopic imagesare presented with increasing bit-rate to the right. The y-axis representsthe estimated Thurstone scale values for each data point scaled back tothe original scale. The ThurcatD analysis results show a good model fit(χ2=93.89, p=0.2879 for Playmobiles and χ2=89.43, p=0.4076 for Bureau).This result means that equal distances on the scale correspond with equaldifferences in the percept judged. The three lines in the figure representthe 3 camera-base distances 0, 8 and 12 cm.
The quality scores show an increasing trend with increasing bit-rate forboth scenes. Two quality dips are clearly visible in the Bureau scene.At these points one of the two views of the stereoscopic image is codedwith a JPEG compression factor of Q10. This image contains a lot of an-noying artefacts (mostly blockiness) which can hardly be reduced by thehigh quality component of the stereoscopic image pair. The Bureau scenecontains some homogeneous areas were the blockiness artefact is morevisible. The quality dip in the Playmobiles scene also occurs at Q10, butis smaller because this image contains less homogeneous areas. Thesequality dips indicate that the relationship between perceived image qual-ity and average bit-rate is not straightforward, at least for stereoscopicimages. For example, image quality ratings of a symmetric coded pair(Q30 Q30) can be higher than for an asymmetric coded pair (Q10 org),even if the averaged bit rate for the symmetric pair (Q30 Q30) is lower,than for the asymmetric pair (Q10 org). An increase in camera-base dis-tance (B) has almost no effect on perceived image quality. The Bureauscene shows almost no differences between the three camera-base dis-tances and the quality judgements of the Playmobiles scene differ onlyslightly.
The weighting of bi-ocular inputs (left and right view) in binocular com-bination was also investigated. When the left and right view of an asym-
55
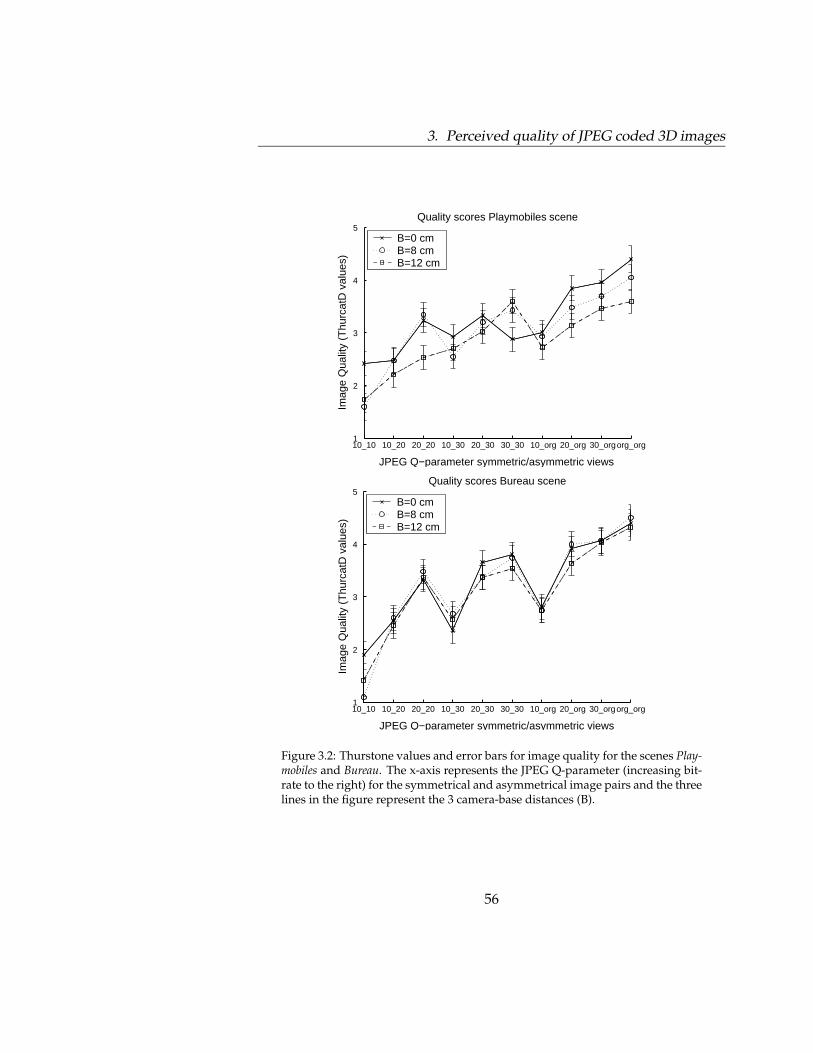
3. Perceived quality of JPEG coded 3D images
10_10 10_20 20_20 10_30 20_30 30_30 10_org 20_org 30_orgorg_org1
2
3
4
5 Quality scores Playmobiles scene
JPEG Q−parameter symmetric/asymmetric views
Imag
e Q
ualit
y (T
hurc
atD
val
ues)
B=0 cmB=8 cmB=12 cm
10_10 10_20 20_20 10_30 20_30 30_30 10_org 20_org 30_orgorg_org1
2
3
4
5 Quality scores Bureau scene
JPEG Q−parameter symmetric/asymmetric views
Imag
e Q
ualit
y (T
hurc
atD
val
ues)
B=0 cmB=8 cmB=12 cm
Figure 3.2: Thurstone values and error bars for image quality for the scenes Play-mobiles and Bureau. The x-axis represents the JPEG Q-parameter (increasing bit-rate to the right) for the symmetrical and asymmetrical image pairs and the threelines in the figure represent the 3 camera-base distances (B).
56

3.2. Experiment 3
Figure 3.3: Binocular weighting of image quality for the Bureau scene with acamera-base distance of 12 cm. In the first case, labeled as 10 20 on the x-axis,the judged image quality of the symmetric image pairs are labeled as ’L’ and ’H’corresponding to JPEG coding Q10 Q10 and Q20 Q20. The judged image qualityof the asymmetric image pair is the height of the bar (Q10 Q20).
metric coding pair are viewed separately, the less compressed view wouldhave a higher subjective image quality. On the other hand, the highlycompressed view would have a lower subjective image quality, and JPEGcoding artefacts are visible. In Figure 3.3, the image quality of the sym-metric inputs (high ’H’ quality e.g., Q20 Q20, and low ’L’ quality e.g.,Q10 Q10 of the views) are presented by the whiskers (endpoints) and theasymmetric combination (stereo view of the high and low quality inputs,e.g., Q10 Q20) is presented by the height of the bar. The image qualityof the symmetric inputs is the bi-ocular combination of two images withthe same compression ratio. Figure 3.3 presents the symmetric and asym-metric stereoscopic image pairs of the Bureau scene with a camera-basedistance of 12 cm.
The results of Figure 3.3 show that the perceived image quality of thebinocular combination was approximately the average of the bi-ocularhigh quality and low quality input. There are some differences betweenthe scenes but these are small. The tendency towards the low quality
57

3. Perceived quality of JPEG coded 3D images
input is a bit stronger in the Bureau scene than in the Playmobiles scenewhen Q10 is in the asymmetric image pair. This can be explained by thefact that the blockiness artefact is more visible in the Bureau scene at highcompression rates because there are more homogeneous areas.
Perceived Depth
The Thurstone values for perceived depth and the error bars for the Play-mobiles and Bureau scene are presented in Figure 3.4. The x-axis repre-sents the symmetric and asymmetric coding combinations in increasingbit-rate. The y-axis represents the estimated Thurstone scale values foreach data point scaled back to the original scale. The ThurcatD analy-sis results show a good model fit (χ2=61.65, p=0.9820 for Playmobiles andχ2=76.07, p=0.7924 for Bureau). This result means that equal distances onthe scale correspond with equal differences in the percept judged. Thethree lines in the figure represent the 3 camera-base distances 0, 8 and 12cm.
As expected, the perceived depth scores increased when the camera-basedistance increased. The perceived depth between camera-base distance 8and 12 cm increased less than between 0 and 8 cm. Furthermore, JPEGcoding had no clear effect on perceived depth. For all JPEG compressionlevels and combinations, the perceived depth remains nearly the same foreach camera-base distance.
Perceived Sharpness
In Figure 3.5 the Thurstone values for sharpness of the Playmobiles sceneand the Bureau scene are given. The x-axis represents the symmetric andasymmetric coding combinations in increasing bit-rate. The y-axis repre-sents the estimated Thurstone scale values for each data point scaled backto the original scale. The ThurcatD analysis results show a good modelfit (χ2=71.73, p=0.8814 for Playmobiles and χ2=91.93, p=0.3381 for Bureau).This result means that equal distances on the scale correspond with equaldifferences in the percept judged. The three lines in the figure representthe 3 camera-base distances 0, 8 and 12 cm.
The results for perceived sharpness show great similarity with the per-
58

3.2. Experiment 3
10_10 10_20 20_20 10_30 20_30 30_30 10_org 20_org 30_orgorg_org1
2
3
4
5 Depth scores Playmobiles scene
JPEG Q−parameter symmetric/asymmetric views
Dep
th (
Thu
rcat
D v
alue
s)
B=0 cmB=8 cmB=12 cm
10_10 10_20 20_20 10_30 20_30 30_30 10_org 20_org 30_orgorg_org1
2
3
4
5 Depth scores Bureau scene
JPEG Q−parameter symmetric/asymmetric views
Dep
th (
Thu
rcat
D v
alue
s)
B=0 cmB=8 cmB=12 cm
Figure 3.4: Thurstone values and error bars for perceived depth for the Playmo-biles and Bureau scenes. The x-axis represents the JPEG Q-parameter (increasingbit-rate to the right) for the symmetrical and asymmetrical image pairs and thethree lines in the figure represent the 3 camera-base distances (B).
59

3. Perceived quality of JPEG coded 3D images
10_10 10_20 20_20 10_30 20_30 30_30 10_org 20_org 30_orgorg_org1
2
3
4
5 Sharpness scores Playmobiles scene
JPEG Q−parameter symmetric/asymmetric views
Sha
rpne
ss (
Thu
rcat
D v
alue
s)
B=0 cmB=8 cmB=12 cm
10_10 10_20 20_20 10_30 20_30 30_30 10_org 20_org 30_orgorg_org1
2
3
4
5 Sharpness scores Bureau scene
JPEG Q−parameter symmetric/asymmetric views
Sha
rpne
ss (
Thu
rcat
D v
alue
s)
B=0 cmB=8 cmB=12 cm
Figure 3.5: Thurstone values and error bars for sharpness for the Playmobiles andBureau scenes. The x-axis represents the JPEG Q-parameter (increasing bit-rate tothe right) for the symmetrical and asymmetrical image pairs and the three linesin the figure represent the 3 camera-base distances (B).
60

3.2. Experiment 3
ceived image quality results. Perceived sharpness increased when thebit rate increased. Also in these figures the perceived sharpness scoresdropped dramatically as soon as JPEG compression level Q10 was pre-sented in one of the two views of the stereoscopic pair. The sharpnessscores in the Bureau scene were approximately the same for the threecamera-base distances. There were little differences visible in the Play-mobiles scene between the three camera-base distances. So, introducingimage disparity appears to have no effect on perceived sharpness in ourstimulus set.
Perceived Eye-strain
Figure 3.6 represents the Thurstone scale values for the eye-strain scoresof the observers. The x-axis represents the symmetric and asymmetriccoding combinations in increasing bit-rate. The y-axis represents the esti-mated Thurstone scale values for each data point scaled back to the origi-nal scale. The ThurcatD analysis results show a good model fit (χ2=66.91,p=0.9460 for Playmobiles and χ2=75.38, p=0.8084 for Bureau). This resultmeans that equal distances on the scale correspond with equal differencesin the percept judged. The three lines in the figure represent the 3 camera-base distances 0, 8 and 12 cm.
The results show less annoyance with increasing bit-rate (less compres-sion) and more annoyance with increasing camera-base distance. As inthe quality and sharpness figures, there is an increase in reported eye-strain as soon as JPEG coding level Q10 is presented in one of the twoviews of a stereoscopic image pair.
Correlation between attributes
In this experiment high correlation coefficients were found between im-age quality and sharpness (R=0.93) and between image quality and eye-strain (R=0.76). No significant correlation was found between image qual-ity and depth as is also obvious when comparing Figures 3.2, 3.4, and 3.5.A moderate negative correlation was found between depth and eye-strainbecause introducing more depth in the image leads to an increase in eye-strain. Table 3.2 shows the correlation coefficients (R) for all attributes.
61

3. Perceived quality of JPEG coded 3D images
10_10 10_20 20_20 10_30 20_30 30_30 10_org 20_org 30_orgorg_org1
2
3
4
5 Eye−strain scores playmobiles scene
JPEG Q−parameter symmetric/asymmetric views
Eye
−st
rain
(T
hurc
atD
val
ues)
B=0 cmB=8 cmB=12 cm
10_10 10_20 20_20 10_30 20_30 30_30 10_org 20_org 30_orgorg_org1
2
3
4
5 Eye−strain scores bureau scene
JPEG Q−parameter symmetric/asymmetric views
Eye
−st
rain
(T
hurc
atD
val
ues)
B=0 cmB=8 cmB=12 cm
Figure 3.6: Thurstone values and error bars for eye-strain for the scenes Playmo-biles and Bureau. The x-axis represents the JPEG Q-parameter (increasing bit-rateto the right) for the symmetrical and asymmetrical image pairs and the threelines in the figure represent the 3 camera-base distances (B).
62

3.2. Experiment 3
Table 3.2: Correlation coefficients (R) for all attributes
Quality Sharpness Depth Eye-strain
Quality 1 0.93 -0.04 0.76Sharpness 0.93 1 0.18 0.62
Depth -0.04 0.18 1 -0.52Eye-strain 0.76 0.62 -0.52 1
Symptom Checklist
Figure 3.7 shows the averaged results of the symptom checklist. The cat-egories correspond with the labels on the x-axis. The y-axis shows theaveraged scores (0 = none, 1 = slight, 2= moderate, 3 = severe) over 10observers for each attribute. The figures are shown separately for each ofthe subjective ratings. This is done so as to visualise potential primingor sensitisation processes in relation to negative side effects as a conse-quence of having provided a certain attribute rating (e.g., eye-strain). Inall figures a slight increase in symptoms can be observed. A WilcoxonMatched-Pairs Signed Ranks test was used to reveal statistical significantdifferences (criterion p< 0.05) between the averaged checklist results be-fore and after the experiment. The symptom checklist of the attributequality shows a significant difference for the items headache (p=0.034)and eye-strain (p=0.034). No significant differences were found for the at-tributes depth and sharpness. The attribute eye-strain reveals significantdifferences for the items general discomfort (p=0.014), fatigue (p=0.034)and eye-strain (p=0.014). The items headache and difficulty focussing al-most reached significance. The averaged ratings of the attribute eye-straindiffered remarkably from the averaged ratings of the other attributes, al-though all observers saw the same stimuli set. A possible explanationmaybe the direct association of the attribute eye-strain with the items onthe symptom checklist, sensitizing observers to potential negative effectsassociated with viewing a stereo display.
63

3.P
erceived
qu
alityo
fJP
EG
cod
ed3D
imag
es
0
1
2
3
Sco
re
gene
ral
disc
omfo
rt
fatig
ue
head
ache
eye−
stra
in
diffi
culty
focu
ssin
g
blur
red
visi
on
Averaged results checklist quality
symptom score beforesymptom score after
p = 0.317
p = 0.257
p = 0.034
p = 0.034
p = 0.257
p = 0.414
0
1
2
3
Sco
re
gene
ral
disc
omfo
rt
fatig
ue
head
ache
eye−
stra
in
diffi
culty
focu
ssin
g
blur
red
visi
on
Averaged results checklist depth
symptom score beforesymptom score after
p = 1.000
p = 0.063
p = 1.000
p = 0.157
p = 0.102
p = 0.083
0
1
2
3S
core
gene
ral
disc
omfo
rt
fatig
ue
head
ache
eye−
stra
in
diffi
culty
focu
ssin
g
blur
red
visi
on
Averaged results checklist sharpness
symptom score beforesymptom score after
p = 1.000
p = 0.063
p = 0.157
p = 0.194
p = 1.000
p = 0.157
0
1
2
3
Sco
re
gene
ral
disc
omfo
rt
fatig
ue
head
ache
eye−
stra
in
diffi
culty
focu
ssin
g
blur
red
visi
on
Averaged results checklist eye−strain
symptom score beforesymptom score after
p = 0.014
p = 0.034
p = 0.063
p = 0.014
p = 0.083
p = 0.157
Fig
ure
3.7:A
verag
edsy
mp
tom
check
listsfo
rall
attribu
tes.T
he
x-ax
issh
ow
sth
eitem
s(1)
gen
eraldisco
mfo
rt,(2)fatig
ue,(3)
head
ache,(4)
eye-strain
,(5)d
ifficu
ltyfo
cussin
gan
d(6)
blu
rredv
ision
.T
he
y-ax
issh
ow
sth
eav
eraged
scores
(0=
no
ne,
1=
sligh
t,2=m
od
eratean
d3
=sev
ere).64

3.2. Experiment 3
3.2.3 Discussion
The perceived image quality of monoscopic images (B=0 cm) was ratedabout the same as that of stereoscopic images (B=8 and 12 cm). The rea-son for this finding may be that the added value of perceived depth wasnot taken into account when judging image quality. This may be due tothe used stimulus set and experimental paradigm. Stelmach et al. (2000)also found a low correlation between image quality and perceived depthusing low-pass filtering. On the other hand, IJsselsteijn et al. (2000b) de-scribed an empirical relation between perceived depth, eye-strain and im-age quality for uncompressed stereoscopic images. The authors showedthat an increase in image quality ratings could be attributed to an increasein perceived depth (when kept within natural bounds). However, qual-ity judgements were attenuated by the eye-strain ratings, thus arrivingat a simple stereoscopic image quality model for uncompressed images,describing quality as the difference between the added value of depthdiminished by experienced eye-strain. In the current experiment, imageartefacts were introduced which may have dominated the image qualityassessment, making observers focus less on the depth dimension.
The results of this experiment show that an increase in JPEG coding de-creases perceived image quality and sharpness and slightly increases per-ceived eye-strain. No effect of JPEG coding was found on perceiveddepth. Results of Stelmach et al. (2000) also showed that spatial low-passfiltering had no effect on perceived depth. In an earlier study, Stelmachand Tam (1998) showed that subjective image quality of a stereo sequencewas approximately the average of the monoscopic quality of the left- andright-eye images. In this experiment, the stereoscopic image quality of thebinocular combination was approximately the average for all disparities(B= 0, 8 and 12 cm). From the image quality figures, it can be concludedthat there is almost no decrease in image quality when coding at org org,org Q30 and org Q20. The quality drops heavily when one of the views iscoded with a JPEG compression of Q10. This can be explained by the factthat the blockiness artefact is highly visible in Q10. These results are inline with Meegan et al. (2001) who also found an under-weighting of thehigh quality component when blockiness artefacts are present in the im-age. So, asymmetric coding is a valuable way to save bandwidth but oneview must be of high quality (preferable the original) and the compres-sion level of the coded view must be within an acceptable range (in this
65

3. Perceived quality of JPEG coded 3D images
experiment Q20 is allowed). Also an interesting conclusion of this exper-iment is, that the relation between perceived image quality and averagebit-rate is not always straightforward, at least for stereoscopic images.Thus, an increase in average bit-rate does not always result in an increasein perceived image quality. The image quality of Q30 Q30 is higher thanthe image quality of Q10 org, whereas the average bit-rate of Q30 Q30 islower than that of Q10 org.
Camera-base distance had no significant effect on perceived image qual-ity. In the Playmobiles scene there were slight differences and in the Bureauscene there were no differences. As expected, perceived depth increasedwith increasing camera-base distance. An increase in camera-base dis-tance from 0 cm to 8 cm significantly increased perceived depth. Theincrease from 8 cm to 12 cm resulted in a smaller increase in perceiveddepth. Increasing camera-base distance appears to have no effect on per-ceived sharpness in our stimulus set. The last attribute, eye-strain, alsoshowed an increase when camera-base distance increased. This was alsofound by IJsselsteijn et al. (2000b) where averaged results of the eye-strainratings showed a clear linear increase with increasing disparities. Also theresults of Kooi and Toet (2004) showed that increasing disparity is one ofthe most important parameters that cause eye fatigue.
The results of the symptom checklist show that the averaged ratings of theattribute eye-strain differed remarkably from the averaged ratings of theother attributes, although all observers saw the same stimulus set. Thisfinding can be explained by a possible priming effect. Observers directlyassociated the attribute eye-strain with the items on the symptom list,sensitizing them to potential negative effects associated with viewing a3D display.
This research showed that the added value of depth is not always orconsistently taken into account when judging image quality, since no in-crease in image quality was found when depth was increased. Whetheror not depth is taken into account when assessing image quality appearsto depend rather heavily on the type of image impairments present in thestereoscopic pair. So, for the evaluation of 3D TV other concepts than im-age quality may be needed. The next experiment addresses the effect ofJPEG coding on 2D and 3D image content comparing the traditional im-age quality criterion and the naturalness criterion. The results presentedin Chapter 2 suggest that naturalness may be a more sensitive evaluation
66

3.3. Experiment 4
criterion to assess the added value of depth.
3.3 Experiment 4
The results of Experiment 3 showed that the image quality of 3D images israted similarly to the quality of their 2D counterparts when 2D artefacts(JPEG-coding) are visible. This suggests that for the assessment of 3Dcontent, image quality is mainly determined by the visibility of artefactsin the images and not so much by the added value of depth. It is expectedthat naturalness will take the added value of 3D into account, even whenartefacts are visible in the images. Therefore, Experiment 4 is performed,determining image quality and naturalness of JPEG impaired images.
3.3.1 Method
Design
The experiment had a mixed design with Image (2 images), Camera basedistance (0, 4, and 8 cm) and JPEG coding (5 levels) as within subject fac-tors, and two different evaluation concepts (naturalness and image qual-ity) tested between subjects.
Observers
Twenty observers participated in this experiment. Ten observers judgedthe image quality whereas the other ten observers judged the naturalnessof the 3D scenes. The observers, mostly students and Philips employees,had a visual acuity >1 per eye (as tested with the Landolt C chart), a stereovision <30 seconds of arc (as tested with the Randot Stereo Test) and nocolor deficiencies (as tested with the Ishihara test).
Equipment
The ScreenscopeTM(mirror stereoscope) was used to direct the left- andright-eye image of a side-by-side displayed stereo pair to the appropriate
67
3. Perceived quality of JPEG coded 3D images
eye. For detailed information see Chapter 1, section 1.3.3.
Stimuli
The image material used in this experiment consisted of two still scenes,Playmobiles and Bureau, which are the same as in Experiment 3. For thesescenes various levels of depth (0, 4, and 8 cm camera base distance) andJPEG coding (org, Q30, Q20, Q15, Q10) were simulated. The scenes wererecorded in a studio set-up, using a professional stereoscopic studio cam-era in a toed-in configuration. For each scene, lens focal length and con-vergence distance of the cameras to the scene were fixed to 20 mm and1.30 m, respectively. Each scene was recorded at three different camera-base distances, namely 0 cm (i.e., monoscopic), 4 cm and 8 cm. The sceneswere originated in the European DISTIMA project and were kindly pro-vided to us by CCETT in France. The spatial resolution of both sceneswas 720x576 pixels per eye.
In total 2 (scenes) x 3 (depth levels)x 5 (JPEG levels) = 30 images were usedin the stimulus set. The experiment started off with a training session of6 stereoscopic images and also included one repetition measurement perstimulus, so in total 66 stereoscopic images were shown.
Procedure
The set of 60 stereoscopic images was presented sequentially to the ob-servers in a random order. After rating an image a grey adaptationfield was shown (3 seconds) before the next image appears. The im-ages were rated according to the single stimulus scaling method. Eachattribute (image quality and naturalness) was rated by 10 observers. Aquality categorical scale ranging from 1 to 5 was used. On this scale1 corresponds to a bad image quality/naturalness and 5 to an excel-lent image quality/naturalness. The scale was labeled with the adjectiveterms [bad]-[poor]-[fair]-[good]-[excellent] according to the ITU BT500-10 (2000). During the training session (6 stereoscopic images) the ob-servers got acquainted with the stimulus set and its variation in imagequality/naturalness.
68

3.3. Experiment 4
3.3.2 Results
Image Quality
In Figure 3.8, the image quality ratings are shown for the Bureau and Play-mobiles scenes. On the x-axis the JPEG coding levels are indicated andthe y-axis represents the image quality in terms of ThurCatD scale values.The three lines in the figure represent the three camera base distances.
Figure 3.8 shows for both scenes that the image quality for 2D (i.e., 0 cmcamera base distance) and 3D (i.e., 4 and 8 cm camera base distance)scenes is rated about the same. Observers anchored their image qual-ity judgements on the most salient features (e.g., JPEG coding artefacts)while the added value of depth is not recognized. So, the evaluation termimage quality does not take into account the added value of depth.
Naturalness
Figure 3.9 shows the naturalness ratings for the scenes Bureau and Playmo-biles. The x-axis indicates the JPEG coding level and the y-axis representsthe rescaled ThurcatD scale values for naturalness. The different camerabase distances are represented by the three lines in the graph.
Figure 3.9 shows a substantial difference in naturalness between 2D (i.e.,0 cm camera base distance) and 3D (i.e., 4 and 8 cm camera base distance)scenes. The naturalness of 3D scenes is rated higher than 2D scenes for allcompression levels. Naturalness ratings decrease with increasing JPEGcompression for both 2D and 3D. As JPEG compression increases, the dif-ference between 2D and 3D ratings becomes less, indicating that natu-ralness is mainly determined by the introduced artefacts at higher JPEGcompression levels. Nevertheless, the added value of depth is taken intoaccount in the naturalness concept for all compression levels. Apparently,when observers are asked to rate naturalness instead of image quality,they weigh the added value of 3D more and are also more tolerant forsome JPEG artefacts in the images. This suggests that people are morefocussed on image distortions when asked to rate image quality, whereasthey pay less attention to these distortions when asked to rate naturalness.Hence, naturalness seems to be a nice example of a concept weightingmore equally the visibility of the distortion as well as the 3D percept.
69

3. Perceived quality of JPEG coded 3D images
org q30 q20 q15 q101
2
3
4
5Image Quality Bureau scene
JPEG Q−parameter
Imag
e Q
ualit
y (T
hurc
atD
val
ues)
B=0 cmB=4 cmB=8 cm
org q30 q20 q15 q101
2
3
4
5Image Quality Playmobiles scene
JPEG Q−parameter
Imag
e Q
ualit
y (T
hurc
atD
val
ues)
B=0 cmB=4 cmB=8 cm
Figure 3.8: Image quality ratings of the Bureau and Playmobiles scene on a Thur-stone true interval scale as a function of the JPEG coding level (lower bit-rateto the right). The three lines represent the different camera base distances. Ascale value of 1 corresponds to a bad image quality and a scale value of 5 to anexcellent image quality.
70

3.3. Experiment 4
org q30 q20 q15 q101
2
3
4
5Naturalness Bureau scene
JPEG Q−parameter
Nat
ural
ness
(T
hurc
atD
val
ues)
B=0 cmB=4 cmB=8 cm
org q30 q20 q15 q101
2
3
4
5Naturalness Playmobiles scene
JPEG Q−parameter
Nat
ural
ness
(T
hurc
atD
val
ues)
B=0 cmB=4 cmB=8 cm
Figure 3.9: The naturalness ratings of the Bureau and Playmobiles scene expressedin Thurstone scale values as a function of the JPEG coding level (lower bit-rate tothe right). The three lines represent the different camera base distances. A scalevalue of 1 corresponds to a bad naturalness and a scale value of 5 to an excellentnaturalness.
71

3. Perceived quality of JPEG coded 3D images
3.4 Conclusion
The main conclusion of Experiment 3 is that the evaluation criterion im-age quality is not sensitive to depth when displaying JPEG impaired im-age material. In other words, people are more focussed on the JPEG dis-tortions in the 2D and 3D images and do not take into account the addedvalue of depth when judging image quality.
Experiment 2 concludes that naturalness seems to be sensitive to depth. InExperiment 4, the naturalness and image quality concept are directly com-pared for JPEG coded image material. Again, observers anchored theirimage quality judgements on the most salient features (e.g., JPEG cod-ing artefacts) while the added value of depth is not recognized, whereas,the added value of depth is clearly taken into account in the naturalnessconcept for all compression levels. Hence, naturalness seems to be a niceexample of a concept taking into account the 2D JPEG distortion as wellas the 3D percept, and therefore, seems well suited for the evaluation of3D content in contrast to image quality.
This chapter focussed on a 2D distortion (JPEG coding) available in both2D and 3D images. The focus of the next chapter will be on crosstalk, atypical 3D distortion only visible in 3D image material. The focus point ofthe next chapter will be building up general knowledge about the behav-ior of crosstalk in 3D images and try to measure the added value of depthwith the evaluation criterion naturalness.
72

Chapter 4
Perceptual attributes of crosstalk in 3D images
Abstract
Nowadays, crosstalk is probably one of the most annoying distortions in 3D dis-plays. So far, display designers still have a relative lack of knowledge about therelevant subjective attributes affected by crosstalk and how they are combined inan overall 3D visual experience model. Perceptual ’benefits’ of perceived depthcan be nullified by the perceptual ’costs’ of crosstalk, as increasing camera basedistance is the manipulation that both increases depth and crosstalk. The aimof the first experiment described in this chapter is to investigate three percep-tually important attributes influencing the overall visual experience: perceivedimage distortion, perceived depth, and visual strain. The stimulus material usedconsisted of two natural scenes varying in depth (0, 4, and 12 cm camera basedistance) and crosstalk level (0, 5, 10, and 15%). Observers rated the attributesaccording to the ITU BT.500-10 in a controlled experiment. Results show thatimage distortion ratings show a clear increase with increasing crosstalk and in-creasing camera base distance. Especially higher crosstalk levels are more visibleat larger camera base distances. Ratings of visual strain and perceived depthonly increase with increasing camera base distance and remain constant withincreasing crosstalk (at least until 15% crosstalk). In the second experiment,the naturalness concept is compared with the image quality concept for differ-ent crosstalk levels and camera base distances. Results show that naturalnessweighs more equally the visibility of the distortion as well as the added value ofdepth in contrast to image quality.
0This chapter is based on Seuntiens et al. (2005c)
73

4. Perceptual attributes of crosstalk in 3D images
4.1 Introduction
Stereoscopic display techniques are based on the principle of displayingtwo views, with a slightly different perspective, in such a way that theleft eye view is only seen by the left eye and the right eye view onlyby the right eye. In both stereoscopic and auto-stereoscopic displays,separation of the left and right eye view is one of the major challengesfor display designers. Imperfect separation makes a small proportion ofone eye’s image perceptible to the other eye, a phenomenon known ascrosstalk or image ghosting. Crosstalk is generally believed to be un-desirable, and display developers are working to minimize crosstalk asmuch as possible. In view of the fact that a perfect left-right image sepa-ration may not always be feasible, in particular in auto-stereoscopic dis-plays, a deeper understanding is needed of the subjective acceptability(rather than mere detectability) of crosstalk, as well as of the relation be-tween the perceptual attributes that contribute to the overall appreciationof an (auto)stereoscopic display. For example, crosstalk becomes gener-ally more noticeable with an increase in left-right image separation. Asthis is the image manipulation that also introduces stereoscopic depth, anoptimal balance between the added value of depth and the negative effectof crosstalk needs to be found.
The research done on crosstalk to date mainly focuses on characterizingthe factors contributing to crosstalk in several (auto)stereoscopic displaydevices. Significant attention has been directed to quantifying crosstalk intime-sequential stereoscopic displays and design of anti-crosstalk modelsfor these displays. The most important factors contributing to crosstalkin Liquid Crystal Shutter (LCS) systems are slow shuttering, shutter leak-age, and phosphor afterglow of the (CRT-type) monitor. Woods and Tan(2002) measured and quantified sources of image ghosting such as imper-fect shuttering and phosphor afterglow. They found that shutters in theopaque state still had a measurable amount of transmission (shutter leak-age) and the decay time of the red phosphor was much longer than thedecay time of the blue and green phosphor. There was also a considerableamount of variation in crosstalk for several LCS glasses in combinationwith different monitors.
Pastoor (1995) performed an experiment investigating visibility thresh-olds of crosstalk in grey-scale patches. He found that the visibility of
74
4.2. Experiment 5
crosstalk increases with increasing contrast and increasing binocular par-allax of the image. On a high-contrast display (contrast-ratio 100:1) anda reasonable depth range (40 min of arc) crosstalk below 0.3% is invisi-ble in grey-scale patches. Hanazato et al. (1999) measured the visibilitythresholds of crosstalk in relation to the amount of binocular parallax andcontrast, using geometrical test patterns and found that crosstalk levelsbelow 0.2% were invisible. Importantly, they also found that for naturalimages crosstalk levels of up to 2% were unnoticed by observers. This isin line with Lipton (1987) who found that natural images may produceghosting which is less visible than in computer-generated wire-frames,because wire-frame images have hard edges and high contrast. Imageswith more texture or more detail tend to conceal crosstalk. Kooi and Toet(2004) found that vertical disparity, crosstalk and blur are the most impor-tant factors that determine stereoscopic viewing comfort. In summary,crosstalk becomes more visible with increasing parallax, which appearsto be less visible or disturbing when images do not contain sharp edges.
Lipscomb and Wooten (1994) designed a crosstalk reduction algorithm.The algorithm brings the background luminance up to 0.3 (0 = black, 1= white) so that any crosstalk up to a value of 0.3 can be eliminated bydarkening the grey background. This anti-crosstalk algorithm is effectivebut limited to artificial representations, because backgrounds in naturalimages are not homogeneous or black. The anti-crosstalk model of Kon-rad et al. (2000) is based on psychovisual experiments quantifying thecrosstalk in the system. After quantifying the crosstalk, a look-up tablecan be created to generate anti-crosstalk. An advantage is that it can beimplemented in real time, but a disadvantage is that for every system ac-curate measurements have to be carried out to quantify the crosstalk.
4.2 Experiment 5
So far, display designers still have a relative lack of knowledge aboutthe relevant subjective attributes affected by crosstalk and how they arecombined in an overall 3D visual experience model. Therefore, it is veryuseful to quantify perceptually relevant attributes such as image distor-tion, visual eye-strain and perceived depth in relation to crosstalk. Thischapter reports on an experiment that was carried out to obtain a betterunderstanding of the perceptual image attributes that can be affected by
75

4. Perceptual attributes of crosstalk in 3D images
crosstalk using natural images. It is assumed that observers’ preference(visual experience) is a trade-off between perceptual attributes such asimage distortions (ghosting, double lines), visual strain (eye-strain) andimage enhancements (added value of perceived depth). The aim of thecurrent experiment is to investigate these perceptually relevant attributeswhen varying the crosstalk level and the amount of depth (image sepa-ration). Session 1 focuses on monocular and binocular image distortionsand tries to find a combination rule for the left and right eye. Session 2focuses on visual strain and perceived depth.
4.2.1 Method
Design
The experiment had a mixed design with Image (2 images), Camera basedistance (0, 4, and 12 cm) and Crosstalk (4 levels) as within subject factors,and the evaluation concepts tested between subjects.
Observers
Twenty non-expert observers participated in the crosstalk experimentwith natural images. Ten observers participated in session 1 and 10 ob-servers in session 2. The observers, mostly students, came from the sameage group (20-30 years old). All observers had a visual acuity of >1 (astested with the Landolt C test), good stereo vision <30 seconds of arc (astested with the Randot stereo test) and good color vision (as tested withthe Ishihara color vision test).
Equipment
For this experiment, a ScreenscopeTM(mirror stereoscope) was used to di-rect the left- and right-eye image of a side-by-side displayed stereo pairto the appropriate eye. The main advantage of using this display is thatit has perfect image separation, thus allowing for complete experimen-tal control over the percentage of crosstalk. A detailed description of theScreenscopeTMcan be found in Chapter 1, section 1.3.3.
76
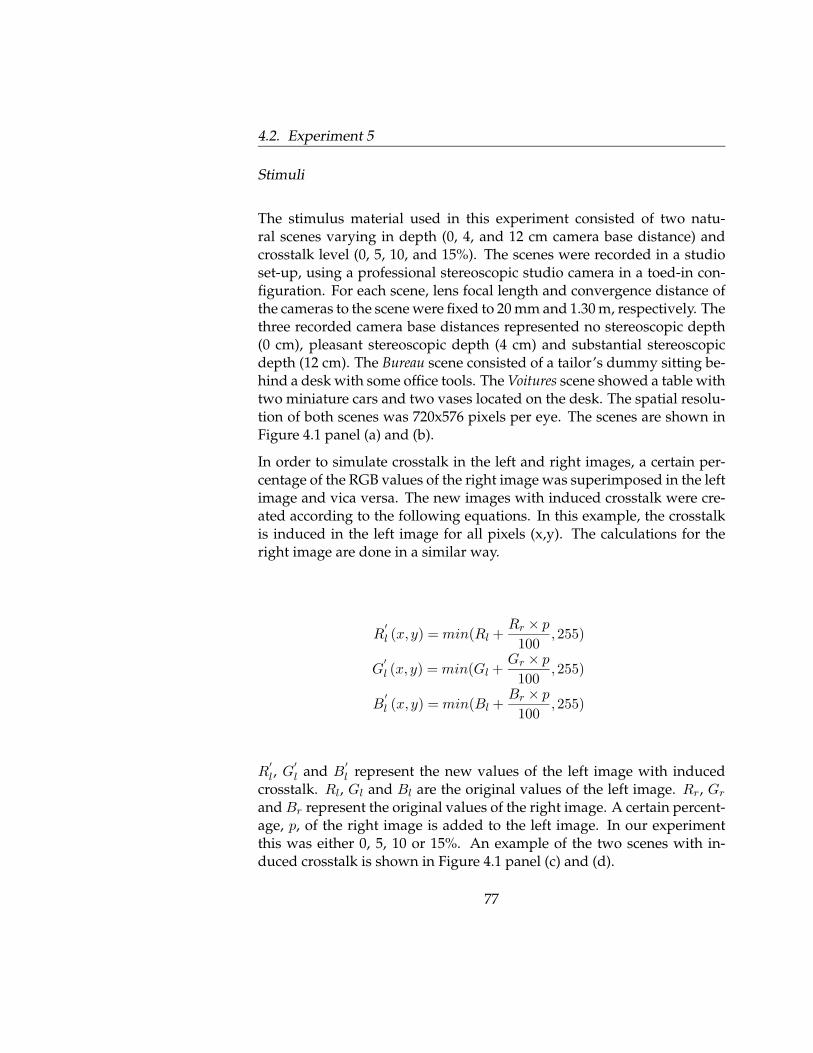
4.2. Experiment 5
Stimuli
The stimulus material used in this experiment consisted of two natu-ral scenes varying in depth (0, 4, and 12 cm camera base distance) andcrosstalk level (0, 5, 10, and 15%). The scenes were recorded in a studioset-up, using a professional stereoscopic studio camera in a toed-in con-figuration. For each scene, lens focal length and convergence distance ofthe cameras to the scene were fixed to 20 mm and 1.30 m, respectively. Thethree recorded camera base distances represented no stereoscopic depth(0 cm), pleasant stereoscopic depth (4 cm) and substantial stereoscopicdepth (12 cm). The Bureau scene consisted of a tailor’s dummy sitting be-hind a desk with some office tools. The Voitures scene showed a table withtwo miniature cars and two vases located on the desk. The spatial resolu-tion of both scenes was 720x576 pixels per eye. The scenes are shown inFigure 4.1 panel (a) and (b).
In order to simulate crosstalk in the left and right images, a certain per-centage of the RGB values of the right image was superimposed in the leftimage and vica versa. The new images with induced crosstalk were cre-ated according to the following equations. In this example, the crosstalkis induced in the left image for all pixels (x,y). The calculations for theright image are done in a similar way.
R′
l (x, y) = min(Rl +Rr × p
100,255)
G′
l (x, y) = min(Gl +Gr × p
100,255)
B′
l (x, y) = min(Bl +Br × p
100,255)
R′
l, G
′
land B
′
lrepresent the new values of the left image with induced
crosstalk. Rl, Gl and Bl are the original values of the left image. Rr, Gr
and Br represent the original values of the right image. A certain percent-age, p, of the right image is added to the left image. In our experimentthis was either 0, 5, 10 or 15%. An example of the two scenes with in-duced crosstalk is shown in Figure 4.1 panel (c) and (d).
77

4. Perceptual attributes of crosstalk in 3D images
100 200 300 400 500 600 700
50
100
150
200
250
300
350
400
450
500
550
100 200 300 400 500 600 700
50
100
150
200
250
300
350
400
450
500
550
(a) (b)
100 200 300 400 500 600 700
50
100
150
200
250
300
350
400
450
500
550
100 200 300 400 500 600 700
50
100
150
200
250
300
350
400
450
500
550
(c) (d)
Figure 4.1: Original scenes Bureau and Voitures are shown in panel (a) and (b).Scenes with induced crosstalk are shown in panel (c) and (d).
78

4.2. Experiment 5
Procedure
In the first session, ten observers assessed the degree of perceived im-age distortion (ghosting, double lines) for static stereoscopic images withinduced crosstalk. In order to be able to separate out the effects of (stereo-scopic) visual strain from (monoscopic) image distortions (ghosting, dou-ble lines), observers were asked to first rate the monocular image distor-tion for the left eye and right eye separately (one eye covered) and next,the binocular image distortion (both eyes open).
In the second session, another ten observers assessed the degree of visualstrain and the degree of perceived depth in two subsessions. The twosubsessions were randomized and contained the same stereoscopic staticimages as in the first session. All images were presented sequentially tothe observers and rated according to the single stimulus scaling methodof the ITU (2000a) using a 5-point numerical categorical scale. The value0 on the scale corresponds with the absence of an attribute in the image.Observers were free to decide when to go to the next image by pressingthe space bar.
Each session took approximately 30 minutes. Before the experimentstarted the observers were asked to read the instructions explaining thetask and attribute they had to rate. Subsequently, the observers partici-pated in a trial of twelve stimuli to get acquainted with the stimulus setand the range of variations in scene, camera base distance and inducedcrosstalk.
4.2.2 Results
Monocular versus binocular image distortion
In the first experiment the perceptual combination of the left and rightmonocular image distortion with different crosstalk levels and camerabase distances was investigated. Therefore, the monocular and binocu-lar image distortions were measured separately and an attempted to finda combination rule was made.
Panel (a) and (b) in Figure 4.3 show the results of the monocular imagedistortion ratings of the left and right eye view as a function of disparity
79

4. Perceptual attributes of crosstalk in 3D images
and crosstalk for both scenes. The amount of implemented crosstalk isshown on the x-axis (0, 5, 10, and 15%). The y-axis represents the esti-mated Thurstone scale values for each data point scaled back to the origi-nal scale. The ThurcatD analysis results show a good model fit (χ2=22.17,p=0.8048 for Bureau and χ2=25.87, p=0.8312 for Voitures). This resultmeans that equal distances on the scale correspond with equal differencesin the percept judged. The lines in the graph represent both left and righteye views for three camera base distances (0, 4, and 12 cm).
A repeated measures ANOVA showed no significant main effect of leftor right eye view on monocular image distortion for both Bureau scene(F(1,9)=18,21, p=0.87) and Voitures scene (F(1,9)=16.63, p=0.93). So, theperceived monocular image distortion is nearly the same for the left andright eye in both scenes.
The Bureau scene shows a constant and low degree of image distortion for0, 4, and 12 cm camera base distance when crosstalk increases from 0 to5%. Crosstalk percentages higher than 5% show an increase in perceivedmonocular image distortion for a camera base distance of 4 cm and evenmore for a camera base distance of 12 cm. In contrast to the Bureau scene,perceived monocular image distortions already increase for low crosstalkpercentages at 4 and 12 cm camera base distance in the Voitures scene. Ob-viously, no crosstalk appears in both scenes for camera base distance of 0cm (left and right view are identical) and this can be regarded as a controlcondition. Both figures in panel (a) and (b) show indeed that monocularimage distortion is rated at a constant low level for this condition, whichbodes well for the reliability of the ratings.
Panel (c) and (d) in Figure 4.3 show the degree of binocular image distor-tion for the scenes Bureau and Voitures. The crosstalk percentages, camerabase distances and the used scale are the same as in the monocular imagedistortion figures. The ThurcatD analysis results show a good model fit(χ2=25.57, p=0.7048 for Bureau and χ2=35.33, p=0.7545 for Voitures). Thisresult means that equal distances on the scale correspond with equal dif-ferences in the percept judged.
The perceived binocular image distortion in the Bureau and Voitures scenein Figure 4.3 panel (c) and (d) follows the same trend as the monocularimage distortion of the left and right eye view in Figure 4.3 panel (a) and(b).
80

4.2. Experiment 5
0 5 10 151
2
3
4
52D image distortion left/right eye view bureau
Crosstalk (%)
Per
ceiv
ed im
age
dist
ortio
nT
hurC
atD
sca
le v
alue
0 cm B left0 cm B right4 cm B left4 cm B right12 cm B left12 cm B right
L
L
L
R
R
R
(a)
0 5 10 151
2
3
4
5 2D image distortion left/right eye view voitures
Crosstalk (%)
Per
ceiv
ed im
age
dist
ortio
nT
hurC
atD
sca
le v
alue
0 cm B left0 cm B right4 cm B left4 cm B right12 cm B left12 cm B right
L
L
R
R
R
L
(b)
Figure 4.2: Results of the monocular image distortion ratings for the left and righteye view of the scenes Bureau and Voitures are shown in panel (a) and (b). The x-axis represents the crosstalk percentage and the y-axis represents the Thurstonevalues for three camera base distances.
81

4. Perceptual attributes of crosstalk in 3D images
0 5 10 151
2
3
4
5 Image Distortion bureau
Crosstalk (%)
Per
ceiv
ed im
age
dist
ortio
nT
hurc
atD
sca
le v
alue
0 cm B4 cm B12 cm B
(c)
0 5 10 151
2
3
4
5 Image Distortion voitures
Crosstalk (%)
Per
ceiv
ed im
age
dist
ortio
nT
hurC
atD
sca
le v
alue
0 cm B4 cm B12 cm B
(d)
Figure 4.3: Results of the binocular image distortion ratings are shown in panel(c) and (d). The x-axis represents the crosstalk percentage and the y-axis repre-sents the Thurstone values for three camera base distances.
82

4.2. Experiment 5
The binocular image distortion ratings of the Bureau and Voitures scene inFigure 4.3 panel (c) and (d) show an increasing trend with increasing cam-era base distance and crosstalk. A repeated measure ANOVA shows a sig-nificant main effect of camera base distance on binocular image distortionfor Bureau (F(2,18)=43.09, p<0.01) and Voitures (F(2,18)=209.55, p<0.01)and a main effect of crosstalk for Bureau (F(3,27)=46.95, p<0.01) andVoitures F(3,27)=99.28, p<0.01). In addition, a significant interaction wasfound between camera base distance and crosstalk on binocular imagedistortion for Bureau (F(6,54)=16.63, p<0.01) and Voitures (F(6,54)=49.04,p<0.01). This interaction has implications for the interpretation of themain effects. The main effect of crosstalk on binocular image distortion isonly valid for a camera base distance of 4 and 12 cm, because the ratingson camera base distance 0 cm remain constant with increasing crosstalk.
The data suggests the following model for the binocular image distortionas a function of the monocular image distortions of the left and right eye.
D3D = 1/2(Dl + Dr)
In this model, D3D represents the calculated binocular image distortionand Dl and Dr represent the left and right eye monocular image distor-tion respectively. This model seems suited because the correlations be-tween the calculated binocular image distortion and the measured binoc-ular image distortion are very high for both scenes (Bureau r = 0.98 andVoitures r = 0.97). So, the perceived binocular image distortion can be rep-resented by the average of the perceived monocular image distortions forthe left and right eye.
Visual strain
Figure 4.4 shows the degree of visual strain for the scenes Bureau andVoitures. The amount of implemented crosstalk is shown on the x-axis(0, 5, 10, 15%). The y-axis represents the estimated Thurstone scale val-ues for each data point scaled back to the original scale. The ThurcatDanalysis results show a good model fit (χ2=21.52, p=0.9377 for Bureau andχ2=19.24, p=0.9729 for Voitures). This result means that equal distanceson the scale correspond with equal differences in the percept judged. The
83
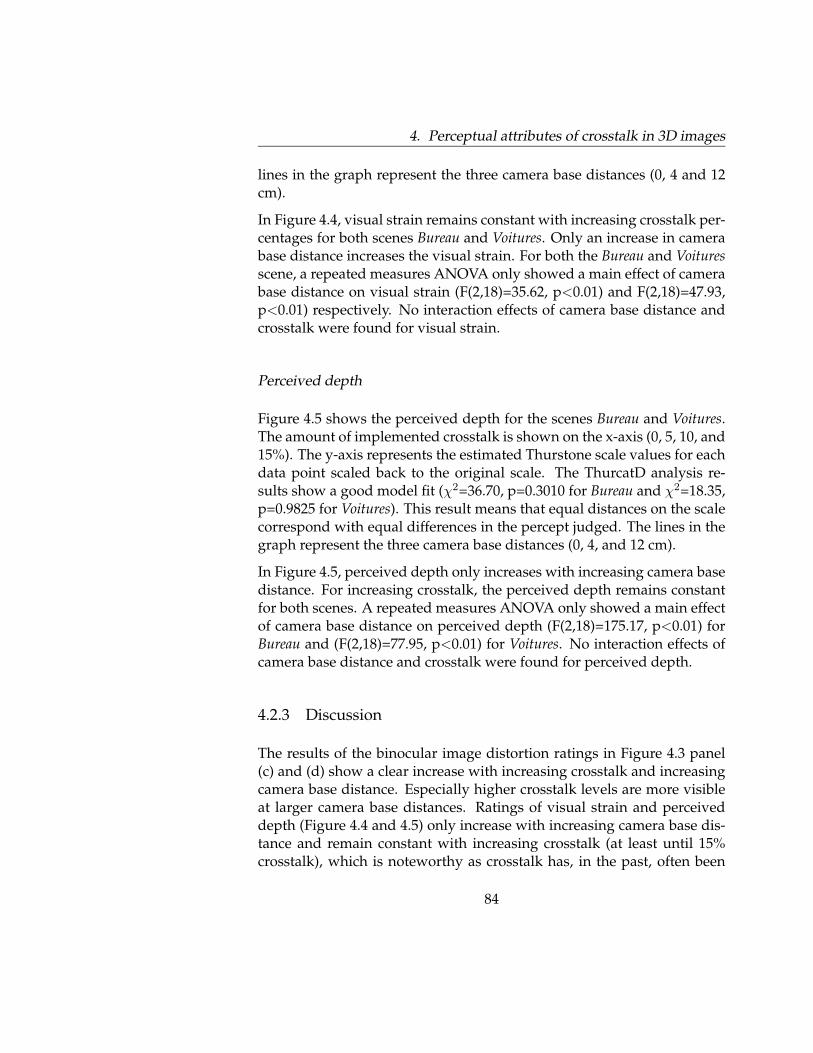
4. Perceptual attributes of crosstalk in 3D images
lines in the graph represent the three camera base distances (0, 4 and 12cm).
In Figure 4.4, visual strain remains constant with increasing crosstalk per-centages for both scenes Bureau and Voitures. Only an increase in camerabase distance increases the visual strain. For both the Bureau and Voituresscene, a repeated measures ANOVA only showed a main effect of camerabase distance on visual strain (F(2,18)=35.62, p<0.01) and F(2,18)=47.93,p<0.01) respectively. No interaction effects of camera base distance andcrosstalk were found for visual strain.
Perceived depth
Figure 4.5 shows the perceived depth for the scenes Bureau and Voitures.The amount of implemented crosstalk is shown on the x-axis (0, 5, 10, and15%). The y-axis represents the estimated Thurstone scale values for eachdata point scaled back to the original scale. The ThurcatD analysis re-sults show a good model fit (χ2=36.70, p=0.3010 for Bureau and χ2=18.35,p=0.9825 for Voitures). This result means that equal distances on the scalecorrespond with equal differences in the percept judged. The lines in thegraph represent the three camera base distances (0, 4, and 12 cm).
In Figure 4.5, perceived depth only increases with increasing camera basedistance. For increasing crosstalk, the perceived depth remains constantfor both scenes. A repeated measures ANOVA only showed a main effectof camera base distance on perceived depth (F(2,18)=175.17, p<0.01) forBureau and (F(2,18)=77.95, p<0.01) for Voitures. No interaction effects ofcamera base distance and crosstalk were found for perceived depth.
4.2.3 Discussion
The results of the binocular image distortion ratings in Figure 4.3 panel(c) and (d) show a clear increase with increasing crosstalk and increasingcamera base distance. Especially higher crosstalk levels are more visibleat larger camera base distances. Ratings of visual strain and perceiveddepth (Figure 4.4 and 4.5) only increase with increasing camera base dis-tance and remain constant with increasing crosstalk (at least until 15%crosstalk), which is noteworthy as crosstalk has, in the past, often been
84

4.2. Experiment 5
0 5 10 151
2
3
4
5Visual strain bureau
Crosstalk (%)
Per
ceiv
ed v
isua
l str
ain
Thu
rCat
D s
cale
val
ue
0 cm B4 cm B12 cm B
0 5 10 151
2
3
4
5Visual strain voitures
Crosstalk (%)
Per
ceiv
ed v
isua
l str
ain
Thu
rCat
D s
cale
val
ue
0 cm B4 cm B12 cm B
Figure 4.4: Visual strain ratings for the 3D scenes Bureau and Voitures. The x-axis represents the crosstalk percentage and the y-axis represents the Thurstonevalues for 3 camera base distances.
85

4. Perceptual attributes of crosstalk in 3D images
0 5 10 151
2
3
4
5 Perceived depth bureau
Crosstalk (%)
Per
ceiv
ed d
epth
Thu
rCat
D s
cale
val
ue
0 cm B4 cm B12 cm B
0 5 10 151
2
3
4
5 Perceived depth voitures
Crosstalk (%)
Per
ceiv
ed d
epth
Thu
rCat
D s
cale
val
ue
0 cm B4 cm B12 cm B
Figure 4.5: Perceived depth ratings for the 3D scenes Bureau and Voitures. The x-axis represents the crosstalk percentage and the y-axis represents the Thurstonevalues for 3 camera base distances.
86

4.3. Experiment 6
cited as one of the potential causes of eye strain (Pommeray et al., 2003).However, in the current experiment relatively short display times wereemployed (between 5-10 seconds), thus it is possible that watching stereo-scopic content for a longer time will increase visual strain with highercrosstalk levels. In natural image material, some crosstalk is allowed butit depends strongly on the scene content as shown in this experiment.Image distortions caused by crosstalk percentages up to 5% are hardlyvisible in the Bureau scene for all camera base distances, as in contrastto the Voitures scene were crosstalk is visible as soon as it is introduced.Difficult to say is where crosstalk becomes visible in the Voitures scenebecause the only measurements were at 0% and 5% crosstalk but our re-sults are in line with Hanazato et al. (1999) who suggested a threshold fornatural images around 2%. Based on their information, display design-ers should keep the system crosstalk below 2% in order to show naturalstereoscopic content without any problems. Also, small depth settings re-duce the visibility of image distortions due to crosstalk as shown in thisexperiment. Image distortions at 4 cm camera base distance are less vis-ible than image distortions with the same intensity at 12 cm camera basedistance. Perceived depth of both scenes increases significantly as soonas camera base distance is increased from 0 cm to 4 cm. The added valueof perceived depth is very small, when increasing the camera base dis-tance further to 12 cm, so, a nice depth percept is already perceived at4 cm camera base distance with the added advantage that perceived im-age distortion and eyestrain are significantly lower than at larger camerabase distances. This experiment investigated only crosstalk percentagesup to 15% crosstalk but it is well possible that visual strain will increasewith crosstalk percentages above 15%. Also, perceived depth may be af-fected negatively for crosstalk percentages higher than 15% because offusion problems. In the next experiment, image quality and naturalnessconcepts are directly compared for crosstalk impaired images.
4.3 Experiment 6
This experiment focuses on both aspects depth reproduction andcrosstalk. More precisely, both image quality and naturalness are eval-uated on crosstalk- impaired images. Previous experiments show that theimage quality of 3D images is rated approximately equal to their 2D coun-
87

4. Perceptual attributes of crosstalk in 3D images
terparts when 2D or 3D artefacts are visible. Thus it appears that imagequality is mainly determined by the visibility of artefacts in the imagesand not so much by the added value of depth. It is expected that natu-ralness will take the added value of 3D into account, even when artefactsare visible in the images.
4.3.1 Method
Design
The experiment had a mixed design with Image (2 images), Camera basedistance (0, 4, and 8cm) and Crosstalk (5 levels) as within subject factors,and the two different evaluation concepts (image quality and naturalness)tested between subjects.
Observers
Twenty observers participated in this experiment. Ten of them judgedimage quality whereas another ten observers judged naturalness of the3D scenes. The observers, mostly students and employees of a researchdepartment, had a visual acuity >1 per eye (as tested with the Landolt Cchart), a stereo vision <30 seconds of arc (as tested with the Randot StereoTest) and no color deficiencies (as tested with the Ishihara test).
Equipment
For running the experiment the PORT (Perceptie Onderzoek ResearchTool) system was used, which was developed at Philips to automaticallycreate test scripts and collect data. It consists of 3 hardware componentsconnected via a network:
• Port console: This is an ordinary PC showing the test leader theuser-interface and controls of the experiment.
• Port participant interface: This PC (in our case a notebook) displaysa user interface giving the participant the opportunity to enter hisor her score.
88

4.3. Experiment 6
• Video streamer: A high-end PC with dedicated hardware (Radeon9000 graphics card, hard disk) and inhouse developed software(VideoSim) that allows to show sequences in real-time. The videostreamer is connected to a Philips Brilliance 107P2 CRT monitor(1600x1200).
Twenty test scripts were generated using the port system and each testscript contained a randomized sequence of the stimulus set. The port con-sole used these scripts as input and controlled the video streamer show-ing the images on the CRT monitor. Observers assessed the image usingthe port participant interface and their score was saved in the port con-sole. The final results were saved in a text file containing subject number,stimulus set, and accompanying scores.
Also for this experiment, a ScreenscopeTM(mirror stereoscope) was usedto direct the left- and right-eye image of a side-by-side displayed stereopair to the appropriate eye. A detailed description of the Screenscope canbe found in Chapter 1, section 1.3.3.
Stimuli
The image material used in this experiment consisted of two still scenes,Playmobiles and Bureau, recorded with the same professional stereoscopicstudio camera as in Experiment 5. The scene Playmobiles consists of acolorful toy landscape with mountains in the background and numer-ous Playmobiles in the foreground. The scene Bureau consists of a tai-lor’s dummy sitting behind a desk with some office equipment. For thesescenes various levels of depth (0, 4, and 8 cm camera base distance) andcrosstalk (0, 5, 10, 15, and 20%) were simulated. The spatial resolution ofboth scenes was 720x576 pixels per eye.
The simulation of crosstalk is described in section 4.2.1. An example ofthe two original scenes (panel (a) and (b)) and crosstalk induced scenes(panel (c) and (d)) is shown in Figure 4.6
In total 2 (scenes) x 3 (depth levels)x 5 (crosstalk levels) = 30 images wereused in the stimulus set. The experiment consisted of first a training ses-sion of 6 stereoscopic images and also included one repetition measure-ment per stimulus, so in total 66 stereoscopic images were shown.
89

4. Perceptual attributes of crosstalk in 3D images
(a) (b)
(c) (d)
Figure 4.6: Original scenes Playmobiles and Bureau are shown in panel (a) and (b).Scenes with induced crosstalk are shown in panel (c) and (d).
90

4.3. Experiment 6
Procedure
The set of 66 stereoscopic images was presented sequentially to the ob-servers in a random order. A grey adaptation field was shown betweentwo consecutive stimuli. The images were rated according to the singlestimulus scaling method. Each attribute (image quality and naturalness)was rated by 10 observers. A categorical scale ranging from 1 to 5 wasused. On this scale 1 corresponds to bad image quality/naturalness and5 to excellent image quality/naturalness. The scale was labeled with theadjective terms [bad]-[poor]-[fair]-[good]-[excellent] according to the ITUBT500-10 (2000). During the training the observers got acquainted withthe stimulus set and its variation in image quality/naturalness.
4.3.2 Results
Image Quality
In Figure 4.7, the image quality ratings are shown for the Bureau and Play-mobiles scenes. On the x-axis the crosstalk levels are indicated. The y-axisrepresents the estimated Thurstone scale values for each data point scaledback to the original scale. The ThurcatD analysis results show a goodmodel fit (χ2=25.67, p=0.9778 for Bureau and χ2=37.68, p=0.6609 for Play-mobiles). This result means that equal distances on the scale correspondwith equal differences in the percept judged. The three lines in the figurerepresent the three camera base distances.
Figure 4.7 shows for both scenes that the 2D image quality (i.e., B = 0cm) is independent of crosstalk level and is rated as good over the wholerange of crosstalk levels. This was expected because crosstalk is a typi-cal 3D distortion linked to the disparity between the left and right eye.Hence, it does not occur in 2D images. 3D image quality only exceeds 2Dimage quality when the 3D image is undistorted (0% crosstalk). As soonas some crosstalk is introduced in the natural images, image quality israted the same (for 5% crosstalk) or lower (for higher levels of crosstalk)in 3D images compared to 2D images. A higher disparity (e.g., B = 8 cm)results in a lower image quality rating compared to lower disparity val-ues (e.g., B = 4 cm) when crosstalk is introduced in the images. Since thisis not the case at zero crosstalk distortion, there clearly is some interac-
91

4. Perceptual attributes of crosstalk in 3D images
0 5 10 15 201
2
3
4
5Image Quality Bureau scene
Crosstalk (%)
Imag
e Q
ualit
y (T
hurc
atD
val
ues)
B=0 cmB=4 cmB=8 cm
0 5 10 15 201
2
3
4
5Image Quality Playmobiles scene
Crosstalk (%)
Imag
e Q
ualit
y (T
hurc
atD
val
ues)
B=0 cmB=4 cmB=8 cm
Figure 4.7: Image quality ratings of the Bureau and Playmobiles scene on a Thur-stone true interval scale as a function of the crosstalk level. The three lines repre-sent the different camera base distances. A scale value of 1 corresponds to a badimage quality and a scale value of 5 to an excellent image quality.
92

4.3. Experiment 6
tion between camera base distance and crosstalk level affecting the imagequality. This is due to the higher visibility of double edges in images witha higher disparity.
Naturalness
Figure 4.8 shows the naturalness ratings for the scenes Bureau and Play-mobiles. The x-axis indicates the crosstalk level. The y-axis representsthe estimated Thurstone scale values for each data point scaled back tothe original scale. The ThurcatD analysis results show a good model fit(χ2=40.03, p=0.5579 for Bureau and χ2=45.70, p=0.3210 for Playmobiles).This result means that equal distances on the scale correspond with equaldifferences in the percept judged.The different camera base distances arerepresented by the three lines in the graph.
Similarly to the image quality scores, also the naturalness scores are in-dependent of crosstalk level when the camera base distance is 0 cm. Asmentioned above, this is not surprising, since crosstalk is a 3D distortionnot affecting the quality of a 2D image. The image quality of the 2D im-ages is on average considered to be good, whereas their naturalness isjudged to be just fair. The naturalness of 3D images is rated higher thanthat of 2D images up to crosstalk levels of 10%. Only when the crosstalklevel exceeds 10%, naturalness is rated lower in 3D images than in 2D im-ages. Observers indicated that at this level the crosstalk distortion getsvery annoying and influences the naturalness percept negatively. Ap-parently, when observers are asked to rate naturalness instead of imagequality, they weight the added value of 3D more and are also more toler-ant for some crosstalk in the images. This suggests that people are morefocussed on image distortions when asked to rate image quality, whereasthey pay less attention to these distortions when asked to rate natural-ness. Hence, naturalness seems to be a nice example of a concept weight-ing more equally the visibility of the distortion as well as the 3D percept,as was also shown in previous chapters in relation to other image distor-tions.
93
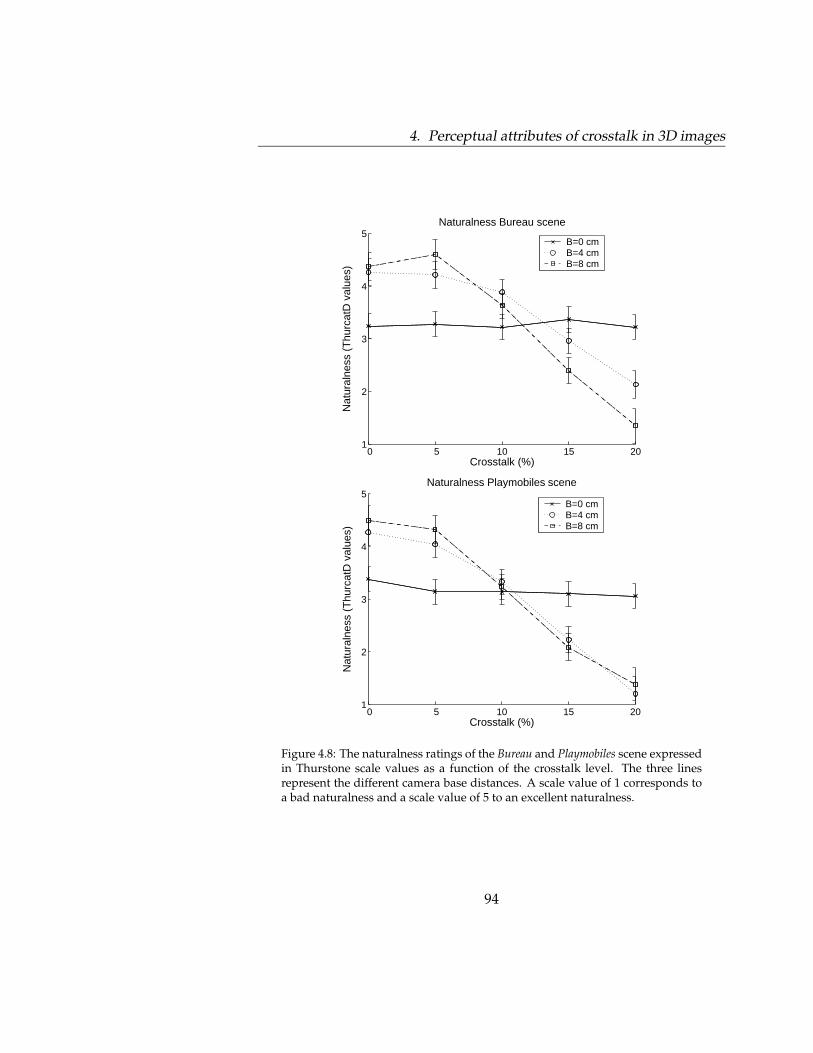
4. Perceptual attributes of crosstalk in 3D images
0 5 10 15 201
2
3
4
5Naturalness Bureau scene
Crosstalk (%)
Nat
ural
ness
(T
hurc
atD
val
ues)
B=0 cmB=4 cmB=8 cm
0 5 10 15 201
2
3
4
5Naturalness Playmobiles scene
Crosstalk (%)
Nat
ural
ness
(T
hurc
atD
val
ues)
B=0 cmB=4 cmB=8 cm
Figure 4.8: The naturalness ratings of the Bureau and Playmobiles scene expressedin Thurstone scale values as a function of the crosstalk level. The three linesrepresent the different camera base distances. A scale value of 1 corresponds toa bad naturalness and a scale value of 5 to an excellent naturalness.
94

4.4. Conclusion
4.4 Conclusion
In sum, the experiments in Chapter 4 were performed to gain better in-sights in the behavior of a typical 3D distortion (crosstalk) in relation toperceptually relevant attributes such as perceived image distortion, visualstrain, and perceived depth. The ’benefits’ of the added value of depthcan be nullified by the ’costs’ of crosstalk, as increasing camera base dis-tance is the parameter that both increases crosstalk and depth.
The main conclusion of Experiment 5 is that perceived image distortionincreases with increasing crosstalk levels and increasing camera base dis-tance. Visual strain and perceived depth are not affected at all by increas-ing crosstalk (< 15%). Increasing camera base distance is the only param-eter that increases visual strain and perceived depth.
Experiment 6 concludes that naturalness of 3D images is rated higher thanthe naturalness of 2D images up to crosstalk levels of 10%. Image qualityratings are always higher for the 2D images as soon as crosstalk is visiblein the 3D images. This suggests that people judging image quality aremore focussed on image distortions, whereas they take into account theadded value of depth when judging naturalness.
Now that we have more insights in the behavior of 2D (JPEG) and 3D(crosstalk) image distortions and how to measure the added value ofdepth, we make a next step and try to model two evaluation concepts interms of image quality and depth in Chapter 5. An additional experimentis performed in Chapter 5 to have a complete and valid data set in whichnaturalness, viewing experience, image quality, and depth are evaluated.In the second part of Chapter 5, the modeling part is described.
95

4. Perceptual attributes of crosstalk in 3D images
96

Chapter 5
Modeling the added value of 3D
Abstract
The goal of this chapter is to model the concepts viewing experience and natu-ralness in terms of image quality and depth. In order to achieve this, reliableweighs are needed and therefore all data should come from experiments contain-ing the same stimulus set and set-up. An additional experiment is describedin this chapter to complete the data set. The main conclusion of this additionalexperiment is that image quality exhibited a higher score for the ’2D’ depth levelthan for higher depth levels, whereas the opposite is true for naturalness. In thecase of viewing experience all the depth levels got more or less similar scores.Thus, naturalness takes into account the added value of depth, whereas imagequality does not.The variables in the overall data set used for the actual modeling are the type ofartefact (2D or 3D artefacts) and the content generation method (conversionor multi-view recording). Naturalness and viewing experience are modeledin terms of image quality and depth according to a linear combination of im-age quality and depth. Results show that naturalness incorporates more imagequality than viewing experience in those cases where only the perceived imagequality is varied, and not the amount of depth. In cases where depth is varied,naturalness takes the added value of depth more into account than viewing ex-perience. Hence, the criterion naturalness seems to balance the perceived imagequality and the perceived depth.
0This chapter is based on Lambooij et al. (2005)
97
5. Modeling the added value of 3D
5.1 Introduction
The main objective of this chapter is to model the concepts viewing expe-rience and naturalness in terms of image quality and depth. A completedata set must be obtained before both concepts can be modeled appropri-ately. The variables in the final data set are different artefacts (2D and 3D)and different content generation methods (2D-3D conversion or multi-view recording). A comparison is made between 2D-3D conversion usinga single image as input and multi-view recording with 9 cameras. The ad-vantage of multi-view recording is that full information from 9 angles (9images) is available and can be displayed on the multi-view display. Thedisadvantage of the 2D-3D conversion algorithm is the occlusion problemwhich gets constantly worse when increasing the virtual camera base dis-tance in the algorithm. The advantage is that the format is flexible and theamount of depth can be adjusted. In Experiment 7, the data set for mod-eling the concepts viewing experience and naturalness will be completed.Next, the actual modeling will be done.
5.2 Experiment 7
This experiment focuses on image quality, perceived depth, viewing ex-perience and naturalness of 2D and 3D image material. 2D-3D conversionsoftware (introducing depth artefacts) and multi-view camera recordings(accurate depth representation) are directly compared in one experimentto complete the data set for the actual modeling.
5.2.1 Method
Design
The experiment had a within subjects design with Content (four scenes),Depth (four levels: 2D, 2D-3D conversion with two settings of the cam-era base distance, and multi-view recording), and Noise (three levels) asdependent variables and image quality, depth, viewing experience, andnaturalness as independent variables.
98

5.2. Experiment 7
Observers
One female and thirteen male naive observers participated in the experi-ment. Seven observers worked in a research environment, five observerswere internal graduation students and two observers were external stu-dents all with a technical background. Their ages ranged from 26 to 34.All observers had good stereo vision (<40 seconds of arc as tested withthe Randot stereo test).
Equipment
A 20” Philips multi-view auto-stereoscopic display as described in Chap-ter 1, section 1.3.3 was used in this experiment . Nine different views weregenerated either using 2D-3D conversion software or using a nine-camerarecording setup. Custom built software (PORT, Perceptie Onderzoek Re-search Tool) was used to conduct this psychophysical experiment.
Stimuli
The image material used in this experiment consisted of four originalstatic scenes (see Figure 5.1). Two images from Experiment 1 (Motor andFruit) and two from Experiment 2 (Rose and Puzzle). The two originalsRose and Puzzle were shot using the nine-camera recording setup (accu-rate depth information). The middle view (camera five) was used as 2Dinput for the conversion algorithm. The two other originals (Motor andFruit) were originally 2D, and hence, for these stimuli nine-view camerarecordings were not available.
For all four originals the 2D content was converted into 3D with the ’real-time’ algorithm (best performing algorithm) as described in Experiment1. Different depth levels (2D, 0.01 cbd, 0.02 cbd) were applied by varyingthe camera base distance parameter in the ’realtime’ algorithm. The algo-rithm generates 3D images containing nine views. A camera base distanceof 0.01 in the algorithm corresponds to a distance of 1 cm between each ofthe nine virtual views. The view-offset, i.e., the part that is displayed infront of the screen was 1/3 (2/3 was displayed behind the screen).
All output images had a resolution of 1600x1200 pixels and were directly
99
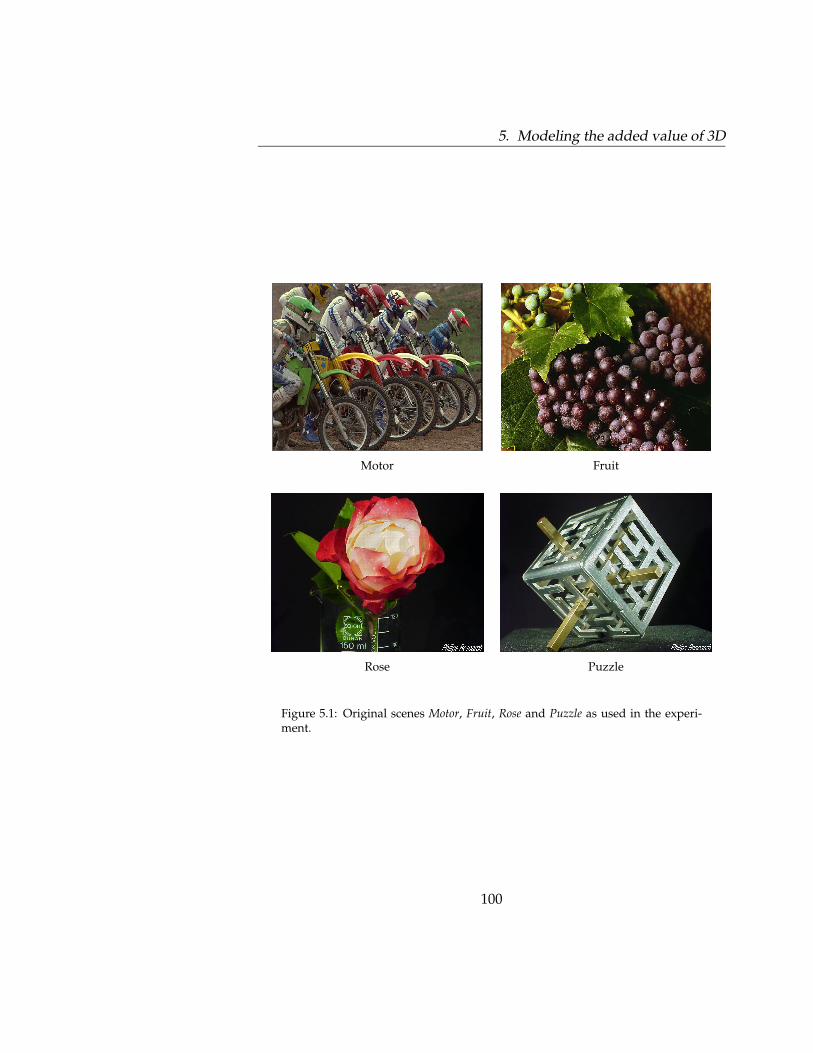
5. Modeling the added value of 3D
Motor Fruit
Rose Puzzle
Figure 5.1: Original scenes Motor, Fruit, Rose and Puzzle as used in the experi-ment.
100

5.2. Experiment 7
displayed on the 20” Philips multi-view auto-stereoscopic monitor. Threelevels of white Gaussian noise (x = 0, σ2 = 0, 0.005, 0.02) were added to alloutput images after 2D-3D conversion. This resulted in stimuli with nodistortion (original image) to stimuli with a PSNR (Peak Signal to NoiseRatio) of 19 dB for both 2D and 3D images.
Procedure
The stimuli were evaluated by four different evaluation criteria, namelyimage quality, depth, naturalness and viewing experience. The ratingscale for all evaluation criteria was labeled with the adjective terms [bad]-[poor]-[fair]-[good]-[excellent] according to the ITU (2000a) recommenda-tion regarding subjective quality assessment. In every session observershad to assess the same set of stimuli, but for different evaluation crite-ria. The evaluation criteria were assigned in random order to observersto cancel out order effects. Two criteria were combined into one session,so each subject had to come back once with at least five days in betweentwo rating sessions. Prior to the experiment, observers were given a briefintroduction on paper about the experiment. Any remaining questionswere answered and subsequently a short training session was conducted.The training consisted of six stills that were also present in the experi-ment. The training session was implemented to make the observers fa-miliar with the assessment method and with the extremes with respectto depth and noise levels. The actual experiment consisted of 42 stim-uli. Four images, three depth levels (conversion), and three noise levels(4x3x3) plus a nine-view depth level for two images with three noise lev-els each (1x2x3). The lighting conditions of the room were constant for allobservers and the level of light in the room was 3 lux, measured perpen-dicular to the display in the direction of the viewer.
5.2.2 Results
The statistical analyses applied on the subjective data were Thurstonescaling and MANOVA. The MANOVA’s independent variables wereDepth, Content, and Noise and the dependent variables were the eval-uation criteria image quality, depth, viewing experience, and naturalness.
A Thurstone analysis (as described in Chapter 3, paragraph 3.2.2) on the
101

5. Modeling the added value of 3D
subjective data revealed a good model fit which implies that the distancebetween scale values was perceived as equal. Further analysis of this ex-periment was divided into two separate parts, namely with and withoutthe nine-view depth level. These sets must be analyzed separately, be-cause the nine-view depth level was an additional depth level that wasonly available for two of the four original images. So, when the nine-viewdepth level was incorporated, the analysis was performed on two origi-nal images and when the nine-view depth level was not incorporated, theanalysis was performed on all four original images.
Effects of content, depth and noise without the nine-view depth level
The averaged assessment scores as a function of noise level and depthlevel with their error bars are plotted in Figure 5.2 for each of the assess-ment criteria.
From Figure 5.2, it is clear that naturalness, viewing experience and im-age quality all seem similarly influenced by the introduced noise, that is,the assessment criteria revealed similar slopes as a function of the noiselevel. Perceived depth however, seems less influenced by noise. It is alsoclear that the ’0.02’ depth level received the lowest scores for naturalness,viewing experience and image quality. This low score is mainly due to an-noying depth artefacts and some color artefacts caused by the ’realtime’algorithm at higher depth levels. The perceived depth for the ’0.02’ levelwas not scored higher than for the ’0.01’ level, although the introduceddepth was higher for the ’0.02’ depth level. As expected, depth showsthe lowest score for the ’2D’ depth level. Finally, it should be noted, thatimage quality exhibited a higher score for the ’2D’ depth level than forthe ’0.01’ depth level, whereas the opposite was true for naturalness andviewing experience. Thus, naturalness and viewing experience take intoaccount the added value of depth whereas image quality does not.
The main effect of Depth level was significant for all evaluation criteria.This result is clearly visible in Figure 5.2 (in all panels), where the depthlines are significantly different from each other. The ’0.02’ depth levelshowed low assessments for naturalness, viewing experience and imagequality. The main effect of Noise was also significant for all evaluationcriteria, although the perceived depth seems less influenced by noise.Three out of four evaluation criteria take into account the impairment
102

5.2. Experiment 7
org 23dB 19dB1
2
3
4
5Naturalness
Noise level (PSNR)
Sco
re
2D3D 0.013D 0.02
org 23dB 19dB1
2
3
4
5Image Quality
Noise level (PSNR)
Sco
re
2D3D 0.013D 0.02
org 23dB 19dB1
2
3
4
5Viewing Experience
Noise level (PSNR)
Sco
re
2D3D 0.013D 0.02
org 23dB 19dB1
2
3
4
5Depth
Noise level (PSNR)
Sco
re2D3D 0.013D 0.02
Figure 5.2: Ratings for Naturalness, Image quality, Viewing experience andDepth of the Motor, Fruit, Rose and Puzzle scenes as a function of noise level.The three lines represent the different camera base distances (2D, 0.01 and 0.02cbd). A scale value of 1 corresponds to bad and a scale value of 5 to excellent.
103

5. Modeling the added value of 3D
introduced by noise. The last main effect, namely Content, was also sig-nificant for all evaluation criteria and this was mainly due to some clearconversion artefacts in the images Fruit and Puzzle. Although there was asignificant effect of Content, the scores of the four scenes were averagedfor each assessment criterion because similar main effects and trends werevisible and in the same direction in the data of all images.
The three possible two-way interactions between the three fixed factorsdiffered in significance. The interaction Content x Noise was not signif-icant for all evaluation criteria. The Content x Depth interaction wassignificant for viewing experience (F(6,479)=2.278, p=0.035) and imagequality (F(6,479)=3.715, p=0.001) and was not significant for naturalness(F(6,479)=1.905, p=0.078) and depth (F(6,479)=1.002, p=0.423). The be-haviour of the content was fairly similar for the ’0.01’ depth level and forthe 2D depth level, but considerably different for the ’0.02’ depth level.The depth artefacts introduced at the ’0.01’ depth were subtle and diffi-cult to see. However, the ’0.02’ depth level exaggerated these artefacts. Astimulus containing many depth artefacts (objects in wrong depth planes)received a lower score than a stimulus with fewer depth artefacts. The in-teraction Depth x Noise was also significant for all evaluation criteria.Further analysis revealed that increasing noise resulted in smaller dif-ferences between the different depth levels. This seems plausible, sincewhen there is too much noise, the differences between the depth levels be-come unclear and overwhelmed by the noise. The 2D stimuli were scoredhigher than the 3D stimuli in terms of image quality (p < .05), but lower interms of naturalness. The assessment in terms of viewing experience didnot differ for the 2D and ’0.01’ depth levels. As expected, the 2D depthlevel gave the lowest score for the evaluation criterion depth. For imagequality, the 2D depth level gave the best results, whereas the ’0.01’ levelresulted in the highest scores for naturalness and viewing experience.
Effects of content, depth and noise including the nine-view depth level
The averaged (over all observers) assessment scores as a function of noiseand depth level and their error bars are plotted in Figure 5.3 for the differ-ent assessment criteria to get a better understanding of the results. Theseresults are based on the images Rose and Puzzle.
Similar trends can be observed as in Figure 5.2 (i.e., without the nine-
104

5.2. Experiment 7
org 23dB 19dB1
2
3
4
5Naturalness
Noise level (PSNR)
Sco
re
2D3D 0.013D 0.029−views
org 23dB 19dB1
2
3
4
5Image Quality
Noise level (PSNR)
Sco
re
2D3D 0.013D 0.029−views
org 23dB 19dB1
2
3
4
5Viewing Experience
Noise level (PSNR)
Sco
re
2D3D 0.013D 0.029−views
org 23dB 19dB1
2
3
4
5Depth
Noise level (PSNR)
Sco
re2D3D 0.013D 0.029−views
Figure 5.3: Ratings for Naturalness, Image quality, Viewing experience andDepth of the Rose and Puzzle scenes as a function of noise level. The four linesrepresent the different camera base distances (2D, 0.01 cbd, 0.02 cbd and 9-view).A scale value of 1 corresponds to bad and a scale value of 5 to excellent.
105
5. Modeling the added value of 3D
view depth level). Increasing noise levels seem to have a similar effecton viewing experience, naturalness and image quality, but depth ratingsseem to be less affected by increasing noise levels. The ’0.02’ depth levelreceived the lowest scores for naturalness, viewing experience and imagequality and is valued almost the same as the ’0.01’ depth level in termsof depth although it introduced more depth. Depth ratings for the nine-view recordings received the highest scores. And finally, image qualitywas rated higher for the ’2D’ depth level than for the nine-view and the’0.01’ depth level, whereas the opposite is true for naturalness. In the caseof viewing experience all the depth levels, except for the ’0.02’ level, gotsimilar scores.
The main effect of Depth was significant for all evaluation criteria. As ex-pected, also Noise had a strong influence on the assessment of the stimuliand was also significant for all criteria, but to a lesser degree for the depthcriterion. Finally, also a significant main effect of Content was found forall criteria. The scene Puzzle was scored considerably higher than thescene Rose. Nevertheless, they both exhibited the same trends regardingNoise and Depth.
The three possible two-way interactions behave very similar to the inter-actions found without the nine-view depth level. The interaction Contentx Noise was not significant for all evaluation criteria. The Content x Depthinteraction was significant for all criteria. The image Puzzle scored higherexcept in the ’nine-view’ case. This could be the result of an artefact inthe nine-view depth level of the image Puzzle. The corner of the cubethat points out of the screen towards the viewer was a little blurred inthe nine-view depth level. The interaction Depth x Noise was also signifi-cant for all evaluation criteria. Again, increasing noise resulted in smallerdifferences between the different depth levels. The assessment in termsof image quality was lower for the nine-view depth level than for the 2Ddepth level, but higher in terms of naturalness. No differences were foundin terms of viewing experience.
5.3 Towards a 3D Visual Experience model
As mentioned before, one of the goals of this thesis is to determine whichevaluation criterion takes into account the added value of depth. The
106

5.3. Towards a 3D Visual Experience model
term Visual Experience is used to denote an overarching category char-acterizing the final outcome of an assessment proces where perceptualcosts and benefits are weighted against each other in relation to relevantcharacteristics of visual display systems. In the case of a stereoscopic 3Dsystem, Visual Experience is a mix of perceived image quality, perceiveddepth and visual comfort as stated in Chapter 1. The contribution of vi-sual comfort to the 3D Visual experience is not incorporated in the modeldescribed below. Future research is needed to give more insights into vi-sual comfort related to 3D Visual experience. Thus, the model is limitedto the contributions of image quality and perceived depth.
In this chapter different evaluation concepts that incorporate to some de-gree the added value of depth, more particularly naturalness and viewingexperience, were applied. Since also image quality and perceived depthwere assessed, it is possible to find a relation for both evaluation criteria(naturalness and viewing experience) in terms of image quality and per-ceived depth. In general terms, this relation is given in Equation 5.1 withEC the evaluation criterion.
EC = α · IQ + β ·D + γ (5.1)
Both evaluation criteria naturalness and viewing experience (EC) takeinto account image quality (α · IQ) as well as perceived depth (β · D)and a residual term (γ). Given that observers scored all evaluation crite-ria in different sessions and used the same scale and range, it might beassumed that for most observers the given scores are not absolute scores,but rather relative scores. As a consequence, the coefficients α and β areonly relative contributions and no absolute coefficients.
Table 5.1 describes five stimulus sets and their variations in 2D artefacts(noise), 3D artefacts (depth artefacts due to conversion) and depth vari-ation (2D, 0.01 cbd, 0.02 cbd, 9 views). These five sets are based on thestimuli from Experiment 1 (only the stills) and Experiment 7. Stimulusset I and II result from Experiment 1 and stimulus set III, IV, and V resultfrom Experiment 7.
Table 5.2 depicts the results of a regression analysis on Equation 5.1 basedon the data from Experiment 1 (only the still images) and Experiment7. In order to get a better understanding of the impact of 2D artefacts, 3D
107

5. Modeling the added value of 3D
Table 5.1: Description of the different stimulus variations includ-ing 2D artefacts, 3D artefacts and depth variation (
√= present).
Stimulus 2D artefact 3D artefact Depth variationset noise depth
2D 0.01 0.02 9v
I -√
-√
- -II -
√-
√ √-
III√
-√
- -√
IV√ √ √ √ √
-V
√ √ √ √ √ √
artefacts, and depth variation on the model, a distinction is made betweenfive stimulus sets.
The results for stimulus set I in Table 5.2 show that for naturalness the co-efficient for image quality (α) is relatively high and for depth (β) is verylow. Experiment 1 confirms this, i.e., the behavior of naturalness with re-spect to the different algorithms is very similar to the behavior of imagequality and is completely different from the behavior of depth. Compa-rable results hold for the coefficients of viewing experience, although forimage quality the coefficient is somewhat lower, and for depth somewhathigher compared to naturalness.
Results for stimulus set II reveal that both naturalness and viewing expe-rience mostly incorporate image quality, but they also incorporate depth.Naturalness incorporates more depth than viewing experience as shownby the depth coefficient (β) and viewing experience incorporates moreimage quality as shown by the image quality coefficient (α). These resultsare not in line with the regression results of stimulus set I, where natural-ness incorporated more image quality than viewing experience and theinfluence of the perceived depth on both naturalness and viewing experi-ence was almost negligible.
Regression results for stimulus set III reveal that the coefficient of depth(β) is higher for naturalness than for viewing experience. This is in linewith results found in Experiment 2 where the difference between 2D and
108
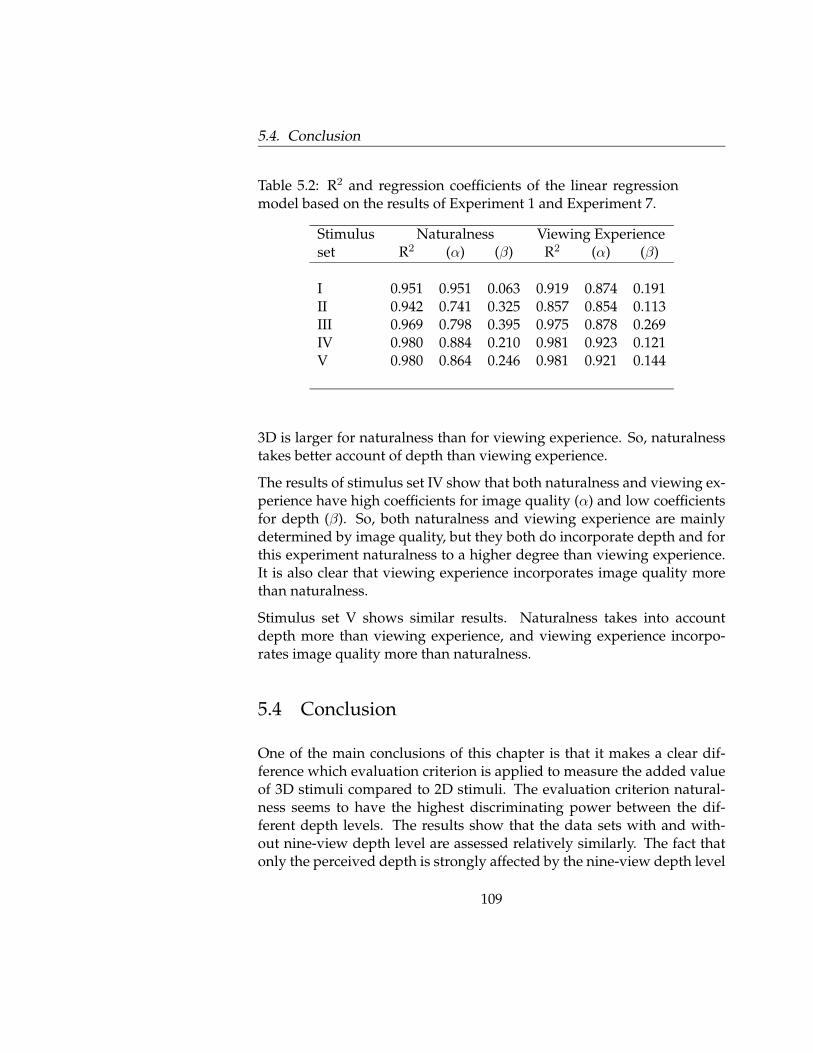
5.4. Conclusion
Table 5.2: R2 and regression coefficients of the linear regressionmodel based on the results of Experiment 1 and Experiment 7.
Stimulus Naturalness Viewing Experienceset R2 (α) (β) R2 (α) (β)
I 0.951 0.951 0.063 0.919 0.874 0.191II 0.942 0.741 0.325 0.857 0.854 0.113III 0.969 0.798 0.395 0.975 0.878 0.269IV 0.980 0.884 0.210 0.981 0.923 0.121V 0.980 0.864 0.246 0.981 0.921 0.144
3D is larger for naturalness than for viewing experience. So, naturalnesstakes better account of depth than viewing experience.
The results of stimulus set IV show that both naturalness and viewing ex-perience have high coefficients for image quality (α) and low coefficientsfor depth (β). So, both naturalness and viewing experience are mainlydetermined by image quality, but they both do incorporate depth and forthis experiment naturalness to a higher degree than viewing experience.It is also clear that viewing experience incorporates image quality morethan naturalness.
Stimulus set V shows similar results. Naturalness takes into accountdepth more than viewing experience, and viewing experience incorpo-rates image quality more than naturalness.
5.4 Conclusion
One of the main conclusions of this chapter is that it makes a clear dif-ference which evaluation criterion is applied to measure the added valueof 3D stimuli compared to 2D stimuli. The evaluation criterion natural-ness seems to have the highest discriminating power between the dif-ferent depth levels. The results show that the data sets with and with-out nine-view depth level are assessed relatively similarly. The fact thatonly the perceived depth is strongly affected by the nine-view depth level
109
5. Modeling the added value of 3D
seems plausible. The nine-view depth level contains the largest and mostaccurate depth information (hardly any depth artefacts are present).
Earlier chapters revealed that naturalness in contrast to image qualitydoes incorporate depth. In this chapter (comparing 2D, 3D converted and3D recorded images in one experiment), 2D images receive also higherscores for image quality than the 3D stimuli. For viewing experience,there are only small, but no significant, differences between 2D and 3D,with a small preference for 3D. Naturalness, on the other hand, is scoredhigher for 3D. This is also in line with Chapter 2, concluding that the shiftbetween 2D and 3D is larger for naturalness than for viewing experience.
The relationship modeled in Equation 5.1 is applied to five differentdata sets. In four cases naturalness includes depth to a greater extentthan viewing experience. This is true when 2D artefacts (noise) and 3Dartefacts (depth artefacts due to 2D-3D conversion) in combination withdepth variation are introduced. Only when no depth variation is intro-duced (stimulus set I), both naturalness and viewing experience do nottake into account the added value of depth, and are mainly related toimage quality. Apparently, naturalness incorporates image quality morethan viewing experience in those cases where only perceived image qual-ity is varied, and not the amount of depth. In cases where also depthis varied, naturalness takes the added value of depth more into accountthan viewing experience. Hence, the criterion naturalness seems to bal-ance the perceived image quality and the perceived depth more than thecriterion viewing experience. Therefore, it is concluded that naturalnessis the best concept to evaluate the quality of 3D image content.
The last chapter looks back on the insights gained from the work on 3Dquality. A redefined 3D Visual Experience model is presented and theapplicability of the model is discussed.
110

Chapter 6
General Discussion
6.1 Main Conclusions
Stereoscopic television has a long history and the last few years a con-sensus has been reached that a successful introduction of 3D televisionbroadcast services can only be a lasting success if the perceived imagequality and the viewing comfort are at least comparable to conventional2D television. In addition, 3D television technology should be compat-ible with conventional 2D television to ensure a gradual transition fromone system to the other. This is becoming increasingly feasible becauseof recent progress in capturing, coding, and display technology. Centralto these developments is the viewer’s experience which will signify suc-cess or failure of the proposed technological innovations. Potential pos-itive effects of introducing the depth dimension in television have oftenbeen assumed, but paradoxically, the majority of image quality studiesof stereoscopic displays failed to show the added value of 3D. Thus, onecentral goal of this thesis was to identify and test subjective evaluationparadigms that would be able to characterize this experience. A secondgoal of this thesis was to describe a 3D visual experience model incor-porating image quality, depth and visual comfort. In this way we willbe able to systematically analyse perceptual issues regarding 3D TV andproduce requirements for design improvements that will eventually leadto a 3D TV system that will be accepted by consumers in their homes.
Chapter 1 provided some basic principles of the human visual system anddiscussed how monocular and binocular cues are used to construct a 3D
111

6. General Discussion
representation of the world surrounding us. Furthermore, we describedan end-to-end 3D broadcast chain that includes content generation, cod-ing, transmission, and display. The acceptance and commercial succes ofsuch a system aimed at the consumer market depend to a large extent onthe users’ experience with and responses towards the system. Therefore,it is important to have a clear understanding of the visual experience of3D TV, both looking at the potential added value of 3D, as well as the po-tential drawbacks for users. In Chapter 1, a number of existing subjectiveassessment methods for the evaluation of 2D and 3D imaging systems arereviewed. Engeldrum (2004) describes a model of subjective image qual-ity for display systems, which helps manufacturers to implement and in-tegrate image quality into their products. This model was developed for2D image quality and was taken as a point of departure for the current3D work. We believe that a 3D visual experience model should incorpo-rate image quality, depth and visual comfort. A first concept is describedin Chapter 1 along with a description of possible new evaluation criteriafor 3D TV like presence, naturalness and viewing experience. It was hy-pothesized that these concepts would take into account the added valueof depth and this was investigated in the following chapters.
The main objective of Chapter 2 was to explore which evaluation crite-rion is most appropriate to assess 3D quality. Therefore, an explorativeexperiment was performed using different (not yet optimal) 2D-3D con-version algorithms to generate the 3D image material and measured as-sessment of image quality, depth, viewing experience, naturalness, andpresence. An important caveat for the results of Experiment 1 is that theresults are based on image material containing 3D depth artefacts due to2D-3D conversion algorithms, only 3D images (no 2D reference), and no2D image artefacts (for instance noise). Results of Experiment 1 indicatethat viewing experience and naturalness have the highest discriminatingpower between the different 2D-3D conversion algorithms. Experiment2 investigated the concepts viewing experience and naturalness in moredetail having complete experimental control over the stimulus set. Perfect2D and 3D image material was used and several controlled noise degra-dations were added manually to the images making the added value ofdepth quantifiable in terms of units of noise impairments. Robust resultsshow that naturalness and viewing experience both take into account theadded value of depth as well as the introduced noise distortion. Natural-ness seems to have the highest discriminating power between 2D and 3D
112

6.2. Adapted 3D Visual Experience model
images.
The focus of Chapter 3 is the direct comparison between the traditionalimage quality concept and the naturalness concept for 2D JPEG artefacts.Results from Experiment 3 show that perceived depth is not affected byJPEG coding and perceived image quality is equal for 2D and 3D im-ages. This means that image quality is sensitive for coding distortions(as expected) but does not account for the depth dimension. Experiment4 shows that the naturalness concept clearly weighs the image distortionand the added value of depth in contrast to image quality and therefore iswell suited for the evaluation of 3D content containing 2D artefacts suchas JPEG coding.
Chapter 4 focuses on the direct comparison between the traditional im-age quality concept and the naturalness concept for 3D crosstalk artefacts.Experiment 5 shows that perceived depth is not affected at all by increas-ing crosstalk. An important observation is that perceived image distor-tion scales with increasing crosstalk and increasing depth, which is notthe case with 2D distortions (such as JPEG) which are independent of theamount of depth (see chapter 3). The results from Experiment 6 show thatas soon as crosstalk is visible in the 3D images the image quality ratingsfor 3D are lower than the image quality ratings for 2D. Crosstalk levelsup to 10% exhibit a higher naturalness score for 3D than for 2D images.So, naturalness also seems an appropriate concept measuring the addedvalue of 3D for image material containing 3D artefacts like crosstalk.
Modeling the added value of 3D is the main topic in Chapter 5. Fromimage quality and depth measurements the viewing experience and nat-uralness were predicted with a linear regression analysis and convincingfits were found for the evaluation criteria viewing experience and natu-ralness. Our results show that naturalness is the best concept weightingboth image quality and depth.
6.2 Adapted 3D Visual Experience model
The traditional Image Quality Circle (as proposed by Engeldrum (2004),described in Chapter 1) seems to be a useful framework for the optimiza-tion of 3D display systems. However, as the experiments in this thesisshow, the image quality concept alone is not enough to measure the vi-
113

6. General Discussion
Image Quality Depth Visual comfort
Naturalness
3D Visual experience
Figure 6.1: 3D Visual experience model
sual experience of a 3D display, since the depth dimension is not incor-porated. Image quality mainly appears to be sensitive to 2D image dis-tortions. Naturalness, on the other hand, appears to be more useful incharacterizing the experience related to a 3D display. In Figure 6.1, anexpansion of the Image Quality Circle for the optimization of 3D displaysystems is proposed.
The image quality box in this model is the same as the upper box in themodel of Engeldrum (2004). The image quality ratings of a 3D TV systemcan be predicted from the technological variables by using the traditionalImage Quality model. The concept naturalness is a higher order conceptin the model, weighting both image quality and depth. Visual comfort(dashed line in the model) was not central to this thesis, but will be ofgreat importance for the success of 3D TV. To date, no comprehensive3D visual experience model is available combining image quality, depth,and visual comfort. This model is a first step forward in measuring over-all 3D visual experience. Future research will investigate the role of vi-sual comfort in our proposed model. In the future, this model will beextended with other applications providing us with an enhanced visualexperience, e.g., AmbiLight TV (Philips, 2004). This feature introduced byPhilips provides ambient light on the walls behind the TV to improve thevisual experience. So, not the depth dimension but the light dimension issupposed to enhance the visual experience.
114

6.3. Applicability of the 3D Visual Experience model
6.3 Applicability of the 3D Visual Experience model
The applicability of the 3D visual experience model depends on the typeof application. 3D TV is a typical appreciation-oriented application andthe goal is to enhance the 3D visual experience of observers. So, theemphasis of broadcasting and entertainment applications is to provide awhole new visual experience. Our model is well suited for appreciation-oriented applications and takes into account typical appreciation-orientedattributes such as the added value of depth and also, potentially, factors ofvisual comfort. The goal is to present the images as ’pleasing’ as possible.
On the other hand, the model may be less suited for performance-orientedapplications such as medical imaging. The intention of images for med-ical imaging is not to provide the viewer with a whole new visual expe-rience, but to enable the doctor to make the right diagnosis. 2D imagequality for broadcast applications depends on important attributes suchas brightness, color rendering, contrast, and sharpness. Some of these2D image quality attributes are also important for medical imaging, butnormally medical image quality is measured in terms of sensitivity, di-agnostic accuracy, and specifity and not in terms of image quality. Thediagnostic results also strongly depend on the observer’s experience in aparticular medical area. Another example of a performance-oriented ap-plication is a surveillance camera system. Although some image qualityaspects are important, the main goal of such a system is to provide imagematerial which is optimized for face recognition.
6.4 Future Research
Future research will focus on visual comfort of 3D display systems whichstill is an important issue in current displays. The difficulty of this prob-lem is that increasing the depth level decreases the visual comfort. So, atrade-off is necessary between the depth range of a 3D display and thevisual comfort. It is important to have a complete understanding of theadvantages and drawbacks of a 3D TV system. Therefore, our 3D visualexperience model could contribute to a lower cost design cycle for 3DTV taking into account the perceptual costs and benefits of the completesystem so that the technological parameters can be optimized to an opti-
115

6. General Discussion
mal visual experience. Although 3D technology has made significant ad-vances over the last years, still some progress must be made before 3D TVcan be introduced to the consumer’s market. In this respect, human fac-tors research plays an essential role addressing perceptual and usabilityissues, and optimizing the design of 3D technology from a user-centeredperspective.
So will 3D TV replace conventional television anytime soon? Probablynot in the short term, because the TV market has recently been confrontedwith some technology pushes, e.g. HDTV and digital broadcasting. How-ever, the new visual experience that 3D TV offers to the user is too attrac-tive to be ignored. Within two years, 3D TV will start as a new applicationfor conventional PCs, probably with later adaptation to the gaming indus-try, which are then already hooked up to the TV set situated in the livingroom. The progress speed will depend on the effort required to createattractive content. Nevertheless, from today’s developments one can beoptimistic that the scientific and technological challenges of 3D TV will besurmountable: A new visual experience lies ahead of us.
116

Bibliography
Ahumada, A. J. (1993). Computational image quality metrics: a review.SID Digest, 24:305–308.
Berthold, A. (1997). The influence of blur on the perceived quality and sen-sation of depth of 2D and stereo images. Technical report, ATR HumanInformation Processing Research Laboratories.
Boschman, M. (2000). ThurcatD: A tool for analyzing ratings on an ordinalcategory scale. Behavior Research Methods, Instruments, and Computers,32:379–388.
Daly, S. (1993). The visible differences predictor: An algorithm for theassessment of image fidelity. In Watson, A. B., editor, Digital Images andHuman Vision, pages 179–206. New York: MIT Press.
de Ridder, H. (1992). Minkowski-metrics as a combination rule for digital-image-coding impairments. Proceedings of the SPIE, 1666:16–26.
de Ridder, H. (1996). Naturalness and image quality: Saturation and light-ness variation in color images of natural scenes. Journal of Imaging Sci-ence and Technology, 40:487–498.
de Ridder, H., Blommaert, F., and Fedorovskaya, E. (1995). Naturalnessand image quality: Chroma and hue variations in color images of nat-ural scenes. Proceedings of the SPIE, 2411:51–61.
Dodgson, N. (2004). Variation and extrema of human interpupillary dis-tance. Proceedings of the SPIE, 5291:36–46.
Engeldrum, P. (2000). Psychometric Scaling. Imcotek Press, Winchester,Massachusetts, USA.
117

Bibliography
Engeldrum, P. (2004). A theory of image quality: The image quality circle.Journal of Imaging Science and Technology, 48:447–457.
Eskicioglu, A. A. and Fisher, P. S. (1995). Image quality measures andtheir performance. IEEE Transactions on Communications, 43:2959–2965.
Fedorovskaya, E., de Ridder, H., and Blommaert, F. (1997). Chroma vari-ations and perceived quality of color images of natural scenes. ColorResearch and applications, 22:96–110.
Freeman, J. and Avons, S. (2000). Focus group exploration of presencethrough advanced broadcast services. Proceedings of the SPIE, 3959:530–539.
Gonzalez, R. C. and Woods, R. E. (1992). Digital Image Processing.Addison-Wesley publishing company, Inc.
Hanazato, A., Okui, M., Yamanoue, H., and Yuyama, I. (1999). Evaluationof crosstalk in stereoscopic display. Proceedings 3D Image Conference,pages 258–263.
IJsselsteijn, W. (2004). Presence in Depth. Ph.D. thesis, Eindhoven Univer-sity of Technology, The Netherlands.
IJsselsteijn, W., de Ridder, H., and Freeman, J. (2001). Effects of stereo-scopic presentation, image motion, and screen size on subjective andobjective corroborative measures of presence. Presence: Teleoperators andVirtual Environments, 10:298–311.
IJsselsteijn, W., de Ridder, H., Freeman, J., and Avons, S. (2000a). Pres-ence: Concept, determinants and measurement. Proceedings of the SPIE,3959:520–529.
IJsselsteijn, W., de Ridder, H., and Hamberg, R. (1998a). Perceptual factorsin stereoscopic displays: The effect of stereoscopic filming parameterson perceived quality and reported eye-strain. Proceedings of the SPIE,3299:282–291.
IJsselsteijn, W., de Ridder, H., Hamberg, R., Bouwhuis, D., and Freeman, J.(1998b). Perceived depth and the feeling of presence in 3DTV. Displays,18:207–214.
118

Bibliography
IJsselsteijn, W., de Ridder, H., and Vliegen, J. (2000b). Effects of stereo-scopic filming parameters and display duration on the subjective as-sessment of eye strain. Proceedings of the SPIE, 3957:12–22.
IJsselsteijn, W., de Ridder, H., and Vliegen, J. (2000c). Subjective evalua-tion of stereoscopic images: Effects of camera parameters and displayduration. IEEE Transactions on Circuits and Systems for Video Technology,10:225–233.
IJsselsteijn, W., Seuntiens, P., and Meesters, L. (2002). ATTEST Deliverable1: State of the art in human factors and quality issues of stereoscopic broadcasttelevision. Technical report, Eindhoven University of Technology.
ITU (2000a). Methodology for the subjective assessment of the quality oftelevision pictures. Recommendation BT.500-10.
ITU (2000b). Subjective assessment of stereoscopic television pictures.Recommendation BT.1438.
Janssen, T. and Blommaert, F. (2000). Visual metrics: Discriminativepower through flexibility. Perception, 29:965–980.
Johanson, M. (2001). Stereoscopic video transmission over the internet.Proceedings of the IEEE Workshop on Internet Applications, pages 12–19.
Karunasekera, S. A. and Kingsbury, N. G. (1995). A distortion measurefor blocking artifacts in images based on human visual sensitivity. IEEETransactions on image processing, 4:713–724.
Kayargadde, V. and Martens, J.-B. (1996a). Perceptual characterization ofimages degraded by blur and noise: Experiments. Journal of the OpticalSociety of America A, 13:1166–1177.
Kayargadde, V. and Martens, J.-B. (1996b). Perceptual characterization ofimages degraded by blur and noise: Model. Journal of the Optical Societyof America A, 13:1178–1188.
Konrad, J., Lacotte, B., and Dubois, E. (2000). Cancellation of imagecrosstalk in time-sequential displays of stereoscopic video. IEEE Trans-actions on Image Processing, 9:897–908.
Kooi, F. and Toet, A. (2004). Visual comfort of binocular and 3D displays.Displays, 25:99–108.
119

Bibliography
Laihanen, P., Lindholm, M., Rouhiainen, S., Saarelma, N., and Tuuteeeri,L. (1994). Automatic color correction. Proceedings of the Second IS&T/SIDColor Imaging Conference: Transportability of Color, pages 97–102.
Lambooij, M., IJsselsteijn, W., Heynderickx, I., and Seuntiens, P. (2005).What is the appropriate attribute to measure 3D quality? Technical report,Eindhoven University of Technology.
Levelt, W. (1965). On Binocular Rivalry. Assen, The Netherlands: RoyalVanGorcum.
Libert, J. M. and Fenimore, C. P. (1999). Visibility thresholds forcompression-induced image blocking: measurement and models. Pro-ceedings of the SPIE, 3644:197–206.
Lipscomb, J. and Wooten, W. (1994). Reducing crosstalk between stereo-scopic views. Proceedings of the SPIE, 2177:92–96.
Lipton, L. (1987). Factors affecting ghosting in time-multiplexed plano-stereoscopic CRT display systems. Proceedings of the SPIE, 761:75–78.
Lubin, J. (1993). The use of psychophysical data and models in the anal-ysis of display system performance. In Watson, A. B., editor, DigitalImages and Human Vision, pages 163–178. New York: The MIT Press.
Mansson, J. (1998). Stereovision: A Model for Human Stereopsis. Technicalreport, Lund University Cognitive Studies, Sweden.
Marr, D. (1982). Vision. W.H. Freeman and Co, San Francisco.
Meegan, D. V., Stelmach, L. B., and Tam, W. J. (2001). Unequal weight-ing of monocular inputs in binocular combination: implications for thecompression of stereoscopic imagery. Journal of Experimental Psychology:Applied, 7:143–153.
Meesters, L. (2002). Predicted and perceived quality of bit-reduced gray-scalestill images. Ph.D. thesis, Eindhoven University of Technology, TheNetherlands.
Meesters, L., IJsselsteijn, W., and Seuntiens, P. (2004). A survey of per-ceptual evaluations and requirements of three-dimensional tv. IEEETransactions on Circuits and Systems for Video Technology, 14:381–391.
120

Bibliography
Mitsuhashi, T. (1996). Evaluation of stereoscopic picture quality with CFF.Ergonomics, 39:1344–1356.
Okuyama, F. (1999). Evaluation of stereoscopic display with visual func-tion and interview. Proceedings of the SPIE, 3639:28–35.
Palmer, S. (1999). Vision Science. MIT Press, Cambridge, Massachusetts,USA.
Pastoor, S. (1995). Wahrnehmungsgrenzen fur stationares Ubersprechen.Internal Report HHI, BMFT-Vorhaben: 01 BK 101.
Pastoor, S. and Wopking, M. (1997). 3D displays: A review of currenttechnologies. Displays, 17:100–110.
Perkins, M. G. (1992). Data compression of stereopairs. IEEE Transactionson Communications, 40:684–696.
Philips (2004). Philips Ambilight technology illuminates the future of homeentertainment. Technical report.
Pommeray, M., Kastelik, J., and Gazalet, M. (2003). Image crosstalk re-duction in stereoscopic laser-based display systems. Journal of ElectronicImaging, 12:689–696.
Roufs, J. A. J. (1992). Perceptual image quality: Concept and measure-ment. Philips Journal of Research, 47:35–62.
Schreer, O., Kauff, P., and Sikora, T. (2005). 3D Videocommunication: Al-gorithms, concepts and real-time systems in human centred communication.Wiley.
Seuntiens, P., Heynderickx, I., and IJsselsteijn, W. (2005a). Viewing experi-ence and naturalness of 3D images. Proceedings of the SPIE, 6016:43–49.
Seuntiens, P., Meesters, L., and IJsselsteijn, W. (2005b). Perceived qualityof compressed stereoscopic images: Effects of symmetric and asymmet-ric JPEG coding and camera separation. ACM Transactions on AppliedPerception, accepted 2005 and to be published 2006.
Seuntiens, P., Meesters, L., and IJsselsteijn, W. (2005c). Perceptual at-tributes of crosstalk in 3D images. Displays, 26:177–183.
121

Bibliography
Sexton, I. and Surman, P. (1999). Stereoscopic and autostereoscopic dis-play systems. IEEE Signal Processing Magazine, 16:85–99.
Slater, M., Steed, A., and Chrysanthou, Y. (2002). Computer Graphics andVirtual Environments. Addison-Wesley Publishing Company, Inc.
Smith, C. and Dumbreck, A. (1988). 3-D TV: The practical requirements.Television: Journal of the Royal Television Society, pages 9–15.
Stelmach, L., Tam, W., Speranza, F., Renaud, R., and Martin, T. (2003).Improving the visual comfort of stereoscopic images. Proceedings of theSPIE, 5006:269–282.
Stelmach, L., Tam, W. J., Meegan, D., and Vincent, A. (2000). Stereo imagequality: Effects of mixed spatio-temporal resolution. IEEE Transactionson Circuits and Systems for Video Technology, 10:188–193.
Stelmach, L. B. and Tam, W. J. (1998). Stereoscopic image coding: effect ofdisparate image-quality in left- and right-eye views. Signal Processing:Image Communications, 14:111–117.
Tam, W., Stelmach, L., and Corriveau, P. (1998). Psychovisual aspects ofviewing stereoscopic video sequences. Proceedings of the SPIE, 3295:226–235.
Thurstone, L. (1927). A law of comparative judgment. Psychological Re-view, 34:273–286.
van Berkel, C. and Clarke, J. (1997). Characterization and optimization of3d-lcd module design. Proceedings of the SPIE, 3012:179–186.
van den Branden Lambrecht, C. J. (1996). Perceptual Models and Archi-tectures for Video Coding Applications. PhD thesis, Ecole PolytechniqueFederale de Lausanne.
Watson, A. B. (1987). Efficiency of a model human image code. Journal ofthe Optical Society of America A, 4:2401–2417.
Westheimer, G. and McKee, S. (1980). Stereoscopic acuity with defocusedand spatially filtered retinal images. Journal of the Optical Society of Amer-ica, 7:772–778.
122

Bibliography
Wheatstone, C. (1838). Contributions to the physiology of vision: Ii. onsome remarkable, and hitherto unobserved, phenomena of binocularvision. Philosophical Transactions of the Royal Society, 128:371–394.
Winkler, S. (1999). Issues in vision modelling for perceptual video qualityassessment. Signal Processing, 78:231–252.
Witmer, B. and Singer, M. (1998). Measuring presence in virtual envi-ronments: A presence questionnaire. Presence: Teleoperators and VirtualEnvironments, 7:225–240.
Woods, A. and Tan, S. (2002). Characterising sources of ghosting in time-sequential stereoscopic video displays. Proceedings of the SPIE, 4660:66–77.
Yamanoue, H., M.Nagayama, M.Bitou, and and, J. (1998). Orthostereo-scopic conditions for 3D HDTV. Proceedings of the SPIE, 3295:111–120.
Yano, S. (1991). Experimental stereoscopic high-definition television. Dis-plays, 12:58–64.
123

Bibliography
124

Samenvatting
Sinds de komst van de televisie is er veel onderzoek verricht naar het ver-beteren van o.a. kleurweergave, beeldkwaliteit, en geluidskwaliteit. Eennieuwe stap voorwaarts is de introductie van drie-dimensionale televisiewaarbij het totale beeld een diepte impressie geeft aan de kijker. Objectenkomen uit het scherm of verdwijnen achter het scherm.
In de echte wereld nemen we diepte waar omdat onze ogen gemiddeld6.5 cm uit elkaar staan. Ieder oog ziet daardoor een ander perspectiefvan de wereld. Onze hersenen mappen deze twee beelden en extraherendiepte-informatie uit de verschuiving van de twee beelden. Dit principewordt ook toegepast in de drie-dimensionale televisie waarbij een lenzensysteem ieder oog van een verschillend beeld voorziet.
Bij het optimaliseren van televisiebeelden wordt vaak gekeken naar dealgehele beeldkwaliteit. Subjectieve testen met gebruikers worden ge-bruikt om de optimale instelling van de technische parameters te vin-den. Voor de conventionele televisie (twee- dimensionaal) zijn er al mo-dellen beschikbaar die de algehele beeldkwaliteit voorspellen, maar zijndeze modellen toereikend om de drie-dimensionale ervaring te meten?Wij denken dat voor een drie-dimensional model alleen beeldkwaliteit devolledige lading niet dekt maar dat ook factoren zoals de kwaliteit van degereproduceerde diepte en het visueel comfort een belangrijke rol spelen.
Het doel van dit proefschrift is het begrijpen, meten en het modellerenvan de drie-dimensionale visuele ervaring. Dit proefschrift onderzoektverschillende nieuwe concepten voor de evaluatie van drie-dimensionalebeelden en vergelijkt deze met een bestaand beeldkwaliteitsmodel.
In hoofdstuk 2 bekijken we welk evaluatiecriterium het meest geschiktis om drie-dimensionale visuele ervaring the meten. De criteria beeld-
125

Samenvatting
kwaliteit, diepte, natuurlijkheid, presence, en kijkervaring zijn onder-zocht in experiment 1 waarbij verschillende 3D conversie algoritmen zijngetest. Deze algoritmen zijn nog niet perfect en bevatten nog enkelebeeldfouten. De resultaten laten zien dat kijkervaring en natuurlijkheidhet grootste onderscheidend vermogen hebben tussen 2D en 3D gecon-verteerde beelden. In experiment 2 leggen we de focus op de criteriakijkervaring en natuurlijkheid en gebruiken we 2D en 3D beeldmateri-aal zonder diepte fouten. Als gecontroleerde verstoring hebben we witteruis gebruikt en resultaten laten zien dat de criteria kijkervaring en na-tuurlijkheid de ruisverstoring in gelijke maten meewegen. Tevens blijktdat natuurlijkheid gevoeliger is voor diepte dan kijkervaring.
Hoofdstuk 3 beschrijft experimenten waarbij gekeken wordt naar heteffect van symmetrische en asymmetrische JPEG codering (typische2D verstoring) en camera basis afstand op verschillende evaluatiecrite-ria. In experiment 3 onderzoeken we het effect van JPEG codering endiepte op de algehele beeldkwaliteit, diepte, waargenomen scherpte, enwaargenomen eye-strain (oogpijn). Resultaten laten zien dat een toe-name van JPEG codering een negatief effect heeft op waargenomen beeld-kwaliteit, scherpte en eye-strain maar geen effect heeft op waargenomendiepte. Een toename in camera basis afstand (meer diepte) heeft een effectop waargenomen diepte en eye-strain maar heeft geen effect op algehelebeeldkwaliteit en waargenomen scherpte. Het traditionele concept alge-hele beeldkwaliteit neemt de toegevoegde waarde van diepte dus nietmee. In experiment 4 wordt het criterium beeldkwaliteit vergeleken methet criterium natuurlijkheid. Resultaten laten zien dat natuurlijkheid dezichtbaarheid van de JPEG verstoring en ook de toegevoegde waarde vandiepte meeneemt in tegenstelling tot beeldkwaliteit. Beeldkwaliteit neemtalleen de JPEG verstoring mee in het oordeel.
In hoofdstuk 4 onderzoeken we het effect van crosstalk (overspraak,typische 3D verstoring) en camera basis afstand op de criteria beeld-kwaliteit, waargenomen diepte, en waargenomen eye-strain. Resul-taten van experiment 5 laten zien dat de waargenomen beeldver-storing toeneemt met een stijging in crosstalk en camera basis afstand.Waargenomen diepte en waargenomen eye-strain stijgen alleen met eentoenemende camera basis afstand en blijven gelijk met toenemendecrosstalk. Resultaten van experiment 6 laten zien dat het criterium na-tuurlijkheid de crosstalk verstoring en de toegevoegde waarde van dieptemeeneemt in tegenstelling tot beeldkwaliteit.
126
Samenvatting
Hoofdstuk 5 gaat over het modelleren van de concepten kijkervaring ennatuurlijkheid in termen van beeldkwaliteit en diepte. Visueel comfortspeelt ook een belangrijke rol in het nieuwe model, maar additioneel on-derzoek is vereist om hierover uitspraken te doen. Het model zal zichdus richten op de bijdrage van beeldkwaliteit en diepte. Het modellerenis gedaan op 5 verschillende data-sets uit dit proefschrift. In vier van devijf gevallen neemt natuurlijkheid diepte meer mee in de beoordeling dankijkervaring. Het modelleren laat zien dat het criterium natuurlijkheid debeste balans heeft tussen beeldkwaliteit enerzijds en diepte anderzijds.Hieruit concluderen we dat natuurlijkheid het beste concept is voor deevaluatie van drie-dimensionale beelden. Hoe visueel comfort ingepastmoet worden in het model heeft zeker nog meer onderzoek nodig. Ookhet effect van bewegende beelden kan zeker van invloed zijn op de be-oordeling en moet daarom ook nog nader onderzocht worden.
In hoofdstuk 6 kijken we terug en beschrijven we welke inzichten wehebben verkregen. Ook bespreken we het nieuwe 3D model en de toepas-baarheid ervan.
127

Samenvatting
128

Summary
Since the introduction of television, much has been done to improve color,picture quality, and sound quality of conventional television. A new stepforward is the introduction of three-dimensional television enabling peo-ple to watch their content in three dimensions.
In the real world we perceive depth due to the fact that our eyes are sep-arated by 6.3 cm on average. Each eye receives a slightly different per-spective of the world. Our brain fuses these two images, and becauseeach image is slightly displaced with respect to the other - a phenomenonknown as retinal disparity - the relative and absolute depths of objects inspace are perceived. This principle is also applied in the 3D-TV were theleft- and right-eye image are separated by optical lenses in the 3D-TV.
The image quality criterion is often used to optimize television sets. Sub-jective tests (user-tests) are performed to find the optimal settings of thetechnical parameters. For conventional television (2D), there already ex-ist models predicting the overal image quality, but are these models suf-ficient to measure the 3-D visual experience? We believe that a 3D visualexperience model is required that is multidimensional, incorporating per-ceptual factors related to reproduced depth, 3D image impairments, andvisual comfort.
The research aim of this thesis is how to understand, measure, and modelthe 3D visual experience. This thesis investigates several new conceptsfor the evaluation of 3D image material and compares it with an existingimage quality model.
The goal of chapter 2 is to explore and determine which evaluation crite-rion is most appropriate to assess the performance of 3D-display systems.Experiment 1 explores the assessment criteria image quality, depth, nat-
129

Summary
uralness, presence and viewing experience using new 2D-3D conversiontechniques (not yet optimal). Results show that viewing experience andnaturalness have the most discriminating power between the various 2D-3D conversion algorithms. Experiment 2 focuses on the criteria viewingexperience and naturalness and uses ’perfect’ 3D content with no conver-sion or depth artefacts. Several noise levels were added to the 2D and3D images to degrade image quality. Results show that the noise distor-tion is weighted equally both with viewing experience and naturalness.Naturalness is more sensitive to depth than viewing experience.
Chapter 3 describes two experiments to investigate the effects of symmet-ric and asymmetric JPEG coding (typical 2D distortion) and camera basedistance on several evaluation criteria. Experiment 3 investigates the ef-fects of camera-base distance and JPEG-coding on overall image quality,perceived depth, perceived sharpness and perceived eye-strain. Resultsshow that an increase in JPEG coding artefacts has a negative effect onimage quality, sharpness and eye-strain but has no effect on perceiveddepth. An increase in camera-base distance (more depth) increases per-ceived depth and reported eye-strain but has no effect on image qualityand perceived sharpness. So, the traditional image quality concept doesnot take into account the added value of depth Experiment 4 comparesthe image quality concept and the naturalness concept. Results show thatnaturalness weighs more equally the visibility of the distortion as well asthe added value of depth in contrast to image quality.
Chapter 4 investigates the effect of crosstalk (ghosting, typical 3D dis-tortion) and camera-base distance on the criteria perceived image distor-tion, perceived depth, and perceived eye-strain. Results of Experiment 5show that image distortion ratings show a clear increase with increasingcrosstalk and increasing camera base distance. Ratings of visual strainand perceived depth only increase with increasing camera base distanceand remain constant with increasing crosstalk. Results of Experiment 6show that naturalness weighs more equally the visibility of the distortionas well as the added value of depth in contrast to image quality.
The goal of chapter 5 is to model the concepts viewing experience and nat-uralness in terms of image quality and depth. Also visual comfort playsan important role in this model, but additional research is required in thisarea. The model will only focus on the contribution of image quality anddepth. The modeling is based on 5 different data-sets from this thesis.
130
Summary
Results show that in four out of five cases naturalness weighs more depththan viewing experience. The modeling shows that the criterion natural-ness seems to have the best balance between image quality and the depth.Therefore, it is concluded that naturalness is the best concept to evaluatethe quality of 3D image content.
In Chapter 6, we will briefly look back on the previous chapters and dis-cuss the most important findings. The new 3D visual experience model ispresented and we discuss the applicability of the model.
131

Summary
132

Acknowledgements
I would like to thank all my colleagues at the Human Technology Interac-tion group and Philips Research for the excellent working atmosphereand the wonderful time together. I acknowledge with gratitude DonBouwhuis, Ingrid Heynderickx, Wijnand IJsselsteijn and Lydia Meestersfor the valuable advice and feedback during this project.
133

134

Biography
Pieter J. H. Seuntiens was born in Eindhoven, The Netherlands, on Febru-ary 6, 1976. He received the B.Sc. degree in mechanical engineeringfrom Fontys University Eindhoven and the M.Sc. degree in Human-Technology Interaction from the Eindhoven University of Technology, in1999 and 2002, respectively. In 2002 he started his PhD research at the J.F.Schouten School for User-System Interaction. His research was funded bythe IST-2001-34396 European project ’ATTEST’ and Philips Research Lab-oratories, Eindhoven. In close collaboration with the Video Processingand Visual Perception Group of Philips Research his work focuses on per-ceptual issues and quality metrics regarding two- and three-dimensionalimaging systems.
135