virtual mentor curriculum infection prevention section ... · virtual mentor curriculum infection...
TRANSCRIPT

Virtual Mentor Curriculum Infection Prevention Section
January 2018
I. Infection Prevention in Dialysis Patients a. Alan Kliger, MD
II. Medical Leadership and Culture of Safety
a. Leslie Wong, MD b. Renee Garrick, MD
III. Infection Prevention in a Quality Assessment & Performance Improvement
(QAPI) Program a. Jerry Jackson, MD b. George Aronoff, MD
IV. Practical Steps for Detecting and Managing Patients with Bloodborne Pathogens
a. T. Alp Ikizler, MD
V. Antimicrobial Stewardship: Protecting Our Patients a. Erika D’Agata, MD
NEPHROLOGISTS TRANSFORMING DIALYSIS SAFETY
The Dialysis Infection Crisis in the United States: A Call to ActionAlan S. Kliger, MDYale New Haven Health System
To enhance the quality of life for people with
kidney failure by engaging nephrologists
as team leaders in transformational change
that continuously improves the safety of life sustaining dialysis.

Disclosures
• Alan S. Kliger, MD• Employer: Yale New Haven Health System• Consultancy: American Society of Nephrology, National Institutes of Digestive Disease and the Kidney• Honoraria: DCI (Dialysis Provider), ARA (Dialysis Provider)• Scientific Advisor/Membership: Qualidigm (Quality Improvement Organization)

Why is infection a critical issue for dialysis?

MORBIDITY:
Infection is second leading cause

Adjusted all-cause mortality is falling in HD and PD
2016 USRDS Annual Data Report, Vol 2, ESRD, Ch 6

Cause of Death in Prevalent Dialysis Patients
PEER Report: Dialysis Care & Outcomes in the U.S., 2014 |Hospitalization|

Incident One Year STD* Death Rates by CVD vs Infection 1996-2014: Incident-based after 90 days
*Adjusted for age, sex, race, cause of ESRD and incident year; PEER Report
0.0
5.0
10.0
15.0
20.0
25.0
30.0
35.0
40.0
45.0
50.0
All Standardized RateCVD Standardized RateINF Standardized Rate

Prevalent One Year STD* Death Rates by CVD vs Infection 1996-2014: deaths/100 Pt Yrs
*Adjusted for age, sex, race, cause of ESRD and prevalent year; PEER Report
0.0
2.0
4.0
6.0
8.0
10.0
12.0
14.0
CVD Preval Standardized RateINF Preval Standardized Rate
• CVD 51% decline since 1996
• Infection 40% decline since 1996

MORBIDITY:
Infection-Related Hospitalization

Adjusted all-cause & cause-specific hospitalization rates for ESRD patients 2005-2014
Hemodialysis all-cause hospitalization rates have been declining,
but hospitalizations for infections have not kept
pace, and are now as frequent as CVD hospitalizations.
Period prevalent ESRD patients; adjusted for age, sex, race, primary cause of kidney failure & their two-way interactions; reference group : ESRD patients, 2011. Abbreviation: ESRD, end-stage renal disease. 2016 Annual Data Report, Vol 2, ESRD, Ch 5

Infection hospital days CVD hospital days
PD
HD
PD
Transplant
Transplant
Infection Hospital Days CVD Hospital Days
There are more hospital days for infection than for CVD.
Data Source: Special analyses, USRDS ESRD Database, 2016 Annual Data Report, Vol 2, ESRD, Ch 5. Period prevalent ESRD patients, adjusted for age, sex, race, primary cause of kidney failure & their two-way interactions; reference group: ESRD patients, 2011.
Abbreviation: ESRD, end-stage renal disease.

Incident Pt First year hospitalization rates for CVD and Infection: per 100 Pt Yrs
PEER Report
20
30
40
50
60
70
80
90
1234123412341234123412341234123412341234123412341234123412341999 2000 2001 2002 2003 2004 2005 2006 2007 2008 2009 2010 2011 2012 2013
Incid Quarterly CVD Pri Dx RateIncid Quarterly Infect Pri Dx Rate

Prevalent Pts Trends in CVD and Infection Hospitalization Rates: per 100 Pt Yrs
PEER Report
20
30
40
50
60
70
80
90
1 2 3 4 1 2 3 4 1 2 3 4 1 2 3 4 1 2 3 4 1 2 3 4 1 2 3 4 1 2 3 4 1 2 3 4 1 2 3 4 1 2 3 4 1 2 3 4 1 2 3 4 1 2 3 4 1 2 3 4 1 2 3 41999 2000 2001 2002 2003 2004 2005 2006 2007 2008 2009 2010 2011 2012 2013 2014
CVD Pri rateInfection Pri Rate

C. Diff Admissions 1st years vs. Prevalent per 100 Pt Yrs
PEER Report
0.0
0.5
1.0
1.5
2.0
2.5
3.0
1 2 3 4 1 2 3 4 1 2 3 4 1 2 3 4 1 2 3 4 1 2 3 4 1 2 3 4 1 2 3 4 1 2 3 4 1 2 3 4 1 2 3 4 1 2 3 4 1 2 3 4 1 2 3 4 1 2 3 41999 2000 2001 2002 2003 2004 2005 2006 2007 2008 2009 2010 2011 2012 2013
Incid C. Diff Pri Dx RatePreval C. Diff Pri Dx Rate

Transmission routes• Physical contact• Blood-borne transmission• Respiratory• Contaminated food, medication
Patient-to-patient or staff-to-patient transmission could occur through
•Contaminated devices, equipment, or supplies•Environmental surfaces•Hands of personnel
Infection Transmission Methods

Principles to Prevent Infection Transmission in HemodialysisUnits
https://www.cdc.gov/dialysis/guidelines/index.html
Infection control precautions for all patients: standard precautions
Cleaning and disinfection
Routine serologic testing for hepatitis B and C
Hepatitis B vaccination
Isolation of hepatitis B-infected patientsOther Infections, ex.: hepatitis C, human immunodeficiency virus (HIV): individualize by patient and facility
Hand Hygiene
Medication/Injection Safety

Infection Prevention for Hemodialysis
Centers for Disease Control and Prevention. Recommendations for preventing transmission of infections among chronic hemodialysis patients. MMWR Recomm Rep 50(No. RR-5); 1–43, 2001
• Change gloves and clean hands between patients every time• Use gloves when handling blood lines, blood specimens• Use gloves when touching equipment and other surfaces
Staff should use gloves whenever caring for a patient or touching equipment
• Either throw it away or decontaminate it before the next patient’s use
Anything taken to, or kept on, a patient’s machine should be considered contaminated
• No common trays or carts should be taken from one patient’s machine to another• Do not puncture single-use vials more than once
Medications should be prepared in an area away from the patient’s machine and only one patient’s medications should be administered at a time
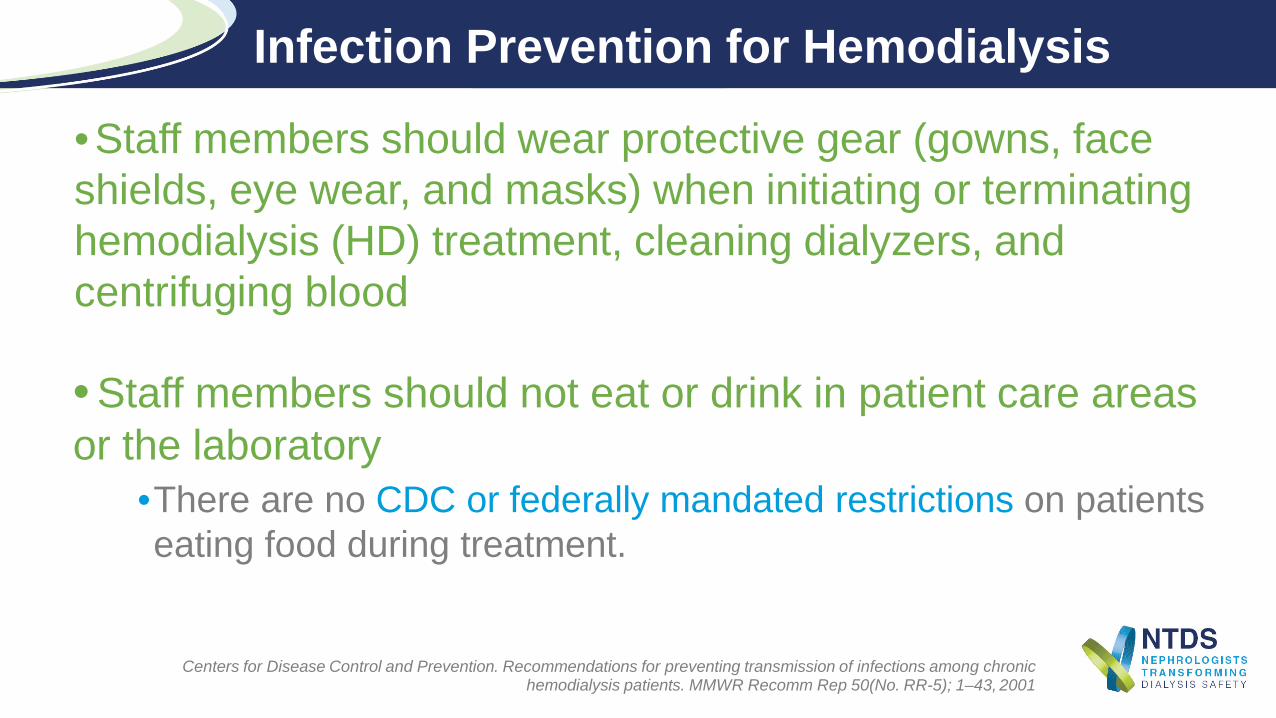
•Staff members should wear protective gear (gowns, face shields, eye wear, and masks) when initiating or terminating hemodialysis (HD) treatment, cleaning dialyzers, and centrifuging blood
• Staff members should not eat or drink in patient care areas or the laboratory
•There are no CDC or federally mandated restrictions on patients eating food during treatment.
Infection Prevention for Hemodialysis
Centers for Disease Control and Prevention. Recommendations for preventing transmission of infections among chronic hemodialysis patients. MMWR Recomm Rep 50(No. RR-5); 1–43, 2001

Cleaning and Disinfection
Centers for Disease Control and Prevention. Recommendations for preventing transmission of infections among chronic hemodialysis patients. MMWR Recomm Rep 50(No. RR-5); 1–43, 2001
Low-Level Disinfection
Intermediate-Level Disinfection
Gross blood spills or items contaminated with visible blood
X
Hemodialyzer port caps XInterior pathways of dialysis machine XWater treatment and distribution system X X*Scissors, hemostats, clamps, blood pressure cuffs, and stethoscopes
X X
Environmental surfaces, including exterior surfaces of HD machines
X X
*Water treatment and fluid concentrate distribution systems require more extensive disinfection if significant biofilm is present within the system.
Careful mechanical cleaning to remove debris should always be done before disinfection.
https://www.cdc.gov/infectioncontrol/pdf/guidelines/environmental-guidelines.pdf

Principles to Prevent Transmission of Blood-borne Infections in HD Units
Implementation and auditing of hand hygiene
and environmental
disinfection policies and procedures

Monitoring for Early Detection of Seroconversion
Centers for Disease Control and Prevention. Recommendations for preventing transmission of infections among chronic hemodialysis patients. MMWR Recomm Rep 50(No. RR-5); 1–43, 2001
Requirements for admission to dialysis unit• HepBsAg, hepatitis B core antibody (HepBcAb), and anti–hepatitis B surface antibody
(HBsAb) status• Hepatitis C virus (HCV) (https://www.cdc.gov/mmwr/pdf/wk/mm62e0507a2.pdf) and HIV
statusMonthly monitoring
• Alanine transaminase (ALT) (serum glutamic pyruvic transaminase [SGPT])• HepBsAg (in patients not immune to hepatitis B)
S e m i-Annual monitoring (q 6 months)• HCV
Annual Monitoring• HepBsAb

Isolation Precautions for HepBsAg+ Patients
Centers for Disease Control and Prevention. Recommendations for preventing transmission of infections among chronic hemodialysis patients. MMWR Recomm Rep 50(No. RR-5); 1–43, 2001
There should be a separate room/area, dedicated machines, equipment, and instruments for HepBsAg+patients• These cannot be shared with HepBsAg– patients
The separation of HepBsAg+ and HepBsAg– patients should be complete• Staff who care for HepBsAg+ patients should only treat patients who are
immune to hepatitis B (titers > 10 mIU/ml)
No dialyzer reuse

What Is The Responsibility of a Strong Infection Prevention Program?
TEACHING QUALITY IMPROVEMENT TECHNIQUES• Root cause analysis
STRESSING INFECTION PREVENTION• Standard precautions• Handwashing• Catheter elimination• Vascular access care and cannulation• Water system maintenance• Dialyzer re-use issues• Chair/HD machine cleaning• Isolation
PERFORMING INFECTION SURVEILLANCE• Identifying blood borne pathogen threats likely to impact
dialysis and transplant patients, family members and staff• Surveillance for Blood stream infections

What Is The Responsibility of a Strong Infection Prevention Program?
TREATING INFECTION ACCORDING TO GUIDELINES• Adopting/developing an antibiotic stewardship program• Addressing the need for standardized protocols to
manage the spread/treatment of hepatitis B & C, HIV, multiple drug-resistant organisms (MDROs)
ADDRESSING THE POSSIBILITY OF EMERGING THREATS• Developing educational programming to protect patients
and staff from emerging threats• Being aware of local and national resources to manage
unanticipated emerging infections (Emory: Ebola; Zika) https://www.emoryhealthcare.org/ebola-protocol/pdf/ehc-evd-protocols.pdf

What Is The Responsibility of a Strong Infection Prevention Program?
LEADERSHIP
Address responsibility confusion:
Do nephrologists believe thatinfection prevention is their responsibility?
Correct knowledge deficits Environmental, technology, equipment challenges
Replace complacency with activism Dialysis has become “routine” and shortcuts have
become “normal” Rushed atmosphere, little time, little staff

Nephrologist Leadership and the Culture of Safety
Leslie P. Wong, MD, MBA, FASNVice Chairman, Cleveland Clinic Nephrology
Renee Garrick, MD, FACPVice Dean and Professor of Clinical Medicine,
New York Medical College

Disclosures
• Leslie P. Wong, MD, MBA, FASN• Director of End-Stage Renal Disease, Cleveland Clinic
• Renee Garrick, MD, FACP• Medical director of DCI dialysis facility in Hawthorne, NY• Executive Medical Director, Westchester Health Network, and Westchester
Medical Center

Infection hospital days CVD hospital days
PD
HD
PD
Transplant
Transplant
The number of citations is increasing each year. Citations
U.S. dialysis facilities do not reliably follow basic infection control.
NNI, July 30, 2015
Surface Disinfection
HandHygiene
CatheterCare
15%35%
83%

Traditional Approaches
•Policies and procedures•Staff training and education•Audit compliance •Disciplinary action•Plan of correction•Employee termination
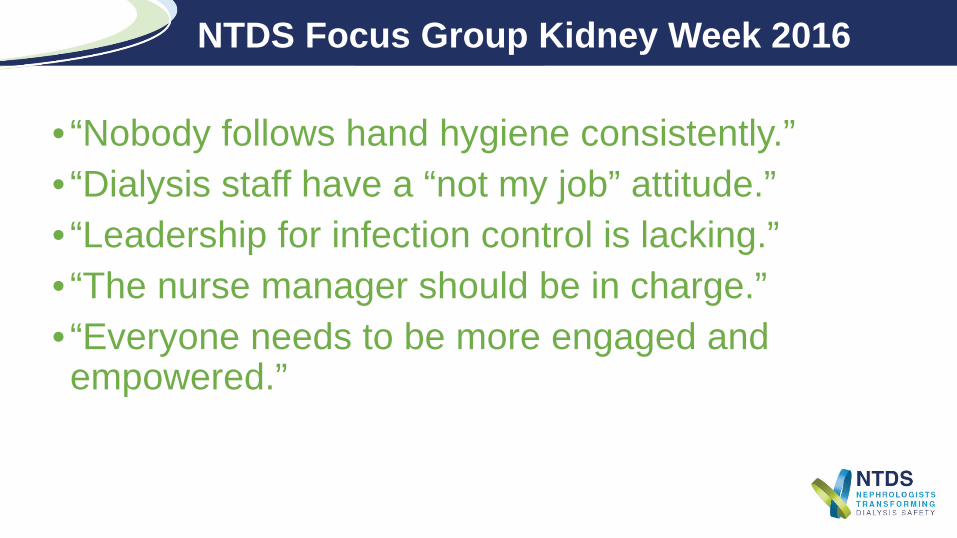
NTDS Focus Group Kidney Week 2016
• “Nobody follows hand hygiene consistently.”• “Dialysis staff have a “not my job” attitude.”• “Leadership for infection control is lacking.”• “The nurse manager should be in charge.”• “Everyone needs to be more engaged and empowered.”

A system is not the sum of its parts It is how these parts fit together
Russell Ackoff (1919-2009)Professor Emeritus ofManagement Science
Wharton School“Einstein of Problem Solving”
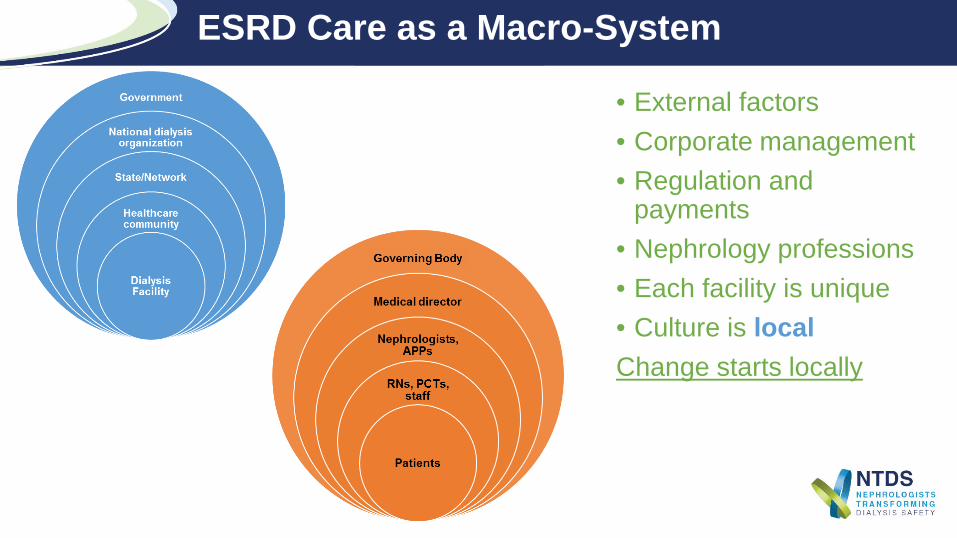
ESRD Care as a Macro-System
• External factors• Corporate management• Regulation and
payments• Nephrology professions• Each facility is unique• Culture is localChange starts locally

Systems Thinking
“Cause and Effect”Looks at parts in isolation
“Dynamic Complexity”Looks at the whole and relationships
Policies
Training
Compliance Infection Control
Infection Control
LeadersCulture

Why Empowerment Fails
•People have to want more authority first
•Lack of clear hierarchy of authority causes confusion and uncertainty
Source: 6 Myths about Empowering Employees by David Marquet, Harvard Business Review 2015

Leadership in the Facility
Medical Director
Designated Leader
Nurse Manager
Second-In Command/Situational Leader
NursesSituational Leaders
TechniciansSituational Leaders
RD, SW, BiomedicalSituational Leaders
Nephrologists APPs
Situational Leaders
§494.250 Condition: Responsibilities of the dialysis facility medical director - Delivery of patient care- Outcomes- Quality of care
NTDS Webinar, May 23, 2017

Designated Leader and Situational Leaders
These roles are interconnected and interdependent.
While good leadership starts at the top, bad leadership at any level can undermine efforts to prevent infections.


Culture
•Survival mechanism for groups of individuals facing problems
•Shared learning of solutions that have worked well enough to be considered valid
•Starts as a behavior, but becomes a way to think, a way to feel - drops from awareness
•Provides stability and a group identity
Edgar Schein Professor EmeritusMIT Sloan School of
Management

Why Culture is So Powerful
•You are not just talking about behavior•You are not talking about “spoken values”•You are talking about unspoken beliefs and values that help preserve identity, esteem & survival
•Challenging culture provokes unconscious reactions by the group & individuals
Schein E, Organizational Culture and Leadership, 2017

Deciphering Culture
What you see
What they say
What they believe
Schein E, Organizational Culture and Leadership, 2017
Visibility Impact
Highest
Highest
Lowest
Lowest

Pinnacle: Culture of Safety
•Communication based on mutual trust•Shared perception about importance of safety•Confidence in the efficacy of preventive measures
•Shared commitment to reduce preventable harms and deaths in healthcare
Kliger AS. CJASN 2015
Role of Leaders in Culture
•New organizations – founding leaders demand behaviors and create a new culture
•Established organizations – leaders must teach new behaviors & beliefs
•This can only occur if old (maladaptive) behavior & beliefs are unlearned
Schein E, Organizational Culture and Leadership, 2017

The Intersection of Quality and Safety
• Safety is one of the 6 domains of Health Care Quality* (safe, effective, patient centered, timely, efficient, equitable)
• Safe Care = patients should not be harmed by the care that is intended to help them. But, it is possible for a desired outcome to occur despite the use of processes that are risky or “unsafe”
• How much risk can a system “tolerate” before “failures” occur?
• Consider this in the context of the 2016 report that medical error remains the 3rd leading cause of death in the US**
*Institute of Medicine (IOM). Crossing the Quality Chasm: A new health system for the 21st Century. Washington DC . National Academy Press, 2001
** BMJ 2016;353:i2139
Which of the Following is the Most Common Cause of Serious Errors?
1. Inattentiveness2. Lack of knowledge3. Failure to clearly communicate4. Errors related to the Electronic Record
(EMR)5. Lack of motivation

Which of the Following is the Most Common Cause of Serious Errors?
Answer: Failure to clearly communicate • It is estimated that 80 percent of serious medical errors involve miscommunication between caregivers during patient transitions or hand-offs*
• Implement SBAR, I-PASS or other scripted toolsencourage clarifying questions, and cross-checks
and similar “crew resource management tools”
*The Joint commission, 2012, Center for Transforming Healthcare

Which of the Following did Staff Indicate as the Major Reason for Medical Errors?
1. Not enough staff to handle work-load2. Patients too hard to work with 3. Staff fail to follow policies and procedures4. Staff lack knowledge5. Staff work too many hours
Answer: Staff fail to follow policies and procedures*
•Work-arounds and other “short-cuts” bypass key policy and safety steps
*Garrick et al; CJASN 7:680, 2012
Which of the Following did Staff Indicate as the Major Reason for Medical Errors?

Why Dialysis Staff Breach Policies
Adopted from Amalberti, R. Qual Saf Health Care 2006
• Many breaches are intentional violations
• Behavioral response to organizational pressures/stress
• Shortcuts to improve performance
• Absent of visible harm, the shortcuts become accepted
• CULTURE MIGRATES AWAY FROM SAFETY

What do Our Patients Say?
When dialysis patients were asked:How often do you worry that someone might make a medical mistake during your treatment?
48.6 % of patients said “sometimes to always”
RPA Health and Safety Survey Project: Patient Survey Response Frequencies, 2007

• Freedom from accidental or preventable injuries produced by the care
• Trust us to do the right thing; say when we did not and correct it
• The goal is to create a system of care delivery that: Prevents errors Learns from the errors that do occur Identifies, trends, and learns from “good catches/ “near misses” Is built on a culture of safety that involves health care
professionals, organizations, and patients
What is Patient Safety?
Modified from IOM and AHRQ

Establishing a Culture of Safety
A culture in which every individual feels comfortable/safe drawing attention
to potential hazards or actual failures without fear of retaliation
--A JUST CULTURE
with 200% accountability and high reliability

Elements of a Culture of Safety
•Care systems must be trustworthy• Acknowledge the high-risk nature of dialysis• It must recognize that a safe environment is NOT error free• Report “near misses” as well as events • When errors occur (with or without harm) events are shared openly
and honestly with both patients and staff• It must be non-punitive; system errors, not individual’s failures
•We must demand individual accountability• Unacceptable deviance from, or disregard, for policy and procedure
prompts peer review and remediation

Developing a Culture of Safety
• Conduct patient safety leadership walk rounds• Designate a patient safety officer• Create an adverse event response team• Perform Root Causes -implement and track effectiveness
of improvements• Re-enact real, and simulate possible, adverse events• Share safety catches and events
Make it easy to do the right thing
http://www.ihi.org/resources/Pages/Changes/DevelopaCultureofSafety.aspx

High Reliability Organizations
•For a system to be trustworthy it must RELIABLE•Goal: to achieve a persistently low rate of error despite operating in an environment that can be unpredictable and is consistently hazardous
•Examples: Nuclear power, airlines•A relentless focus on safety
Kliger, A : Yale Medical system

How is High Reliability Accomplished? • Sensitivity to operations
• “Situational awareness” how should/ how do our systems work, does that match current policy
• Reluctance to accept simplistic solutions • Be wary of simplistic solutions to complex problems; systems can fail in
ways that have not previously considered• Preoccupation with failure/risk
• Think ahead to predict, mitigate, eliminate risk, track and share good catches
• Deference to expertise• Age and rank don't necessarily make you the “expert” The frontline staff are
often the experts• Commitment to resilience
• Contain, mitigate, and recover form errors, improvise correctly when needed; remember, errors will occur

Dialysis Facilities Safety Risk: Contributing Factors
• The environment of care of dialysis is complex• Advanced technology, dynamic human physiology• Open interfaces between humans and machines (i.e. humans decide
actions – no auto pilot or prefect “fail safes”)• Many chances for error
• Multiple policies and processes: often not well standardized• Treatments involve multiple steps each with separate risk point
• Water treatment – multiple steps and checks• Equipment – staff interface: set up and intra-treatment• Infection control risk points – hand hygiene and access care• Communication risks – multiple staff – poor handoffs
• Patient factors: may be frail; acutely changing physiology
In complex environments the design of the systems often permits or facilitates “human error” which can lead to safety breaches.
The Road to High Reliability
• Error rates can be measured.• Some tasks and situations are more prone to errors than others.• Can we reduce errors by identifying and mitigating these factors?
Applied Human Factors Engineering
Human error is inevitable BUT we can reduces risks and rates

1 2 3 4 5 6 7 8 9 10 11 12
1 1 1 1 0.9 1 1 1 1 0.9 1 1
0.99 0.99 0.99 0.99 0.99 0.99 0.99 0.99 0.99 0.99 0.99 0.99
0.9 0.9 0.9 0.9 0.9 0.9 0.9 0.9 0.9 0.9 0.9 0.9
Reliability of a Series Work Process(following Infection control steps during HD initiation)
A Set Series of Tasks is done each time
Each task is preformed at a reliability level “ R” and so the Reliability of the system= R1 x R2 x R3 x R 4x R5…...
R =0.28
R= 0.81
R= 0.88
How can we move from system 1 to system 3Or from system 2 to “perfection”

Applied Human Factor Engineering in Dialysis
• Check lists can reduce error rate from 10/100 to 3/1000
• Larger fonts, more white space reduce error rate from 3/100 to 3/10,000
• Math should be PRE-calculated as much as possible (e.g. maximum allowable UFR rates etc) otherwise error rate/task can be 1-3/100
• Standardize and simplify as much as possible
• Design machines and systems with forcing functions, fail safes, double checks (reduces error rate from 1/10 to 5/10,000)

Focus on Safety: Human Factor Engineering
• Can/will policy and procedure work in “real-world;” can staff implement and sustain?
Usability Testing
Standardization and Hard-Wired Safety Tools
• Automate and remove options – reduces possibility of selecting unsafe care sequences
Forcing Functions
• Efforts to anticipate, detect, avoid, and mitigate unsafe actions before they occur
Resiliency Efforts
• Aids in situational awareness, team response, adherence to safety tools
Simulation

Safety Roadmap: Designing Highly Reliable Systems for Safety
• Reduce hand-offs• Simplify and standardize processes and
communication• Improve physical features of the workplace• Create redundant safety measures• Reduce reliance on memory • Utilize checklists and hard stops effectively• Employ technology effectively• Collaborate and improve communication
among ALL staff• Involve patients and their families

Forms of Resistance to Change
Denial
Blaming or evading
Maneuvering and bargaining

How Leaders Overcome Resistance
Provide a compelling vision for change
Provide formal training and support
Role model behaviors and address barriers
Create psychological safety

Nephrologists as Change Agents
Commitment to Ending
Preventable Infections
Leadershipcreates
Motivation
Motivationcreates
Learning
Learningcreates
Internalization
Rate Limiting Step
Create Sense of Urgency
Inspire with Vision
Teach and Role Model
Desired Culture

Safety Champs
Kliger A. Yale Health Care System

Including Infection Prevention in a Quality Assessment & Performance Improvement (QAPI) Program –Tools and Resources
Jerry W. Jackson, MD, FACPChairman, FMC Patient Safety Council
George Aronoff, MD, MS, FACP, FASN
Vice President, Clinical Affairs, Office of the Chief Medical Officer, DaVita Kidney Care

Disclosures
• Jerry W. Jackson, MD, FACP• Chairman, FMC Patient Safety Council
• George Aronoff, MD, MS, FACP, FASN• DaVita Kidney Care—Employee• Qsource—Board of Directors• University of Louisville Research Foundation—Intellectual Property• Dosis, Inc.—Board of Directors, Owner

Elements Needed for Effective QAPI
Culture
Medical Director Leadership
Subject Matter Knowledge
Framework forImprovement

Paradigm A: QAPI is Only a Meeting
Medical Director
Well, just one more thing before we end the meeting. Were there any infections this month?
Nurse Manager
Yes, there were 2 BSI’s—but they were both in catheter patients. So, what can you do?
Medical Director
I suppose you are right. What is the current status of those 2 patients?
Nurse Manager
Both are OK for now. The Vascular Access Center exchanged their catheters, so neither had to be admitted. They are nearly finished with their Vancomycin.
Medical Director
Great—see you next month!Copyright: <a href='https://www.123rf.com/profile_rawpixel'>rawpixel / 123RF Stock Photo</a>
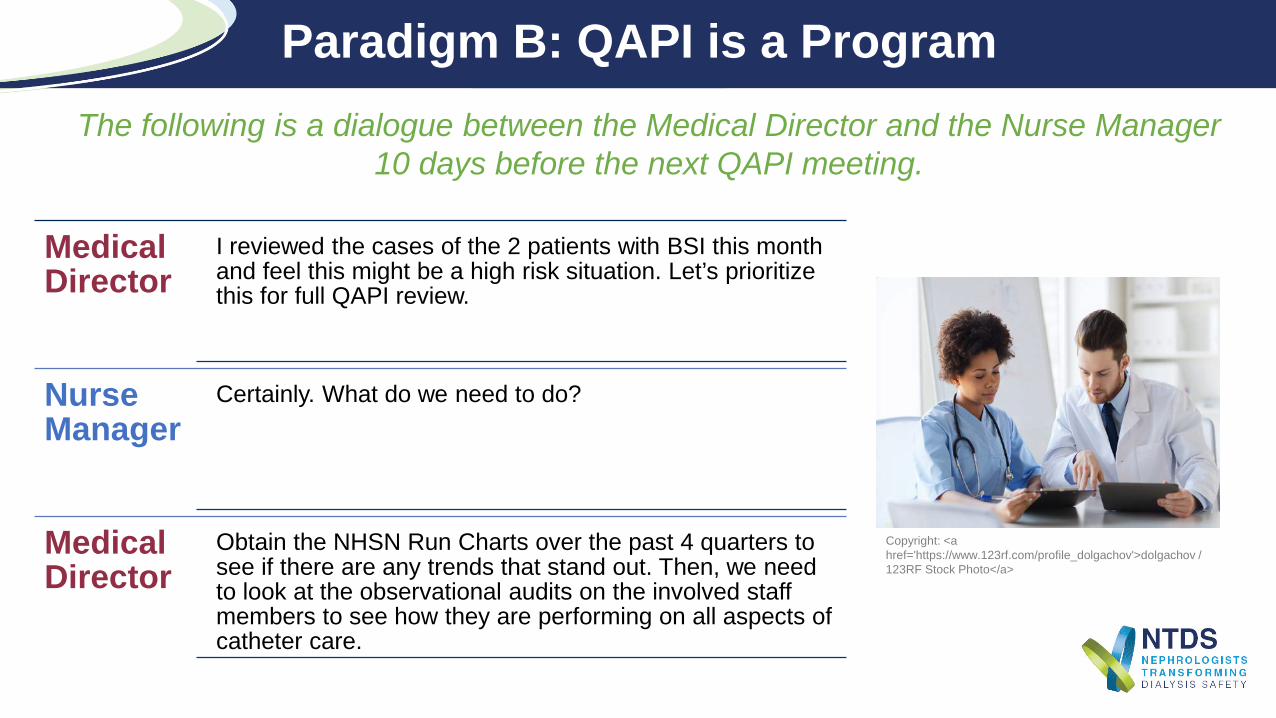
Paradigm B: QAPI is a Program
Medical Director
I reviewed the cases of the 2 patients with BSI this month and feel this might be a high risk situation. Let’s prioritize this for full QAPI review.
Nurse Manager
Certainly. What do we need to do?
Medical Director
Obtain the NHSN Run Charts over the past 4 quarters to see if there are any trends that stand out. Then, we need to look at the observational audits on the involved staff members to see how they are performing on all aspects of catheter care.
Copyright: <a href='https://www.123rf.com/profile_dolgachov'>dolgachov / 123RF Stock Photo</a>
The following is a dialogue between the Medical Director and the Nurse Manager 10 days before the next QAPI meeting.
Paradigm B Dialogue – Continued
Medical Director
Also, I noticed that the culture results were called to me a couple of days late, so I would like to look at our communication process to see why that happened. And, go through the RCA Questionnaire with the involved staff members. Start the Flow Diagram based on things you spot in this information, then ahead of the meeting we can consider all the findings. We will need to brainstorm on the underlying causes and put together some preliminary action plan ideas to discuss with the full team.
Nurse Manager
I am writing all this down and will begin working on it right away. I realize how important it is to prevent infections in the facility, and I agree this should be given top priority.
Medical Director
Thanks! I will see you next week to go over all the information with you and exchange ideas. Call me if questions come up in the meantime.

Justification for Including Infections in QAPI
§494.150 Condition: Responsibilities of the Medical Director“Quality assessment and performance improvement program”“Ensure that policies and procedures related to patient admissions, patient care, infection control and safety are adhered to by all individuals who treat patients…”
§494.110 Condition: QAPI“The program must include…the following:Infection control; with respect to this component the facility must—A. analyze and document the incidence of infection to identify trends and establish
baseline information on infection incidence;B. develop recommendations and action plans to minimize infection transmission,
promote immunization; andC. take actions to reduce future incidents.”
• “The program must include…the following:
• Infection control; with respect to this component the facility must—A. Analyze and document the incidence of infection to identify trends and establish baseline information on infection incidence;
B. Develop recommendations and action plans to minimize infection transmission, promote immunization; and
C. take actions to reduce future incidents.”

Components of QAPI — A Process View
• Which metrics should you follow?• Which data are suitable for trending?
Data or Information
• What patterns emerge from the data?• How can analysis reveal system weaknesses?
Analysis
• Analysis is pointless unless it leads to actions for improvement.• The QAPI Program offers a platform for information sharing and learning among all
facility staff.• Communications from the QAPI Program can influence culture!
Action Planning
The QAPI Program offers a crossroad for information sharing and learning among all facility staff.

Data
Dr. Edwards Deming
Evidence from the medical literature is important to build knowledge, but improvement efforts should be built around your own facility data.

Data for Infection Control in the Facility’s QAPI Program: Measuring the Process and the Outcome
Process Type Data:NHSN• Outpatient dialysis center practice surveyInternal Audits (multiple types)
Antibiogram
Antibiotic Prescribing Practices by Practitioner
Root Cause Analysis Results
Near Miss Reports
Communication Data
Vaccination Data
Outcome Type Data:NHSN• Facility Rate Tables• Facility Run ChartsSelf-generated BSI rates, trended
Non-NHSN infections• Wound data• Pneumonia• Influenza• Cellulitis• Others

Here is an example of a NHSN BSI Rate Table. It shows:• Facility’s overall BSI rate by
access types in the blue box• The national average for those
categories in the yellow box; comparing the facility vs. the national rates using the p-value column
• This is only the mean rate for a quarter, not an actual trend
• The national rate is not “good enough”, it is simply the national average for the quarter.

NHSN…

Data: Benefits of Trending
Trending allows one to assess the stability of the system over time.
Trending allows close-to-real-time detection of outbreaks at the facility.
Trending allows one to judge the effectiveness of actions.

Data: Difficulties in Trending Infection Data
Some months have zero infections.• For this reason, quarterly trends
are easier to interpret.
Self-generated trended facility data could be sufficient for QI purposes, but this approach would possibly lack case-mix adjustment, standardization and/or stratification by vascular access type.• NHSN offers a facility-specific
Run Chart by infection type and VA type.

Available CDC Dialysis Infection Prevention Audit Tools
https://www.cdc.gov/dialysis/prevention-tools/audit-tools.html

CDC Checklist Tools
https://www.cdc.gov/dialysis/prevention-tools/audit-tools.html

Core Interventions for Dialysis Bloodstream Infection (BSI) Prevention
http://www.cdc.gov/dialysis/prevention-tools/core-interventions.html

Resources for Use in the QAPI Program:ASN Home > NTDS > Resource Library
Infection Prevention in the Dialysis Environment
Identification and Treatment of Bloodborne Pathogens
Education
Leadership & Culture
Collaboration and Partnerships
Regulations
Visit the NTDS Resource Library.
https://www.asn-online.org/ntds/resources/

Analysis
• Analysis can be used to address 3 Questions of the Framework for Improvement:o What are we trying to accomplish?o What changes can we make that will lead to improvement?o How do we know that a change results in improvement?
• Analysis should move from the broad framework down to the detailed plan:o First establish what improvements are neededo Then prioritize the areas of need to be addressed immediatelyo Then develop the details of the action plan and its implementation and followup
• Each Step in this process requires the application of tools and methods

Analysis
• Examples of tools and methods used at different points along this path toward improvementoPattern recognition using data reviewoFailure mode and effects analysis oCause and effect diagrammingoRoot Cause Analysis applied to:
o Individual adverse eventso Multiple similar adverse eventso Unsafe conditionso Near miss events
oPlan-Do-Study-Act cycles

Communications—the Lifeblood of Teamwork and Learning
• If the data, analysis, and action planning of the QAPI Program is restricted to its Committee members, how would this information translate into improvements at the point of care? o Involvement of everyone who comes in contact with patients is especially
critical for infection prevention.
• Communication can be formal or informaloMorning Briefs and afternoon DebriefsoAd hoc Team HuddlesoMedical Director led teaching sessions for staffoStaff member to staff member feedback, call outs• Morning Briefs and afternoon Debriefs
• Ad hoc Team Huddles
• Medical director led teaching sessions for staff
• Staff member to staff member feedback, call outs

The “Days Since Infection” Poster can be used as a focal point for discussions around infection prevention in general and specifically the facility’s current actions (developed in the QAPI Program) needed for improvement.

Putting Quality Improvement Tools Into Action

Root Cause Analysis (RCA)
• Structured method used to examine major safety events
• More than “putting out fires”; finding a way to prevent the fire
In-depth review of:Organization and management of policies/procedures
The environment of care
Staffing levels and staff competency
Interactions of the care team
Patient-specific factors
Institutional and regulatory factors
Specific task functions
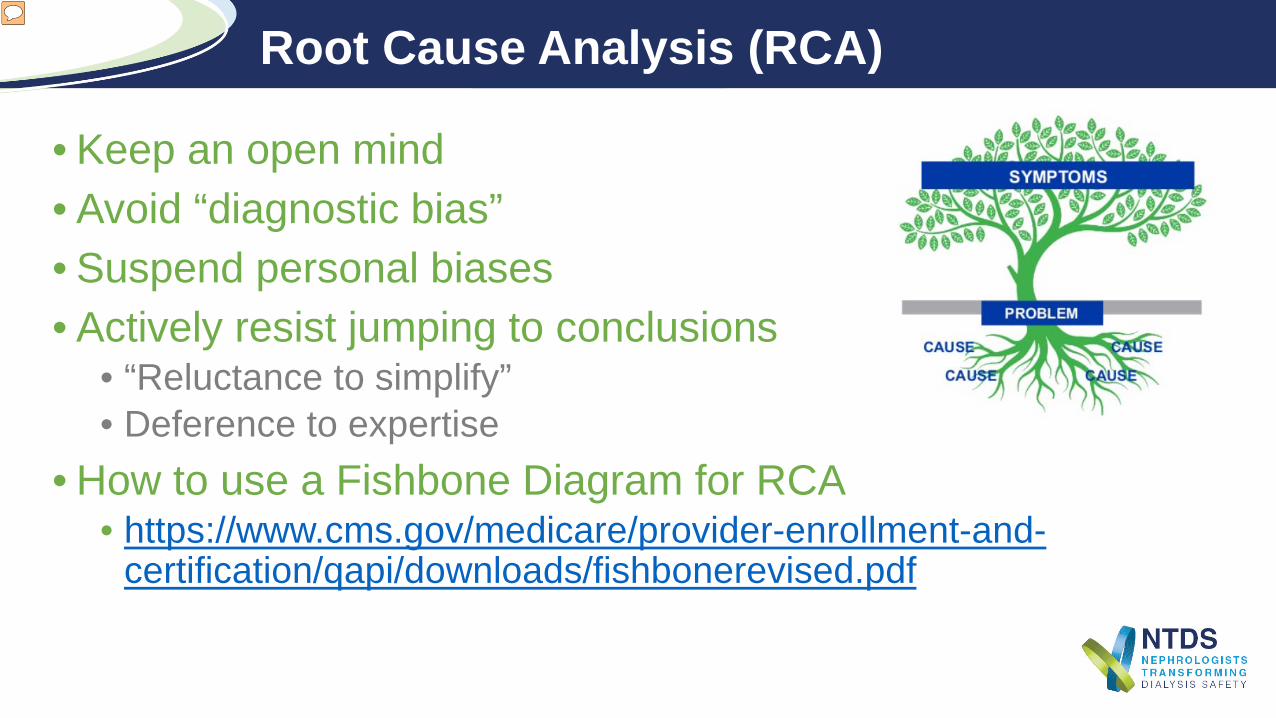
Root Cause Analysis (RCA)
• Keep an open mind• Avoid “diagnostic bias”• Suspend personal biases• Actively resist jumping to conclusions
• “Reluctance to simplify”• Deference to expertise
• How to use a Fishbone Diagram for RCA• https://www.cms.gov/medicare/provider-enrollment-and-
certification/qapi/downloads/fishbonerevised.pdf

Root Cause Analysis Fishbone Diagram
Problem
Cause 1 Cause 4Cause 2
Cause 5 Cause 8Cause 6
Cause 3
Cause 7

What is an Action Plan?
A list of tasks specific to the next steps toward completion of an improvement aim; it is not a restatement of the goal
The plan can be frequently modified as tasks are completed or if re-direction is needed
It should include timelines and a list of who is responsible for each step
Is part of the overall Quality Improvement Work Plan

Quality Improvement Work Plan• Guides QI performance activities• Describes
• QI program activities of performance indicator development and refinement
• Ongoing and time-limited performance improvement projects• Focused studies• Other monitors to ensure quality care
• Helps to ensure that the entire team understands what is being monitored
• Allows for transparency and improves accountability

Sample Quality Improvement Work PlanRoot Cause Action Personnel Time Frame Target Reporting
Too many catheters
Communicate with surgeon
Medical Director
2 weeks Importance of fistulas, timely visits and follow up
Monthly
Poor patient hygiene
Patient education Social worker 2-3 months Education programs for clinic.Individual patient intervention
Monthly
Protocol adherence
Re-educate nurses and techs
Nurse educator
2 months Observed adherence with protocols
Monthly
Physicalprophylaxis
Contact dialysis provider regardingTego/Curos,approval for antibiotic lock solution
Medical Director
2 weeks Start using physicalprophylaxis
Monthly
Surveillance Observe adherence Head Nurse Now and recheck
Record adherence with protocols
Monthly

Pareto Chart
• Named after Vilfredo Pareto, contains both bars and a line graph
• Individual values are represented in descending order by bars and the cumulative total is represented by the line
• Uses the Pareto Principle (80/20 rule); 80% of the effect comes from 20% of the causes
• Pareto chart helps to identify the most frequent defects, complaints, or other factor you can count or categorize

Pareto Chart

The Quality Paradigm
See It•Requires Courage
Own It•Requires Character
Solve It•Requires Imagination and Knowledge
Do It•Requires Will

Plan, Do, Check, Act (PDCA) Cycle
• An iterative 4-step management method used to control and continually improve processes and products
• Made popular by W. Edwards Deming who is considered to be the father of modern quality control
• Based on the scientific method; hypothesis-experiment-evaluation• Once evaluated, the cycle begins all over again• Multiple iterations of the PDCA cycle are repeated until the problem is
solved

• Prepare• Apply (pilot)• Verify the tools
• Verify results of actions taken
• Compare with plan
• Adopt, adapt
• Identify problem• Gather data• Review current
policy and procedure
• Isolate causes• Root cause
evaluation• Define actions
• Adopt, adapt• Standardize• Disseminate and
implement across system
Act Plan
DoCheck
Plan, Do, Check, Act (PDCA) Cycle

Control Charts

Normal (or Common) Cause Variation
Data points within upper (UCL) and lower (LCL) limits, above and below the mean (CL)

Special Cause Variation
Requires investigation
Data point outside Control limit = “special cause” variation requiring investigation

Trend Chart
Trend: 6-7 data points increasing (decreasing) in succession
0.0
0.1
0.2
0.3
0.4
0.5
0.6
0.7
0.8
0.9
1.0
Jan-15 Feb-15 Mar-15 Apr-15 May-15 Jun-15 Jul-15 Aug-15 Sep-15 Oct-15 Nov-15 Dec-15 Jan-16 Feb-16 Mar-16
Requiresinvestigation

References• Medicare’s Conditions for Coverage, 2008: (https://www.cms.gov/Regulations-and-
Guidance/Legislation/CfCsAndCoPs/Downloads/ESRDfinalrule0415.pdf).
• Wachter RM. Understanding Patient Safety, 2nd ed. McGraw-Hill, Inc., 2012.• Provost LP and Murray SK. The Health Care Data Guide, John Wiley & Sons,
Inc., 2011.• RCA²: Improving Root Cause Analysis and Actions to Prevent Harm. National
Patient Safety Foundation, 2015: (www.npsf.org).
• Nelson EC, Batalden PB, Godfrey MM, eds. Quality by Design, 1st ed. John Wiley & Sons, Inc., 2007.
• Kapoian T, Meyer KB, Johnson DS. Infection Prevention and the Medical Director: Uncharted Territory. Clin J Am Soc Neph 10: 1-12, 2015.
• CDC Making Dialysis Safer For Patients Coalition Resources: www.cdc.gov/dialysis/coalition/resource.html

Practical Steps for Detecting and Managing Patients with Bloodborne Pathogens – Lessons Learned from the Ebola Epidemic
T. Alp Ikizler, MDVanderbilt University
Professor of MedicineAssociate Director, Division of Nephrology

Disclosures
• T. Alp Ikizler, MD• None

The Problem
Widespread epidemic of Ebola virus in West Africa in 2014 and 2015
As of June 10, 2016, total of confirmed, probable and suspected cases of Ebola virus disease (EVD) in West Africa was 28,616
Confirmed 11,310 deaths
Of 27 patients who received therapy in United States and Europe, five (19%) required renal replacement therapy (RRT)
A number of gaps in the level of preparedness of inpatient hemodialysis units were identified.
Although it is unlikely that a person who may have EVD will present to outpatient hemodialysis center, it is recommended that HD centers be prepared for such an occurrence.
This would set a precedent for any other potential emerging threat at the Outpatient Dialysis Unit setting.

The Story
March 2014, initial Ebola Cases reported in Guinea, spreads to Liberia, Sierra Leona, Nigeria and Mali.
By June 2014, 330 deaths officially recorded.
July 2014, 2 physicians, one of which is the CMO in charge of battling Ebola epidemic in Sierra Leona, are dead.
December 2014, over 7,000 deaths recorded, due to EVD including 11 physicians in Sierra Leona
September 2014, 6 million people quarantined in SL, door to door search reveals 130 cases and 92 bodies.

The Story – The U.S. Experience
August 2014, two patients arrive at Emory for treatment of EVD
September 2014, Mr. Duncan story begins in Liberia.• Presents to ED in Texas, states he was hospitalized in Liberia but discharged.• Admitted to Texas hospital in early October 2014, requires intensive treatment, dies on
October 8th.
Nurses taking care of Mr. Duncan travel. Two present with symptoms and are diagnosed with Ebola..
November, 2014 three patients arrive at University of Nebraska for treatment of EVD

FMC Experience – As Reported By Dr. Jeff Hymes
Within 1-2 weeks of the Ebola onset, a transient dialysis patient was traveling on the same plane as one of the Texas nurses exposed to EVD (patient saw report on TV and reported it to FMC); FMC attempted to transfer patient to an academic center for treatment and was refused. Pt had no physical contact with the nurse on the plane.
Problems identified:• No guidance - first thought that patients would be able to dialyze in the unit after all the patients
had left but decided not to do this due to fear within the unit.• Used NxStage and used bags for effluent…
• didn’t think to use bleach in the bags at the time - this was early in the process• NxStage was able to accommodate set-up for this home patient very rapidly.• FMC reported this event to the local health department and to the CDC; this was early in the
process and they were still looking for guidance for PPE

FMC Experience –Lessons Learned
This was a potential exposure (although remote); home, staff-assisted dialysis was a good option
If there were a large number of patients involved, would consider re-arranging system and dedicate an entire center to treat potentially exposed patients
Sending patients to the hospital was a problem as it seemed the hospital was confused
Everyone that came into the facility-UPS, FedEx, mailman, visitors, etc. had their temperature taken during that time period…but how do you take that temperature, and if it is elevated, then what??

Gap Analysis of Out-Patient Hemodialysis Units
No on-site written policies for possible infection with Ebola virus, Middle East Respiratory Syndrome (MERS), Severe Adult Respiratory Syndrome
(SARS)
No written process and list of relevant telephone
numbers for alerting key dialysis center personnel
No designated person responsible for monitoring
news, public health alerts or appropriate (e.g., CDC)
websites
Lack of a policy and adequate resources for
appropriate triage of patients with suspected
infection
Failure to have trained a limited number of personnel regarding specific isolation precautions and procedures• High staff turnover
Potential lack of appropriate space for immediately
placing a patient who is being evaluated for possible
Ebola virus infection.
No dedicated supply of the types of personal protective
equipment (PPE)

Measures for Closing the Gaps at Out-Patient Dialysis Centers
•Designate an individual who will be responsible for monitoring news/websites for evidence of ongoing Ebola virus transmission•Consider nurse manager• Individual with infection prevention experience
• Implement Ebola preparedness plan• Identify• Isolate• Inform

Ebola Preparedness Plan in Outpatient HD Units
Identify• Place signs• Send message to patients via telephone and social
media• Screen patients before they walk all the way
through the facility• Identify signs and symptoms in high risk patients
• Surveillance for 21 days in high risk patients

Ebola Preparedness Plan In Outpatient HD Units
Isolate• Place in private room or area• Use PPE at all times when contacting the patient• Use personnel with training and limit exposure with
other staff• Minimize exposure to blood (i.e., limited to no blood
draws)• Consult health department
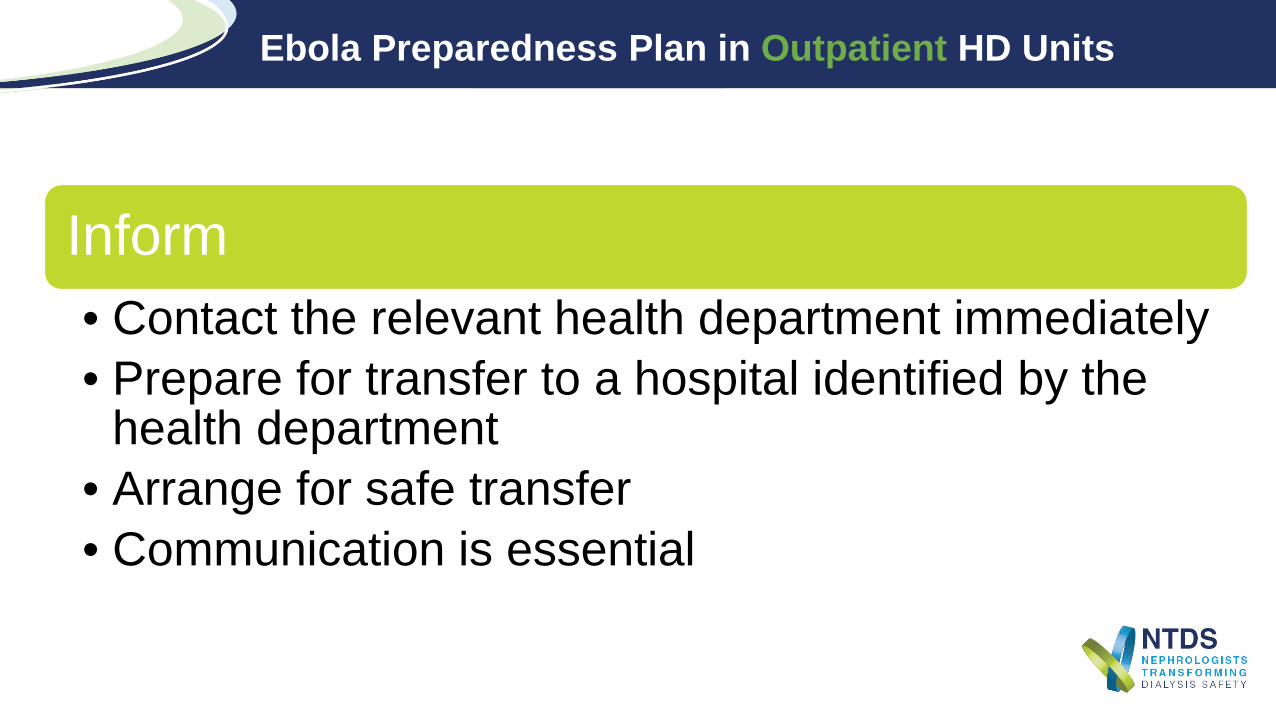
Ebola Preparedness Plan in Outpatient HD Units
Inform• Contact the relevant health department immediately• Prepare for transfer to a hospital identified by the
health department• Arrange for safe transfer• Communication is essential

Ebola Preparedness Plan in Inpatient HD Units
•Make available a written emergency preparedness policy in the dialysis unit
•Train in advance a group of physicians and nurses who will care for the dialysis patient
•Train ICU staff where dialysis will be performed• CRRT is preferred• Regional citrate preferred
•Arrange dedicated testing material and storage place for effluent
•Disinfect machines with bleach and rest for 7-10 days


Practical Steps for Detecting and Managing Patients with Bloodborne Pathogens
• Based on the efforts of multiple organizations, much has been learned regarding how to safely and effectively perform hemodialysis on patients with Ebola Virus Disease (EVD).
• Many of the general strategies developed for management of patients with EVD should also be applicable, with appropriate modifications, for handling patients with other severe transmissible diseases that may emerge in the future.
• Uncertainty exits regarding the level of funding. Formation of the network of 10 National Ebola Training and Education Centers should help in the future.
• A number of areas require further research and evaluation.• Improvements in infrastructure, processes for detection, triage and isolation of
individuals with EVD, the design of PPE, new technologies for environmental cleaning and disinfection, and best infection control practices.
• Securing future funding represents a challenge

Antimicrobial Stewardship in Dialysis
Erika D’Agata, MD, MPHProfessor of Medicine
Brown UniversityDivision of Infectious Diseases
Rhode Island Hospital

Disclosures
• Erika D’Agata, MD, MPH• None

Methicillin-Resistant Staphylococcus aureusGlobal dissemination
Molton J S et al. Clin Infect Dis. 2013;56:1310-1318
© The Author 2013. Published by Oxford University Press on behalf of the Infectious Diseases Society of America. All rights reserved. For Permissions, please e-mail: [email protected].

Vancomycin-Resistant EnterococcusGlobal dissemination
Molton J S et al. Clin Infect Dis. 2013;56:1310-1318
© The Author 2013. Published by Oxford University Press on behalf of the Infectious Diseases Society of America. All rights reserved. For Permissions, please e-mail: [email protected].

0
2
4
6
8
10
12
14
16
18
20
1994-95 1996-97 1998-99 2000-01 2002YEAR
Perc
ent o
f iso
late
s re
sist
ant t
o ≥3
antim
icro
bial
s
P.aeruginosaEnterobacter spp.Proteus spp.Klebsiella spp.E.coli
GRAM-NEGATIVE BACTERIA RESISTANT TO ≥3
D’Agata ICHE 2004

Multidrug-resistant Gram-negative Bacteria
•Currently the most concerning multidrug-resistant organism-very limited antimicrobial options
•Extended-spectrum beta-lactamase-producing gram-negative bacteria
• Resistant to cephalosporins and most other antimicrobials• Susceptible to carbapenems
•Carbapenemase-producing gram-negative bacteria- New Delhi metallo-beta-lactamase (NDM-1)
Emerged in 2008Susceptible only to polymixins

Klebsiella pneumoniae carbapenemase–producing K. pneumoniaeand New Delhi metallo-β-lactamase-1–producing Enterobacteriaceae
Global dissemination
Molton J S et al. Clin Infect Dis. 2013;56:1310-1318
© The Author 2013. Published by Oxford University Press on behalf of the Infectious Diseases Society of America. All rights reserved. For Permissions, please e-mail: [email protected].

Timeline Of Antimicrobial Development
Clatworthy et al. Nature Chemical Biology:2007;3:541-8
Tigecycline

Timeline Of Antimicrobial Resistance
Clatworthy et al. Nature Chemical Biology:2007;3:541-8

“Bad Bugs, No Drugs: As Antibiotic Discovery Stagnates, A Public Health Crisis Brews” – Infectious Disease Society of America report
Spellberg et al. Clin Infect Dis 2007

Development of New Antibiotics

Population of Chronic Hemodialysis (CHD)USRDS 2009 Annual Report
• Infections are the major cause of hospitalizations and death
• Rates of hospitalization due to infection are increasing 43% higher in 2009 than in 1993
• Mortality rates due to infections caused by antimicrobial-resistant bacteria are 2-5 fold higher then infections caused by susceptible bacteria
• Antimicrobial resistance rates are among the highest in patients requiring chronic hemodialysis

CHD Patients At High Risk Of ESBL-GN Infections
•Saely et al. Am J Infect Control 2011
•Hemodialysis was associated with 13-fold higher risk of ESBL-producing Klebsiella pneumoniae infections
•OR 13.60, 95%CI 4.3-43.2

Societal Impact Of Multidrug-resistant Organisms (MDRO) Among The Dialysis Population
•CHD patients contribute to MDRO spread in the hospital setting(USRDS 2009)
• 2 admissions per year• LOS 12 days• 36% readmitted within 30 days
•CHD patients contribute to MDRO spread in the community setting (Lu 2008)
• 7% of CHD family members colonized with same MRSA strain

Preventing The Emergence And Spread Of Multidrug-resistant Organisms (MDRO)
1. Prevent emergence of resistance judicious use of antimicrobials
2. Prevent spread of MDRO limiting patient to patient transmission judicious use of antimicrobials

Recommendations For The Prevention Of MDRO Spread
CDC MMWR 2001
1 Wear gloves when in contact with patients
2 Remove gloves and wash hands in between patients or stations
3 Follow published guidelines for judicious use of antibiotics
4 Avoid multiuse items
5 Do not use common medication carts

Recommendations For The Prevention Of MDRO Spread
CDC MMWR 2001
6 Patients at high risk of MDRO spread
Infected wounds
Drainage not contained by dressing
Fecal incontinence or diarrhea
Wear both gloves and dedicated disposable gowns when providing care
Provide dialysis during sessions with the least amount of other patients OR at a station with as few adjacent stations as possible

Antimicrobial Use In The Dialysis Population
•Paucity of data• Antimicrobial starts or claims data
• Two studies addressing inappropriate prescribing of vancomycin in the hospital
• Only one study addressing inappropriate prescribing of all antimicrobials in outpatient units

Antimicrobial Use In Two Dialysis Centers
Snyder/D’Agata Infect Control Hosp Epidemiol 2013

Antimicrobial Use In Two Dialysis Centers
Snyder/D’Agata Infect Control Hosp Epidemiol 2013

Antimicrobial Use In Two Dialysis Centers
Snyder/D’Agata Infect Control Hosp Epidemiol 2013

Antimicrobial Use In Two Dialysis Centers
Snyder/D’Agata Infect Control Hosp Epidemiol 2013

Vancomycin Prescribing Patterns Among Hospitalized CHD Patients
Green K, D’Agata E, Am J Kidney Dis 2000

Antimicrobial Use in Hemodialysis
Zvonar R, Nephrol Dial Transplant 2008

Nafcillin/Cefazolin Superior To Vancomycin In The Treatment Of MSSA Infections
•Schweizer et al. BMC Infect Dis 2011
- nafcillin/cefazolin - 79% lower mortality hazards compared to vancomycin alone
- Among patients who initially received vancomycin empirically, those switched to nafcillin/cefazolin had 69% lower mortality hazards compared to vancomycin

Nafcillin/Cefazolin Superior To Vancomycin In The Treatment Of MSSA Infections
•Stryjewski et al. Clin Infect Dis 2007
•MSSA BSI among 123 CHD patients
•Treatment failure more common among those receiving vancomycin (31%) c/t cefazolin (13%) P=0.02
•Cefazolin dose: 2-3 grams after HD

Nafcillin/Cefazolin Superior To Vancomycin In The Treatment Of MSSA Infections
•Chan et al. JASN 2012
•38% lower risk of hospitalization or death among CHD patients receiving cefazolin c/t vancomycin
•HR=0.62 95%CI 0.46-0.83
Indications For Antimicrobial Use In Two Dialysis Centers (CDC Collaboration)
•Prospective study from 2010-2011
• Indications for antimicrobial doses
• Inappropriate reasons for administration based on national guidelines
Snyder, D’Agata Infect Control Hosp Epidemiol 2013

Inappropriate Indications For Antimicrobial Administration
1. Empiric start (in dialysis unit)- no fever and/or criteria for infection not met
2. Continuing doses- criteria for infection not met - more narrow spectrum antimicrobial not chosen
3. Surgical prophylaxis – indication or choice of antimicrobial inappropriate
30% of antimicrobial doses were not indicated

Type Of Antimicrobials Prescribed Inappropriately
Snyder, D’Agata Infect Control Hosp Epidemiol 2013

Indications/Appropriateness
Snyder, D’Agata Infect Control Hosp Epidemiol 2013

Reasons For Inappropriate Administration Of Antimicrobial Doses

Criteria For Infection Not Met - BSI•Empiric doses
•no fever, negative blood cultures, “chills”
•Continuing doses•did not meet definition of BSI
•One positive culture with either fever, hypotension or chills• contaminant

Criteria For Infection Not Met -SSTI•Definition of SSTI
• new or increasing drainage at the site or• 2+ of the following: fever, redness, tenderness, warmth, new/increasing
swelling• only either redness, tenderness or swelling documented
•Definition for vascular access site infection• pus, redness or swelling• only tenderness documented

Antimicrobial Not Narrowed•Given vancomycin but beta-lactam antibiotic appropriate- 48 doses (65%)
•Given 3d/4th generation cephalosporin but first generation appropriate- 26 doses (35%)•Based on susceptibility data of positive cultures

Elements of an Acute Care/Hospital Antibiotic Stewardship Program
It is the opinion of Dr. D’Agata that these elements may be applied to a dialysis facility.

1.Leadership
Support
Dedicating necessary resources• Personnel• Financial• Information technology

2. Identifying Individuals Who Will
Lead The ASP (Champions)
Appoint a single leader responsible for the ASP• Responsible at an executive-level or
patient quality-focused committee
Identify a team
• Medical director• Clinical manager or other• Person with drug expertise

3. Drug
Expertise
Pharmacist
Infectious disease physician
Dialysis units

4. Identify Areas
for Improvement
Review prescribing patterns
• Most common antimicrobials
Review patterns of obtaining cultures
• How often are cultures being obtained in the absence of signs or symptoms
Identify why antimicrobials are being prescribed inappropriately• Type of antimicrobial• Duration of antimicrobial treatment• De-escalation• Surgical prophylaxis

5.Tracking
Monitor process measures• Adherence to facility-specific guidelines• Time to de-escalation• Impact on patients
• AB-related adverse effects• Clostridium difficile infections• Drug-drug interactions
6.Reporting/Feedback
Regular reporting of information to relevant staff and leadership• Single unit results and comparison to
other units
Effective in reducing surgical site infections

7. Education
Optimal prescribing• Published guidelines and clinical
pathways
Infection management
Emergence of resistance

8. Strategies
Antimicrobial order forms/checklists
Formulary restriction
Review with verbal feedback
Positive deviance strategy