virkkunen, iikka; koskinen, tuomas; jessen-juhler, oskari
TRANSCRIPT
This is an electronic reprint of the original article.This reprint may differ from the original in pagination and typographic detail.
Powered by TCPDF (www.tcpdf.org)
This material is protected by copyright and other intellectual property rights, and duplication or sale of all or part of any of the repository collections is not permitted, except that material may be duplicated by you for your research use or educational purposes in electronic or print form. You must obtain permission for any other use. Electronic or print copies may not be offered, whether for sale or otherwise to anyone who is not an authorised user.
Virkkunen, Iikka; Koskinen, Tuomas; Jessen-Juhler, Oskari; Rinta-aho, JariAugmented Ultrasonic Data for Machine Learning
Published in:Journal of Nondestructive Evaluation
DOI:10.1007/s10921-020-00739-5
Published: 01/03/2021
Document VersionPeer reviewed version
Please cite the original version:Virkkunen, I., Koskinen, T., Jessen-Juhler, O., & Rinta-aho, J. (2021). Augmented Ultrasonic Data for MachineLearning. Journal of Nondestructive Evaluation, 40(1), [4]. https://doi.org/10.1007/s10921-020-00739-5
Journal of Nondestructive Evaluation manuscript No.(will be inserted by the editor)
Augmented Ultrasonic Data for Machine Learning
Iikka Virkkunen · Tuomas Koskinen ·Oskari Jessen-Juhler · Jari Rinta-aho
Received: date / Accepted: date
Abstract Flaw detection in non-destructive testing, especially for complexsignals like ultrasonic data, has thus far relied heavily on the expertise andjudgement of trained human inspectors. While automated systems have beenused for a long time, these have mostly been limited to using simple decisionautomation, such as signal amplitude threshold.
The recent advances in various machine learning algorithms have solvedmany similarly difficult classification problems, that have previously been con-sidered intractable. For non-destructive testing, encouraging results have al-ready been reported in the open literature, but the use of machine learning isstill very limited in NDT applications in the field. Key issue hindering theiruse, is the limited availability of representative flawed data-sets to be used fortraining.
In the present paper, we develop modern, deep convolutional network todetect flaws from phased-array ultrasonic data. We make extensive use of dataaugmentation to enhance the initially limited raw data and to aid learning.The data augmentation utilizes virtual flaws - a technique, that has success-fully been used in training human inspectors and is soon to be used in nuclearinspection qualification. The results from the machine learning classifier arecompared to human performance. We show, that using sophisticated data aug-mentation, modern deep learning networks can be trained to achieve human-level performance.
Keywords Machine learning · NDT · Ultrasonic Inspection · Data augmen-tation · Virtual flaws
Iikka VirkkunenAalto UniversityTel.: +358 50 3475557E-mail: [email protected]
Tuomas Koskinen, Oskari Jessen-Juhler,Jari Rinta-ahoVTT Technical Research Centre of Finland Ltd
2 Iikka Virkkunen et al.
1 Introduction
Automated systems have long been used for flaw detection in various Non-destructive evaluation (NDE) systems. The automated systems provide con-sistent results and do not show the variation commonly seen in human inspec-tors due to fatigue, stress or other ”human factors”. However, the traditionalautomated systems have relied on simple decision algorithms such as a signalamplitude threshold. In more demanding inspection cases, such as the typicalultrasonic inspections, the human inspectors achieve far superior inspectionresults than the simplistic automated systems. Consequently, in most of theseinspections the data analysis are currently analyzed by human experts, evenwhen the data acquisition is highly automated. Such analysis is time consum-ing to do and taxing for the personnel.
The key problem with more sophisticated automation has been, that thework of the human inspector does not lend itself to simple algorithmic descrip-tion. The inspectors acquire their skill through years of training and utilizevarious signal characteristics in their judgement (e.g. the “signal dynamics”).Machine learning (ML) systems can be used to automate systems, where di-rect algorithmic description is intractable. The recent improvements in MLalgorithms and computational tools (GPU acceleration, in particular) haveenabled more complex and powerful models that reach human-level perfor-mance in tasks like image classification and machine translation.
Early attempts to use machine learning for NDT flaw detection and clas-sification focused on using simple neural networks to classify various types ofNDT data. Masnata and Sunser [22] used a neural network with single hiddenlayer to classify various flaw types (cracks, slag inclusions, porosity) from ul-trasonic A-scans. Before learning, the A-scan was reduced to 24 pre-selectedfeatures using the Fischer discriminant analysis. Chen and Lee [7] used waveletdecomposition, to obtain features from A-scans and reported goal classifica-tion, while the training and testing was done with limited data set. Yi and Yun[36] similarly used shallow neural network to train flaw type classifier with alarger data set. Aldrin et al. [2] attained high POD-performance on compli-cated ultrasonic inspection case by training several shallow neural networksto detect various chahacteristic crack types from a complex ultrasonic signal.Although in many cases this early work reported high classification accuracy,the results proved to be difficult to scale and to extend to new cases.
One of the issues with developing ML-models for defect classification hasbeen the limited availability of training data. Liu et al. [20] used finite elementsimulation results to provide artificial NDT signals to augment training data.
With the increase in computational power, the used machine learning mod-els have become more powerful. Many authors ([11, 13, 26, 27]) have reportedgood results with shallow models like support vector machines (SVM’s). Whilethese models offer high classification capability, they also require a pre-selectedset of features to be extracted from the raw NDT signal. Fei et al. [13] usedwavelet packet decomposition of ultrasonic A-scans to train SVM for defectclassification in a petroleum pipeline. Sambath et al. [26] used neural network
Augmented Ultrasonic Data for Machine Learning 3
with two hidden layers to classify ultrasonic A-scans using a hand-engineeredset of 12 features. Shipway et al. [27] used random forests to detect cracks fromfluorescent penetrant inspections (FPI). Cruz et al. [11] used feature extrac-tion based on principal component analysis to train a shallow neural networkto detect cracks from ultrasonic A-scans. He reported good classification anal-ysis with only 5 extracted features, and computational efficiency that makessuch classification feasible as on-line evaluation support for inspector duringmanual scanning. Silva et al. [28] used fast extreme learning machine to clas-sify time of flight diffraction (TOFD) signals in welds that allowed fast andefficient training on limited set of frequency based features.
Kahrobaee et al. [16] demonstrated the use of machine learning to achievedata fusion by learning separate classification networks from different NDTdata and using a combined classifier with the results from these separate clas-sifiers. It is often the case in inspection, that more than one inspection methodis used and the ability to take better advantage of the multiple data sourcesis thus advantageous.
The machine learning classifiers have been used for a wide variety of NDTsignals and classification cases. Tong et al. [30] used deep convolutional neuralnetworks (CNNs) to detect subgrade defect from ground penetrating radarsignals. For NDT methods, that provide image or image-like raw data, deepCNNs used for image classification have been applied with little modification.Dorafshan et al. [12] used the AlexNet [18] deep CNN for detecting cracks inconcrete from visual inspection images.
Convolutional networks have recently shown great success with variousimage classification tasks [21]. The convolutional architechture lets the net-works to learn position independent classification. The recent deep architer-ctures have shown the ability to learn increasingly abstract representationsin higher layers, which obliviates the need for hand-engineered features [38].These features make the deep convolutional networks also interesting for theflaw detection in NDE signals.
Recently Meng et al. [23], Zhu et al. [39] and Munir et al. [25] used deepCNNs for defect classification in ultrasonic and EC-data. Meng et al. [23]used deep neural networks with an SVM top layer for enhanced classificationcapability. The classifier was used to classify voids and delamination flaws incarbon fibre composite material. Before presented to the CNN, the raw A-scandata was decomposed using wavelet packet decomposition and the resultingcoefficients re-organized into 32x16 feature matrix. Thus, the CNNs classifiedthe A-scans separately.
Munir et al. [24] used deep CNN’s to classify austenitic stainless steel welds.The training data was obtained from weld training samples containing artificialflaws (i.e. solidification flaws). The data-set was augmented by shifting the A-scans in time-domain and by introducing Gaussian noise to the signal.
Zhu et al. [39] used deep CNN’s to detect cracks in eddy current signal.Also, drop-out layer was used to estimate the confidence of the classification,which is an important opportunity in using ML in field NDT, where the reli-ability requirements are very high. This work is also notable in that the raw
4 Iikka Virkkunen et al.
signal database was exceptionally representative with NDT indications repre-senting plant data for various defect types [31].
In summary, the current state of the art for using machine learning inNDT classification may be seen to focus on two distinct aims. Firstly, modernshallow ML models (e.g. random forests) with advanced feature-engineeringare used with the aim to develop computationally lightweight models that canbe implemented on-line to aid inspector in manual inspection. Secondly, deepCNNs are used to learn from raw NDT signals without the need for explicitfeature engineering. The recent work on deep models takes full advantageof recent advances in models developed for other industries and shows goodresults across different NDT fields.
For ultrasonic testing, the existing machine learning models have mostlyinvolved classification the single A-scan level. This is a natural approach formany applications, such as the previously studied manual inspection [11] orfor C-scan style classification of large inspection analysis as done by Menget al. [23]. However, in many inspection cases, mechanized inspection andelectronic scanning using phased array ultrasonic systems provide rich data-setwhere adjacent A-scans can be analysed together to provide more information.Machine learning application to such data-sets have not been widely published.In the present work, we present application of deep CNN for phased arrayultrasonic data, where number of adjacent A-scans are considered together forimproved flaw detection capability.
Common obstacle for using powerful ML models in NDE classification is,that the available flawed data tends to be scarce. Acquiring sufficient represen-tative data-set would in many cases necessitate artificially manufacturing largeset of flawed samples, which quickly becomes infeasible. Data augmentationis commonly considered a key tool for successful application of ML for smalldata sets and some authors have used data augmentation [24] for ultrasonicdata. In the present work, we significantly expand on the previously publisheddata augmentation schemes for ultrasonic inspection by using virtual flaws togenerate augmented data sets. The use of virtual flaws enables generation ofhighly representative augmented data set for ML applications.
Finally, the key requirement for adaptation of machine learning modelsin many industries, is to show how they compare with human inspectors.Especially in high-reliability industries like the nuclear and aerospace indus-tries, there’s common requirement to employ best-available means to guaranteestructural reliability. In practice, this would mean that the ML models wouldneed to show performance exceeding that attained by the human inspectorsor to show performance that meets the current requirements set for the tradi-tional inspection systems (e.g. show required a90/95 performance, as commonlyrequired in the aerospace industry). However, in many cases even the humaninspection performance is not quantified and known with sufficient reliabilityto allow direct comparison to developed ML models. In present work, we usedhuman performance data obtained from previous research [35] and developedthe machine learning models to work on comparable data thus enabling directcomparison between human inspector and modern machine learning model.
Augmented Ultrasonic Data for Machine Learning 5
1.1 Virtual flaws and data augmentation
The problem with ultrasonic training of machine learning models is the scarcityof representative ultrasonic data. Samples with real flaws are difficult to comeby and in terms of nuclear power plants can be contaminated making themchallenging to use. Mock-ups can be made with representative flaws, but pro-duction of such mock-ups is costly and time-consuming. The mock-ups alsotend to be specific to a certain inspection case. Virtual flaws can be used togenerate sufficient representative flawed ultrasonic data from limited set ofmock-ups and flaws [17, 29, 33, 34]. In essence, the flawed sample is scannedand the ultrasonic data recorded. From the recorded data the flaw signals areextracted by comparing the signal data point by data point to a selected flaw-less area. The flaw signal extracted this way is guaranteed to be representative,since it is recorded from an existing flaw. The extracted flaw signal can thenbe implanted into different locations of the scan data, point by point, allowingthe generation of new virtual flaws. In addition, the depth and length of theflaw can be altered and various other signal modifications can be achieved.The flaw signals extracted can be moved to different samples. Flaw signalsacquired with different ultrasonic parameters can be made compatible withdifferent files. Using the virtual flaws augmented data generation is virtuallyunlimited and ample representative training data can be generated for thetraining of ML models. The approach has some similarity with synthesizedlearning cases used by Bansal et al. [6].
1.2 Estimation of NDT performance and probability of detection (POD)
NDE is most valuable when used in area, where its expected reliability isvery high. Consequently, measuring the performance of an NDE system andits reliability, in particular, is demanding. Demonstrating this high reliabilityrequires high number of evaluation results on relevant targets and, thus, highnumber of test samples with representative flaws. Providing these flawed testsamples is costly and thus different methodologies have evolved to optimizethe use of the available test blocks.
Currently, the standard way to measure NDE performance is to define aprobability of detection (POD) curve and, in particular the smallest crackthat can be found at level of sufficient confidence, typically 90% POD at 95%confidence (a90/95). Experimentally, the POD curve is determined with testblock trials and a set of standardized statistical tools [3, 4, 5].
In this paper hit/miss method was selected due to nature of the test set-up.While signal amplitude can be used with fewer test blocks, it does not includethe effects of inspector judgement on the NDE reliability. Especially in noisyinspection cases such as austenitic stainless steel welds, flaw detection relieson pattern recognition, not just signal amplitude and a clear threshold, thusthe result is filtered by the inspector. This was observed also by Virkkunenand Ylitalo [32]. For the present study and comparing human and machine
6 Iikka Virkkunen et al.
inspectors, it’s vital to include the judgement effect and thus, the hit/missapproach was chosen.
2 Materials & Methods
2.1 NDT Data
Inspected specimen for data-acquisition was a butt-weld in an austenitic 316Lstainless steel pipe. Three thermal fatigue cracks with depths 1.6, 4.0 and 8.6mm were implemented in the inner diameter of the pipe near the weld root byTrueflaw ltd. and scanned with ultrasonic equipment. An austenitic weld waschosen as a test specimen due to being common in the industry. In additionaustenitic weld has increased inspection difficulty due to noise caused by theanisotropy of the weld structure.
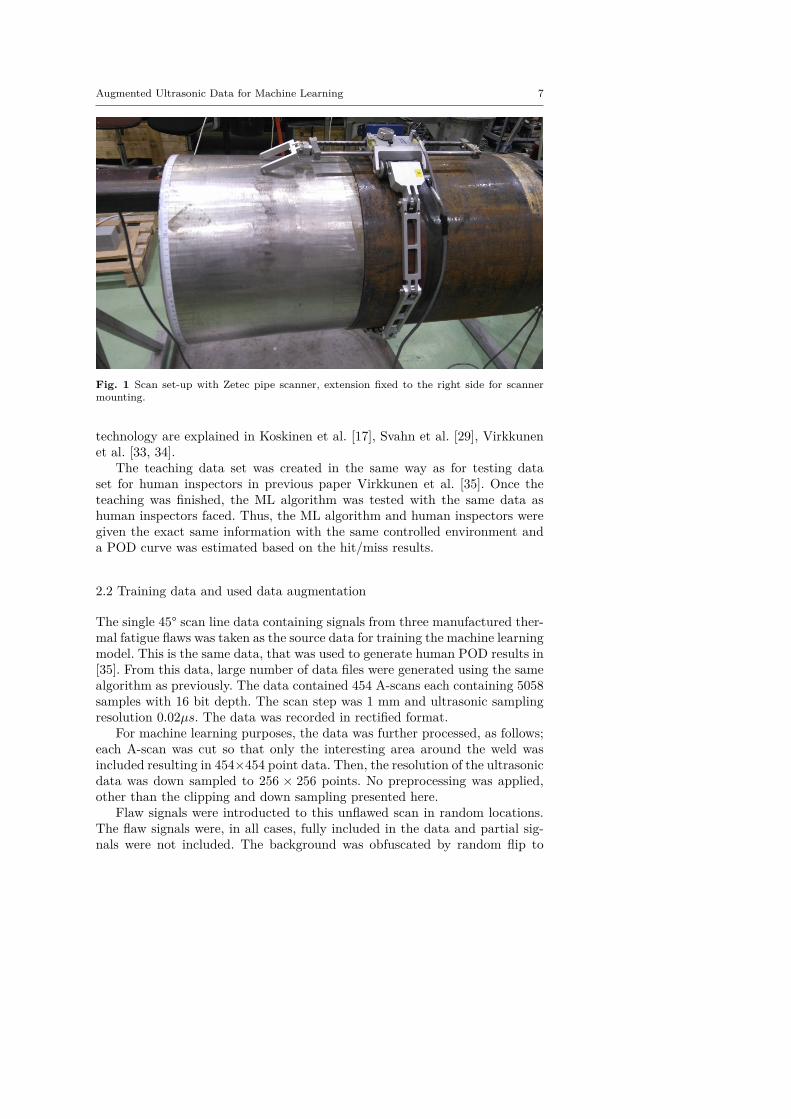
Inspection method used for data acquisition was Transmission ReceiveShear (TRS) phased array, one of the common methods used in inspecting ofaustenitic and dissimilar metal welds. The scan was carried out by using ZetecDynaray 64/64PR-Lite flaw detector linked to a PC. The probes used were aImasonic 1.5 MHz 1.5M5x3E17.5-9 matrix probes with central frequency at1.8 MHz, element dimensions 3.35 × 2.85 mm and element arrangement as5 × 3 elements. The sampling rate used was 100MHz. A wedge ADUX577Awas used to produce a shear wave efficiently. One linear scan with no skewangles was utilized. The ultrasonic wave was focused to the inner surface ofthe pipe and the probe was positioned in a way that the beam would be fo-cused directly to the manufactured cracks. Coupling was applied through afeed water system and the pipe was rotated underneath the probe to assureconstant and even coupling between the probe and the pipe. Probe positionwas carefully monitored along the scan line by Zetec pipe scanner with 0.21mm scan resolution. The specimen and the inspection procedure is describedin more detail in [17]. The specimen and the scanner can be seen in Figure 1.
For data efficiency, only a single angle was used. The chosen angle was theone, where the cracks were the most visible. In this case, this was the 45° angle.As only one scan line was acquired, the data was visualized and evaluated usingB-scan images. Since the crack locations and sizes were precisely known, thecrack signals could be removed from the ultrasonic data to create a blankcanvas. Virtual flaw augmentation was used to broaden the representativesizes of the cracks. The virtual flaw software used was Trueflaw’s eFlaw. Inthis case, the eFlaw was used with an assumption that signal amplitude isthe most significant feature of the crack signal from detection point of view.A similar assumption is used in the signal response POD estimation (a vs.a). The eFlaw was used to modify and scale down the original crack signalamplitude to represent different variety of cracks with smaller sizes than theoriginal. This allows creation of high amount of crack images required for PODestimation and for teaching datasets for ML algorithms. Details of the eFlaw
Augmented Ultrasonic Data for Machine Learning 7
Fig. 1 Scan set-up with Zetec pipe scanner, extension fixed to the right side for scannermounting.
technology are explained in Koskinen et al. [17], Svahn et al. [29], Virkkunenet al. [33, 34].
The teaching data set was created in the same way as for testing dataset for human inspectors in previous paper Virkkunen et al. [35]. Once theteaching was finished, the ML algorithm was tested with the same data ashuman inspectors faced. Thus, the ML algorithm and human inspectors weregiven the exact same information with the same controlled environment anda POD curve was estimated based on the hit/miss results.
2.2 Training data and used data augmentation
The single 45° scan line data containing signals from three manufactured ther-mal fatigue flaws was taken as the source data for training the machine learningmodel. This is the same data, that was used to generate human POD results in[35]. From this data, large number of data files were generated using the samealgorithm as previously. The data contained 454 A-scans each containing 5058samples with 16 bit depth. The scan step was 1 mm and ultrasonic samplingresolution 0.02µs. The data was recorded in rectified format.
For machine learning purposes, the data was further processed, as follows;each A-scan was cut so that only the interesting area around the weld wasincluded resulting in 454×454 point data. Then, the resolution of the ultrasonicdata was down sampled to 256 × 256 points. No preprocessing was applied,other than the clipping and down sampling presented here.
Flaw signals were introducted to this unflawed scan in random locations.The flaw signals were, in all cases, fully included in the data and partial sig-nals were not included. The background was obfuscated by random flip to
8 Iikka Virkkunen et al.
a=1.0 mm a=6.2 mm a=2.9 mm
a=1.2 mm a=2.9 mm a=5.0 mm
a=1.0 mm a=6.6 mm a=0.97 mm
0%
5%
10%
15%
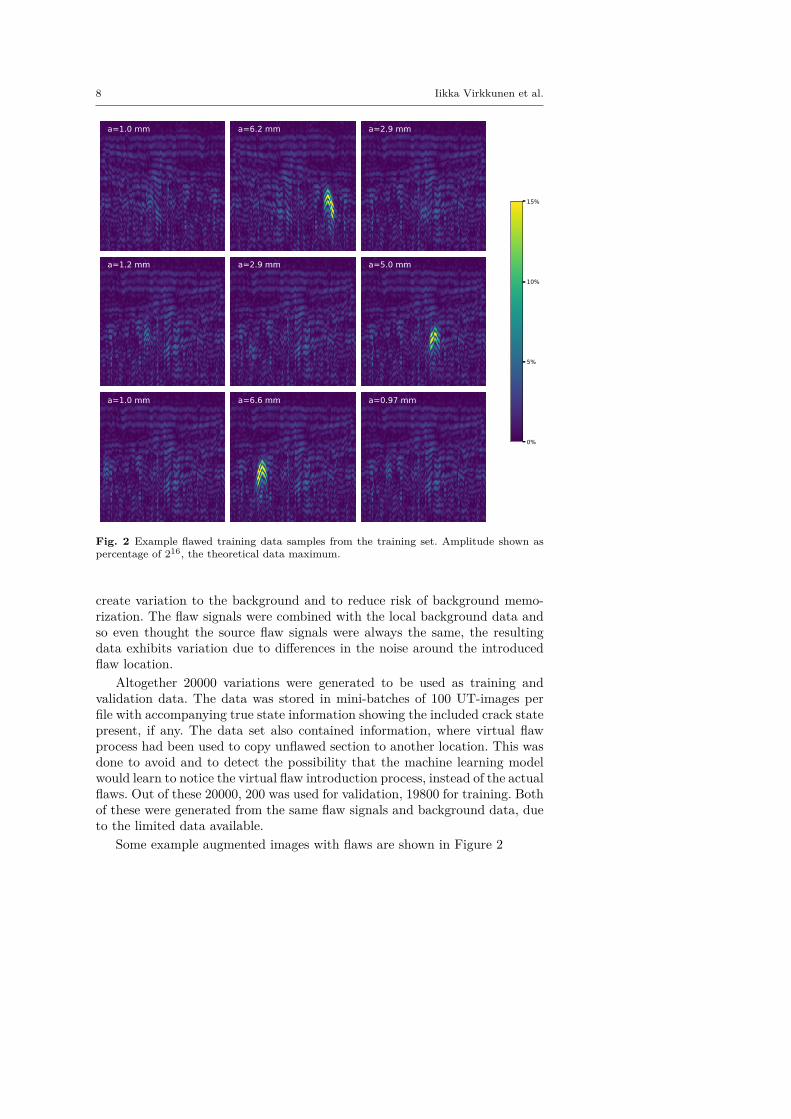
Fig. 2 Example flawed training data samples from the training set. Amplitude shown aspercentage of 216, the theoretical data maximum.
create variation to the background and to reduce risk of background memo-rization. The flaw signals were combined with the local background data andso even thought the source flaw signals were always the same, the resultingdata exhibits variation due to differences in the noise around the introducedflaw location.
Altogether 20000 variations were generated to be used as training andvalidation data. The data was stored in mini-batches of 100 UT-images perfile with accompanying true state information showing the included crack statepresent, if any. The data set also contained information, where virtual flawprocess had been used to copy unflawed section to another location. This wasdone to avoid and to detect the possibility that the machine learning modelwould learn to notice the virtual flaw introduction process, instead of the actualflaws. Out of these 20000, 200 was used for validation, 19800 for training. Bothof these were generated from the same flaw signals and background data, dueto the limited data available.
Some example augmented images with flaws are shown in Figure 2
Augmented Ultrasonic Data for Machine Learning 9
2.3 Used ML architecture
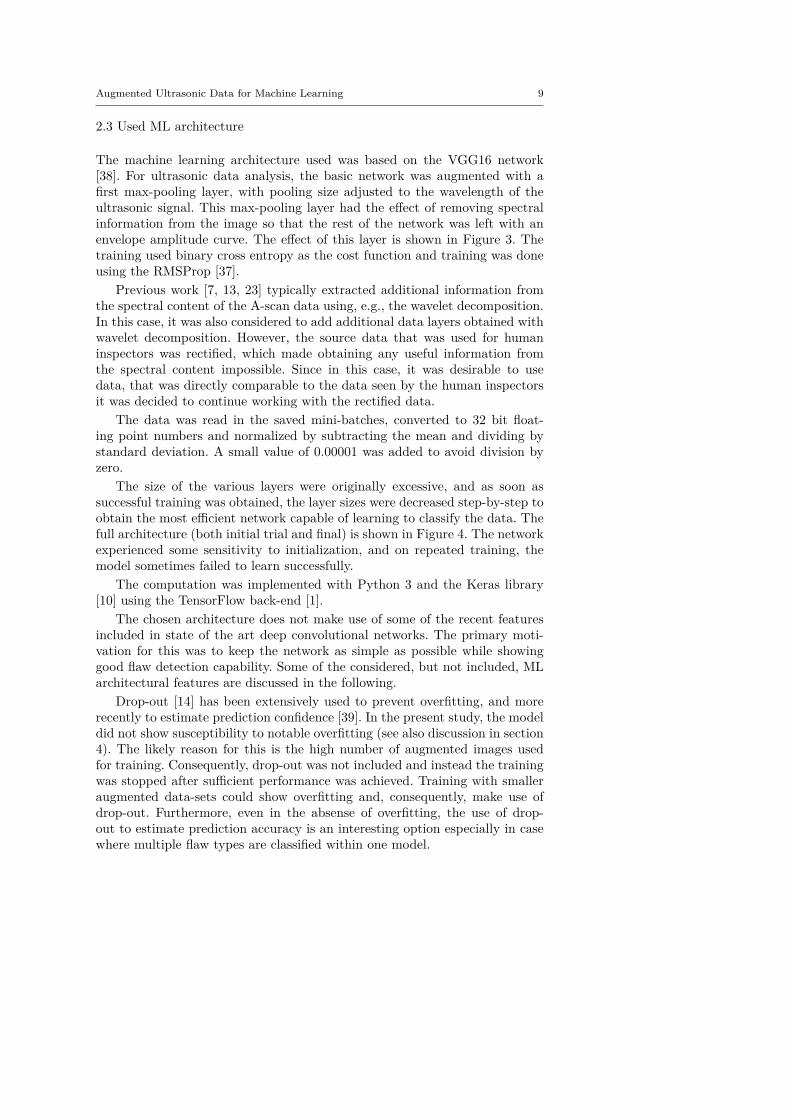
The machine learning architecture used was based on the VGG16 network[38]. For ultrasonic data analysis, the basic network was augmented with afirst max-pooling layer, with pooling size adjusted to the wavelength of theultrasonic signal. This max-pooling layer had the effect of removing spectralinformation from the image so that the rest of the network was left with anenvelope amplitude curve. The effect of this layer is shown in Figure 3. Thetraining used binary cross entropy as the cost function and training was doneusing the RMSProp [37].
Previous work [7, 13, 23] typically extracted additional information fromthe spectral content of the A-scan data using, e.g., the wavelet decomposition.In this case, it was also considered to add additional data layers obtained withwavelet decomposition. However, the source data that was used for humaninspectors was rectified, which made obtaining any useful information fromthe spectral content impossible. Since in this case, it was desirable to usedata, that was directly comparable to the data seen by the human inspectorsit was decided to continue working with the rectified data.
The data was read in the saved mini-batches, converted to 32 bit float-ing point numbers and normalized by subtracting the mean and dividing bystandard deviation. A small value of 0.00001 was added to avoid division byzero.
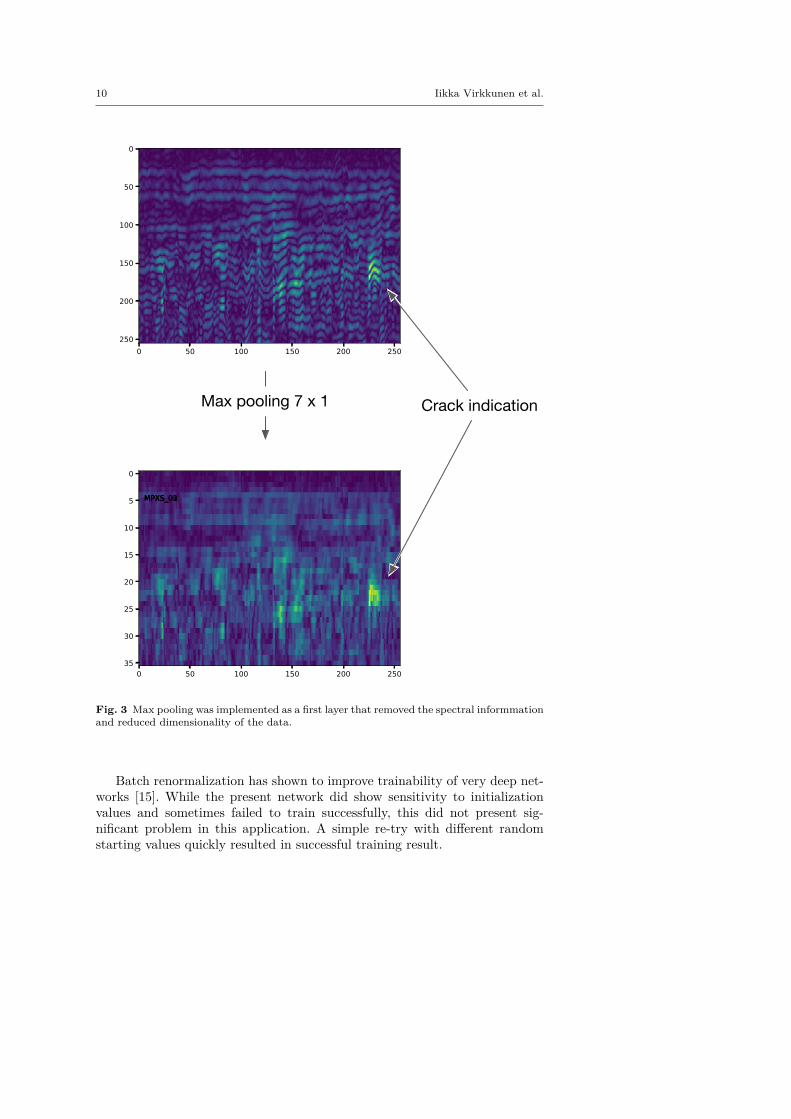
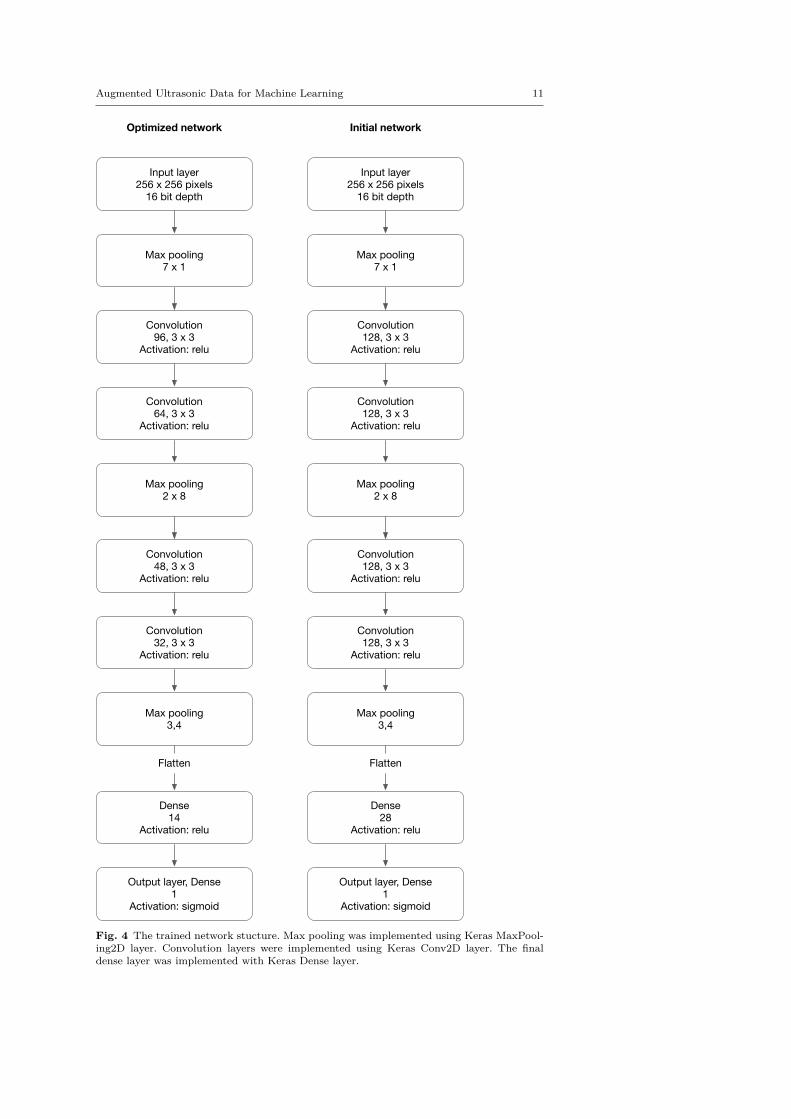
The size of the various layers were originally excessive, and as soon assuccessful training was obtained, the layer sizes were decreased step-by-step toobtain the most efficient network capable of learning to classify the data. Thefull architecture (both initial trial and final) is shown in Figure 4. The networkexperienced some sensitivity to initialization, and on repeated training, themodel sometimes failed to learn successfully.
The computation was implemented with Python 3 and the Keras library[10] using the TensorFlow back-end [1].
The chosen architecture does not make use of some of the recent featuresincluded in state of the art deep convolutional networks. The primary moti-vation for this was to keep the network as simple as possible while showinggood flaw detection capability. Some of the considered, but not included, MLarchitectural features are discussed in the following.
Drop-out [14] has been extensively used to prevent overfitting, and morerecently to estimate prediction confidence [39]. In the present study, the modeldid not show susceptibility to notable overfitting (see also discussion in section4). The likely reason for this is the high number of augmented images usedfor training. Consequently, drop-out was not included and instead the trainingwas stopped after sufficient performance was achieved. Training with smalleraugmented data-sets could show overfitting and, consequently, make use ofdrop-out. Furthermore, even in the absense of overfitting, the use of drop-out to estimate prediction accuracy is an interesting option especially in casewhere multiple flaw types are classified within one model.
10 Iikka Virkkunen et al.
Max pooling 7 x 1 Crack indication
Fig. 3 Max pooling was implemented as a first layer that removed the spectral informmationand reduced dimensionality of the data.
Batch renormalization has shown to improve trainability of very deep net-works [15]. While the present network did show sensitivity to initializationvalues and sometimes failed to train successfully, this did not present sig-nificant problem in this application. A simple re-try with different randomstarting values quickly resulted in successful training result.
Augmented Ultrasonic Data for Machine Learning 11
Input layer256 x 256 pixels
16 bit depth
Max pooling7 x 1
Convolution 96, 3 x 3
Activation: relu
Convolution 64, 3 x 3
Activation: relu
Max pooling2 x 8
Convolution 48, 3 x 3
Activation: relu
Convolution 32, 3 x 3
Activation: relu
Max pooling3,4
Dense14
Activation: relu
Output layer, Dense1
Activation: sigmoid
Flatten
Input layer256 x 256 pixels
16 bit depth
Max pooling7 x 1
Convolution 128, 3 x 3
Activation: relu
Convolution 128, 3 x 3
Activation: relu
Max pooling2 x 8
Convolution 128, 3 x 3
Activation: relu
Convolution 128, 3 x 3
Activation: relu
Max pooling3,4
Dense28
Activation: relu
Output layer, Dense1
Activation: sigmoid
Flatten
Optimized network Initial network
Fig. 4 The trained network stucture. Max pooling was implemented using Keras MaxPool-ing2D layer. Convolution layers were implemented using Keras Conv2D layer. The finaldense layer was implemented with Keras Dense layer.
12 Iikka Virkkunen et al.
Channel-wise training [9] has been used to ease training and to improvetraining results in image classification. In the present case, the interestingchannel-wise information would be amplitude information (as used in thepresent analysis) and frequency-related information, such as the wavelet de-composed features used, e.g., by Chen and Lee [7], Fei et al. [13]. However,in this case, it was of interest to use as-is the data that was used in previousresearch [35] to estimate human POD performance. As this data was rectified,most of the spectral data was lost and could not be used. Extracting spectralfeatures using wavelet decomposition as separate channels remains interestingoption for further study and may improve flaw detection.
2.4 Performance evaluation
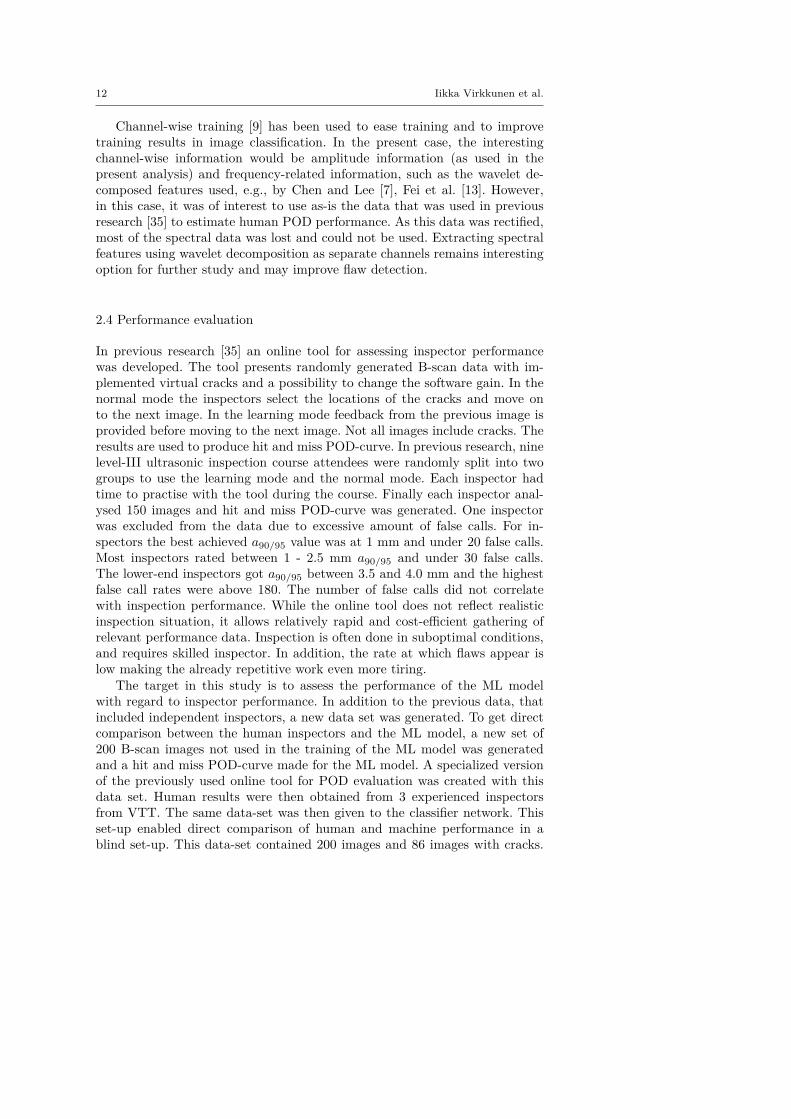
In previous research [35] an online tool for assessing inspector performancewas developed. The tool presents randomly generated B-scan data with im-plemented virtual cracks and a possibility to change the software gain. In thenormal mode the inspectors select the locations of the cracks and move onto the next image. In the learning mode feedback from the previous image isprovided before moving to the next image. Not all images include cracks. Theresults are used to produce hit and miss POD-curve. In previous research, ninelevel-III ultrasonic inspection course attendees were randomly split into twogroups to use the learning mode and the normal mode. Each inspector hadtime to practise with the tool during the course. Finally each inspector anal-ysed 150 images and hit and miss POD-curve was generated. One inspectorwas excluded from the data due to excessive amount of false calls. For in-spectors the best achieved a90/95 value was at 1 mm and under 20 false calls.Most inspectors rated between 1 - 2.5 mm a90/95 and under 30 false calls.The lower-end inspectors got a90/95 between 3.5 and 4.0 mm and the highestfalse call rates were above 180. The number of false calls did not correlatewith inspection performance. While the online tool does not reflect realisticinspection situation, it allows relatively rapid and cost-efficient gathering ofrelevant performance data. Inspection is often done in suboptimal conditions,and requires skilled inspector. In addition, the rate at which flaws appear islow making the already repetitive work even more tiring.
The target in this study is to assess the performance of the ML modelwith regard to inspector performance. In addition to the previous data, thatincluded independent inspectors, a new data set was generated. To get directcomparison between the human inspectors and the ML model, a new set of200 B-scan images not used in the training of the ML model was generatedand a hit and miss POD-curve made for the ML model. A specialized versionof the previously used online tool for POD evaluation was created with thisdata set. Human results were then obtained from 3 experienced inspectorsfrom VTT. The same data-set was then given to the classifier network. Thisset-up enabled direct comparison of human and machine performance in ablind set-up. This data-set contained 200 images and 86 images with cracks.
Augmented Ultrasonic Data for Machine Learning 13
Validation lossValidation accuracy
Valid
atio
n lo
ss/a
ccur
acy
0
0.2
0.4
0.6
0.8
1.0
Epoch0 10 20 30 40 50 60 70 80 90 100 110
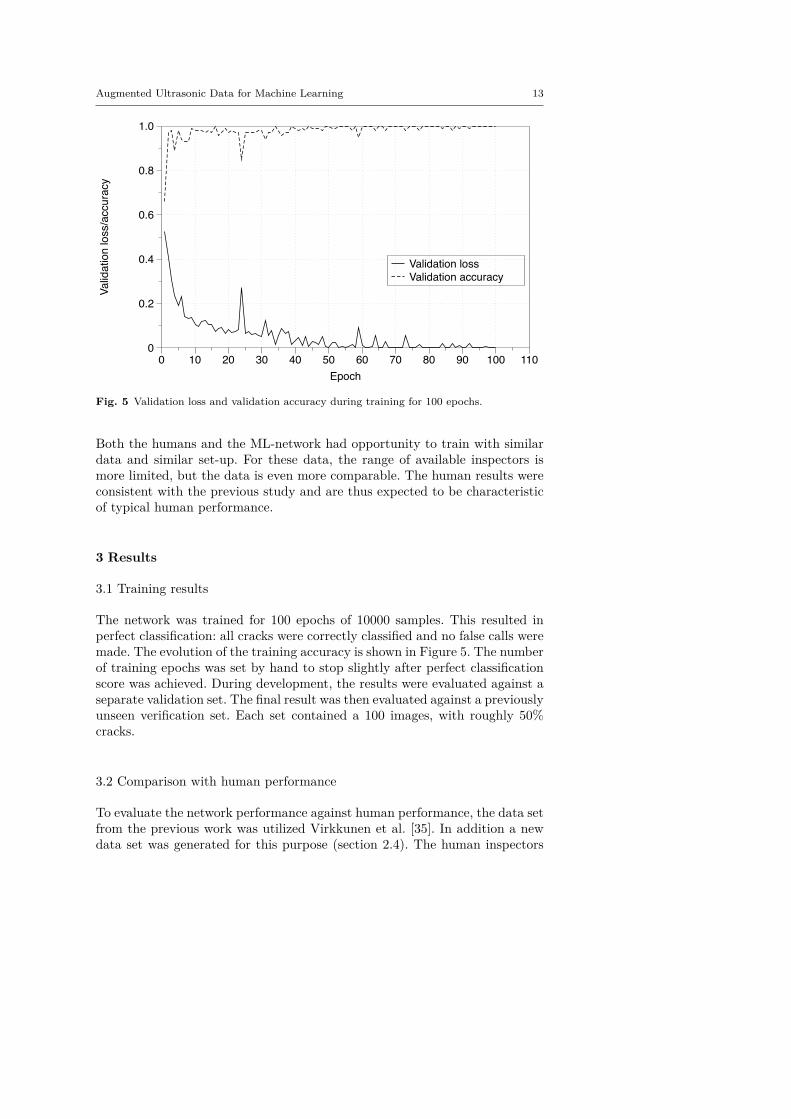
Fig. 5 Validation loss and validation accuracy during training for 100 epochs.
Both the humans and the ML-network had opportunity to train with similardata and similar set-up. For these data, the range of available inspectors ismore limited, but the data is even more comparable. The human results wereconsistent with the previous study and are thus expected to be characteristicof typical human performance.
3 Results
3.1 Training results
The network was trained for 100 epochs of 10000 samples. This resulted inperfect classification: all cracks were correctly classified and no false calls weremade. The evolution of the training accuracy is shown in Figure 5. The numberof training epochs was set by hand to stop slightly after perfect classificationscore was achieved. During development, the results were evaluated against aseparate validation set. The final result was then evaluated against a previouslyunseen verification set. Each set contained a 100 images, with roughly 50%cracks.
3.2 Comparison with human performance
To evaluate the network performance against human performance, the data setfrom the previous work was utilized Virkkunen et al. [35]. In addition a newdata set was generated for this purpose (section 2.4). The human inspectors
14 Iikka Virkkunen et al.
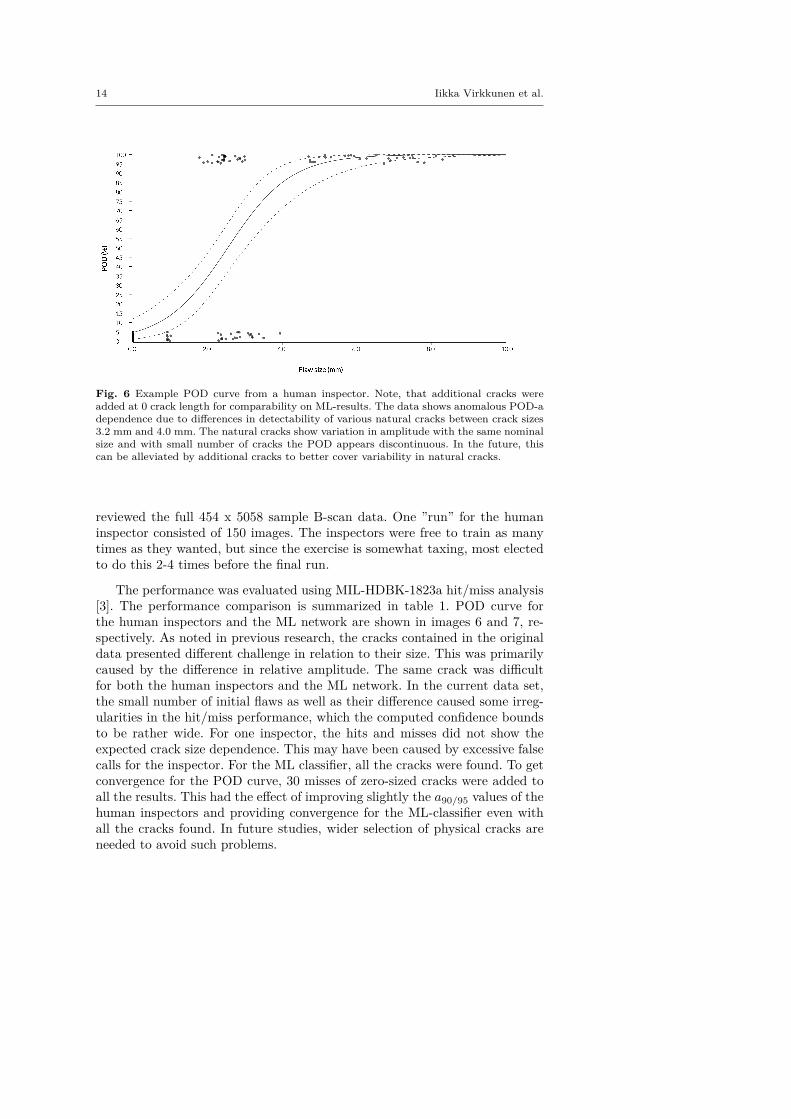
Fig. 6 Example POD curve from a human inspector. Note, that additional cracks wereadded at 0 crack length for comparability on ML-results. The data shows anomalous POD-adependence due to differences in detectability of various natural cracks between crack sizes3.2 mm and 4.0 mm. The natural cracks show variation in amplitude with the same nominalsize and with small number of cracks the POD appears discontinuous. In the future, thiscan be alleviated by additional cracks to better cover variability in natural cracks.
reviewed the full 454 x 5058 sample B-scan data. One ”run” for the humaninspector consisted of 150 images. The inspectors were free to train as manytimes as they wanted, but since the exercise is somewhat taxing, most electedto do this 2-4 times before the final run.
The performance was evaluated using MIL-HDBK-1823a hit/miss analysis[3]. The performance comparison is summarized in table 1. POD curve forthe human inspectors and the ML network are shown in images 6 and 7, re-spectively. As noted in previous research, the cracks contained in the originaldata presented different challenge in relation to their size. This was primarilycaused by the difference in relative amplitude. The same crack was difficultfor both the human inspectors and the ML network. In the current data set,the small number of initial flaws as well as their difference caused some irreg-ularities in the hit/miss performance, which the computed confidence boundsto be rather wide. For one inspector, the hits and misses did not show theexpected crack size dependence. This may have been caused by excessive falsecalls for the inspector. For the ML classifier, all the cracks were found. To getconvergence for the POD curve, 30 misses of zero-sized cracks were added toall the results. This had the effect of improving slightly the a90/95 values of thehuman inspectors and providing convergence for the ML-classifier even withall the cracks found. In future studies, wider selection of physical cracks areneeded to avoid such problems.
Augmented Ultrasonic Data for Machine Learning 15
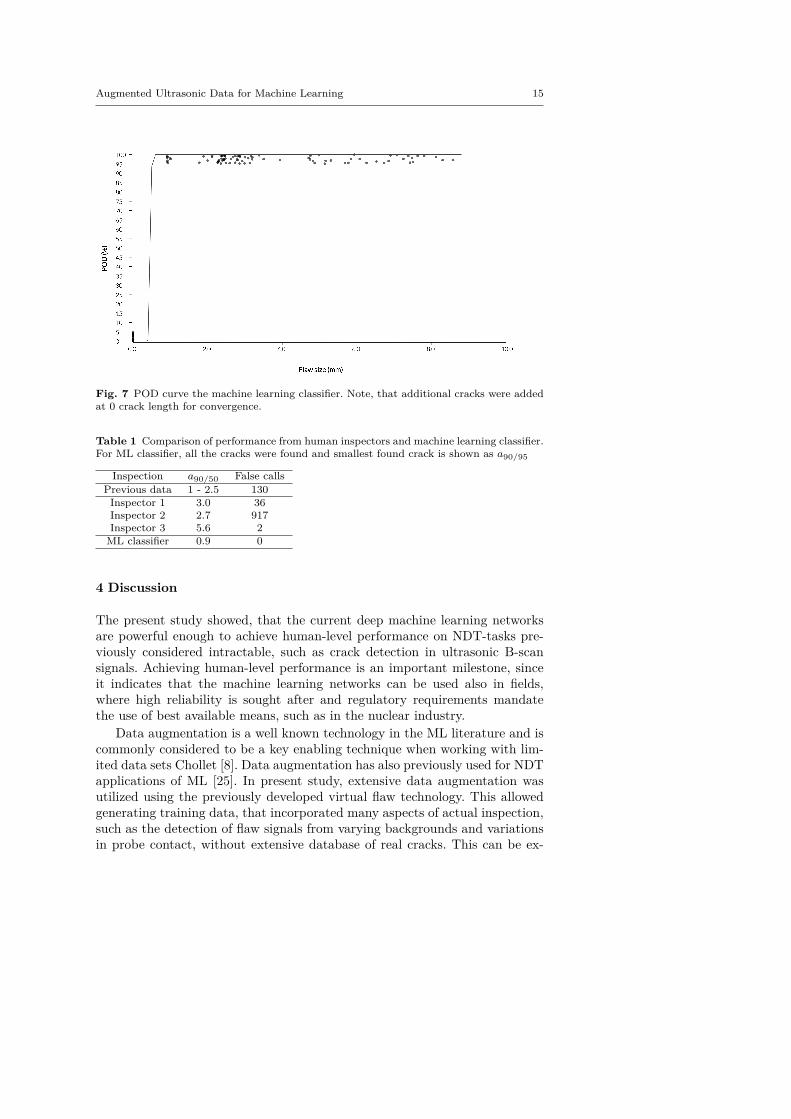
Fig. 7 POD curve the machine learning classifier. Note, that additional cracks were addedat 0 crack length for convergence.
Table 1 Comparison of performance from human inspectors and machine learning classifier.For ML classifier, all the cracks were found and smallest found crack is shown as a90/95
Inspection a90/50 False callsPrevious data 1 - 2.5 130
Inspector 1 3.0 36Inspector 2 2.7 917Inspector 3 5.6 2
ML classifier 0.9 0
4 Discussion
The present study showed, that the current deep machine learning networksare powerful enough to achieve human-level performance on NDT-tasks pre-viously considered intractable, such as crack detection in ultrasonic B-scansignals. Achieving human-level performance is an important milestone, sinceit indicates that the machine learning networks can be used also in fields,where high reliability is sought after and regulatory requirements mandatethe use of best available means, such as in the nuclear industry.
Data augmentation is a well known technology in the ML literature and iscommonly considered to be a key enabling technique when working with lim-ited data sets Chollet [8]. Data augmentation has also previously used for NDTapplications of ML [25]. In present study, extensive data augmentation wasutilized using the previously developed virtual flaw technology. This allowedgenerating training data, that incorporated many aspects of actual inspection,such as the detection of flaw signals from varying backgrounds and variationsin probe contact, without extensive database of real cracks. This can be ex-
16 Iikka Virkkunen et al.
pected to yield ML-models that generalize well to different real-world inspec-tion cases. In addition, the virtual flaw technology has been used in traininghuman inspectors, and expected to be used in nuclear qualifications in thenear future. The use and extensive validation of the virtual flaw technology inthe case of human inspectors gives high confidence that the augmented datasets are relevant also for ML applications.
The results from present study indicate, that such domain-specific andseparately validated data-augmentation techniques enabling technique for suc-cessfully applying machine learning in various NDE fields, where the data isscarce but performance requirements high.
In previous work, the ML-classification of ultrasonic signal is usually ap-plied at the single A-scan level. In contrast, our approach has been to train thenetwork on full scan of 454 A-scan lines. This approach necessarily limits theapplicability of the solution to mechanized or location-encoded inspections,where such coordinated combination of A-scans is available.
The present work has some significant limitations. The raw data containedonly three real cracks, that were then modified to give the total data set.This was similar for both the human inspectors and the machine learningsolution. The natural flaws exhibit significant variation and a set of three flawsis clearly insufficient to capture this variation and thus the model may overfitto the specific flaw types present in this study. For example, the ASTM PODstandard [5] requires 40 cracks, which is chiefly to to capture this variation.Thus the network trained here is not expected to work as-is for more generalcrack detection tasks. Instead, future research will extend the source datausing additional thermal fatigue cracks, simulated flaws and other interestingsignal types.
Due to the limited data there are several plausible ways for the model toexhibit ”Clever Hans” behaviours [19] and to learn something other than thedesired flaw detection. For example, an ML model might learn to memorizethe repeating background or to identify the specific repeated flaw patterns orfeatures of the augmentation. Similar behaviours are plausible for the humaninspectors. While we tried to minimize these behaviors in the current studyby model selection and augmentation, proper validation would require testingperformance on data completely separate from training and data augmenta-tion. This will be addressed in further studies. Accordingly, it is not claimedthat the POD curves presented in this study are descriptive of field inspec-tions; the POD curves show comparative performance between the trained MLand human performance, with the described limitations.
5 Conclusions
The following conclusions can be drawn from this study:
– Deep convolutional neural networks are powerful enough to reach human-level performance in detecting cracks from ultrasonic data
Augmented Ultrasonic Data for Machine Learning 17
– Data augmentation using virtual flaws is seen as key enabling technique totrain machine learning networks with limited flawed data
6 Data availability
The used python code as well as the training data set is made available fordownload at https://github.com/iikka-v/ML-NDT.
Acknowledgements The data augmentation using virtual flaws and the initial network &training was contributed by Trueflaw Ltd. Their contribution is gratefully acknowledged.
Conflict of interest
Virkkunen is associated with Truelfaw Ltd. that provided the virtual flawsused in this study. This is not seen to induce any conflict of interest to thisstudy.
References
1. Abadi M, Agarwal A, Barham P, Brevdo E, Chen Z, Citro C, Corrado GS,Davis A, Dean J, Devin M, Ghemawat S, Goodfellow I, Harp A, IrvingG, Isard M, Jia Y, Jozefowicz R, Kaiser L, Kudlur M, Levenberg J, ManéD, Monga R, Moore S, Murray D, Olah C, Schuster M, Shlens J, SteinerB, Sutskever I, Talwar K, Tucker P, Vanhoucke V, Vasudevan V, ViégasF, Vinyals O, Warden P, Wattenberg M, Wicke M, Yu Y, Zheng X (2015)TensorFlow: Large-scale machine learning on heterogeneous systems. URLhttps://www.tensorflow.org/, software available from tensorflow.org
2. Aldrin J, Achenbach J, Andrew G, P’an C, Grills B, Mullis R, Spencer F,Golis M (2001) Case study for the implementation of an automated ultra-sonic technique to detect fatigue cracks in aircraft weep holes. MaterialsEvaluation 59(11):1313–1319
3. Annis C (2009) Mil-hdbk-1823a, nondestructive eval-uation system reliability assessment. Tech. rep., URLhttp://www.statisticalengineering.com/mh1823/MIL-HDBK-1823A(2009).pdf
4. ASTM (2012) Standard practice for probability of detection analysis forhit/miss data. ASTM E2862-12, American Society for Testing and Mate-rials
5. ASTM (2015) Standard practice for probability of detection analysis forâ versus a data. ASTM E3023-15, American Society for Testing and Ma-terials
6. Bansal M, Krizhevsky A, Ogale AS (2018) Chauffeurnet: Learning to driveby imitating the best and synthesizing the worst. CoRR abs/1812.03079,URL http://arxiv.org/abs/1812.03079, 1812.03079
18 Iikka Virkkunen et al.
7. Chen CH, Lee GG (1993) Neural networks for ultrasonic nde signal classi-fication using time-frequency analysis. In: 1993 IEEE International Con-ference on Acoustics, Speech, and Signal Processing, vol 1, pp 493–496vol.1
8. Chollet F (2017) Deep Learning with Python, 1st edn. Manning Publica-tions Co., Greenwich, CT, USA
9. Chollet F (2017) Xception: Deep learning with depthwise sep-arable convolutions. 2017 IEEE Conference on Computer Visionand Pattern Recognition (CVPR) DOI 10.1109/cvpr.2017.195, URLhttp://dx.doi.org/10.1109/CVPR.2017.195
10. Chollet F, et al. (2015) Keras. https://keras.io11. Cruz FC, Simas Filho EF, Albuquerque MC, Silva IC, Farias
CT, Gouvea LL (2017) Efficient feature selection for neural net-work based detection of flaws in steel welded joints using ultra-sound testing. Ultrasonics 73:1–8, DOI 10.1016/j.ultras.2016.08.017, URLhttps://www.ncbi.nlm.nih.gov/pubmed/27592203
12. Dorafshan S, Thomas RJ, Maguire M (2018) Comparison of deep convolu-tional neural networks and edge detectors for image-based crack detectionin concrete. Construction and Building Materials 186:1031–1045, DOI10.1016/j.conbuildmat.2018.08.011
13. Fei C, Han Z, Dong J (2006) An ultrasonic flaw-classification sys-tem with wavelet-packet decomposition, a mutative scale chaotic ge-netic algorithm, and a support vector machine and its application topetroleum-transporting pipelines. Russian Journal of Nondestructive Test-ing 42(3):190–197, DOI 10.1134/s1061830906030077
14. Hinton GE, Srivastava N, Krizhevsky A, Sutskever I, Salakhutdinov R(2012) Improving neural networks by preventing co-adaptation of featuredetectors. CoRR abs/1207.0580, URL http://arxiv.org/abs/1207.0580,1207.0580
15. Ioffe S, Szegedy C (2015) Batch normalization: Accelerating deep networktraining by reducing internal covariate shift. CoRR abs/1502.03167, URLhttp://arxiv.org/abs/1502.03167, 1502.03167
16. Kahrobaee S, Haghighi MS, Akhlaghi IA (2018) Improving non-destructive characterization of dual phase steels using data fusion.Journal of Magnetism and Magnetic Materials 458:317–326, DOI10.1016/j.jmmm.2018.03.049
17. Koskinen T, Virkkunen I, Papula S, Sarikka T, Haapalainen J (2018) Pro-ducing a pod curve with emulated signal response data. Insight 60(1):42–48, DOI 10.1784/insi.2018.60.1.42
18. Krizhevsky A, Sutskever I, Hinton GEa (2017) Imagenet clas-sification with deep convolutional neural networks. Communi-cations of the ACM 60(6):84–90, DOI 10.1145/3065386, URLhttps://dx.doi.org/10.1145/3065386
19. Lapuschkin S, Wäldchen S, Binder A, Montavon G, Samek W, Müller KR(2019) Unmasking clever hans predictors and assessing what machinesreally learn. Nature Communications 10:1096, DOI 10.1038/s41467-019-
Augmented Ultrasonic Data for Machine Learning 19
08987-4, URL https://doi.org/10.1038/s41467-019-08987-420. Liu S, Huang JH, Sung J, Lee C (2002) Detection of cracks using neu-
ral network and computational mechanics. Computer methods in appliedmechanics and engineering 191:2831 – 2845
21. Marcus G (2018) Deep learning: A critical appraisal. CoRRabs/1801.00631, URL http://arxiv.org/abs/1801.00631, 1801.00631
22. Masnata A, Sunser M (1996) Neural network classification of flaws de-tected by ultrasonic means. NDT & E International 29(2):87–93
23. Meng M, Chua YJ, Wouterson E, Ong CPK (2017) Ultrasonic sig-nal classification and imaging system for composite materials via deepconvolutional neural networks. Neurocomputing 257:128–135, DOI10.1016/j.neucom.2016.11.066
24. Munir N, Kim HJ, Park J, Song SJ, Kang SS (2018) Convolu-tional neural network for ultrasonic weldment flaw classification innoisy conditions. Ultrasonics DOI 10.1016/j.ultras.2018.12.001, URLhttps://doi.org/10.1016/j.ultras.2018.12.001
25. Munir N, Kim HJ, Song SJ, Kang SS (2018) Investigation of deep neu-ral network with drop out for ultrasonic flaw classification in weldments.Journal of Mechanical Science and Technology 32(7):3073–3080, DOI10.1007/s12206-018-0610-1
26. Sambath S, Nagaraj P, Selvakumar N (2010) Automatic defect classifica-tion in ultrasonic NDT using artificial intelligence. Journal of Nondestruc-tive Evaluation 30(1):20–28, DOI 10.1007/s10921-010-0086-0
27. Shipway NJ, Barden TJ, Huthwaite P, Lowe MJS (2019) Automated defectdetection for fluorescent penetrant inspection using random forest. NDT& E International 101:113–123, DOI 10.1016/j.ndteint.2018.10.008
28. Silva LC, Simas Filho EF, Albuquerque MC, Silva IC, Farias CT (2020)Segmented analysis of time-of-flight diffraction ultrasound for flaw detec-tion in welded steel plates using extreme learning machines. Ultrason-ics 102:106057, DOI https://doi.org/10.1016/j.ultras.2019.106057, URLhttp://www.sciencedirect.com/science/article/pii/S0041624X19307164
29. Svahn PH, Virkkunen I, Zettervall T, Snögren D (2018) The use of virtualflaws to increase flexibility of qualification. In: 12th European Conferenceon Non-Destructive Testing (ECNDT 2018), NDT.net, no. 8 in The e-Journal of Nondestructive Testing
30. Tong Z, Gao J, Zhang H (2018) Innovative method for recognizing sub-grade defects based on a convolutional neural network. Construction andBuilding Materials 169:69–82, DOI 10.1016/j.conbuildmat.2018.02.081
31. Udpa L, Ramuhalli P (2009) Steam generator management program: Au-tomated analysis of array probe eddy current data. Tech. Rep. 1018559,EPRI, Palo Alto, CA
32. Virkkunen I, Ylitalo M (2016) Practical experiences in pod determinationfor airframe et inspection. International Symposium on NDT in Aerospace; Conference date: 03-11-2016 Through 05-11-2016
33. Virkkunen I, Miettinen K, Packalén T (2014) Virtual flaws for nde train-ing and qualification. In: 11th European Conference on Non-Destructive
20 Iikka Virkkunen et al.
Testing (ECNDT 2014)34. Virkkunen I, Rönneteg U, Grybäck T, Emilsson G, Miettinen K (2016)
Feasibility study of using eflaws on qualification of nuclear spent fuel dis-posal canister inspection. URL http://www.12thnde.com, internationalConference on Non Destructive Evaluation in Relation to Structural In-tegrity for Nuclear and Pressurized Components ; Conference date: 04-10-2016 Through 06-10-2016
35. Virkkunen I, Haapalainen J, Papula S, Sarikka T, Kotamies J,Hänninen H (2017) Effect of feedback and variation on inspec-tion reliability. In: 7th European-American Workshop on Reliabil-ity of NDE, German Society for Non-Destructive Testing, URLhttps://www.ndt.net/article/reliability2017/papers/12.pdf
36. Yi W, Yun Is (1998) The defect detection and non-destructive evalua-tion in weld zone of austenitic stainless steel 304 using neural network-ultrasonic wave. KSMME Enternational Journal 12(6):1150 – 1161
37. Zeiler MD (2012) Adadelta: An adaptive learning rate method. 1212.570138. Zhang X, Zou J, He K, Sun J (2016) Accelerating very deep convo-
lutional networks for classification and detection. IEEE Transactionson Pattern Analysis and Machine Intelligence 38(10):1943–1955, DOI10.1109/TPAMI.2015.2502579
39. Zhu P, Cheng Y, Banerjee P, Tamburrino A, Deng Y (2019) A novelmachine learning model for eddy current testing with uncertainty. NDT& E International 101:104–112, DOI 10.1016/j.ndteint.2018.09.010