virginia tech research center arlington, virginia, usa nuclear saifur rahm… · · 2014-12-1780...
TRANSCRIPT

Energy Security and the Role of Nuclear Power
!"#$%&$'"(')(*"+,"--.#(/0"+102-#3(
44(5-6-78-.9(:;4<(530=09(/0"+102-#3(
(>.')?(@0,)&.(A0370"(
#.0370"BC%?-2&((D,.+,",0(E-63(F(G2C0"6-2(A-#-0.63(!"#$%&%-(
(HHH?#0,)&..0370"?'.+((
2 HHH?#0,)&..0370"?'.+(
Virginia Tech Research Center Arlington, Virginia, USA
2
PPT slides will be available at
Energy Security
3
Source of fuel and electricity either from domestic or reliable foreign sources to sustain the country’s
economic growth over the long term.
Issues
Resource Manpower
Infrastructure Economics
Foreign Policy 12/10/14 4 ©Saifur Rahman 2014

Geopolitics
12/10/14 5 ©Saifur Rahman 2014
12/10/14 6 ©Saifur Rahman 2014
I(;;; <(;;; J(;;; K(;;; EL3
:(;;;
A shift in emerging economies
!"#$%##&$'()$#*#+,)-+-,.$-%$#/#)0-%0$#+(%(/-#1$&)-2#1$3$456$-%+)#31#$-%$7()*&7-&#$&#/3%&8$7-,"$9"-%3$:$;%&-3$3++(<%=%0$'()$(2#)$"3*'$('$,"#$0*(>3*$0)(7,"$
!"#$%&'($'&)&*+,(*(+-'%&$&,#./$0'123241256'
M4(;;; ; 4(;;;
N0O0"
*&.'O-0"(P",'"
P",%-2(@%0%-#
Q3,"0
EL3
Q'01 R0# S&61-0. A-"-H081-#
!"2,0
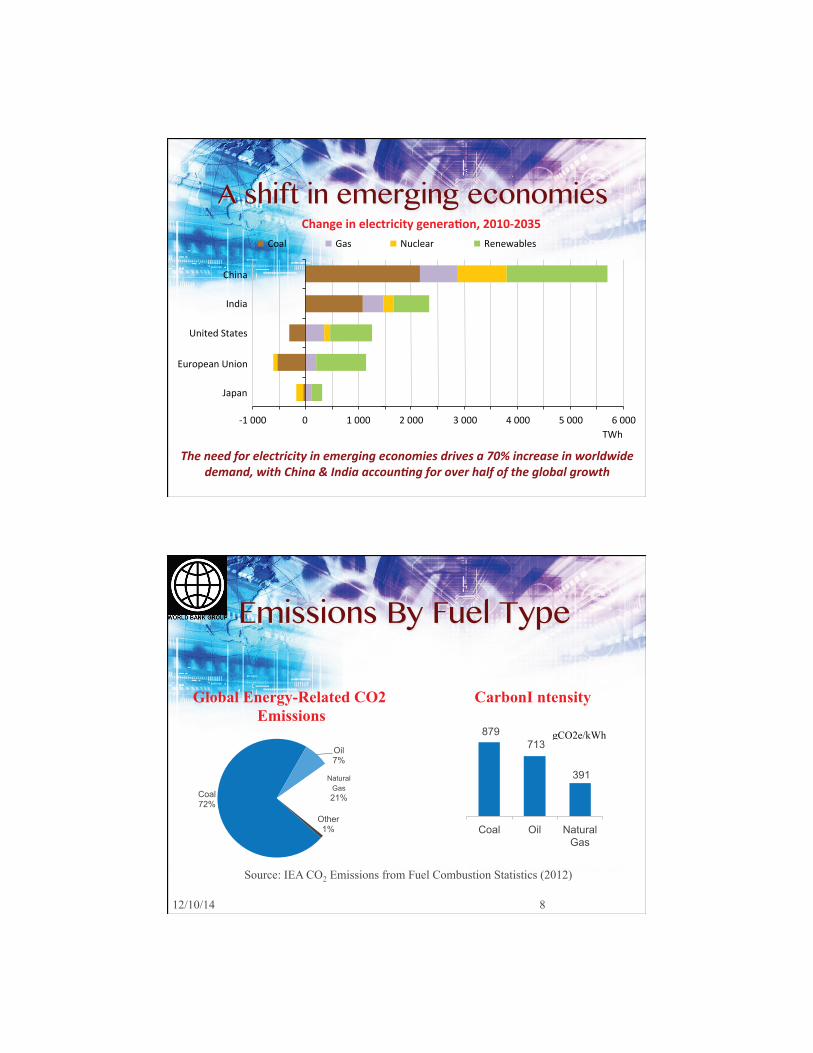
Emissions By Fuel Type
Global Energy-Related CO2 Emissions
Carbon I ntensity
12/10/14 8 Sustainable Energy Department
Coal 72%
Oil 7%
Natural Gas 21%
Other 1%
879 713
391
Coal Oil Natural Gas
gCO2e/kWh
Source: IEA CO2 Emissions from Fuel Combustion Statistics (2012)
Sources of Electricity
Oil Coal
Natural gas Hydro
Non-hydro renewables Nuclear
Cross-border power transfer
12/10/14 9 ©Saifur Rahman 2014
12/10/14 10 ©Saifur Rahman
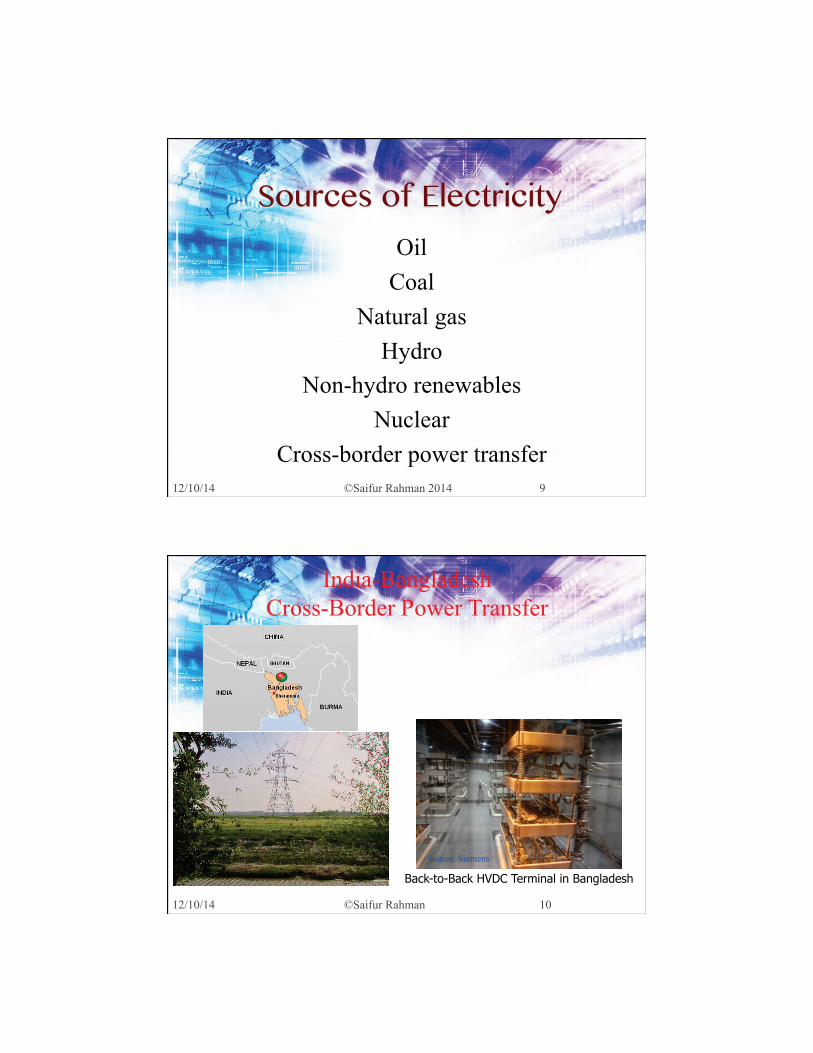
Back-to-Back HVDC Terminal in Bangladesh
India-Bangladesh Cross-Border Power Transfer
Source: Siemens
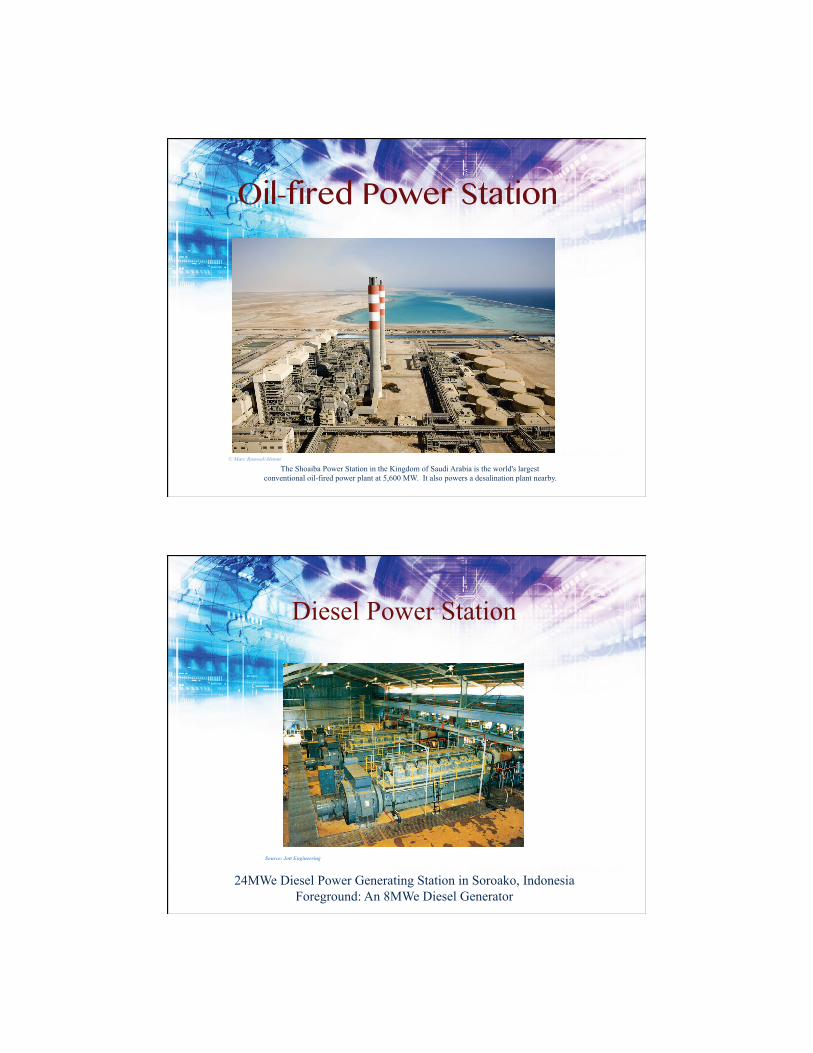
Oil-fired Power Station
The Shoaiba Power Station in the Kingdom of Saudi Arabia is the world's largest conventional oil-fired power plant at 5,600 MW. It also powers a desalination plant nearby.
© Marc Roussel/Alstom
Diesel Power Station
24MWe Diesel Power Generating Station in Soroako, Indonesia Foreground: An 8MWe Diesel Generator
Source: Jott Engineering
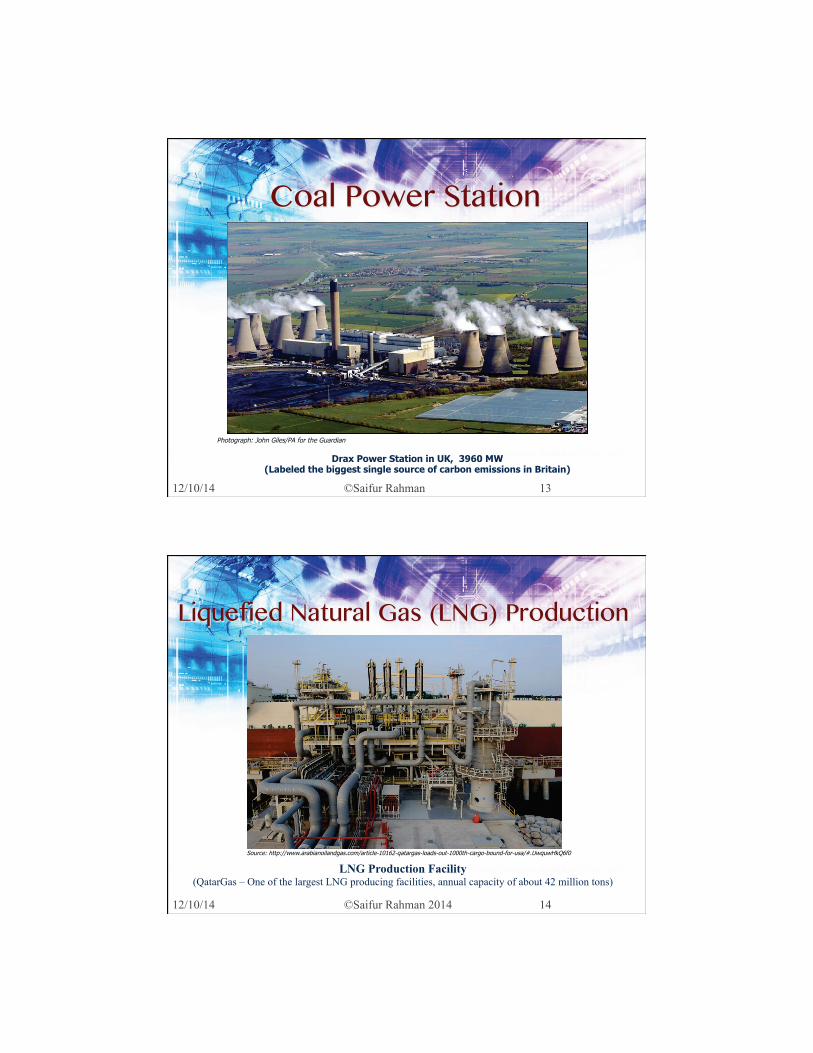
Coal Power Station
12/10/14 13 ©Saifur Rahman
Drax Power Station in UK, 3960 MW (Labeled the biggest single source of carbon emissions in Britain)
Photograph: John Giles/PA for the Guardian
Liquefied Natural Gas (LNG) Production
12/10/14 14 ©Saifur Rahman 2014
Source: http://www.arabianoilandgas.com/article-10162-qatargas-loads-out-1000th-cargo-bound-for-usa/#.UwquwHkQ6f0
LNG Production Facility (QatarGas – One of the largest LNG producing facilities, annual capacity of about 42 million tons)

LNG Transport
12/10/14 15 ©Saifur Rahman 2014
Source: http://www.marineinsight.com
LNG Tanker LNG is transported in large cryogenic vessels on a tanker
(Energy Frontier, Japan – DWT 73795 tons)
LNG Import Terminal
12/10/14 16 ©Saifur Rahman 2014
Onshore LNG Terminal (Tokyo’s Largest LNG Terminal at Sodegaura, Chiba)
LNG comes from three sources Offshore LNG Terminal
(The Adriatic LNG Terminal off the coast of Venice, Italy )

TSR(A-+0#,U60$'"(
12/10/14 17 ©Saifur Rahman 2014
Photo by Brian Haux - SkyHawk Photography
The Marsh Landing natural gas-fired power plant in California consisting of four units generating a total of 720MWe
Natural Gas Fired Power Plant

Hydroelectricity
Three Gorges Dam on the Yangtze River, China
700 MW x 22 = 15,400 MW
Non-Hydro Renewables
12/10/14 20 ©Saifur Rahman 2014
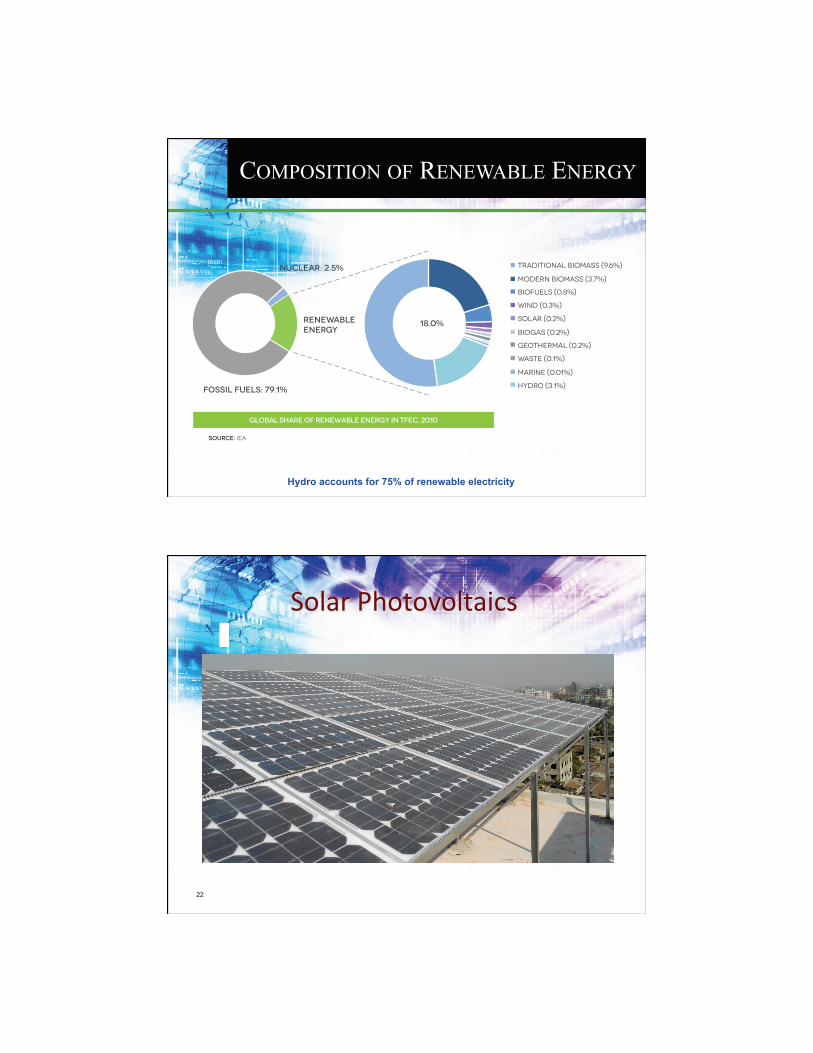
Hydro accounts for 75% of renewable electricity
traditional biomass (9.6%)
modern biomass (3.7%)
biofuels (0.8%)
wind (0.3%)
solar (0.2%)
biogas (0.2%)
geothermal (0.2%)
waste (0.1%)
marine (0.01%)
hydro (3.1%)
18.0%renewableenergy
fossil fuels: 79.1%
nuclear: 2.5%
Global Share of Renewable Energy in TFEC, 2010
SOURCE: IEA
COMPOSITION OF RENEWABLE ENERGY
22
@'10.(>3'%'C'1%0,6#((
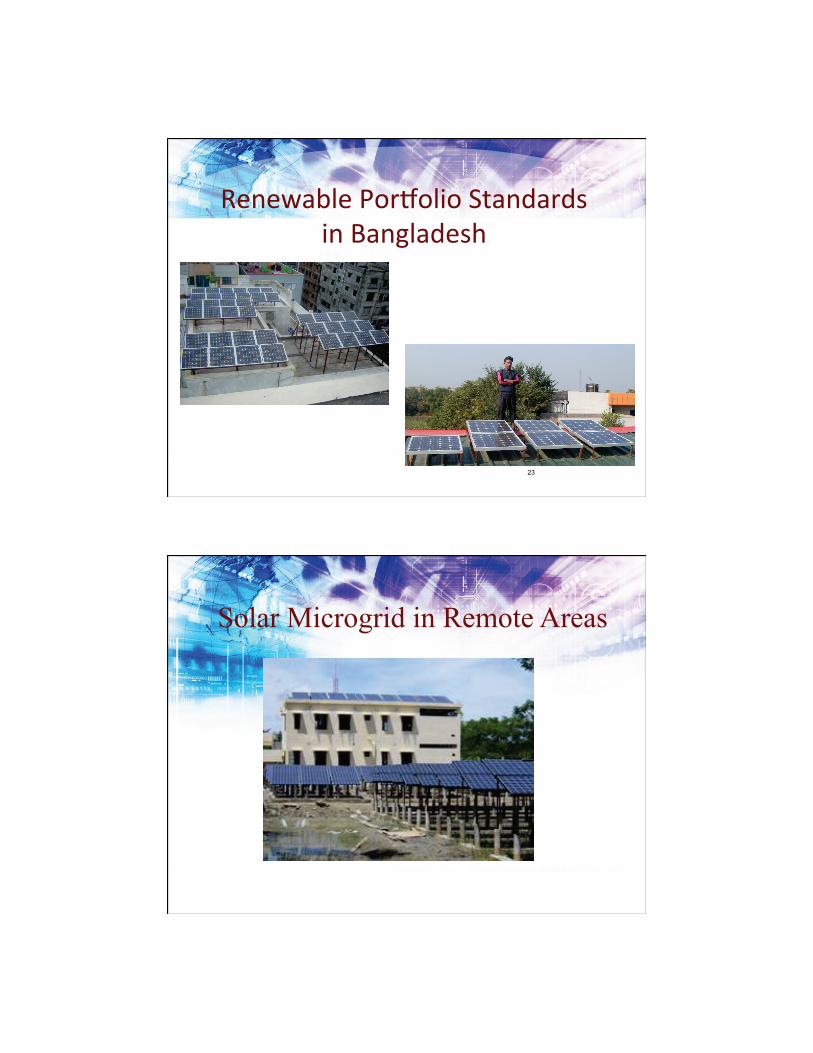
23
A-"-H081-(>'.V'1,'(@%0"20.2#(((,"(/0"+102-#3(
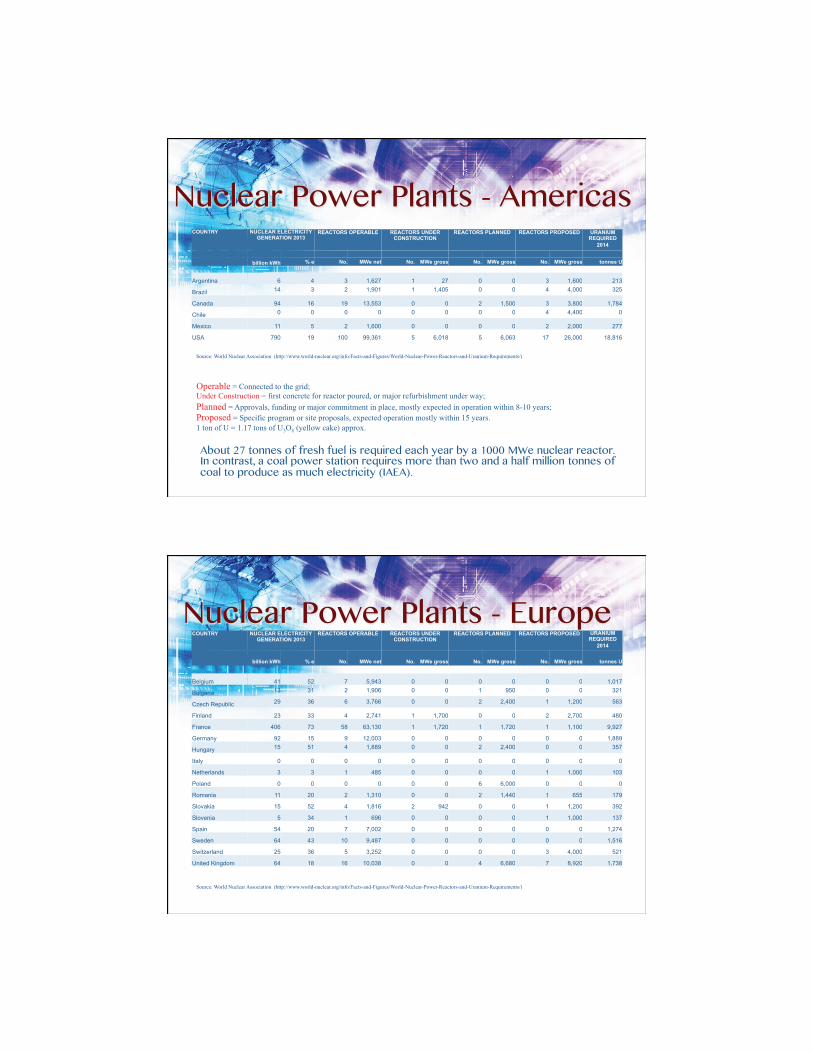
Solar Microgrid in Remote Areas

25
L,"2(*"-.+W(
Zafarana Wind Farm in Egypt
Nuclear Power Plant
E3-(S,"-(X,1-(>',"%("&61-0.(O'H-.(#%0$'"(6'"#,#$"+((')(%H'(&",%#(+-"-.0$"+(%'%01(')(4YY;XL-(
Photograph courtesy Constellation Energy
Nuclear Power Plants - Americas COUNTRY NUCLEAR ELECTRICITY
GENERATION 2013 REACTORS OPERABLE REACTORS UNDER
CONSTRUCTION REACTORS PLANNED REACTORS PROPOSED URANIUM
REQUIRED 2014
billion kWh % e No. MWe net No. MWe gross No. MWe gross No. MWe gross tonnes U
Argentina 6 4 3 1,627 1 27 0 0 3 1,600 213
Brazil 14 3 2 1,901 1 1,405 0 0 4 4,000 325
Canada 94 16 19 13,553 0 0 2 1,500 3 3,800 1,784
Chile 0 0 0 0 0 0 0 0 4 4,400 0
Mexico 11 5 2 1,600 0 0 0 0 2 2,000 277
USA 790 19 100 99,361 5 6,018 5 6,063 17 26,000 18,816
Source: World Nuclear Association (http://www.world-nuclear.org/info/Facts-and-Figures/World-Nuclear-Power-Reactors-and-Uranium-Requirements/)
Operable = Connected to the grid; Under Construction = first concrete for reactor poured, or major refurbishment under way; Planned = Approvals, funding or major commitment in place, mostly expected in operation within 8-10 years; Proposed = Specific program or site proposals, expected operation mostly within 15 years. 1 ton of U = 1.17 tons of U3O8 (yellow cake) approx.
About 27 tonnes of fresh fuel is required each year by a 1000 MWe nuclear reactor. In contrast, a coal power station requires more than two and a half million tonnes of coal to produce as much electricity (IAEA).
Nuclear Power Plants - Europe COUNTRY NUCLEAR ELECTRICITY
GENERATION 2013 REACTORS OPERABLE REACTORS UNDER
CONSTRUCTION REACTORS PLANNED REACTORS PROPOSED URANIUM
REQUIRED 2014
billion kWh % e No. MWe net No. MWe gross No. MWe gross No. MWe gross tonnes U
Belgium 41 52 7 5,943 0 0 0 0 0 0 1,017
Bulgaria 13 31 2 1,906 0 0 1 950 0 0 321
Czech Republic 29 36 6 3,766 0 0 2 2,400 1 1,200 563
Finland 23 33 4 2,741 1 1,700 0 0 2 2,700 480
France 406 73 58 63,130 1 1,720 1 1,720 1 1,100 9,927
Germany 92 15 9 12,003 0 0 0 0 0 0 1,889
Hungary 15 51 4 1,889 0 0 2 2,400 0 0 357
Italy 0 0 0 0 0 0 0 0 0 0 0
Netherlands 3 3 1 485 0 0 0 0 1 1,000 103
Poland 0 0 0 0 0 0 6 6,000 0 0 0
Romania 11 20 2 1,310 0 0 2 1,440 1 655 179
Slovakia 15 52 4 1,816 2 942 0 0 1 1,200 392
Slovenia 5 34 1 696 0 0 0 0 1 1,000 137
Spain 54 20 7 7,002 0 0 0 0 0 0 1,274
Sweden 64 43 10 9,487 0 0 0 0 0 0 1,516
Switzerland 25 36 5 3,252 0 0 0 0 3 4,000 521
United Kingdom 64 18 16 10,038 0 0 4 6,680 7 8,920 1,738
Source: World Nuclear Association (http://www.world-nuclear.org/info/Facts-and-Figures/World-Nuclear-Power-Reactors-and-Uranium-Requirements/)

Nuclear Power Plants Middle East & Africa
COUNTRY NUCLEAR ELECTRICITY GENERATION 2013
REACTORS OPERABLE REACTORS UNDER CONSTRUCTION
REACTORS PLANNED REACTORS PROPOSED URANIUM REQUIRED
2014 billion kWh % e No. MWe net No. MWe gross No. MWe gross No. MWe gross tonnes U
Egypt 0 0 0 0 0 0 1 1,000 1 1,000 0
Iran 4 2 1 915 0 0 1 1,000 1 300 174
Israel 0 0 0 0 0 0 0 0 1 1,200 0
Jordan 0 0 0 0 0 0 1 1,000 0
Saudi Arabia 0 0 0 0 0 0 0 0 16 17,000 0
South Africa 14 6 2 1,830 0 0 0 0 6 9,600 305
Turkey 0 0 0 0 0 0 4 4,800 4 4,500 0
UAE 0 0 0 0 3 4,200 1 1,400 10 14,400 0
Source: World Nuclear Association (http://www.world-nuclear.org/info/Facts-and-Figures/World-Nuclear-Power-Reactors-and-Uranium-Requirements/)
Nuclear Power Plants Central Asia
COUNTRY NUCLEAR ELECTRICITY GENERATION 2013
REACTORS OPERABLE REACTORS UNDER CONSTRUCTION
REACTORS PLANNED REACTORS PROPOSED URANIUM REQUIRED
2014
billion kWh % e No. MWe net No. MWe gross No. MWe gross No. MWe gross tonnes U
Armenia 2 29 1 376 0 0 1 1,060 87
Belarus 0 0 0 0 2 2,400 0 0 2 2,400 0
Kazakhstan 0 0 0 0 0 0 2 600 2 600 0
Lithuania 0 0 0 0 0 0 1 1,350 0 0 0
Russia 162 18 33 24,253 10 9,068 31 32,780 18 16,000 5,456
Ukraine 78 44 15 13,168 0 0 2 1,900 11 12,000 2,359
Source: World Nuclear Association (http://www.world-nuclear.org/info/Facts-and-Figures/World-Nuclear-Power-Reactors-and-Uranium-Requirements/)

Nuclear Power Plants - Asia COUNTRY NUCLEAR ELECTRICITY
GENERATION 2013 REACTORS OPERABLE REACTORS UNDER
CONSTRUCTION REACTORS PLANNED REACTORS PROPOSED URANIUM
REQUIRED 2014
billion kWh % e No. MWe net No. MWe gross No. MWe gross No. MWe gross tonnes U
Bangladesh 0 0 0 0 0 0 2 2,000 0 0 0
China 105 2 21 18,075 27 29,548 60 66,220 120 124,000 6,296
India 30 3 21 5,302 6 4,300 22 21,300 35 40,000 913
Indonesia 0 0 0 0 0 0 1 30 4 4,000 0
Japan 14 2 48 42,569 3 3,036 9 12,947 3 4,145 2,119
Korea DPR (North) 0 0 0 0 0 0 0 0 1 950 0
Korea RO (South) 133 28 23 20,656 5 6,870 6 8,730 0 0 5,022
Malaysia 0 0 0 0 0 0 0 0 2 2,000 0
Pakistan 4 4 3 725 2 680 0 0 2 2,000 99
Thailand 0 0 0 0 0 0 0 0 5 5,000 0
Vietnam 0 0 0 0 0 0 4 4,000 6 6,700 0
Source: World Nuclear Association (http://www.world-nuclear.org/info/Facts-and-Figures/World-Nuclear-Power-Reactors-and-Uranium-Requirements/)
Nuclear Fuel is a Big Issue
12/10/14 32 ©Saifur Rahman 2014
Source: http://web.ead.anl.gov/uranium/guide/prodhand/sld001.cfm
Nuclear Power Issues
Monitoring and Control (BAERA) Trained Manpower – Regulatory and Operation
Operational Safety Fuel Security
Spent Fuel Nuclear Accidents
12/10/14 33 ©Saifur Rahman 2014
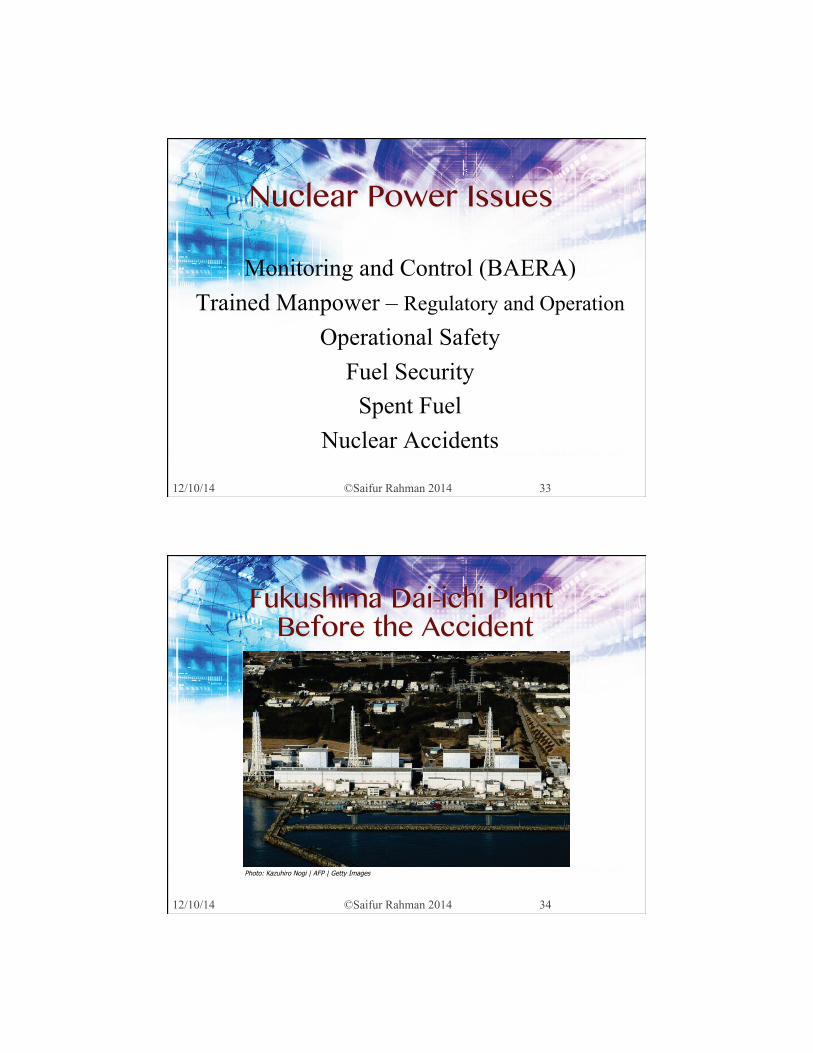
Fukushima Dai-ichi Plant Before the Accident
12/10/14 34 ©Saifur Rahman 2014
Photo: Kazuhiro Nogi | AFP | Getty Images
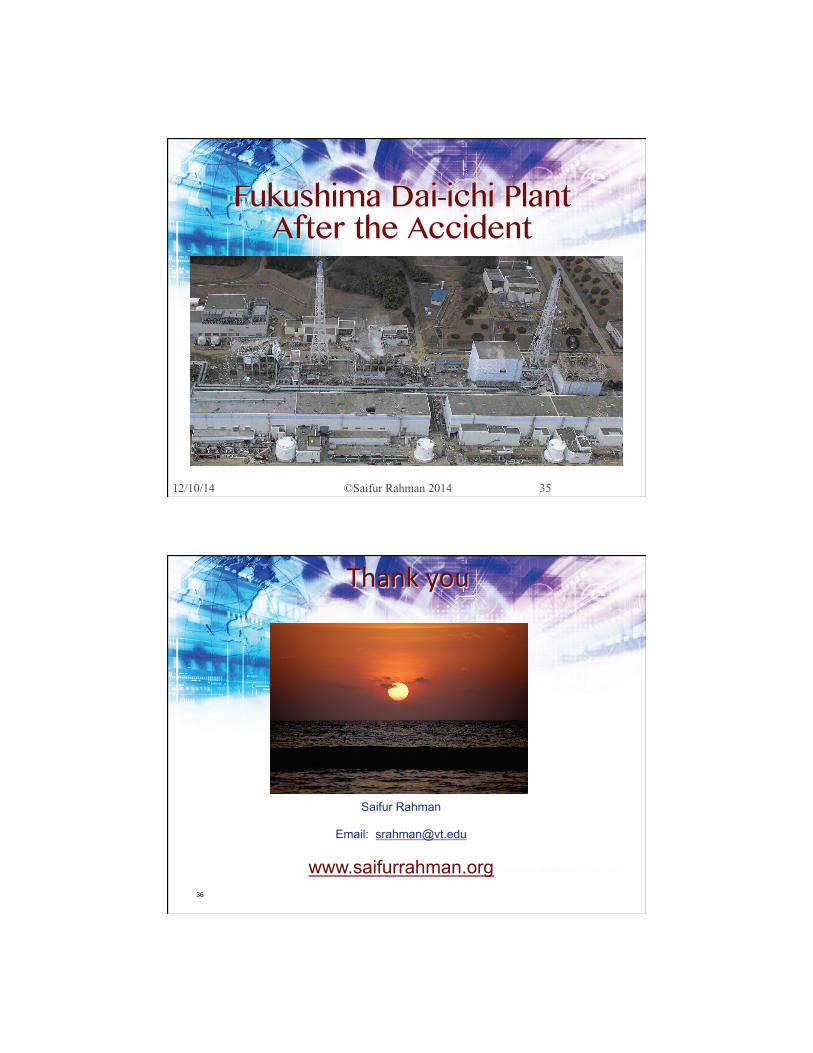
Fukushima Dai-ichi Plant After the Accident
12/10/14 35 ©Saifur Rahman 2014
36
E30"=(W'&
Saifur Rahman
Email: [email protected]
www.saifurrahman.org