virginia conservation lands needs assessment virginia
TRANSCRIPT
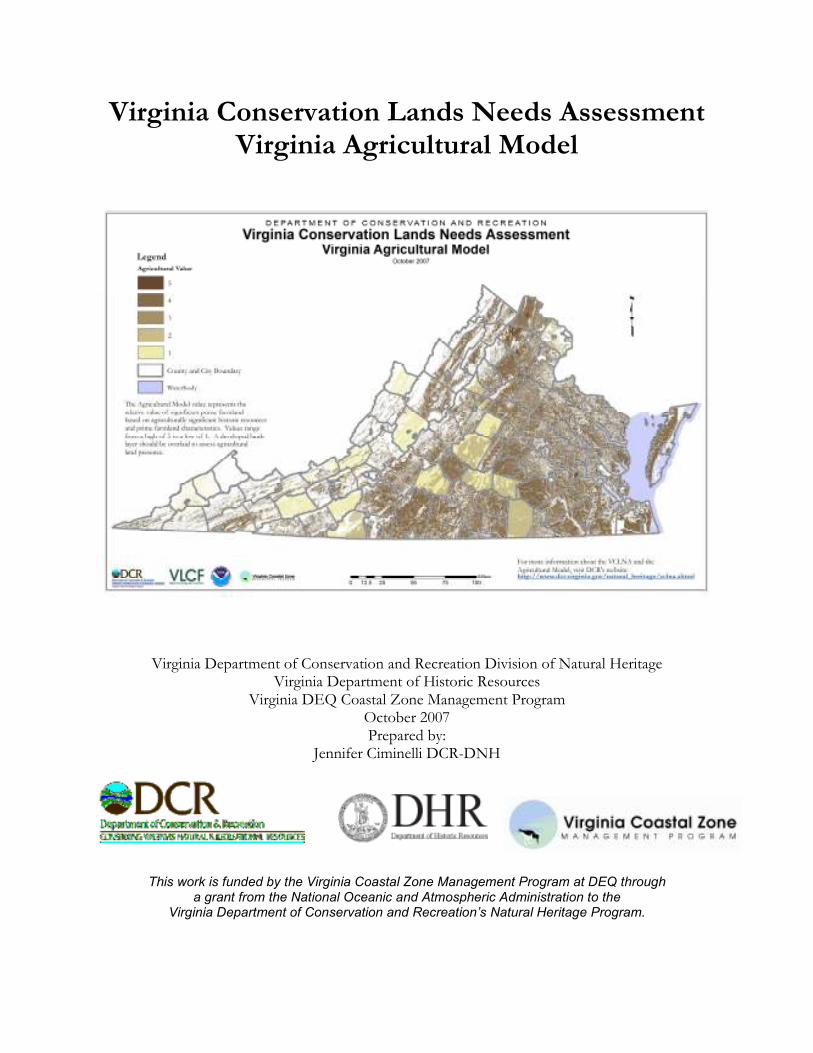
Virginia Conservation Lands Needs Assessment Virginia Agricultural Model
Virginia Department of Conservation and Recreation Division of Natural Heritage Virginia Department of Historic Resources
Virginia DEQ Coastal Zone Management Program October 2007 Prepared by:
Jennifer Ciminelli DCR-DNH
This work is funded by the Virginia Coastal Zone Management Program at DEQ through a grant from the National Oceanic and Atmospheric Administration to the
Virginia Department of Conservation and Recreation’s Natural Heritage Program.
i
TABLE OF CONTENTS
INTRODUCTION .......................................................................................................................................... 1
Application of the Agricultural Model....................................................................................................... 1 METHODOLOGY ......................................................................................................................................... 3
Prime Farmland............................................................................................................................................. 3 Slope ............................................................................................................................................................ 3 Suitable Land Cover..................................................................................................................................... 3 Soils ............................................................................................................................................................. 3 Final Soils Layer.......................................................................................................................................... 3
Culturally Significant Agricultural Resources ........................................................................................... 4 Final Agricultural Overlay ........................................................................................................................... 4 Model Validation .......................................................................................................................................... 4
RESULTS........................................................................................................................................................... 4 DISCUSSION ................................................................................................................................................... 5
Constraints..................................................................................................................................................... 5 Application..................................................................................................................................................... 5
FUTURE APPLICATIONS........................................................................................................................... 5 REFERENCES................................................................................................................................................. 6 Figure 1. Agricultural Model Methodology Overview................................................................................ 7 Figure 2. PDC 1 LENOWISCO Planning District Commission Agricultural Model........................... 8 Figure 3. PDC 2 Cumberland Plateau Agricultural Model. ....................................................................... 9 Figure 4. PDC 3 Mount Rogers Planning District Commission Agricultural Model. ......................... 10 Figure 5. PDC 4 New River Valley Planning District Commission Agricultural Model..................... 11 Figure 6. PDC 5 Roanoke Valley-Alleghany Regional Commission Agricultural Model.................... 12 Figure 7. PDC 6 Central Shenandoah Planning District Commission Agricultural Model. ............... 13 Figure 8. PDC 7 Northern Shenandoah Valley Regional Commission Agricultural Model............... 14 Figure 9. Northern Virginia Regional Commission Agricultural Model................................................ 15 Figure 10. PDC 9 Rappahannock-Rapidan Regional Commission Agricultural Model...................... 16 Figure 11. PDC 10 Thomas Jefferson Planning District Commission Agricultural Model................ 17 Figure 12. PDC 11 Region 2000 Local Government Council Planning District Commission. ......... 18 Figure 13. PDC 12 West Piedmont Planning District Commission Agricultural Model. ................... 19 Figure 14. PDC 13 Southside Planning District Commission Agricultural Model. ............................. 20 Figure 15. PDC 14 Commonwealth Regional Council Agricultural Model. ......................................... 21 Figure 16. PDC 15 Richmond Regional Planning District Commission Agricultural Model. ........... 22 Figure 17. PDC 16 George Washington Regional Commission Agricultural Model. ......................... 23 Figure 18. PDC 17 Northern Neck Planning District Commission Agricultural Model. ................... 24 Figure 19. PDC 18 Middle Peninsula Planning District Commission Agricultural Model. ................ 25 Figure 20. PDC 19 Crater Planning District Commission....................................................................... 26 Figure 21. PDC 22 Accomack-Northampton Planning District Commission. .................................... 27 Figure 22. PDC 23 Hampton Roads Planning District Commission Agricultural Model. ................. 28 Figure 23. Coastal Zone Agricultural Model.............................................................................................. 29 Figure 24. Statewide Agricultural Model..................................................................................................... 30
1
INTRODUCTION
The Virginia Agricultural Model was developed in an effort to map important agricultural areas in Virginia based on suitable lands, prime farmland soils and historic farm resources. As development pressure continues across the state, remaining resources are being irretrievably lost to development.
Agricultural resources contribute to the economy and to a sustainable way of life. Conserving important agricultural resources and prime farmland is imperative as the threat of exurbanization increases. Exurbanization is the development or movement of people into areas of “cropland within one hundred miles of central cities” (Nelson 1999). This area is considered to be remote enough to provide rural character, yet remains close to urban centers and markets. As population density increases in these areas, residential conversion pressures increase (Lynch 2002).
The potential loss of agriculture to the economy may not be immediately recognizable as prime farmland is considered a merit good and these goods are “potential economic benefit not recognized presently by lands markets because those benefits will accrue only to future generations” (Nelson 1999). The loss of agricultural land translates into the loss of these future benefits (i.e. air quality, scenery, open space, agricultural product exports).
There are a variety of factors and relationships which contribute to agricultural land conversion pressure which this paper does not review in detail. These relationships are complicated, but there are ways to manage developmental pressure and agricultural preservation (Nelson 1992, Nelson 1999). The first step in the process is to understand where agriculturally important lands exist. The development of a GIS model to delineate where agriculturally valuable lands exist serves as a guide to local government, consultants, and developers. The model also serves as part of a larger green infrastructure plan, which aims to model where Virginia’s conservation priorities are located to facilitate an integrated approach to planning and development. For information on the Virginia Conservation Lands Needs Assessment and the Green Infrastructure Modeling effort, please visit the VCLNA website at http://www.dcr.virginia.gov/natural_heritage/vclna.shtml.
The development of a GIS model to delineate where agriculturally valuable lands exist may serve as a guide to local government, consultants, and developers as to the location of these areas in Virginia. The model also serves as part of a larger green infrastructure plan, which aims to model where Virginia’s conservation priorities are located to facilitate an integrated approach to planning and development. For information on the Virginia Conservation Lands Needs Assessment and the Green Infrastructure Modeling effort, please visit the VCLNA website at http://www.dcr.virginia.gov/natural_heritage/vclna.shtml.
The Virginia Department of Conservation and Recreation Division of Natural Heritage (DCR –DNH) developed the Virginia Agricultural Model based on the Chesapeake Bay Programs Resource Lands Assessment, the NRCS prime farmland designation criteria, and Farm and Ranch Lands Protection Program (http://www.nrcs.usda.gov/programs/farmbill/2002/pdf/FRPPKyPt.pdf).
DCR – DNH collaborated with the Virginia Department of Historic Resources (http://www.dhr.virginia.gov) in an effort to promote the mission of DHR which is “to foster, encourage, and support the stewardship of Virginia’s significant historic, architectural, archaeological, and cultural resources”. DHR was used as the expert source for model parameter weighting and as the data sources. For information, or to request archaeological or architectural data, please contact the Virginia Department of Historic Resources.
Application of the Agricultural Model
Some general categories of uses to which the agricultural model can be applied include:
• Targeting – to identify targets for protection activities
• Prioritizing – to provide primary or additional justification for key conservation land purchases and other protection activities.
• Local planning – guidance for comprehensive planning and local ordinance and zoning development.
• Assessment – to review proposed projects for potential impacts to historically rich farms or important potential farmland areas.

2
• Land Management – to guide property owners and public and private land managers in making land management decisions that enhance farmland values
• Public Education – to inform the citizenry about the agricultural value of their community, helping retain the unique sense of place associated with these communities.
3
METHODOLOGY The agricultural value of land was determined by a combination of natural resource and cultural data. The natural resource criteria included soil information, slope, and land use. The cultural criteria included the presence of an historic farm site as determined by the Virginia Department of Historic Resources.
Prime Farmland
Slope
The National Resource Conservation Service (NRCS) Statewide Important Farmland slope criteria for Virginia were used to suitable slope area for potential prime farmland soil in Virginia. National Elevation Dataset (NED) was used to generate slope and areas that exceeded 15 percent slope in the Coastal Plain or 25 percent slope in the remainder of the state were excluded (NRCS 2004). Suitable Land Cover
Suitable land cover for prime farmland was selected from the 2000 Regional Earth Science Applications Center (University of Maryland RESAC) land cover. Unsuitable land classes were defined (based on Chesapeake Bay Programs Resource Lands Assessment) as:
CLASS CODE Open water 1 Developed 3, 4, 5 Transportation 8 All urban classes 10, 11, 12, and 15 Extractive 17 Emergent Wetland 37
Soils
NRCS STATSGO and SSURGO soil data (http://www.ncgc.nrcs.usda.gov/) were used to determine prime farmland. SSURGO soils data is not available statewide, so STATSGO data was used to supplement the SSURGO coverage.
STATSGO
Compiled tabular and spatial STATSGO data from the Soil Data Mart (http://soildatamart.nrcs.usda.gov/USDGSM.aspx) for Virginia. Summarized percent component for each unique polygon in STATSGO and converted the percent value to a proportion. The percent component is a STATSGO attribute which indicates the percentage of the component in that particular polygon. Joined the tabular data to the spatial data and created a floating point grid based on the proportion of prime farmland in the polygon. The proportion value ranges from 0.01 to 0.87. These values represent a probability of finding prime farmland at a geographic location (based on the STATSGO percent component information for prime farmland within a STATSGO polygon).
Unsuitable lands were masked from the STATSGO grid based on suitable land use definitions and slope values based on prime farmland designation criteria (see above). The final STATSGO grid was clipped by missing SSURGO area county boundaries.
For more information on STATSGO, refer to the STATSGO user information located at http://www.nrcs.usda.gov/technical/techtools/statsgo_db.pdf.
SSURGO
Compiled tabular and spatial SSURGO data from the Soil Data Mart (http://soildatamart.nrcs.usda.gov/) for Virginia (where available). Selected out prime farmland designated soil polygons and created a prime farmland grid coverage. Final Soils Layer
The clipped STATSGO data was merged to the existing SSURGO data to create a final statewide prime farmland coverage. The grid value represents the probability of finding prime farmland at the designated cell location.
4
Culturally Significant Agricultural Resources
Cultural Resource Consideration was evaluated as part of the Agricultural Model using the Virginia Department of Historic Resources (DHR) historic farms data.
DHR exported historic farms data from the archaeological and architectural databases and submitted the data to DNH. Data were buffered at 30 meters then converted to an historic archaeological farm grid and an historic architectural farm grid. Each grid was set with values equal to 1 to indicate the probability of finding an historic farm entity (since the historic farm is present, all cultural resources got a value of 1).
Final Agricultural Overlay
The final prime farmland grid and final historic farm grids were overlaid with the weighted overlay function in ArcGIS to create the final agricultural model. The prime farmland grid was weighted at 80%, the historic archaeological farms were weighted at 10% and the historic architectural farms were weighted at 10%. The final grid values were symbolized using 5 Equal Interval classes:
RANGE
0.8015686 – 1
0.6031372 – 0.8015686
0.4047058 – 0.6031372
0.2062745 – 0.4047058
0.0078431 – 0.2062745
Model Validation
The Agricultural Model was quality controlled / assured throughout data compilation with a visual assessment process. The USGS 3.75 minute quarter quadrangle was overlaid on top of the grid and original input data feature classes. The USGS grids were systematically assessed in ArcMap to visually check for the absence of data in the recreation grids in relation to presence of an original polygon in the original input feature classes. The final summed grid was validated the same way. Data were overlaid on the VBMP 2002 imagery to assess land use issues and model constraints (detailed in the Discussion section).
The final model was submitted to DCR DNH for an internal review, as well as externally to the Virginia Tech Cooperative Extension, Virginia Department of Agriculture and Consumer Services (VDACS) and the National Resources Conservation Service (NRCS – USDA).
RESULTS
The final agricultural grid values were recoded to represent ranks ranging from a high of 5 to a low of 1. Values (which represent the value from the weighted overlay of probability values) were coded as:
RANGE RANK
0.8015686 – 1 5
0.6031372 – 0.8015686 4
0.4047058 – 0.6031372 3
0.2062745 – 0.4047058 2
0.0078431 – 0.2062745 1
Maps were produced for the State, Coastal Zone and the Planning District Commissions (PDC) and are included as part of this report. The report is available via FTP and on CD by request and includes:
• Maps showing:
5
o Agricultural value of land o Individual PDC maps
• Metadata
• Personal geodatabase and shapefiles of the Agricultural Model
• Personal geodatabase and shapefile of the prime farmland layer (derived from STATSGO and SSURGO)
The data is also available for viewing on the Division of Conservation and Recreation Division of Natural Heritage Land Conservation Data Explorer accessible at www.vaconservedlands.org.
DISCUSSION
Constraints
Development of a statewide model constrains the model to statewide available datasets. Assessing agricultural lands for conservation or green infrastructure planning should include the use of a development or parcel layer at the local scale in addition to the Agriculture Model. This model uses 2000 RESAC data to identify urban / built up areas. The RESAC, in addition to being dated, is also 30 meter resolution. Additional land use information should be used to assess where existing farmland is on the ground as new subdivisions and development are introduced into the landscape daily.
Historic Farm data was used as an additional data input to help identify conservation priorities. The DHR archaeological and architectural database includes spatial information for resources regardless of historic register status. The reason for this is that some sites have not yet been assessed for register status. Another reason for this is that if a site is considered to be culturally significant by the Department of Historic Resources, it is included in the model as an historic, and therefore, significant feature. DHR maintains register and easement information. This information can be used to weight specific historic features (i.e. listed in the National Register of Historic Places).
Application
The Agricultural Model may serve as a guide to state and local government, consultants, and developers as to the location of important agricultural resources. The model can be used alone or integrated with other datasets, such as the DNH Conservation Lands database, the VCLNA Vulnerability Model (growth prediction model) or Ecological Model, to identify which resources are most valuable to conservation prioritization or most at risk to growth pressures.
The model may also be used to help guide local land use planners in the development of their comprehensive plans. It is important to look at the landscape as a whole and assess how growth may impact the agricultural resources and where to focus acquisition efforts.
The VCLNA models serve as part of a larger green infrastructure plan, which aims to model where Virginia’s conservation priorities are located to facilitate an integrated approach to planning and development. For information on the Virginia Conservation Lands Needs Assessment and the Green Infrastructure Modeling effort, please visit the VCLNA website at http://www.dcr.virginia.gov/natural_heritage/vclna.shtml
FUTURE APPLICATIONS
Additional Data Incorporation
Additional datasets can be readily added to the final Agricultural Model to fine tune and refine analyses. Such datasets may include agricultural economic information, bordering land use information and market analysis.
6
REFERENCES Chesapeake Bay Program. 2004. Resource Lands Assessment Prime Farmland Model. < http://www.chesapeakebay.net/rla.htm>. Accessed September 2007. Lynch, L. and J. Carpenter. 2002. Does the farm sector have a critical mass? The University of Maryland, College Park, MD. <http://www.arec.umd.edu/Publications/Papers/Working-Papers-PDF-files/02-14.pdf>. Accessed September 2007. Natural Resources Conservation Service (NRCS). 2004. Statewide Important Farmlands in Virginia. Natural Resources Conservation Service (NRCS). 2004. <http://www.nrcs.usda.gov/programs/farmbill/2002/pdf/FRPPKyPt.pdf>. Accessed September 2007. Nelson, A. C. 1992. Preserving Prime Farmland in the Face of Urbanization: Lessons from Oregon. Journal of the American Planning Association 58(4): 467 – 488. Nelson, A. C. 1997. The exurban battleground. In Contested Landscape edited by Mark Lapping and Owen Furuseth. London: Avebury.

7
Figure 1. Agricultural Model Methodology Overview.
8
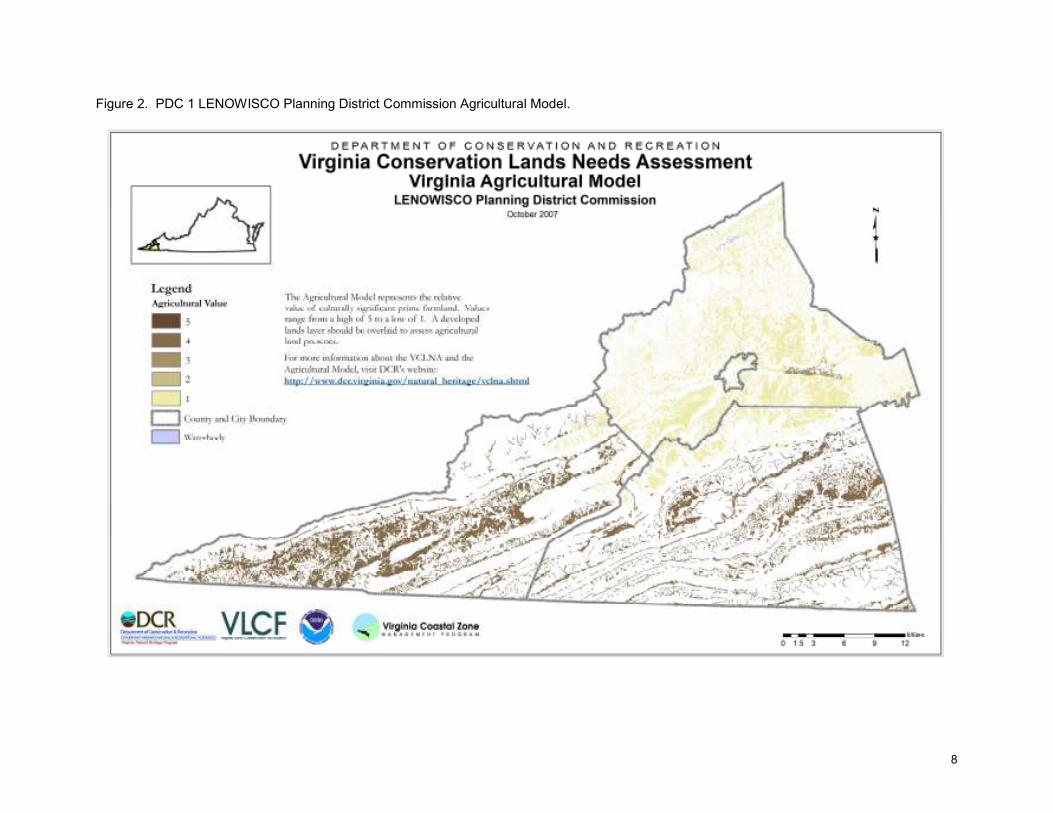
Figure 2. PDC 1 LENOWISCO Planning District Commission Agricultural Model.
9
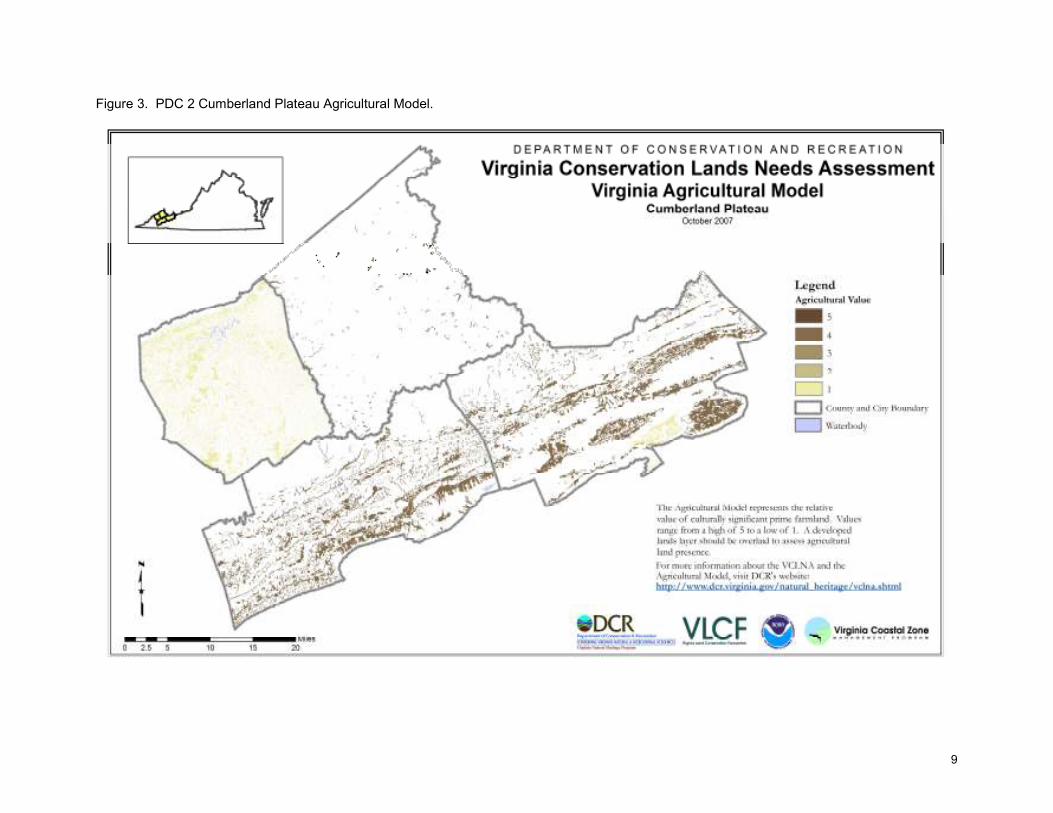
Figure 3. PDC 2 Cumberland Plateau Agricultural Model.
10
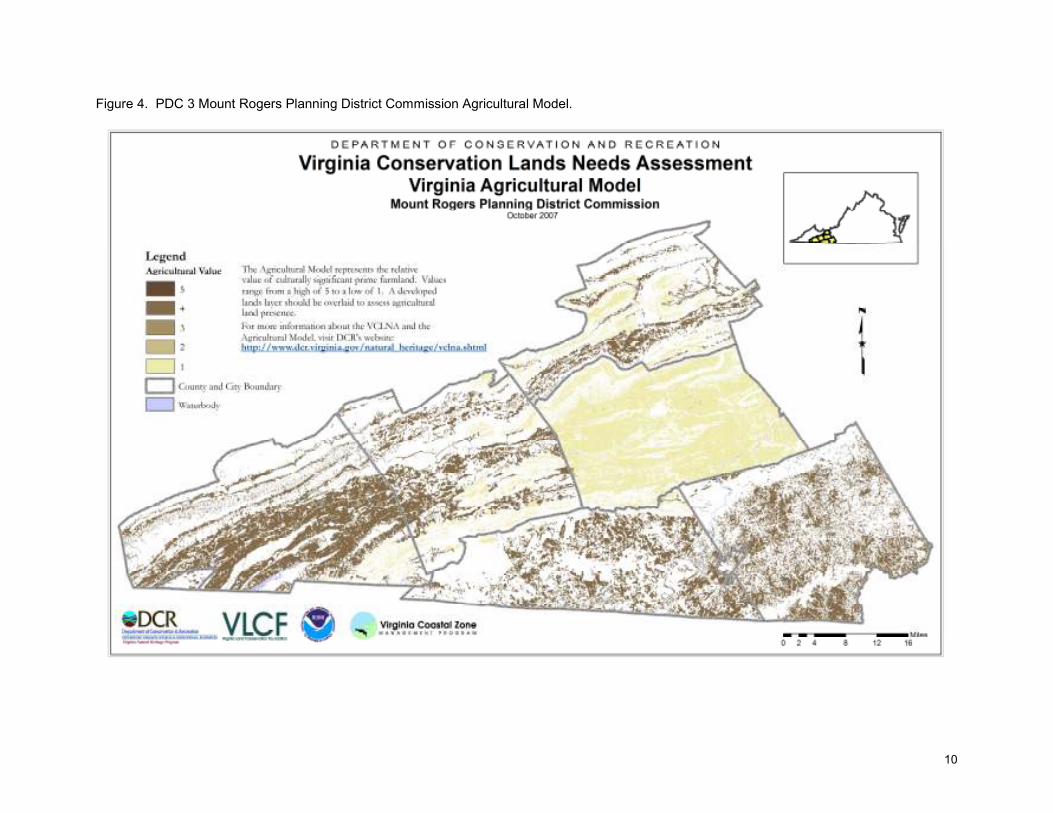
Figure 4. PDC 3 Mount Rogers Planning District Commission Agricultural Model.
11
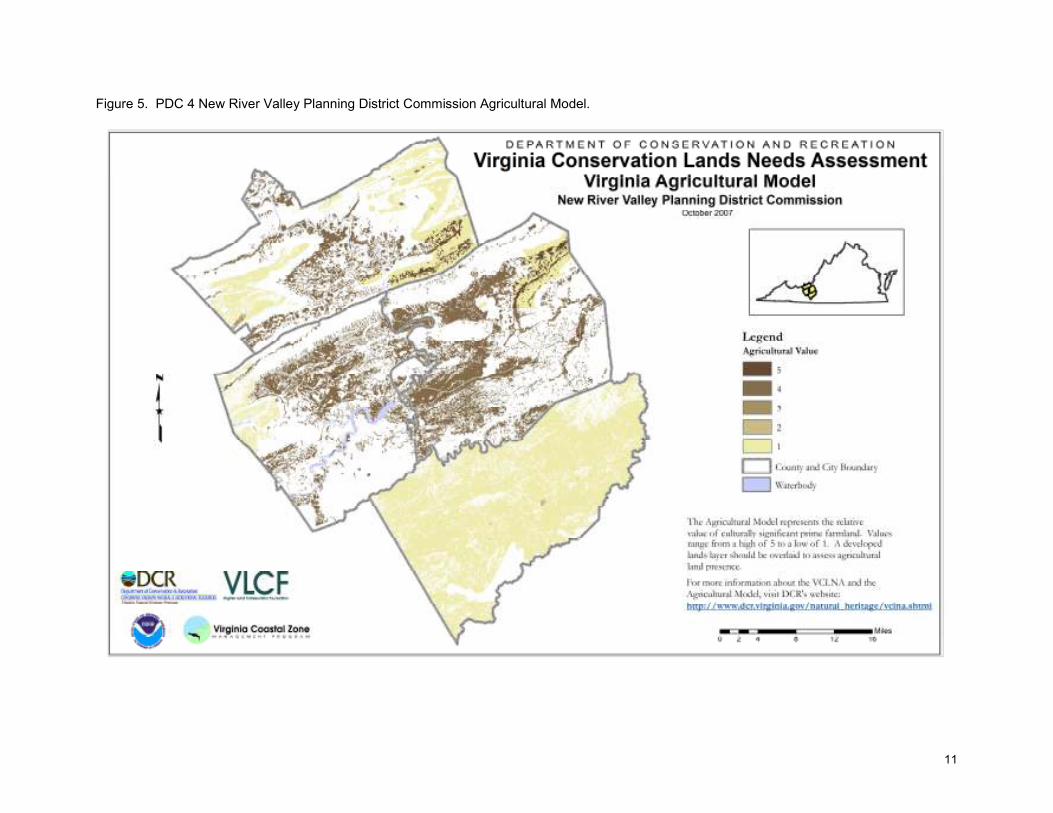
Figure 5. PDC 4 New River Valley Planning District Commission Agricultural Model.
12
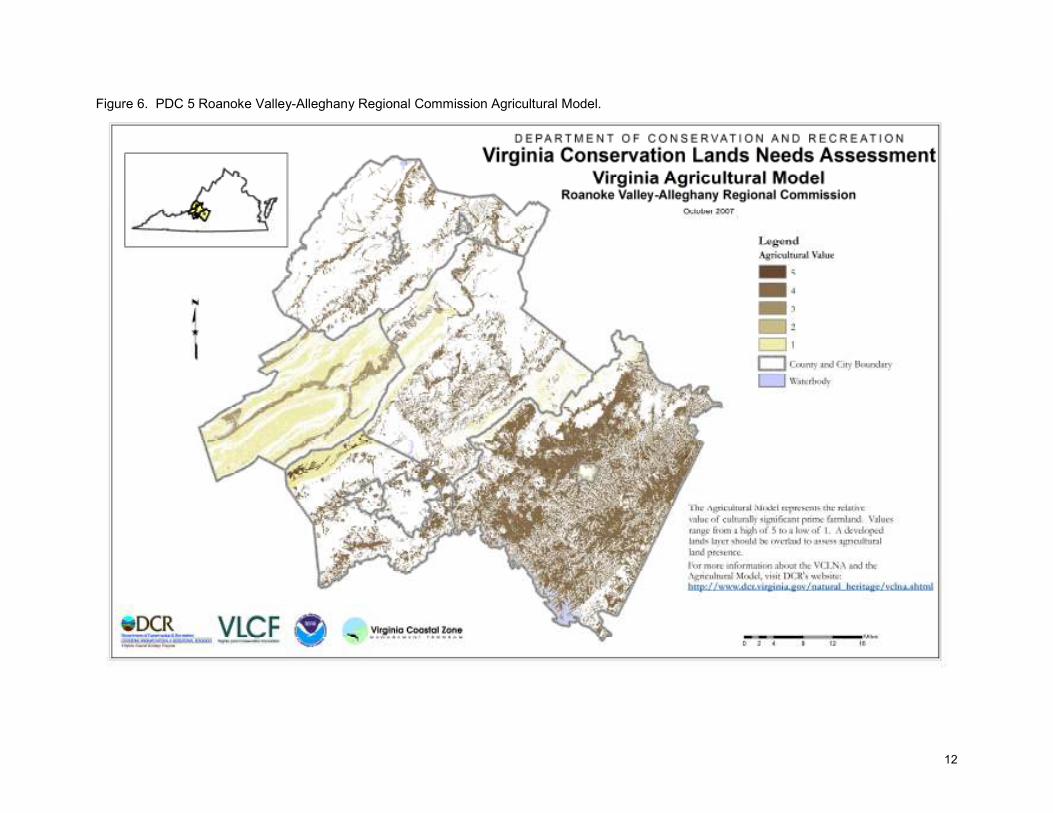
Figure 6. PDC 5 Roanoke Valley-Alleghany Regional Commission Agricultural Model.
13
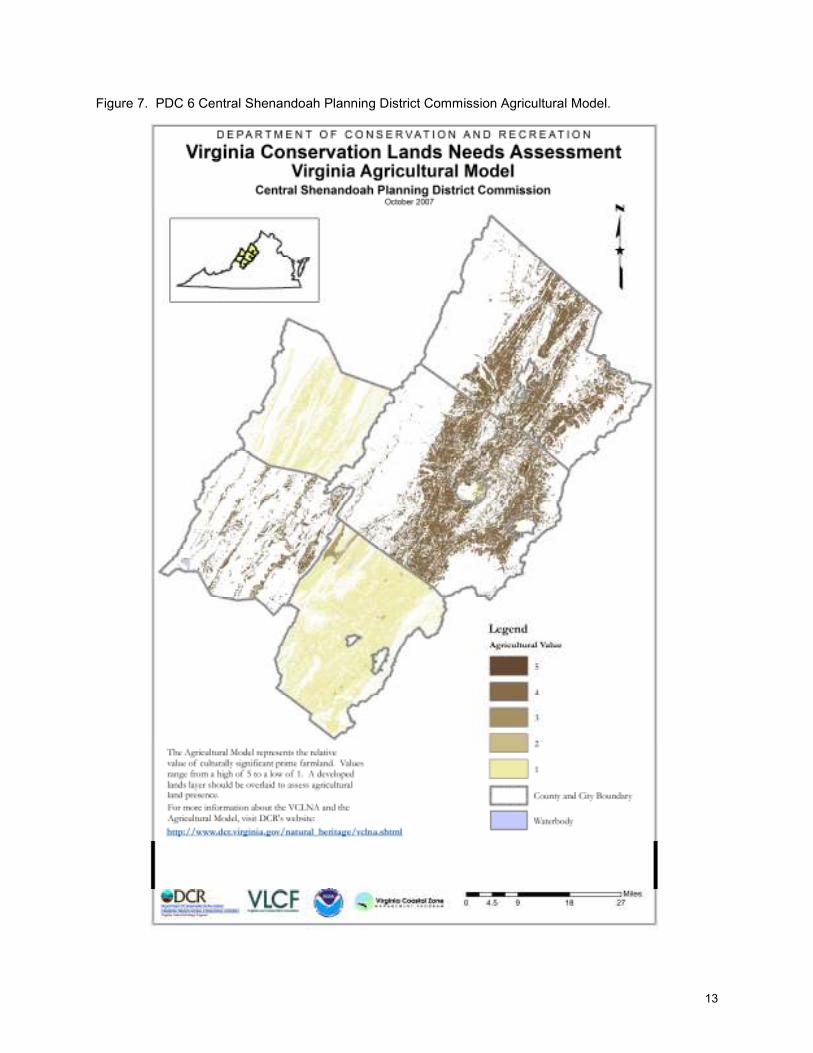
Figure 7. PDC 6 Central Shenandoah Planning District Commission Agricultural Model.
14
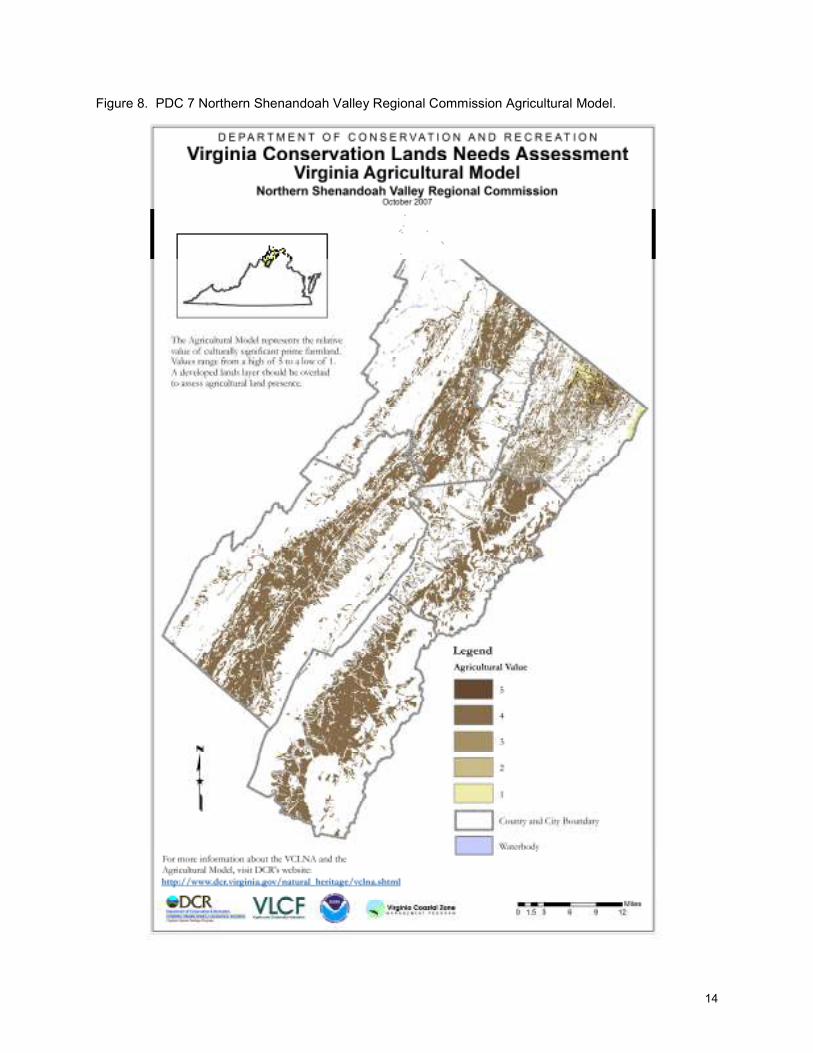
Figure 8. PDC 7 Northern Shenandoah Valley Regional Commission Agricultural Model.
15
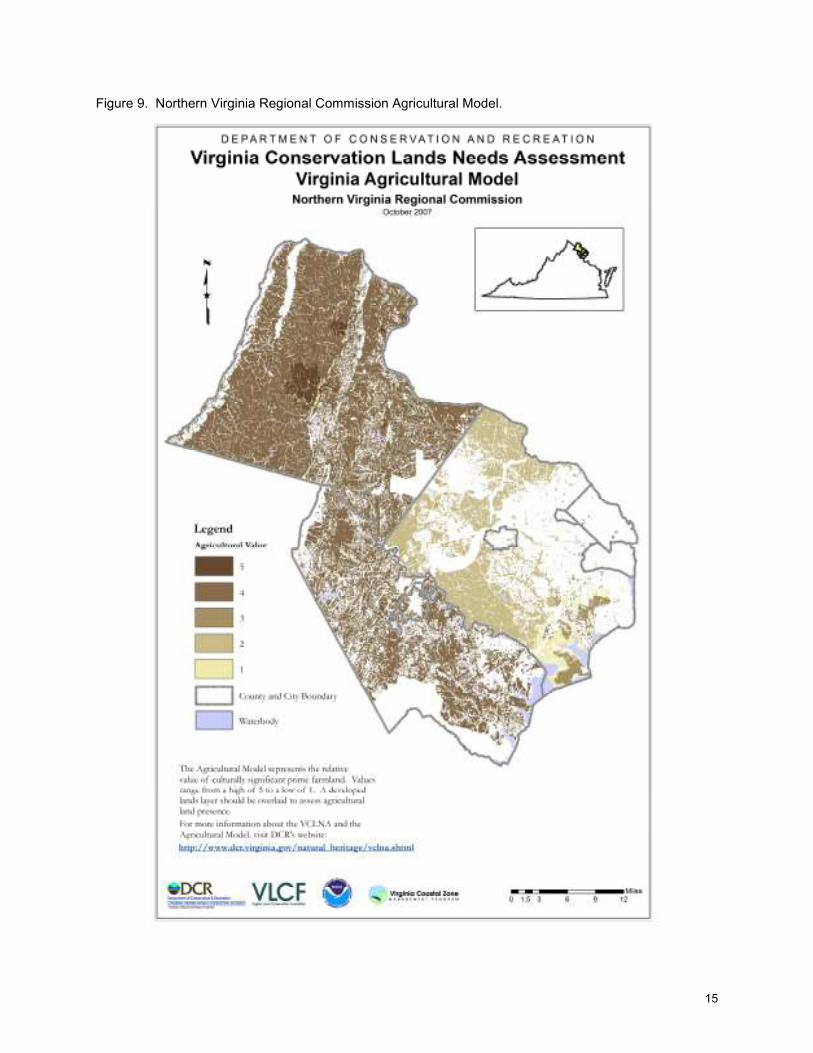
Figure 9. Northern Virginia Regional Commission Agricultural Model.
16
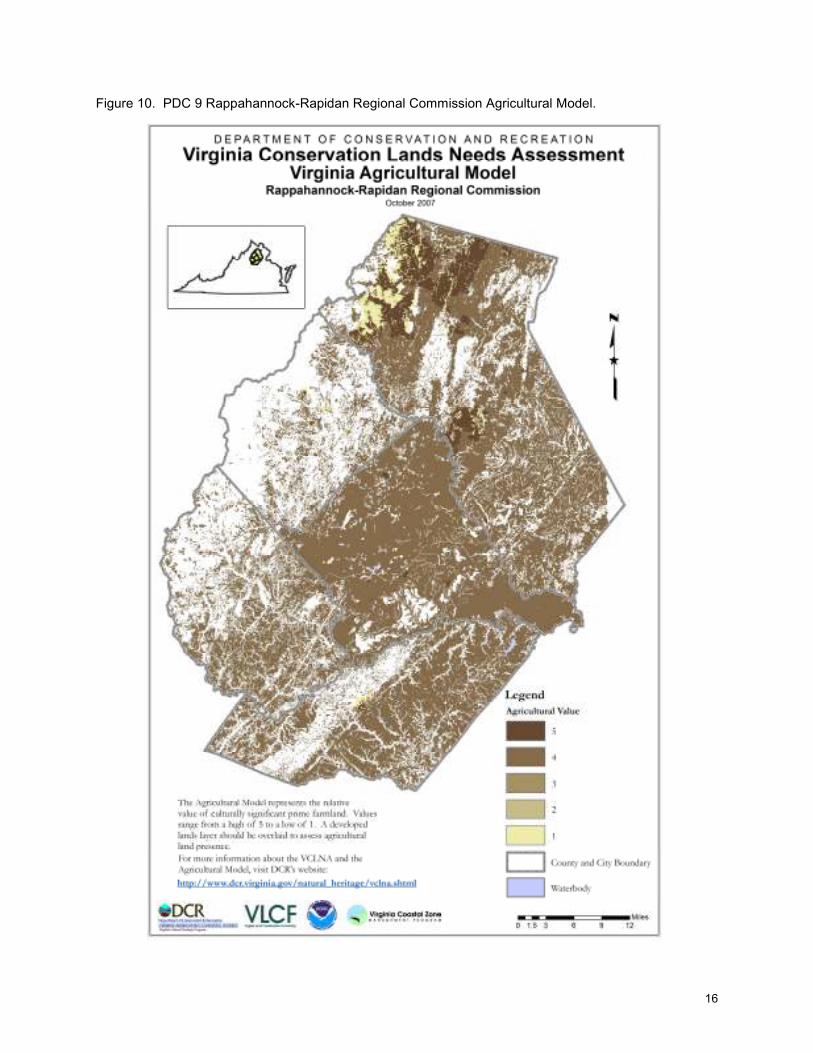
Figure 10. PDC 9 Rappahannock-Rapidan Regional Commission Agricultural Model.
17
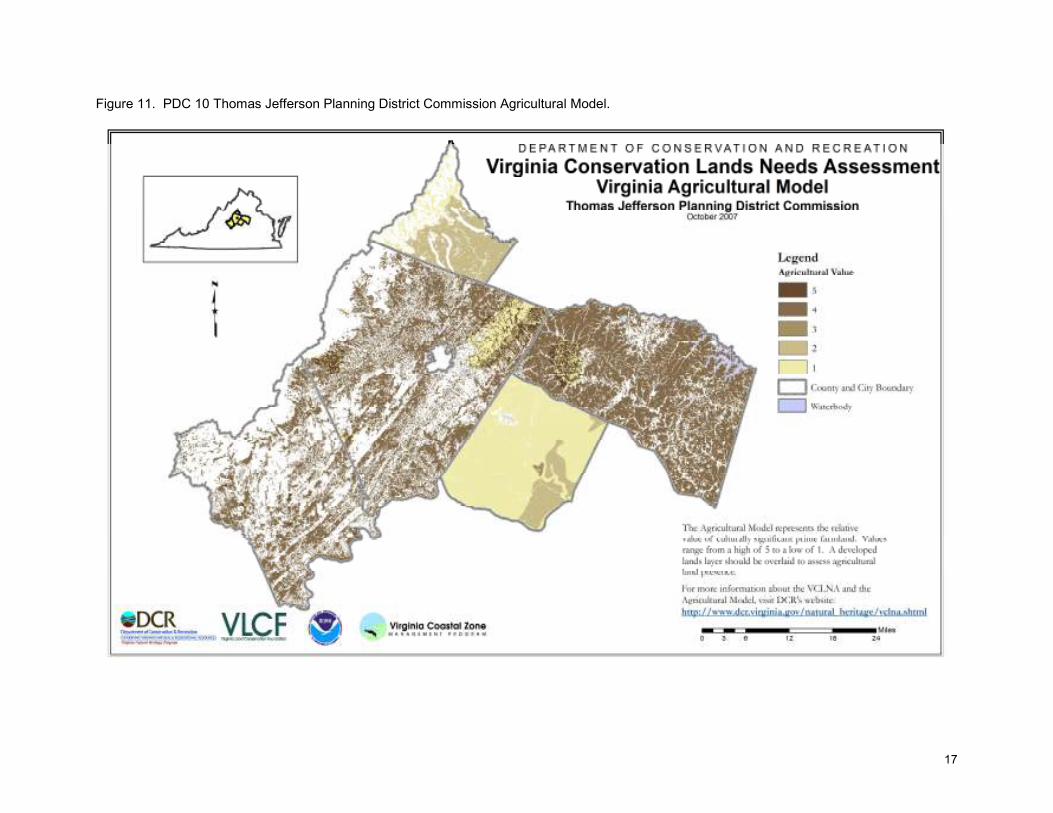
Figure 11. PDC 10 Thomas Jefferson Planning District Commission Agricultural Model.
18
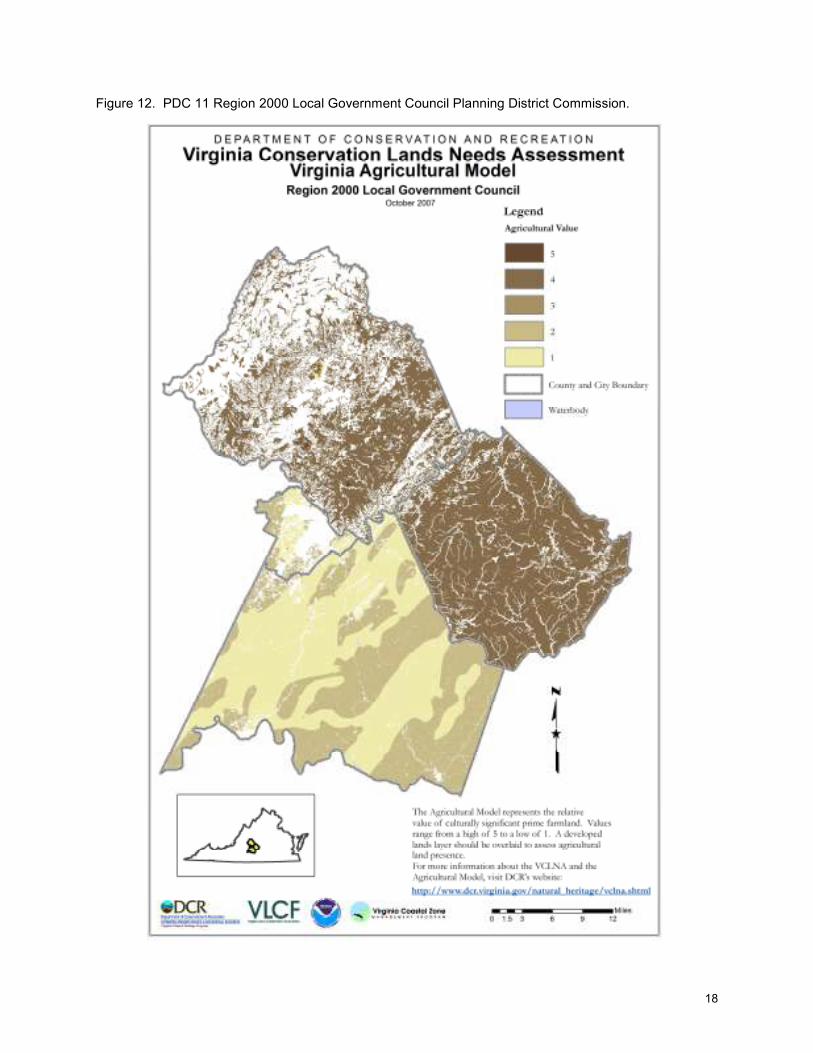
Figure 12. PDC 11 Region 2000 Local Government Council Planning District Commission.
19
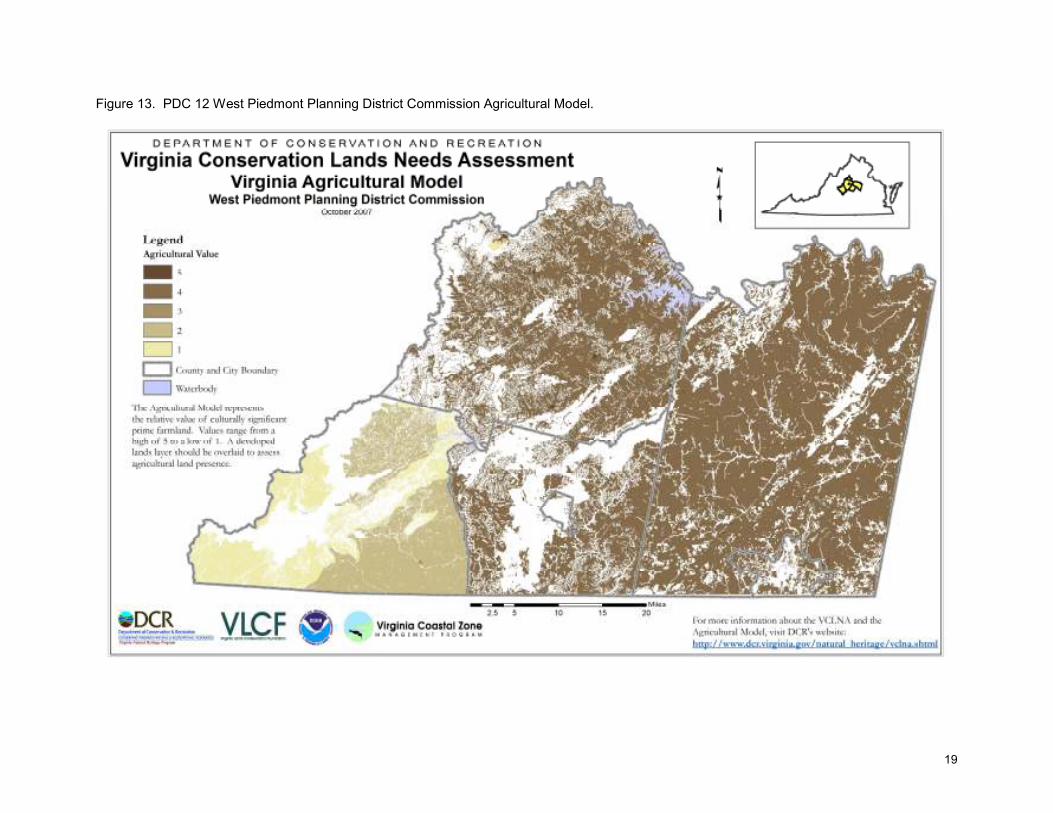
Figure 13. PDC 12 West Piedmont Planning District Commission Agricultural Model.
20
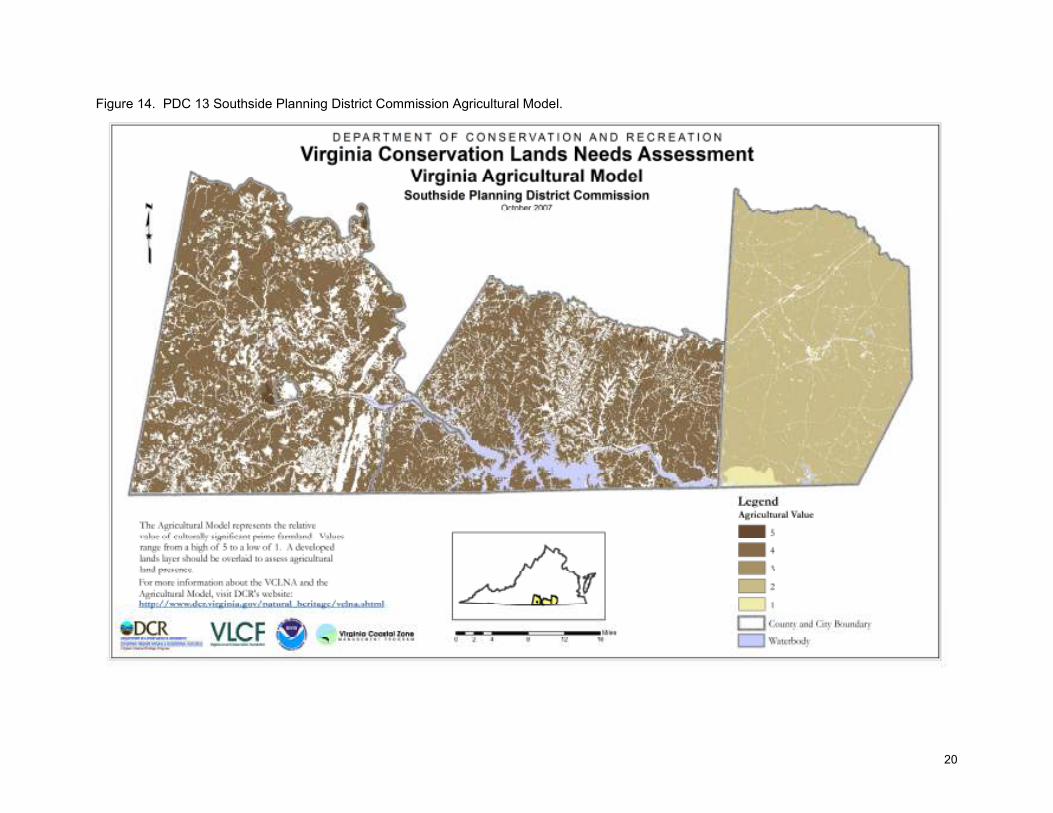
Figure 14. PDC 13 Southside Planning District Commission Agricultural Model.
21
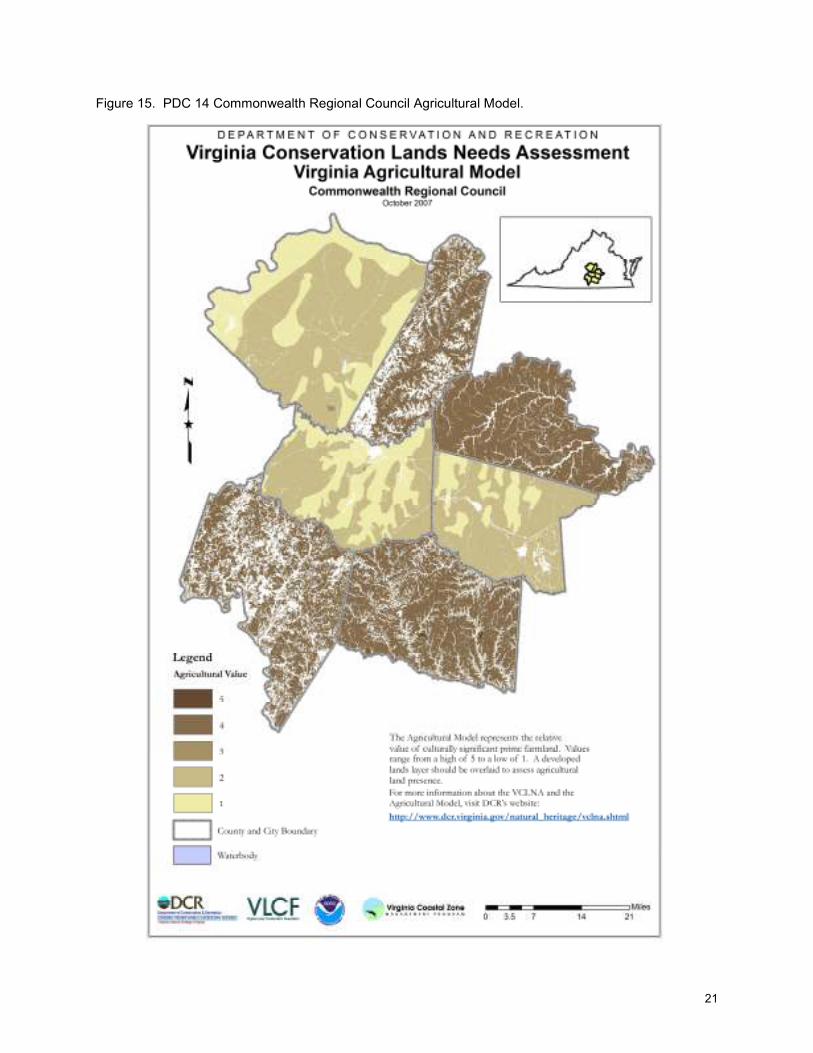
Figure 15. PDC 14 Commonwealth Regional Council Agricultural Model.
22
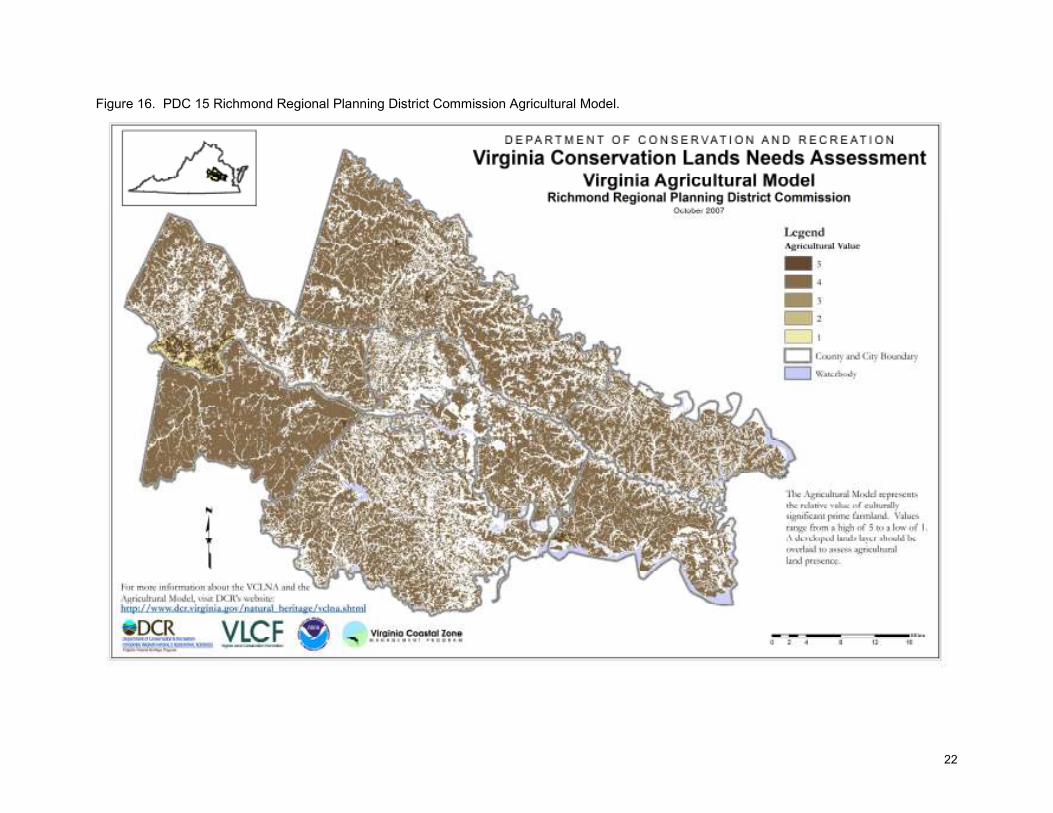
Figure 16. PDC 15 Richmond Regional Planning District Commission Agricultural Model.
23
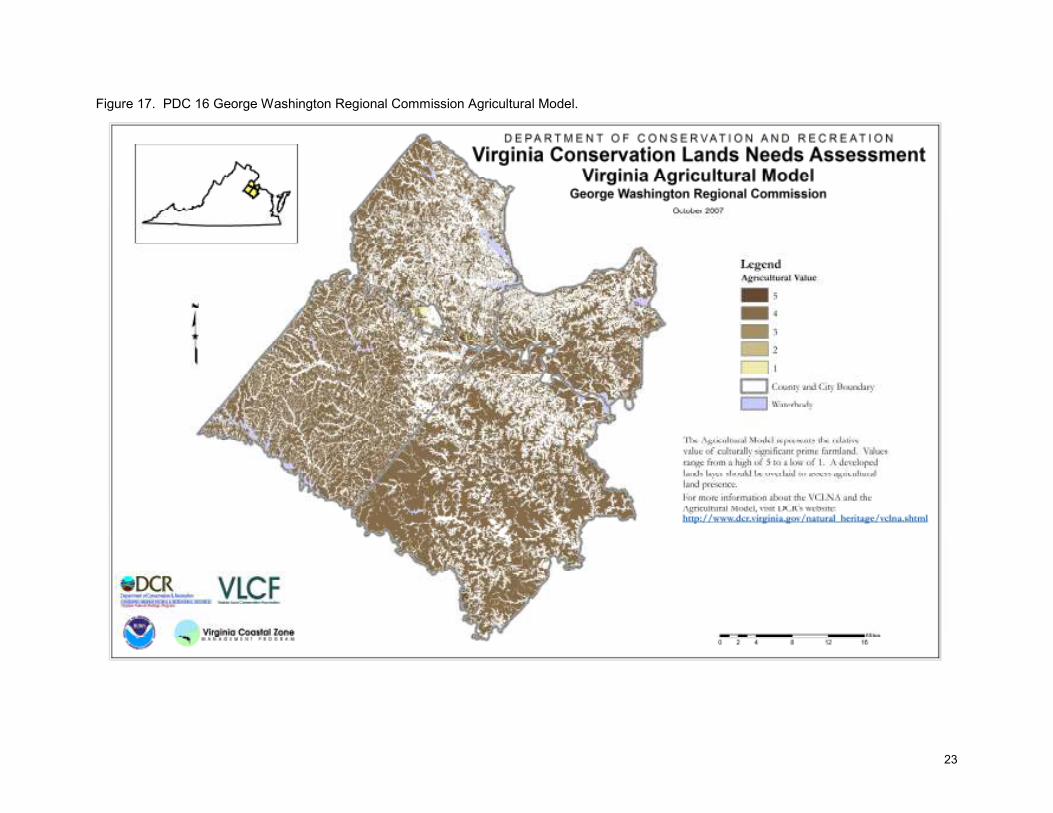
Figure 17. PDC 16 George Washington Regional Commission Agricultural Model.
24
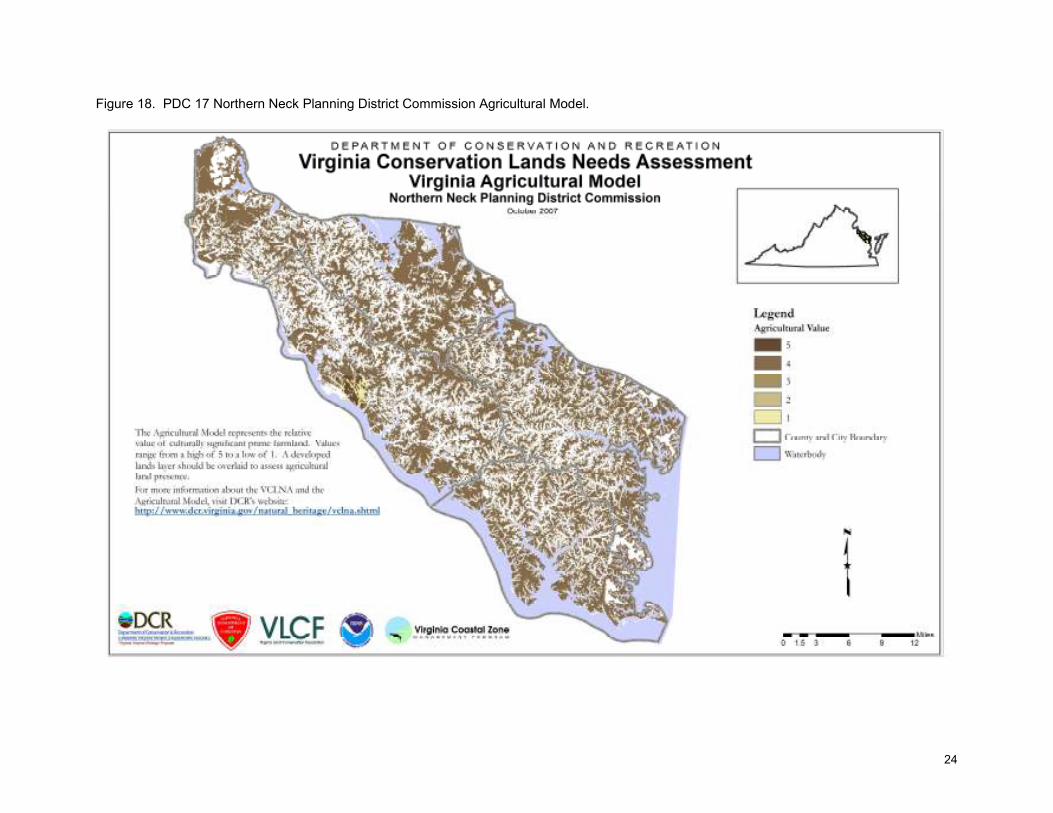
Figure 18. PDC 17 Northern Neck Planning District Commission Agricultural Model.
25
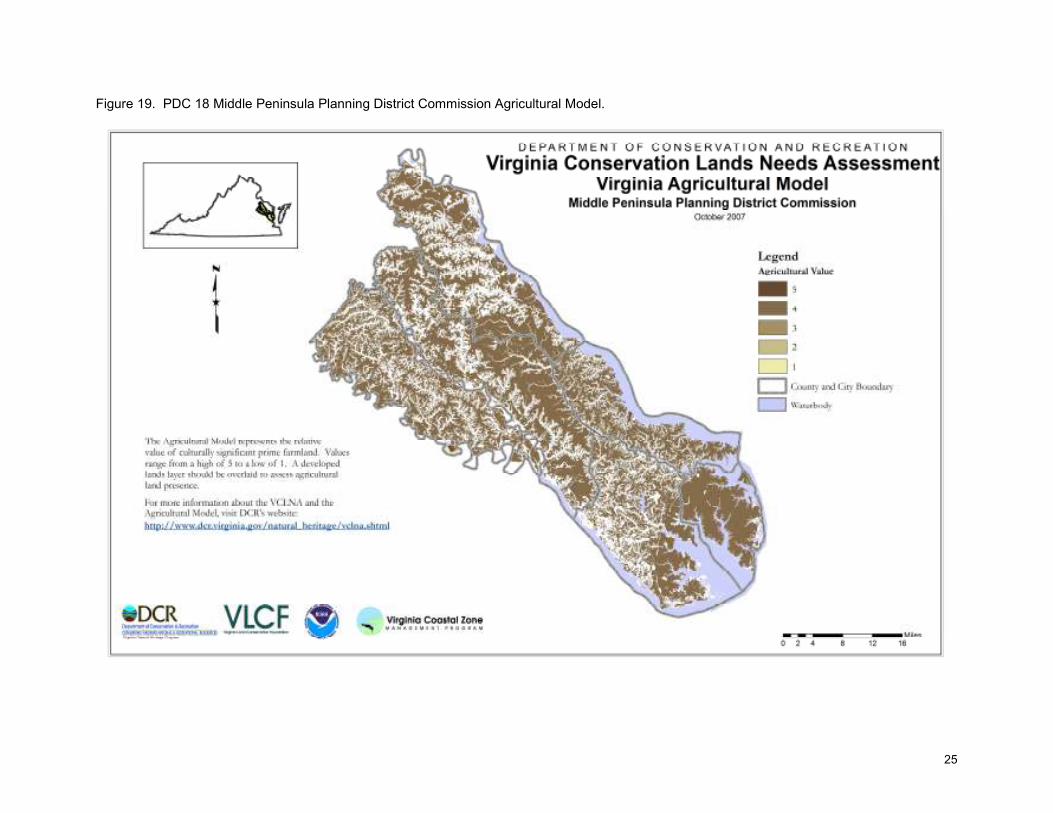
Figure 19. PDC 18 Middle Peninsula Planning District Commission Agricultural Model.
26
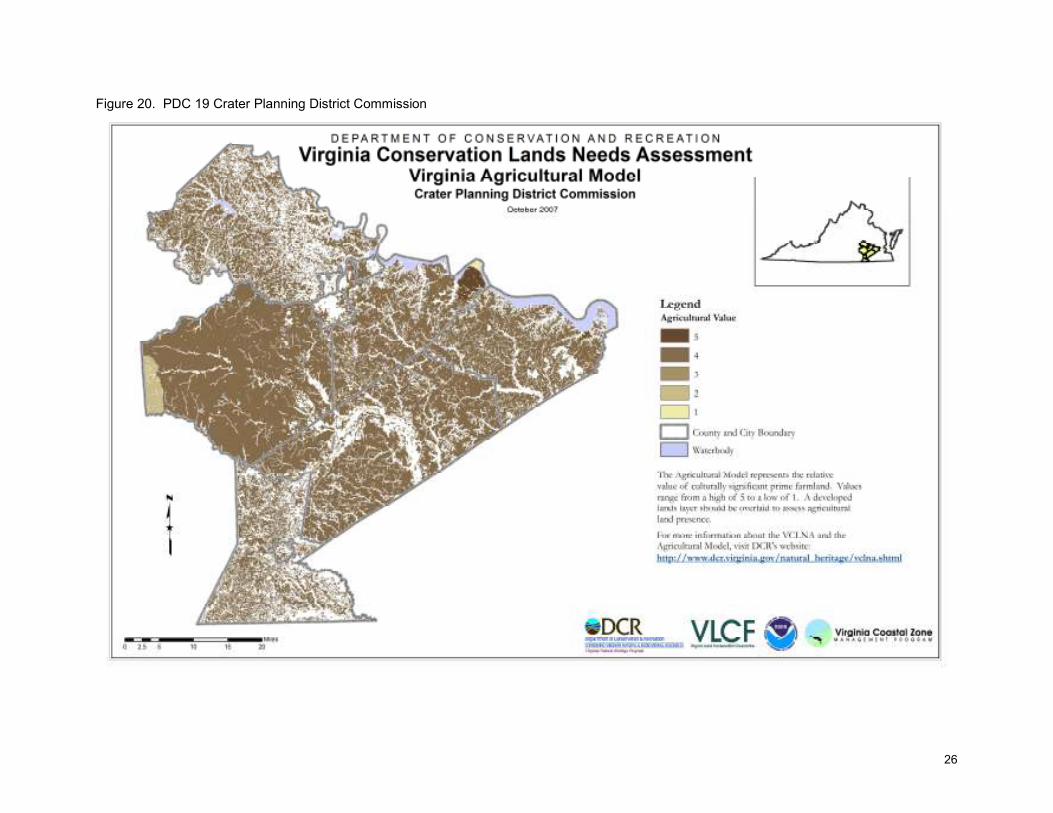
Figure 20. PDC 19 Crater Planning District Commission
27
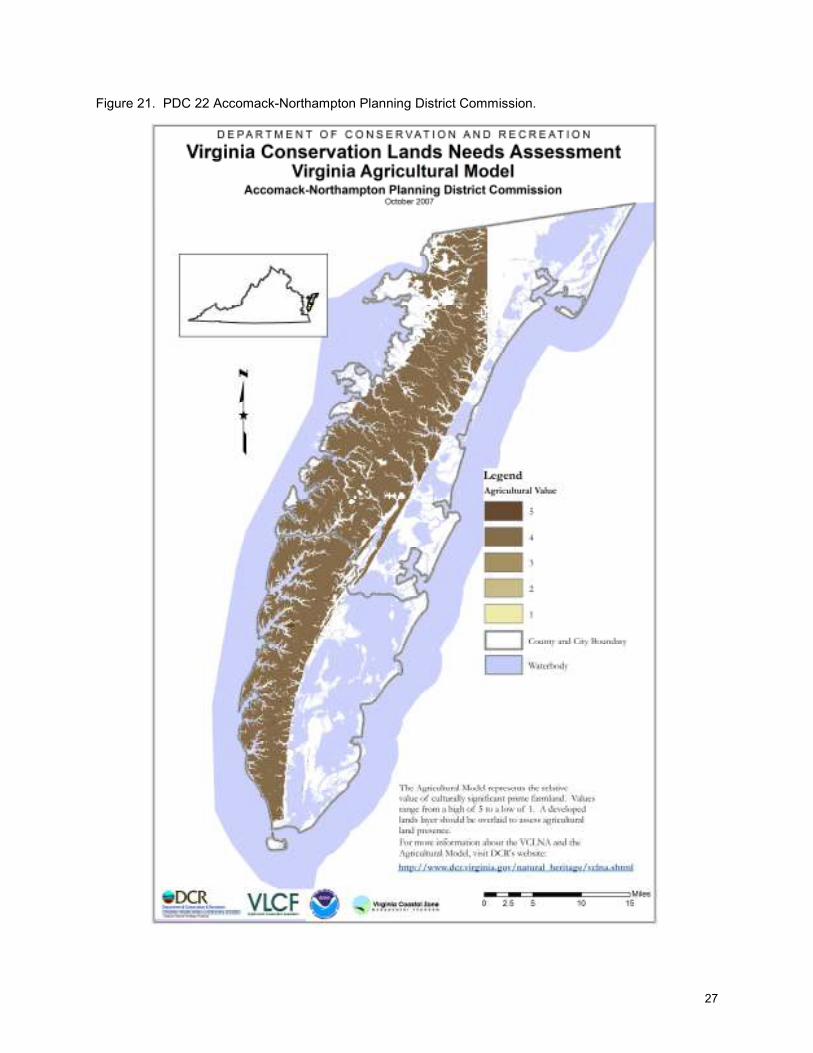
Figure 21. PDC 22 Accomack-Northampton Planning District Commission.
28
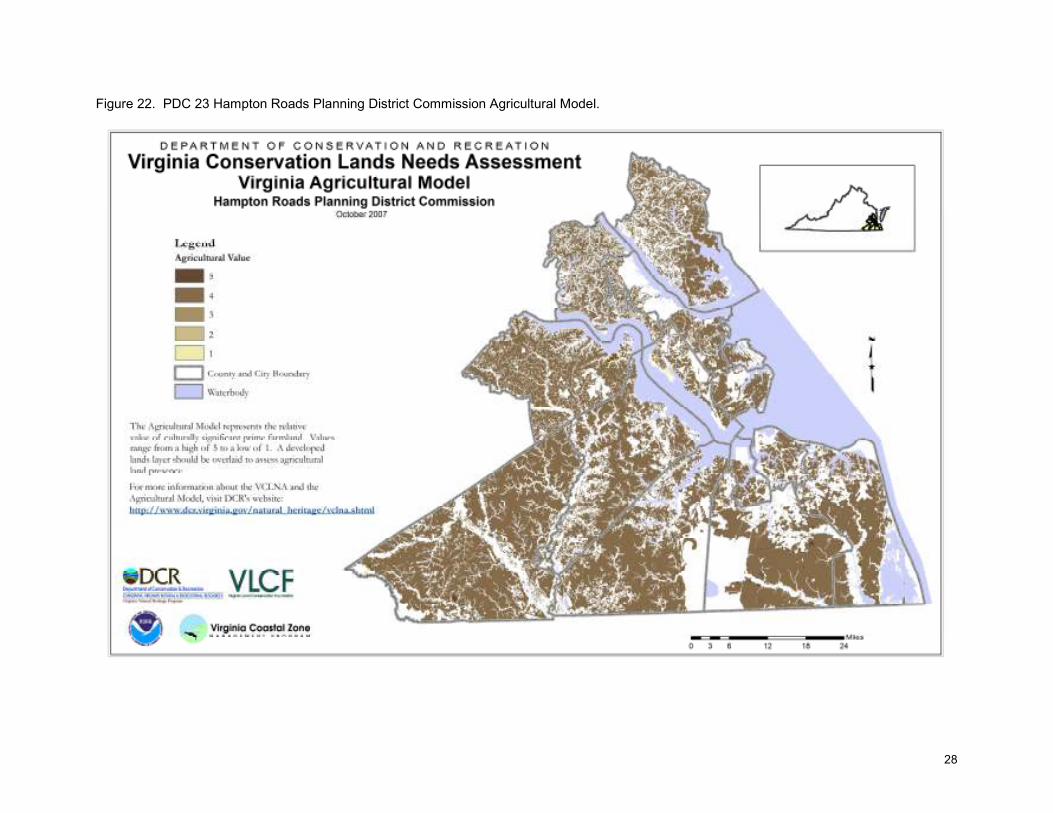
Figure 22. PDC 23 Hampton Roads Planning District Commission Agricultural Model.
29
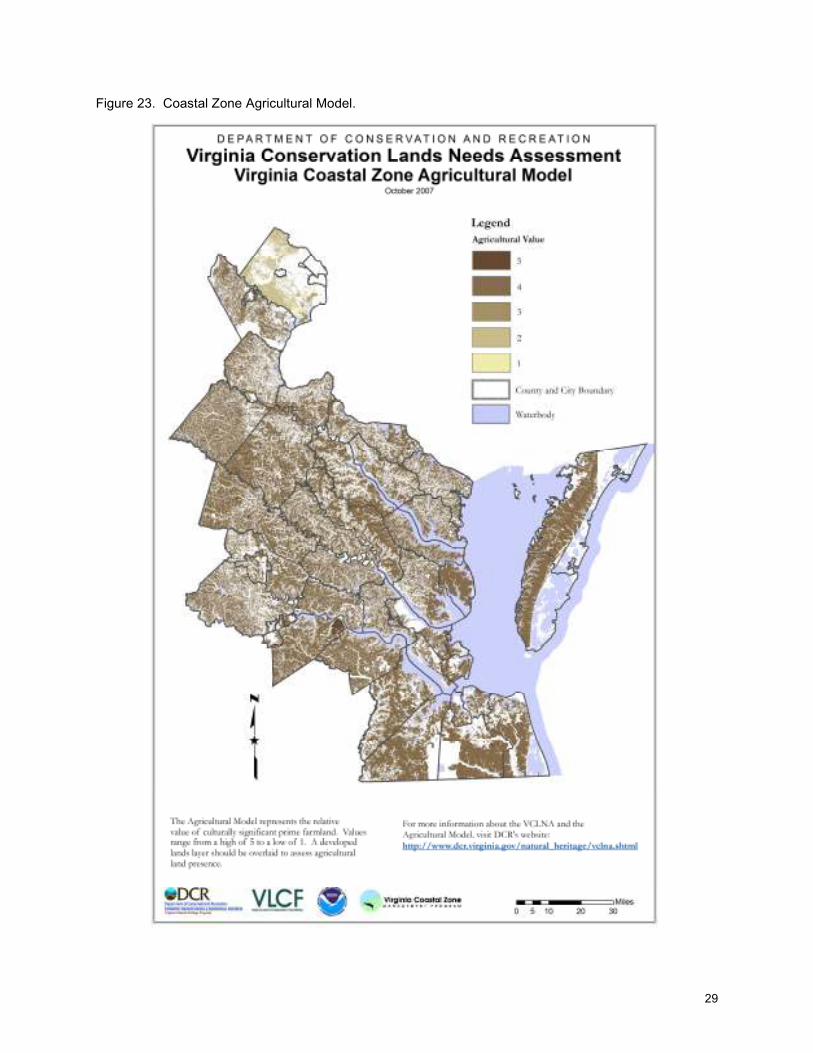
Figure 23. Coastal Zone Agricultural Model.
30
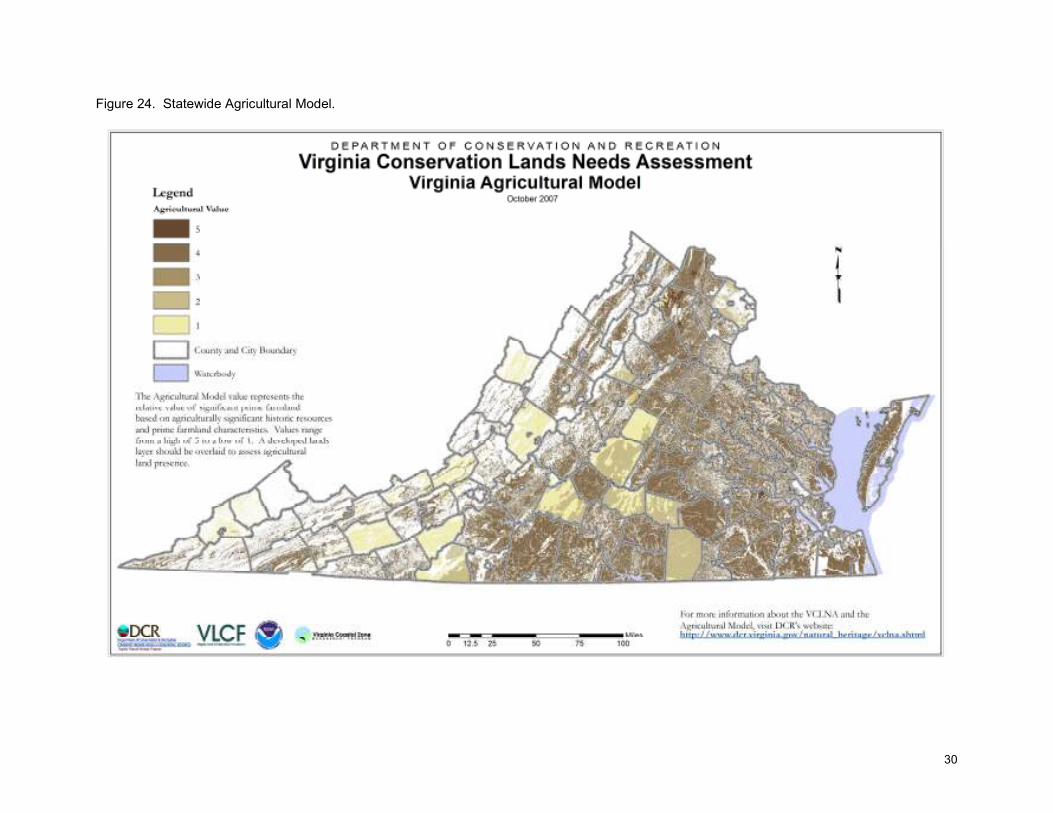
Figure 24. Statewide Agricultural Model.