villanova cfa research challenge 2015 presentation: harsco
TRANSCRIPT

PRESENTED BY: Kara Stessl, Retaish Bharadwaja, Brian HalamarQ&A LED BY: Hung Vo & Vishnu Atimyala
Sources: Factset2
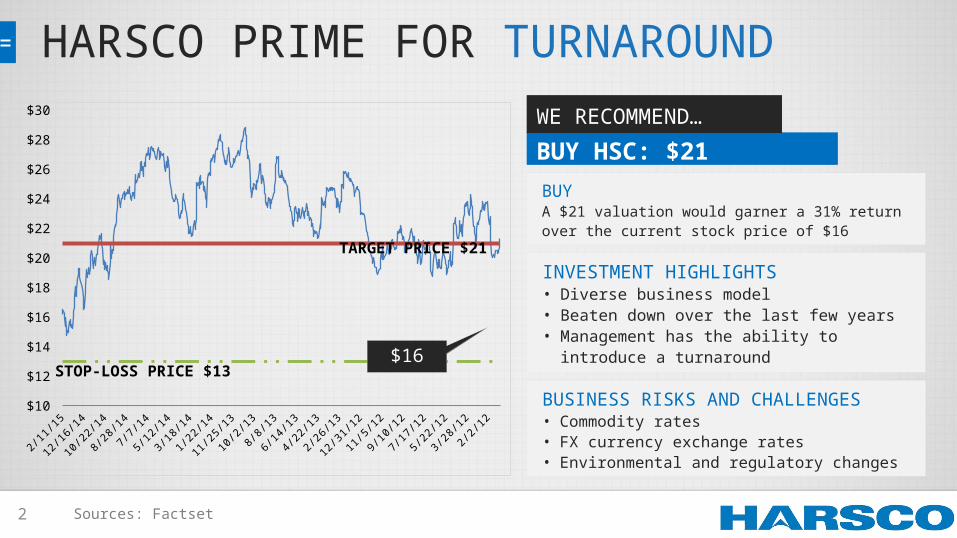
BUY HSC: $21
WE RECOMMEND…
BUYA $21 valuation would garner a 31% return over the current stock price of $16
INVESTMENT HIGHLIGHTS• Diverse business model• Beaten down over the last few years• Management has the ability to introduce a
turnaround
BUSINESS RISKS AND CHALLENGES• Commodity rates• FX currency exchange rates• Environmental and regulatory changes
1/3/
12
2/18
/12
4/4/
12
5/20
/12
7/5/
12
8/20
/12
10/5
/12
11/2
0/12
1/5/
13
2/20
/13
4/7/
13
5/23
/13
7/8/
13
8/23
/13
10/8
/13
11/2
3/13
1/8/
14
2/23
/14
4/10
/14
5/26
/14
7/11
/14
8/26
/14
10/1
1/14
11/2
6/14
1/11
/15
$10
$12
$14
$16
$18
$20
$22
$24
$26
$28
$30
$16
TARGET PRICE $21
STOP-LOSS PRICE $13
HARSCO PRIME FOR TURNAROUND

3 Sources: Factset, Harsco 10-K 2013
METALS &MINERALS
INFRASTRUCTURE RAIL &INDUSTRIAL
47% 30%13%
FINANCIAL TRENDS
of revenues 10%and
Rest of World25%
Western Europe
37%
North America
38%
REVENUES BY REGION
2009 2010 2011 2012 2013
-35
-30
-25
-20
-15
-10
-5
0
5
10 ROE % 5 YEAR TREND
16.7%
9.9%
5.9%
DIVESTED FOR $300mm
and
REVENUEBREAKDOWN
OPERATINGMARGINS
M&M TO DRIVE TURNAROUND

4
HARSCO VS
INDUSTRY PEERS
METALS AND MINERALSINDUSTRY HIGHLIGHTS
Sources: Factset, Harsco 10-K, Team Estimates
Scale: 1 (low) – 5 (high)
• Capital intensive industries • Strong price competition • Low switching costs - supplier
and buyer threat• M&M industry highly
fragmented • Only 84 companies
• Brand name highly valuable in M&M industry
RAIL, INDUSTRIAL, AND INFRASTRUCTURE
COMPETITVE POSITIONING

5
DAYS SALES OUTSTANDING
Sources: Factset, Harsco 10-K
2004
-12
2005
-12
2006
-12
2007
-12
2008
-12
2009
-12
2010
-12
2011
-12
2012
-12
2013
-12
0
20
40
60
80
2004
-12
2005
-12
2006
-12
2007
-12
2008
-12
2009
-12
2010
-12
2011
-12
2012
-12
2013
-12
0.00
0.05
0.10
0.15
0.20
0.25REVENUE PER EMPLOYEE
2004
-12
2005
-12
2006
-12
2007
-12
2008
-12
2009
-12
2010
-12
2011
-12
2012
-12
2013
-12
00.20.40.60.8
11.2
ASSET TURNOVER
DEBT POSITIONING
20042005200620072008200920102011201220130
0.4
0.8
1.2
1.6
Current Ratio Quick Ratio
LIQUIDITY RATIOS
2004200520062007200820092010201120122013
0
5
10
15
20
25
30
GROSS MARGIN
2004
2005
2006
2007
2008
2009
2010
2011
2012
2013
0
200
400
600
800
1000
1200
Debt Issuance Debt Repayment
ASSET UTILIZATION DRIVING TURNAROUND

6 Sources: Team Estimates, Bloomberg, Factset
GOING FORWARDFocus on ROIC instead of growth
ROIC NEEDEDNeed to obtain 11% ROIC vs
Industry average of 16%
TURNAROUNDExpect new management to improve
Harsco’s business.
TARGET PRICE Value Drivers
$21 Division Assumptions
Metals & Minerals Sales Growth: 0-2%
COGS decline
Improving margins
Lower SG&A
Rail Sales Growth: 1-4%
COGS decline
Improvement in aftermarket services higher margins
Industrial Sales Growth: 3-4% due to strong industry growth
METHODUsed a discounted cash flow (DCF) model to forecast our price valuation.
Equity Weight 62.76%
Debt Weight 37.24%
Tax Rate 32%
Cost of Debt 4.05%
Cost of Equity 12.60%
WACC 8.91%
ROIC DRIVING VALUE

7 Sources: Harsco Investor Presentation, Harsco 10-K
Ending unfavorable contracts
Slashing SG&A to improve operating efficiency
Turnaround of Metals & Minerals through Project Orion
• Lower CAPEX 2015
• Lower termination cost
• Phase 1 savings expected to be $25 million annually starting in 2015
PROJECT ORIONMETALS & MINERALS TURNAROUND
Phase IAbove site
improvements
Phase IIAt-site
improvements
Phase III
Bid & contract
management
Phase IV
Under-performing
sites
PROJECT ORION WORK STREAMS
CATALYSTS FOR CHANGE

Sources: Bloomberg8
CEO
NicholasGrasberger
CFO
Peter Minan
Head of MM
RichardLundgren
Managing Director of Precision Polymers
CFO of Kennametal Inc.
CEO of Armstrong’s Building Products division
30 year career at KPMG
Served multi-national Fortune 500 industrial firms
VP of ERM at Computer Sciences Corporation
CEO of Shale-Inland Holdings
President of Tyco Thermal Controls
6 of 10 Board of Directors have served for less than 5
years
Age: 50 Age: 52
EXECUTIVE TRANSITION COMPLETE
Age: 57

Sources: Factset, Team Estimates9
$300mm divestiture $500 – 700mm IPO M&M Backlogs Dividends
CASH AVAILABLE
LOW HANGING FRUITImprovements to ROIC already being seen
SENSITIVITY ANALYSIS• Only needs to get ROIC below the industry
average of 16%• Organic only• Minimal sales growth needed• Don’t have razor thin margins
HOW IS IT POSSIBLE?
HARSCO TURNAROUND
WACC
ROIC 8.0% 8.5% 9.0% 9.5% 10.0% 10.5%
9.5% $22.43 $19.93 $17.86 $16.12 $14.64 $13.36
10.0% $24.02 $21.34 $19.13 $17.26 $15.68 $14.31
10.5% $25.61 $22.76 $20.39 $18.41 $16.71 $15.26
11.0% $27.20 $24.17 $21.66 $19.55 $17.75 $16.20
11.5% $28.79 $25.58 $22.93 $20.69 $18.79 $17.15
12.0% $30.38 $27.00 $24.19 $21.83 $19.82 $18.09
12.5% $31.97 $28.41 $25.46 $22.97 $20.86 $19.04
KEY TURNAROUND GOALS

10
ADDITIONAL KEY FACTORSFresh management breath of new life Already showing signs of improvementDivestiture allows Harsco to refocus on fewer divisions
PRICE: Final valuation target price of $21 which would yield a 31% return over the current stock price of $16
WHAT MAKES HARSCO A STRONG TURNAROUND?
FEASIBLE
•Management’s simple plan of organic growth and internal improvements
MEASUREABLE
•Management laid out plan of deliverable dates
AFFORDABLE
•$300mm immediate cash inflow and future inflows if needed
KEYS TO SUCCESS

11
THANK YOU FOR YOUR TIME…
…ANY QUESTIONS?

Sources: Factset12
ADDITIONAL ANALYSIS

13
2004 2005 2006 2007 2008 2009 2010 2011 2012 20130
200
400
600
800
1000
1200
Debt Issuance Debt Repayment
2004 2005 2006 2007 2008 2009 2010 2011 2012 20130
50
100
150
200
250
300
350
400
450
Business Divestitures business acquisitions
Debt Positioning Cash Flow – Divestitures and Acquisitions

14
5-Year Cumulative Returns: Harsco, S&P Midcap 400, Dow Jones US Diversified Industrials

15
Harsco Revenue Distributions
Harsco Consolidated Revenue % by Business Sector (2013)
Harsco Consolidated Revenue % by Region (2013)

16
US Dollar Index Metals and Minerals Site Performance
Metals and Minerals Past FCF and ROIC
Category 2013 Actual 2017 Plan
Revenue $1.4 B $1.3-1.4 B
EBIT Margin 7% 10-11%
FCF $54 M $130-150 M
ROIC % 5% 8-9%
Expected Long-Run Metal and Materials Projections

17
Board of Directors
Harsco Board of Directors Age Tenure (Years) Start
Chairman: David C Everitt 61 0.4 Aug-14
Lead Director: Kathy G Eddy 63
Terry D Growcock 69 7 2008
Stuart E Graham 68 5.9 Feb-09
James M Loree 56 5 2010
James F Earl 57 2.4 Jul-12
Phillip C Widman 59 1 Jan-14
Elaine La Roche 65 0.8 Mar-14
F Nicholas Grasberger III 51 0.7 Apr-14
Henry W Knueppel 66 0.4 Aug-14
Street Recommendation and Target Price

18
Scale of Interaction0 - No Interaction 2 - Low 4 - High1 - Insignificant 3 - Average 5 - Very High

19
Rail Segment Revenue Distribution 2013 vs 2014

20

21

22
US- Structural metal product manufacturing industry REV out look
YearRevenue $
millionGrowth %
2008 55,876,900 6.1
2009 40,910,800 -26.8
2010 36,644,200 -10.4
2011 39,782,000 8.6
2012 40,500,000 1.8
2013 42,321,400 4.5
2014 44,776,300 5.8
2015 49,836,000.00 11.3
2016 53,474,000.00 7.3
2017 58,179,800.00 8.8
2018 58,936,100.00 1.3
2019 62,118,600.00 5.4
2020 64,603,400.00 4
US-boiler & heat exchanger manufacturing
Year Revenue $ million Growth %
2008 6,969,200 7.1
2009 6,267,400 -10.1
2010 6,002,500 -4.2
2011 6,571,500 9.5
2012 7,354,800 11.9
2013 7,077,700 -3.8
2014 7,041,500 -0.5
2015 7,252,700 3
2016 7,608,100 4.9
2017 7,562,500 -0.6
2018 7,744,000 2.4
2019 7,906,600 2.1
2020 8,080,500 2.2

23
Dec. 31,
2009
Dec. 31,
2010
Dec. 31,
2011
Dec. 31,
2012
Dec. 31,
2013
Dec. 31,
2014
Dec. 31,
2015
Dec. 31,
2016
Dec. 31,
2017
Dec. 31,
2018
Dec. 31,
2019
-0.2
-0.1
0
0.1
0.2
0.3
0.4
-13.48%
32.00%
15.18%
3.80% 4.39%
9.74% 9.84%
1.54%5.13%
3.01%
Industrial
Harsco Industrial Growth rate
US Rail Maintenance ServiceRevenue Growth
YearRevenue $
millionGrowth %
2002 144,918.00 0
2003 145,215.60 0.2
2004 159,526.40 9.9
2005 179,904.40 12.8
2006 188,702.50 4.9
2007 196,244.50 4
2008 200,645.50 2.2
2009 156,891.90 -21.8
2010 172,408.50 9.9
2011 200,575.30 16.3
2012 223,769.00 11.6
2013 230,703.50 3.1
2014 241,317.30 4.6
2015 250,004.80 3.6
2016 258,004.90 3.2
2017 265,229.10 2.8
2018 275,307.80 3.8
2019 285,218.80 3.6
2020 296,342.40 3.9

24
Future Projections and Assumptions by Business Segment

25
Future Projections and Assumptions by Business Segment

26
Future Projections and Assumptions by Business Segment

27
Fluor SPW KBR KMT HSC
Beta 1.53 1.39 1.45 1.3 1.78
D/E 5.03% 36.30% 2.50% 31.07% 59.34%
Tax 31.25% 31.26% 41.40% 29.31% 32%Unlevered Beta 1.479 1.112 1.429 1.066 1.272
WACC Calculations
Beta 1.78
Risk Premium 6%
Risk-free Rate 1.85%
Cost of Equity 12.6%
Cost of Debt 4.05%
Equity Weight 62.76%
Debt Weight 37.24%
Cost of Equity 12.6%
Tax Rate 32.0%
WACC 8.91%

28
DCF Valuation

29
DCF Valuation

30
Relative Valuation
EV/EBIT
SPX 10.71
FLR 6.26
KMT 11.46
Average 9.5
2015 EBIT 111,303
2.0% 2.5% 3.0% 3.5% 4.0%
7.5 848,819 852,980 857,141 861,302 865,463
8.5 962,348 967,066 971,783 976,500 981,218
9.5 1,075,877 1,081,151 1,086,425 1,091,699 1,096,973
10.5 1,189,406 1,195,237 1,201,067 1,206,898 1,212,728
11.5 1,302,935 1,309,322 1,315,709 1,322,096 1,328,483
M&M, Industrial and Rail Value
Relative Sensitivity Analysis
2.0% 2.5% 3.0% 3.5% 4.0%
7.5 $13.01 $13.06 $13.10 $13.15 $13.20
8.5 $14.30 $14.35 $14.41 $14.46 $14.51
9.5 $15.59 $15.65 $15.71 $15.77 $15.83
10.5 $16.88 $16.95 $17.01 $17.08 $17.15
11.5 $18.17 $18.24 $18.32 $18.39 $18.46
31
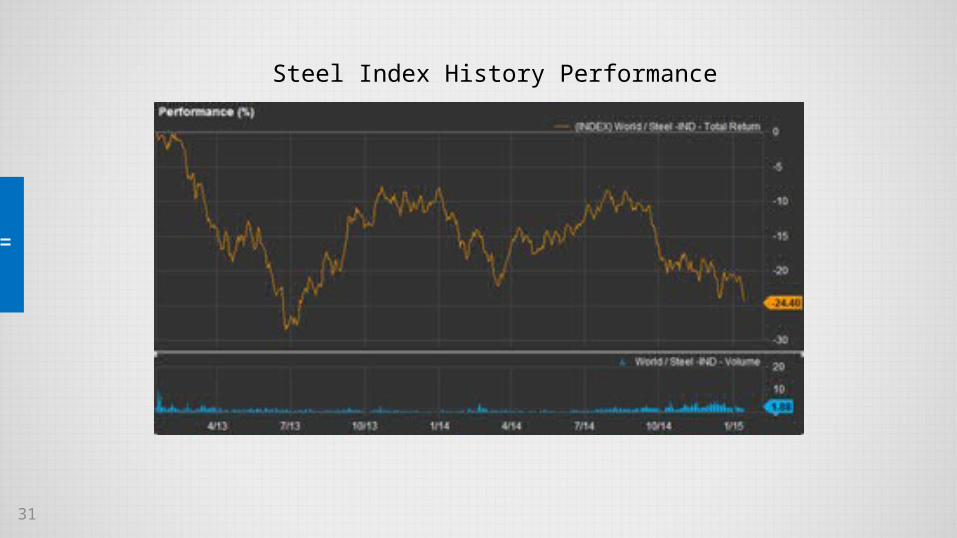
Steel Index History Performance

32
CONSOLIDATED BALANCE SHEETS (Include Infrastructure) Dec. 31, 2009 Dec. 31, 2010 Dec. 31, 2011 Dec. 31, 2012 Dec. 31, 2013
In Thousands, unless otherwise specified
Current assets: ' 'Cash and cash equivalents $94,184.00 $124,238 $121,184 $95,250 $93,605 Trade accounts receivable, net 598,318 585,301 618,475 600,264 353,181Other receivables 30,865 29,299 44,431 39,836 46,470Inventories 291,174 271,617 241,934 236,512 155,689Assets held-for-sale 2,399 113,968Other current assets 154,797 144,491 133,407 92,182 75,842Total current assets 1,169,338 1,154,946 1,159,431 1,066,443 838,755Investments 3,201 298,856Property, plant and equipment, net 1,510,801 1,366,973 1,274,484 1,266,225 711,346Goodwill 699,041 690,787 680,901 429,198 431,265Intangible assets, net 150,746 120,959 93,501 77,726 53,261Other assets 109,314 135,555 130,560 133,176 108,265Total assets 3,639,240 3,469,220 3,338,877 2,975,969 2,441,748Current liabilities: ' 'Short-term borrowings 57,380 31,197 51,414 8,560 7,489Current maturities of long-term debt 25,813 4,011 3,558 3,278 20,257Accounts payable 215,504 261,509 252,329 221,479 181,410Accrued compensation 67,652 83,928 92,603 94,398 53,113Income taxes payable 5,931 9,718 8,409 10,109 7,199Dividends payable 16,473 16,505 16,498 16,520 16,536Insurance liabilities 25,533 25,844 25,075 19,434 10,523Advances on contracts 149,413 128,794 111,429 47,696 24,053Liabilities of assets held-for-sale 0 109,176Due to unconsolidated affiliate
0 24,954Due to related party 0 22,320Other current liabilities 187,403 206,358 220,953 216,101 129,739Total current liabilities 751,102 767,864 782,268 637,575 606,769Long-term debt 901,734 849,724 853,800 957,428 783,158Deferred income taxes 90,993 35,642 27,430 18,880 8,217Insurance liabilities 61,660 62,202 60,864 63,248 41,879Retirement plan liabilities 250,075 223,777 343,842 385,062 241,049Due to unconsolidated affiliate
0 27,292Due to related party 0 84,023Other liabilities 73,842 61,866 50,755 52,152 42,526Total liabilities 2,129,406 2,001,075 2,118,959 2,114,345 1,834,913COMMITMENTS AND CONTINGENCIES ' '

33
HARSCO CORPORATION STOCKHOLDERS' EQUITY
' 'Preferred stock, Series A junior participating cumulative preferred stock
0 0Common stock, par value $1.25
139,234 139,514 139,914 140,080 140,248Additional paid-in capital
137,746 141,298 149,066 152,645 159,025Accumulated other comprehensive loss
-201,684 -185,932 -364,191 -411,168 -370,615Retained earnings
2,133,297 2,073,920 1,996,234 1,675,490 1,381,321Treasury stock, at cost (31,519,768 and 31,479,310 shares at December 31, 2013 and 2012, respectively) -735,016 -737,106 -744,644 -745,205 -746,237Total Harsco Corporation stockholders' equity
1,473,577 1,431,694 1,176,379 811,842 563,742Noncontrolling interests
36,257 36,451 43,539 49,782 43,093Total equity
1,509,834 1,468,145 1,219,918 861,624 606,835Total liabilities and equity
$ 3,639,240 $3,469,220 $3,338,877 $2,975,969 $2,441,748
Balance Sheet (Continued)

34
Consolidated Income Statement
In Thousand Dec. 31, 2009 Dec. 31, 2010 Dec. 31, 2011 Dec. 31, 2012 Dec. 31, 2013
Net sales 2,990,577 3,038,678 3,302,740 3,046,018 2,896,520
Cost of sales (Incl D&A) (2,252,138) (2,336,879) (2,570,628) (2,349,516) (2,234,215)
Gross profit 738,439 701,799 732,112 696,502 662,305 Selling, general & administrative expenses (509,071) (532,624) (535,679) (503,339) (481,052)
R&D (3,151) (4,271) (6,044) (9,139) (9,570)
Other expense (7,561) (86,473) (102,740) (93,776) (15,110)
Operating Income 218,656 78,431 87,649 90,248 156,573
Interest income 2,928 2,668 2,751 3,676 2,087
Interest expense (62,746) (60,623) (48,735) (47,381) (49,654)Change in fair value to unit adjustment liability - - (966)
Goodwill Impair (265,038)
Dispose Infrasture (291,372)
Earnings before taxes 158,838 20,476 41,665 (218,495) (183,332)
Income taxes (18,509) (4,276) (49,848) (35,251) (34,912)
Net income(Loss) for Continue Operating 140,329 16,200 (8,183) (253,746) (218,244)Equity in income of unconsolidated entities, net 504 390 690 564 1,548 Loss from continuing operations
140,833 16,590 (7,493) (253,182) (216,696)Discontinued operations:
' ' ' Loss on disposal of discontinued business (21,907) (7,249) (3,306) (1,843) (2,398)Income tax benefit related to discontinued business 6,846 3,118 1,243 924 906 Loss from discontinued operations
(15,061) (4,131) (2,063) (919) (1,492)Net Income (Loss)
125,772 12,459 (9,556) (254,101) (218,188)

35

36
In Thousand Dec. 31, Dec. 31, 2010
Dec. 31, 2011
Dec. 31, 2012
Dec. 31, 2013M&M 2009
Net Revenues 1,159,200 1,031,807 1,588,302 1,404,103 1,359,004 Cost of Revenues 883,117 991,503 1,201,133 1,068,412 1,044,671
Gross Profit 276,083 40,304 387,169 335,691 314,333 Research and Development 1,688 2,093 1,786 1,735 1,918
SG&A 197,324.83
180,856.67
257,610.36
232,020.89
225,702.43 Net Gain from asset Sale (3,406.00) (3,942.00) (1,666.00) (2,449.00) (1,043.00)Employee Termination Benefit Costs 7998 4684 18533 8082 3561Impaired Asset Write-downs 1464 1028 0 7152 689Costs to Exit Activities 2577 930 1313 3627 2705
Total Operating Expense 207,646 185,650 277,576 250,168 233,532 Operating Income 68,437 (145,346) 109,593 85,523 80,801 Provision for Income Taxes - - - - - Net
Income $68,437 $(145,346) $109,593 $85,523 $80,801
Income Statement by Business Segment
Harsco Infrastructure Net Revenues 1,257,098 1,461,531 1,108,293 937,293 885,377
Cost of Revenues 999,257 1,004,152 967,675 808,016 723,252 Gross Profit 257,841 457,379 140,618 129,277 162,125
SG&A 213,989.52 256,179.33 179,756.59 154,882.91 147,042.79 Research and Development 1,087 1,392 2,686 3,134 2,916
Net Gain from asset Sale (4,641.00) (3,253.00) (3,607.00) (2,198.00) (2,864.00)Contingent consideration adjustments 0 -10620 -3966 0 0Employee Termination Benefit Costs 2352 19068 16546 17291 -326Costs to Exit Activities 1720 33458 8694 34820 -254Impaired Asset Write-downs 30 8938 0 0 0Product line rationalization — 34302 66,063 24,966
Disposal Charge 265038 291,372 Total Operating Expense 214,538 339,464 266,173 497,934 437,887
Operating Income 43,303 117,915 -125,555 -368,657 -275,762

37
Income Statement by Business Segment
Harsco Rail 2009 2010 2011 2012 2013
Net Revenues 306,016 313,262 300,029 352,036 286,167
Cost of Revenues 196,948 191,058 191,439 234,205 197,690
Gross Profit 109,068 122,204 108,590 117,831 88,477
SG&A 52,091.58 54,909.03 48,662.39 58,172.16 47,526.41
Research and Development 188 593 886 3,335 3,418
Employee Termination Benefit Costs 246 578 296 245 235
Impaired Asset Write-downs 0 0 8999
Total Operating Expense 52,526 56,080 49,844 61,752 60,178
Operating Income 56,542 66,124 58,746 56,079 28,299
Harsco Industrial 2009 2010 2011 2012 2013
Net Revenues 268,023 231,898 306,116 352,586 365,972
Cost of Revenues 166,783 148,270 205,590 233,899 243,474
Gross Profit 101,240 83,628 100,526 118,687 122,498
SG&A 45,665.07 40,678.98 49,649.66 58,263.05 60,780.37
Research and Development 188 193 686 935 1,318
Net Gain from asset Sale (597.00) (889.00) (1,089.00) (750.00)
Employee Termination Benefit Costs 303 486 423 418 115
Costs to Exit Activities -4
Total Operating Expense 46,156 40,757 49,870 58,527 61,463
Operating Income 55,084 42,871 50,656 60,160 61,035