· web viewibm analytics win/linux/ osx r/python hadoop ibm watson n/a multiple n/a microsoft...
TRANSCRIPT

This publication arises from the ACT@Scale (Advancing Care Coordination and Telehealth deployment at Scale) Programme which has received funding from the European Union, in the framework of the Health Programme under grant agreement 709770. The ACT@Scale programme is fully aligned with the European Innovation Partnership in Active and Healthy Ageing objectives to deploy integrated care for
Deliverable D4.1
Evaluation Engine ArchitectureArchitecture to analyse and monitor scaling-up for integrated care programs
ACT@ScaleAdvancing Care Coordination
and Telehealth @ Scale

Evaluation Engine Architecture
Document InformationPROJECT ACRONYM: ACT@ScaleCONTRACT NUMBER: 709770DISSEMINATION LEVEL: Confidential / Public / RestrictedNATURE OF DOCUMENT: Report
TITLE OF DOCUMENT: Evaluation Engine ArchitectureREFERENCE NUMBER: D4.1WORKPACKAGE CONTRIBUTING TO THE DOCUMENT:
WP4
VERSION: V0.5EXPECTED DELIVERY DATE: 05/08/2016DATE: 5 August 2016AUTHORS (name and organization): H. Schonenberg (PEN), I. Chouvarda
(AUTH), D. Filos (AUTH), V. Gaveikaite (PEN), R. van der Heijden (PEN), K. Lourida (AUTH), N. Maglaveras (AUTH), S. Pauws (PEN),
Short description of the Deliverable:Work package 4 (WP4) contributes to the transfer of good practices and data analytics in the ACT@Scale project. For this purpose an evaluation framework for scaling up integrated care programs was developed that defines the required indicators for scaling-up and for the evaluation of program specific goals. The requirements for an evaluation that can collect, store, analyse and monitor the integrated care programs in the regions were collected and related work was consulted to propose an initial architecture for the evaluation engine. Results are presented in this deliverable (D4.1).
REVISION HISTORYREVISION DATE COMMENTS AUTHOR (NAME AND
ORGANISATION)V0.1 03/06/2016 Draft of the skeleton Helen Schonenberg (PEN)V0.2 14/06/2016 First content added in multiple Helen Schonenberg (PEN)
Public Page 2 of 59 V0./5 August 201
Evaluation Engine Architecture
sectionsV0.3 27/06/2016 Review iteration Dimitris Filos (AUTH)V0.4 29/07/2016 Draft for consortium review Helen Schonenberg (PEN)V0.5 05/08/2016 Final version for EU Helen Schonenberg (PEN)
Public Page 3 of 59 V0./5 August 201

Evaluation Engine Architecture
Executive SummaryAims and objectives
The specific objective of Workpackage 4 (WP4) is to engage the consortium (and collaborating) regions in collecting the relevant data to measure experience, status, progress and success of scaling-up integrated care delivery.
The outcome of WP4 is an evaluation framework for all data collected in the ACT@Scale and an evaluation engine that supports the collections, storage and analysis of the data and monitors the programs during the project. The engine provides access to good practices to facilitate knowledge transfers between programs.
MethodsThe Evaluation Framework was designed based on (1) experience – the purpose and availability of data collected for the ACT project, (2) practice – the current data and collected in the programs and the priorities and goals, and (3) evidence –literature on assessment of integrated care programs, telehealth and healthcare. Stakeholder input from the weekly telcos and additional sessions with the individual regions was used to construct an initial set of requirements for the evaluation engine. A study of related work was performed to investigate state-of-the-art solutions and existing tools for the evaluation engine.
ResultsThe Evaluation Framework reflects the Donabedian structure of process-structure-outcomes. This framework not only addresses general scaling-up outcomes from the perspective of the IHI triple aim, but also supports the programs specific objectives and more general cluster outcomes for related programs. Furthermore we have defined an initial set of requirements and architecture proposal that will be used to start AGILE development of the evaluation engine. Following the AGILE methodology, the requirements and architecture will be further refined during the project.
Public Page 4 of 59 V0./5 August 201

Evaluation Engine Architecture
ContentDocument Information................................................................................................2Executive Summary...................................................................................................4Introduction................................................................................................................6
Background.............................................................................................................6Problem Statement.................................................................................................8Methodology..........................................................................................................10Document Structure..............................................................................................10
Evaluation Framework..............................................................................................11Adjustment Variables............................................................................................12Data Collection Summary......................................................................................13Scaling-Up Outcomes............................................................................................14Process Outcomes.................................................................................................16Limitations.............................................................................................................16
Requirements...........................................................................................................17Business requirements..........................................................................................17User requirements.................................................................................................19System requirements............................................................................................22Assumptions..........................................................................................................31
Related Work............................................................................................................32Related projects....................................................................................................32Off-The-Shelf Tools................................................................................................36State of the Art Solutions......................................................................................44
Logical Architecture (proposal).................................................................................53Conclusions and Future Work...................................................................................56
Future work...........................................................................................................56References...............................................................................................................58
Public Page 5 of 59 V0./5 August 201

Evaluation Engine Architecture
IntroductionPopulation aging is a very modern phenomenon that is redefining the modern healthcare in terms of its structures, processes and outcomes. The result of a globally increasing life expectancy and/or decreasing birth rates is a gradual increase in the senior (>60s) population, which is currently highest in human history. Aging population brings new challenges to the healthcare systems [1], which have traditionally focused on infectious and acute conditions. A typical disease profile brings a combination of chronic and degenerative diseases [2, 3], which cause a great financial burden to existing primary and secondary care structures. This is one of the main reasons for recent changes in healthcare systems (UK, US, Europe), which aim to make healthcare more sustainable [4, 5, 6].
Arguably, Healthcare is one of the most complex fields and is inherently heterogeneous. The need to deliver the best possible care means a high degree of specialization, which in turn leads to complicated communications between different care structures [7]. As a patient receives care throughout the disease course, the different stakeholders usually act independently with little communication. This naturally leads to discontinuous and inefficient processes. Changing healthcare business practices in a way, which would lead to a more cohesive and patient-centric infrastructure is the definition of integrated care. Although the concept is quite old, it has been highly impractical to implement until the recent rise and adoption information technology in healthcare [8, 9].
The greatest challenge is to move on from experiments to routine care, engaging healthcare organisations in implementing the changes associated with integrated care delivery. Healthcare regions are investigating how best to incorporate integrated services into their care delivery, and how to scale them up, making them part of routine practice. “Scaling-up” encompasses making the services sustainable, providing them to entire populations or cohorts of patients, and engaging patients and practitioners.
BackgroundDespite the rapid rise and adoption of information technologies in most sectors, healthcare innovation has been struggling to establish new products [10]. At the heart of most problems is again the complexity of the healthcare sector, tight regulation and a lack of standardised platforms [11]. Most of the innovation in the sector has focused on addressing these problems, by focusing on evidence based approaches, creating more standardised data management techniques and improving communication between the stakeholders and the public [12]. Virtually all new products had a modern data technology aspect, including better data
Public Page 6 of 59 V0./5 August 201

Evaluation Engine Architecture
collection (wearables, interned of things devices, telehealth devices), better data management (EHR systems, improved analytics) as well as better communication among stakeholders (financial data analytics, clinical trial innovations) and the public (online appointment booking, AI healthcare information assistants). All of the successful technologies had in common the successful execution towards the goal of improving patient care, sometimes without directly serving patient needs, but rather improving the overall financial or operational efficiency. The key feature of a successful product launch was the feedback about the adoption of the product as well as evaluating patient outcomes or technology impact on a social level [13]. This was the most difficult and time consuming part, as collecting trial data or stakeholder feedback takes considerable resources.
Process evaluation and health technology assessment are some of the most complex and important tasks required for designing new products. The effectiveness of new technologies usually relies on successful implementation, which is highly dependent on the insight into the unknown sequence of events, through which patients are affected by the interventions [14, 15]. Process evaluation requires measurement instruments, that are both sensitive and specific to the interventions in question [16]. The two main types of collected data comprise of health outcomes and economic evaluation. Health outcome monitoring is designed to determine whether the intervention has achieved the intended effects on processes and outcome indicators in the intermediate (lifestyle, behaviour) and final stages (clinical parameters, quality of life, care utilization and patient experience. Economic evaluation on the other hand focuses on the cost-effectiveness, which is an important component in clinical decision making. Economic instruments focus on measuring the total cost of care, including development, utilization and healthcare implementation, including financing and reimbursement.
Perhaps the largest recent advance in data driven technologies came from the creation and spread of distributed data storage and processing solutions. This redefined the way we deal with and act upon the increasing amounts of information. Distributed processing is relatively uncommon in healthcare, simply because traditional data sources (trials, health records) are structured and have a very high density of information. This means that most variables hold relevant information because of experiment design and data is stored in a tabular format, where big data solutions offer little advantage for standard databases. However, as healthcare undergoes a transformation data mining becomes an important aspect for unconventional sources, such as EHRs, wearable activity trackers and devices [17], medical transaction data [18], and publicly available sources, such as social media [19]. Big data techniques are particularly relevant for low information density sources generating data with time, as high rates of data collection quickly accumulate large volumes. Such data sources are particularly useful for inductive
Public Page 7 of 59 V0./5 August 201
Evaluation Engine Architecture
statistics, which makes it possible to infer causation and test hypotheses. Generally, when looking at retrospectively designed studies, Big Data approaches only add unnecessary complexity, however they are a must, when looking at low information density, unstructured sources, such as tracker, wearable, transaction or social data. Big data approaches hold a great promise in these traditionally low information density areas.
The Advancing Care Coordination & TeleHealth (ACT) programme ran as a project within the 2nd Health Programme (2013-2015). This project identified best practice and enabled healthcare regions to monitor progress of their Care Coordination & Telehealth (CC&TH) deployment via reliable high-quality data. The ACT programme delivered a holistic approach for the quantitative and qualitative evaluation of CC&TH programs, evaluating the performance of those programs and the organisational drivers affecting the performance, i.e. risk stratification, workflow and organisation optimisation, staff engagement and patient adherence. This holistic framework was implemented in an evaluation engine that collected, stored and analysed the data. Data availability and data homogeneity were the biggest challenge for the evaluation. Due to data sharing limitations, only population-level outcomes data were included in the engine. Patient-level data should remain locally, within the region and a new approach is needed to perform case-mix adjustments for better comparison between the programs and/or regions.
Problem StatementEngage consortium (and collaborating) regions in collating relevant data for the scaling-up process, structure and outcomes that describe and measure experience, status, progress and success of scaling-up integrated care delivery.
WP4 Contribution (bold) to ACT@Scale Objectives:
- Scaling-up healthcare CC&TH programmes.- Transferability of good practices for scaling-up- Develop and validate a structured methodology (PDSA) for assessment,
benchmarking, and exchange of good practices of scaling-up integrated CC & TH delivery
- Engage consortium (and collaborating) regions in collating relevant data for both survey and outcome indicator use in measuring experience, status, progress and success of scaling-up integrated care delivery
- Achieve an appropriate level of support and commitment from the stakeholders to innovative health services, specifically care coordination and telehealth
- Achieve an appropriate level of distribution of health and care resources defined by the dynamic needs of the patients and populations addressed
Public Page 8 of 59 V0./5 August 201

Evaluation Engine Architecture
- To deliver at least equal quality of care at lower costs and / or with fewer personnel.
- Empowering citizens of the network of users / citizens on scaling-up
ACT@Scale will harness the ACT evaluation framework, and ACT evaluation engine, and extends its functionality from assessment tool to decision making tool, enabling the management of the scaling-up process. The engine will be extended from population-level data to patient-level data, allowing case-mix adjustment and patient tracking, while the patient data remains in the regions. Challenges to be addressed by the distributed engine include:
- Confidentiality- Protection of personal data- Evaluation of the results within the region- Share results / outcomes with other partners- Data shielded, restricted for patient-level data to comply
o Legislationo Ethical issueso Data ownershipo control
To support transferability of good practices for scaling-up, the engine will support:
- Visualisation of process and maturity progress - Structuring knowledge to lead to better decision making - Benchmarking and guiding resolutions with optimised indicators / score
boards
MethodologyData will be collected in three iterations (in month 6, 8 and 30) for all consortium agreed indicators measuring experience, status, progress and success of scaling-up integrated CC&TH care delivery. Data is collected, stored and analysed by the engine.
ACT@Scale is a project where the requirements are not known in advance and will evolve during the project. In such a project it is important to be able to cope with changing requirements. Agile software development facilitate adaptive planning, evolutionary development, early delivery, and continuous improvement. This requires strong involvement of all consortium partners during the entire project.
Public Page 9 of 59 V0./5 August 201

Evaluation Engine Architecture
Document Structure In the first chapter, we describe the ACT@Scale Evaluation Framework. This framework captures the classical Donabedian structure, process, outcomes indicators and captures the IHI triple aim outcomes, focused on indicators for scaling-up integrated care programs. The evaluation of these indicators will be automated by an evaluation engine. In the Requirements chapter, we describe the characteristics, qualities, constraints and assumptions for the evaluation engine. In Related Work we elaborate on the state-of-the-art methodologies and solutions currently available which lead to a proposal of a Logical Architecture described in the next chapter. Finally, we present Conclusions & Future Work in the final chapter of this report.
Public Page 10 of 59 V0./5 August 201

Evaluation Engine Architecture
Evaluation FrameworkThis chapter describes the evaluation framework created by the ACT@Scale consortium to be used for the evaluation of scaling-up of integrated care programs for the baseline assessment and for the two iterations.
The framework (see Figure 1) follows the classical conceptual Donabedian process-structure-outcome framework for examining health services and evaluating healthcare [20, 21]. The Donabedian framework allows us to track differences and changes in the process and structure, while monitoring the outcomes. Structure changes may occur during the ACT@Scale and are not triggered by the programme, e.g. changes in financial streams, whereas process changes are initiated by the programs during ACT@Scale in one or more of the following areas (1) citizen empowerment, (2) service selection, (3) change and stakeholder management, and (4) business models.
The structure indicators describe the context in which care is delivered (e.g. buildings, staff, financing and equipment). The structure data is part of our knowledge base that we can use to report programs with a similar structure.
The process indicators describe the transactions between stakeholders in the care delivery process. These will be affected by the PSDA1 cycles the program participates in to improve in one of the 4 before mentioned areas. These indicators track what changes have been made by the programs during these iterations.
Outcomes for scaling-up integrated care programs are defined at multiple levels. At the highest level the framework describes general outcomes, applicable across all programs. These outcomes follow the IHI triple aim and focus on the experience of care, health of the population and per capita cost, all in the context of scaling-up integrated care programs.
On the next level, cluster-specific outcomes are specified. In each cluster the goals of related programs are specified. These are the outcomes that are known to be relevant for a specific patient population, e.g., COPD patients. These indicators to be collected are derived from the literature and provided by the domain experts in the ACT@Scale consortium.
Finally, at the lowest level, outcomes are defined for program specific goals. Each program may have their own objectives that they want to monitor and evaluate during ACT@Scale.
1 Plan-Do-Check-Act
Public Page 11 of 59 V0./5 August 201

Evaluation Engine Architecture
Input from the regions and programs will be requested once a year (3 times).
Figure 1 ACT@Scale Evaluation Framework for the evaluation of scaling-up of integrated care programs.
Adjustment VariablesCase mix adjustment refers to the use of statistical procedures to permit comparison of treatment outcomes between providers with differing mix of patients with regard to diagnoses, severity of illness, and other variables associated with the probability of improvement with treatment. Not all the required data is available in the information systems, hence some data will be collected in the surveys to be deployed to the patients. We will collect the following adjustment variables:
Age (Information system) Gender (Information system) Marital status (Survey) Education level (Survey)
Public Page 12 of 59 V0./5 August 201

Evaluation Engine Architecture
Data Collection SummaryFigure 2 provides an overview of the data collection for the general scaling outcomes, the process indicators and the adjustment variables. Cluster variables, program-specific variables and structure outcomes are not presented in this overview.
Data input Topic Type Target for surveysScaling-up: Experience of Care
Healthcare Consumer Assessment
NPS survey Patients
Psycho social PAM included in MAY survey
Patients
Scaling-up: Health of a population
Scaling data: Population
Population indicators
Scaling data: Individual
Individual indicators
Disease burden: Population
Population indicators
Scaling-up: Per capita costs
Population Population indicators
Individual Individual indicators
Adjustment variables
Individual Individual indicators
Individual per survey
Individual indicators collected in survey
Patients
WP5: Stakeholder and Change Management
Stakeholder management
ACT@Scale survey Manager/researcher
Change management
ACT@Scale survey Manager/researcher
Staff Engagement ACT@Scale survey Manager/researcherACT@Scale survey Frontline staff
WP6: Service Selection
Service selection ACT@Scale survey Manager/researcher
WP7: Sustainability and Business models
Sustainability ACT@Scale survey Manager/researcher
WP8: Citizen empowerment
Psycho social Rest or MAY survey PatientsPsycho social CSPAM survey Frontline staff
Figure 2 Data collection overview.
Cluster variables will be defined based on literature study. The program-specific variables will be provided by the programs and the structure variables can be defined from the information provided by the regions and does not require a data collection as such.
Public Page 13 of 59 V0./5 August 201

Evaluation Engine Architecture
Scaling-Up OutcomesExperience of careWe evaluate three aspects of experience of care
1. Health care consumer assessment Survey: NPS (Net Promotor Score) Measures: Customer satisfaction Reference: https://www.surveymonkey.co.uk/mp/net-promoter-score/
2. Psycho-social elements Survey: MAY (More About You) Measures:
Patient Activation Measure (PAM), disease impact, comfort with technology, social support, self-care behaviours and communication style
Reference: https://digisemas-staging.ehv.campus.philips.com/demo/may_en_20_18
3. Non-patient surveys Survey: CSPAM Measures: how far clinicians value people’s role in the care process Reference:
https://www.england.nhs.uk/wp-content/uploads/2015/11/cspam-report.pdf
Health of PopulationWe measure 2 aspects of population health
1. Scaling data2. Disease burden
Scaling-data
Population Population size size of the population in the region Population stratified number of people stratified by the tool Population per risk stratum number of people per risk stratum Target population number of people identified for the program Population served number of people served by the program Population diagnosed number of people diagnosed with target disease
Public Page 14 of 59 V0./5 August 201

Evaluation Engine Architecture
Individual Diagnosis per patient (for adjustment) Status in the program (selected/active/out)
o Reasons for out (death/normal ending/interruption Physician/interruption patient/other)
Disease burden
Population Incidence to estimate future scaling targets Prevalence to check with stratification outcomes, or instead of stratification
outcomes (if no tool used)
Per Capita CostIn per capita cost, we consider 2 aspect
1. Total cost2. Unit cost and utilisation
Total cost
Population cost per program total cost of the program cost per user average cost per user
Unit cost and utilisation
IndividualPer user (cost and use) of yearly2:
primary Home visit primary Primary care GP visit primary Nurse visit secondary ED visit secondary Specialist visit outpatient Outpatient visit
2 Per calendar year.
Public Page 15 of 59 V0./5 August 201

Evaluation Engine Architecture
secondary Admissions secondary Readmissions (30 days) secondary Hospitalization – average secondary Hospitalization – day community Community care –Referrals Community Home visit
Process OutcomesProcess status and changes are measured by the workpackage by surveys. This is the list of surveys that will be deployed to measure the process outcomes
[WP5] Stakeholder management (ACT@Scale) [WP5] Change management (ACT@Scale) [WP5] Staff engagement (ACT@Scale) [WP6] Service selection (ACT@Scale) [WP7] Sustainability (ACT@Scale) [WP8] Patient activation measure (PAM/MAY) [WP8] Clinician activation measure (CSPAM)
More details for these surveys can be found in the deliverables of the associated work packages.
LimitationsFollow-up time of the indicators may be too short for Health system intervention, actual results may take longer or the effects are attributable to changes in the structure.
RequirementsBased on stakeholder input, we have defined an initial set of requirements for the evaluation engine. A requirement is a condition or capability needed by the stakeholder to solve a problem or achieve an objective3. Business requirements describe the business benefits, high level objectives and the scope of the project. User requirements describe what the users will do with the product. Finally, the system requirements describe the features and the environment. Here, the functional requirements define what behaviour the product is supposed to have, whereas non-functional requirements define the qualities the product is supposed to 3 IEEE Std. 1233, 1998 Edition
Public Page 16 of 59 V0./5 August 201

Evaluation Engine Architecture
have. Constraints define boundaries and limitations of the system (business, technical, financial).
As stated above, this set of requirements is an initial set of requirements that will be used to start Agile development of the evaluation engine. Based on short iterations of the evaluation engine, stakeholders in the consortium provide feedback to refine and adjust the requirements and implementation during the course of the project. The purpose of this chapter was to have an initial understanding of the purpose of the engine, the users, and the requirements and constraints the regions have for the evaluation engine. This document
Business requirementsThe benefits of the evaluation engine are to:
- Provide monitoring and analysis of scaling-up integrated care programs in regions that do not have direct access to their data.
- Standardize monitoring and analysis of scaling-up integrated care programs in regions do have direct access to their data.
- Share knowledge of scaling-up integrated care between integrated care programs and regions.
- Share information on outcomes of integrated care programs with other stakeholders such as policy makers for decision making.
That leads to the following mission statement:
“The evaluation engine is a platform to identify best practices in scaling-up integrated care programs”
StakeholdersThe full list of stakeholders related to the evaluation is presented in Table 1. The identified main users of the distributed evaluation engine are:- Primary users: program managers, consortium members- Secondary user: policy makers.Table 1 Stakeholders.
Stakeholder Example Engine purpose / analysis goalsProgram / Region manager
Primary
General managers Program managers Telehealth service
managers Local project
To learn from other regions, e.g. check performance of the program(s) to learn from others and see how things are organized in the different programs- Relative comparison (similar programs
Public Page 17 of 59 V0./5 August 201

Evaluation Engine Architecture
managers Integrated care
organizations
outside region)- Internal comparison (similar programs in the
region)- Present data to disseminate program results
to stakeholders (management, project managers, payers, ...)
Consortium members
Primary
WP leaders Project manager
To extract data to perform data analysis
To review the engine results
Policy makers
Secondary
AQUAS Local government
To benchmark the different care providers (microsystems)
To evaluate the healthcare system outcomes on performance and/or program targets
Payers Department of health
Insurance companies
To investigate the costs and performance of the programs
Note: try to engage in future discussionsHealthcare Professionals
Doctors Nurses
To monitor clinical outcomes
This stakeholder group is relevant for input for the collaborative methods. Most regions did not see this stakeholder an end user for the evaluation engine.
Technology / Service Providers
Industry To improve service or technology
To provide consultancy on appropriate deployment of the service or technology
Regional data manager
Regional data manager
ICT department (BAS)
To populate the local ACT database from data from the regional systems (technical task)
Data quality management
Information system department (BAS)
UGS (BAS)
To validate the extraction and results (non-technical, clinical validation task)
Developers Developers (consortium)
IT department (region)
To develop the evaluation engine and deploy the engine in the region
Data auditing
Out of scope To review confidentiality, privacy, …
Currently there are no procedures for auditing of systems such as the evaluation engine the monitor the integrated care programs. Currently out of scope.
Patients Out of scope To review published indicators on the web (Transparency)
Currently out of scope. In the future we can consider publishing static results on the outcomes on the webpage.
Public Page 18 of 59 V0./5 August 201

Evaluation Engine Architecture
Peers (family)
Out of scope See patients
General public
Out of scope See patients
User requirements Table 2 summarizes the users (actors) of the distributed evaluation engine, what their roles is and how the engine can help them support this goal. The final column represents the prioritization in the MoSCoW method for the first iterations. Where the categories are defined as:
- Must have (M) – critical requirement for the current delivery- Should have (S) – important but not necessary requirement for the current
delivery. - Could have (C) – desirable but not important requirement for the current
delivery. - Won’t have (W) – least relevant, least critical, and/or inappropriate requirement
for the current delivery.
In Agile development, we expect the list of user requirements to grow over time, e.g. inclusion of analysis and a knowledge base. During the project we keep a backlog of the user stories that have been identified that will be prioritized for each sprint. In the table we list the user requirements currently available and the prioritization for the first implementation sprint(s).
Table 2 Business use cases as defined Aug 2016.4
Id Actors Role Goals MoSCoW
a1 Program / Region managers
Data visualization and outcomes / conclusions.
Comparing outcomes of different regions / programs
Scaling up of running programs
Getting insights of how their program or region is doing compared with other programs / regions.
Must have (3)
a2 Researchers / data analysts (outside consortium)
Data visualization and outcomes.
Comparing outcomes of different regions / programs
Getting insights of different programs and regions compared.
Won’t have
4 The user requirements marked (W) have not been considered in the remainder of this chapter.
Public Page 19 of 59 V0./5 August 201

Evaluation Engine Architecture
Getting outcomes to see how programs and/or regions can scale up.
a3 Regional data providers
A way to provide anonymized data to feed the system based on the minimum dataset.
Make sure that the right data is available to let the researchers do their analysis.
Must have (1)
a4 Regional data quality management
Data visualization and reporting (Only for the region itself).
Data validation Must have (2)
a5 Policy makers Comparing outcomes of different regions / programs
Formulate outcomes for performance
Should have
a6 Payers Comparing outcomes of different regions / programs
Using the data for own purposes
Formulate outcomes for performance
Getting insights of how their program or region is doing
Performance reporting
Could have
a7 Consortium members
Data visualization and outcomes / conclusions.
Analysis execution Data access /
download Algorithm
implementation (dedicated member(s))
Getting insights of different programs and regions compared.
Getting outcomes to see how programs and/or regions can scale up.
Must have (1)
a8 Healthcare professionals
Clinical outcome data report
Improve quality of care
Won’t have
a9 Patient, family, General public
Program quality report
Decision to participate
Form a general opinion
Won’t have
a10
Technology / Service provider
Monitoring the service / usage
Adjust service delivery in case of bad performance
Performance reporting
Could have
a11
Region employee (appointed by region manager)
Sending surveys to patients
Performs analysis on patient data
Monitoring mental health
Guarantee patients privacy
Must have
Public Page 20 of 59 V0./5 August 201
Evaluation Engine Architecture
System requirementsIn this chapter we elaborate on prioritise user requirements from the previous section and describe the requirements at a system level. We describe the processing inputs and outputs for the system. What the system does (functional requirements) and how well the system does it (non-functional requirements) and the constraints identified by the stakeholders.
Functional requirementsTable 3 describes the business events, by which actor (see Table 2) they are triggered and what input and output the system should process. The business events have been prioritized to support data collections, storage and analysis for the baseline assessment.
Public Page 21 of 59 V0./5 August 201

Evaluation Engine Architecture
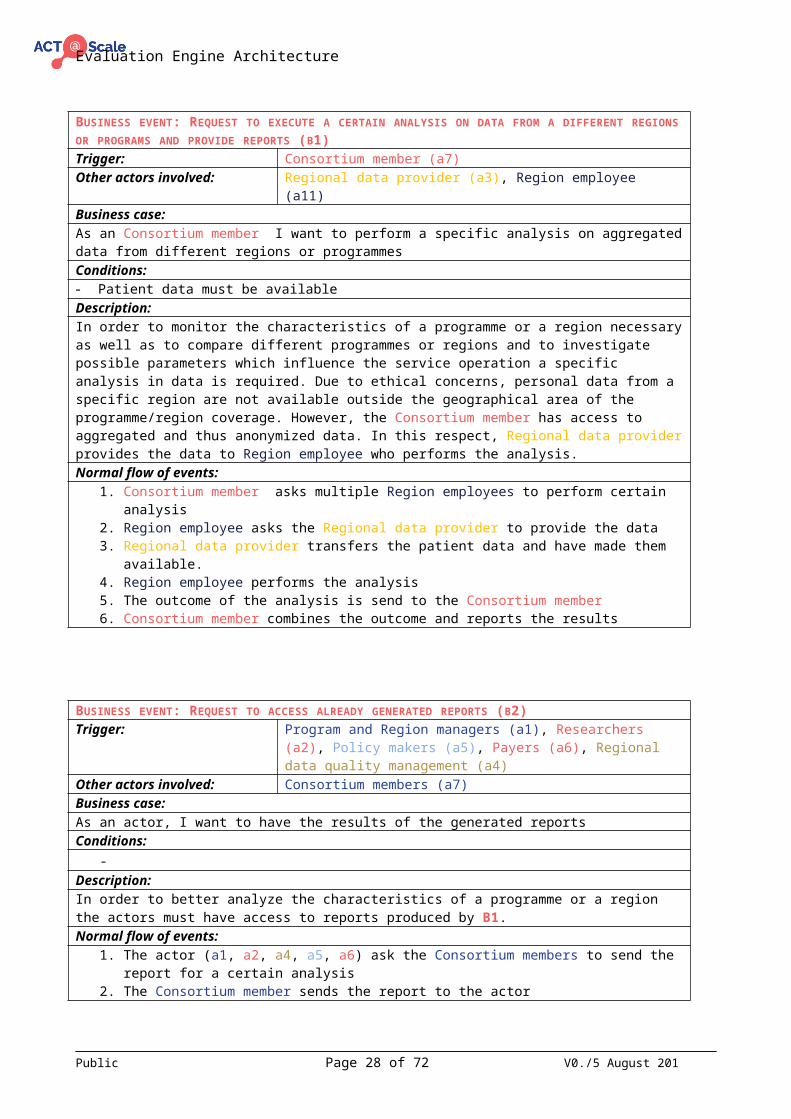
Table 3 Business events as defined Aug 2016. 5
ID Business event Triggered by Input Outputb1 Request to execute a certain analysis on
data from a different region or program and provide reports
Consortium members (a7) Request to execute an already existing analysis by providing certain parameters (e.g. sex and/or age category).
Outcome data or report for specific analysis call depended of the request.
b2 Request to access already generated reports
Consortium members (a7) Program and Region managers (a1) Researchers (a2) Policy makers (a5) Payers (a6) Regional data quality management
(a4)
Request to access an already generated report by defining the date parameter
Report generated on the requested date
b3 Request to execute a certain analysis on local data and provide reports
Program and Region managers (a1) Request to execute an already existing analysis by providing certain parameters (e.g. sex and/or age category).
Outcome data or report for specific analysis call depended of the request.
b7 Providing anonymous patient data locally used for analysis
Regional data providers (a3) Local data systems
Providing anonymousPatient data that is defined in the minimal dataset.
Feedback that the data is correctly received and in the right format.
b8 Request to access the local anonymized patient data to check for data integrity
Regional data quality management (a4)
Request to access anonymized patient data from the programme/region by
Anonymized data in format to be defined.
b9 Providing algorithms for data analysis Consortium members (a7) Files/algorithms allowing programmes/region to do analysis
Message that the algorithms are correctly received
b11 Invite actors to participate in survey Consortium members (a7) Region employee (a11)
Survey Questionnaire results
5 Note that some of the IDs are missing in the table. These events were similar to events presented in this table and have been merged.
Public Page 22 of 59 V0./5 August 201

Evaluation Engine Architecture
BUSINESS EVENT: REQUEST TO EXECUTE A CERTAIN ANALYSIS ON DATA FROM A DIFFERENT REGIONS OR PROGRAMS AND PROVIDE REPORTS (B1)Trigger: Consortium member (a7)Other actors involved: Regional data provider (a3), Region employee (a11)Business case:As an Consortium member I want to perform a specific analysis on aggregated data from different regions or programmesConditions:- Patient data must be availableDescription:In order to monitor the characteristics of a programme or a region necessary as well as to compare different programmes or regions and to investigate possible parameters which influence the service operation a specific analysis in data is required. Due to ethical concerns, personal data from a specific region are not available outside the geographical area of the programme/region coverage. However, the Consortium member has access to aggregated and thus anonymized data. In this respect, Regional data provider provides the data to Region employee who performs the analysis.Normal flow of events:
1. Consortium member asks multiple Region employees to perform certain analysis2. Region employee asks the Regional data provider to provide the data3. Regional data provider transfers the patient data and have made them available.4. Region employee performs the analysis5. The outcome of the analysis is send to the Consortium member6. Consortium member combines the outcome and reports the results
BUSINESS EVENT: REQUEST TO ACCESS ALREADY GENERATED REPORTS (B2)Trigger: Program and Region managers (a1), Researchers (a2),
Policy makers (a5), Payers (a6), Regional data quality management (a4)
Other actors involved: Consortium members (a7)Business case:As an actor, I want to have the results of the generated reportsConditions:
-Description:In order to better analyze the characteristics of a programme or a region the actors must have access to reports produced by B1.Normal flow of events:
1. The actor (a1, a2, a4, a5, a6) ask the Consortium members to send the report for a certain analysis
2. The Consortium member sends the report to the actorAlternative flow:
1. The actor (a1, a2, a4, a5, a6) ask the Consortium members to send the report for a certain analysis
2. Consortium member triggers B13. Consortium member sends the report to the actor (a1, a2, a4, a5, a6)
BUSINESS EVENT: REQUEST TO EXECUTE A CERTAIN ANALYSIS ON LOCAL DATA AND PROVIDE REPORTS (B3)
Public Page 23 of 59 V0./5 August 201

Evaluation Engine Architecture
Trigger: Program and Region managers (a1)Other actors involved: Regional data provider (a3), Consortium members(a7)Business case:Request to execute an already existing analysis by providing certain parameters (e.g. sex and/or age category)Conditions:- Local data must be availableDescription:In order to monitor the characteristics of a programme or a region and to investigate possible parameters which influence the service operation a specific analysis in data is necessary. Program and Region managers have access to patient level, anonymized data. Regional data provider makes the data available. The data are obtained by the use of specific questionnaires as well as information form the EHR. Program and Region managers have access to a platform provided by Consortium members.Normal flow of events:
1. Regional data provider makes the data available.2. Consortium member provides the url with the analysis platform.3. Program and Region managers access the platform by using username/password
already provided to him.4. Program and Region managers selects the parameters in order define the data to
be analyzed.5. The platform access the data and make them available for analysis.6. The platform provides visual representation of the results.7. Program and Region managers selects the analysis results to be included into the
report.8. The platform makes the report available for download. The report includes a
section with all the necessary information related to the analysis made.
BUSINESS EVENT: PROVIDING ANONYMOUS PATIENT DATA LOCALLY USED FOR ANALYSIS (B7)Trigger: Regional data provider (a3)Other actors involved: Program and Region managers (a1)Business case:Providing anonymous patient data that is defined in the minimal dataset.Conditions:- Data from the questionnaires must be available- Data from EHR must be availableDescription:The Program and Region managers must be able to perform an analysis on data derived from the region/programme. In this respect Regional data provider must make the data available for analysis. The data are obtained by the use of specific questionnaires as well as information form the EHR.Normal flow of events:
1. Regional data provider access the data from the questionnaires and the EHR.2. Regional data provider applies a anonymization procedure3. Regional data provider transfers the data to the local system4. Feedback that the data is correctly received and in the right format.5. Program and Region managers can access the data.
Public Page 24 of 59 V0./5 August 201
Evaluation Engine Architecture
REQUEST TO ACCESS THE LOCAL ANONYMIZED PATIENT DATA TO CHECK FOR DATA INTEGRITY (B8)Trigger: Regional data quality management (a4)Other actors involved: Region employee (a11)Business case:As a Regional data quality manager I want to ask the Region employee to provide the outcomes for comparing data integrity.Conditions:- Outcome data has already been generated before this business event is triggered.Description:To check the integrity for data used for analysis by comparing outcomes results generated by the regions themselves.Normal flow of events:
1. Regional data quality manager asks the Region employee to send over outcomes of already executed analysis.
2. Regional data quality compares outcomes with results generated by regions themselves.
PROVIDING ALGORITHMS FOR DATA ANALYSIS (B9)Trigger: Consortium members (a7)Other actors involved: Regional data quality management (a4), Region employee
(a11)Business case:As a Consortium member I want to send created algorithm to the Region employee for future execution.Conditions:
-Description:A created algorithm will be send to multiple regions in order to prepare regions to do analysis on regional patient data. This data should stay on location at all times. Only aggregated outcomes will be shared.Normal flow of events:
1. Consortium member creates or updates an algorithm to be used by Region employees within multiple regions.
2. Consortium member sends algorithm to the Region employees.3. Region employee runs a check on the algorithm to be checked by the Regional
data quality manager.4. Region employee stores the algorithm for future use.
Public Page 25 of 59 V0./5 August 201

Evaluation Engine Architecture
BUSINESS EVENT: INVITE ACTORS TO PARTICIPATE IN SURVEY (B11)Trigger: Consortium member (a7)Other actors involved: Region employee (a11), Patient (a9)Business case:As a Consortium member I want to ask a Region employee to send existing surveys to a group of Patient(s).Conditions:- A survey tool will be used. (Which will create uniquely identifiable surveys)Description:To monitor mental health of patients there’s a need for surveys. Due to patient privacy a Consortium member could not directly invite patients from different regions to fill in a survey. A Region employee will be asked to send surveys to their patients. The surveys will be provided by a Consortium member.Normal flow of events:
1. Consortium member prepares unique links (URLS) to questionnaire for each patient. (Store which group / region received which unique surveys)
2. Consortium member sends links to each regions Region employee.3. Region employee maps unique link to each patient and keeps track. (Links unique
survey to unique person and stores the link secretly and secure)4. Region employee sends questionnaire links (URLS) to corresponding patient(s).5. Patient fills in corresponding questionnaire.6. Consortium member can see questionnaire results filled in by patient(s).
Non-functional requirementsNon-functional requirements are product properties that describe the experience of the user while working with the system. We use a user-focused classification of the non-functional requirements. These are split into:
1. Operation - How well does the system operate for daily use by the user? 2. Revision - How easy is it to correct errors and add functions?3. Transition - How easy is it to adapt to changes in the technical
environment?
The full set of the non-functional requirements are depicted in . During the project, these requirements will become more important for the product. Initially, we need the product to collect survey data from the regions for the baseline assessment. For this purpose, we will define requirements for (1) access security, (2) integrity, (3) verifiability, and (4) interoperability.
Access securityThe extent to which the system is safeguarded against deliberate and intrusive faults from internal and external sources. Only consortium members are allowed to access the product.
Public Page 26 of 59 V0./5 August 201

Evaluation Engine Architecture
IntegrityThe degree to which the data maintained by the software system are accurate, authentic, and without corruption. Data collected and stored by the product should be tested and results should checked with the regions.
VerifiabilityThe extent to which tests, analysis, and demonstrations are needed to prove that the software system will function as intended. The product is fully tested and can be demonstrated to the consortium to demonstrate correctness.
InteroperabilityThe extent to which the software system is able to couple or facilitate the interface with other systems. The product should within the IT environment in the regions.
Table 4 Overview of non-functional requirements..
NF ID User concern Non FunctionalOperationNF_OPS_01 How well is it safeguarded against unauthorized
access?Access Security
NF_OPS_02 How dependable is it during normal operating times?
Availability
NF_OPS_03 How fast, how well and how many does it respond?
Efficiency
NF_OPS_04 How accurate and how authentic is the data? IntegrityNF_OPS_05 How immune is the system to failure? ReliabilityNF_OPS_06 How resilient is the system to failure? SurvivabilityNF_OPS_07 How easy is it to learn and operate the system? UsabilityRevisionNF_REV_01 How easy is it to change and add new features? FlexibilityNF_REV_02 How easy is it to upkeep and repair the system? MaintainabilityNF_REV_03 How easy is it to expand or upgrade its
capabilities?Scalability
NF_REV_04 How easy is it to show it performs its functions? VerifiabilityTransitionNF_TRA_01 How easy is it to interface with other systems? InteroperabilityNF_TRA_02 How easy is it to transport? PortabilityNF_TRA_03 How easy is it to convert for use in another
system?Reusability
Public Page 27 of 59 V0./5 August 201
Evaluation Engine Architecture
ConstraintsTable 5 depicts the constraints on the evaluation engine, provided by the region stakeholders.Table 5 Constraints on the product.
ID Constraint MotivationC01 Analysis will be done on
anonymized data of individualsSevere limitation on population data; e.g. no possibilities to make adjustments
C02 Data should remain in the region Privacy; legislationsC03 (Copies of) the data cannot be
sent to the central engineSee above
C04 Central engine for querying, analysis and reporting
Knowledge transfer between regionsCentral access point for policy makers, payers
C05 Aggregated results can be sent to the central engine
Allows analysis and visualization across all participating programs; facilitates discussions and knowledge transfer
C06 Aggregated results can be stored in the central engine
Allows access to agreed analysis resultsEspecially relevant if there will be restrictions on the querying within the regions
C07 A local ACT database will be installed in the region that can be queried by the central engine
We need a unified database structure for the querying across all regions
C08 The local ACT database will contain the agreed minimum data set indicators and adjustment variables per program
Only data that is relevant for the project will be shared
C09 The data in de local ACT database is de-identified conform all applicable legislation
Only data that is agreement with local and international legislation is shared
C10 There is one ACT database per region for all programs
Reduce complexity of the system (design, implementation and maintenance)
DeploymentIn addition, the regions have provided constraints for deployment of the evaluation engine within their IT environment.
The Basque CountryThe Basque Country has a unique data warehouse, including business intelligence environment with Oracle Business Intelligence Oracle and it is complemented by R that is a free software environment for statistical computing and graphics. There are ETL tools supported by their technical staff. There is a list of official software suppliers
Public Page 28 of 59 V0./5 August 201

Evaluation Engine Architecture
accredited by OSAKIDETZA. Adding new solutions in the production environment is a very lengthy process. Nothing external can be introduced into the region production environment. The requirements and characteristics of the engine need to be checked with the ICT department to understand the condition, timing and possibilities. The distributed engine could perhaps be hosted in a lab (test) environment.
CataloniaIt is possible to set-up a Microsoft MySQL database in the IT infrastructure of Catalonia. Catalonia can support a definition of the local ACT database scheme and implement the mapping (ETL) from their data sources to the ACT database. There are statistical tools such as R and Stata running in this environment. They work with data from audited resources, the precise sources have to be identified.
Northern IrelandThe different providers provide an end-to-end solution that includes hosting and analysis of the data. There is no data at the organizational level. There are no procedures in place for data integration. Here we need to work with the providers. Data sharing is a requirement for future providers in Northern Ireland. The benefit of the distributed engine for Northern Ireland is the possibility to access and to analyse the data. For external querying, the distributed engine needs to be hosted in a separate environment.
Northern NetherlandsSimilar to Northern Ireland, there is no end-to-end solution in Northern Netherlands. Programs are offered by different providers. Northern Netherlands has appointed a dedicated resource to include the distributed engine in their environment.
Region of South DenmarkThe IT environment of the region of South Denmark is primarily Windows based. Similar to Northern Ireland, the end-to-end solution is different per system. The distributed engine needs to import the different inputs and file formats from the different systems. It is not clear yet who is able to perform the integration from the different systems. The region has a list of agreed supplies that operate under a framework contract. It is too early to discuss external querying and the validation process, the current set of requirements do not raise an alarm.
Public Page 29 of 59 V0./5 August 201

Evaluation Engine Architecture
AssumptionsFrom the discussions with the regions, we conclude this chapter with the assumptions for development of the distributed engine
- We can install a local ACT database in the region that hosts the patient data. There will be patient data on this database and a cloud-based solution is not acceptable.
- It is possible to query6 this local ACT database from a central engine.- The region is responsible7 for the transformation of local data in their systems to
the local ACT database for the minimum data set indicators including adjustment variables.
- Each region has a person (data manager) who populates the local ACT database.
Related WorkIn this chapter we describe work related to WP4 activities. This chapter describes similar projects, off-the-shelf tools for data collection and analysis, as well as state of the art solutions.
Related projectsWe identified projects related to ACT@Scale the projects addressing:
- Evaluation of similar8 integrated care programs/services,- Evaluation of connected health,- Knowledge sharing for scaling telehealth,- Monitoring and assessment frameworks for active healthy aging,- Health technology assessment for telemedicine,
6 Direct querying, request/approval7 WP4 can support in the transformation to the local ACT database but regions need to connect to their local databases and systems.
8 Clusters relevant to ACT@Scale, such as multimorbidity and independent living.
Public Page 30 of 59 V0./5 August 201

Evaluation Engine Architecture
- Evaluation of integrated care programs for multi-morbidity, impact and sustainable financial/payment schemes patient experience, health outcomes and cost, and/or
- Integrated care for elderly with multiple health and social needs, improvement design, assess improvements, share best practices
ENJECTThe European Network for the Joint Evaluation of Connected Health Technology (ENJECT9) project is a 4-years programme, founded by the European Cooperation in Science and Technology (COST). The ENJECT focus is on Connected Health defined as a new model for health management which “puts the correct information at the correct hands at correct time”. In this respect, it aims to develop a knowledge base and an evaluation framework.
ACTThe Advancing Care Coordination & Telehealth Deployment (ACT10) programme was an EU funded project which aimed to produce and distribute good practices for the successful deployment of the care coordination & telehealth (CC&TH) programmes for chronic conditions (chronic obstructive pulmonary diseases, diabetes, heart failure, as well as comorbidities). ACT uses a holistic framework for qualitative and quantitative evaluation of CC&TH deployment. It includes key performance indicators to evaluate the performance of CC&TH deployment and the drivers affecting the performance from the areas of risk stratification, workflow and organisational optimisation, staff engagement, and patient adherence. The framework is implemented in an evaluation engine for data collection, storage and analysis of CC&TH performance. Despite that the evaluation was based on population data, data availability and homogeneity were the biggest challenge in the evaluation. Individual patient data is needed to adjust for population differences between programs. These and other insights led to the ACT@Scale proposal.
MomentumMomentum11 is a recently completed project, which facilitates guidance for telemedicine practitioners to move telemedicine from pilot, to practice, to scale, sharing knowledge between experts including health authorities, eHealth competence centres, managers etc. The output of the project is a Blueprint [20] for telemedicine deployment which can be served as tool to scale up a telemedicine solution from idea or pilot to daily practice.
In the context of Momentum, a set of data were defined which were the basis of knowledge on which to build the work for each specific area such as (1) telemedicine 9 http://enject.eu/ 10 https://www.act-programme.eu/ 11 http://www.telemedicine-momentum.eu/
Public Page 31 of 59 V0./5 August 201

Evaluation Engine Architecture
strategy and management, (2) organizational implementation and change management, (3) legal, regulatory and security issues and (4) technical infrastructure and market relations. These data were collected using questionnaires which included open and closed questions. After the completion of the surveys, the data were analysed and specific workshops were organized in order to discuss the critical success factors for large scale telemedicine deployment. The findings of the project were used for the creation of the Blueprint which distils the key learning from the project and it can be used as a set of guidelines for scaling up telemedicine services.
MAFEIPThe Monitoring and Assessment Framework for the EIP on AHA (MAFEIP12) is a project launched by the European Commission Joint Research Center, Institute for Prospective Technological Studies (JRC IPTS), the Directorate General for Communications Networks, Content and Technology (DG CNECT), and the Directorate General for Health and Food Safety (DG SANCO). EIP on AHA is the abbreviation of European Innovation Partnership on Active and Healthy Aging, which consists an initiative which aims on sharing and scaling up innovative solutions in order to improve active and healthy ageing in Europe. The goal of MAFEIP is to define a monitoring framework towards facilitating and harmonizing the monitoring of the process of EIP on AHA as well as the output of the action groups within EIP on AHA. In this respect, a short list of indicators was defined. These indicators are quantifiable and common between different disease areas. Additionally, they are also able to capture the effects of EIP on AHA action groups.
In the context of MAFEIP, a monitoring frameworks, named MAEFIP tool, was implemented. This monitoring framework consists a web-based tool aiming at estimating the impact of the EIP on AHA activities and health/social care systems [21]. The core of the tool is the decision and analytic model which is based on Markov model. This allows maximum flexibility when collecting data from multiple sources and the synthesis of data evidence. The model was implemented using R programming language whereas the web user interface allowed the user who are not necessary experts in health modelling, to perform their analysis by interacting with the web interface and customize the analysis.
MethoTelemed -MASTModel for Assessment of Telemedicine Applications (MAST) [22] is the development framework for decision making on the use of telemedicine applications and it consists a part of the results of the MethoTelemed project. The MAST model was based on the Core HTA model of the EUnetHTA13.Through a systematic literature review, for the identification of the impacts of telemedicine services, and workshops, in order to specify the users’ and stakeholders’ needs, the consortium reached a consensus on 12 http://is.jrc.ec.europa.eu/pages/TFS/MAFEIP.html 13 http://www.eunethta.eu/
Public Page 32 of 59 V0./5 August 201

Evaluation Engine Architecture
the MAST model. According to the model the telemedicine related information is organized into 7 domains covering different aspects such as:
1. Health problem & description of application2. Safety3. Clinical effectiveness4. Patient perspectives5. Economic aspects6. Organizational aspects7. Socio-cultural, ethical and legal aspects
The MAST assessment model was adopted from numerous EU funded projects such as Renewing Health14. The Renewing Health project was partially founded by the European Union and it consist the largest Randomized Control Trial study in the area of Telemedicine in Europe which aims to produce a methodological and multidisciplinary evaluation of the impact of personal health systems and telemedicine services.
SELFIEThe project on Sunstainable Integrated Care Models for Multi-Morbidity Delivery, Financing and Performance (SELFIE15) is a Horizon2020 EU project that contributes to the current state of knowledge on integrated chronic care (ICC) for persons with multi-morbidity and provide applicable policy advice. The aim is to generate evidence on the impact of promising ICC models and supporting financing/payment schemes on patient experience, health outcomes, and costs. Specific ICC projects for multi-morbidity will be empirically evaluated using multi-criteria decision analyses (MCDA).
SUSTAINSUSTAIN is a cross-European Horizon 2020 research project and stands for sustainable tailored integrated care for older people in Europe (SUSTAIN16). SUSTAIN aims to concretely improve the way care services for older adults are organised and delivered across Europe, and especially for those who have multiple health and social care needs. The project will analyse the 14 care services by gathering data and by interviewing several persons who are involved (practitioners, users, policy makers, health insurers etc.). With a group of organisations (associations, groups, etc.) at local level, design and implement a set of improvements of the care service, with regards to key principles and values for quality of care. Assess the improvements and gather information on this experience, share best practices between countries and build lessons for future stakeholders who would like to improve integrated care delivery.
14 http://www.renewinghealth.eu/en/ 15 http://www.selfie2020.eu/ 16 http://www.sustain-eu.org/
Public Page 33 of 59 V0./5 August 201

Evaluation Engine Architecture
The tips and tricks, recommendations and tools will all come together in a product that we call an online roadmap, designed to show how to improve care services and deliver ‘integrated care’. The roadmap will be a key outcome of the project.
TOPICS-MDSThe Older Persons and Informal Caregivers Survey Minimum Dataset (TOPICS-MDS) is a public data repository which contains information on the physical and mental health and wellbeing of the older persons in and informal care givers across the Netherlands. TOPICS is a questionnaire, a data set and an experiment.
It is a questionnaire to assess physical and mental wellbeing, quality of life and healthcare utilization of the elderly and their informal care givers. The TOPICS questionnaire has been conducted in 53 different studies since 2008 and the data has been collected in a national database. This database is open for secondary research purposes for researchers in the Netherlands. Furthermore, TOPICS is a data sharing experiment; it is advised and stimulated to share data, but the process is not yet well defined.
Off-The-Shelf ToolsData storageData is continually evolving over the course of time which inevitably results in a constant pursuance of the most effective practices for data storage and management. The increased volume of data and the diverse nature of it has also changed the overall scheme of data storage solutions.
One of the fundamental distinctions regarding how data is stored and managed features between SQL (Structured Query Language) and NoSQL (Not only SQL). SQL is the standard language for relational databases and both American National Standards Institute17 and ISO/IEC1819 have accepted it is as such.
In SQL, data is stored in a relational model, comprising of tables, rows and columns. The schema implemented in SQL is fixed and database design is determined prior to entering any data. SQL is compliant to the Atomicity Consistency Isolation Durability (ACID) properties guaranteeing this way data consistency and integrity. As SQL is a mature language, the majority of common relational database SQL - NO/SQL
17 https://www.ansi.org 18 International Organization for Standardization/International Electrotechnical Commission.19 http://www.iso.org/iso/jtc1_home.html
Public Page 34 of 59 V0./5 August 201

Evaluation Engine Architecture
management systems use it, such as Oracle20, Microsoft SQL Server21, MySQL22 and more.
As a result of the vast growth and transformation of data during the past decades, SQL proved to be lacking in certain aspects regarding storage, flexibility and scalability hence, the evolvement of NoSQL. The term NoSQL incorporates databases which support different data storage models. For instance, data stored in document format, key-value pairs, graphical, columnar and more thus avoiding this way the restriction imposed from SQL which only uses a table format for storing and retrieving data. Additionally, in contrast to SQL, schemas are dynamic in NoSQLs and data can be added any time providing this way flexibility. Additionally, SQL and NoSQL follow a different approach in terms of scalability. In NoSQL scalability is achieved horizontally (scale out/in) as opposed to SQL where scalability is accomplished vertically (scale up/down). The process of scaling out involves the addition of more machines to a system and thus providing a combined power of all the involved machines. Comprehensibly, horizontal scalability does not limit the use of a single unit. On the other hand, scaling up means adding resources to a single machine of a system for example by adding CPU power or memory on a single machine.
Nevertheless, a NoSQL data storage solution may indeed offer an enhanced performance and scalability in data storage retrieval but may compromise some of the ACID properties. NoSQL favours the Basic Availability Soft-state Eventual consistency (BASE) scheme consequently compromising the strong data consistency and isolation which were guaranteed by relational databases. Some of the commonly used NoSQL databases include MongoDB23, Redis24, Cassandra 25, HBase26 and others.
20 http://www.oracle.com/index.html 21 https://www.microsoft.com/en-us/server-cloud/products/sql-server/ 22 https://www.mysql.com/ 23 https://www.mongodb.com/24 http://redis.io/25 http://cassandra.apache.org/ 26 https://hbase.apache.org/
Public Page 35 of 59 V0./5 August 201

Evaluation Engine Architecture
Figure 3 Difference SQL and NoSQL, (source: Microsoft Azure).
Data integrationData integration encompasses the combination of data stored in different data sources in order to provide users with a unified and meaningful view of the data. As data may reside in data sources scattered on premises or outside of it, the integration, mapping and delivery of it is not a trivial task especially when performing analytics and business processes. In addition to this, data can be heterogeneous thus resulting in a semantic integration strain.
ETLA common method to combine data from heterogeneous data sources is by implementing ETL (Extract Transform Load) tools. ETL tools work in alignment with data warehouses. The ETL tools are responsible for retrieving data from the heterogeneous data sources, transforming it to the format require and predetermined and finally loads it to the data warehouse. Even though the ETL architecture seems to resolve some aspects of combining data from heterogeneous sources, this becomes complex when data need frequent updates such as real-time data as this would result in executing ETL processes continuously. However, on the market ETL tools seem to evolve into platforms with additional integration components that attempt to tackle (near) real-time and quick response issues.
Public Page 36 of 59 V0./5 August 201

Evaluation Engine Architecture
Figure 1 – An Extract - Transform – Load (ETL) depiction
OntologiesAnother alternative approach to resolve heterogeneities of sources is the semantic representation with the use of ontologies which provide a predefinition of a schema to be used. An ontology is a formal, explicit specification of a shared conceptualization [23]. Thus, by using a conceptual depiction of the entities, properties and their relations, heterogeneities can be removed making data integration attainable. Such a semantic representation complements the NoSQL approach which focuses on schemaless data management without enforcing relationships between data thus not being able to illustrate relations. An interesting approach introduces the ontology-based data integration which uses ontologies to organize and describe the medical concepts of both the source system and the target system [24].
Regarding the medical and clinical community there have been notable efforts for designing architectures to support the integration of vast amounts of clinical data. The Informatics for Integrating Biology and the Bedside (i2b2)27 is funded by the National Institutes of Health (NIH)28. It provides a scalable informatics framework to combine clinical, demographic and genomic data to be used in research projects.
The Electronic Health Records for Clinical Research (EHR4CR)29 project is funded by the European Federation of Pharmaceutical Industries and Associations (EFPIA)30 and the Innovative Medicines Initiative (IMI)31. It focuses in providing software and service solutions to reuse Electronic Health Record (EHR) data which offers great 27 https://www.i2b2.org 28 https://www.nih.gov/ 29 http://www.ehr4cr.eu/30 http://www.efpia.eu/ 31 https://www.imi.europa.eu/
Public Page 37 of 59 V0./5 August 201

Evaluation Engine Architecture
advancements and improvements in healthcare and patient safety. The core of the EHR4CR platform handles the semantic integration problem. The platform specifies a Common Information Model (CIM) and all additional tools are structured according to the CIM. Complex queries are accessible to tools in order to efficiently transform criteria in CIM queries.
The platform implements an ETL tool while the EHR4CR semantic integration layer is responsible for the transformation between the local information models and the EHR4RC CIM. EHR4CR also provides tools for iteratively updating mappings and improving data quality.
Data analysisData analysis is the key step, which transforms systematic observations into deliverable insight and brings value to the end user. It relies on standardized procedural techniques, such as statistical analytics and mathematical modelling, interpretation, reporting and visualization. The analysis itself, begins after data collection, which usually integrates data quality evaluation. Initially, all data is cleaned in order to ensure high quality and avoid misleading conclusions at the analysis stage. At this point it is important to be able to develop reliant and accurate models and correlations. Finally, all meaningful information is displayed to the end user in various formats to support the user’s need to observe, understand and predict, allowing the end user to react and reorganize by means of reports, dashboards and scorecards, using various types of visualization and analysis techniques from descriptive, to monitoring to prediction, to recommendation.
Healthcare analysts in particular rely on standardisation, consistency and software stability. In this field, data analysis in the field is already challenging nevertheless the expedient process. Outcomes of data analysis often include patient care improvement, as clinicians or patients can act on accurate information regarding patient’s lifestyle, medication treatments, patient medical history and more. Additionally, administrative costs or readmissions can benefit exceedingly form accurate results.
There is a tendency for big software providers to offer integrated analysis tools that encompass data management, mining, cleaning, modelling, as well as visualization. Some even go as far as becoming business intelligence platforms encompassing the full lifecycle of data collection, storage, integration, analysis and visualization. Concerning specialized medical software providers, there is little differentiation from already established products, as the data technology trends are dictated by more intense data markets. Generally, the packages are built with increased security features and redundancies to improve safety and stability. The next tables and figures summarize available data solutions.
Public Page 38 of 59 V0./5 August 201

Evaluation Engine Architecture
Table 1 Leading proprietary data analytics packages
Provider/Package Platform Developmental languages
Big Data support
IBM Analytics WIN/Linux/ OSX
R/Python Hadoop
IBM Watson N/A Multiple N/AMicrosoft Azure N/A Multiple HadoopSAS WIN/Linux R/Python HadoopORACLE WIN/Linux/
OSXR Hadoop
MERGE WIN/Linux C#/Java Hadoop
Public Page 39 of 59 V0./5 August 201

Evaluation Engine Architecture
Table 2 Leading open-source data analytics packages
Provider/Package
Platform Developmental languages
Big Data support
Dependencies
Knime analytics WIN/Linux/ OSX
R/Python Hadoop Extendable
Rapidminer WIN/Linux R/Python/SQL RadoopH2O, machine learning
WIN/Linux/ OSX
R/Python Hadoop
Gnubila HadoopPentaho (ETL) WIN/Linux/
OSXR Hadoop
Jaspersoft (ETL) WIN/Linux/ OSX
Hadoop Some features
Talend (ETL) Hadoop
Figure 1 Current healthcare 'Big data' ecosystem.
Business Intelligence PlatformsHere we investigate the various and different existing solutions that could be used in the ACT@SCALE project. As a first approach some business intelligence platforms are being presented in order to establish a general perspective of what such tools have to offer regarding data storage, data integration, data analysis and visualization.Table 3 Technological solutions.
Solutions Data storage Data integration
Data Analysis
Data Visualization
Public Page 40 of 59 V0./5 August 201
Evaluation Engine Architecture
PackagesIBM Relational databases,
content repositories, Apach Hadoop, NoSQL databases
+ + +
SAS + + +Oracle Business Analytics
Relational + Big Data support
+ + +
Knime Simple text files, databases, documents, images, networks, and even Hadoop-based data can all be combined within the same visual workflow.
Data blending and transformation
+ +
Alteryx SQL and NoSQL support Data blending andData preparation
+ +
TIBCO SQL and NoSQL support + + +
Sisense SQL support (SQL Server, Oracle, MySQL, POSTGRESQL,ODBC drivers, Hadoop via Hive)Files( Microsoft Excel and Access)Online web services ( Salesforce, Amazon Redshift and more)
+ + +
Gnubila Relational databases, unstructured databases
+ FedEHR FedEHR
Pentaho(ETL)
NoSQL data stores and analytics databases
NoSQL (MongoDB, Cassandra, etc)
Saphana, Amazon Reshift, Netezza etc.
+ + +
Talend(ETL)
Relational databases, NoSql databases (MongoDB,Cassandra, CouchDB,Couchbase,Neo4J, Riak, HBase.
+ Not clarified Not clarified
Popmednet
Public Page 41 of 59 V0./5 August 201

Evaluation Engine Architecture
IBM32, SAS33, and ORACLE34 are well-known vendors of commercial analytics platforms, covering the whole range of proprietary tools for data storage, data integration, data analysis, and data visualization.
KNIME 35offers an open source analytics platform. It provides a collection of different tools for data analytics, data integration and reporting. It has a wide range of connectors in order to support major file formats and databases, including data types such as XML, JSON, images and documents. It can also deliver native and in-database data blending and transformation. Additionally, a wide variety of math and statistical functions are available for use as well as advanced predictive and machine learning algorithms. Moreover, it provides tools to support Python, R, SQL, Java, Weka and more. Finally, reporting and different data visualization tools are accessible. KNIME has been utilized in various fields such as Finance, Manufacturing, Government, and in Pharmaceutical research as well.36
ALTERYX37 offers a platform for self-service data analytics. It provides solutions for data blending, data preparation, in-database processing, predictive analytics, Big Data analytics, R based analytics, spatial analytics, visualization tools and more. It is a platform which can deliver services for various industries such as Financial, Commercial, Healthcare, Pharmaceutical & Biotechnology and many more.
TIBCO38 provides tools for data integration and analytics than can be utilized on-premises or in a cloud environment. Among the various tools it offers, the TIBCO Spotfire39 solution delivers a self-service visualization and analytics software in which structured and unstructured data are combined and analyzed. Additionally, TIBCO Jaspersoft40 is also available as an open source business intelligence software that provides services for data integration, data analysis, data reporting and dashboards.
Sisense41 is a business analytics software which enables users to join and analyze data sets from multiple sources as well as tools such as dashboards and reports to visualize the analysis results. Advanced statistical analysis can be delivered as it utilizes a library of R functions. In order to manage data in Sisense the use of ElastiCube42 is required. ElastiCube is Sisense’s analytical database which enables the connection with databases (like SQL Server, MySql, Oracle, etc.), files (text, csv, Microsoft Access, etc.) and online web services (Google AdWords/Analytics, Salesforce, Zendesk, etc.).
32 http://www.ibm.com/analytics/us/en/technology/business-intelligence/ 33 http://www.sas.com 34 https://www.oracle.com/index.html 35 https://www.knime.org/ 36 https://www.knime.org/applications 37 http://www.alteryx.com/ 38 http://www.tibco.com/ 39 http://spotfire.tibco.com/ 40 http://www.jaspersoft.com/ 41 https://www.sisense.com/ 42 https://www.sisense.com/elasticube-technology/
Public Page 42 of 59 V0./5 August 201

Evaluation Engine Architecture
GNUBILA43 has developed various applications for different industries such as banking, healthcare and government. Primarily it focused on graph oriented databases, federated databases and highly sophisticated systems. It delivers FedEHR44 and G45 platform among others. FedEHR offers a patient-centric EHR (Electronic Health Record) repository, leveraging on the cloud which can store many types of data conforming to standards such as SNOMED46 and ICD-1047. Moreover it supports secured data sharing as well as a variety of data visualization tools. G platform provides an unstructured graph oriented DBMS and acts as a container to host applications developed in Perl, Java, Microsoft.NET, C, PHP and more. Capabilities such as authentication, authorization integrity and scalability are also supplied. The G platform also provides the G Integration Middleware solution in order to support integration needed at server, client and middle side. It can integrate all different kinds of data files or media contents, business processes, message BUS as it supports technologies like Ruby and Python.
Pentaho48 offers a suite for managing Business Analytics. The suite provides solutions for data integration and ability to manage highly diverse data, ETL tools, data mining, analytics, services for reporting and dashboards. It supports integration of analytic models such as R, Python and Weka. It supports native SQL databases (MySQL, Ingres, SQL Server, Postgres and more) as well as NoSQL databases.
Talend49 focuses more on data integration and data preparation. It offers solutions to connect to various data sources including support for relational databases as well as NoSQL databases.
State of the Art SolutionsTaking into consideration that there are multiple tools and methods available in the broad area of data analytics, there is not an outright and absolute approach that could be fitting for all circumstances. Therefore, in the following section a brief discussion is provided, of some of the commonly used approaches, including frameworks, programming models and engines that could potentially accommodate the requirements of ACT@SCALE.
In order to conduct the investigation of existing approaches certain factors of the nature of ACT@SCALE were deliberated and more specifically the diversity of the data, the regional distribution of data as well as the different regional requirements which need to be fulfilled such as data analysis and visualization.
43 http://www.gnubila.com/ 44 https://www.fedehr.com/ 45 http://gnubila.com/geas/g-cloud-application-platform 46 http://www.snomed.org/ 47 http://www.who.int/classifications/icd/en/ 48 http://www.pentaho.com/ 49 https://www.talend.com/
Public Page 43 of 59 V0./5 August 201

Evaluation Engine Architecture
Federated databasesThe initial conception of a federated database system (FDBS) derived from the need for managing diverse organizational data residing in autonomous databases. All organizational data maintained a decentralized approach where data were scattered in different databases with no interchangeable functionality. Therefore, coordination of data sharing and exchanging was an unmanageable task. Heimbigner [25] and Sheth [26] defined that a federated database system is a collection of cooperating but autonomous database management systems.
In federated database systems, the main concept is that data remain in the source databases. A “virtual” data repository is created which has knowledge of the data models implemented in the source databases. When the client requires data from an application, the query is sent to the “virtual database” and the federation engine determines in which source database the data required are residing. Then, the query is translated according to the structure of the source database, data is retrieved and delivered to the client [27].
As mentioned above, one of the vital characteristics of a federated database system is that local database management systems maintain their data. Thus, there is no need for the data themselves to be exported. It provides autonomy to source databases offering them the complete control of their data while there is no need for further modifications on the local databases in order to conform to the federation database schema. Additional data sources can be added to the federated schema independently to the existing source databases. FDBSs can support different data models, databases and languages making it appealing to infrastructures that require to maintain heterogeneity of data sources in their systems. Such heterogeneity provides support for relational or non-relational databases, web services or even flat files. The user is provided with a unified and integrated view of data hiding this way all the added complexities from multiple resources. Due to the fact that data remains in local databases it enforces their autonomy as all data control remains locally. Finally, FDBSs is applicable in structures in which data source are geographically distributed thus facilitating the distribution of data outside the premises of an infrastructure.
A graphical representation of the 5-level Schema Architecture is provided in Figure 1 [26].
Public Page 44 of 59 V0./5 August 201

Evaluation Engine Architecture
Figure 2- Five-level schema architecture of an FDBS
There are two types of data federation: Tightly coupled and loosely coupled. Tightly coupled include a central engine which is responsible for controlling and overseeing the federated database system, while in the loose coupled federated system there is no central instance and global users are responsible for creating their federated systems. Nonetheless, some drawbacks should be taken into consideration before deciding on a federated database schema. The autonomy key concept of a federated database system can in fact affect performance as the data sources may proceed with unpredictable changes, thus requiring further modifications of the federated engine. Moreover, the federation should be carefully designed as the addition of more data sources may lead to complex infrastructures demanding technical expertise regarding query algorithms, performance issues and potential latency. As the concept of database federation has evolved major vendors like Oracle, SQL, IBM provide solutions and support tools for implementing federated database systems.
Big Data management and analytics Big data is often characterized by the data characteristics (3 Vs) on which traditional non-big data solutions fail in storing, accessing and analysing the data within required response times. These characteristics are (1) Volume - the size of the data is huge and needs different storing strategies, e.g. genomics, (2) Velocity - the data comes in too fast to be processed, e.g. millions of clickstream events per minute for Facebook, and (3) Variety – data is unstructured and can be anything from free text, audio and video or a combination thereof. Big data is data for which these characteristics apply, but often the term big data is used in cases where there the volume of data is somewhat increased without exactly satisfying any of the big data characteristics, or when (free or cheaper) big data solutions are used for data management where also non-big data
Public Page 45 of 59 V0./5 August 201

Evaluation Engine Architecture
solutions could be used. Big data applies in situations where an abundance of data is available (weblogs, clickstream behaviour, social interactions, device data), but it is not clear yet which questions to ask and which variables matter, so everything is stored with the option to do the analysis later, which is facilitated by affordable computing resources.
The big data approach is different from the field of traditional scientific analysis; which is a very strict process of formulating the research question, constructing the hypothesis, designing the experiment, collecting and analysing the data, drawing conclusions communicating and discussing the results with the scientific community. In big data however, one starts with the data and builds models around the data, run the models and discover the results. Criticism of big data is that it does not follow strict scientific methodologies. Big data does support the collection of vast amounts of data and (near) real-time analysis that facilitates organizations to create a closed loop where new results are immediately actionable and it facilitates ad-hoc analysis of unexplored data.
There are many successful applications of big data (e.g. the success of Amazon, Google features), but not all big data applications are successful. It is not enough to have the technology. Successful application of big data depends on the technology, the people and the processes. The technology can be purchased; but it is the integration of big data and fact-based decisions into the organization and having the right people that deliver the results in terms the business understands that is the real challenge. Common mistakes include too much focus on technology, not understanding the problem or not selecting the wrong problem, using the wrong analytical techniques, automated decision making without careful monitoring and interpretation and intentional undermining of analytics50. It is important to understand that in big data there are more distractions, more false positives, more bias, and there is more reliance on machine learning. In big data you can find the evidence you seek. As a result human judgment and interpretation make the predictions more accurate[28].
While big data has already been applied in many organizations, in healthcare it is still relatively new. Especially in healthcare there are big concerns related to privacy to share data with the many cross-organizational stakeholders. The data resides in silos across the healthcare organization and these systems typically have limited possibilities of data sharing. In addition there is resistance to change from clinical judgment, based on clinical trial to big data findings. The trend in healthcare is to make healthcare data more actionable across the whole healthcare sector and recent business models may require evidence of correct care for refunding.
50 “If you torture the data long enough, it will confess to anything”, How to lie with statistics by D. Huff (1954).
Public Page 46 of 59 V0./5 August 201

Evaluation Engine Architecture
Figure 4 Companies must develop a range of big-data capabilities (source: McKinsey report Big Data in Healthcare).
HadoopThe Apache Hadoop51 software library is a framework that allows for the distributed processing and storage of large data sets across clusters of computers using simple programming models. It is designed to scale up from single servers to thousands of machines, each offering local computation and storage.
Some of the most important modules of this framework are:
a) The Hadoop Distributed File System (HDFS™): A distributed file system that provides high-throughput access to application data. The HDFS distributes large datasets across many data nodes, by segmenting large files into blocks, replicating blocks on several data-nodes, and storing all block/datanode locations on a central namenode. Access to HDFS is possible via APIs in different languages, e.g. python, R, etc.
b) Hadoop YARN: A framework for job scheduling and cluster resource management.
c) Hadoop MapReduce: A YARN-based system for parallel processing of large data sets.
d) Cassandra: A scalable and fault tolerant database oriented to columnar data.
51 http://hadoop.apache.org/
Public Page 47 of 59 V0./5 August 201

Evaluation Engine Architecture
e) Hbase: A scalable, distributed database that supports structured data storage for large tables.
f) Hive: A data warehouse infrastructure that provides data summarization and ad hoc querying. It facilitates reading, writing, and managing large datasets residing in distributed storage using SQL. Structure can be projected onto data already in storage. A command line tool and JDBC driver are provided to connect users to Hive.
MapreduceMAPREDUCE is a programming model which is primarily used for processing data in large-scale distributed systems, like cluster and grid computing. Therefore, making it one of the most prominent candidates in systems that are handling Big Data. Its origins, are found at Google, in the early 2000s, when there was a significant need to distribute and process data in parallel. Taking into consideration that the web was expanding and more and more users were engaged with the web, Google designed a programming model which fulfilled the requirements for parallel execution.
MAPREDUCE is based on functional programming and it embraces the divide and conquer concept, therefore dividing tasks to multiple workers for better performance. Simplified, there are two distinct stages: mapping and reducing. MAPREDUCE focuses on mapping a list of values into another list of values which are then reduced into a single value, hence the name MAPREDUCE. In more details, during the mapping process a key/value pair generates another key/value pair called the intermediate pair. The computation applied to each value is the same. The intermediate values are then supplied to the reduce function via the iterator. In the reduce process all intermediate values are merged and assigned with the same key. Thus, producing and forming a smaller single value again by applying the same computation to each value [29].
A more detailed architecture of MAPREDUCE is provided in Figure 2 [30].
Public Page 48 of 59 V0./5 August 201

Evaluation Engine Architecture
Figure 2 - MAPREDUCE execution overview
In order to understand the motivation on selecting MAPREDUCE as the preferred model to handle Big Data, a review of the benefits the model provides could be useful. More specifically, it is based on a simple programming model while the scalability it provides is significant as it can distribute large datasets. Moreover, the fact that is can support different types of data while processing them in parallel makes it appealing to large-scale distributed environments. Finally, it provides fault tolerance as it can recognize any failures during the map and reduce stages and handles them appropriately in order to avoid further delays.
However, it is wise to take into account some considerations when using MAPREDUCE. First, during the map and reduce process a performance degradation may occur bearing in mind, that the reduce phase cannot begin until the map phase finishes. What is more, is that if a computation of a value depends on the result of previously computed values then MAPREDUCE cannot be used. In large scale environments the requirements may be complex thus demanding complex algorithms which can be hard to implement without expertise in optimising parallel programming
Apache SparkApache Spark™52 is a fast and general engine for large-scale data processing, for cluster computing. It provides high-level APIs in Java, Scala, Python and R, as well as high-level tools for SQL and structured data processing, machine learning, graph 52 http://spark.apache.org/
Public Page 49 of 59 V0./5 August 201

Evaluation Engine Architecture
processing, and Streaming. It is a newer and very promising technology than Hadoop MAPREDUCE and performs a different data management. It seems to outperform MAPREDUCE in terms of speed, and is expected to replace it in enterprise IT.
Data protection / Data Trust
DataSHIELDDataSHIELD (Data Aggregation Through Anonymous Summary-statistics from Harmonised Individual levEL Databases) is an open-source R library which enable the users to access remotely multiple datasets, without the need of data transfer or any risk of disclosing patient-level data itself [31].
The IT infrastructure is modular and therefor flexible for adoption under different scenarios. The main DataSHIELD components include: a computer server at each source study hosting an Opal databases, the statistical environment (R) and specific R libraries installed on both each data server and client computer. Opal is a database application and is typically used for analysis of data acquired at different centres and its ultimate purpose is to achieve seamless data-sharing.
Instances of Opal, the R server and the DataSHIELD server-side R libraries are implemented behind the firewall of each data owner’s location. The client is used to enact and control the distributed analysis and the client-side R libraries are installed there. A DataSHIELD platform consists of at least one client communicating with a number of servers or with just one server (i.e. single-site DataSHIELD).
Public Page 50 of 59 V0./5 August 201

Evaluation Engine Architecture
Figure 5 DataSHIELD architecture.
The key advantages of dataSHIELD are that it (1) allows the co-analysis of patient level data from multiple studies without releasing or sharing the data, (2) facilitates equivalent governance of analysis while preventing or hiding access to single dataset, (3) allowing sharing of information from one data set with other research groups without providing the control of the patient level data and (4) facilitates the analysis of large datasets without the need of physically transfer of the data.
Public Page 51 of 59 V0./5 August 201

Evaluation Engine Architecture
Logical Architecture (proposal)The analysis and the correlation of complex data from different datasets, containing sensitive, personal health information is the aim of the ACT@Scale project. In this respect, data derived from large number of individuals, from different regions and programmes, will be evaluated in the context of the project.
As already mentioned, the data that will be used for the analysis are sensitive as they included personal information regarding the individuals’ health condition and there are ethical issues which do not allow the transmission of the data outside the regional databases. However, for the evaluation purposes, it is crucial that the people from different regions must access and work with those data. The architecture proposed here consists a proposal in order to overcome these contradictory situations. The main idea behind the proposed architecture is to take the analysis to “the data not the data to the analysis”.
This proposal uses distribution of computing and parallelized analysis in order to facilitate the joint analysis of individual-level data from several sources, without the need of data transfer. The figure below consists a graphical representation of the interaction between the components.
Figure 2. Conceptual component interaction
According to the proposed IT infrastructure, the individual patient level data remain on the regions. Any actor involved in the project, such as the programme managers, enacts and control the analysis between the regions while at the same time the actor receives the results of the analysis. In this respect, the actor is able to guide the analysis by sending specific commands to each region, whereas only the outcome of
Public Page 52 of 59 V0./5 August 201

Evaluation Engine Architecture
the analysis is returned to the actor, while the individual-level data are retained on the local database. The outcome data from each region can be further analysed for reporting purposes.
In this respect, the data from the Patient’s Health Record (PHR) are transferred into the regional database, based on the minimum dataset based on the consensus with all the clinical partners of the project. The interaction between the components is achieved through the central service, which is responsible for accessing the regional datasets and execute the analysis, according to user needs and goals. Furthermore, the data derived from the surveys are stored into an external database, ensuring anonymization of data. These data are also accessible through the central service and may serve as valuable information in order to improve the calculation of the outcomes.
The aforementioned architecture is based on that proposed by Data-shield which is already used in the field of genomic epidemiology where data patient-level are used and ethical concerns imposes the restriction of data transferring between the researchers from different regions. This architecture covers all constraints described in the requirements(C01-C10).
In more details, according to the proposed architecture, the distributed engine consists of a data warehouse (C07) and an analysis component (figure below). The database contains the data described by the minimum dataset (C08). These data are de-identified (C09), whereas as the schema of the database is common for all the regions (C10). As it can be shown in the figure, the communication between the analysis components is performed through the central point (C04), the central service, which supports the discovery service, the authentication and the algorithms implementation. The analysis in performed on anonymized data (C01), and no patient-level data are transferred between the components. In other words, the data remain in the local database (C02-C03). For the analysis purposes, only aggregated data and the outcome of the statistical analysis in each region are available for the actor involved (C05) through the central engine. For advanced analysis of the statistical `
Public Page 53 of 59 V0./5 August 201
Evaluation Engine Architecture
Figure 3. The Distributed engine conceptual architecture.
According to Figure 2, the actors, who represent a specific region, can access the data from their own region (stored in the minimum dataset database) and perform a specific analysis. Furthermore, the actor, through the central service, he will also be able to perform the same analysis into the respective data from other regions and access the results. In this respect, the actor can compare the finding from different regions without the need of transferring the data from other regions to another local database. Finally, the answers from the survey can also be accessed through the central service.
Public Page 54 of 59 V0./5 August 201

Evaluation Engine Architecture
Conclusions and Future WorkThis document described the evaluation framework for scaling-up integrated care programs. The framework requires the description of the structure (deployment context) of the program and the deployment process. During ACT@Scale the changes in the process made in (1) citizen empowerment, (2) service selection, (3) change & stakeholder management, and (4) business model & sustainability will be captured by the process indicators. Scaling-up outcomes reflect the IHI triple aim areas of the experience of care, health of the population, and per capita cost. In addition to these high-level outcomes, programs can evaluate their program-specific objectives. In addition, the framework supports evaluation of outcomes common for a specific cluster of diseases.
We explored the initial requirements for an engine that collects, stores and analyses data of the evaluation framework. We will develop the engine using Agile principles to facilitate early feedback and refinement of the engine. Such an approach is very suitable for a project like ACT@Scale, where a large part of the requirements is unknown and will evolve during the project. The set of requirements presented in this document will be extended, refined and adjusted during the full length of the project. This deliverable will be used to have further discussions with the regions and their IT departments on further development of the engine.
The document described related work (projects, tools, and methodologies) for the evaluation of integrated care programs. While there are a lot of open source and commercial tools on the market, there is no single solution that covers the full end-to-end needs, within the constraints of this project. Where possible we want to use existing tools and technologies. We described a set of initial user stories that relate to the baseline data collection using surveys. Finally, a very high level architecture for the survey data collection was proposed.
Future work
As future work we will start the implementation of the user stories and the proposed architecture described in this document. We may have additional or refined requirements from stakeholders, based on this feedback, we continue or adjust further development and create new user stories. In the first iteration(s), we will implement or embed a survey tool. Furthermore, we will use this document to communicate latest requirements and implementation results to the region IT.
Public Page 55 of 59 V0./5 August 201
Evaluation Engine Architecture
Next on the planning is the implementation of the ACT data model, that facilitates data storage following the evaluation framework. While the implementation of the knowledge base will not be addressed till the baseline collection is running
Public Page 56 of 59 V0./5 August 201

Evaluation Engine Architecture
References[1] C. de Meijer, B. Wouterse, J. Polder og M. Koopmanschap, »The effect of
population aging on health expenditure growth: a critical review.,« Eur. J. Ageing, årg. 10, p. 353–361, 2013.
[2] J. C. Kvedar, A. L. Fogel, E. Elenko og D. Zohar, »Digital medicine’s march on chronic disease.,« Nat. Biotechnol., årg. 34, p. 239–246, 2016.
[3] E. E. Nolte og M. McKee, »Caring for people with chronic conditions?: a health system perspective.,« Eur. Obs. Heal. Syst. Policies Ser., årg. XXI, p. 259, 2008.
[4] K. Taylor, »Connected health - How digital technology is transforming health and social care.,« Deloitte 40, 2015.
[5] C. Imison, S. Castle-clarke, R. Watson og N. Edwards, »Delivering the benefits of digital health care,« The Nuffield Trust., 2016.
[6] Philips, »Transforming Healthcare Through Innovation and Service Design.,« Philips., 2016.
[7] A. Tsiachristas, »Payment and Economic Evaluation of Integrated Care.,« PhD Thesis, 2015.
[8] J. Grant, »What does it take to make integrated care work?,« McKinsey, 2010.
[9] R. e. a. Wakabayashi, »Efficient integrated education for older patients with chronic obstructive pulmonary disease using the Lung Information Needs Questionnaire.,« Geriatr. Gerontol. Int., årg. 11, p. 422–430, 2011.
[10] ExpandNet, »W. H. O. Beginning with the end in mind: planning pilot projects and other programmatic research for successful scaling up.,« World Health Organization, 2011.
[11] B. Johns og T. T. Torres, »Costs of scaling up health interventions: a systematic review.,« Heal. Policy Plan. , årg. 20, pp. 1-13, 2005.
[12] P. M. Barker, R. A. og M. W. Schall, »A framework for scaling up health interventions: lessons from large-scale improvement initiatives in Africa.,« Implement. Sci. , årg. 11, pp. 1-11, 2016.
[13] B. Adamou, »Guide for monitoring scale-up of health practices and interventions: MEASURE evaluation.,« 2013.
[14] L. Rychetnik, M. Frommer, P. Hawe og A. Shiell, »Criteria for evaluating evidence
Public Page 57 of 59 V0./5 August 201

Evaluation Engine Architecture
on public health interventions.,« J. Epidemiol. Community Heal., årg. 56, pp. 119-127, 2002.
[15] M. C. Portela, P. J. Pronovost, T. Woodcock, P. Carter og M. Dixon-Woods, »How to study improvement interventions: a brief overview of possible study types.,« BMJ Qual. Saf., 2015.
[16] K. M. M. e. a. Lemmens, »Evaluation of a large scale implementation of disease management programmes in various Dutch regions: a study protocol.,« BMC Health Serv. Res. , årg. 11, pp. 1-9, 2011.
[17] E. Mezghani, E. Exposito, K. Drira, M. Da Silveira og C. Pruski, »A Semantic Big Data Platform for Integrating Heterogeneous Wearable Data in Healthcare.,« J. Med. Syst. , årg. 39, pp. 1-8, 2015.
[18] W. Raghupathi og V. Raghupathi, »Big data analytics in healthcare: promise and potential.,« Heal. Inf. Sci. Syst. , årg. 2, nr. 3, 2014.
[19] F. e. a. Greaves, »Harnessing the cloud of patient experience: using social media to detect poor quality healthcare.,« BMJ Qual. Saf. , årg. 22, pp. 251-255, 2013.
[20] Momentum, »Momentum - Advancing telemedicine adoption in Europe,« [Online]. Available: http://www.telemedicine-momentum.eu/wp-content/uploads/2015/02/D3.4_v1.0_ValidatedBlueprint.pdf. [Senest hentet eller vist den Aug 2016].
[21] C. E. Boehler, G. de Graaf, L. Steuten, Y. Yang og F. Abadie, »Development of a web-based tool for the assessment of health and economic outcomes of the European Innovation Partnership on Active and Healthy Ageing (EIP on AHA).,« BMC medical informatics and decision making, 2015.
[22] K. E. A. G. Kidholm, L. K. Jensen, J. Rasmussen, C. D. Pedersen, A. Bowes og M. Bech, »A Model for Assessment of Telemedicine Applications: MAST.,« International journal of technology assessment in health care, årg. 28, nr. 01, pp. 44-51., 2012.
[23] T. R. Gruber, »A translation approach to portable ontology specifications,« Knowledge acquisition, årg. 5, nr. 2, pp. 199-220, 1993.
[24] S. Mate, F. Köpcke, D. Toddenroth, M. Martin, H. Prokosch, T. Bürkle og T. Ganslandt, »Ontology-Based Data Integration between Clinical and Research Systems,« PLoS ONE, årg. 10, nr. 1, 2015.
[25] D. Heimbigner og D. McLeod, »A federated architecture for information management.,« ACM Trans. Inf. Syst. , årg. 3, nr. 3, pp. 253-278, 1985.
[26] A. Sheth og J. Larson, »Federated database systems for managing distributed, heterogeneous, and autonomous databases,« ACT Computing Surveys, årg. 22,
Public Page 58 of 59 V0./5 August 201
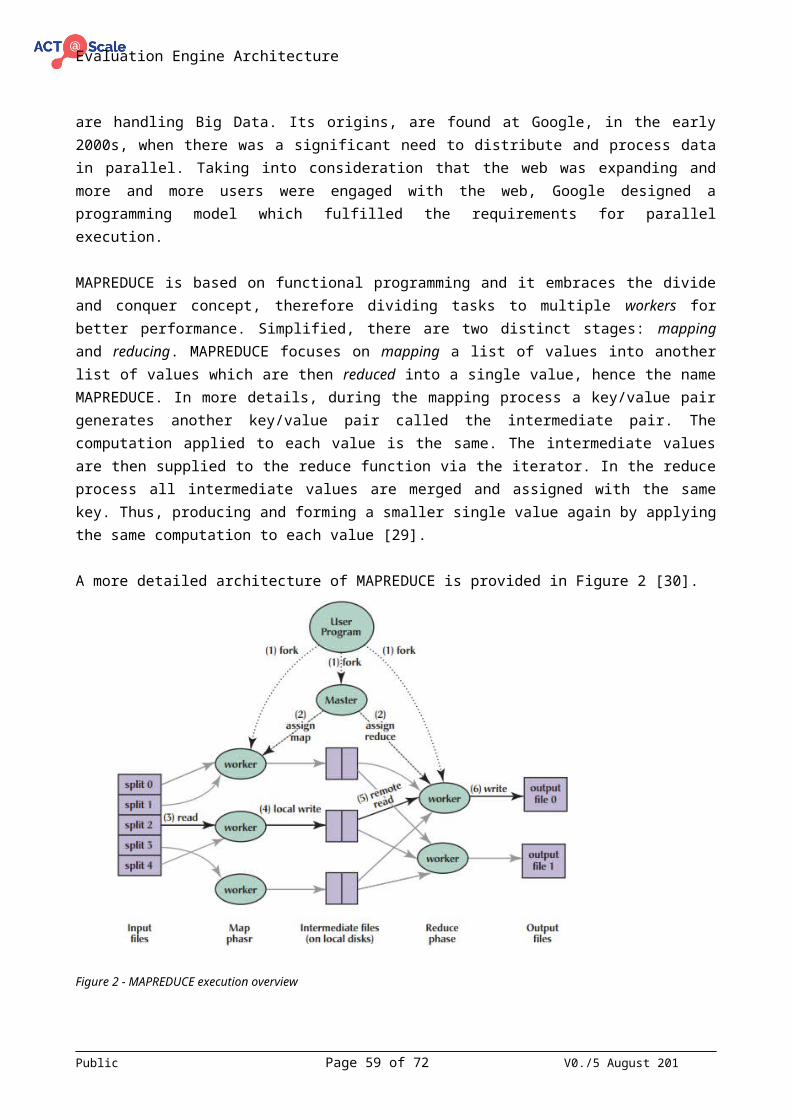
Evaluation Engine Architecture
nr. 3, pp. 183-236, 1990.
[27] J. Sinard, Practical pathology informatics: Demystifying informatics for the practicing anatomic pathologist., New York: Springer Science+Business Media, 2005.
[28] N. Silver, The Signal and the Noise : Why Most Predictions Fail – but Some Don't, Penguin Group, 2012.
[29] K. Krishnan, Data warehousing in the age of big data., Burlington: Elsevier Science., 2013.
[30] J. Dean og S. Ghemawat, »MapReduce,« Communications of the ACM, årg. 51 (1), p. 107.
[31] A. Gaye, Y. Marcon, J. Isaeva, P. LaFlamme, A. Turner, E. M. Jones og R. Wilson, »DataSHIELD: taking the analysis to the data, not the data to the analysis.,« International journal of epidemiology, , årg. 43, nr. 6, pp. 1929-1944, 2014.
[32] »MapReduce - What's Big Data?,« May 2016. [Online]. Available: http://whatsbigdata.be/MapReduce/.
[33] »Welcome to mini-sentinel,« Mini-sentinel, 2014. [Online]. Available: http://mini-sentinel.org . [Senest hentet eller vist den April 2016].
[34] C. Date, An introduction to data base systems, Boston: Addison-Wesley, 2003.
[35] M. Begg og T. Connolly, Database systems: A practical approach to design, implementation, and management (3rd), Harlow: Addison-Wesley.
[36] R. Casey, »Federation Architecture,« [Online]. Available: http://searchbusinessanalytics.techtarget.com/news/2240111412/How-Federated-Databases-Benefit-Bioinformatics-Research. [Senest hentet eller vist den April 2016].
[37] »What is MapReduce,« May 2016. [Online]. Available: https://www-01.ibm.com/software/data/infosphere/hadoop/mapreduce/.
Public Page 59 of 59 V0./5 August 201