· web viewfrom answers.com: gini coefficient: in a lorenz curve, a measure of the difference...
TRANSCRIPT

1Prof. John H. Munro [email protected] of Economics [email protected] of Toronto http://www.economics.utoronto.ca/munro5/
4 October 2012
ECONOMICS 303Y1
The Economic History of Modern Europe to1914
Prof. John Munro
Lecture Topic No. 5
II. GREAT BRITAIN AS THE HOMELAND OF THE INDUSTRIAL REVOLUTION, 1750-1815
E. The Expansion of the Market: Domestic Trade
1. Importance of the Domestic Market for the Industrial Revolution2. Factors Promoting Growth of the Domestic Market in 18th Century3. Revolution in Inland Transportation: Canals and Roads
F. The Expansion of the Market: Foreign Trade
1. Foreign Trade: The ‘Commercial Revolution,’ or The Era of ‘New Colonialism’, 1660 - 17602. Importance of New Colonial Re-export Trades for English Economic Development3. Mercantilism: Policies of State Intervention in Foreign Trade, Economic Nationalism and Protectionism4. British Foreign Trade During the Industrial Revolution Era, 1760 -1820
E.
F.
G.Expansion of the Market during the British Industrial Revolution: The Role of the Domestic Market, 1750 - 1820
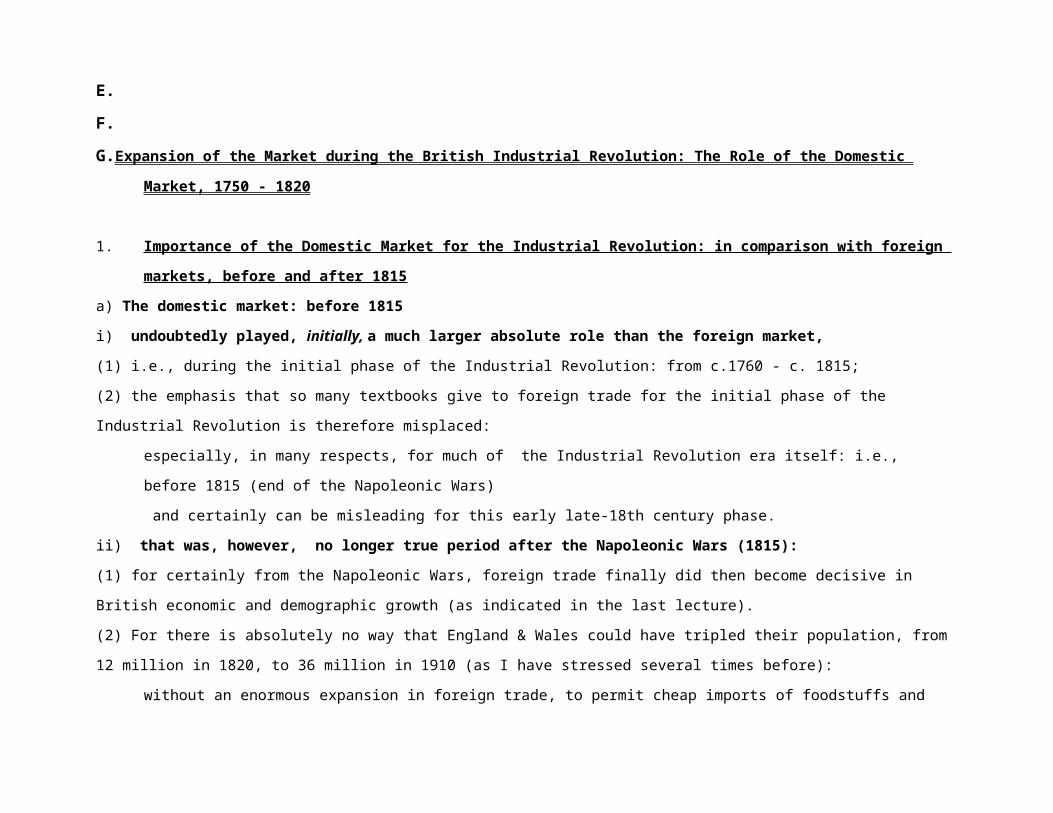
1. Importance of the Domestic Market for the Industrial Revolution: in comparison with foreign markets, before and after 1815
a) The domestic market: before 1815
i) undoubtedly played, initially, a much larger absolute role than the foreign market,
(1) i.e., during the initial phase of the Industrial Revolution: from c.1760 - c. 1815;
(2) the emphasis that so many textbooks give to foreign trade for the initial phase of the Industrial Revolution is therefore misplaced:
# especially, in many respects, for much of the Industrial Revolution era itself: i.e., before 1815 (end of the Napoleonic Wars)
# and certainly can be misleading for this early late-18th century phase.
ii) that was, however, no longer true period after the Napoleonic Wars (1815):
(1) for certainly from the Napoleonic Wars, foreign trade finally did then become decisive in British economic and demographic growth (as
indicated in the last lecture).
(2) For there is absolutely no way that England & Wales could have tripled their population, from 12 million in 1820, to 36 million in 1910 (as I
have stressed several times before):
# without an enormous expansion in foreign trade, to permit cheap imports of foodstuffs and raw materials
# and that also meant: without the impact of the Industrial Revolution (and related impacts on commercial and financial institutions) on
foreign trade.
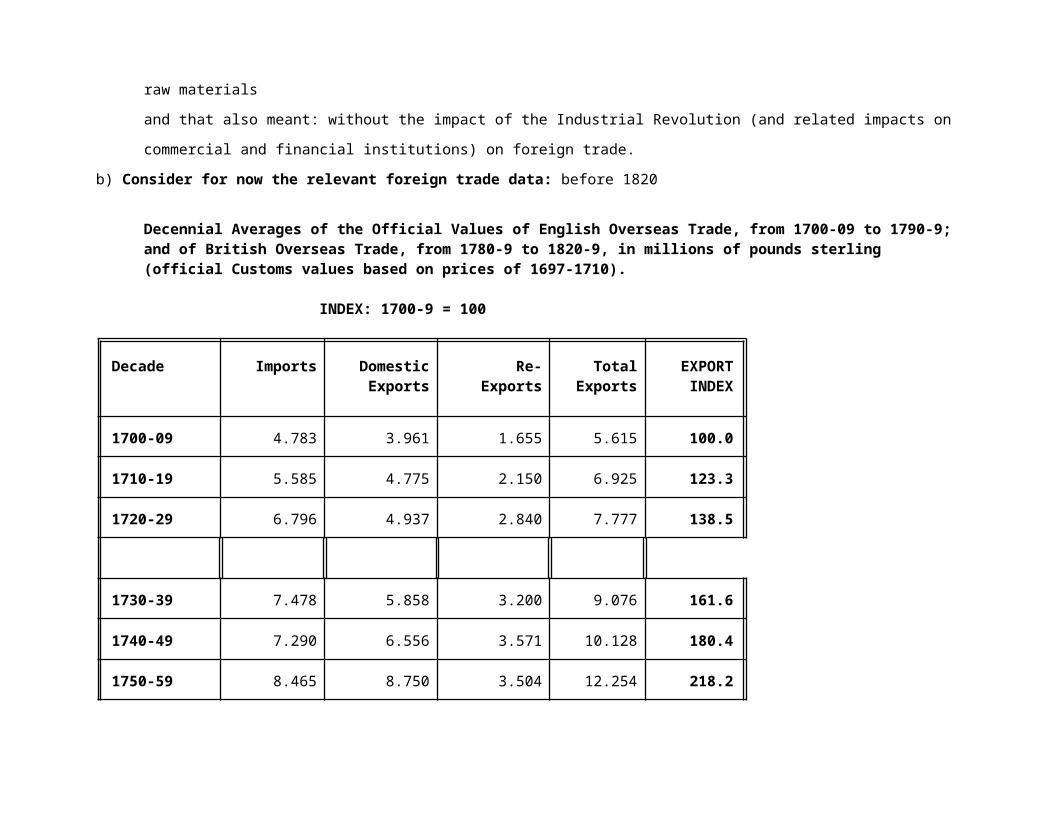
b) Consider for now the relevant foreign trade data: before 1820
Decennial Averages of the Official Values of English Overseas Trade, from 1700-09 to 1790-9; and of British Overseas Trade, from 1780-9 to 1820-9, in millions of pounds sterling (official Customs values based on prices of 1697-1710).
INDEX: 1700-9 = 100
Decade Imports DomesticExports
Re-Exports
TotalExports
EXPORTINDEX
1700-09 4.783 3.961 1.655 5.615 100.0
1710-19 5.585 4.775 2.150 6.925 123.3
1720-29 6.796 4.937 2.840 7.777 138.5
1730-39 7.478 5.858 3.200 9.076 161.6
1740-49 7.290 6.556 3.571 10.128 180.4
1750-59 8.465 8.750 3.504 12.254 218.2
1760-69 10.719 10.043 4.490 14.533 258.8
1770-79 12.105 9.287 5.136 14.422 253.3
1780-89 13.730 10.200 4.262 14.462 257.5
1790-99 21.797 17.520 9.350 26.870 478.5
GR BRITAIN
1780-99 14.889 10.889 4.529 15.419 274.6
1790-99 22.164 17.697 9.425 27.123 483.0
1800-09 28.737 24.880 10.100 34.980 622.9
Decade Imports DomesticExports
Re-Exports
TotalExports
EXPORTINDEX
1810-19 31.633 35.044 11.678 46.722 832.0
1820-29 38.310 46.530 9.880 56.410 1004.5
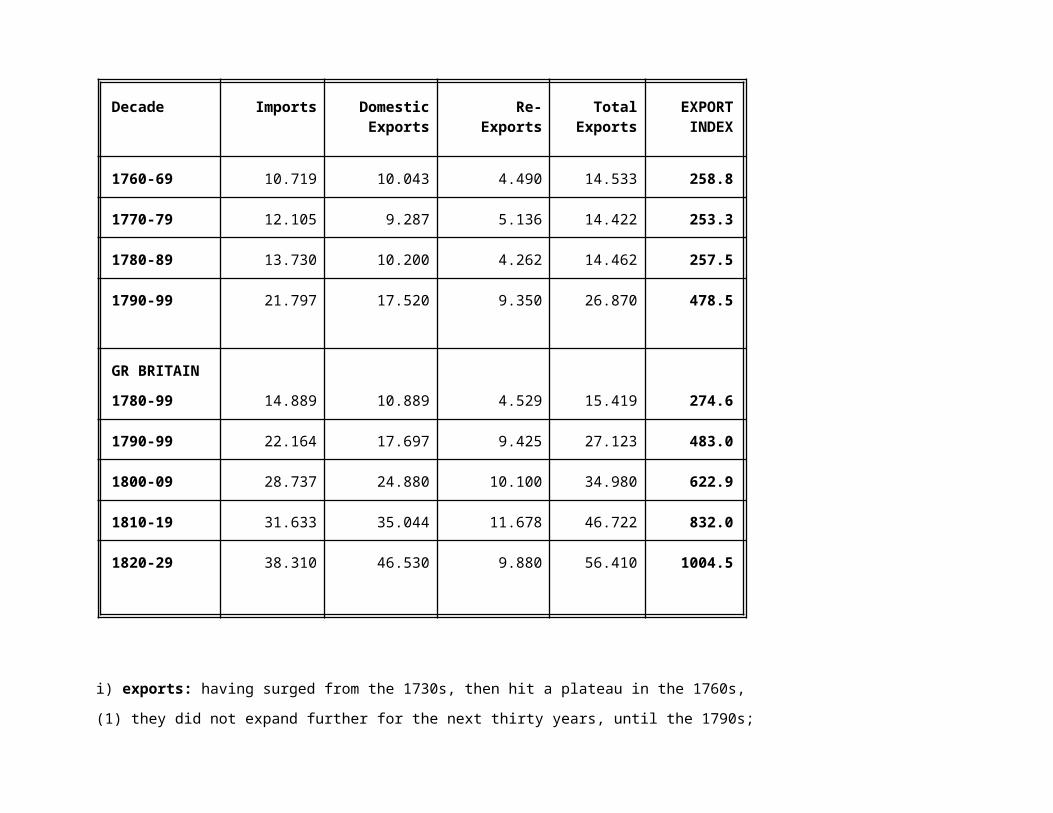
i) exports: having surged from the 1730s, then hit a plateau in the 1760s,
(1) they did not expand further for the next thirty years, until the 1790s;
(2) Thus exports were generally stable or flat for the initial take-off period of industrialization; obviously they were no spur to growth.
ii) Total exports in fact fell during the period of American Revolutionary War, from 1776 to 1783.
iii) The subsequent export boom from the 1790s: may thus be viewed more of a consequence of industrialization than a cause.
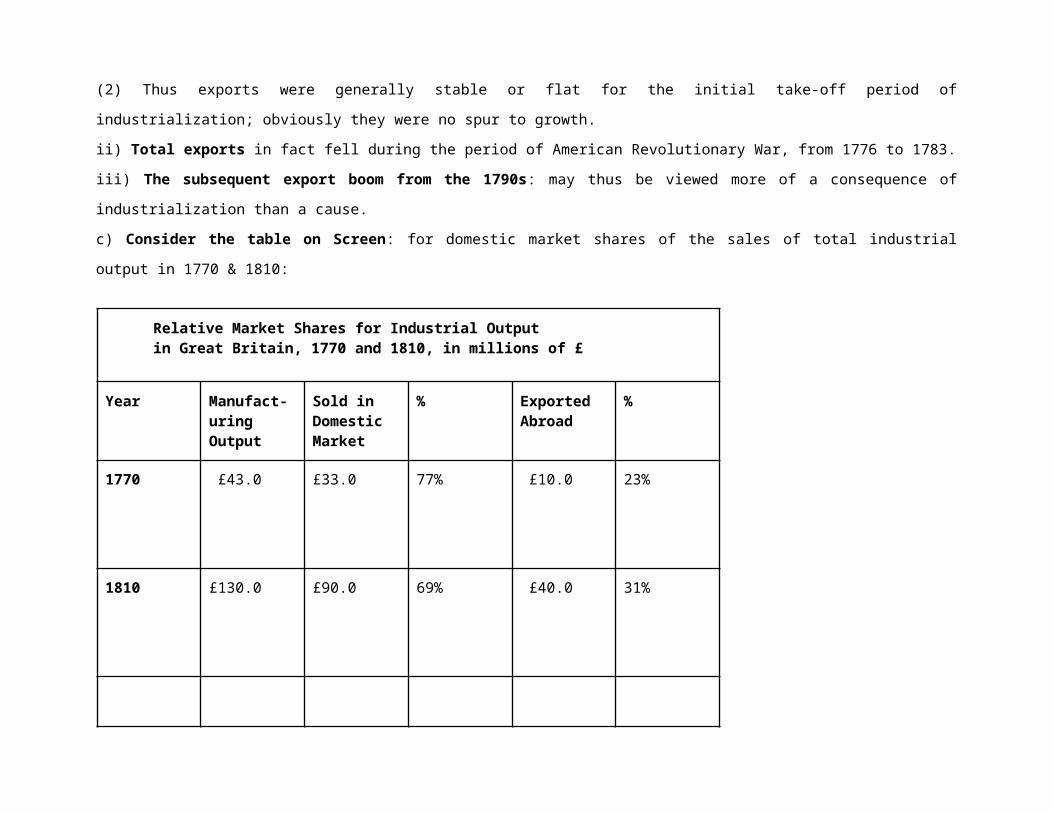
c) Consider the table on Screen: for domestic market shares of the sales of total industrial output in 1770 & 1810:
Relative Market Shares for Industrial Outputin Great Britain, 1770 and 1810, in millions of £
Year Manufact-uringOutput
Sold inDomesticMarket
% ExportedAbroad
%
1770 £43.0 £33.0 77% £10.0 23%
Relative Market Shares for Industrial Outputin Great Britain, 1770 and 1810, in millions of £
1810 £130.0 £90.0 69% £40.0 31%
i) In the 1770s: total output of manufactured goods is estimated at £43 million:
(1) of which only £10 million, or just under one quarter (23%), were exported,
(2) while about £33 million or just over three-quarters (76%) were sold in the domestic market.
ii) in 1810: total output of manufactured goods had risen three-fold to about £130 million:
(1) of which £90 million or over two-thirds (69%) were still sold in the domestic market,
(2) while just under a third of total manufactured goods produced (31%),
# about £40 million, were now being exported
# in absolute terms, a four fold increase from 1770s.
iii) with the export boom from 1790s:
(1) some relative increase in exports;
(2) but nevertheless the domestic market still remained predominant.
2. Factors Promoting Growth of the Domestic Market in 18th Century
a) Population Growth:
i) as noted previously – several times now -- England's population had doubled between 1750 and 1820:
(1) from about 6 million to almost 12 million
# 1751: 5.922 million for England (alone);
# 1821: 11.457 million for England alone; 12.269 million including Wales
(2) and then the population tripled again, from 12 to 36 million, from 1820 to 1910
ii) Scotland's population:
(1) may also have doubled (though we have no usable population figures before 1800):
(2) Scotland became part of the British domestic market in 1707, to be explained later
iii) While continental Europe's population was also growing, England's population growth was much faster.
(1) As was demonstrated in a table for the previous lecture,
# for the period 1681 to 1821, England's population grew 133% (annual rate of 0.95%),
# while France's grew only 39% (annual rate of just 0.28%),
# and the Netherlands just 8% (annual rate of 0.06%).
(2) In 1681, England's population had been only 22% of the French;
(3) but by 1821, the English population was 38% of the French: England had grown more than 3 times as fast as France.
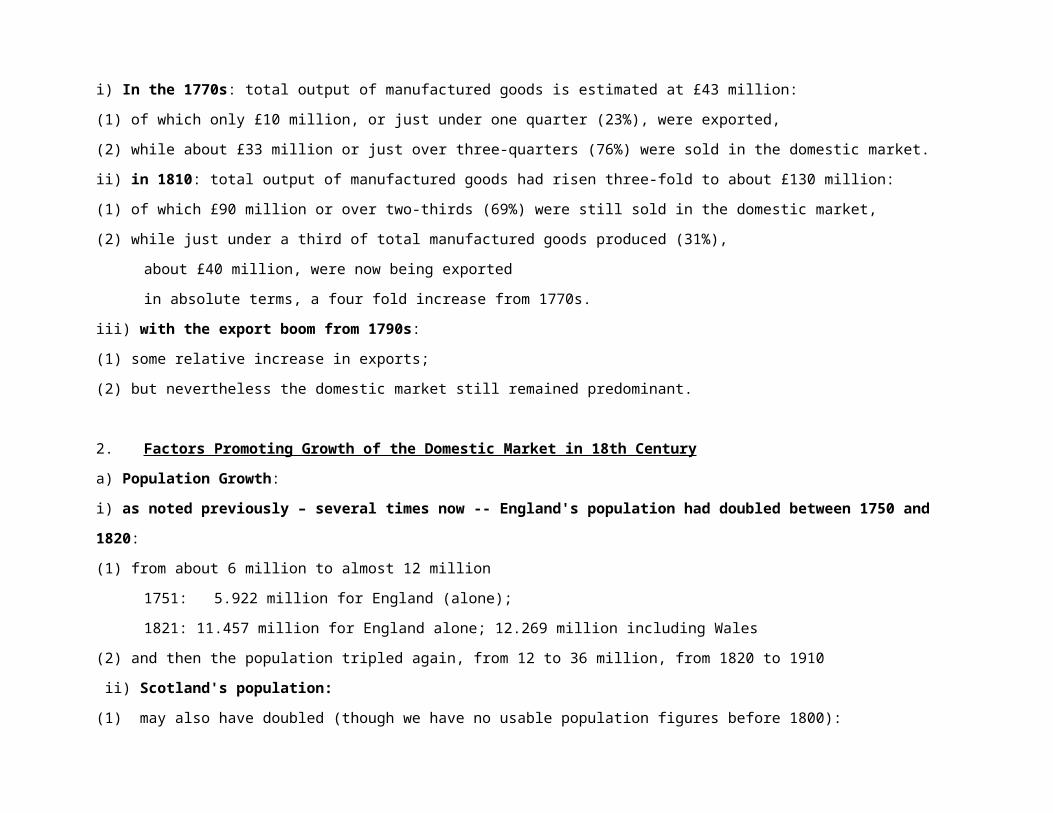
(4) Finally, consider this table on comparative European populations: 1550 - 1910
Estimated Population Totals and Percentage Growth Rates in Western Europe*
Population Totals (millions)
1550 1680 1820 1900
England 3.0 4.9 11.5 30.5
France 17.0 21.9 30.5 38.5
Netherlands 1.2 1.9 2.0 5.1

Spain 9.0 8.5 14.0 18.6
Italy 11.0 12.0 18.4 32.5
Germany 12.0 12.0 18.1 43.6
Western Europe 61.1 71.9 116.5 201.4
England as %Western Europe
4.91% 6.82% 9.87% 15.14%
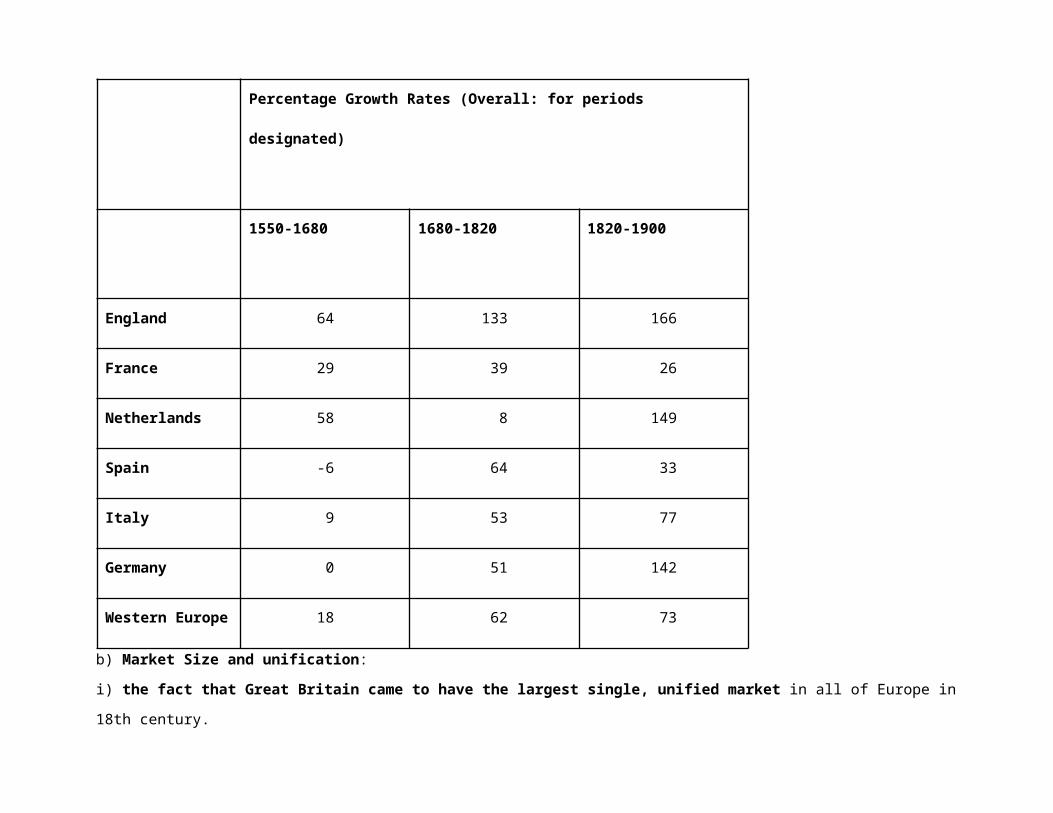
Percentage Growth Rates
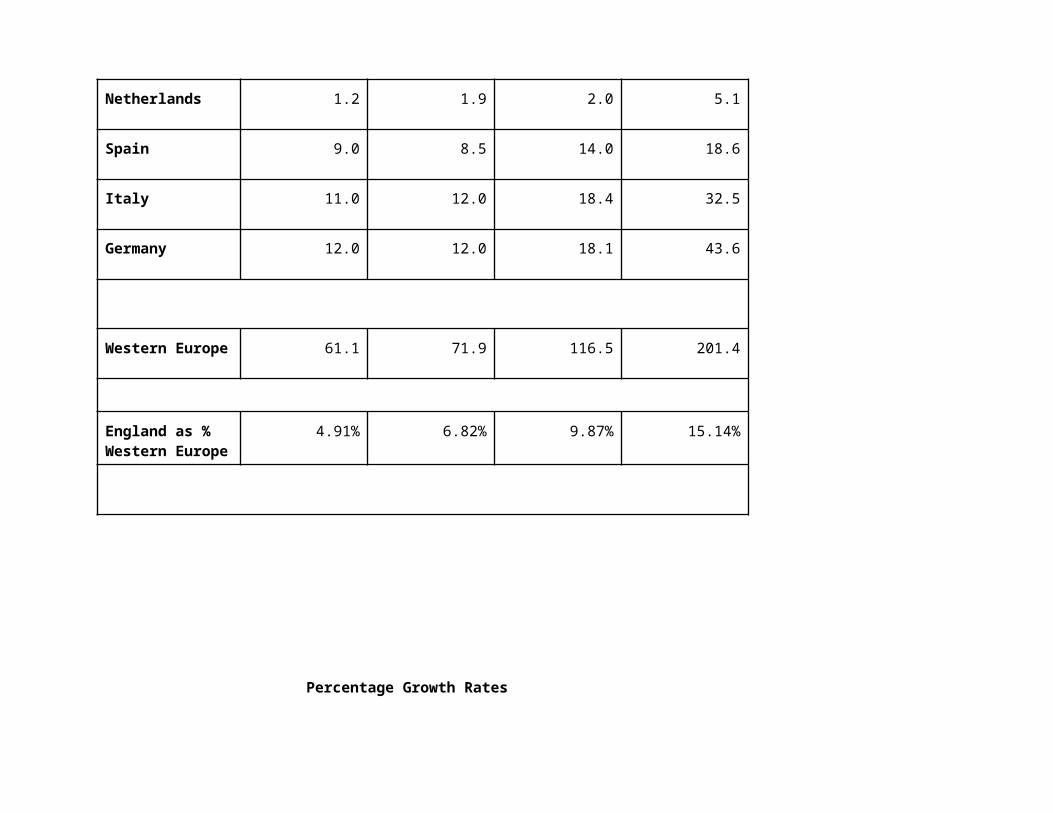
Percentage Growth Rates (Overall: for periods designated)
1550-1680 1680-1820 1820-1900
England 64 133 166
France 29 39 26
Netherlands 58 8 149
Spain -6 64 33
Italy 9 53 77
Germany 0 51 142
Western Europe 18 62 73
b) Market Size and unification:
i) the fact that Great Britain came to have the largest single, unified market in all of Europe in 18th century.
ii) England before the Act of Union, unlike almost all continental European countries had always enjoyed internal free trade:
(1) From the time of the Norman Conquest of England in 1086, England had avoided the feudal fragmentation – into self-ruling counties and
duchies and bishoprics, etc. – that had beset continental Europe from the Carolingian era (9 th - 10th centuries)
(2) as noted in an earlier lecture, England had become politically unified, under royal ‘common’ law and a centralized judicial administration,
from the reign of Henry II (1154-1189).
(3) Thus medieval and early-modern England did not suffer from internal provincial tariffs, river and road tolls and taxes of trade, etc. that
afflicted most of Europe: especially France, Germany, Italy, Spain, Central Europe, Russia.
(4) These continental countries would not enjoy internal free trade until after the French Revolution (and some not till mid 19th century).
iii) The Act of Union of 1707:
(1) From the Act of Union of 1707, uniting Scotland with England and Wales, Great Britain certainly came to have the largest single, and united
market, in Europe
(2) that political union expanded domestic market by about 20%.
(3) Political history: note that England and Scotland had the same king (and queen) as titular rulers from 1603:
# on the death of Elizabeth I, James VI of Scotland (descended from England’s Henry VII) succeeded her as James I of England (followed
by Charles I, Charles II, James II, William and Mary).1
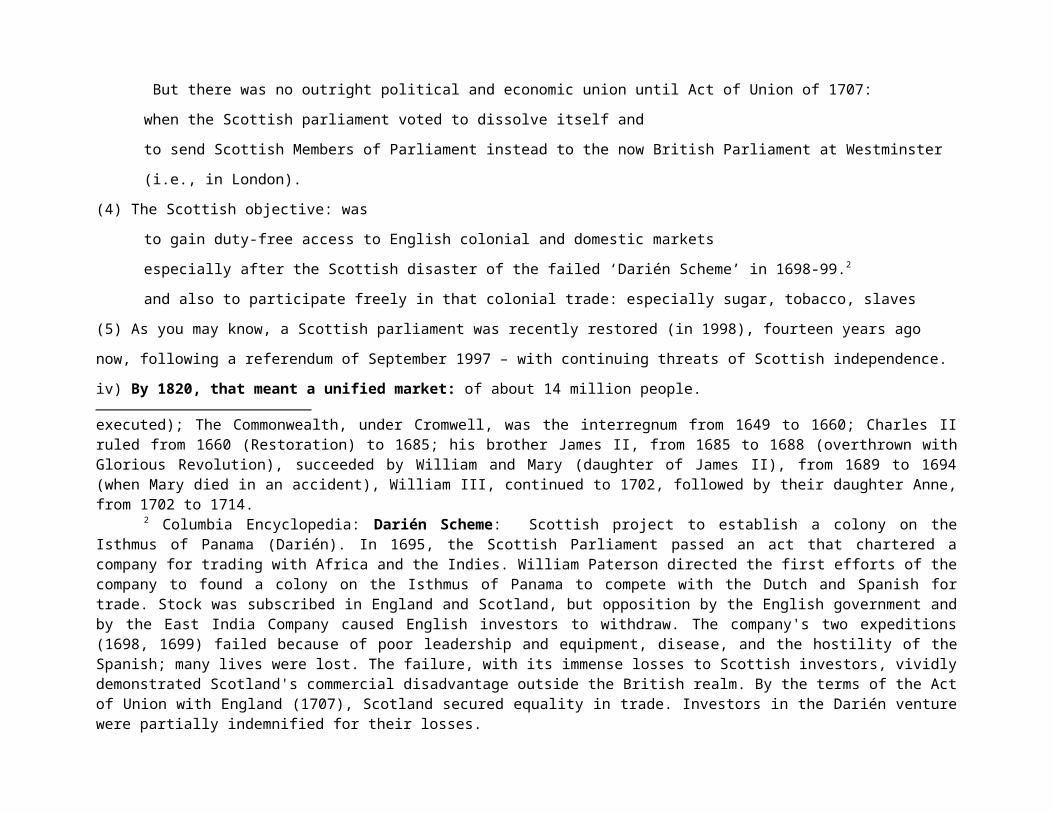
# But there was no outright political and economic union until Act of Union of 1707:
# when the Scottish parliament voted to dissolve itself and
# to send Scottish Members of Parliament instead to the now British Parliament at Westminster (i.e., in London).
(4) The Scottish objective: was
# to gain duty-free access to English colonial and domestic markets
# especially after the Scottish disaster of the failed ‘Darién Scheme’ in 1698-99.2
1 James I ruled, as king of England, from 1603 to 1625; Charles I, from 1625 to 1649 (when executed); The Commonwealth, under Cromwell, was the interregnum from 1649 to 1660; Charles II ruled from 1660 (Restoration) to 1685; his brother James II, from 1685 to 1688 (overthrown with Glorious Revolution), succeeded by William and Mary (daughter of James II), from 1689 to 1694 (when Mary died in an accident), William III, continued to 1702, followed by their daughter Anne, from 1702 to 1714.
2 Columbia Encyclopedia: Darién Scheme: Scottish project to establish a colony on the Isthmus of Panama (Darién). In 1695, the Scottish Parliament passed an act that chartered a company for trading with Africa and the Indies. William Paterson directed the first efforts of the company to found a colony on the Isthmus of Panama to compete with the Dutch and Spanish for trade. Stock was subscribed in England and Scotland, but opposition by the English government and by the East India Company caused English investors to withdraw. The company's two expeditions (1698, 1699) failed because of poor leadership and equipment, disease, and the hostility of the Spanish;

# and also to participate freely in that colonial trade: especially sugar, tobacco, slaves
(5) As you may know, a Scottish parliament was recently restored (in 1998), fourteen years ago now, following a referendum of September 1997 –
with continuing threats of Scottish independence.
iv) By 1820, that meant a unified market: of about 14 million people.
v) Ireland amalgamated with the now United Kingdom in 1805:
(1) Ireland had been subjected to the rule of English kings since the late 12 th century,
(2) but Ireland had developed and retained its own Parliament and customs system.
(3) in 1805, that Parliament was also abolished and Ireland was fully integrated into the United Kingdom.
(4) Ireland had a far larger population (perhaps 2.5 million) than did Scotland
c) Urbanization: i.e., larger cities to provide more efficient markets.
i) Britain had many more large cities: and much larger urban concentrations than any comparable area on continent (except the Netherlands):
ii) London was the most important:
(1) continuing to be the largest city in Europe.
(2) As previously noted [in last day’s lecture on Population],
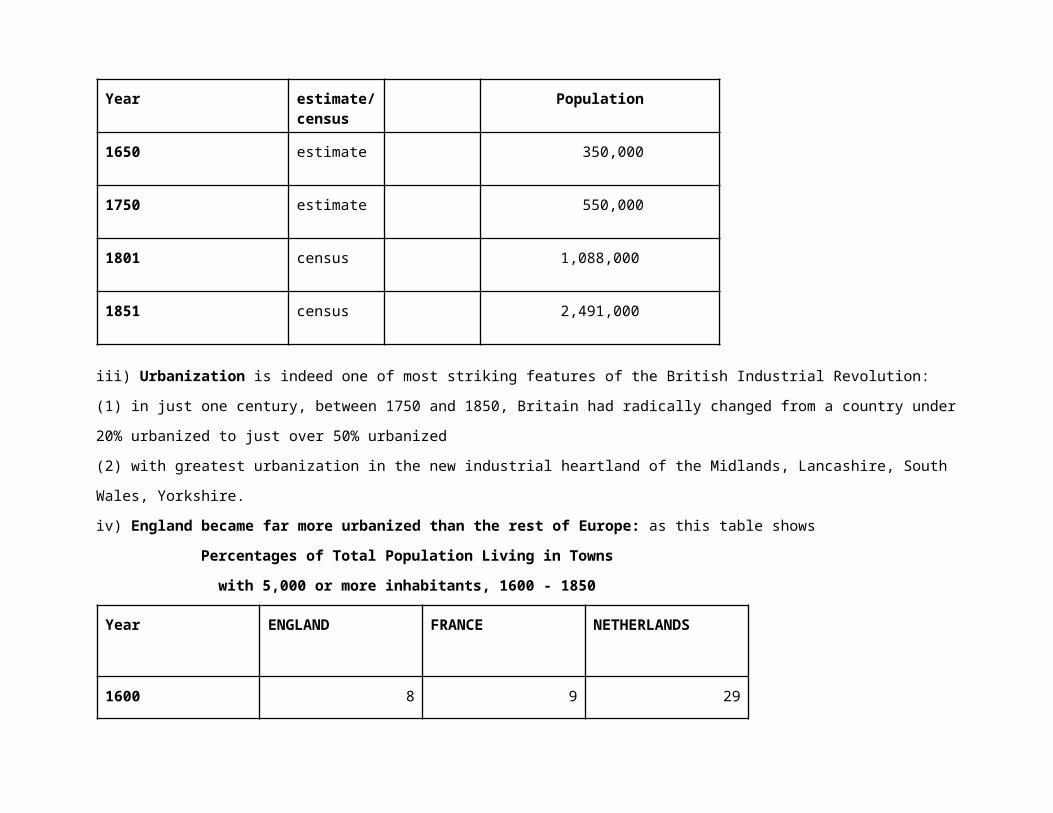
# London had grown from just about 500,000 in 1650 to just over 1.0 million by 1800,
# well more than doubling thereafter, to about 2.5 million by 1850.
Table 4. ESTIMATES OF THE POPULATION OF LONDON
Year estimate/census
Population
1500 estimate 50,000
many lives were lost. The failure, with its immense losses to Scottish investors, vividly demonstrated Scotland's commercial disadvantage outside the British realm. By the terms of the Act of Union with England (1707), Scotland secured equality in trade. Investors in the Darién venture were partially indemnified for their losses.
Year estimate/census
Population
1600 estimate 200,000
1650 estimate 350,000
1750 estimate 550,000
1801 census 1,088,000
1851 census 2,491,000
iii) Urbanization is indeed one of most striking features of the British Industrial Revolution:
(1) in just one century, between 1750 and 1850, Britain had radically changed from a country under 20% urbanized to just over 50% urbanized
(2) with greatest urbanization in the new industrial heartland of the Midlands, Lancashire, South Wales, Yorkshire.
iv) England became far more urbanized than the rest of Europe: as this table shows
Percentages of Total Population Living in Towns
with 5,000 or more inhabitants, 1600 - 1850
Year ENGLAND FRANCE NETHERLANDS
1600 8 9 29
1700 17 11 39
1750 21 10 35

Year ENGLAND FRANCE NETHERLANDS
1800 28 11 35
1850 45 19 39
Source: E. Anthony Wrigley, ‘British Population during the “Long” Eighteenth Century, 1680 - 1840’, in Roderick Floud and Paul Johnson, eds., Cambridge Economic History of Modern Britain, 3 vols. (Cambridge and New York: Cambridge University Press, 2004), Vol I: Industrialization, 1700 - 1860, Table 3.11, p. 88.
iv) That English (British) urban growth was initially the result,
(1) chiefly, of commercial expansion: i.e., in the major port towns of London itself, Southampton, Bristol, and Liverpool especially.
(2) but from the 1780s, it was much more so directly the result of industrialization itself.
d) Question of Say's Law: Supply Creates its Own Demand.3
In what respects did the Industrial Revolution create its own markets?
i) The technological changes of the industrial revolution, through cost and price cutting, did much to expand industrial markets (as will be
noted again in discussing foreign trade):
(1) by reducing prices within the purchasing power range of even the lower classes,
(2) to create a true mass market, at home and abroad.
ii) The Industrial Revolution, especially industrial urbanization, created demand in terms of:
(1) not only large concentrated urban markets,
(2) but a large and growing class of wage-earning proletarians (rural and urban),
# now entirely divorced from any self-sufficient rural economy,
# almost totally dependent upon cash markets to meet (satisfy) their needs.
3 Jean Baptiste Say (1767-1832): In his most famous work, A Treatise on Political Economy (1803), he advanced his law of markets, which claims that supply creates its own demand. See Lecture no. 2 (given in the first day of class, this year)..
e) The Question of Standard of Living and Real Wages:4
i) the concepts involved in the term ‘real wages’.
(1) The ‘real wage’ is the purchasing power of the nominal money wage, usually paid in silver coins, in medieval and early-modern Europe, and
indeed throughout the 19th century.
(2) The formula to express the real wage is usually given in terms of index numbers, with the base 100 representing an arithmetic mean of prices
and wages for some given period:
# RWI = NWI/CPI:
# i.e., the Real Wage is the Nominal Wage Index divided by the Consumer Price Index5
(4) I myself have used an alternative but related method, 6
# by first calculating the yearly value of the entire ‘basket of consumers’
# and then calculating the number of such baskets that a master craftsmen and a labourer could purchase with their annual money-wage
income.
# To do so, I estimated that the average number of days of paid employment in early-modern western Europe was 210 days (vs. other
4 The most recent major contributions to this still ongoing debate are: : Charles H. Feinstein, ‘Pessimism Perpetuated: Real Wages and the Standard of Living in Britain during and after the Industrial Revolution,’ Journal of Economic History, 58:3 (September 1998), 625-58; and Gregory Clark, ‘Farm Wages and Living Standards in the Industrial Revolution: England, 1670 - 1869’, The Economic History Review, 2nd ser., 54:3 (August 2001), 477-505. See the reading list for this A List debate/essay topic (but for the second term).
5 Many historians use the ‘basket of consumables’ price index and real wage index of Phelps Brown and Hopkins, who chose their base period as: 1451-1475 (a period stable prices and wages in England). See E.H. Phelps Brown, , and Sheila V. Hopkins, ‘Seven Centuries of the Prices of Consumables, Compared with Builders’ Wage Rates’, Economica, 23:92 (November 1956), 296-31; reprinted in E.M. Carus-Wilson, ed., Essays in Economic History, 3 vols. (London, 1954-62), vol. II, pp. 179-96, and in E.H. Phelps Brown and Sheila V. Hopkins, A Perspective of Wages and Prices (London, 1981), pp. 13-59.
6 See John Munro, ‘Builders’ Wages in Southern England and the Southern Low Countries, 1346 -1500: A Comparative Study of Trends in and Levels of Real Incomes’, in Simonetta Cavaciocchi, ed., L’Edilizia prima della rivoluzione industriale, secc. XIII-XVIII, Atti delle “Settimana di Studi” e altri convegni, no. 36, Istituto Internazionale di Storia Economica “Francesco Datini” (Florence: Le Monnier, 2005), pp. 1013-76; See also John Munro, ‘Wage Stickiness, Monetary Changes, and Real Incomes in Late-Medieval England and the Low Countries, 1300 - 1500: Did Money Matter?’ Research in Economic History, 21 (2003), 185 - 297.

estimates up to 320 days).
ii) Problems of estimating ‘real incomes’: we have to know the following:
(1) the real wage, as outlined above
(2) the standard hours of employment:
# with seasonal wages: i.e., more hours worked per day in summers (13 - 14 hours) than winters (8 hours)
# the average number of days of employment per year (as given above)
# the proportion of the adult labour pool unemployed per year
(3) The impact of inflation and deflation on real wages and real incomes
iii) The Debate about Rising Living Standards in England to ca. 1770: For the period preceding the Industrial Revolution, from about
1700 to 1760, there is little debate.
(1) Most agree that there was a significant rise in real incomes, up to the Industrial Revolution.
(2) Phyllis Deane, in particular, has estimated, for a somewhat longer period, that real incomes per capita almost doubled from:
# about £9 per head in 1700
# to about £12 per head in 1750
# and to perhaps £17 per head in 1780 .
(3) but both her estimates of aggregate national income and her population figures have now been challenged.
iv) For the Industrial Revolution era itself, however (1760-1820) this is a subject of hot and continuing debate:
(1) on whether or not real wages of artisans and labourers especially rose or fell during the initial phase of the Industrial Revolution:
(2) seemingly a debate between Marxists and Conservatives,
(3) though many non-Marxists (such as myself) argue that living standards did fall, but reasons other than those advanced by Marxists
v) The more important question may be changes in income distribution:
(1) were the lower classes, industrial workers, better or worse off?
(2) again, there is some general agreement that even the lower classes were experiencing a rise in real incomes, across most of England, until
perhaps the 1780s.
(3) statistical tables show that real industrial wages continued to rise in Lancashire, heart of Industrial Revolution, until the 1790s.
(4) but in London, with highest cost of living, real wages for artisans rose only to about 1750 and declined thereafter, until the 1820s.
vi) From the 1790s to about 1820: there is also agreement, though not general agreement, that the real wages of the lower classes, of much of the
agricultural and industrial proletariat, did decline to varying degrees. [See again the Lindert graph]
vii) The Debate over principal factors involved in decline of real wages:
(1) the Marxist contention that industrialization itself depressed real wages:
# i.e., that industrialization was financed by more a much more intensive exploitation of the working classes: in order to extract an even
greater ‘surplus value’ from labour [as the sole source of value, in Marxian economics];7
# by increasing investment at expense of consumption (a view that has not yet been proved, it must be noted).
# most Marxists, however, will readily concede that, by the 1850s, real wages were also rising for industrial labourers, and then, from the
1970s, very steeply rising
(2) The Kuznets U-Curve: a non-Marxist approach but with similar conclusions8
# that in the first phase of modern economic growth, especially with industrialization, there is a gradual transfer of wealth, resources, and
real incomes from the lower to the upper, and especially entrepreneurial or business strata of society
# but as entrepreneurial innovations become successfully implemented, to raise Total Factor Productivity throughout the economy, the
poorer strata of society benefit even more with rising real incomes: in this case, of the British Industrial Revolution, from the 1830s or
1840s
(3) The Malthusian Argument: the effect of population pressure
#
i.e., the Malthusian argument that population growth outstripped agricultural production, with diminishing returns on land
# i.e., Malthusian demographic pressures were most strongly experienced in terms of relatively inelastic food supplies:
# i.e., in terms of soaring grain prices, when grain products (including beer) accounted for a large share of income expenditures by the lower
classes, perhaps well over half of their incomes of the lower classes
# Those adverse consequences of population growth took place before the technological and other economic changes of modern
industrialization finally brought forth their fruits of higher productivity, perhaps only after about 1820.
7 See my web document A Layman's Guide to the Basic Principles of Marxian Economics: at http://www.economics.utoronto.ca/munro5/MARXECON.pdf
8 For Kuznets and the Kuznets U-curve, see lecture no. 2.

# The evidence and explanation for this will be seen in our examination of the agricultural sector.
# that Malthusian argument, as I have noted earlier, is still anathema to orthodox Marxists, who naturally wish to believe that
industrialization and capitalist exploitation was the prime cause of ‘immiserization’ (poverty), not population growth
(4) the effects (welfare consequences) of warfare: In particular the effects of the French Revolutionary and Napoleonic Wars, from 1793 to
1815: in terms of
# trade disruptions (Napoleonic blockades);
# inflationary consequences of warfare;
# government war-financing at the expense of current consumption (diverting national income to war).
(5) effects of monetary inflation:
# as a result of both fiscal and monetary policies in financing the wars with France from 1792 to 1815,
# especially during the era of the so-called ‘Paper Pound’ 1797-1815 (to be discussed later), when the government or the Bank of England
issued a veritable flood of paper money, or credit notes convertible into paper money (to be analysed in the later topic on banking and
finance).
# As a consequence of purely monetary inflation, with a vast expansion in the paper money supply and of government wartime
expenditures, consumer prices rose faster than wages.
# Thus inflation was arguably the prime determinant of changes in real incomes:
# inflation generally did and still does transfer income from the poorer to richer strata of society;
# and the most decisive fall in real incomes did occur during the inflationary wartime era, up to 1815.
v) The effects of Taxation and Warfare: many contend that war-time taxation and war financing did depress the domestic consumer market for
manufactures.
(1) Note: Most European warfare was financed by debts, rather than by direct taxes.9
# loans (borrowing) or by the sale of annuities (most commonly called rentes) to the national or state government.
# taxes were raised to pay the annual costs of such public finance: in the form of interest or annuity payments
9 See also John Munro, ‘The Medieval Origins of the Financial Revolution: Usury, Rentes, and Negotiablity’, The International History Review, 25:3 (September 2003), 505-62.

(2) An article by Peter Mathias and Patrick O’Brien, in the Journal of European Economic History (1976), argues that in the 18th and early 19th
century, the British tax burden rose 85%; 10
(3) and that these tax increases were more than double the increase of the French tax burden in the 18th century.
(4) Subsequently, Beckett and Turner in the Economic History Review, 2nd ser. (Aug. 1990), in examining British taxation in the 18th century,
supported the conclusions of Mathias and O'Brien 11
(5) and the results of their analyses can be seen in their graphs
# which show a very steep rise in real per capita taxes (in terms of public revenue) during the 18th century:
# overall a doubling from 1700 to 1800 (but almost a six-fold rise from 1660: indeed steepest rise was from 1689 to 1714, in the wars
against Louis XIV).
(6) Nevertheless they come to the surprising conclusion, for the Industrial Revolution era, an era of warfare, that ‘overall, the evidence does not
seem to suggest that warfare increased the level of taxation to the point where it was likely to affect demand’.
(7) And: ‘Consequently it must have been war, rather than taxation in wartime, which reduced consumption of overseas goods (and thereby
reduced customs [revenue] )’.
(8) The nature of taxation of the lower and middle classes in this era was highly regressive:12
# as indicated, customs duties or tariffs on the importation of various goods, including food
# excise taxes on the sale of foodstuffs – beer, wine, bread, meat, fish, etc. – and other consumables, such as textiles.
# levied at the same rate for everybody without exemptions.
# excise duties had long been imposed in continental European countries,
# but were not introduced into England until much later: in the Long Parliament of July 1643, just after the outbreak of the Civil War
between Parliament and the Crown.
10 Peter Mathias and Patrick O'Brien, ‘Taxation in Britain and France, 1715 - 1810: A Comparison of the Social and Economic Incidence of Taxes Collected for the Central Governments’, The Journal of European Economic History, 5 (Winter 1976), 601-50.
11 J. V. Beckett and Michael Turner, ‘Taxation and Economic Growth in Eighteenth-Century England’, Economic History Review, 2nd ser. 43 (August 1990), 377 - 403.
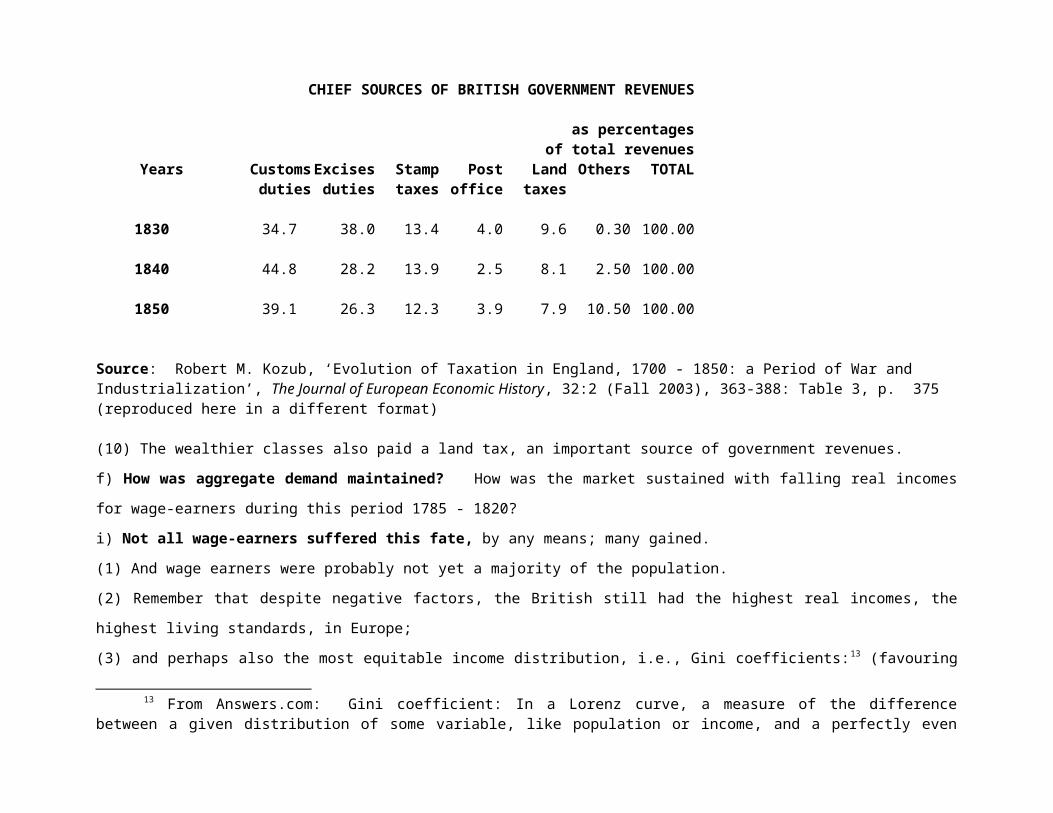
12 See: Robert M. Kozub, ‘Evolution of Taxation in England, 1700 - 1850: a Period of War and Industrialization’, The Journal of European Economic History, 32:2 (Fall 2003), 363-388: Table 3, p. 375 (reproduced, in a different format, in the Appendix to this lecture).

(9) The following table indicates both the proportions and regressivity of both excise taxes and customs duties on consumption:
CHIEF SOURCES OF BRITISH GOVERNMENT REVENUES
as percentages of total revenuesYears Customs Excises Stamp Post Land Others TOTAL
duties duties taxes office taxes
1700 35.0 23.7 2.1 1.8 34.1 3.30 100.00
1710 25.5 29.5 1.9 1.2 34.9 7.00 100.00
1720 26.4 39.2 2.8 1.5 24.4 5.70 100.00
1730 31.3 44.8 2.5 1.5 24.9 -5.00 100.00
1740 24.7 49.0 2.3 1.5 26.4 -3.90 100.00
1750 20.6 46.2 1.8 1.2 29.6 0.60 100.00
1760 22.9 45.8 3.1 0.9 29.2 -1.90 100.00
1770 25.0 45.2 3.0 1.4 15.8 9.60 100.00
1780 22.1 48.5 4.3 1.1 20.1 3.90 100.00
1790 20.3 45.3 7.8 2.2 17.6 6.80 100.00
1800 21.5 33.5 8.3 3.8 16.1 16.80 100.00
1810 21.1 35.8 8.7 2.5 12.1 19.80 100.00
1820 22.4 45.5 12.0 3.6 14.1 2.40 100.00
1830 34.7 38.0 13.4 4.0 9.6 0.30 100.00
1840 44.8 28.2 13.9 2.5 8.1 2.50 100.00
1850 39.1 26.3 12.3 3.9 7.9 10.50 100.00

CHIEF SOURCES OF BRITISH GOVERNMENT REVENUES
as percentages of total revenuesYears Customs Excises Stamp Post Land Others TOTAL
duties duties taxes office taxes
Source: Robert M. Kozub, ‘Evolution of Taxation in England, 1700 - 1850: a Period of War and Industrialization’, The Journal of European Economic History, 32:2 (Fall 2003), 363-388: Table 3, p. 375 (reproduced here in a different format)
(10) The wealthier classes also paid a land tax, an important source of government revenues.
f) How was aggregate demand maintained? How was the market sustained with falling real incomes for wage-earners during this period 1785 -
1820?
i) Not all wage-earners suffered this fate, by any means; many gained.
(1) And wage earners were probably not yet a majority of the population.
(2) Remember that despite negative factors, the British still had the highest real incomes, the highest living standards, in Europe;
(3) and perhaps also the most equitable income distribution, i.e., Gini coefficients:13 (favouring mass markets.
ii) Industrialization brought a far higher proportion of the population within a market economy, thus expanding market demand.
iii) Remember that population and thus aggregate demand continued to expand: in this period of supposedly falling real wages.
iv) Some evidence that wage-earners, not wishing to surrender the higher standard of living they had become used to, sacrificed leisure
instead: i.e., to work harder and longer to maintain their cash incomes.
v) Price Indices used to measure the inflation and thus fall in real incomes can be misleading:
(1) the price components (of the weighted basket) are not changed by statisticians;
(2) and thus the indices do not take account of consumer substitution: i.e., switching from higher to lower priced goods.
13 From Answers.com: Gini coefficient: In a Lorenz curve, a measure of the difference between a given distribution of some variable, like population or income, and a perfectly even distribution. More simply, it tells us how evenly the variable is spread; this might be a measure of how wealth is distributed over the regions of a country, or over the classes in society. A diagonal line shows an even distribution, and the calculation of the Gini coefficient uses the ‘gap’ between the diagonal and the actual curve. The coefficient, also known as Gini's concentration ratio, may be calculated as the ratio of area between the diagonal and the Lorenz curve to the total area beneath the diagonal. The lower the Gini coefficient, the more evenly spread the variable.

vi) Agricultural gainers vs urban industrial losers:
(1) If the chief factor reducing real incomes for wage-earners was soaring food prices, and general inflation, then many or most of those engaged
in the agricultural, distribution, and commercial sectors were gainers:
(2) and it is very difficult to balance off these changes in income distribution, between gainers and losers in an era of inflation.
vii) The renewed importance of the export sector from the 1790s:
(1) If we focus on the period of warfare with France, from 1792 to 1815, and if we concede that the costs of warfare combined with perhaps some
Malthusian pressures together depressed purchasing power in the domestic consumer market, if we agree that the middle and lower classes
suffered a reduction in real incomes, then: ➔(2) As we shall see shortly, in examining British foreign trade, this very period experienced a very strong and sustained export boom, which
evidently compensated for any decline in the domestic market.
3. Inland Transportation and the Domestic Market
a) Inland Transportation: without adequate transportation facilities, that growth in domestic demand could not have been translated into
effective market demand:
i) England's internal transportation facilities had been indeed inadequate for the needs of modern industrialization, constituting an
important barrier to growth that had to be removed.
ii) Compared to most continental countries, England's roads and highways were in a deplorable state -- based on old Roman and medieval
roads, and in much inferior condition, with inadequate maintenance: ‘What God had left after the Flood’.
iii) Before the 18th century, so costly was much internal land transport that many of England's coastal towns had a much closer economic
contact with continental coastal towns than with their own hinterland.
iv) That illustrates once more the cardinal importance of maritime shipping: as the initial basis for rapid commercial expansion.
v) Defective internal transportation: meant that England did not possess an integrated national economy, but a mosaic of local, regional
economies.
b) Nevertheless, Britain did possess one major advantage over most continental countries:
i) being a small island with many rivers, so that almost no place was more than 70 miles from some form of water transport.
ii) Furthermore, in England, thousands of kilometres of its rivers and internal waterways had been dredged and made navigable since the 16th
century.
iii) In fact some contend that: this river-navigation system gave England a tremendous market advantage over most continental countries, more
than offsetting the deficiencies of her road system.
iv) The initial solution to the transport problem was simply to link up the navigable portions of those rivers by canals : and thus that
transport barrier, while important, was one that was easily remedied.
v) The ensuing creation of a canal network, from 1760 to 1800,
(1) provided Britain with a transport grid that was much superior to those of most continental countries,
(2) who really had to wait until the coming of the railroad in 19th century to give them equivalent transportation facilities.
c) Origins and Creation of the Canal Network:
i) growth of towns provided the initial stimulus:
(1) the need to supply growing towns with adequate supplies of grain and fuel, coal fuels,
(2) especially when urbanization, settlement, and industrial expansion had resulted in considerable deforestation and high cost wood fuels.
ii) again, an example of how population pressure forced economies in use of natural resources: which led to a shift from wood to coal fuels,
cheap coal fuels carried by canals.
iii) 1759 marks the real beginning of the Canal Era:
(1) when the Duke of Bridgewater (appropriately named) built a canal from his coal mines at Worsley (canals partly underground) to Manchester,
20 miles away.
(2) That cut cost of shipping coal in half;
(3) and his example sparked a veritable canal building mania
(4) first with canals linking Manchester and seaport of Liverpool.
iv) By 1790, England had developed the basic structure of the so-called Cross Scheme or Wolverhampton Network:
(1) as shown on the map
# from Hull in the north-east to Bristol in the south-west;
# from Manchester-Liverpool in the north-east to London in south-east.
(2) These canals crossed at Wolverhampton near Birmingham in metal-working Midlands:
(3) hence the name ‘Cross Scheme’ or ‘Wolverhampton Network’.

d) Economic Consequences of the Canals:
i) For industry: great reduction in cost of supplying industrial outputs: cut costs of shipping bulky raw materials (coal, iron, cotton, etc.) from
50% to 75%, compared to overland transport.
ii) For marketing final goods: or shipping goods to seaports for export abroad, similar if lesser reduction in transport costs.
iii) That made possible not only a far broader geographic extension of the market: to embrace all of Britain, but also meant an increased
range of the market in terms of purchasing power: i.e., lower costs and prices brought goods within range of the lower classes.
iv) For agriculture in particular: canals brought all of the arable land finally within reach of the market economy: and canals were themselves a
major factor in thus promoting agricultural modernization and growth, as will be shown in the subsequent lectures on agrarian change.
v) For industrial location: I must here stress that the combination of both canals and coalfields largely determined most industrial location in
Great Britain during the Industrial Revolution; and that pattern of industrial urbanization was not really changed by the railroad in 19th century.
e) Canals were not, however, an unmixed blessing:
i) they were natural monopolies: sanctioned by Parliament, which incorporated them and gave them exclusive rights of way.
ii) Those monopoly powers did lead to inefficiency and over-charging (i.e., beyond high cost):
(1) so that by the 1820s the canals themselves had become an obstacle to further economic growth,
(2) necessitating a new stage in the transportation revolution, in the form of the railroad: steam-powered locomotives.

F. The Expansion of the Market: Foreign Trade:
1. Foreign Trade: The ‘Commercial Revolution,’ or The Era of ‘New Colonialism’, 1660 - 1760:
a) The role of foreign trade in British Industrialization:
i) Foreign markets were rather less important than the domestic market for industrialization, during the first phase of the Industrial
Revolution era (up to about 1815), as I argued earlier, in contrast to much of the traditional literature
ii) To repeat the key points made earlier about foreign trade:
(1) exports: first, as you can see from the table on the screen:
# British exports, after having rapidly expanded during the first half of the 18th century, reached a plateau by the 1760s, on the eve of the
Industrial Revolution,
# and then remained stagnant for the next thirty years, until the mid 1790s.
(2) the domestic market share: in the 1770s, as another table indicated:
# was accounting for over three quarters -- for 77% -- of total sales of industrial manufacturing goods,
# reflecting as well the fact that foreign markets for the new industrial goods were not so well developed, accounting for just 23% of total
sales by value.
ii) nevertheless, by 1810, sales of manufactured goods had been shifting more and more towards foreign markets,
(1) so that exports were now accounting for 31% of sales of domestically manufactured goods;
(2) while the domestic market still accounted for a hefty 69% of that output;
(3) then, after the Napoleonic Wars -- after 1815 --foreign markets would soon become predominant; and continued British industrialization and
economic growth did fundamentally depend upon the export sector.
iii) At the same, British economic growth was also becoming just as dependent on imports:
(1) not only for supplies of raw cotton and other industrial inputs, but equally important,
(2) for imported foodstuffs, because continued rapid population growth had well outstripped domestic food supplies and Britain.
(3) In essence, as so strongly stressed earlier: 19th-century Britain was able to grow so rapidly, tripling its population – from 12 to 36 million–
only by earning sufficient export revenues to buy more and more foreign foodstuffs and other imported commodities.
(4) and it also managed to do so with continually rising living standards (at least from the 1830s)
iv) In these crucial aspects, therefore, British industrialization finally did come to depend on foreign trade:
(1) initially that foreign trade sector had depended upon Britain’s establishment of an overseas colonial and commercial empire,
(2) and defended by naval power and state support, under protectionist economic policies that we call Mercantilism, our next topic.
v) We must begin again with the decade of the 1660s as yet another crucial turning point: to see how Britain established this overseas
empire, and a Mercantilist structure for her foreign trade, and how together they promoted British industrialization, indeed in a way that no other
European colonial empire did.
b) The 1660s as a significant turning point in English commerce: two connected views
i) Ralph Davis Ralph Davis: The Commercial Revolution Thesis [by the author of the Rise of the Atlantic Economies (1973)]:
(1) Davis argued that the 1660s was the onset of a veritable ‘commercial revolution’, breaking a three-fold, centuries long commercial
dependence
# broke England’s centuries old commercial dependence on the nearby continent,
# and dependence on the Low Countries and Dutch in particular, as intermediaries who then dominated European shipping and commerce.
# and broke England’s dependence on one export commodity: originally raw wool (producing Europe’s finest, in great abundance), and
then, from the later 15th century, woollen cloth, which together had accounted for over 90% of the value of English exports, up to the
1640s.
(2) Such attempts at least the first objective had begun as early as the 1550s:
# with the break away from the Antwerp market (controlled by England’s enemy, Spain): to establish the first overseas joint-stock trading
companies (Russia Company, Levant Company, East India Company)
# Also: Although the English had set out to establish an overseas colonial and commercial Empire at the same time as the Dutch, both
around 1600, the English had really lost out to the Dutch, had then failed really in these endeavours, in the early 17 th century.
(3) Only from the 1660s were they finally successful in establishing and developing an overseas commercial empire in Asia (principally India), the
Caribbean, and the Americas -- indeed all at the same time;
(4) Those overseas colonial developments from the 1660s dramatically altered the fundamental character of both the export and import trades,
while also greatly expanding British sea power.

ii) Eric Hobsbawm: his thesis of the 17th-century ‘General Crisis’ and a ‘New Colonialism’ as the outcome of that General Crisis:14
(1) As I suggested earlier, this General Crisis theory represents
# Hobsbawm’s own individual interpretation of the more general Marxist theory of a necessarily ‘revolutionary’ transition from Feudalism
to modern Capitalism,
# one that in particular paved the way directly for the British Industrial Revolution-- an intriguing position, whether or not one is
sympathetic to Marxism (I am not).
(2) In particular, Hobsbawm saw the 1660s as a crucial turning point away from what he called ‘Old Colonialism’ towards a fundamentally
different ‘New Colonialism’,
(3) which, he argued, was much more conducive to modern industrialization than the older forms of colonialism — and also more so than the
Dutch and French forms of colonialism.
(4) In his view the original Old Colonialism, representing the initial phase of European overseas expansion from about 1450 to 1650, had been
based on two commodities:
# spices and precious metals,
# or more succinctly: pepper and gold.
(5) These had served as the twin lures of lucrative profit that had lured first the Portuguese, then the Spanish, Dutch, English and other West
Europeans into overseas expansion and colonialism from the mid 15th century (i.e., from before Columbus).
(6) The Portuguese and Spanish explorations, with their conquests in Africa, Asia, and the Americas, had sought and indeed fought
# to gain monopoly control over spices (chiefly pepper) in Africa
# and then more importantly in Asia;
# similarly over gold in Africa, and then silver in the Americas.
(7) Hobsbawm argued that, by the early to mid-17th century: costs were rising above revenue
# the costs of conquests, warfare, and piracy amongst fiercely competing Europeans in a race for colonies,
# and that the costs of trying to maintain and control of this new international maritime trade
# had outstripped any profits to be derived from exploiting these colonies for bullion and spices;
# and that brought about a crisis in the Old Colonial trades.
14 Eric Hobsbawm (1917 - 2012): he died on 1 October 2012, aged 95, after a most productive life.
(8) That crisis in turn forced these European powers to develop a fundamentally new type of colonialism: one based on mass production of
cheaper commodities:
# a colonialism that was initially much less profitable but in the long run proved to be far more beneficial by promoting overseas
settlements and economic growth both in the colonies and the Mother countries,
# and in particular in promoting the Industrial Revolution in Great Britain, the country that best succeeded in engineering and developing
this New Colonialism.
iii) The Foundations of Mercantilism can be found in both the Hobsbawm and Davis theses: as state economic policies to foster economic
growth by promoting foreign trade and export-oriented manufacturing industries.
iv) To understand both of these theses, concerning the ‘Commercial Revolution’ and the ‘New Colonialism’, and in turn the formulation of
early-modern Mercantilism and state intervention, we have to look very briefly at a genuine commercial crisis in the mid-17th century to see why
the 1660s is indeed a turning-point.
c) Commercial Depression during an era of ‘General Crisis’ up to the 1660s:
i) For many historians, and not just Hobsbawm, much of the 17th century marked an era of ‘general crisis’: in both the European economy
and its society;
ii) almost all historians agree that the period from 1615 to 1660, in particular, was one of commercial crises and depression, for most countries,
excepting perhaps the Dutch.
iii) For England, this era marked the end of a two-century industrial-commercial era:
(1) in which English foreign trade had been propelled by the exports of England's own primary manufacture, woollen textiles .
(2) which, however, still remained the single most important export until about 1800.
iv) Warfare and especially the Thirty Years' War, 1618-48:
(1) is seen as many as the chief cause of that depression, by so seriously disrupting important English cloth markets in Germany, Poland, and
Central Europe,
(2) during an era when over 80% of English exports by value were in the form of woollen textiles.
v) Demographic decline or at best stagnation in much of western Europe: also helped to depress commerce in general.
(1) with significant depopulation in Germany, Poland, Italy, Spain, eastern France.
(2) I have already noted that even England and Holland, as the two economic leaders of the European economy in this era, suffered from some

population decline in the mid-17th century.
vi) An evident agrarian recession throughout western Europe:
(1) with steadily falling grain prices, and a contraction in the Baltic grain trades, also harmed English overseas commerce.
(2) The nature of that agrarian recession will be examined more thoroughly in the next major topic, on agriculture.
vii) Monetary Contraction: with some deflation (to be seen later):
(1) For both Dutch and English (and other European) commerce with the East, first under Old Colonialism but under New Colonialism as well,
# the outflow of bullion, and especially silver to both the eastern Baltic (including Russia), and to Asia came to exceed the influx of bullion
from the Americans,
# especially during the second half of the 17th century and the early 18th century.
(2) Why did the Dutch and English East India Companies conduct their Asian trade principally with bullion (gold and silver, but chiefly silver: see
tables in the Appendix)?
# because western Europe had few commodities – other than metals such as copper and iron – that found any markets in Asia
# certainly not wanted was Europe’s principal export: heavy-weight woollen cloths!!
# In general, Europeans could not yet manufacture commodities of the same quality and that same cost and prices as those available from
Asian manufacturers
# but the principal reason was likely very high transportation and transaction costs: in transporting goods some 10,000 - 15,000 km from
Europe to southern and eastern Asia, the resulting prices to cover all costs would have been prohibitively expensive.
(3) others aspects will be examined in the following topic on banking and finance, in which many significant innovations, especially paper money,
were in response to the scarcity of coined money;
(4) but for now our chief consideration is the fact that monetary scarcity itself certainly impeded commercial expansion, especially in Europe,
before these financial innovations took hold.
(5) In particular, a major consequence of monetary contraction was deflation, which was in turn very harmful to industry and business, in:
# raising the real factor costs of production: for labour (wages), land (rents), and capital (interest), because those factor prices did not fall
with the fall in commodity prices (CPI)
# thus discouraged borrowing – but also lending, if the lender feared that worsening business conditions would threaten non-payment of
debts.

viii) The Dutch, during this era of commercial crisis, fared much the best: indeed the Dutch, in so firmly establishing such a firm supremacy
in overseas shipping, commerce, and finance, seemed to hinder the English (and the French) all the more in their attempts to overcome this
commercial crisis.
ix) Hence again Hobsbawm's Crisis of ‘Old Colonialism’ as part of the ‘General Crisis’:’
(1) forcing a transition to a New Colonialism based on settlement, plantations, and colonial economic development rather than -- in his view --
mere theft of their possessions,
(2) though colonial exploitation nonetheless (in his view): more specifically a colonialism based on Asian cotton textiles, Caribbean sugar, and
American tobacco; and later also, Asian tea.
d) Chief significance of the 17th-century economic crises: for many historians was to promote a dramatic re-orientation of English overseas
commerce, from the 1660s, as follows, that would lead to an overseas commercial empire far more conducive to industrialization than any other
European power:
i) first, to promote overseas trade diversification:
(1) in order to break English two-fold commercial dependence:
# on woollen cloth exports and
# on export markets in nearby north-western Europe and the Baltic
(2) and to expand overseas commerce in the Mediterranean regions and then overseas.
ii) second, to promote overseas colonial expansion, as bases for world-wide trade:
(1) In Asia and the Indian Ocean:
# when the English/British failed in challenging the Dutch in the East Indies [modern day Indonesia], they turned their attention to the
Indian subcontinent (modern day India, Pakistan, Bangladesh, Sri Lanka, and Burma – now officially ‘Myanmar’):
# and here were more successful, certainly from the 1660s
(2) In the Caribbean
# again the English were far more successful than the Dutch and the French in creating, expanding, and holding colonies, and again from the
1660s.
# especially those based on sugar plantations: Jamaica, Barbados, Westward and Leeward islands (later: Trinidad: from Spain)
# The Dutch West India Company, in the Caribbean, was an utter failure, unlike the Dutch East India Company in Asia: so that the Dutch

ended up holding only Surinam (Dutch Guiana) and the island of Curaçao (both taken from Portugal)
(3) North America:
# The greatest Dutch failure in North America was to engage in the economics of Old Colonialism in their one and only colony: the very
small colony of Nieuw Nederland [New Netherlands], along the Hudson River, including the town of Nieuw Amsterdam, and its northern
capital, Fort Orange (now Albany, the capital of New York state)15
# the Dutch utilized this colony for one sole purpose: the fur trade, thereby discouraging settlement, in order to retain the forests as
preserves for the beaver and other such animals.
# Small and weak, and surrounded by English colonies, the Dutch lost this colony when English military forces invaded at the outbreak of
the Second Anglo-Dutch War in 1660
# The English renamed Nieuw Amsterdam as New York: and you do not have to be told how important New York became for the North
American economy.
# The French, with a similar focus (at least in Nouvelle France – Quebec) on the luxury fur trade, ultimately lost New France to Britain
(1763) and the far vaster Louisiana Territory (French settlement from 1718) to the new republic of the United States (purchased in 1803;
and Louisiana became a state in 1812).
# The 13 British colonies in North America that became the Republic of the United States had been settled independently of English/British
government controls or management – unlike the other European colonies – and were developed on an agrarian, commercial, and
industrial base to achieve relative self-sufficiency, with the best prospects for economic growth
# These colonies indeed enjoyed a remarkably rapid demographic and economic growth in the later 17 th and 18th centuries, to enjoy the
world’s highest standard of living (and thus market purchasing power)
(4) In essence, the English created an overseas commercial Empire that was far more conductive to modern industrialization – in terms of markets
and raw materials (cotton) than either the Dutch or the French overseas commercial empires.
(5) This story is, however, better told in my ECO 301Y course and online lectures.16
iii) third: to promote the development of Mercantilism:
15 See the first lecture for this course: not given in class, but put online, at this URL:http://www.economics.utoronto.ca/munro5/01dutcom.pdf
16 http://www.economics.utoronto.ca/munro5/lecnot301.htm. See also the Power Point versions of these lectures, at this URL: http://www.economics.utoronto.ca/munro5/301LectSummaries.htm
(1) economic nationalism, in both economic philosophies and policies geared to national power and protectionism, based on the concept that
wealth & power were determined by a nation’s stock of precious metals.
(2) This is a separate lecture topic, following this one.
iv) fourth: to promote the development of new colonial trades:
(1) a commerce in new colonial products, for both European and overseas markets, broadly based.
(2) colonial products chiefly from: greater India, Caribbean [Jamaica, Windward & Leeward Islands], and the North American colonies
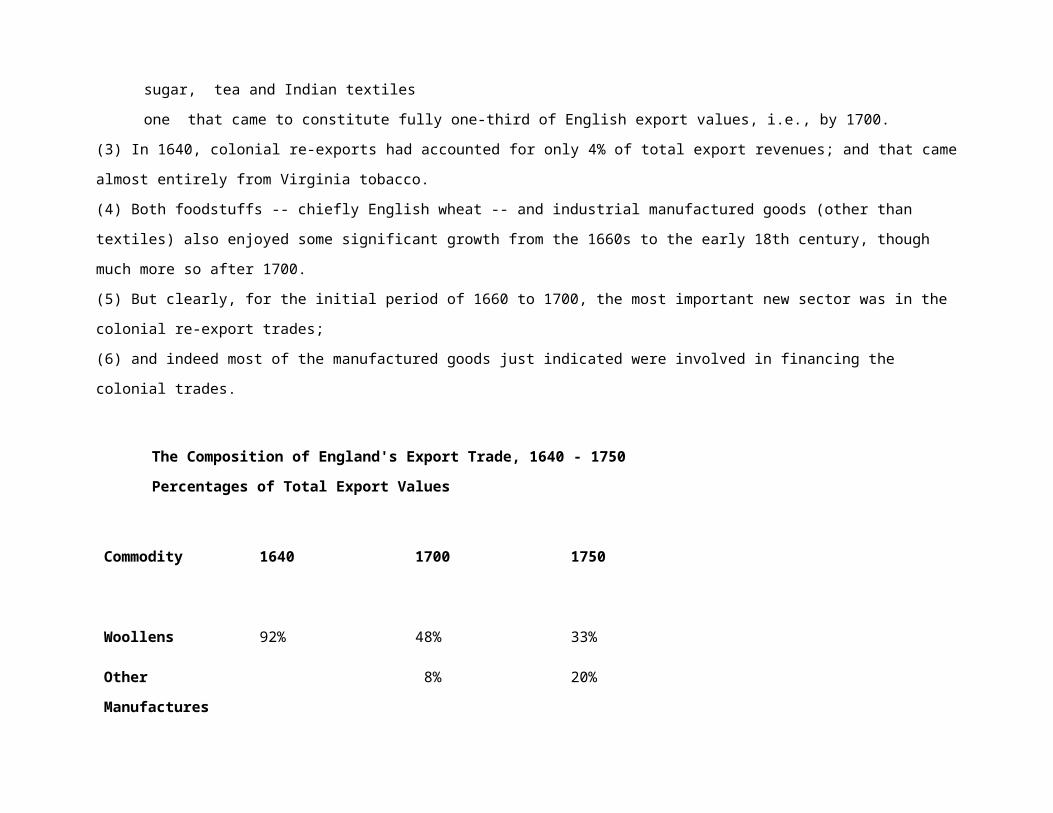
v) The nature and success of that commercial reorientation achieved after the 1660s can be seen in the following table on the screen, which
shows the following:
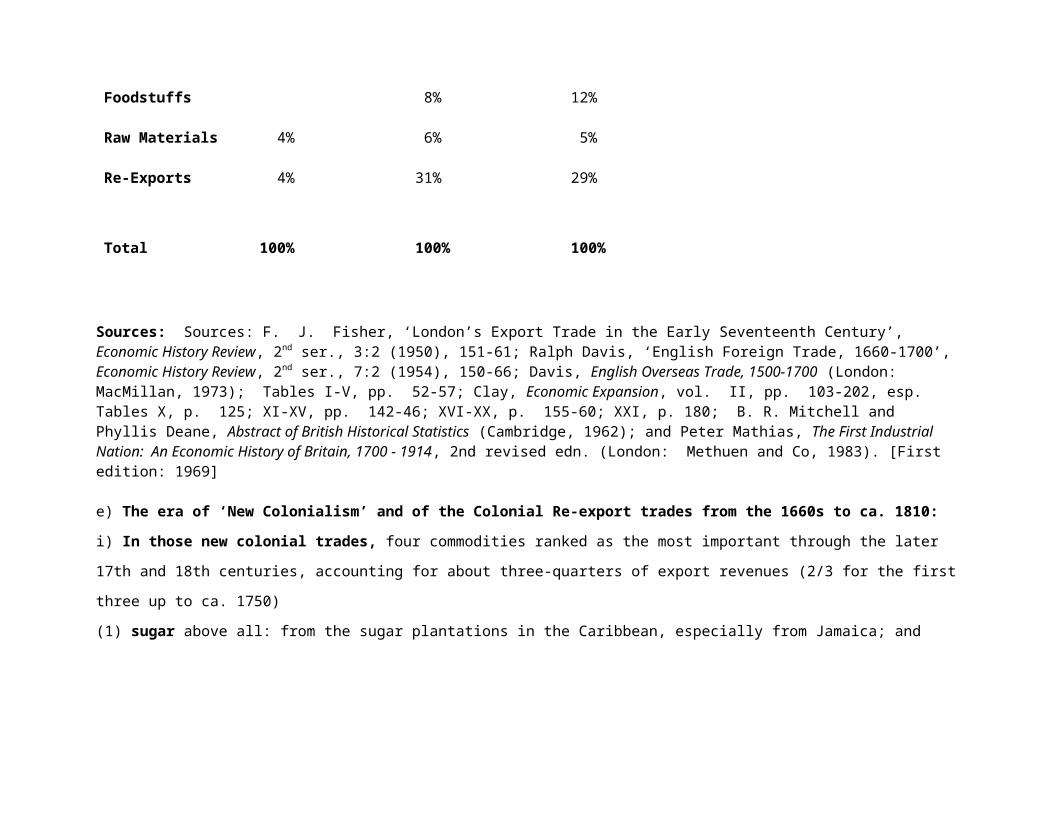
(1) that the value of woollen cloth exports fell from 92% of total export revenues in 1640 to just 48%, under half, by 1700, while:
(2) over the same period, from the 1660s to 1700,
# the English developed a virtually new trade in colonial products,
# as a re-export trade (i.e., re-exports of processed colonial goods): principally in tobacco, sugar, tea and Indian textiles
# one that came to constitute fully one-third of English export values, i.e., by 1700.
(3) In 1640, colonial re-exports had accounted for only 4% of total export revenues; and that came almost entirely from Virginia tobacco.
(4) Both foodstuffs -- chiefly English wheat -- and industrial manufactured goods (other than textiles) also enjoyed some significant growth from
the 1660s to the early 18th century, though much more so after 1700.
(5) But clearly, for the initial period of 1660 to 1700, the most important new sector was in the colonial re-export trades;
(6) and indeed most of the manufactured goods just indicated were involved in financing the colonial trades.
The Composition of England's Export Trade, 1640 - 1750
Percentages of Total Export Values
Commodity 1640 1700 1750
Woollens 92% 48% 33%
Other Manufactures 8% 20%
Foodstuffs 8% 12%
Raw Materials 4% 6% 5%
Re-Exports 4% 31% 29%
Total 100% 100% 100%
Sources: Sources: F. J. Fisher, ‘London’s Export Trade in the Early Seventeenth Century’, Economic History Review, 2nd ser., 3:2 (1950), 151-61; Ralph Davis, ‘English Foreign Trade, 1660-1700’, Economic History Review, 2nd ser., 7:2 (1954), 150-66; Davis, English Overseas Trade, 1500-1700 (London: MacMillan, 1973); Tables I-V, pp. 52-57; Clay, Economic Expansion, vol. II, pp. 103-202, esp. Tables X, p. 125; XI-XV, pp. 142-46; XVI-XX, p. 155-60; XXI, p. 180; B. R. Mitchell and Phyllis Deane, Abstract of British Historical Statistics (Cambridge, 1962); and Peter Mathias, The First Industrial Nation: An Economic History of Britain, 1700 - 1914, 2nd revised edn. (London: Methuen and Co, 1983). [First edition: 1969]
e) The era of ‘New Colonialism’ and of the Colonial Re-export trades from the 1660s to ca. 1810:
i) In those new colonial trades, four commodities ranked as the most important through the later 17th and 18th centuries, accounting for about
three-quarters of export revenues (2/3 for the first three up to ca. 1750)
(1) sugar above all: from the sugar plantations in the Caribbean, especially from Jamaica; and note that almost all the English sugar plantations
were established after 1660.
(2) tobacco from the Virginia plantations in the southern colonies of North America, the earliest of the colonial products.
(3) cotton textiles, called calicoes and muslins: from India, and adjacent Asian regions (Persia, Iraq).17
(4) tea, subsequently, also from India and China, became increasingly important in the 18th century.
17 Please note that raw cotton, chiefly from the plantations of Virginia, the Carolinas, Georgia, Alabama, Louisiana, Florida, came much later, from the very late 18th and then 19th centuries.
ii) Other colonial commodities worth a brief mention:
(1) From Asia: coffee, silks, pepper-- along with other spices, indigo dyestuffs, and hemp from Asia (principally India);
(2) from Canada and New England: codfish (Newfoundland); beaver furs, lumber.
iii) The slave trade from West Africa:
(1) even though it was not a re-export trade, its importance must be strongly emphasized, since West African slaves provided the labour
foundations of plantation economies in the Caribbean and North America's southern colonies -- for sugar and tobacco, and later raw cotton.
(2) I do not, however, know how to estimate properly either the absolute or relative values of these slave exports from West Africa -- a horrifying
trade in which all the major west European colonial powers engaged.
iv) During almost this entire period, up to the beginning of the 19th century, colonial re-export products continued to account for about one-
third of Britain's total export revenues, at least until the sudden explosion in British cotton textile exports after 1810.
2. Importance of New Colonial Re-export Trades for English Economic Development
a) Mass markets for these products were created by sharp reductions in production and trading costs and thus in prices: by mass
production on large-scale plantations; by large-volume shipping and marketing.
i) Most of these products had begun as luxury commodities, with relatively inelastic demand.
(1) The development of mass production, especially from slave-based plantations in producing sugar and tobacco,
(2) thus shifted the Supply Schedule first along the inelastic portion of the demand schedule,
(3) thereby producing the sharp fall in prices;
ii) then, continued expansion of production shifted the supply schedule:
(1) over time into the elastic portion of the demand schedule (if we assume that there no changes in the structure of demand),
(2) so that further price reductions resulted in more than proportionate increases in the quantity demanded: i.e., prices had fallen well within the
reach of mass markets amongst the lower-income strata of society.
(3) For example tea prices fell from 20s. [shillings] a lb in 1700 to just 5s. a lb by 1750.18
18 The British pound sterling was composed of 20 shillings, each of which contained 21 pence (d), so that there were 240d (pence or pennies) to the pound: 20 * 12 = 240d. The monetary system of pounds, shillings, and pence was used throughout Europe until the French Revolution (1789); but Britain itself did not convert to the decimal pound until 1972 – the last to do so.

iii) Along with this, or as part of this price-cutting phenomenon,
(1) was a sharp drop in transaction costs in international trade,
(2) from both improved shipping technology and financial institutions.
iv) British re-export trade in Indian cotton calicoes and muslins:
(1) this proved to be extremely important in developing subsequent export markets for Britain's own cotton textile industry, from the later 18th
century.
(2) We will return to this theme in discussing the Industrial Revolution in cotton textiles.
b) Impact on British Industrialization: direct or indirect?
i) Question: did this colonial re-export trade generate any increase in the industrialization during the earlier 18th century, before the
Industrial Revolution itself?
(1) in a small way, it did generate some increase in manufactured exports to help finance the colonial trades, and especially to acquire slaves from
West Africa.
(2) It did foster the growth of refining and processing industries, to re-export colonial products in more finished form (e.g. refined sugar, molasses,
rum).
(3) But in the Asian colonial trades, the British and other Europeans
# had little in the way of manufactured goods to offer Asian consumers, who could obtain better quality industrial goods more cheaply from
their own industries;
# and, as a consequence of that, European had to finance the purchases of about 2/3 to 3/4 of Asian imports through bullion exports, chiefly
in the form of silver, rather than in gold: i.e., by using bullion to purchase Asian spices, textiles, dyestuffs, and other luxury-oriented
goods
ii) In sum, these colonial re-export trades did not really promote industrialization: not in any major direct way, beyond fostering the growth
of various processing and refining industries, most of which were quite labour intensive and small-scale, without large capital investments.
c) Indirect consequences of the re-export trades in fostering industrialization:
i) Hobsbawm, himself, contended, in his General Crisis thesis, that the particular crisis of Old Colonialism resolved itself in ‘indirect and round
about ways’, in producing New Colonialism, which is less than the ‘cop-out’ it seems to be: thus he mentions the following
(1) in promoting shipping, shipbuilding, and overseas commercial facilities;
(2) in widening and deepening British markets abroad;
(3) in increasing commercial profits as source of capital investment;
(4) in promoting development of banking and financial institutions.
ii) The colonial re-export trades were instrumental in stimulating the development of western ports to reduce the once overwhelming
dominance of London in overseas trade: the growth of Bristol (based on sugar and slaves); Liverpool (sugar, slaves, tobacco); Glasgow (tobacco
-- leading port for that trade).
iii) Export Markets: Perhaps the greatest impact came from developing the North American and other colonies as markets for the British
Industrial Revolution:
(1) Note that at the beginning of the 18th century, overseas colonial markets were taking only 15% of total English exports by value; and that
England therefore still depended on western Europe for 85% of total export values.
(2) But by the 1790s, when British access to European markets was cut off by warfare, British colonies and recent ex-colonies were now taking
70% of exports, whose aggregate value was four times larger than in 1700 (and twice as large as in 1750).
(3) And of these exports, North American took a third (32%), as the following table shows:
Direction and Distribution of English Exports, 1700 - 98
Region 1700 1750 1772 1798
North America 6% 11% 25% 32%
Caribbean/S.
America
5% 5% 12% 25%

Direction and Distribution of English Exports, 1700 - 98
Region 1700 1750 1772 1798
Africa-Asia 4% 7% 14% 13%
Total of Above 15% 23% 51% 70%
Europe 85% 77% 49% 30%
Total Values:
millions of £ st.
£4.461 £9.125 £10.196 £18.298
(4) Even as early as 1700, North America and the Caribbean were offering the English important overseas markets, as the following population
figures indicate:
Population of the British North American and
Caribbean Colonies in 1700
NEW ENGLAND:
Maine, New Hampshire, Rhode Island,Massachusetts, Connecticut
130,000
Middle Colonies:
New York, New Jersey, Pennsylvania, Delaware
65,000
Virginia and Maryland
90,000
North and South Carolina
12,000
Subtotal 297,000
Caribbean 121,000
TOTAL 418,000
ENGLAND: Population
5,210,000
(5) Thus, in 1700, British North America and the Caribbean region offered markets with about 8.0% of the population of England.
(6) Consider what might have happened to the development of the Dutch and French economies in the 18th century had they controlled as much of
the Americas as did the British
(7) By the eve of the American Revolution, the population of British North American had risen to 2.176 million (just under 30% of England’s
population, then 6.913 million) – plus 331,000 slaves (with far, far lower purchasing power, of course).
(8) As you can see from the graph on the screen the population of the United States, the new American Republic (without the rest of British North
American) had risen to 20 million by the 1840s.
(9) Here is a table showing the population of what became the United States, in 1774:
Population of Britain’s Thirteen Colonies in North America in 1774:
in what became the United States of America
British Colonies in North
America (excluding Canada)
Population of European
Origin
Population of African Origin
New England
Massachusetts, New Hampshire,
Rhode Island, Connecticut
661,000 15,000
Middle Colonies:
New York, New Jersey,
Delaware, Pennsylvania
617,000 6,000
Southern Colonies:
Maryland, Virginia, North
Carolina, South Carolina,
Georgia
898,000 310,000
TOTAL 2,176,000 331,000
Source: Ralph Davis, The Rise of the Atlantic Economies (Ithaca: Cornell University Press, 1973), p. 265
d) British Sea power and Rivalry with the Dutch:
i) From the late 16th century and through the 17th, the Dutch, as England's chief rival, had gained a supremacy in European shipping,
especially in the bulk goods of north European commerce.
ii) Dutch superiority was based on a combination of: (as noted in the published lectures on the Dutch commercial empire):
(1) technical superiority in ship design and ship-building, in their cheap cargo boats (the fluitschip – or ‘flute’),
# one that saved space and manpower by not using cannons;
# used cheap pine rather than expensive oak (except in the basic framework of the ship)
# standardized parts and construction machinery to permit mass production, at lower costs
(2) to repeat: low costs through mass-production with: standardized parts, mechanization,
(3) and also very cheap capital (from superior financial institutions);
(4) control of the Baltic trade, as the chief source of lumber and naval stores for shipping.
iii) But that Dutch supremacy in the Baltic trades was a comparative advantage extending only to trade in high bulk low valued
commodities of northern trade,
(1) such as grain, lumber, naval stores, iron and copper ores, cheap textiles;
(2) but the Dutch did not have an advantage in the more luxury-oriented, higher valued lower-bulk colonial goods, especially in pirate-infested
waters that required armed ships.
iv) By the late 17th or early 18th century, the British had gained a comparative advantage in shipping for both the Mediterranean and
overseas colonial trades by developing superior naval power: by developing heavily armed merchants ships that could double as warships,
which permitted much lower insurance rates to offset higher freight rates.
v) In North America, during the 1660s, the British used a combination of superior military power and much more extensive colonial settlement
to drive out the Dutch (and especially in conquering Nieuw Amsterdam in the 1660s, which became the British colony of New York, with the port
of New York city.)
h) A Brief Survey of British Overseas Trade, 1660 - 1760:
i) Export Boom from the 1660s to the 1690s: This very rapid growth immediately follows:
(1) the enactment of the major mercantilist Navigation Laws (to be examined shortly),
(2) the establishment of sugar plantations in the Caribbean,
(3) and the beginnings of successful commercial and colonial dominance in India.
(4) But that period of rapid growth was brief, and ended in the 1690s.
ii) Export Stagnation, 1690s to 1720s: when:
(1) Britain fought a series of very disruptive, almost world-wide wars with France, which severely injured British commerce.
(2) Britain encountered increasing French and Dutch competition in continental sugar markets: Indeed by the mid-18th century the English lost
virtually all these European markets.
(3) While official figures show that sugar continued to be the major re-export, in fact most of the sugar was exported to Ireland and the British
colonies.
iii) Renewed Export Boom from the 1730s to the 1760s:
As the table shows, English foreign trade experienced a much more rapid rate of growth from the 1730s: and by the 1760s, exports had again
doubled; and now a colonial re-export trade in tea was helping to make from difficulties in the sugar trades.
3. Mercantilism: Policies of State Intervention in Foreign Trade, Economic Nationalism and Protectionism:19
19 For a much fuller exposition, see my ECO 301Y lecture notes: for lecture no. 22 (in March)
a) Early-Modern Mercantilism and Protectionism in Western Europe:
i) Most early-modern and modern countries had practised and continue to practise protectionist economic policies, especially in foreign
trade -- policies of economic nationalism, which prevail in most countries to this very day;
ii) Since those have been by far the predominant economic policies in European or even world economic history,
(1) we must first, for this ongoing study of the British Industrial Revolution, understand what those policies of Mercantilism had meant to Britain
during the 17th, 18th, and early 19th centuries,
(2) i.e., before industrialized Britain became the first nation to convert from Mercantilism to Free Trade, in the 1840s.
b) Some definitions of Mercantilism:
i) A broad term referring to particular relationships between the national state and the economy: more particularly referring to all those
ideas, laws, administrative measures by which the state intervened in the economy to foster the twin goals of national power and national
prosperity.
ii) National Power and National Prosperity were seen as twin and mutually reinforcing goals by most mercantilists:
(1) in that, for most observers and statesmen, one goal could not be achieved or maintained without the other.
(2) Power meant prosperity, but prosperity could neither be achieved nor defended without the exercise of national power, especially military
power.
iii) See-saw Theorem of Wealth and Power:
(1) Many mercantilists, in England and France, believed that
# that international trade, with a quantity of precious metals , was a zero-sum game.
# i.e., that if their nation succeeded in acquiring new wealth in bullion from other countries, their gain in wealth and power was matched by
a proportional fall in the wealth and thus power of those other countries,
# most of whom were viewed as competitive rivals and indeed as enemies – actual or potential
(2) Mercantilism thus meant a competitive struggle for power, international rivalries -- especially in a race to gain overseas colonies -- that would
naturally lead to war. In sum, more simply, we can refer to mercantilism as a special form of economic nationalism.
(3) An example of this philosophy, along with the concept that wealth and national power consisted of stocks of precious metals, see the following
letter from Jean Colbert to King Louis XIV of France, in 1670, as his chief minister: 20
20 Mémoire au Roi sur les Finances (1670), published in P. Clémont, Lettres, instructions et mémoires de
As there is only a fixed quantity of silver circulating in the whole of Europe, which is increased from time to time by import from the West Indies [Spanish Americas], it may certainly be proved that there is no more than 150 million livres [£] of silver circulating among the public. It is not possible to increase the stock of one country by 20, 30, or 50 million livres [£ tournois] without at the same time taking the same quantity from neighbouring states. Thus arises this two-fold increase, which has been so clearly discernible for several years past: on the one hand, the power and greatness of your Majesty increases, while, on the other hand, that of your enemies and ill-wishers falls.... I suppose that anyone would readily agree with this principle: namely, that it is simply and solely the abundance of money within a state that makes the difference in its grandeur and power.
iv) Foreign Trade became the focal point of early-modern Mercantilism in western Europe:
(1) Foreign trade became the chief sphere of state economic intervention simply because foreign trade was seen to be the chief arena through
which the nation state could best achieve these twin goals of power and prosperity.
(2) Indeed, the term ‘mercantilism’ was first coined in 18th-century France (as mercantilisme), by a school of economists known as Physicocrats:
to describe the very commonly held belief that foreign trade -- the activity of merchants -- was the only means of increasing national wealth
specifically defined in terms of national stocks of gold and silver.
(3) The term mercantilisme was originally meant to be a term of contempt, especially by those French scholars known as the Physiocrats, who
believed that land and natural resources -- agriculture, mining, fishing, forestry, etc. -- were the true forms of national wealth, and not gold and
silver stocks.
(4) When Adam Smith borrowed the French term as mercantilism’ [its first use in English] he also meant it to be a term of contempt, especially
the monetary view that wealth was merely gold and silver.
iv) The Monetary Core of Early-Modern Mercantilism: Bullionism:
(1) Bullionism refers to the widespread, common belief that wealth consisted of precious metals, gold and silver, or that gold and silver at least
provided the best means of acquiring material wealth through trade.
(2) It was a very ancient and deeply held belief, long-predating early-modern Mercantilism, but late-medieval bullionism helped to promote the
economic nationalism that pervades later mercantilism through a national rather than individual lusting after gold and silver.
(3) Despite or because of the antiquity of these bullionist beliefs, they remained an article of faith amongst most merchants, businessmen,
government officials, and politicians in early-modern Europe, especially in commercialized western Europe.
Colbert, 7 vols (Paris, 1870), VII, 252: cited in English translation in Eli F. Hecksher, Mercantilism, 2 vols., translated by Mandel Shapiro; revised edn ed. by E. F. Söderlund (London: Allen and Unwin; New York: Macmillan, 1955), p. 27, 48.
(4) As noted earlier, Europe experienced a scarcity of silver and monetary contraction from about the mid-17th to mid-18th centuries, during the
very Heyday of Mercantilism
(5) How were nations supposed to acquire this bullion?
# Mercantilists argued that, since most countries did not themselves possess gold and silver mines, therefore, the only alternative and
effective means of acquiring stocks of gold and silver bullion, of acquiring wealth in the form of precious metals was through international
trade,
# and in particular through achieving and maintaining what they called a ‘favourable balance of trade’:
(6) In essence, therefore, economic policies had to be pursued in order to ensure or determine that the nation’s exports of goods and services
always exceeded imports (or total payments made abroad),
# so that gold and silver would necessarily flow into the country to finance that surplus;
# i.e., that foreigners would be forced to finance their corresponding trade deficits with bullion shipments.
d) Why did Mercantilists want to increase the nation’s stock of precious metals?
i) primarily, as noted, in the belief that this would increase the nation’s wealth and military power.
ii) but more sophisticated mercantilists also thought that an increased supply of money would lead to lower interest rates, increased credit,
and increased employment
iii) The mercantilist concept that money is capital or a form of capital:
(1) J.M. Keynes indeed saw in mercantilist writings many sensible ideas: ideas that had greater validity than the criticisms of Classical economists.
(2) Keynes argued that many mercantilists, in treating money as capital, in fact shared his own views about the money supply, liquidity preference,
and interest rates:21
(3) In Keynes’ view: an increase in the money supply -- producing a rightward shift of the Ms schedule, with no shift in the Liquidity Preference
21 John Meynard Keynes, in his chapter 23, ‘Notes on Mercantilism’, in The General Theory of Employment, Interest and Money (London, 1936), stated that: ‘For some two hundred years both economic theorists and practical men did not doubt that there is a peculiar advantage to a country in [having] a favourable balance of trade, and grave danger in an unfavourable balance, particularly if it results in an efflux of the precious metals. But for the past one hundred years there has been a remarkable divergence of opinion’...; and furthermore that ‘ a preoccupation on the part of the authorities with a favourable balance of trade served both purposes [of keeping interest rates low and of promoting foreign investment]; and was, furthermore, the only available means of promoting them’. See full text in the Appendix to this lecture.
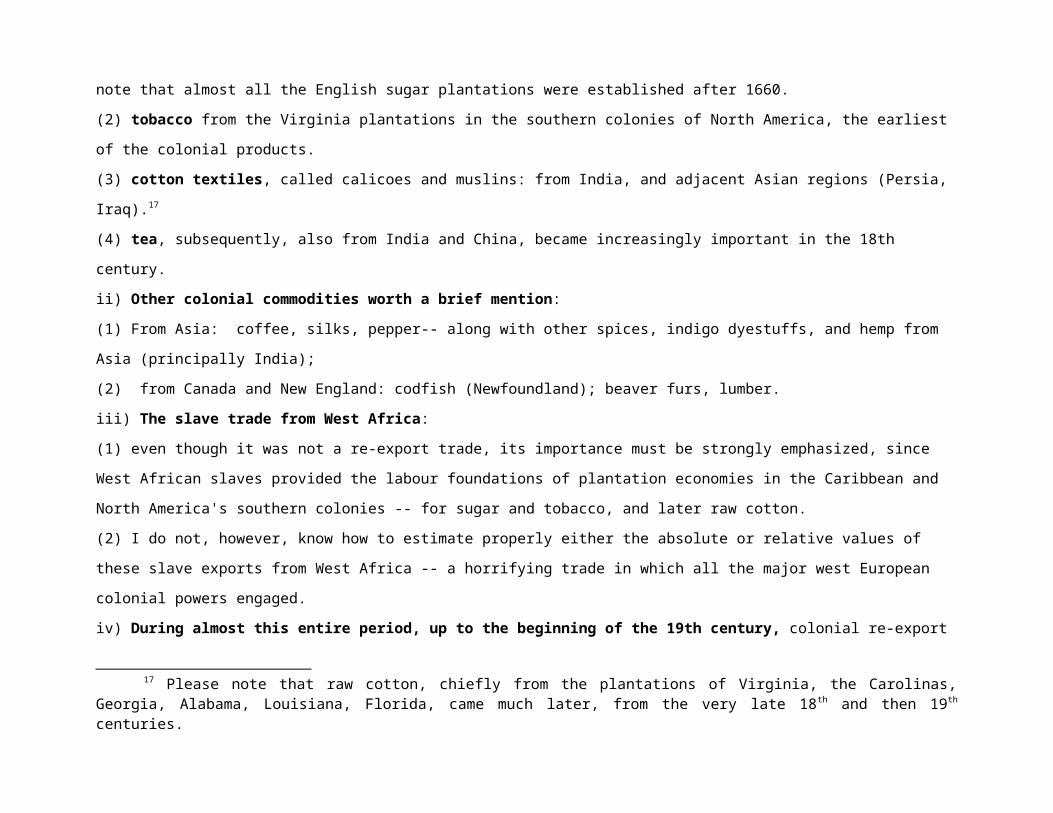
Schedule -- would lower the rate of interest.
iii) Some mercantilists were indeed aware of the price consequences of such an increased monetary circulation:
(1) i.e., in producing some degree of price inflation.
(2) But in an era of general deflation or stagnant price-levels, many welcomed some stimulus from inflation, i.e., from rising prices, in promoting
trade and investment.
(3) In any case, the Classical Economists were simply wrong in their presumed fundamental attack on Mercantilist policies designed to produce an
influx of bullion:
# they argued, in essence, that such policies were vain and self defeating
# because, say, an influx of bullion that increased the money supply by 10 percent would automatically produce an inflation of 10 percent:
raising the level of prices by 10 percent
# such inflation, they argued, would raise export prices, making them uncompetitive, and leading to a fall of exports, while imports, being
relatively cheaper would rise
# as a consequence, they argued, all the bullion that had flowed into the country would flow out, as imports exceeded exports
# their fallacy was to subscribe to a crude quantity theory of money [to be examined later]
(4) In historical fact (as I can assert from my own research);
# an increase in bullion imports (gold and silver) is never directly proportional to an increase in the money supply, which does in fact
consist just of precious metals.
# and inflation is not proportional – and certainly never occurs quickly and automatically – to the an increase in the money supply
# yes, we normally can expect some degree of inflation, but generally moderate
# for the degree of inflation, with an increased money supply, would be offset (as Keynes himself argued), by a reduction in the income
velocity of money [an increase in Cambridge k, representing cash balances) and by an increase in the level of output, stimulated by
increased investment and market demand
# as just noted: ‘Mercantilists were inflationists at heart’, all the more so since inflation cheapened the real cost of previously borrowed
capital.22
22 See my ECO 301Y lectures on the Price Revolution for an explanation; and indeed my publications on inflation and the European Price Revolution (from my online CV and List of Publications).
iv) Also: treasure required to finance trade with deficit areas, such as the Baltic and Asia.
e) In summary: Government intervention in foreign trade had three chief ‘mercantilist’ and ‘bullionist’ goals:
i) First Goal: To ensure that favourable trade balance, which to repeat necessarily meant a surplus of exports over imports, in order to make
foreigners pay for these excess exports with precious metals, and thus to increase the nation’s stock of precious metals.
(1) That meant taxing and otherwise hindering imports -- with tariffs and import quotas,
(2) but also promoting exports by paying subsidies or bounties to exporters.
(3) From the late 1660s [in fact from the 1689 war against France] the English government steadily increased tariffs and other taxes on imports,
especially manufactured goods;
(4) and while these taxes were ostensibly imposed to secure revenues in financing warfare, their long-term effect was to become increasingly
protectionist.
(5) In general tariffs were much higher on imported manufactured commodities than on raw materials and other unfinished goods.
(6) Indeed most mercantilists argued that the most valuable exports a nation could produce were fully manufactured goods, industrial goods,
because of their extra value added (value added over raw material components);
(7) and thus the growth of the industrial manufacturing sector should be the chief domestic economic policy for the government to pursue.
(8) Ban on Bullion Exports: Finally, in terms of this first goal, virtually all nations -- except the Dutch -- had banned the export of all precious
metals, except to licence special bullion exports to conduct trade with those areas that would not purchase a sufficient value of western goods.
(9) As we have already seen, western Europe conducted trade with two such regions that did almost consistently require such bullion exports:
# Asia and the Baltic,
# both of which did drain off large amounts of European silver in the 17th and 18th centuries.
(10) In May 1663, the English Parliament, convinced by arguments from the English East India Company,23
# relaxed the long-standing ban to permit bullion exports in the Asian and Baltic trades,
# on the mercantilist grounds that goods so acquired from these trades and then re-sold in Europe or elsewhere resulted in a much greater
23 From January 1364, Statute 36 Edwardi III, stat. 1, c. 2 had forbidden the export of any English coin (without a royal licence) as well as all forms of bullion.. Statutes of the Realm, vol. I, 383. In May 1663, Parliament repealed its provisions concerning bullion exports (but not coin) : in Statute 15 Carolus II. c, 7, in Statutes of the Realm, vol. V, p. 451, sec. 9. That legislation was influenced by argument set forth by the East India Company: in Thomas Mun, England's Treasure by Forraign Trade [1664] (reissued Oxford, 1937).
bullion influx.
(11) That reflects a newer and more mature mercantilist view that the overall balance of trade and overall bullion flows are the important issue, not
trade balances between individual nations.
ii) Second Goal: To secure control over those foreign resources necessary to maintain and strengthen national power,
(1) i.e., military power and for England as an island nation that meant especially naval power.
(2) The most important such resources were, of course, lumber, naval stores, iron and other metals;
(3) The chief region for these naval stores was the Baltic region,
(4) but then later followed (18th century) by the British North American colonies of New Brunswick and Maine.
iii) Third Goal: To gain and control overseas colonies as monopoly preserves, of the mother country in foreign trade:
(1) for both raw materials and
(2) for exclusive markets (to avoid buying goods from foreigners.)
iv) England's Overseas Colonies and Foreign Rivals:
(1) As we have already seen, England had acquired, by the 1660s, the foundations for a vast overseas commercial empire in the form of conquests
and settled colonies in Asia (especially in India), the Caribbean, and North America. (African colonial acquisitions came much later).
(2) By the 1660s, England's chief rivals were the Dutch across the Channel with a much larger and much more lucrative colonial empire in Asia,
though a far smaller one in the Caribbean and the Americas.
(3) The Dutch then also enjoyed, as I have noted before, an imposing supremacy in international trade and finance,
# based upon a combined supremacy in both shipbuilding and shipping services,
# in turn based upon firm control of the Baltic Sea region,
# which, as just noted, was then the chief European source of lumber, iron, and other materials for shipbuilding (called ‘naval stores’)
f) The Navigation Laws: represent the fullest and most crystallized legislative expression of Mercantilism in early-modern England, based on
sea-power, with the major aim of defeating the Dutch in international trade and shipping, with specifically the following aims and goals.
i) They sought to exploit the newly acquired overseas colonies for England's own exclusive benefit: in securing both raw materials and
markets -- exclusively for the so-called mother country.
ii) They were equally designed to promote English shipbuilding and overseas shipping, in all forms of foreign trade.
iii) More particularly, they were designed to bypass the Dutch as carriers and middlemen in English overseas trade: to deny the Dutch
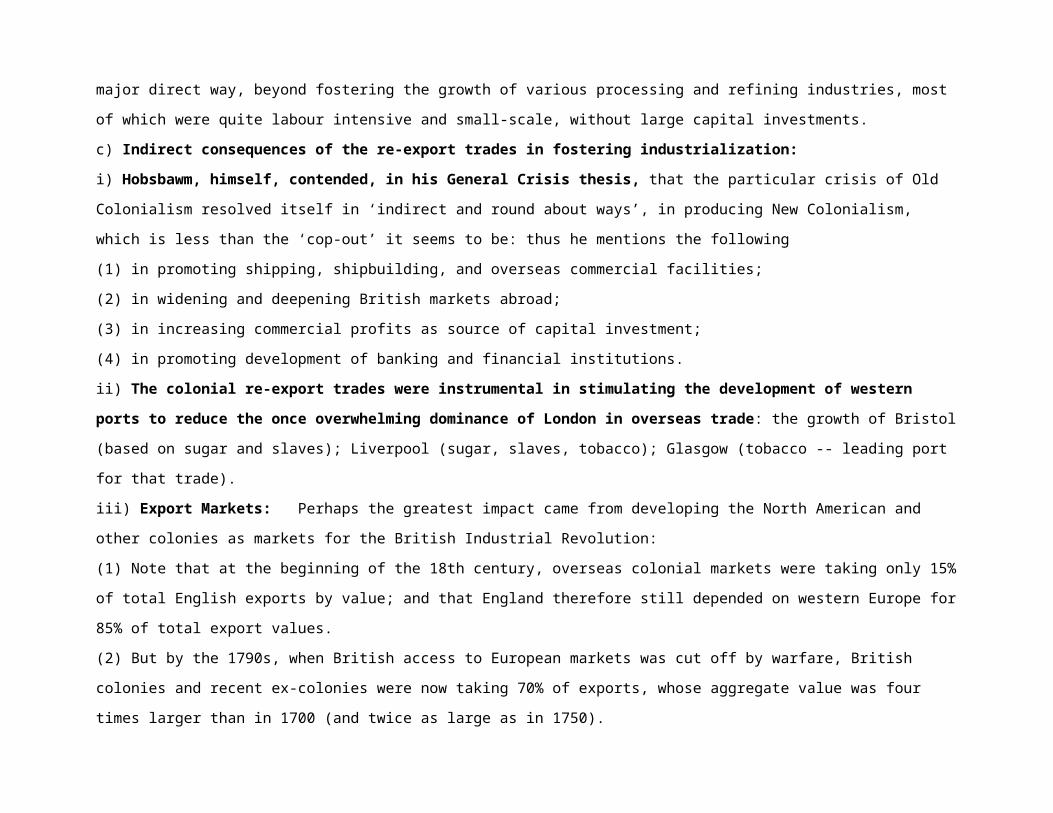
access to English trade, as much as was possible.
iv) More generally and more philosophically, the ultimate goal of these Navigation Laws was in promoting a ‘favourable balance of
trade’:
(1) emphasizing the export of services as well as goods
(2) to ensure a continuous influx of precious metals -- of gold and silver bullion (especially from the Spanish Americas, where the chief silver
mines then lay -- in Peru and Mexico).
v) The Most important mercantilist acts legislated in the 17th century were the following:
(1) Navigation Act of 1651 (Cromwell)
(2) Navigation Act of 1660 (Charles II)
(3) Staple Act of 1663 (Charles II)
(4) Navigation Act of 1673 (Charles II)
vi) Chief Provisions of Navigation Acts:
(1) all trade to and from or between English colonies had to be conducted solely by English ships or English colonial ships: no foreigners
were to be allowed to handle these trades.
(2) all of England's foreign trade, imports and exports, had to be conducted by English or English colonial ships, with one single and
necessary exception:
# that goods could also be imported on ships from the country that produced those goods.
# thus Spanish wine could be imported on Spanish ships, Swedish iron on Swedish ships, Norwegian lumber on Norwegian ships.
# The objective here certainly was to cut out Dutch shippers.
(2) Those foreign ships that did import their own goods still had to pay a much higher import duty; and they were not allowed to export
English goods.
(3) Any foreign goods that were destined to be sold in English colonies first had to pass through English ‘staple’ ports: had to be stapled’ in
designated English ports, before going on to English colonial ports.
vii) The ‘Enumerated Articles’ list:
(1) a list of specific colonial goods that had to be exported only to England (for domestic consumption or re-export).
(2) especially the leading colonial goods of sugar, tobacco, cotton, along with lumber and naval stores (New Brunswick and Maine), Canadian

furs, East India tea, rice, hemp, coffee, etc.
(3) The object was to guarantee English industries a source of raw materials and to give English merchants and ships, i.e., from the mother
country, exclusive control over the re-export trade in these commodities.
viii) Consequences of the Navigation Laws for Great Britain:
(1) Whether or not these laws succeeded in cutting out the Dutch as middlemen for English trade is still hotly disputed: for some argue that
these laws never achieved this objective, or did so only from the mid to later 18th century.
(2) Many argue that these laws had a greater impact in promoting the shipping of Dutch rivals in the Baltic trades: i.e., in fostering
German and Scandinavian shipping, by virtue of that ‘country of origin’ clause.
(3) But many of these hostile arguments come from Liberal historians who were faithful adherents of the Classical School, which argued
for complete Free Trade, and whose intellectual origins lay in Adam Smith's Wealth of Nations (1776), which, as noted earlier, was primarily an
assault on Mercantilism, to use Smith's own specific term.
(4) Though I have always basically supported the Classical Free-Trade tradition, I am nevertheless more sympathetic to the view that the
Navigation Laws did have a positive effect: that they did promote the growth of English shipping and shipbuilding industries, but especially
colonial shipping.
(5) It is worth observing that French shipping enjoyed a six-fold increase during the 18th century; and that the rapid growth of French
shipping was evidently also related to their own Navigation Laws, very similarly constructed to the English laws.
(6) Certainly the relative decline of Dutch commercial power in 18th century was primarily due to growth of shipping by their European
rivals, above all the English, French, and German.
(7) Historically, the Navigation Laws are also seen to be important in helping to provoke the American Revolution against British rule;
and that successful revolt, beginning in 1776, in establishing the United States of America as a new republic, really marked the end of the
Navigation Laws.
g) The Historic Significance of Economic Nationalism and Mercantilism in Early-Modern Europe: two complementary views:
i) Jared Diamond, Guns, Germs, and Steel: the Fates of Human Societies (New York, 1999): an attempt to explain how modern Europe
achieved economic supremacy in non-biological, non-racist, non-ethnic terms, but rather in terms of geography, topography, climate, resource
endowments.
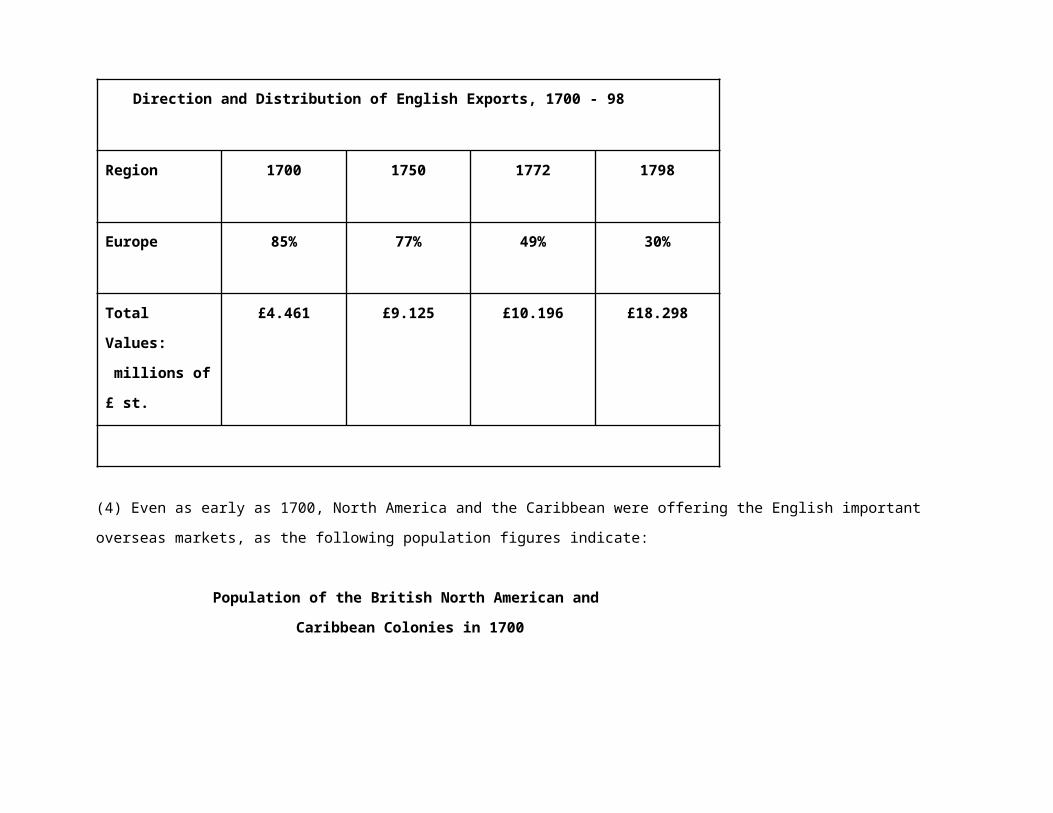
(1) He argues that in the medieval and early-modern eras states and governments or ruling authorities across the world frequently sought to
suppress the diffusion of new ideas, as a threat to the existing order and their own powers or class privileges.
(2) In the case of China, the combination of topography and geographic configurations, with even coastlines, and no important internal barriers,
promoted early unification under autocratic rule, which certainly did seek to suppress innovations and diffusions of new ideas
(3) In western Europe, however, its geography (jagged, indented coastlines, etc.) and topography (mountains and other natural barriers) promoted
political fragmentation.
(4) While such fragmentation can have its own serious costs, the formation of national states and centralized monarchies in early-modern times
reduced those costs with improved benefits
(5) namely competition for power and wealth between such nation states in an era of mercantilism: made it almost impossible to prevent the export
and diffusion of new ideas and new technologies, if their acquisition could provide states with at least short term benefits in power and wealth
ii) David Landes, The Unbound Prometheus: Technological Change and Industrial Development in Western Europe from 1750 to the
Present, 2nd edn (Cambridge, 2003).24
(1) first, a similar theme, but in the context of private enterprise in a functioning market economy (pp. 15-16):
The role of private enterprise in the West is perhaps unique: more than any other factor, it made the modern world... It was the new men of commerce, banking, and industry who provided the increment of resources that financed the ambitions of the rulers and statesmen who invented the polity of the nation-state. ... To be sure, kings could, and did, make or break the men of business; but the power of the sovereign was constrained by the requirements of state (money was the sinews of war) and international competition. Capitalists could take their wealth and enterprise elsewhere; and even if they could not leave, the capitalists of other realms would not be slow to profit from their discomfiture.
(2) Because of this crucial role as midwife and instrument of power in a context of multiple, completing polities (the contrast is with the all-encompassing empires of the Orient or of the Ancient World), private enterprise in the West possessed a social and political vitality without precedent of counterpart. This varied, needless to say, from one part of Europe to another, depending upon comparative economic advantage, historical experience, and the circumstances of the moment.
(3) And more particularly on the economics and politics of Mercantilism: (pp. 31-32)
Hence mercantilism. The state acted, controlling and manipulating the economy for its own advantage, and theory hastened to follow. (In this respect, too, mercantilist thought and natural science had much in common....). The theory in turn provided man
24 These ideas were further expanded in his recent book: David S. Landes, The Wealth of Poverty of Nations: Why Some Are So Rich and Some So Poor (New York and London: W.W. Norton, 1998).
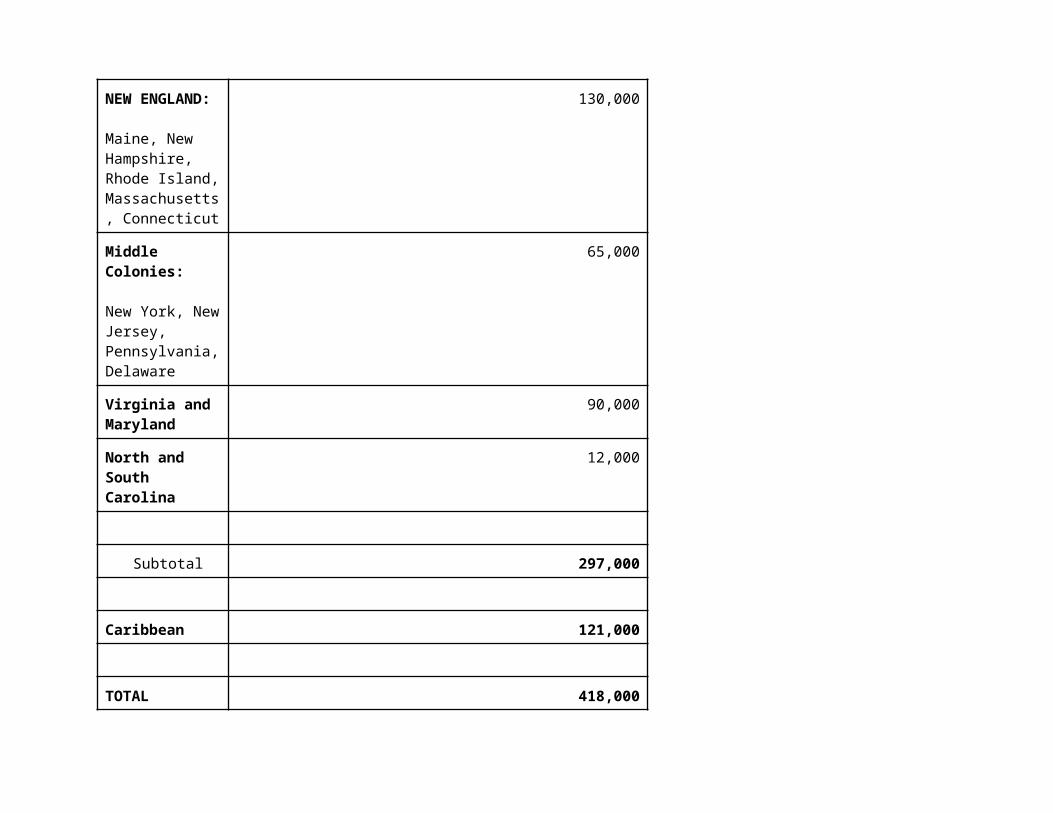
with new tools for mastery of his environment. Admittedly, mercantilist doctrine was shapeless, inconsistent. It was inconsistent because it reflected policy as much as guided it, and each state did with its economy what circumstances warranted, knowledge (or ignorance) suggested, and means permitted. Mercantilism, was, in short, pragmatism guided by principle.
(4) Yet mercantilism was more than mere rationalization. Precisely because it was pragmatic, because it aimed at results, it contained the seeds of the sciences of human behaviour. Its principle were modelled on those propounded for the natural sciences: the careful accumulation of data, the use of inductive reasoning, the pursuit of the economical explanation, the effort to find a surrogate for the replicated experiment by the use of explicit international comparison. ..... Our point here is simply that Mercantilism was the expression in the sphere of political economy – a particularly striking expression – of the rationality principle and the Faustian spirit of mastery.
4. British Foreign Trade During the Industrial Revolution Era, 1760 - 1820
a) Let us now look at the continued and changing role of British foreign trade: during the era that encompassed both the American Revolution
and British Industrial Revolution, both bring to an end the era of Mercantilism.
b) Export Stagnation from the 1760s to the 1790s: for which the chief cause was again warfare, especially:
i) The Seven Years War with France, 1756 - 1763: and then
ii) The American Revolutionary and general European war from 1776 to 1783:
iii) European protectionist tariffs against British goods:
c) The American Revolution of 1776-1783, and the End of the Navigation Laws:
i) The chief beneficiaries of England's Navigation Laws may have been the shipping and shipbuilding industries of the American colonies:
in particular New England, which was also blessed by an abundant local supply of cheap timber and naval stores (and enterprising merchants).
ii) Under an umbrella of mercantilist protection, the New Englanders especially had enjoyed a very rapid economic development, with high
standard of living, based to a large extent on their own overseas shipping.
iii) Unfortunately, however, the New Englanders and other Americans developed a rather narrow-minded negative attitude towards these
Navigation Laws,
(1) They especially did so as their shipping and export trades grew more rapidly from the 1720s.
(2) They loudly resented, as indicated earlier, those restrictions on their shipping:
# especially those preventing them from dealing directly with continental European markets or directly with French and Spanish colonies in
the Americas,
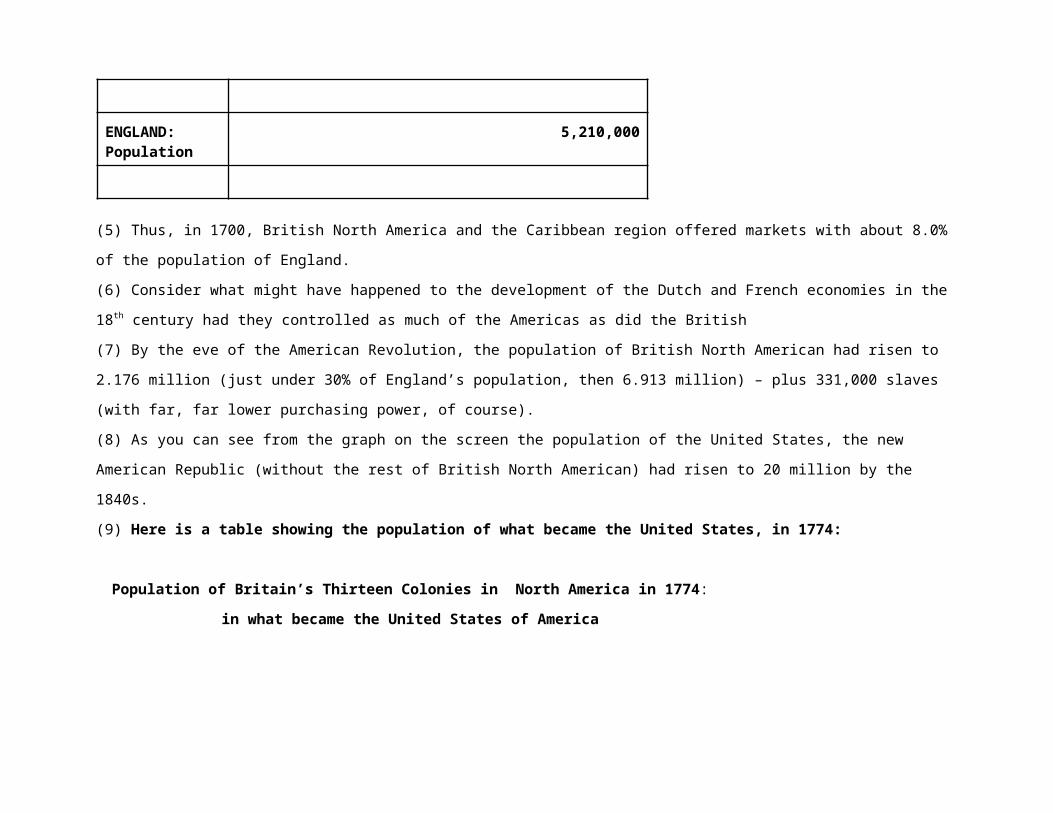
# where they had also developed markets for their fish, lumber, and textiles, etc.
iv) To prevent this direct trade, to prevent colonial evasion of the Navigation Laws, the British Parliament passed several ‘enforcement acts’,
some of which were enacted at the request of the English sugar lobby, which resented direct American trade with French sugar islands.
(1) Molasses Act of 1733: heavy duties on imports of foreign sugar
(2) Sugar Act of 1764: banning direct trade with French islands
v) Other American grievances:
# laws restricting their own manufacturing industries;
# but especially English taxation of their colonies (to pay for their own defence): ‘No taxation without representation’.
# All of these grievances (Boston Tea Party) were factors in American Revolution.
vi) The American Revolution (1776 - 1783): and its Economic Aftermath:
(1) That Revolution obviously ended the era of the Navigation Laws, though these laws and other mercantilist legislation stayed on the statute
books for another 65 years, until 1849.
(2) Nevertheless, despite the effective end of mercantilist restrictions, despite the American Revolution, the new United States of America still
remained almost entirely within the British commercial orbit: both as an almost exclusive market for British manufactures, and as an important
source of industrial raw materials, especially raw cotton.
(3) In fact, British North America as a whole, though largely the new American Republic,
# took a third of all British domestic exports around 1800, and continued to grow as the major British market.
# This was a region of rapidly expanding population (as we have just seen on the graph)
# with the world's highest living standards and purchasing power.
(4) Finally, as the previous table on the composition of British 18th-century exports showed, the vindication for British mercantilism is the role of
these colonial or former colonial markets.
(5) For in the 1790s, when the British economy was so badly beset by warfare with Revolutionary France, when European markets were
periodically cut off, these overseas colonies collectively took 70% of exports, whose volume and value were far larger than earlier in the century.
d) The British Export Boom, 1790 - 1815: Chief Factors
i) Very rapid population growth: in both Europe and the Americas.
(1) The most impressive growth was in British North American colonies where the population grew 6-fold in 18th century, while also acquiring
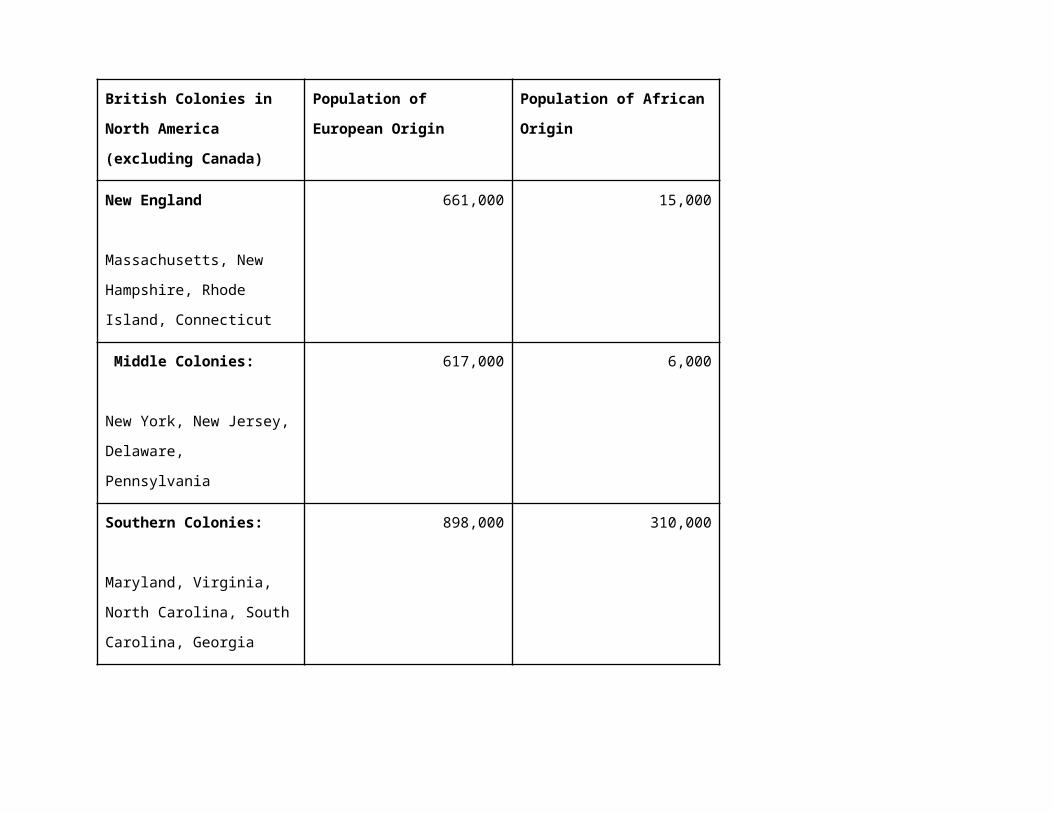
the highest standard of living in the world.
(2) Demographic growth and the accompanying economic development Western Europe in this era, particularly France: created demand for
British goods.
ii) the British Industrial Revolution itself contributed to the export boom: an example of supply creating its own demand.
(1) As I argued earlier, the most important feature of the British Industrial Revolution, in terms of Say's Law, was drastic cost and price cutting,
# especially for cotton textiles,
# thus reducing prices to reach much broader, mass markets.
(2) increased British imports of raw materials, semi-finished and manufactured goods from Europe and Americas gave their inhabitants the extra
income with which to buy British goods.
iii) British naval power: British military success in dominating the main oceanic trade routes with her naval power, allowing the British:
(1) to defend and exploit their overseas commercial empire, and at the same time: →
(2) to exclude or restrict rival shipping during time of war: in effect disrupting or destroying the maritime trade of the Dutch, French, and Spanish.
iv) Overseas Colonies: But clearly, Britain's chief salvation in the later 18th century was to repeat once more her overseas colonies, now taking
70% of British exports (vs. only 15% in 1700); and in 1798: note that the value of those exports were double those of 1750.
(1) North America: Note once more that North America accounted for almost half of these colonial markets, and for a third of total exports.
(2) The area called the West Indies:
# Obviously that included the Caribbean region, whose markets expanded with the growth of sugar production;
# but this region in fact also includes Spanish colonial America, which was becoming a much more important market for British.
v) British Textile Exports:
(1) While the share of total export values taken by woollen textiles fell from 78% in 1700/09 to just under half (48.4%) in 1750, to 30% by the
1790s,
# nevertheless woollen-worsted textile exports actually grew in absolute volume,
# and they remained the single most important item to 1805, when they surpassed by another textile, namely the cottons of the Industrial
Revolution.
(2) Cotton textiles: thereafter, remained decisively Britain's most important export; and even by the 1820s, cottons were accounting for 60% of
total exports.
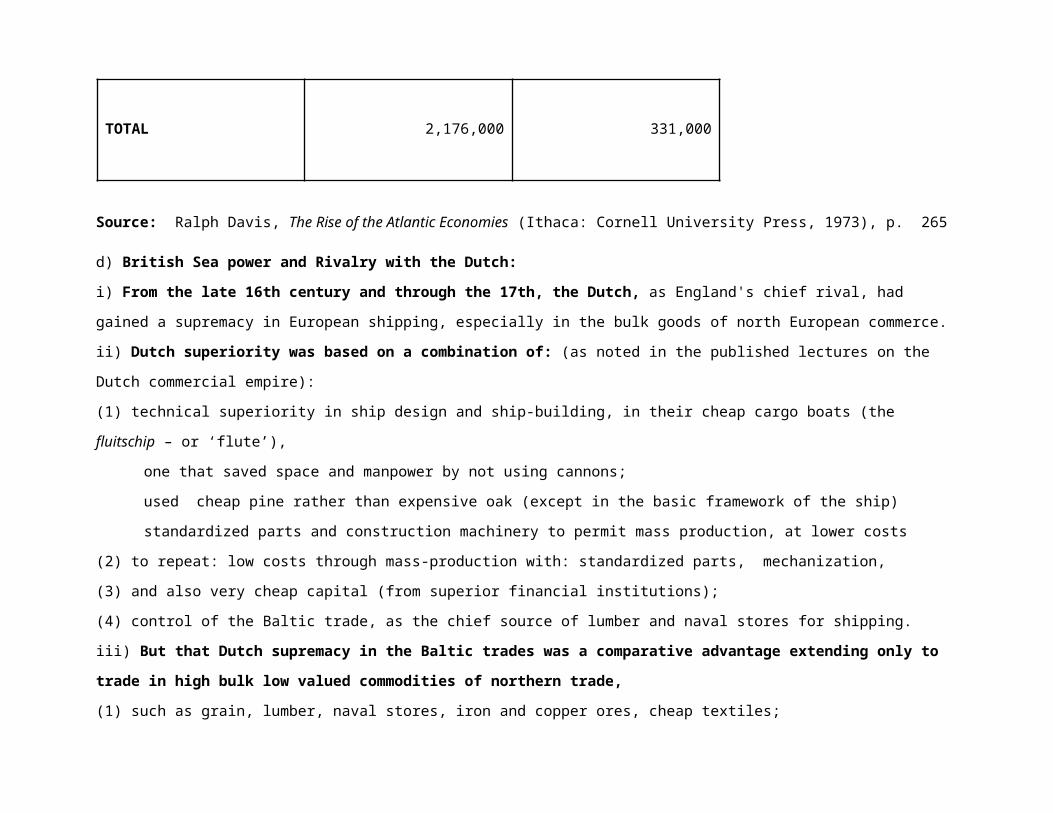
e) An Econometric Exercise of W. A. Cole: in the first edition of the Floud-McCloskey, Economic History of Britain Since 1700 (1981) [but
strangely omitted from the second and very different edition of 1994, with most chapters written by newly-recruited and different authors]:
i) Cole estimates that British exports grew from 20% to 35% of the total industrial output over the 18th century, noting in particular the
decisive role played by the textile industries.
ii) He argues that the combination of industry and commerce together, including that export sector, accounted for 40% of NNI in 1800, vs.
35% for agriculture.
iii) From his econometric analyses, he then argues (in what is called ‘counter-factual history’, the essence of econometric analysis) that without
that growth in the foreign trade sector these proportions would have been reversed: i.e., 46% for agriculture vs. 27% for industry and commerce
together.
f) British Foreign Trade after 1815:
i) The post-1815 era, after the Napoleonic Wars: is the one in which foreign markets finally become decisively important, so that by the mid-
19th century Britain was literally in the position of having ‘to export or die’, as the common saying had it.
ii) The principal reason for this export dependence:
(1) in my opinion, stressed so many times now: Britain's rapid population growth (tripling from 1820 to 1910), expanding far beyond the capacity
of domestic agriculture, meant that Britain had to import so much foodstuffs (and raw materials), which could only be obtained by exporting goods
and especially services.
(2) Clearly Britain could not have sustained such a population growth with rising real incomes without the rapid expansion of both the export and
import sectors, which of course are directly related.
(3) As Adam Smith clearly argued: the principal reason and justification for exports:
# is in order to import necessary goods and services,
# and to do so more cheaply than producing them at home
# we will come back to this theory of Comparative Advantage in the last lecture for the first term of this course
iii) Industrial Britain had also, of course, become a voracious consumer of other imports as industrial inputs, and in particular raw cotton, most
of which came from the southern United States.
KEYNES ON MERCANTILISM:
John Maynard Keynes, The General Theory of Employment, Interest, and Money (London, 1936), chapter 23, ‘Notes on Mercantilism...’, pp. 333-51.
For some two hundred years both economic theorists and practical men did not doubt that there is a peculiar advantage to a country in a favourable balance of trade, and grave danger in an unfavourable balance, particularly if it results in an efflux of the precious metals. But for the past one hundred years there has been a remarkable divergence of opinion. The majority of statesmen and practical men in most countries... have remained faithful to the ancient doctrine; whereas almost all economic theorists have held that anxiety concerning such matters is absolutely groundless, except on a very short view, since the mechanism of foreign trade is self-adjusting and attempts to interfere without it are not only futile, but greatly impoverish those who practise them, because they forfeit the advantages of the international division of labour. It will be convenient, in accordance with tradition, to designate the older opinion as Mercantilism and the newer as Free Trade....
Let me first state in my own terms what now seems to be the element of scientific truth in mercantilist doctrines.... It should be understood that the advantages claimed are avowedly national advantages and are unlikely to benefit the world as a whole.
When a country is growing in wealth somewhat rapidly, the further progress of this happy state of affairs is likely to be interrupted, in conditions of laissez-faire, by the insufficiency of the inducements to new investment. Given the social and political environment and the national characteristics which determine the propensity to consume, the well-being of the progressive state essentially depends .. on the sufficiency of such inducements. They may be found in either home investment or in foreign investment (including in the latter the accumulation of precious metals), which, between them [home + foreign investment], make up aggregate investment..... The opportunities for home investment will be governed, in the long run, by the domestic rate of interest; whilst the volume of foreign investment is necessarily determined by the size of the favourable balance of trade [i.e., the current account surplus]. Thus, in a society where there is no question of direct investment under the aegis of public authority, the economic objects, with which it reasonable for the government to be preoccupied, are the domestic rate of interest and the balance of foreign trade.
Now, if the wage-unit is somewhat stable and not liable to spontaneous changes of significant magnitude (a condition which is almost always satisfied), if the state of liquidity preference is somewhat stable, taken as an average of its short-period fluctuations, and if the banking conventions are also stable, the rate of interest will tend to be governed by the quantity of precious metals, measured in terms of the wage-unit, available to satisfy the community’s desire for liquidity. At the same time, in an age in which substantial foreign loans and the outright ownership of wealth located abroad are scarcely practicable, increases and decreases in the quantity of precious metals will largely depend on whether the balance of trade is favourable or unfavourable.
Thus, as it happens, a preoccupation on the part of the authorities with a favourable balance of trade served both purposes; and was, furthermore, the only available means of promoting them. At a time when the authorities had no direct control over the domestic rate of interest or the other inducements to home investment, measures to increase the favourable balance of trade were the only direct means at their disposal for increasing foreign investment; and, at the same time, the effect of a favourable balance of trade on the influx of the precious metals was their only
indirect means of reducing the domestic rate of interest and so increasing the inducement to home investment.
For a favourable balance [of trade], provided it is not too large, will prove extremely stimulating; whilst an unfavourable balance may soon produce a state of persistent depression.
Thus, the weight of my criticism is directed against the inadequacy of the theoretical foundations of the laissez-faire doctrine upon which I was brought up and which for many years I taught; -- against a notion that the rate of interest and the volume of investment are self-adjusting at the optimum level, so that preoccupation with the balance of trade is a waste of time. For we, the faculty of economics, prove to have been guilty of presumptuous error in treating as a puerile obsession what for centuries has been a prime object of practical statecraft.
Under the influence of this faulty theory the City of London gradually devised the most dangerous technique for the maintenance of equilibrium which can possibly be imagined: namely, the technique of bank rate coupled with a rigid parity of the foreign exchanges. For this meant that the objective of maintaining a domestic rate of interest consistent with full employment was wholly ruled out. Since, in practice, it is impossible to neglect the balance of payments, a means of controlling it was evolved which, instead of protecting the domestic rate of interest, sacrificed it to the operation of blind forces.
.... As a contribution to statecraft, which is concerned with the economic system as a whole and with securing the optimum employment of the system’s entire resources, the methods of the early pioneers of economic thinking in the sixteenth and seventeenth centuries may have attained to fragments of practical wisdom which the unrealistic abstractions of Ricardo first forgot and then obliterated. There was wisdom in their intense preoccupation with keeping down the rate of interest by means of usury laws, by maintaining the domestic stock of money and by discouraging rises in the wage-unit; and in their readiness in the last resort to restore the stock of money by devaluation, if it had become plainly deficient through an unavoidable foreign drain, a rise in the wage-unit, or any other cause...
The mercantilists perceived the existence of the problem without being able to push their analysis to the point of solving it. But the Classical School ignored the problem, as a consequence of introducing into their premisses conditions which involved its non-existence; with the result of creating a cleavage between the conclusions of economic theory and those of common sense.
I remember Bonar Law’s mingled rage and perplexity in the face of the economists, because they were denying what was obvious.25 He was deeply troubled for an explanation. One recurs to the analogy between the sway of the Classical School of economic theory and that of certain religions. For it is a far greater exercise of the potency of an idea to exorcise the obvious than to introduce into men’s common notions the recondite and the remote...
25 Bonar Law (1858-1923): the Canadian-born and Canadian-educated Prime Minister of the United Kingdom in 1922-23.
Table 1: RELATIVE MARKET SHARES FOR INDUSTRIAL OUTPUTin Great Britain, 1770 and 1810, in millions of £ sterling
Year Manufact- Sold in % Exported %uring Domestic AbroadOutput Market
1770 £43.0 £33.0 77% £10.0 23%
1810 £130.0 £90.0 69% £40.0 31%
Table 2. Estimated Population Totals and Percentage Growth Rates*
Population Totals (millions)
1550 1680 1820 1900
England 3 4.9 11.5 30.5
France 17 21.9 30.5 38.5
Netherlands 1.2 1.9 2.0 5.1
Spain 9.0 8.5 14.0 18.6
Italy 11.0 12.0 18.4 32.5
Germany 12.0 12.0 18.1 43.6
Western Europe 61.1 71.9 116.5 201.4
England as %Western Europe
4.91% 6.82% 9.87% 15.14%
Table 3 Percentage Growth Rates (Overall: for periods designated)
1550-1680 1680-1820 1820-1900
England 64 133 166
France 29 39 26
Netherlands 58 8 149
Spain -6 64 33
Italy 9 53 77
Germany 0 51 142
Western Europe 18 62 73

* Notes and sources:
From the authors cited below:
The totals shown become progressively more accurate. Some of those for 1550 and 1680 are subject to very wide margins of error. In many cases the figures used are based on estimates for dates close to the year heading each column rather than for the year itself. The estimates refer to the present territories of the countries shown. The English data exclude Wales and Monmouthshire. For 1820 and 1900 all totals are taken from or estimated from B.R. Mitchell, European Historical Statistics, 2nd edn. (Cambridge, 1981), table BI, except for England in 1820. Otherwise the most important sources used were the following: E.A. Wrigley and R.S. Schofield, The Population History of England, 1541-1871: A Reconstruction (London, 1981), table 7.8; B.R. Mitchell and P. Deane, Abstract of British Historical Statistics (Cambridge, 1962), chapter I, tables 2, 7; M. Reinhard, A. Arnmengaud and J. Dupaquier, Histoire générale de la population mondiale, 3rd edn. (Paris, 1968); J. Dupâquier, La population française aux XVIIe et XVIIIe siècles (Paris, 1979); C. McEvedy and R. Jones, Atlas of World Population History (London, 1978); M. Flinn, ed., Scottish Population History from the 17th Century to the 1930s (Cambridge, 1977); C.M. Cipolla, ‘Four Centuries of Italian Demographic Development’, and K.H. Connell, ‘Land and Population in Ireland, 1780-1845’, both in D.V. Glass and D.E.C. Eversley, eds., Population in History (London, 1965); J.A. Faber, H.K. Roessingh, B.H. Slicher van Bath, A.M. Van der Woude and H.J. Van Xanten, ‘Population Changes and Economic Developments in the Netherlands: A Historical Survey’, A.A.G. Bijdragen, 12 (1965).
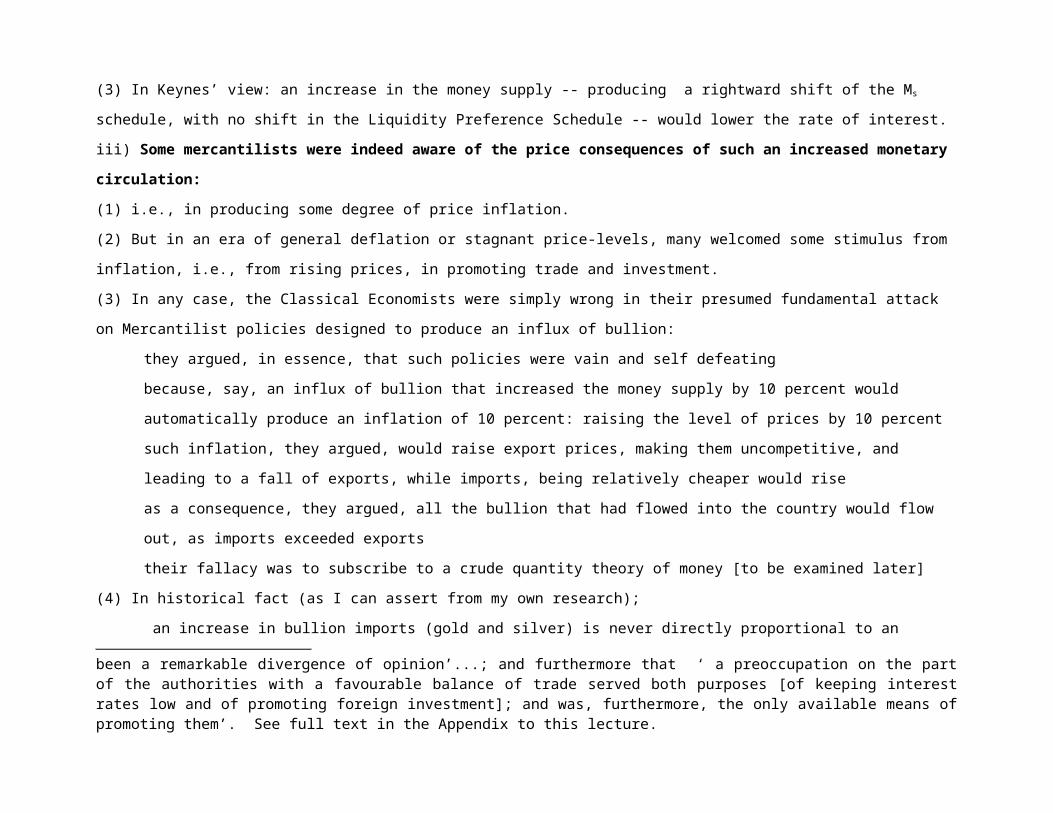
Table 4. ESTIMATES OF THE POPULATION OF LONDON
1500 estimate 50,000
1600 estimate 200,000
1650 estimate 350,000
1750 estimate 550,000
1801 census 1,088,000
1851 census 2,491,000
Table 5. Percentages of Total Population Living in Townswith 5,000 or more inhabitants, 1600 - 1850
Year ENGLAND FRANCE NETHERLANDS
1600 8 9 29
1700 17 11 39
1750 21 10 35
1800 28 11 35
1850 45 19 39
Source:
E. Anthony Wrigley, ‘British Population during the “Long” Eighteenth Century, 1680 - 1840’, in Roderick Floud and Paul Johnson, eds., Cambridge Economic History of Modern Britain, 3 vols. (Cambridge and New York: Cambridge University Press, 2004), Vol I: Industrialization, 1700 - 1860, Table 3.11, p. 88.
Table 6.
CHIEF SOURCES OF BRITISH GOVERNMENT REVENUES as percentages of total
revenuesYears Customs Excises Stamp Post Land Others TOTAL
duties duties taxes office taxes
1700 35.0 23.7 2.1 1.8 34.1 3.30 100.00
1710 25.5 29.5 1.9 1.2 34.9 7.00 100.00
1720 26.4 39.2 2.8 1.5 24.4 5.70 100.00
1730 31.3 44.8 2.5 1.5 24.9 -5.00 100.00
1740 24.7 49.0 2.3 1.5 26.4 -3.90 100.00
1750 20.6 46.2 1.8 1.2 29.6 0.60 100.00
1760 22.9 45.8 3.1 0.9 29.2 -1.90 100.00
1770 25.0 45.2 3.0 1.4 15.8 9.60 100.00
1780 22.1 48.5 4.3 1.1 20.1 3.90 100.00
1790 20.3 45.3 7.8 2.2 17.6 6.80 100.00
1800 21.5 33.5 8.3 3.8 16.1 16.80 100.00
1810 21.1 35.8 8.7 2.5 12.1 19.80 100.00
1820 22.4 45.5 12.0 3.6 14.1 2.40 100.00
1830 34.7 38.0 13.4 4.0 9.6 0.30 100.00

1840 44.8 28.2 13.9 2.5 8.1 2.50 100.00
1850 39.1 26.3 12.3 3.9 7.9 10.50 100.00
Source: Robert M. Kozub, ‘Evolution of Taxation in England, 1700 - 1850: a Period of War and Industrialization’, The Journal of European Economic History, 32:2 (Fall 2003), 363-388: Table 3, p. 375 (reproduced in a different format).
Table 7: Decennial Averages of the Official Values of English Overseas Trade, from 1700-09 to 1790-9; and of British Overseas Trade, from 1780-9 to 1820-9, in millions of pounds sterling (official Customs values based on prices of 1697-1710).
INDEX: 1700-9 = 100
Decade Imports Index DomesticExports
Re-Exports
Per cent ofTotal
Exports
TotalExports
EXPORTINDEX
1700-09 4.783 100.0 3.961 1.655 29.5% 5.615 100.0
1710-19 5.585 116.8 4.775 2.150 31.0% 6.925 123.3
1720-29 6.796 142.1 4.937 2.840 36.5% 7.777 138.5
1730-39 7.478 156.4 5.858 3.200 35.3% 9.076 161.6
1740-49 7.290 152.4 6.556 3.571 35.3% 10.128 180.4
1750-59 8.465 177.0 8.750 3.504 28.6% 12.254 218.2
1760-69 10.719 224.1 10.043 4.490 30.9% 14.533 258.8

1770-79 12.105 253.1 9.287 5.136 35.6% 14.422 253.3
1780-89 13.730 287.1 10.200 4.262 29.5% 14.462 257.5
1790-99 21.797 455.7 17.520 9.350 34.8% 26.870 478.5
GR BRITAIN
1780-99 14.889 311.3 10.889 4.529 29.4% 15.419 274.6
1790-99 22.164 463.4 17.697 9.425 34.8% 27.123 483.0
1800-09 28.737 600.9 24.880 10.100 28.9% 34.980 622.9
1810-19 31.633 661.4 35.044 11.678 25.0% 46.722 832.0
1820-29 38.310 801.0 46.530 9.880 17.5% 56.410 1004.5
Table 8: The Composition of England's Export Trade, 1640 - 1750
Percentages of Total Export Values
COMMODITY 1640 1700 1750
Woollens 92% 48% 33%
Other Manufactures 8% 20%
Foodstuffs 8% 12%
Raw Materials 4% 6% 5%
Re-Exports 4% 31% 29%
Total 100% 100% 100%

Table 9: Direction and Distribution of English Exports, 1700 - 98
In percentages of export values:
Region 1700 1750 1772 1798
North America 6% 11% 25% 32%
Caribbean/S.
America
5% 5% 12% 25%
Africa-Asia 4% 7% 14% 13%
Total of Above 15% 23% 51% 70%
Europe 85% 77% 49% 30%
Region 1700 1750 1772 1798
Total Values:
millions of £ st.
£4.461 £9.125 £10.196 £18.298
Table 10.
The English East India Company's Export Trade to India in Treasure and Merchandise
in pounds sterling: in decennial means, 1660-69 to 1710-19
Decades Total Treasure Merchandise Total Value Treasure Merchandise
in £ sterling in £ sterling in £ sterling percent Percent
1660-69 74,022.400 41,085.200 115,107.600 64.31% 35.69%
1670-79 234,091.400 89,990.800 324,082.200 72.23% 27.77%

1680-89 383,707.700 56,170.200 439,877.900 87.23% 12.77%
1690-99 166,561.400 72,065.200 238,626.600 69.80% 30.20%
1700-09 337,008.900 60,876.500 397,885.400 84.70% 15.30%
1710-19 371,418.100 97,771.300 469,189.400 79.16% 20.84%
TOTAL 1,566,809.900 417,959.200 1,984,769.100 78.94% 21.06%
Source: Calculated from:
K. N. Chaudhuri, ‘Treasure and Trade Balances: the East India Company's Export Trade, 1660-1720’, Economic History Review, 2nd ser. 21 (Dec. 1968), Table 1, pp. 497-98.

Table 11.Export Statistics of the English East India Company: Exports of Precious Metals
in kilograms and Pounds Sterling of England, in decennial means: 1660-69 to 1710-19
Decades Silver kg Silver value Gold kg Gold Value Total Treasure
Silver Gold as
in £ sterling in £ sterling in £ sterling as percent percent
1660-69 5,729.600 51,445.568 175.140 22,576.832 74,022.400 69.50% 30.50%
1670-79 11,364.000 102,063.850 1,015.300 132,027.550 234,091.400 43.60% 56.40%
1680-89 29,276.000 262,839.775 929.070 120,867.926 383,707.700 68.50% 31.50%
1690-99 18,179.000 163,230.172 24.690 3,331.228 166,561.400 98.00% 2.00%
1700-09 36,294.300 325,887.606 79.540 11,121.294 337,008.900 96.70% 3.30%
1710-19 41,133.600 369,189.591 14.970 2,228.509 371,418.100 99.40% 0.60%
TOTAL 141,976.500 1,274,656.563 2,238.710 292,153.337 1,566,809.900 81.35% 18.65%
Source:
Calculated from K N. Chaudhuri, ‘Treasure and Trade Balances: the East India Company's Export Trade, 1660-1720’, Economic History Review, 2nd ser. 21 (Dec. 1968), Table 1, pp. 497-98.
Table 12: Exports of Silver to India and East Asia by the Dutchand British East India Companies, in Kilograms of Pure Metal
Decennial Means, 1660-9 to 1710-19
Decade By the Dutch By the British Total Silver
East India Co. East India Co. Shipments
1660-69 11,563.1 5,729.6 17,292.7
1670-79 11,854.6 11,364.0 23,218.6
1680-89 18,847.0 29,276.0 48,123.0
1690-99 27,720.9 18,179.0 45,899.9
1700-09 37,392.9 36,294.3 73,687.2
1710-19 37,108.1 41,133.6 78,241.7
F.S. Gaastra, ‘The Exports of Precious Metal from Europe to Asia by the Dutch East India Company, 1602-1795 A.D.’, in John F.
Richards, ed., Precious Metals in the Medieval and Early Modern Worlds (Durham, N.C., 1983), pp. 447-76.
Kirti N. Chaudhuri, ‘Treasure and Trade Balances: the East India Company's Export Trade, 1660-1720’, Economic History Review, 2nd ser. 21 (Dec. 1968), Table 1, pp. 497-98.

Table 13. Imports into Seville of Spanish American Gold and Silver Bullion in pesos of 450 maravedis and in kilograms of fine metals: in quinquennial means, 1501-05 to 1656-61
Year: Year: Public Bullion: Private Bullion: TOTAL Bullion: Mean MeanBegin End Means in pesos Means in pesos Means in pesos Silver Imports Gold Imports
of 450 maravedis of 450 maravedis of 450 maravedis in kg in kg
1503 1505 32,405.50 91,279.60 123,685.10 517.241506 1510 42,770.80 120,476.50 163,247.30 682.691511 1515 62,647.00 176,463.70 239,110.70 999.951516 1520 52,043.50 146,595.80 198,639.30 830.701521 1525 7,030.50 19,803.50 26,834.00 3.40 111.881526 1530 54,414.10 153,273.30 207,687.40 26.34 865.931531 1535 86,472.10 243,574.10 330,046.20 5,090.79 854.411536 1540 270,177.00 517,401.40 787,578.40 12,147.99 2,038.861541 1545 151,557.70 839,243.30 990,801.00 16,815.87 2,363.401546 1550 318,534.30 783,207.90 1,101,742.20 18,698.76 2,628.031551 1555 725,701.30 1,247,404.90 1,973,106.20 33,479.21 4,707.311556 1560 313,699.10 1,286,100.60 1,599,799.70 27,145.03 3,816.701561 1565 363,906.60 1,877,600.50 2,241,507.10 83,373.92 1,019.641566 1570 756,948.60 2,071,294.50 2,828,243.10 105,197.84 1,286.541571 1575 659,732.10 1,721,589.70 2,381,321.80 91,353.22 770.061576 1580 1,329,935.70 2,120,452.50 3,450,388.20 132,365.17 1,115.771581 1585 1,510,120.80 4,364,801.60 5,874,922.40 232,207.57 1,336.211586 1590 1,608,642.50 3,157,883.60 4,766,526.10 188,397.97 1,084.121591 1595 2,004,669.70 5,032,302.80 7,036,972.50 273,704.54 1,966.281596 1600 2,194,863.60 4,690,836.50 6,885,700.10 267,820.77 1,924.011601 1605 1,303,977.10 3,576,688.50 4,880,665.60 193,590.35 1,028.811606 1610 1,709,935.80 4,571,105.60 6,281,041.40 249,135.90 1,324.001611 1615 1,442,584.30 3,463,039.80 4,905,624.10 196,820.45 795.09
Table 13. Imports into Seville of Spanish American Gold and Silver Bullion in pesos of 450 maravedis and in kilograms of fine metals: in quinquennial means, 1501-05 to 1656-61
Year: Year: Public Bullion: Private Bullion: TOTAL Bullion: Mean MeanBegin End Means in pesos Means in pesos Means in pesos Silver Imports Gold Imports
of 450 maravedis of 450 maravedis of 450 maravedis in kg in kg
1616 1620 869,557.60 5,152,934.40 6,022,492.00 241,630.75 976.101621 1625 978,231.20 4,423,904.50 5,402,135.70 223,022.55 404.371626 1630 923,760.20 4,067,145.10 4,990,905.30 206,045.26 373.591631 1635 946,764.90 2,475,405.90 3,422,170.80 143,003.28 126.991636 1640 938,260.60 2,324,659.80 3,262,920.40 136,348.64 121.091641 1645 928,732.40 1,824,028.10 2,752,760.50 113,889.78 167.031646 1650 333,022.50 2,021,086.90 2,354,109.40 97,396.41 142.841651 1655 447,775.60 1,010,977.80 1,458,753.40 60,685.98 64.271656 1660 121,304.80 550,918.30 672,223.10 27,965.33 29.62
Source:
Earl J. Hamilton, American Treasure and the Price Revolution in Spain, 1501-1650 (Cambridge, Mass. 1934), pp. 34, 42. Bullion imports were given only in decennial means; but the values of imported treasure, for gold and silver bullion combined were given in quinquennial means; and for each decade, the proportional values for the quinquennium was used to estimated the quinquennial means of the kilograms of fine metal imported. Hamilton’s research in the Seville archives concluded in 1660; and no further research has revealed estimates of treasure imports into Seville beyond 1660.
Table 14
Mined Outputs of Gold and Silver from Spanish America,and Exports of Gold and Silver Bullion from Spanish America to Sevillein quinquennial means, 1526-30 to 1701-05
Potosi: Zacatecas: Sombrerete Total KnownMean Value
of Mean Mean Silver IndexIndex of
YearSilver Outputs
Silver Outputs
Silver Outputs Silver Mining Bullion Imports
GoldImports Imports Imports:
MinedOutputs
in kg. in kg. in kg. Outputs in kgin 450
maravedis in kg in kg1591-
1600=1001591-1600=100
1526-30 207,687.40 865.93 26.34 0.011531-35 330,046.20 854.41 5,090.79 1.881536-40 787,578.40 2,038.86 12,147.99 4.491541-45 990,801.00 2,363.40 16,815.87 6.211546-50 1,101,742.20 2,628.03 18,698.76 6.911551-55 64,848.88 64,848.88 1,973,106.20 4,707.31 33,479.21 12.36 31.391556-60 54,335.74 21,294.68 75,630.42 1,599,799.70 3,816.70 27,145.03 10.03 36.611561-65 56,080.38 27,761.40 83,841.77 2,241,507.10 1,019.64 83,373.92 30.79 40.591566-70 51,717.86 31,498.08 83,215.94 2,828,243.10 1,286.54 105,197.84 38.85 40.291571-75 36,439.01 35,925.21 72,364.22 2,381,321.80 770.06 91,353.22 33.74 35.031576-80 111,607.53 30,389.38 141,996.90 3,450,388.20 1,115.77 132,365.17 48.89 68.741581-85 168,398.46 27,613.05 196,011.51 5,874,922.40 1,336.21 232,207.57 85.76 94.891586-90 176,839.51 28,413.40 205,252.91 4,766,526.10 1,084.12 188,397.97 69.58 99.361591-95 192,454.49 27,002.87 219,457.36 7,036,972.50 1,966.28 273,704.54 101.09 106.241596-00 169,671.92 24,005.40 193,677.32 6,885,700.10 1,924.01 267,820.77 98.91 93.761601-05 183,470.02 29,736.38 213,206.40 4,880,665.60 1,028.81 193,590.35 71.50 103.21

Mined Outputs of Gold and Silver from Spanish America,and Exports of Gold and Silver Bullion from Spanish America to Sevillein quinquennial means, 1526-30 to 1701-05
Potosi: Zacatecas: Sombrerete Total KnownMean Value
of Mean Mean Silver IndexIndex of
YearSilver Outputs
Silver Outputs
Silver Outputs Silver Mining Bullion Imports
GoldImports Imports Imports:
MinedOutputs
in kg. in kg. in kg. Outputs in kgin 450
maravedis in kg in kg1591-
1600=1001591-1600=100
1606-10 158,273.46 34,121.27 192,394.73 6,281,041.40 1,324.00 249,135.90 92.01 93.141611-15 161,108.67 47,517.24 208,625.91 4,905,624.10 795.09 196,820.45 72.69 101.001616-20 139,403.78 48,213.16 187,616.94 6,022,492.00 976.10 241,630.75 89.24 90.831621-25 134,795.30 55,609.74 190,405.04 5,402,135.70 404.37 223,022.55 82.37 92.181626-30 130,628.28 47,861.74 178,490.02 4,990,905.30 373.59 206,045.26 76.10 86.411631-35 124,267.78 47,934.53 172,202.31 3,422,170.80 126.99 143,003.28 52.82 83.361636-40 147,647.32 31,044.38 178,691.70 3,262,920.40 121.09 136,348.64 50.36 86.511641-45 113,646.36 28,101.07 141,747.43 2,752,760.50 167.03 113,889.78 42.06 68.621646-50 121,192.60 30,215.72 151,408.32 2,354,109.40 142.84 97,396.41 35.97 73.301651-55 99,371.13 31,046.27 130,417.40 1,458,753.40 64.27 60,685.98 22.41 63.141656-60 103,710.82 26,373.41 130,084.23 672,223.10 29.62 27,965.33 10.33 62.971661-65 78,949.36 22,584.61 101,533.96 49.151666-70 83,016.31 35,513.85 118,530.16 57.381671-75 82,017.54 50,404.29 132,421.83 64.111676-80 75,757.15 64,139.87 139,897.01 67.721681-85 88,180.87 37,823.48 30,492.83 156,497.18 75.761686-90 81,005.43 31,164.00 31,043.50 143,212.93 69.331691-95 68,181.86 31,863.18 17,500.54 117,545.58 56.90
Mined Outputs of Gold and Silver from Spanish America,and Exports of Gold and Silver Bullion from Spanish America to Sevillein quinquennial means, 1526-30 to 1701-05
Potosi: Zacatecas: Sombrerete Total KnownMean Value
of Mean Mean Silver IndexIndex of
YearSilver Outputs
Silver Outputs
Silver Outputs Silver Mining Bullion Imports
GoldImports Imports Imports:
MinedOutputs
in kg. in kg. in kg. Outputs in kgin 450
maravedis in kg in kg1591-
1600=1001591-1600=100
1696-00 56,884.78 26,451.05 12,506.02 95,841.85 46.401701-05 43,642.72 31,719.17 6,233.96 81,595.85 39.50
Sources:
Peter J. Bakewell, ‘Registered Silver Production in the Potosi District, 1550-1735’, Jahrbuch Für Geschichte: von Staat, Wirtschaft and Gesellschaft Lateinsamerikas,12 (1975), 68-103; Peter Bakewell, Silver Mining and Society in Colonial Mexico: Zacatecas, 1546 - 1700 (Cambridge and New York: Cambridge University Press, 1971), pp. 241-50; Earl J. Hamilton, American Treasure and the Price Revolution in Spain, 1501-1650 (Cambridge, Mass. 1934), pp. 34, 42.

TABLE 15
Indices of Real Wages or Incomes of English Workers, in Five-Year Averages,1770-74 to 1845-49 (Average of 1810-19 = Base 100)
Years‘Basket of
Consumables’
Price Index
Indices of the Purchasing Power of Average Weekly Incomes (normal week) of following workers:
Cotton FactoryWorkers
Shipbuilding&
Engineering
BuildingWorkers
Compositors
Agriculture
1770-41775-91780-41785-91790-41795-91800-41805-91810-41815-91820-41825-91830-41835-91840-41845-9
50.8 49.8 50.1 52.9 56.3 68.3 90.5 93.7108.1 91.9 73.3 89.3 71.0 72.2 72.0 69.9
93.3108.5132.5117.7129.7126.2123.4130.8
92.4109.7136.5125.5141.4141.2146.8148.7
99.8120.6119.8113.0108.7108.7 77.1 94.9 92.1107.9136.0124.9139.9137.2138.7143.5
140.2140.0135.4137.7126.2 97.2100.7 95.0106.6124.9114.8128.5130.6135.3138.6
99.0100.4100.3 94.9 99.2108.3 95.9109.1 94.1106.5109.7 96.8109.5107.1111.2103.8
SOURCES: (a) ‘Basket of Consumables’ Price Index and Purchasing Power of Builders' Wages (recalculated for the base 1810-9 from that 1450-75,) in E.H. Phelps Brown and Sheila Hopkins, ‘Seven Centuries of the Prices of Consumables, Compared with Builders' Wage-Rates’, in E.M. Carus-Wilson, ed. Essays in Economic History, II, 195-6.
(b) Average weekly money incomes of cotton factory workers, compositors, and those in shipbuilding & engineering and agriculture, calculated from indices (recalculated to base 1810-9) in B.R. Mitchell and P. Deane, Abstract of British Historical Statistics (1962), 348-9. [The indices of money incomes so adjusted were divided by the price index given in column 1, the Phelps-Brown & Hopkins ‘basket’.]

TABLE 16
Wages and the Standard of Living in 18th Century EnglandIndices of Money and Real Wages of Labourers in London and Lancashire in decennial averages,
1700 - 1796 (Average of 1700-09 = 100)
Decade Cost of LivingLONDON WAGES LANCASHIRE WAGES
Money Real Money Real
1700-9
1710-9
1720-9
1730-9
1740-9
1750-9
1760-9
1770-9
1780-9
1790-9
100.0
104.0
99.6
90.9
96.0
101.6
110.7
125.8
130.8
149.7
100.0
102.3
102.5
107.8
109.8
110.7
112.5
112.4
115.2
--
100.0
98.4
102.9
118.6
114.4
109.0
101.6
89.3
88.1
--
100.0
109.1
126.1
135.9
135.9
132.4
161.7
203.6
215.7
238.6
100.0
104.9
126.6
149.5
141.6
130.3
146.1
161.8
164.9
159.4

SOURCE: Calculated from statistics in Elizabeth Gilboy, ‘The Cost of Living and Real Wages in Eighteenth Century England’, Review of Economic Statistics (1938), as re-printed in B.R. Mitchell and Phyllis Deane, eds. Abstract of British Historical Statistics (1962), pp. 346-7.
TABLE 17
Estimates of Nominal Annual Earnings for Eighteen Occupations1755-1851: Adult Males, England and Wales (in current £'s)
Occupation
1755 1781 1797 1805 1810 1815 1819 1827 1835 1851
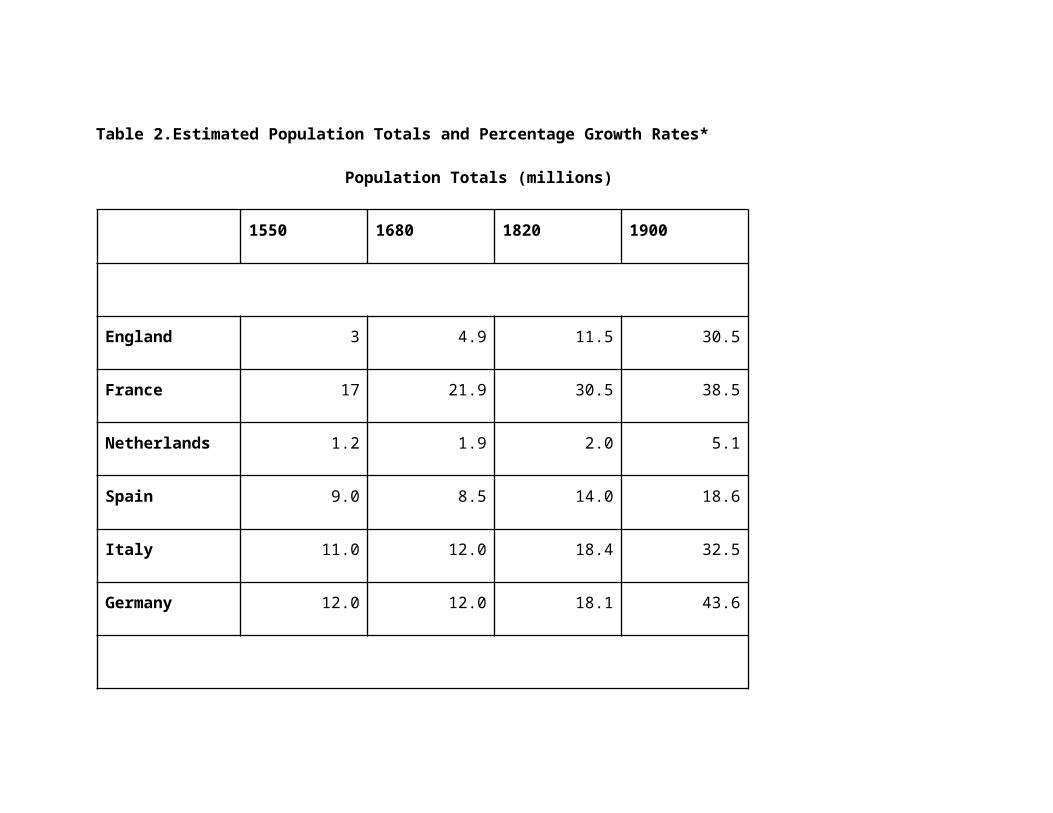
(lL) Farm laborers
(2L) Nonfarm labor
(3L) Messengers & porters
(4L) Other gov't low-wage
(5L) Police & guards
(6L) Colliers
(1H) Gov't high-wage
(2H) Shipbuilding trades
(3H) Engineering trades
(4H) Building trades
(5H) Cotton spinners
(6H) Printing trades
(7H) Clergy
(8H) Solicitors/barristers
(9H) Clerks
(10H) Surgeons & doctors
(11H) Schoolmasters
(12H) Engineers/surveyors
17.18
20.75
33.99
28.62
25.76
22.94
78.91
38.82
43.60
30.51
35.96
46.34
91.90
231.00
63.62
62.02
15.97
137.51
21.09
23.13
33.54
46.02
48.08
24.37
104.55
45.26
50.83
35.57
41.93
54.03
182.65
242.67
101.57
88.35
16.53
170.00
30.03
25.09
57.66
46.77
47.04
47.79
133.73
51.71
58.08
40.64
47.90
66.61
238.50
165.00
135.26
174.95
43.21
190.00
40.40
36.87
69.43
52.48
51.26
64.99
151.09
51.32
75.88
55.30
65.18
71.11
266.42
340.00
150.44
217.60
43.21
291.43
42.04
43.94
76.01
57.17
67.89
63.22
176.86
55.25
88.23
66.35
78.21
79.22
283.89
447.50
178.11
217.60
51.10
305.00
40.04
43.94
80.69
60.22
69.34
57.82
195.16
59.20
94.91
66.35
67.60
79.22
272.53
447.50
200.79
217.60
51.10
337.50
39.05
41.47
81.35
60.60
69.18
50.37
219.25
57.23
92.71
63.02
67.60
71.14
266.55
447.50
229.64
217.60
69.35
326.43
31.04
43.64
84.39
59.01
62.95
54.61
222.95
62.22
80.69
66.35
58.50
70.23
254.60
522.50
240.29
175.20
69.35
265.71
30.03
39.29
87.20
58.70
63.33
56.41
270.42
62.74
77.26
59.72
64.56
70.23
258.76
1166.67
269.11
200.92
81.89
398.89
29.04
44.83
88.88
66.45
53.62
55.44
234.87
64.12
84.05
66.35
58.64
74.72
267.09
1837.50
235.81
200.92
81.11
479.00
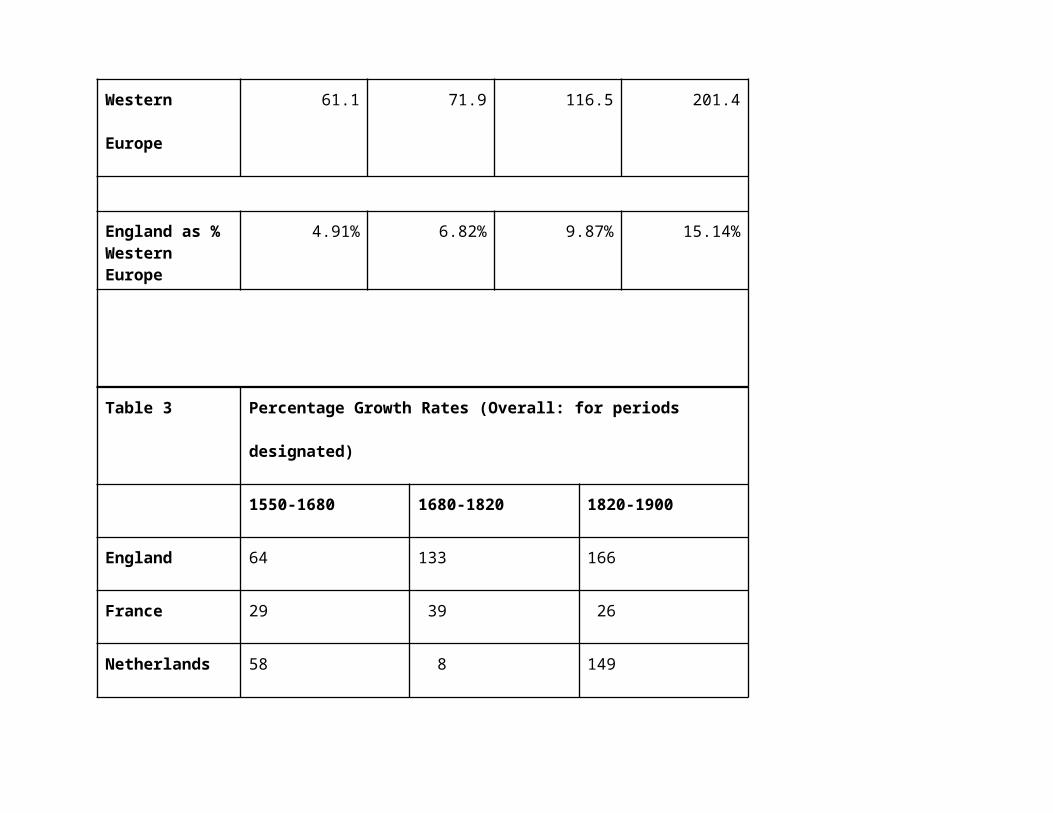
NOTE: (4L) = watchmen, guards, porters, messengers, Post Office letter carriers, janitors;(1H) = clerks, Post Office sorters, ware-housemen, collectors, tax surveyors, solicitors clergymen, surgeons, medical officers, architects, engineers;(2H) = shipwrights;(3H) = fitters, turners, iron-moulders;(4H) = bricklayers, masons, carpenters, plasterers;(6H) = compositors.
SOURCE: From Williamson, 1982b, Appendix Table 4.
TABLE 18
Trends in Nominal Full-Time Earnings for Six Labor Groups,Compared with Three Previous Series, 1755-1851 (1851 = 100)
-1 -2 -3 -4 -5 -6
Farm laborers
Bowley's farm
laborersMiddle group
Phelps Brown-Hopkins building laborers
Labor aristocracy
Tucker's London artisans
All bluecollar
White collar
All workers

1755
1781
1797
1805
1810
1815
1819
1827
1835
1851
52 weeks' earnings in 1851
59.16
72.62
103.41
139.12
144.76
137.88
134.47
106.89
103.41
100.00
£29.04
75.5
93.9
100.8
112.3
100.00
£29.04
42.95
54.88
72.92
98.89
110.95
105.55
99.41
98.89
96.98
100.00
£52.95
48.5
57.6
66.7
83.3
97.0
97.0
97.0
97.0
97.0
100.00
£42.90
50.86
57.38
64.86
79.44
92.03
95.28
91.92
93.55
88.68
100.00
£75.15
69.8
69.8
81.0
87.0
105.6
112.1
103.3
105.1
98.9
100.00
n.a.
51.05
59.64
74.42
96.58
107.81
106.18
101.84
97.59
94.11
100.00
£52.62
21.62
26.42
32.55
38.88
43.01
46.55
50.77
55.09
75.03
100.00
£258.88
38.62
46.62
58.97
75.87
84.89
85.30
84.37
83.11
88.77
100.00
£75.51
NOTE: The indices are aggregated from the finer groups listed in Table 9.1, using wage series from Table 9.2 and employment weights. The employment weights for 1755-1815 draw on Lindert, ‘English Occupations, 1670-1811,’ Table 3; while those for 1815-1851 are derived from censuses. The derivations of the employment weights are described in DP, Appendix A.
SOURCE: For the three previous series, see Bowley, 1900, table in back; Phelps Brown and Hopkins, 1955; Tucker, 1936, pp. 73-84. The conversion of the Phelps Brown-Hopkins series from daily to annual wages assumed 312 working days a year.
Table 19
A 'Best Guess' Cost-of-Living Index for southern England, 1781 - 1850: 1850 = 100Using Southern Urban Expenditure Weights

Years Index Years Index
1781 118.8 1816 192.11782 119.3 1817 197.51783 121.9 1818 192.41784 118.4 1819 182.91785 112.3 1820 170.11786 109.6 1821 150.51787 112.5 1822 139.81788 115.9 1823 146.01789 122.3 1824 154.61790 125.9 1825 162.31791 121.2 1826 144.41792 118.3 1827 140.91793 127.3 1828 143.21794 130.7 1829 143.21795 153.8 1830 143.91796 159.5 1831 141.31797 138.8 1832 133.91798 136.9 1833 124.71799 155.7 1834 117.61800 207.1 1835 112.81801 218.2 1836 126.41802 160.9 1837 129.21803 156.8 1838 138.3
1804 160.2 1839 142.31805 186.7 1840 138.41806 178.5 1841 133.31807 169.1 1842 123.41808 180.5 1843 109.61809 204.9 1844 114.51810 215.4 1845 112.01811 204.5 1846 116.41812 235.7 1847 138.0
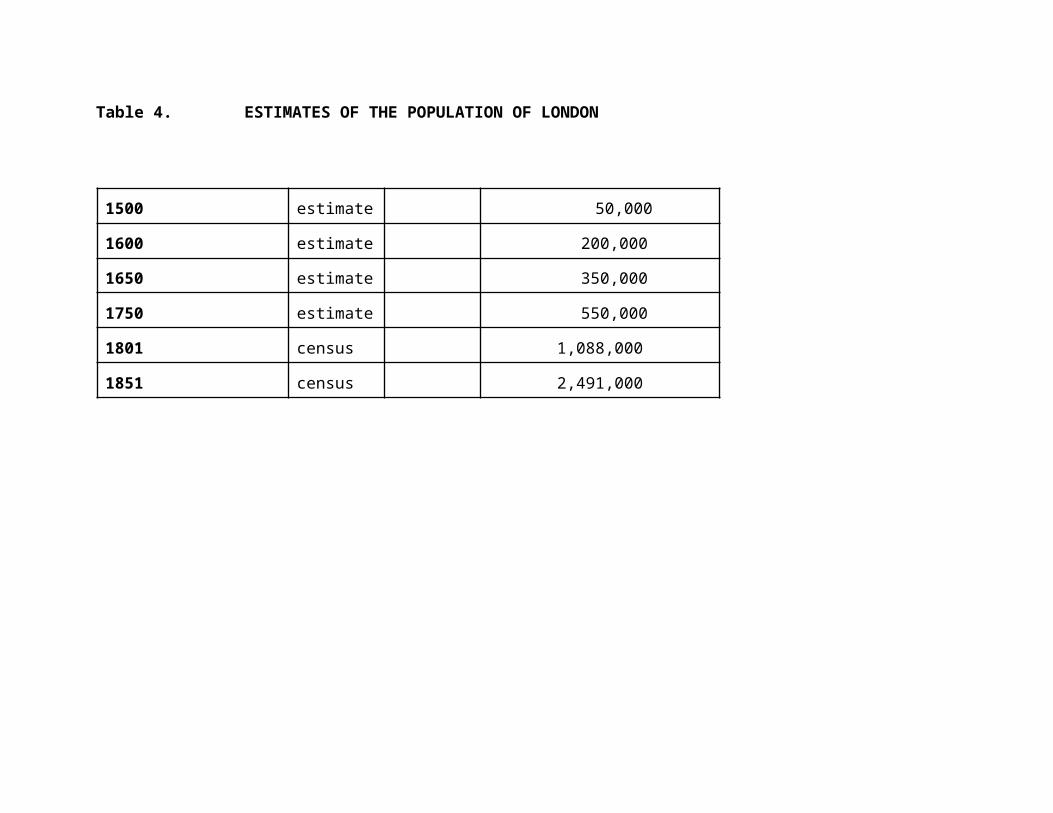
1813 230.0 1848 110.91814 203.3 1849 101.21815 182.6 1850 100
Source:
Peter Lindert and Jeffrey Williamson, ‘English Workers' Living Standards During the Industrial Revolution: A New Look’, in Joel Mokyr, ed., The Economics of the Industrial Revolution (London: George Allen and Unwin, 1985), pp. 177 - 206.

TABLE 20
Revised Measures of English Workers' Standard-of-Living Gains, 1781-1851
Overall improvement, 1781-1851
Source of improvement Farmlaborers
All blue-collar
workers
Allworkers
1. Real full-time earnings (‘Best guess,’ Table 9.5)a. Due to occupational change (DP, Sec. 6)b. Due to regional migration (DP, Sec. 7)c. Residual: real wage gains within occupations and regions
63.6%
(0)
(<3.6%)
(>60.0%)
99.2%
(<5.3%)
(<3.6%)
(>90.3%)
154.8%
(<17.2%)
(<3.6%)
(>134.0%)
2. Diminished by an ‘upper-bound’ rise in unemployment, or <7.4% (see Sec. VI above) 63.6% >91.8% >147.4%
3. Diminished by the shift toward higher urban living costs, or <3.3%* 63.6% >88.5% >144.1%
4. Diminished by urban-industrial disamenities, or <2.5%* 63.6% >86.0% >141.6%
5. Augmented by adult mortality gains, which were not negative (Sec. VIII) >63.6% >86.0% >141.6%

* These figures taken from DP, Section 8. Readers preferring the estimates in Section IX above may wish to substitute the 9.7% figure for Rows 3 and 4 together in the ‘blue-collar’ and ‘all workers’ columns.
Source: Peter Lindert and Jeffrey Williamson, ‘English Workers' Living Standards During the Industrial Revolution: A New Look’, in Joel Mokyr, ed., The Economics of the Industrial Revolution (London: George Allen and Unwin, 1985), pp. 177 - 206.
TABLE 21
Investment, Employment, and Output in England and Wales, 1761-1770 to 1841-1850,in 1788-1792 Prices
Decade Capitalstock(£m)
Repairs andrenewals
(£m)
Capitalformation
(£m)
Grossinvestment
(£m)
Labor force(000s)
Wage bill(£m)
Land rents(£m)
Land stock(£m)
Totaloutput
(A) Agriculture
1761-701771-801781-901791-18001801-101811-201821-301831-401841-50
260276299326351373396421455
22.524.427.030.030.833.335.938.342.3
0.91.82.12.41.81.91.92.23.5
23.426.229.132.432.635.237.840.545.8
874908894842768770820805809
23.523.823.623.924.127.127.328.629.6
19.819.720.321.224.521.022.032.337.0
374395423453435418680739886
66.769.773.077.581.283.497.0101.3112.4
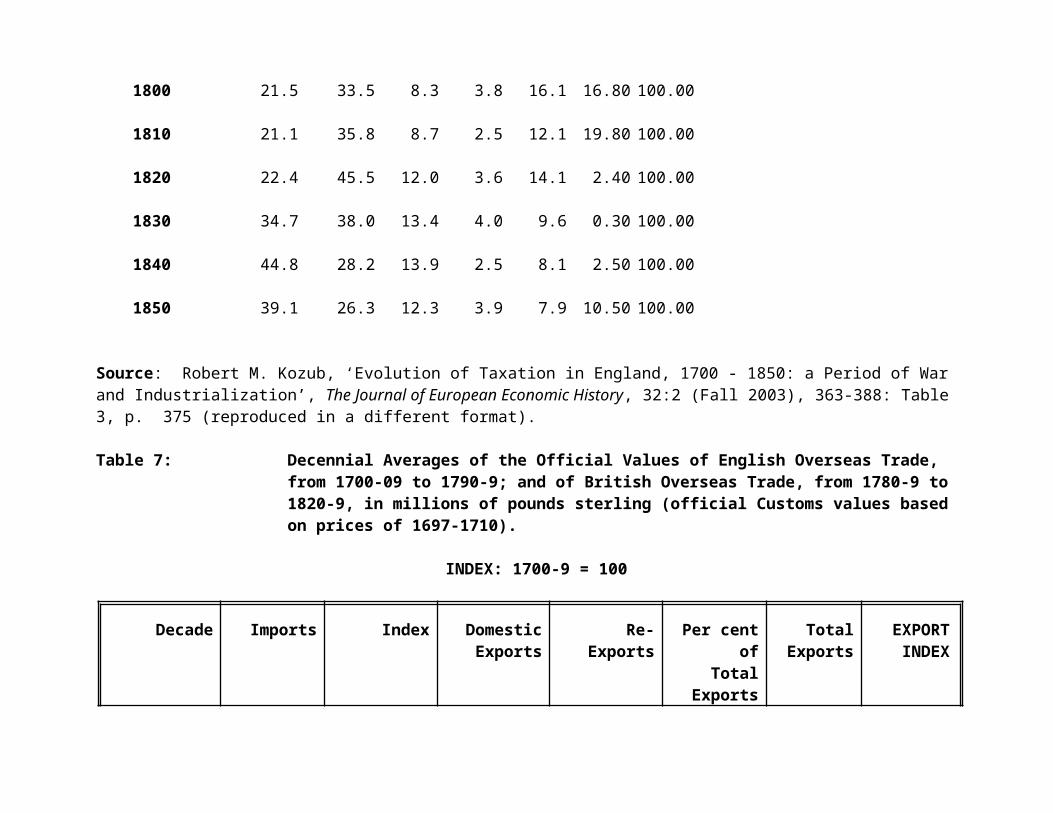
(B) Industry
1761-701771-801781-901791-18001801-101811-201821-301831-401841-50
198219248292341403501664887
6.67.58.910.811.113.717.621.629.0
1.82.33.75.04.97.412.420.224.3
8.49.812.515.816.021.229.941.753.3
4475045947899881204147318622217
16.518.621.927.633.746.075.697.0128.3
0.30.30.40.50.60.70.91.83.9
678101215193779
25.228.734.843.850.267.9106.4140.6185.5
Notes: All figures assume full employment (hence some agricultural series have been revised upward to allow for actual unemployment). Gross investment = Repairs & renewals + Capital formation. Labor force measured as numbers of families (thousands). Labor force and Wage bill figures take into account earnings by some members of chiefly agricultural families in industrial employment. Rents for industry are ‘urban rents, ‘ derived from Feinstein (1978). Total output (= Gross Investment + Wage Bill + Land Rents) is exclusive of transfer payments, of which the most important were interest payments. Services, etc. excluded (see text).
Source: Gustav N. von Tunzelmann, ‘The Standard of Living Debate and Optimal Economic (London: George Allen and Unwin, 1985), pp. 207 - 26.