· web viewfor the purpose of defining ecosystem diversity we use the interim australian...
TRANSCRIPT

2015–16 Basin-scale evaluation of Commonwealth environmental water – Ecosystem Diversity
Prepared by: Shane Brooks
Final ReportMDFRC Publication 144/2017
document.docx 1

2015–16 Basin-scale evaluation of Commonwealth environmental water — Ecosystem DiversityReport prepared for the Commonwealth Environmental Water Office by The Murray–Darling Freshwater Research Centre
This report was prepared by The Murray–Darling Freshwater Research Centre (MDFRC). The aim of the MDFRC is to provide the scientific knowledge necessary for the management and sustained utilisation of the Murray–Darling Basin water resources. The MDFRC is a joint venture between La Trobe University and CSIRO. Additional investment is provided through the University of Canberra.
For further information contact:
Ben Gawne
The Murray–Darling Freshwater Research CentrePO Box 991 Wodonga VIC 3689 Ph: (02) 6024 9650
Email: Ben.Gawne@ Canberra.edu.au Web: www.mdfrc.org.auEnquiries: [email protected]
Report Citation: Brooks S (2017) 2015–16 Basin-scale evaluation of Commonwealth environmental water – Ecosystem Diversity. Final Report prepared for the Commonwealth Environmental Water Office by The Murray–Darling Freshwater Research Centre, MDFRC Publication 144/2017, May, 45pp.
2015–16 Basin-scale evaluation of Commonwealth environmental water – Ecosystem Diversity i

This monitoring project was commissioned and funded by Commonwealth Environmental Water Office.
Copyright
© Copyright Commonwealth of Australia, 2016
2015–16 Basin-scale evaluation of Commonwealth environmental water – Ecosystem Diversity (2017) is licensed by the Commonwealth of Australia for use under a Creative Commons By Attribution 3.0 Australia licence with the exception of the Coat of Arms of the Commonwealth of Australia, the logo of the agency responsible for publishing the report, content supplied by third parties, and any images depicting people. For licence conditions see: http://creativecommons.org/licenses/by/3.0/au/
This report should be attributed as: Brooks S (2017) 2015–16 Basin-scale evaluation of Commonwealth environmental water – Ecosystem Diversity. Final Report prepared for the Commonwealth Environmental Water Office by The Murray–Darling Freshwater Research Centre, MDFRC Publication 144/2017, May, 45pp.
Disclaimer
The views and opinions expressed in this publication are those of the authors and do not necessarily reflect those of the Australian Government or the Minister for the Environment.
While reasonable efforts have been made to ensure that the contents of this publication are factually correct, the Commonwealth does not accept responsibility for the accuracy or completeness of the contents, and shall not be liable for any loss or damage that may be occasioned directly or indirectly through the use of, or reliance on, the contents of this publication.
The material contained in this publication represents the opinion of the author only. Whilst every effort has been made to ensure that the information in this publication is accurate, the author and MDFRC do not accept any liability for any loss or damage howsoever arising whether in contract, tort or otherwise which may be incurred by any person as a result of any reliance or use of any statement in this publication. The author and MDFRC do not give any warranties in relation to the accuracy, completeness and up to date status of the information in this publication.
Where legislation implies any condition or warranty which cannot be excluded restricted or modified such condition or warranty shall be deemed to be included provided that the author’s and MDFRC’s liability for a breach of such term condition or warranty is, at the option of MDFRC, limited to the supply of the services again or the cost of supplying the services again.
2015–16 Basin-scale evaluation of Commonwealth environmental water – Ecosystem Diversity ii

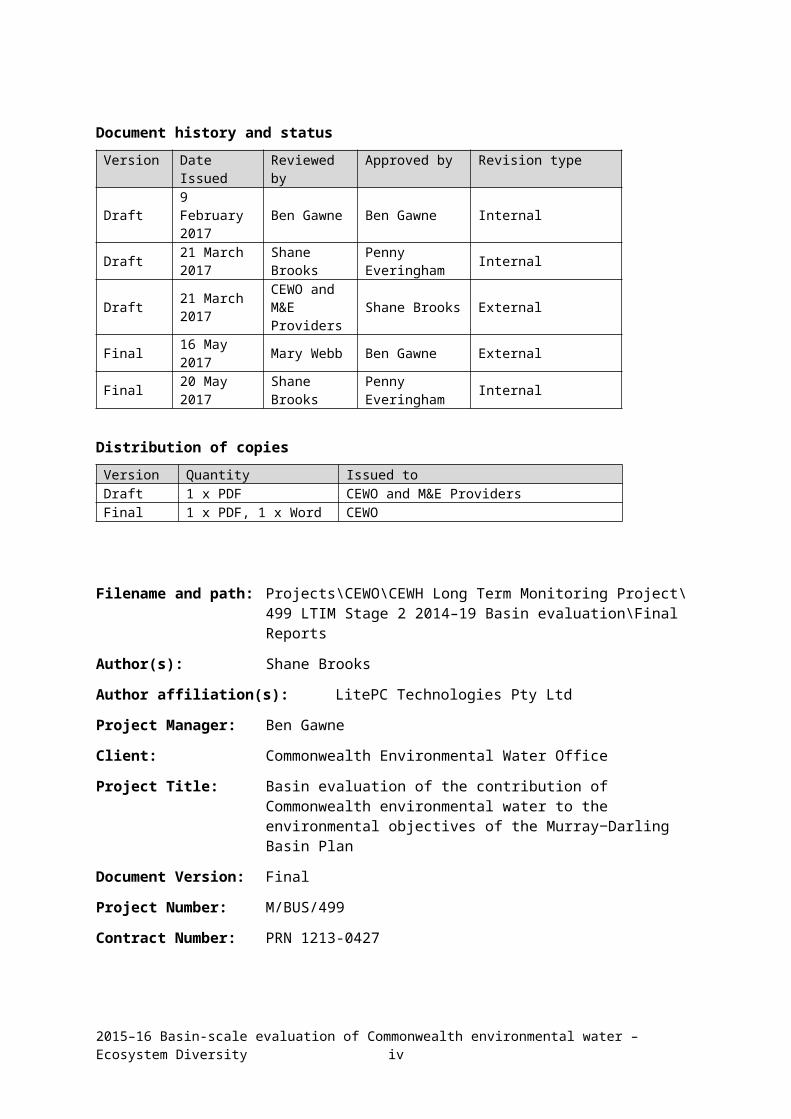
Document history and status
Version Date Issued Reviewed by Approved by Revision type
Draft 9 February 2017 Ben Gawne Ben Gawne Internal
Draft 21 March 2017 Shane Brooks Penny
Everingham Internal
Draft 21 March 2017
CEWO and M&E Providers
Shane Brooks External
Final 16 May 2017 Mary Webb Ben Gawne External
Final 20 May 2017 Shane Brooks Penny Everingham Internal
Distribution of copies
Version Quantity Issued toDraft 1 x PDF CEWO and M&E ProvidersFinal 1 x PDF, 1 x Word CEWO
Filename and path: Projects\CEWO\CEWH Long Term Monitoring Project\499 LTIM Stage 2 2014–19 Basin evaluation\Final Reports
Author(s): Shane Brooks
Author affiliation(s): LitePC Technologies Pty Ltd
Project Manager: Ben Gawne
Client: Commonwealth Environmental Water Office
Project Title: Basin evaluation of the contribution of Commonwealth environmental water to the environmental objectives of the Murray‒Darling Basin Plan
Document Version: Final
Project Number: M/BUS/499
Contract Number: PRN 1213-0427
2015–16 Basin-scale evaluation of Commonwealth environmental water – Ecosystem Diversity iii

Acknowledgements:
This project was undertaken using data collected for the Commonwealth Environmental Water Office Long Term Intervention Monitoring (LTIM) Project. The assistance provided by the Monitoring and Evaluation Providers into interpretation of data and report review is greatly appreciated. The author would also like to thank Commonwealth Environmental Water Office staff, State water agency staff, and LTIM Monitoring and Evaluation Providers who contributed to detailed mapping of inundation from watering actions that is a core input to this report. Thank you to the LTIM Hydrology team for compiling the inundation maps.
The Murray–Darling Freshwater Research Centre offices are located on the land of the Latje Latje and Wiradjuri peoples. We undertake work throughout the Murray–Darling Basin and acknowledge the traditional owners of this land and water. We pay respect to Elders past, present and future.
2015–16 Basin-scale evaluation of Commonwealth environmental water – Ecosystem Diversity iv
Contents1 Introduction..................................................................................................................................... 1
2 Method............................................................................................................................................ 3
2.1 Data..........................................................................................................................................................4
2.2 GIS Workflows..........................................................................................................................................8
3 Ecosystem Diversity Basin-scale evaluation.....................................................................................10
3.1 Highlights................................................................................................................................................10
3.2 Basin-scale evaluation 2015–16..............................................................................................................10
3.3 Cumulative Basin-scale evaluation (2014–16)........................................................................................15
3.4 Adaptive management...........................................................................................................................18
4 Contribution to achievement of Basin Plan objectives.....................................................................19
References.................................................................................................................................................. 20
Annex A. Updating the Basin ANAE classification.........................................................................................22
Annex B. ANAE wetland types influenced by Commonwealth environmental water by valley.......................24
Annex C. ANAE floodplain types inundated by Commonwealth environmental water by valley....................39
Annex D. ANAE river channel types influenced by Commonwealth environmental water by valley...............44
List of tablesTable 1. Area of each LTIM catchment inundated by Commonwealth environmental water (excluding in-
channel flows) in 2015–16, including both floodplain and wetland ecosystem types....................11
Table 2. Contribution of Commonwealth environmental water to ecosystem diversity of wetlands at the basin-scale. Ecosystem types are sorted by the area influenced by Commonwealth environmental water.12
Table 3. Contribution of Commonwealth environmental water to ecosystem diversity of floodplains at the Basin-scale, sorted by the area inundated......................................................................................14
Table 4. Contribution of Commonwealth environmental water to ecosystem diversity of estuarine areas in the Basin sorted by the area influenced by Commonwealth environmental water..............................14
Table 5. Contribution of Commonwealth environmental water to ecosystem diversity within river channels of the Basin sorted by the area influenced by Commonwealth environmental water........................14
Table 6. Comparison of the contribution of Commonwealth environmental water to ecosystem diversity of wetlands in the first two years of the LTIM project sorted by the magnitude of the difference between the two years. Ecosystem types with more than 5% of their total Basin area inundated in at least one year are shaded blue. Ecosystem types that have not received Commonwealth environmental water in the two years of LTIM to date are shaded red.........................................16
Table 7. Commonwealth Environmental Outcomes framework for ecosystem diversity...................................19
Table B1. Area of each wetland ecosystem type and the contribution of Commonwealth environmental water to supporting wetland ecosystem diversity within each valley, sorted by the area influenced with inundation highlighted in blue (includes riverine areas that are within the inundated areas but excludes in-channel flows presented in Annex D)..........................................................................24
Table C1. Area of each floodplain ecosystem type and the contribution of Commonwealth environmental water to supporting floodplain ecosystem diversity within each valley, sorted by the area inundated with inundation highlighted in blue...............................................................................39
2015–16 Basin-scale evaluation of Commonwealth environmental water – Ecosystem Diversity v

Table D1. Length of river and stream ecosystem types influenced by the delivery of Commonwealth environmental water as represented by the Basin ANAE waterways data set in each valley.........44
List of figuresFigure 1. Cause-and-effect diagram depicting the influence of flow on landscape ecosystem diversity (from
MDFRC 2013)....................................................................................................................................2
Figure 2. Structure and levels of the Interim Australian National Aquatic Ecosystem Classification Framework (AETG 2012)......................................................................................................................................3
Figure 3. The Basin ANAE wetlands.......................................................................................................................5
Figure 4. Inundation by Commonwealth environmental water 2015–16..............................................................6
Figure 5. Valley boundaries within the Murray–Darling Basin used in this evaluation..........................................7
Figure A1. The Basin ANAE classification confidence in the System Type attribute for wetland feature mapping (Brooks et al. 2014).........................................................................................................................23
AbbreviationsANAE Australian National Aquatic Ecosystem (classification)
CEWO Commonwealth Environmental Water Office
GIS geographical information system
ha hectare
LTIM Long Term Intervention Monitoring
M&E Providers Monitoring and Evaluation Providers
MDBA Murray–Darling Basin Authority
MDFRC Murray–Darling Basin Freshwater Research Centre
2015–16 Basin-scale evaluation of Commonwealth environmental water – Ecosystem Diversity vi

1 IntroductionA wide variety of ecosystem types occur in the Basin; from arid salt flats and clay pans to lush vegetated wetlands, from open grasslands to dense riparian forests; from dry ephemeral creeks to the large permanent channels and tributaries of the Murray River. Considered together, the range of different ecosystem types within a specified area defines the ecosystem diversity for that area. Ecosystem diversity defines patterns of natural variability that shape species distribution and abundance, resilience, and natural ecosystem functioning (Junk et al. 1989, Poff 1997, Thorp et al. 2006). As such, ecosystem diversity is an important component of biodiversity together with species diversity, genetic diversity and diversity of ecosystem function (Geist 2011).
Why focus on Ecosystem Diversity in the LTIM project?
Principles of ecosystem management suggest that protecting or restoring ecosystems also preserves valued species, habitats, and critical processes within them in addition to critical ecosystem services that they may provide. Evaluating the extent to which water-dependent ecosystem types have been supported by Commonwealth environmental water therefore contributes to assessing the contribution of Commonwealth environmental water to biodiversity in the Basin as outlined in the Commonwealth Environmental Water Outcomes Framework (CEWH 2013).
Developing understanding for how and why environmental watering outcomes differ among ecosystem types will also inform adaptive management by (1) fine tuning expected outcomes from the delivery of environmental water in different ecosystems, and (2) ultimately improving the efficiency, effectiveness and impact of the use of Commonwealth environmental water in the Basin.
The output of the Ecosystem Diversity evaluation provides a template for extrapolating observed outcomes at monitoring sites within the Basin (in LTIM Selected Areas) to similar ecosystem types in areas that are not monitored, thereby facilitating a Basin-scale evaluation of the impact of Commonwealth environmental water.
The detailed ecological or hydrological outcomes within each ecosystem are the subject of other LTIM Basin matter and Selected Area reports (refer Gawne et al. 2014).
Primary output from this evaluation
Environmental watering supports the maintenance of ecosystem diversity via the provision of water to maintain aquatic habitats, which in turn support a mosaic of water-dependent flora and fauna. This evaluation catalogues the different ecosystem types that received Commonwealth environmental water during the 2015–16 water year. It quantifies the physical area of each ecosystem type within the Basin that is inundated or influenced by Commonwealth environmental water compared to the known distribution for each type.
Additional Context
This is the second evaluation within the Long Term Intervention Monitoring (LTIM) project (see Brooks 2016a for the 2014–15 year).
This evaluation is concerned with identifying the range and distribution of ecosystem types that receive Commonwealth environmental water rather than documenting change in landscape ecosystem diversity through time. Delivery of environmental water has the potential to change physical landscape diversity through geomorphological processes (Figure 1), but in practice the frequency and volumes of Commonwealth environmental water that are delivered are constrained by storage volumes, infrastructure and land use to volumes that complement natural hydrological regimes rather than creating wholesale hydrological regime change with potential to restructure
2015–16 Basin-scale evaluation of Commonwealth environmental water – Ecosystem Diversity 1

landscapes. Large changes to the distribution and abundance of ecosystem types in the Basin are not expected within the duration of the LTIM project (5 years).
Figure 1. Cause-and-effect diagram depicting the influence of flow on landscape ecosystem diversity (from MDFRC 2013).
2015–16 Basin-scale evaluation of Commonwealth environmental water – Ecosystem Diversity 2

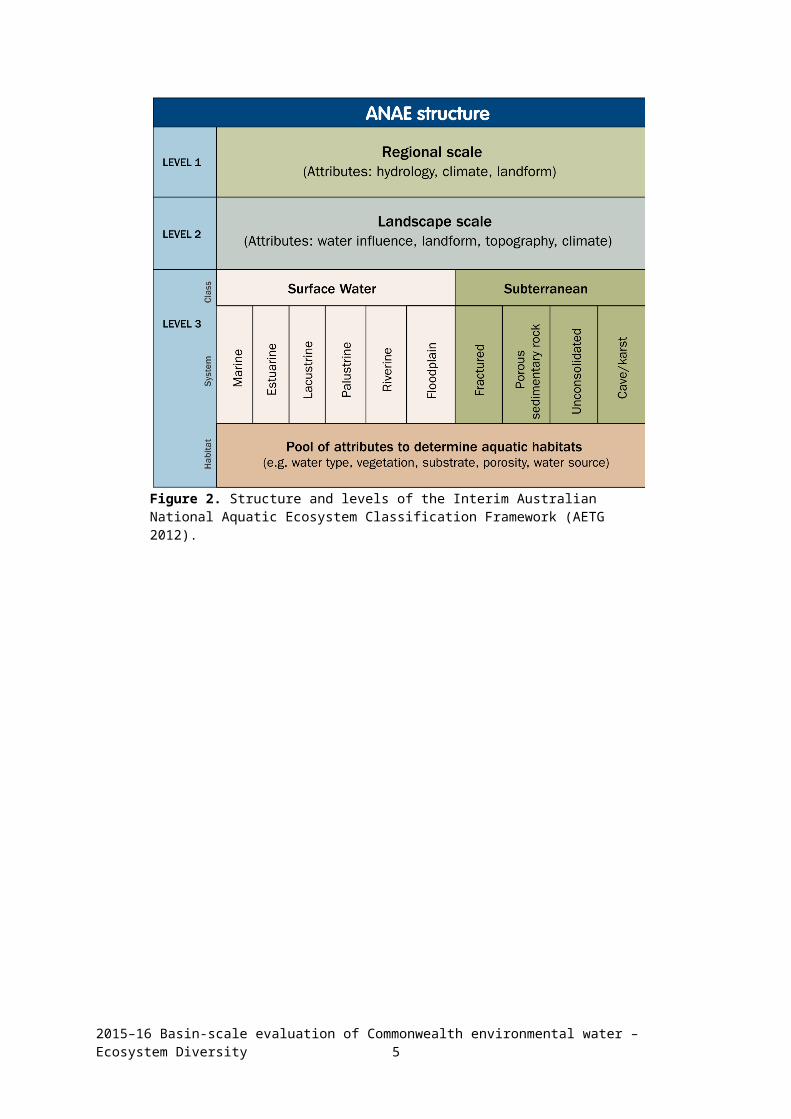
2 MethodFor the purpose of defining ecosystem diversity we use the interim Australian National Aquatic Ecosystem (ANAE) Classification Framework to identify distinct ecosystem types and their location in the Basin. The ANAE framework was prepared by the Australian Government Aquatic Ecosystems Task Group (AETG) to provide a consistent ecosystem type classification that can inform cross-jurisdictional adaptive management of aquatic ecosystems (AETG 2012). It uses three levels of attribute data to classify ecosystem types ( Figure 2). Level 1 attributes include national and regional data related to national climate, landform and hydrological patterns. Level 2 attributes are similar to Level 1 attributes but applied at sub-catchment scales. Level 3 attributes are applied to individual aquatic ecosystems. The ANAE classification was applied to the best available jurisdictional mapping for Basin wetlands, floodplains and rivers by Brooks et al. (2014) to produce the interim Murray-Darling Basin Aquatic Ecosystem Classification data set (hereafter referred to as the Basin ANAE classification). This data set provides the LTIM project with a baseline map that quantifies the distribution and extent of different aquatic ecosystem types, providing a relevant and contemporary means for defining ecosystem diversity in the Basin.
Overlaying a map of the Commonwealth environmental water that was delivered in the Basin can then identify which ecosystem types received Commonwealth environmental water to answer the following short-term (1-year) and long-term (5-year) Basin-scale evaluation question:
1. What did Commonwealth environmental water contribute to ecosystem diversity?
Figure 2. Structure and levels of the Interim Australian National Aquatic Ecosystem Classification Framework (AETG 2012).
2015–16 Basin-scale evaluation of Commonwealth environmental water – Ecosystem Diversity 3
2.1 Data
Data inputs to the evaluation of ecosystem diversity include:
The Basin ANAE data set (Brooks et al. 2014) (Figure 3). A significant update of the classification in the Basin is currently underway to improve confidence and consistency in the ANAE mapping and classification (Annex A). There will be significant changes to the numbers and extent of wetlands in areas of NSW that received Commonwealth environmental water in 2016–17 (e.g. the Central Murray Forests, Macquarie Marshes, Lowbidgee and Gwydir Wetlands). This evaluation of the 2015–16 contribution of Commonwealth environmental water to ecosystem diversity in the Basin and that of last year (2014–15) are therefore interim assessments that will be updated in 2018 using the revised classification. Substantive comparison between years is deferred to that time.
Commonwealth environmental water Inundation 2015–16 — a spatial representation of watering extent for Commonwealth environmental water delivered in the 2015–16 (Stewardson & Guarino 2017) (Figure 4). Improvements in the mapping of inundation extent this year led to the inclusion of the Coorong and Lakes Alexandria and Albert and the longitudinal extent of influence of Commonwealth environmental water in river channels.
LTIM valleys — a spatial layer developed for the LTIM project evaluation that subdivides the Basin into the major river valleys (Figure 5). These boundaries were derived from the Sustainable Rivers Audit (SRA) catchment boundaries with a modification to separate the Edward-Wakool Catchment from the Central Murray. The boundaries were adjusted slightly for this current evaluation in comparison to last year to improve the assignment of wetlands near valley boundaries to the watersheds in which managers and Commonwealth environmental water accounting allocate them. Mostly this effects the Central Murray area with a widening along the Murray River corridor to encompass fringing wetlands and the Gunbower and Barmah forests, and southern expansion of the Murrumbidgee valley to include Yanco Creek within the Murrumbidgee (the previous boundary roughly followed the creek line placing parts of Yanco Creek in the Murrumbidgee and other parts in the Central Murray). Areas inundated in 2014–15 were not in these affected areas so the evaluation of ecosystems inundated in 2014–15 and 2015–16 are comparable despite the boundary change.
2015–16 Basin-scale evaluation of Commonwealth environmental water – Ecosystem Diversity 4

Figure 3. The Basin ANAE wetlands.
2015–16 Basin-scale evaluation of Commonwealth environmental water – Ecosystem Diversity 5

Figure 4. Inundation by Commonwealth environmental water 2015–16.
2015–16 Basin-scale evaluation of Commonwealth environmental water – Ecosystem Diversity 6
Figure 5. Valley boundaries within the Murray–Darling Basin used in this evaluation.
As for the previous year, two different approaches were used to quantify the area of different ecosystem types that received Commonwealth environmental water:
1. Area inundated by Commonwealth environmental water = the sum of only the inundated areas of each wetland type, excluding the areas of wetlands that were not inundated.
2. Area influenced by Commonwealth environmental water = the sum of the all wetland areas that received water even if the inundation mapping showed that only a portion of the wetland was inundated.
The area inundated by Commonwealth environmental water is a ‘literal’ definition that represents the minimum contribution of Commonwealth environmental water in the landscape. The area influenced by Commonwealth environmental water acknowledges that aquatic ecosystems are complex interconnected systems and delivering water to part of a wetland contributes benefits to the entire wetland system. For example, filling a wetland depression may raise local water tables and benefit fringing vegetation, or provide feeding habitat for waterbirds that roost elsewhere in the wetland vegetation that was not inundated.
2015–16 Basin-scale evaluation of Commonwealth environmental water – Ecosystem Diversity 7
For wetlands, the total area influenced by Commonwealth environmental water is the appropriate measure of the contribution of Commonwealth environmental water to ecosystem diversity.
For floodplains, the area inundated by Commonwealth environmental water is used to measure the contribution of Commonwealth environmental water to ecosystem diversity. This more conservative measure is used for floodplains because: 1) there is low confidence in the MDBAv2 data set used by the Basin ANAE to map floodplain ecosystems (see discussion in Brooks et al. 2014); and 2) the mapping includes some very large floodplain areas mapped as single ecosystems that span thousands of square kilometres that would unduly distort the apparent contribution of Commonwealth environmental water.
GIS methodologies for calculating these areas are provided in Section 2.2.
The spatial representation of watering extent for Commonwealth environmental water delivered in 2015–16 includes all watering actions that resulted in inundation beyond the river channel (Stewardson & Guarino 2017). River reaches that received in-channel pulses, freshes and passing flows are also identified (Figure 4), but the mapping is not of sufficient resolution to identify inundation of river banks and fringing habitats along the channels.
Observations of increased inundation in the Coorong, Lake Alexandrina, Lake Albert and the Murray Mouth from Commonwealth environmental water were not made during 2015–16 but inundation extent was modelled from the hydrograph and detailed elevation models and bathymetry.
2.2 GIS Workflows
All spatial layers are based on the 1994 Geocentric Datum of Australia (GDA94). Areas in this report are in hectares and have been calculated in the Australia Albers Equal Area Conic projection to report accurate area measurements across the Basin.
Area of wetlands inundated by Commonwealth environmental water
GIS Workflow:1. Intersect:
a. The Basin ANAE Wetlands;b. Inundation15/16; andc. LTIM Valleys
2. Calculate polygon area in hectares using equal area GDA94 Australian Albers projection.3. Sum the area of each ANAE wetland type per valley.
Area of wetlands influenced by Commonwealth environmental water (Commonwealth environmental water overlaps any portion of the wetland polygon)
GIS Workflow:1. Select by location all wetland polygons that intersect with the Inundation 15/16.2. Intersect the selected wetlands with the catchment boundaries.3. Calculate polygon area in hectares using equal area GDA94 Australian Albers projection.4. Sum the area of each ANAE wetland type per valley.
Area of floodplains inundated by Commonwealth environmental water (inundated area only within the ANAE floodplain)
GIS Workflow:1. Intersect:
a. The Basin ANAE Floodplains (MDBAv2)b. Inundation 15/16c. LTIM Valleys
2015–16 Basin-scale evaluation of Commonwealth environmental water – Ecosystem Diversity 8

2. Calculate polygon areas in hectares using equal area GDA94 Australian Albers projection.3. Calculate summary statistics to sum areas of each ANAE floodplain type per valley.
Length of waterways influenced by Commonwealth environmental water
River length measurement is highly dependent on the resolution of the mapping with higher resolution mapping capturing more twists and turns in the river that increase the measured river length along the flow path between two points. The Basin ANAE waterway mapping compiles state data that varies in resolution from 1:25 000 to 1:100 000.
GIS Workflow:1. Intersect:
a. The Basin ANAE Waterwaysb. Inundation 15/16 (waterways)c. LTIM Valleys
2. Calculate the river length inundated for each ecosystem type in kilometres using equal area GDA94 Australian Albers projection.
3. Calculate summary statistics to sum the length of each river ecosystem type per valley.
2015–16 Basin-scale evaluation of Commonwealth environmental water – Ecosystem Diversity 9

3 Ecosystem Diversity Basin-scale evaluation
3.1 Highlights
In the 2015–16 water year:
More than 200,000 ha of wetlands and floodplains and 20,000km of river were inundated by Commonwealth environmental water.
Wetland and floodplains in four LTIM Selected Areas received Commonwealth environmental water with substantial areas also inundated in the Macquarie and Central Murray valleys
A high diversity of ecosystem types received Commonwealth environmental water with 64% of the different wetland ecosystem types present in the Basin and 89% of floodplain ecosystem types being represented in the areas inundated by Commonwealth environmental water. For 10 ecosystem types, substantial areas (> 25% of their individual footprints in the basin) were inundated; these include, permanent and temporary lakes, permanent saline lakes, permanent and temporary tall marshes and intermittent river red gum floodplain swamps. Much of the lake area and many of the marshes are associated with Lakes Alexandrina and Albert and their fringing wetlands.
Approximately 40% of the wetland and floodplain areas that received Commonwealth environmental water were classed as temporary or intermittent ecosystem types. These areas can be hot-spots for diversity if they support different suites of species in the dry and wet phases.
Commonwealth environmental water contributed to all of the estuarine ecosystem types in 2015–16 as flows passed through to the Murray Mouth and Coorong. This is likely also true in 2014–15 although these areas were not included in the evaluation for that year.
Comparing 2015-16 to 2014-15 there was:
Decreased inundation of intermittent river cooba swamp and permanent floodplain grass marshes in the Macquarie Marshes.
Increased inundation of intermittent river red gum floodplain swamp in Barmah Forest. Increased inundation of permanent saline wetlands, temporary swamps, permanent streams
and temporary streams associated with anabranches and connected billabongs between the South Australian border downstream to Morgan an also in the Central Murray associated with the Barmah Forest.
Decreased inundation of permanent floodplain grass marshes and permanent floodplain wetland associated with the Macquarie Marshes and Mulcra Island (Lower Murray) in 2015–16.
Decreased inundation of temporary sedge/grass/forb floodplain marsh in 2015–16, because Commonwealth environmental water from the Warrego River was not used to water the Western Floodplain in 2015–16 as was done in 2014–15.
Increase in the amount of permanent floodplain lakes and temporary tall emergent marsh temporary saline swamp and permanent salt marsh associated with marginal areas of the Lakes Alexandrina and Alberta and Coorong. This is an artefact of these areas not being included in the 2014–15 evaluation.
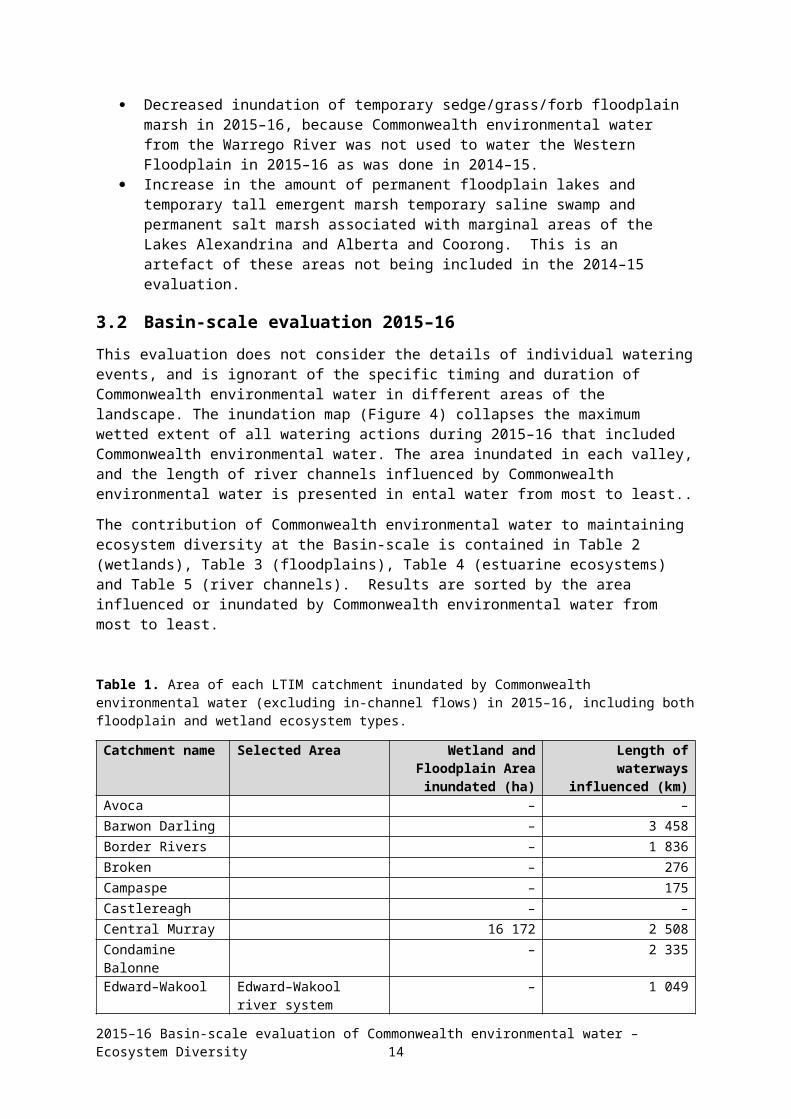
3.2 Basin-scale evaluation 2015–16
This evaluation does not consider the details of individual watering events, and is ignorant of the specific timing and duration of Commonwealth environmental water in different areas of the landscape. The inundation map (Figure 4) collapses the maximum wetted extent of all watering actions during 2015–16 that included Commonwealth environmental water. The area inundated in
2015–16 Basin-scale evaluation of Commonwealth environmental water – Ecosystem Diversity 10

each valley, and the length of river channels influenced by Commonwealth environmental water is presented in ental water from most to least..
The contribution of Commonwealth environmental water to maintaining ecosystem diversity at the Basin-scale is contained in Table 2 (wetlands), Table 3 (floodplains), Table 4 (estuarine ecosystems) and Table 5 (river channels). Results are sorted by the area influenced or inundated by Commonwealth environmental water from most to least.
Table 1. Area of each LTIM catchment inundated by Commonwealth environmental water (excluding in-channel flows) in 2015–16, including both floodplain and wetland ecosystem types.
Catchment name Selected Area Wetland and Floodplain Area inundated (ha)
Length of waterways influenced (km)
Avoca – –Barwon Darling – 3 458Border Rivers – 1 836Broken – 276Campaspe – 175Castlereagh – –Central Murray 16 172 2 508Condamine Balonne – 2 335Edward–Wakool Edward–Wakool river
system– 1 049
Goulburn Goulburn River – 537Gwydir Gwydir river system 2 322 1 127Kiewa – –Lachlan Lachlan river system 20 912 1 597Loddon – 560Lower Darling – –Lower Murray Lower Murray River* 130 791 991Macquarie 9 902 829Mitta Mitta – –Murrumbidgee Murrumbidgee river
system22 316 1 875
Namoi – –Ovens – 544Paroo – –Upper Murray – –Warrego Junction of the Warrego
and Darling rivers– 493
Wimmera – –Total area inundated (excluding channels) 202 415 20 190
* includes the Coorong, Lakes Alexandrina and Albert and the Murray Mouth.
Commonwealth environmental watering actions contributed to the inundation of a wide range of ecosystem types within the Basin that included approximately 64% of the different wetland types and 89% of the different floodplain types, and all (100%) of the river channel and estuarine ecosystem types.
A more detailed breakdown by valley is provided in Annex B (wetlands and estuarine ecosystems), Annex C (floodplains) and Annex D (river channels).
2015–16 Basin-scale evaluation of Commonwealth environmental water – Ecosystem Diversity 11

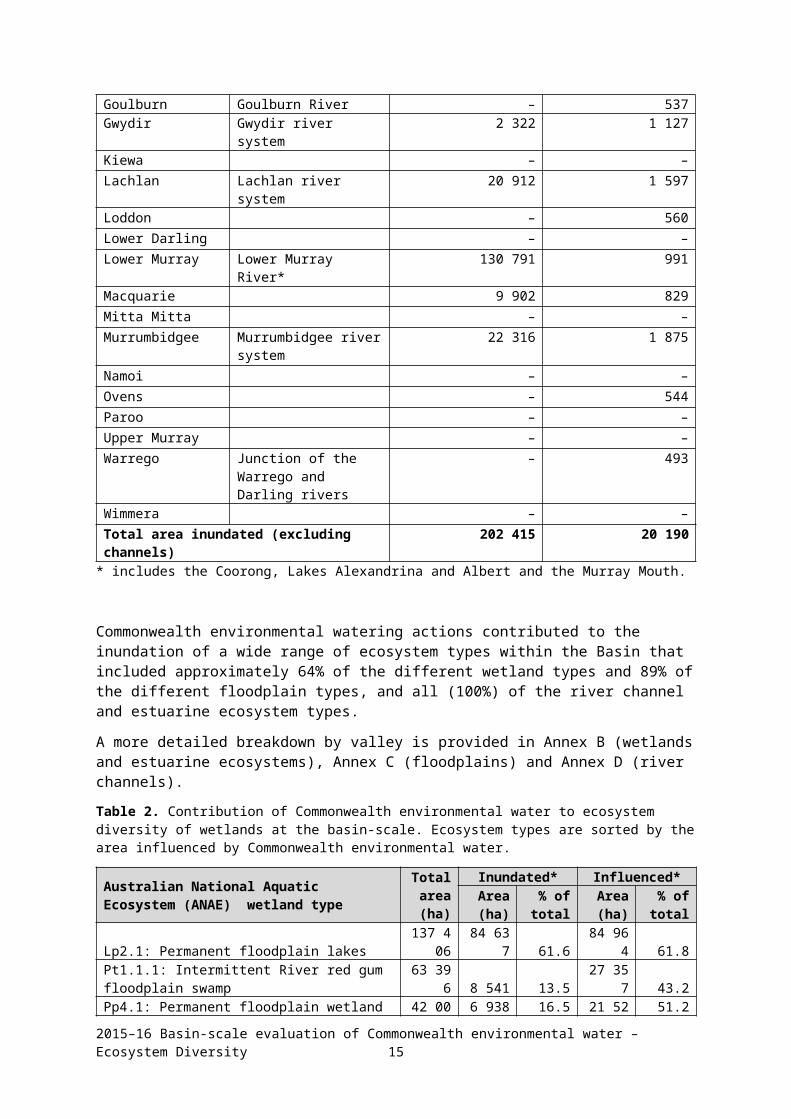
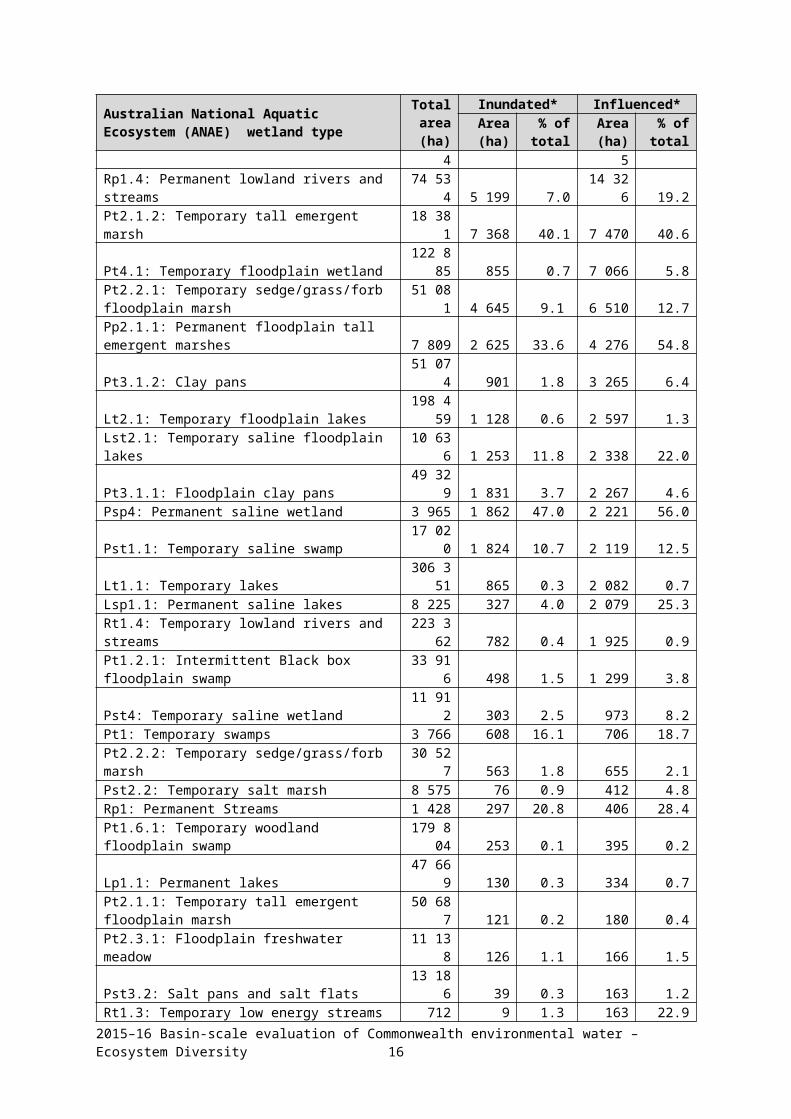
Table 2. Contribution of Commonwealth environmental water to ecosystem diversity of wetlands at the basin-scale. Ecosystem types are sorted by the area influenced by Commonwealth environmental water.
Australian National Aquatic Ecosystem (ANAE) wetland type
Totalarea (ha)
Inundated* Influenced*Area (ha)
% of total
Area (ha)
% of total
Lp2.1: Permanent floodplain lakes137 40
6 84 637 61.6 84 964 61.8Pt1.1.1: Intermittent River red gum floodplain swamp 63 396 8 541 13.5 27 357 43.2Pp4.1: Permanent floodplain wetland 42 004 6 938 16.5 21 525 51.2Rp1.4: Permanent lowland rivers and streams 74 534 5 199 7.0 14 326 19.2Pt2.1.2: Temporary tall emergent marsh 18 381 7 368 40.1 7 470 40.6
Pt4.1: Temporary floodplain wetland122 88
5 855 0.7 7 066 5.8Pt2.2.1: Temporary sedge/grass/forb floodplain marsh 51 081 4 645 9.1 6 510 12.7Pp2.1.1: Permanent floodplain tall emergent marshes 7 809 2 625 33.6 4 276 54.8Pt3.1.2: Clay pans 51 074 901 1.8 3 265 6.4
Lt2.1: Temporary floodplain lakes198 45
9 1 128 0.6 2 597 1.3Lst2.1: Temporary saline floodplain lakes 10 636 1 253 11.8 2 338 22.0Pt3.1.1: Floodplain clay pans 49 329 1 831 3.7 2 267 4.6Psp4: Permanent saline wetland 3 965 1 862 47.0 2 221 56.0Pst1.1: Temporary saline swamp 17 020 1 824 10.7 2 119 12.5
Lt1.1: Temporary lakes306 35
1 865 0.3 2 082 0.7Lsp1.1: Permanent saline lakes 8 225 327 4.0 2 079 25.3
Rt1.4: Temporary lowland rivers and streams223 36
2 782 0.4 1 925 0.9Pt1.2.1: Intermittent Black box floodplain swamp 33 916 498 1.5 1 299 3.8Pst4: Temporary saline wetland 11 912 303 2.5 973 8.2Pt1: Temporary swamps 3 766 608 16.1 706 18.7Pt2.2.2: Temporary sedge/grass/forb marsh 30 527 563 1.8 655 2.1Pst2.2: Temporary salt marsh 8 575 76 0.9 412 4.8Rp1: Permanent Streams 1 428 297 20.8 406 28.4
Pt1.6.1: Temporary woodland floodplain swamp179 80
4 253 0.1 395 0.2Lp1.1: Permanent lakes 47 669 130 0.3 334 0.7Pt2.1.1: Temporary tall emergent floodplain marsh 50 687 121 0.2 180 0.4Pt2.3.1: Floodplain freshwater meadow 11 138 126 1.1 166 1.5Pst3.2: Salt pans and salt flats 13 186 39 0.3 163 1.2Rt1.3: Temporary low energy streams 712 9 1.3 163 22.9Rt1: Temporary Streams 294 70 23.8 99 33.7
Pt4.2: Temporary wetland130 76
0 52 <0.1 92 0.1Pt1.2.2: Intermittent Black box swamp 16 470 54 0.3 88 0.5Rt1.2: Temporary transitional zone streams 5 957 10 0.2 33 0.6Pp2.1.2: Permanent tall emergent marshes 134 31 23.1 31 23.1Rp1.3: Permanent low energy streams 286 25 8.7 26 9.1Pp2.3.1: Permanent floodplain grass marshes 431 10 2.3 25 5.8Pp4.2: Permanent wetland 22 388 18 0.1 18 0.1Pt1.7.1: Intermittent Lignum floodplain swamp 27 356 4 <0.1 11 <0.1Pp2.3.2: Permanent grass marshes 183 7 3.8 7 3.8Lst1.1: Temporary saline lakes 12 759 2 <0.1 4 <0.1Pt1.3.1: Intermittent Coolibah floodplain swamp 5 173 <1 <0.1 3 0.1
2015–16 Basin-scale evaluation of Commonwealth environmental water – Ecosystem Diversity 12

Australian National Aquatic Ecosystem (ANAE) wetland type
Totalarea (ha)
Inundated* Influenced*Area (ha)
% of total
Area (ha)
% of total
Pt1.7.2: Intermittent Lignum swamps 17 967 1 <0.1 3 <0.1Psp2.1: Permanent salt marsh 3 <1 <0.1 2 66.7Rp1.2: Permanent transitional zone streams 3 652 <1 <0.1 <1 <0.1Lp1.2: Permanent lakes with aquatic beds 1 197 0 0 0 –Lp2.2: Permanent floodplain lakes with aquatic beds 1 868 0 0 0 –Lsp1.2: Permanent saline lakes with aquatic beds 18 0 0 0 –Lsp2.1: Permanent saline floodplain lakes 13 178 0 0 0 –Lst1.2: Temporary saline lakes with aquatic beds 1 905 0 0 0 –Lst2.2: Temporary saline floodplain lakes with aquatic beds 391 0 0 0
–
Lt1.2: Temporary lakes with aquatic beds 804 0 0 0 –Lt2.2: Temporary floodplain lakes with aquatic beds 2 520 0 0 0 –Pp1.1.2: Permanent paperbark swamps 1 0 0 0 –Pp2.2.1: Permanent floodplain sedge/grass/forb marshes 2 275 0 0 0
–
Pp2.2.2: Permanent sedge/grass/forb marshes 2 564 0 0 0 –Pp2.4.1: Permanent floodplain forb marshes 157 0 0 0 –Pp2.4.2: Permanent forb marshes 32 0 0 0 –Pp3: Peat bogs and fen marshes 173 0 0 0 –Pps5: Permanent springs 130 0 0 0 –Psp1.1: Saline paperbark swamp 137 0 0 0 –Psp3.1: Permanent seagrass marshes 16 328 0 0 0 –Pt1.1.2: Intermittent River red gum swamps 8 480 0 0 0 –Pt1.3.2: Intermittent Coolibah swamp 1 019 0 0 0 –Pt1.4.1: Intermittent River Cooba floodplain swamp 3 0 0 0 –Pt1.4.2: Intermittent River Cooba swamp 104 0 0 0 –Pt1.5.1: Temporary paperbark floodplain swamp 32 0 0 0 –Pt1.5.2: Temporary paperbark swamp 89 0 0 0 –Pt1.6.2: Temporary woodland swamp 44 406 0 0 0 –Pt2.3.2: Freshwater meadow 14 780 0 0 0 –Pu1: Unspecified wetland 1 768 0 0 0 –Rp1.1: Permanent high energy streams 9 662 0 0 0 –Rt1.1: Temporary high energy streams 13 853 0 0 0 –Ru1: Unspecified river (landform unknown) 3 0 0 0 –
* Area inundated/influenced by Commonwealth environmental water: see Section 2.1 for definitions.
2015–16 Basin-scale evaluation of Commonwealth environmental water – Ecosystem Diversity 13

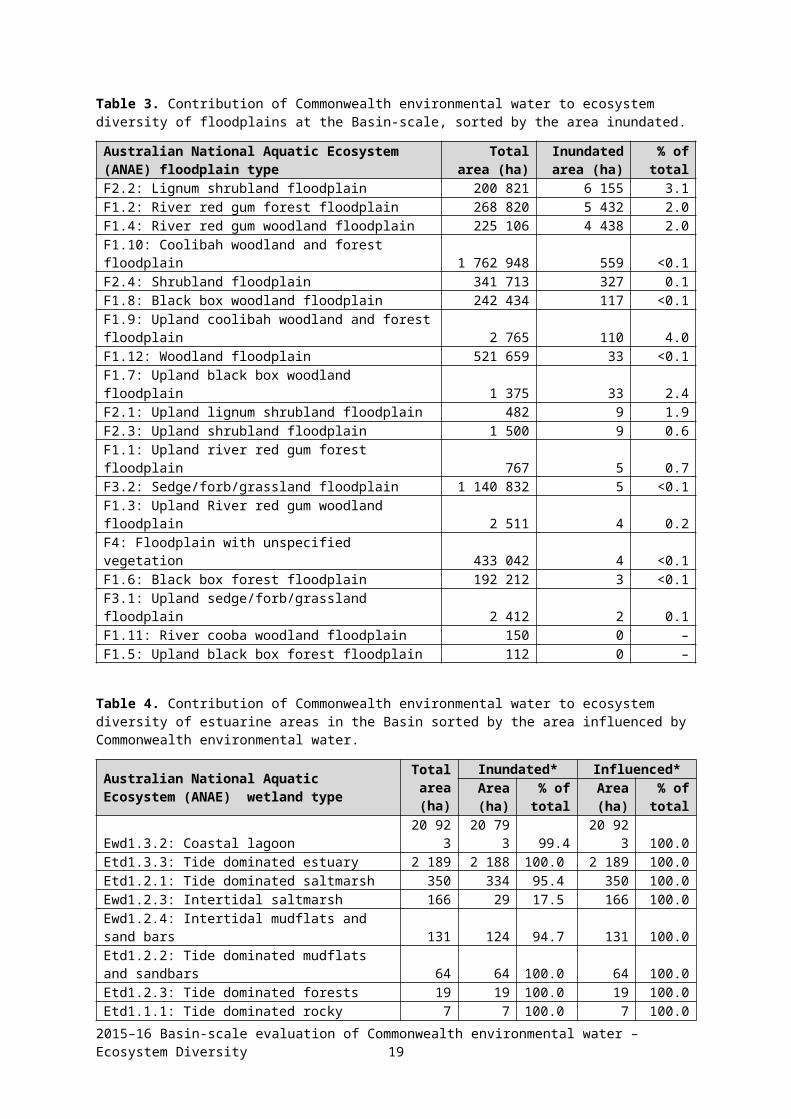
Table 3. Contribution of Commonwealth environmental water to ecosystem diversity of floodplains at the Basin-scale, sorted by the area inundated.
Australian National Aquatic Ecosystem (ANAE) floodplain type
Totalarea (ha)
Inundatedarea (ha)
% of total
F2.2: Lignum shrubland floodplain 200 821 6 155 3.1F1.2: River red gum forest floodplain 268 820 5 432 2.0F1.4: River red gum woodland floodplain 225 106 4 438 2.0F1.10: Coolibah woodland and forest floodplain 1 762 948 559 <0.1F2.4: Shrubland floodplain 341 713 327 0.1F1.8: Black box woodland floodplain 242 434 117 <0.1F1.9: Upland coolibah woodland and forest floodplain 2 765 110 4.0F1.12: Woodland floodplain 521 659 33 <0.1F1.7: Upland black box woodland floodplain 1 375 33 2.4F2.1: Upland lignum shrubland floodplain 482 9 1.9F2.3: Upland shrubland floodplain 1 500 9 0.6F1.1: Upland river red gum forest floodplain 767 5 0.7F3.2: Sedge/forb/grassland floodplain 1 140 832 5 <0.1F1.3: Upland River red gum woodland floodplain 2 511 4 0.2F4: Floodplain with unspecified vegetation 433 042 4 <0.1F1.6: Black box forest floodplain 192 212 3 <0.1F3.1: Upland sedge/forb/grassland floodplain 2 412 2 0.1F1.11: River cooba woodland floodplain 150 0 –F1.5: Upland black box forest floodplain 112 0 –
Table 4. Contribution of Commonwealth environmental water to ecosystem diversity of estuarine areas in the Basin sorted by the area influenced by Commonwealth environmental water.
Australian National Aquatic Ecosystem (ANAE) wetland type
Totalarea (ha)
Inundated* Influenced*Area (ha)
% of total
Area (ha)
% of total
Ewd1.3.2: Coastal lagoon 20 923 20 793 99.4 20 923 100.0Etd1.3.3: Tide dominated estuary 2 189 2 188 100.0 2 189 100.0Etd1.2.1: Tide dominated saltmarsh 350 334 95.4 350 100.0Ewd1.2.3: Intertidal saltmarsh 166 29 17.5 166 100.0Ewd1.2.4: Intertidal mudflats and sand bars 131 124 94.7 131 100.0Etd1.2.2: Tide dominated mudflats and sandbars 64 64 100.0 64 100.0Etd1.2.3: Tide dominated forests 19 19 100.0 19 100.0Etd1.1.1: Tide dominated rocky shoreline 7 7 100.0 7 100.0
Table 5. Contribution of Commonwealth environmental water to ecosystem diversity within river channels of the Basin sorted by the area influenced by Commonwealth environmental water.
Australian National Aquatic Ecosystem (ANAE) waterway type
Length (km)
Rp1.4: Permanent lowland rivers and streams 14 069Rt1.4: Temporary lowland rivers and streams 4 082Rp1.1: Permanent high energy streams 928Rp1.2: Permanent transitional zone streams 654Rp1.3: Permanent low energy streams 212Rt1.1: Temporary high energy streams 160Rt1.3: Temporary low energy streams 43Rt1.2: Temporary transitional zone streams 42
2015–16 Basin-scale evaluation of Commonwealth environmental water – Ecosystem Diversity 14
3.3 Cumulative Basin-scale evaluation (2014–16)
Commonwealth environmental water contributed to inundation of the Gwydir wetlands, Macquarie Marshes and Lower Murrumbidgee (Lowbidgee) in both 2014–15 and 2015–16 water years. In 2014–15 these three valleys alone comprised 90% of the area inundated, although the real figure would be lower if hydrology to assess inundation of the Coorong and Lower Lakes had been available in 2014–15. In 2015–16 substantial areas along the Murray River between Morgan and the S.A Border, Barmah Forest and the Lachlan River also received Commonwealth environmental water and the Coorong, Lakes Alexandrine and Albert and the Murray Mouth were added.
The comparison presented in Table 6 should be viewed as indicative only as there are some differences in the way inundation extents were mapped in each year to date. The 2014–15 inundation likely over-estimates the extent of Commonwealth environmental water in the Macquarie Marshes, Gwydir wetlands and Lowbidgee due to poor discrimination of Commonwealth environmental water from other water in satellite imagery. Improvements to the data assembly process increased the accuracy and confidence in the inundation mapping in 2015–16 and the comparison can be revisited if those improvements can be applied retrospectively to the 2014–15 data. Estuarine areas were excluded as they were not included in the 2014–15 evaluation.
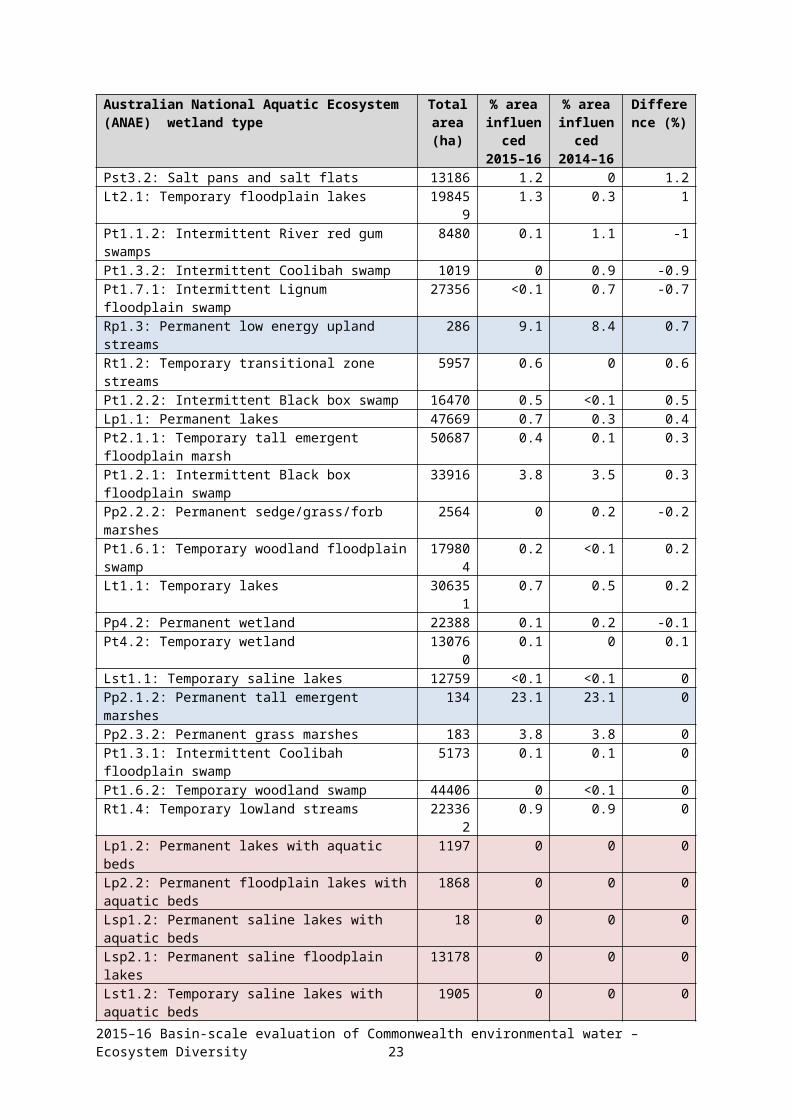
The evaluation compares the area of each ecosystem type influenced by Commonwealth environmental water (i.e. the whole wetland area if part of the wetland was inundated). Commonwealth environmental water has influenced more than 5% of the area of 21 wetland ecosystem types (=28.8% of the wetland ecosystem types present in the basin) in at least one year of the last two with a further 28 wetland ecosystem types (38.3%) having only small areas inundated that influenced between 0 and 1% of their basin area in at least one year. Twenty four wetland types (=32.9% of the wetland ecosystem types present in the basin) have not had Commonwealth environmental water delivered to them within the two years of LTIM. Some of these areas may be included in areas targeted for watering by or other state-based delivery partners but it is currently beyond the scope of this evaluation to evaluate Commonwealth environmental water in the context of all other environmental water.
Comparing 2015–16 to 2014–15 there was:
Decreased inundation of intermittent river cooba swamp and permanent floodplain grass marshes in the Macquarie Marshes.
Increased inundation of intermittent river red gum floodplain swamp in Barmah Forest. Increased inundation of permanent saline wetlands, temporary swamps, permanent streams
and temporary streams associated with anabranches and connected billabongs between the South Australian border downstream to Morgan an also in the Central Murray associated with the Barmah Forest.
Decreased inundation of permanent floodplain grass marshes and permanent floodplain wetland associated with the Macquarie Marshes and Mulcra Island (Lower Murray) in 2015–16.
Decreased inundation of temporary sedge/grass/forb floodplain marsh in 2015–16, because Commonwealth environmental water from the Warrego River was not used to water the Western Floodplain in 2015–16 as was done in 2014–15.
Increase in the amount of permanent floodplain lakes and temporary tall emergent marsh temporary saline swamp and permanent salt marsh associated with marginal areas of the Lakes Alexandrina and Alberta and Coorong. This is an artefact of these areas not being included in the 2014–15 evaluation.
2015–16 Basin-scale evaluation of Commonwealth environmental water – Ecosystem Diversity 15
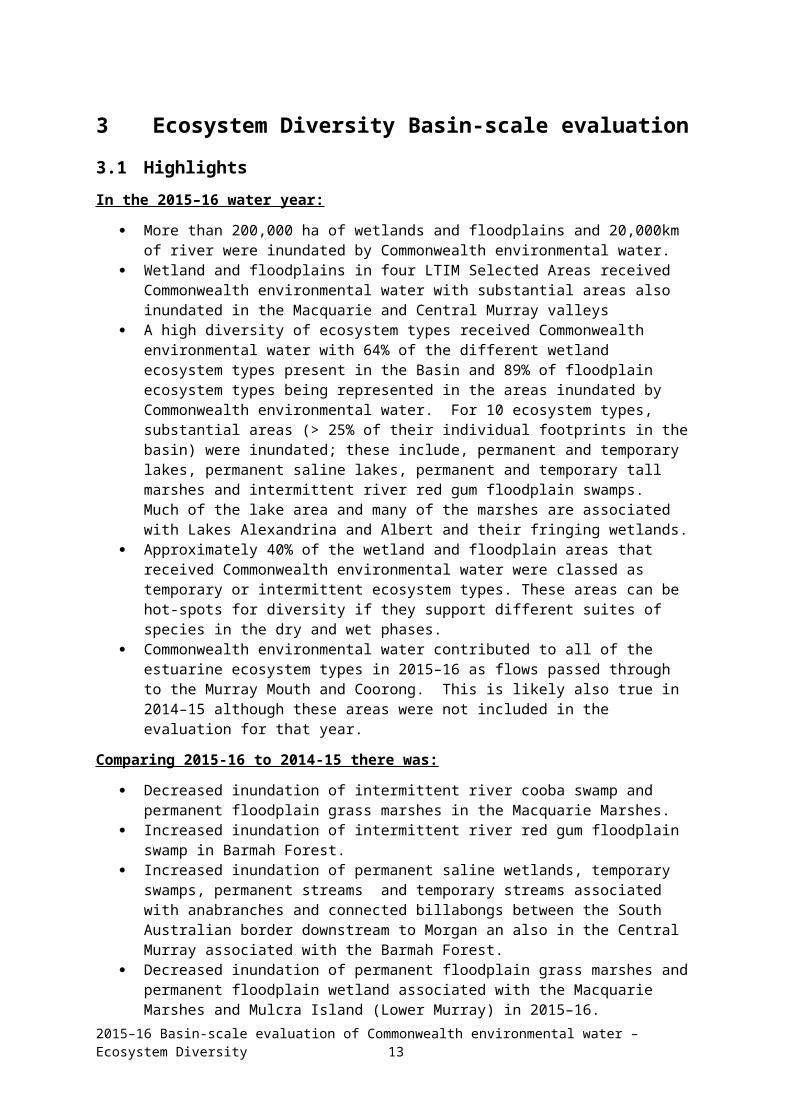
Table 6. Comparison of the contribution of Commonwealth environmental water to ecosystem diversity of wetlands in the first two years of the LTIM project sorted by the magnitude of the difference between the two years. Ecosystem types with more than 5% of their total Basin area inundated in at least one year are shaded blue. Ecosystem types that have not received Commonwealth environmental water in the two years of LTIM to date are shaded red.
Australian National Aquatic Ecosystem (ANAE) wetland type
Totalarea (ha)
% area influenced 2015–16
% area influenced 2014–16
Difference (%)
Pt1.4.2: Intermittent River Cooba swamp 104 0 97.1 -97.1Psp2.1: Permanent salt marsh 3 66.7 0 66.7Lp2.1: Permanent floodplain lakes 137406 61.8 0.5 61.3Psp4: Permanent saline wetland 3965 56 4 52Pp2.3.1: Permanent floodplain grass marshes 431 5.8 50.3 -44.5Pt2.1.2: Temporary tall emergent marsh 18381 40.6 0 40.6Rt1: Temporary Streams 294 33.7 1.7 32Rp1: Permanent Streams 1428 28.4 0 28.4Pt1.1.1: Intermittent River red gum floodplain swamp 63396 43.2 15.8 27.4Lsp1.1: Permanent saline lakes 8225 25.3 0 25.3Pt2.2.1: Temporary sedge/grass/forb floodplain marsh 51081 12.7 35.6 -22.9Rt1.3: Temporary low energy upland streams 712 22.9 0 22.9Rp1.4: Permanent lowland streams 74534 19.2 5.2 14Pt1: Temporary swamps 3766 18.7 7.4 11.3Pst1.1: Temporary saline swamp 17020 12.5 3.2 9.3Pp2.1.1: Permanent floodplain tall emergent marshes 7809 54.8 45.6 9.2Lst2.1: Temporary saline floodplain lakes 10636 22 13 9Pst4: Temporary saline wetland 11912 8.2 0.9 7.3Pp4.1: Permanent floodplain wetland 42004 51.2 44.4 6.8Pst2.2: Temporary salt marsh 8575 4.8 0 4.8Pt4.1: Temporary floodplain wetland 122885 5.8 1.3 4.5Pt3.1.2: Clay pans 51074 6.4 4.1 2.3Pp2.4.1: Permanent floodplain forb marshes 157 1.9 0 1.9Pt1.7.2: Intermittent Lignum swamps 17967 <0.1 1.8 -1.8Pt2.2.2: Temporary sedge/grass/forb marsh 30527 2.1 0.3 1.8Pt2.3.1: Floodplain freshwater meadow 11138 1.5 2.9 -1.4Pt3.1.1: Floodplain clay pans 49329 4.6 3.2 1.4Pst3.2: Salt pans and salt flats 13186 1.2 0 1.2Lt2.1: Temporary floodplain lakes 198459 1.3 0.3 1Pt1.1.2: Intermittent River red gum swamps 8480 0.1 1.1 -1Pt1.3.2: Intermittent Coolibah swamp 1019 0 0.9 -0.9Pt1.7.1: Intermittent Lignum floodplain swamp 27356 <0.1 0.7 -0.7Rp1.3: Permanent low energy upland streams 286 9.1 8.4 0.7Rt1.2: Temporary transitional zone streams 5957 0.6 0 0.6Pt1.2.2: Intermittent Black box swamp 16470 0.5 <0.1 0.5Lp1.1: Permanent lakes 47669 0.7 0.3 0.4Pt2.1.1: Temporary tall emergent floodplain marsh 50687 0.4 0.1 0.3Pt1.2.1: Intermittent Black box floodplain swamp 33916 3.8 3.5 0.3Pp2.2.2: Permanent sedge/grass/forb marshes 2564 0 0.2 -0.2Pt1.6.1: Temporary woodland floodplain swamp 179804 0.2 <0.1 0.2Lt1.1: Temporary lakes 306351 0.7 0.5 0.2Pp4.2: Permanent wetland 22388 0.1 0.2 -0.1Pt4.2: Temporary wetland 130760 0.1 0 0.1Lst1.1: Temporary saline lakes 12759 <0.1 <0.1 0Pp2.1.2: Permanent tall emergent marshes 134 23.1 23.1 0Pp2.3.2: Permanent grass marshes 183 3.8 3.8 0
2015–16 Basin-scale evaluation of Commonwealth environmental water – Ecosystem Diversity 16
Australian National Aquatic Ecosystem (ANAE) wetland type
Totalarea (ha)
% area influenced 2015–16
% area influenced 2014–16
Difference (%)
Pt1.3.1: Intermittent Coolibah floodplain swamp 5173 0.1 0.1 0Pt1.6.2: Temporary woodland swamp 44406 0 <0.1 0Rt1.4: Temporary lowland streams 223362 0.9 0.9 0Lp1.2: Permanent lakes with aquatic beds 1197 0 0 0Lp2.2: Permanent floodplain lakes with aquatic beds 1868 0 0 0Lsp1.2: Permanent saline lakes with aquatic beds 18 0 0 0Lsp2.1: Permanent saline floodplain lakes 13178 0 0 0Lst1.2: Temporary saline lakes with aquatic beds 1905 0 0 0Lst2.2: Temporary saline floodplain lakes with aquatic beds
391 0 0 0
Lt1.2: Temporary lakes with aquatic beds 804 0 0 0Lt2.2: Temporary floodplain lakes with aquatic beds 2520 0 0 0Pp1.1.2: Permanent paperbark swamps 1 0 0 0Pp2.2.1: Permanent floodplain sedge/grass/forb marshes
2275 0 0 0
Pp2.4.2: Permanent forb marshes 32 0 0 0Pp3: Peat bogs and fen marshes 173 0 0 0Pps5: Permanent springs 130 0 0 0Psp1.1: Saline paperbark swamp 137 0 0 0Psp3.1: Permanent seagrass marshes 16328 0 0 0Pt1.4.1: Intermittent River Cooba floodplain swamp 3 0 0 0Pt1.5.1: Temporary paperbark floodplain swamp 32 0 0 0Pt1.5.2: Temporary paperbark swamp 89 0 0 0Pt2.3.2: Freshwater meadow 14780 0 0 0Pu1: Unspecified wetland 1768 0 0 0Rp1.1: Permanent high energy upland streams 9662 0 0 0Rp1.2: Permanent transitional zone streams 3652 0 0 0Rt1.1: Temporary high energy upland streams 13853 0 0 0Ru1: Unspecified river (landform unknown) 3 0 0 0
2015–16 Basin-scale evaluation of Commonwealth environmental water – Ecosystem Diversity 17
3.4 Adaptive management
There are a number of avenues by which the Ecosystem Diversity evaluation can foster improvements in Commonwealth environmental water management and evaluation. Namely:
1) Improving confidence in the evaluation of the contribution of Commonwealth environmental water to Ecosystem Diversity within LTIM. This second year evaluation is already benefiting from greatly improved knowledge and mapping of the spatial extent of Commonwealth environmental water in the Basin. The anticipated improvements to the Basin ANAE mapping and classification will further improve the accuracy and comparability for determining the ecosystem types, particularly in areas of NSW that are a focus for Commonwealth environmental water delivery (e.g. the Lowbidgee, Macquarie Marshes, Gwydir wetlands and Central Murray Forests).
2) Improving understanding of the landscape context at monitoring sites to inform extrapolation of observed outcomes to unmonitored sites. Understanding how biotic and functional responses vary among ecosystem types that are monitored within Selected Areas will permit extrapolation of Selected Area and Basin matter outcomes to watering events in the same ecosystem types located in other areas of the Basin.
3) Developing watering objectives and expected outcomes for different ecosystem types. Understanding how key ecosystem types influence Basin biodiversity, resilience, ecosystem function and ecosystem services paves the way towards delivering Commonwealth environmental water for ecosystem objectives that move beyond counting ecosystem watering targets. For example, shaping flow regimes to preserve patterns of spatio-temporal variability along a river, or delivering water at critical times to maintain life forms or processes because they characterise ecosystem types that are to be preserved or improved. Managing to prevent or promote ecosystem turnover to new types may require long-term management frameworks with institutional memory and conviction to stay the course over decadal time scales. The Commonwealth currently does not have 1-year or 5-year expected outcomes for ecosystem diversity but it is hoped that within the LTIM project we can develop thinking towards an appropriate approach to develop draft ecosystem objectives. Current planning that links ecosystem types to water availability scenarios, e.g. directing water to maintain permanent water systems in dry years, and augmenting over-bank flows to the floodplain in wet years may be a good starting point that is already implicitly considering ecosystem diversity, albeit often without explicit ecosystem objectives.
4) Reducing the risks of implementing inappropriate watering regimes. Too much water, too frequently or consistently missing particular ecosystems types are all scenarios that are potentially deleterious to Basin biodiversity. Improving understanding of watering requirements at the ecosystem level should complement and enhance existing understanding that often focuses on the requirement s of focal species or communities. Through LTIM, we are assembling a library of basin wide watering frequencies from Commonwealth environmental water. Ecosystems types (and locations) that are consistently not watered, or watered with too much regularity, can then be identified and an informed assessment of risks can then take place to determine if there is a need and capability to adjust management planning to ensure Basin Plan objectives are met.
2015–16 Basin-scale evaluation of Commonwealth environmental water – Ecosystem Diversity 18
4 Contribution to achievement of Basin Plan objectivesThe Ecosystem Diversity component of the Basin evaluation contributes to the Basin Plan objective for Biodiversity under Section 8.05 of the Basin Plan and contributes indirectly to additional Basin Plan objectives by informing the evaluation of the Vegetation and Generic Diversity matters within the LTIM project (Capon and Campbell 2016, 2017, Hale 2016, 2017).
As for the previous year, the Commonwealth does not yet have 1-year or 5-year expected outcomes for ecosystem diversity (Table 7) and water is not currently delivered with direct understanding of the contribution of Commonwealth environmental watering to ecosystem diversity at the Basin-scale. However, this evaluation provides a foundation from which expected outcomes for ecosystem diversity may be developed in the future. Improvements to the Basin ANAE mapping and classification that are currently under way will alter the view of the contribution of Commonwealth environmental water to ecosystem diversity in the coming year. Once complete, the new classification will be retrospectively applied to LTIM project inundation data to provide for consistent multi-year comparison to facilitate the development of appropriate, achievable 1–5-year expected outcomes for ecosystem diversity.
Table 7. Commonwealth Environmental Outcomes framework for ecosystem diversity.
Basin Plan objectives Basin outcomes 5–year expected outcomes 1–year expected outcomes
Biodiversity
(Basin Plan S. 8.05)Ecosystem diversity None identified None identified
2015–16 Basin-scale evaluation of Commonwealth environmental water – Ecosystem Diversity 19

ReferencesAETG (Aquatic Ecosystems Task Group (2012) Aquatic ecosystems toolkit, module 2: Interim
Australian National Aquatic Ecosystems (ANAE) Classification Framework, Version 1.0. Department of Sustainability, Environment, Water, Population and Communities, Canberra.
Brooks S, Cottingham P, Butcher R, Hale J (2014) Murray–Darling Basin aquatic ecosystem classification: Stage 2 report. Peter Cottingham & Associates report to the Commonwealth Environmental Water Office and Murray–Darling Basin Authority, Canberra.
Brooks S (2016a) 2014-15 Basin-scale evaluation of Commonwealth environmental water – Ecosystem Diversity Report. Final Report prepared for the Commonwealth Environmental Water Office by The Murray–Darling Freshwater Research Centre, MDFRC Publication 106/2016, May, 50pp.
Brooks S (2016b) Assessing the need to update the Interim Australian National Aquatic Ecosystems (ANAE) Classification in the Murray-Darling Basin. Report to the Murray-Darling Basin Authority, Canberra.
Capon S, Campbell C (2016) 2014–15 Basin-scale evaluation of Commonwealth environmental water - Vegetation Diversity. Final Report prepared for the Commonwealth Environmental Water Office by The Murray–Darling Freshwater Research Centre, MDFRC Publication 107/2016, September, 85pp.
Capon S, Campbell C (2017) 2015–16 Basin-scale evaluation of Commonwealth environmental water - Vegetation Diversity. Final Report prepared for the Commonwealth Environmental Water Office by The Murray–Darling Freshwater Research Centre, MDFRC Publication 145/2017, August, 87pp.
CEWH (Commonwealth Environmental Water Holder) (2013) Commonwealth Environmental Water – The Environmental Water Outcomes Framework v1.1. Commonwealth Environmental Water Holder for the Australian Government, Canberra.
Gawne B, Roots J, Hale J, Stewardson M (2014) Commonwealth Environmental Water Office Long Term Intervention Monitoring Project: Basin Evaluation Plan. Report prepared for the Commonwealth Environmental Water Office by The Murray–Darling Freshwater Research Centre. MDFRC Publication 42/2014. MDFRC, Wodonga.
Geist J (2011) Integrative freshwater ecology and biodiversity conservation. Ecological Indicators 11(6), 1507–1516.
Hale J (2016) 2014-15 Basin-scale evaluation of Commonwealth environmental water – Generic Diversity. Final Report prepared for the Commonwealth Environmental Water Office by The Murray–Darling Freshwater Research Centre, MDFRC Publication 109/2016, October, 48pp.
Hale J (2017) 2015-16 Basin-scale evaluation of Commonwealth environmental water – Generic Diversity. Final Report prepared for the Commonwealth Environmental Water Office by The Murray–Darling Freshwater Research Centre, MDFRC Publication 147/2017, August, 58pp.
Junk J, Bayley P, and Sparks R (1989) The flood pulse concept in river floodplain systems. Can. Spec. Publ. Fish. Aquat. Sci. 106: 110–127.
MDFRC (2013) Long Term Intervention Monitoring – Generic Cause and Effect Diagrams Final Report prepared for the Commonwealth Environmental Water Office by The Murray-Darling Freshwater Research Centre, MDFRC Publication 01.5/2013, May, 163pp.
Miles, M., and Eckert, G. 2013. Murray Darling Basin ANAE dataset – Manual edits to SA component. ‐Government of South Australia, through Department of Environment, Water and Natural Resources, Adelaide.
Poff NL (1997) Landscape filters and species traits: towards mechanistic understanding and prediction in stream ecology. J. North Am. Benthol. Soc. 16(2): 391–409.
Stewardson MJ, Guarino F (2017) 2015–16 Basin-scale evaluation of Commonwealth environmental water — Hydrology. Final Report prepared for the Commonwealth Environmental Water
2015–16 Basin-scale evaluation of Commonwealth environmental water – Ecosystem Diversity 20

Office by The Murray–Darling Freshwater Research Centre, MDFRC Publication 142/2017, Month, #pp.
Thorp JH, Thoms MC, and Delong MD (2006) The riverine ecosystem synthesis: biocomplexity in river networks across space and time. River Res. Appl. 22(2): 123–147.
2015–16 Basin-scale evaluation of Commonwealth environmental water – Ecosystem Diversity 21
Annex A. Updating the Basin ANAE classificationConfidence in the accuracy of mapping and the Basin ANAE classification was examined in the previous LTIM ecosystem diversity evaluation (Brooks 2016a) and in the development of the classification (Brooks et al. 2014). Confidence in the mapping and classification varies throughout the Basin with the highest confidence in Queensland and Victoria, and the lowest confidence in New South Wales (NSW) (Brooks et al. 2014) (Figure A1). In South Australia ANAE ecosystem types were manually ascribed to wetlands and riverine reaches along full length of the Murray River to improve confidence and alignment of the classification to ecosystem types used by SA wetland managers above that produced by the ANAE classification methodology. Some additional limitations of the ANAE classification in South Australia that influence the findings in this report are noted in Miles and Eckert (2013) and include farms dams classified as natural wetland ecosystems, temporary wetlands to the south east of the south lagoon of the Coorong being classified as permanent, and wetland boundaries adjacent to the Lake Alexandrina that encompass multiple ecosystem types. These errors are mainly associated with wetland types around Lake Alexandrina and the Coorong (Miles pers. comm. 2017) but similar examples can be found in all states in areas where fundamental hydrological data and vegetation mapping are limited.
There was generally good agreement between the ecosystem types identified by the Basin ANAE classification when ground-truthed at sampling sites by LTIM Selected Area teams (Brooks 2016a). Most discrepancies were related to inaccuracies in the mapping of wetland boundaries rather than fundamental disagreement with the ANAE classification itself. The poorest representation of ecosystem types by the ANAE classification was in the Lachlan river system, Gwydir river system and Junction of the Warrego and Darling rivers Selected Areas (Brooks 2016a).
A significant update of the Basin ANAE classification is currently underway and scheduled to be completed mid-2017. The update is incorporating new data sets to increase confidence in the ANAE classification throughout the Basin with significant advances to the wetland and vegetation mapping in NSW in particular that will improve cross-jurisdictional consistency at the Basin-scale (Brooks 2016b). There will be significant changes to the number and extent of wetlands in areas of NSW that have been a recent focus for Commonwealth environmental water delivery in 2014-15 and again in 2015-16, namely: the Central Murray forests, the Macquarie Marshes, Lachlan River and to a lesser extent the Lowbidgee. This evaluation of the 2015-16 contribution of Commonwealth environmental water to ecosystem diversity in the Basin and that of last year (2014-15) are therefore interim assessments that will be updated in 2018 using the revised ANAE classification.
2015–16 Basin-scale evaluation of Commonwealth environmental water – Ecosystem Diversity 22
Figure A1. The Basin ANAE classification confidence in the System Type attribute for wetland feature mapping (Brooks et al. 2014).
2015–16 Basin-scale evaluation of Commonwealth environmental water – Ecosystem Diversity 23

Annex B. ANAE wetland types influenced by Commonwealth environmental water by valleyWetland types influenced by Commonwealth environmental water are represented by the entire wetland when any portion of the wetland was recorded as having been inundated. The contribution of Commonwealth environmental water to supporting wetland ecosystem diversity within each valley is presented below in Table B1.
Table B1. Area of each wetland ecosystem type and the contribution of Commonwealth environmental water to supporting wetland ecosystem diversity within each valley, sorted by the area influenced with inundation highlighted in blue (includes riverine areas that are within the inundated areas but excludes in-channel flows presented in Annex D).
Valley name Australian National Aquatic Ecosystem (ANAE) wetland type
Totalarea (ha)
Influenced by Commonwealth
environmental waterArea (ha) % of total
Avoca Psp3.1: Permanent seagrass marshes 15 547 0 –Avoca Pst3.2: Salt pans and salt flats 7 060 0 –Avoca Pt3.1.1: Floodplain clay pans 6 956 0 –Avoca Pst1.1: Temporary saline swamp 6 106 0 –Avoca Lst1.1: Temporary saline lakes 4 595 0 –Avoca Lt1.1: Temporary lakes 4 501 0 –Avoca Pp2.2.2: Permanent sedge/grass/forb marshes 1 704 0 –Avoca Lst1.2: Temporary saline lakes with aquatic beds 1 646 0 –Avoca Pt3.1.2: Clay pans 1 047 0 –Avoca Pt1.6.1: Temporary woodland floodplain swamp 793 0 –Avoca Lst2.1: Temporary saline floodplain lakes 568 0 –Avoca Lt2.1: Temporary floodplain lakes 341 0 –Avoca Pst2.2: Temporary salt marsh 330 0 –Avoca Pst4: Temporary saline wetland 245 0 –Avoca Psp4: Permanent saline wetland 225 0 –Avoca Pt4.2: Temporary wetland 223 0 –Avoca Pt1.6.2: Temporary woodland swamp 153 0 –Avoca Pt1.1.2: Intermittent River red gum swamps 93 0 –Avoca Lp1.1: Permanent lakes 82 0 –Avoca Pt2.3.1: Floodplain freshwater meadow 68 0 –Avoca Pt1.1.1: Intermittent River red gum floodplain swamp 52 0 –Avoca Pt4.1: Temporary floodplain wetland 50 0 –Avoca Lp2.1: Permanent floodplain lakes 11 0 –Avoca Pt2.3.2: Freshwater meadow 9 0 –Avoca Pp4.2: Permanent wetland 7 0 –Barwon Darling Lt1.1: Temporary lakes 31 568 0 –Barwon Darling Lt2.1: Temporary floodplain lakes 28 294 0 –Barwon Darling Lp2.1: Permanent floodplain lakes 26 734 0 –Barwon Darling Pt1.6.2: Temporary woodland swamp 12 894 0 –Barwon Darling Pt4.2: Temporary wetland 9 644 0 –Barwon Darling Rp1.4: Permanent lowland rivers and streams 6 554 0 –Barwon Darling Pt1.6.1: Temporary woodland floodplain swamp 3 383 0 –Barwon Darling Pt1.2.1: Intermittent Black box floodplain swamp 2 249 0 –Barwon Darling Pt4.1: Temporary floodplain wetland 1 973 0 –Barwon Darling Lp1.1: Permanent lakes 1 795 0 –Barwon Darling Rt1.4: Temporary lowland rivers and streams 1 607 0 –Barwon Darling Pp4.1: Permanent floodplain wetland 992 0 –Barwon Darling Pt2.2.1: Temporary sedge/grass/forb floodplain marsh 747 0 –Barwon Darling Pt1.2.2: Intermittent Black box swamp 714 0 –Barwon Darling Pp4.2: Permanent wetland 669 0 –Barwon Darling Pt2.2.2: Temporary sedge/grass/forb marsh 450 0 –
2015–16 Basin-scale evaluation of Commonwealth environmental water – Ecosystem Diversity 24

Valley name Australian National Aquatic Ecosystem (ANAE) wetland type
Totalarea (ha)
Influenced by Commonwealth
environmental waterArea (ha) % of total
Barwon Darling Pt1.1.1: Intermittent River red gum floodplain swamp 429 0 –Barwon Darling Pt3.1.1: Floodplain clay pans 132 0 –
Barwon Darling Pp2.2.1: Permanent floodplain sedge/grass/forb marshes 71 0 –
Barwon Darling Pt1.3.1: Intermittent Coolibah floodplain swamp 60 0 –Barwon Darling Pt3.1.2: Clay pans 48 0 –Barwon Darling Pt1.1.2: Intermittent River red gum swamps 11 0 –Barwon Darling Rt1.1: Temporary high energy streams 7 0 –Barwon Darling Rp1.2: Permanent transitional zone streams 5 0 –Barwon Darling Pt1.3.2: Intermittent Coolibah swamp 3 0 –Barwon Darling Pps5: Permanent springs <1 0 –Barwon Darling Ru1: Unspecified river (landform unknown) <1 0 –Border Rivers Rt1.4: Temporary lowland rivers and streams 26 917 0 –Border Rivers Rt1.1: Temporary high energy streams 7 949 0 –Border Rivers Rp1.4: Permanent lowland rivers and streams 6 356 0 –Border Rivers Pt4.1: Temporary floodplain wetland 3 178 0 –Border Rivers Rt1.2: Temporary transitional zone streams 2 335 0 –Border Rivers Pt1.6.2: Temporary woodland swamp 1 072 0 –Border Rivers Pt1.6.1: Temporary woodland floodplain swamp 1 026 0 –Border Rivers Rp1.1: Permanent high energy streams 1 000 0 –Border Rivers Lp1.1: Permanent lakes 773 0 –Border Rivers Lp2.1: Permanent floodplain lakes 626 0 –Border Rivers Pt1.1.1: Intermittent River red gum floodplain swamp 607 0 –Border Rivers Rp1.2: Permanent transitional zone streams 575 0 –Border Rivers Pp4.1: Permanent floodplain wetland 551 0 –Border Rivers Lt2.1: Temporary floodplain lakes 518 0 –Border Rivers Pt2.3.1: Floodplain freshwater meadow 361 0 –Border Rivers Pt2.3.2: Freshwater meadow 326 0 –Border Rivers Pt1.3.1: Intermittent Coolibah floodplain swamp 323 0 –Border Rivers Pt4.2: Temporary wetland 317 0 –Border Rivers Lt1.1: Temporary lakes 303 0 –Border Rivers Lp2.2: Permanent floodplain lakes with aquatic beds 255 0 –Border Rivers Pp4.2: Permanent wetland 116 0 –Border Rivers Pt2.1.2: Temporary tall emergent marsh 96 0 –Border Rivers Pt3.1.1: Floodplain clay pans 93 0 –Border Rivers Rt1.3: Temporary low energy streams 78 0 –Border Rivers Pt3.1.2: Clay pans 76 0 –Border Rivers Lt2.2: Temporary floodplain lakes with aquatic beds 45 0 –Border Rivers Pp2.3.1: Permanent floodplain grass marshes 26 0 –Border Rivers Pt1.2.2: Intermittent Black box swamp 9 0 –Border Rivers Rp1.3: Permanent low energy streams 9 0 –Border Rivers Pt1.1.2: Intermittent River red gum swamps 9 0 –Border Rivers Pp2.2.2: Permanent sedge/grass/forb marshes 5 0 –Border Rivers Pt1.2.1: Intermittent Black box floodplain swamp 4 0 –Border Rivers Ru1: Unspecified river (landform unknown) 2 0 –Border Rivers Pt2.2.2: Temporary sedge/grass/forb marsh 1 0 –Border Rivers Pt1.3.2: Intermittent Coolibah swamp 1 0 –Border Rivers Pps5: Permanent springs <1 0 –Broken Pt3.1.2: Clay pans 1 604 0 –Broken Pt1.1.1: Intermittent River red gum floodplain swamp 1 200 0 –Broken Pt3.1.1: Floodplain clay pans 832 0 –Broken Pt1.1.2: Intermittent River red gum swamps 579 0 –Broken Pt1.6.1: Temporary woodland floodplain swamp 294 0 –Broken Pt2.3.1: Floodplain freshwater meadow 203 0 –Broken Pst4: Temporary saline wetland 185 0 –Broken Lt1.1: Temporary lakes 171 0 –
2015–16 Basin-scale evaluation of Commonwealth environmental water – Ecosystem Diversity 25
Valley name Australian National Aquatic Ecosystem (ANAE) wetland type
Totalarea (ha)
Influenced by Commonwealth
environmental waterArea (ha) % of total
Broken Pt1.6.2: Temporary woodland swamp 160 0 –Broken Pt1.2.2: Intermittent Black box swamp 104 0 –Broken Pt2.1.1: Temporary tall emergent floodplain marsh 79 0 –Broken Pt2.2.1: Temporary sedge/grass/forb floodplain marsh 77 0 –Broken Lt2.1: Temporary floodplain lakes 70 0 –Broken Pt2.3.2: Freshwater meadow 68 0 –Broken Pst3.2: Salt pans and salt flats 60 0 –Broken Pt2.1.2: Temporary tall emergent marsh 60 0 –Broken Lp1.1: Permanent lakes 46 0 –Broken Lp2.1: Permanent floodplain lakes 16 0 –Broken Pst1.1: Temporary saline swamp 16 0 –Broken Pp4.2: Permanent wetland 3 0 –Broken Pt1.2.1: Intermittent Black box floodplain swamp 2 0 –Broken Pp4.1: Permanent floodplain wetland 1 0 –Broken Pps5: Permanent springs <1 0 –Campaspe Pt3.1.2: Clay pans 1 705 0 –Campaspe Pt1.1.2: Intermittent River red gum swamps 388 0 –Campaspe Pt1.6.2: Temporary woodland swamp 143 0 –Campaspe Lt1.1: Temporary lakes 85 0 –Campaspe Pt2.1.2: Temporary tall emergent marsh 38 0 –Campaspe Pt2.3.2: Freshwater meadow 33 0 –Campaspe Lp1.1: Permanent lakes 22 0 –Campaspe Pp2.4.2: Permanent forb marshes 3 0 –Campaspe Pps5: Permanent springs 1 0 –Castlereagh Rt1.4: Temporary lowland rivers and streams 557 0 –Castlereagh Rp1.4: Permanent lowland rivers and streams 488 0 –Castlereagh Lt1.1: Temporary lakes 279 0 –Castlereagh Lt2.1: Temporary floodplain lakes 177 0 –Castlereagh Pt4.2: Temporary wetland 51 0 –Castlereagh Pt1.6.2: Temporary woodland swamp 35 0 –Castlereagh Rp1.2: Permanent transitional zone streams 32 0 –Castlereagh Pt3.1.2: Clay pans 30 0 –Castlereagh Pt1.2.2: Intermittent Black box swamp 25 0 –Castlereagh Rp1.3: Permanent low energy streams 17 0 –Castlereagh Pp4.2: Permanent wetland 16 0 –Castlereagh Pt2.1.1: Temporary tall emergent floodplain marsh 13 0 –Castlereagh Rt1.2: Temporary transitional zone streams 12 0 –Castlereagh Rp1.1: Permanent high energy streams 11 0 –Castlereagh Lp1.1: Permanent lakes 5 0 –Castlereagh Pt1.1.2: Intermittent River red gum swamps 1 0 –Castlereagh Rt1.1: Temporary high energy streams 1 0 –Castlereagh Pt2.2.2: Temporary sedge/grass/forb marsh 1 0 –Castlereagh Pt1.2.1: Intermittent Black box floodplain swamp 1 0 –Castlereagh Pps5: Permanent springs 1 0 –Central Murray Pt1.1.1: Intermittent River red gum floodplain swamp 36 559 22 047 60.3Central Murray Pp4.1: Permanent floodplain wetland 7 331 2 401 32.8Central Murray Lt2.1: Temporary floodplain lakes 4 684 1 852 39.5Central Murray Lst2.1: Temporary saline floodplain lakes 1 630 1 513 92.8Central Murray Rp1.4: Permanent lowland rivers and streams 12 011 1 080 9.0Central Murray Lt1.1: Temporary lakes 13 767 1 053 7.6Central Murray Psp4: Permanent saline wetland 1 008 916 90.9Central Murray Rt1.4: Temporary lowland rivers and streams 10 267 716 7.0Central Murray Pp2.1.1: Permanent floodplain tall emergent marshes 969 710 73.3Central Murray Lp2.1: Permanent floodplain lakes 1 744 395 22.6Central Murray Pt1.6.1: Temporary woodland floodplain swamp 918 393 42.8Central Murray Pst1.1: Temporary saline swamp 1 102 267 24.2
2015–16 Basin-scale evaluation of Commonwealth environmental water – Ecosystem Diversity 26

Valley name Australian National Aquatic Ecosystem (ANAE) wetland type
Totalarea (ha)
Influenced by Commonwealth
environmental waterArea (ha) % of total
Central Murray Pst4: Temporary saline wetland 1 252 237 18.9Central Murray Pt1.2.1: Intermittent Black box floodplain swamp 3 049 236 7.7Central Murray Rt1.3: Temporary low energy streams 249 163 65.5Central Murray Pt2.3.1: Floodplain freshwater meadow 526 84 16.0Central Murray Pt4.1: Temporary floodplain wetland 807 63 7.8Central Murray Pt3.1.2: Clay pans 3 641 35 1.0Central Murray Pt3.1.1: Floodplain clay pans 6 608 32 0.5Central Murray Rt1.2: Temporary transitional zone streams 60 27 45.0Central Murray Lp1.1: Permanent lakes 1 542 19 1.2Central Murray Pt1.1.2: Intermittent River red gum swamps 717 5 0.7Central Murray Lst1.1: Temporary saline lakes 1 797 4 0.2Central Murray Pp2.4.1: Permanent floodplain forb marshes 132 3 2.3Central Murray Pp2.3.1: Permanent floodplain grass marshes 41 2 4.9Central Murray Rp1.3: Permanent low energy streams 19 2 10.5Central Murray Pp4.2: Permanent wetland 3 199 0 –Central Murray Pt1.7.2: Intermittent Lignum swamps 1 373 0 –Central Murray Pt1.7.1: Intermittent Lignum floodplain swamp 1 018 0 –Central Murray Pt1.6.2: Temporary woodland swamp 561 0 –Central Murray Pt2.1.1: Temporary tall emergent floodplain marsh 436 0 –Central Murray Pt4.2: Temporary wetland 418 0 –Central Murray Pt2.3.2: Freshwater meadow 403 0 –Central Murray Pt1.2.2: Intermittent Black box swamp 401 0 –Central Murray Pst3.2: Salt pans and salt flats 361 0 –Central Murray Pt2.2.1: Temporary sedge/grass/forb floodplain marsh 247 0 –Central Murray Pt2.2.2: Temporary sedge/grass/forb marsh 232 0 –Central Murray Lsp2.1: Permanent saline floodplain lakes 188 0 –Central Murray Rp1.1: Permanent high energy streams 104 0 –Central Murray Pp2.2.2: Permanent sedge/grass/forb marshes 89 0 –Central Murray Rp1.2: Permanent transitional zone streams 75 0 –
Central Murray Pp2.2.1: Permanent floodplain sedge/grass/forb marshes 68 0 –
Central Murray Pt2.1.2: Temporary tall emergent marsh 52 0 –Central Murray Rt1.1: Temporary high energy streams 51 0 –Central Murray Lsp1.1: Permanent saline lakes 46 0 –Central Murray Pp2.1.2: Permanent tall emergent marshes 42 0 –Central Murray Lt2.2: Temporary floodplain lakes with aquatic beds 18 0 –Central Murray Pp2.3.2: Permanent grass marshes 1 0 –Condamine Balonne Rt1.4: Temporary lowland rivers and streams 83 638 0 –Condamine Balonne Pt2.1.1: Temporary tall emergent floodplain marsh 35 572 0 –Condamine Balonne Pt4.1: Temporary floodplain wetland 30 720 0 –Condamine Balonne Pt1.7.1: Intermittent Lignum floodplain swamp 11 797 0 –Condamine Balonne Lt1.1: Temporary lakes 10 712 0 –Condamine Balonne Lt2.1: Temporary floodplain lakes 8 606 0 –Condamine Balonne Pt1.6.1: Temporary woodland floodplain swamp 6 462 0 –Condamine Balonne Pt1.2.1: Intermittent Black box floodplain swamp 4 683 0 –Condamine Balonne Pt4.2: Temporary wetland 4 428 0 –Condamine Balonne Rt1.1: Temporary high energy streams 4 120 0 –Condamine Balonne Pt2.1.2: Temporary tall emergent marsh 4 108 0 –Condamine Balonne Pt2.2.1: Temporary sedge/grass/forb floodplain marsh 2 923 0 –Condamine Balonne Pt1.6.2: Temporary woodland swamp 2 550 0 –Condamine Balonne Pp2.1.1: Permanent floodplain tall emergent marshes 2 550 0 –Condamine Balonne Pp4.1: Permanent floodplain wetland 2 361 0 –Condamine Balonne Pt3.1.1: Floodplain clay pans 2 349 0 –Condamine Balonne Rt1.2: Temporary transitional zone streams 1 996 0 –Condamine Balonne Rp1.4: Permanent lowland rivers and streams 1 902 0 –Condamine Balonne Lt2.2: Temporary floodplain lakes with aquatic beds 1 726 0 –
2015–16 Basin-scale evaluation of Commonwealth environmental water – Ecosystem Diversity 27

Valley name Australian National Aquatic Ecosystem (ANAE) wetland type
Totalarea (ha)
Influenced by Commonwealth
environmental waterArea (ha) % of total
Condamine Balonne Lp2.2: Permanent floodplain lakes with aquatic beds 1 452 0 –Condamine Balonne Lst2.1: Temporary saline floodplain lakes 1 322 0 –Condamine Balonne Pp4.2: Permanent wetland 1 285 0 –Condamine Balonne Lp1.1: Permanent lakes 1 234 0 –Condamine Balonne Lp2.1: Permanent floodplain lakes 876 0 –Condamine Balonne Pt1.1.2: Intermittent River red gum swamps 528 0 –Condamine Balonne Pt1.1.1: Intermittent River red gum floodplain swamp 503 0 –Condamine Balonne Pt1.3.1: Intermittent Coolibah floodplain swamp 363 0 –Condamine Balonne Lp1.2: Permanent lakes with aquatic beds 363 0 –Condamine Balonne Lst1.1: Temporary saline lakes 303 0 –Condamine Balonne Pt1.3.2: Intermittent Coolibah swamp 268 0 –Condamine Balonne Pt2.2.2: Temporary sedge/grass/forb marsh 242 0 –Condamine Balonne Pt2.3.1: Floodplain freshwater meadow 192 0 –Condamine Balonne Rt1.3: Temporary low energy streams 145 0 –Condamine Balonne Pt2.3.2: Freshwater meadow 100 0 –Condamine Balonne Rp1.2: Permanent transitional zone streams 65 0 –Condamine Balonne Rp1.1: Permanent high energy streams 54 0 –Condamine Balonne Pt3.1.2: Clay pans 45 0 –Condamine Balonne Pp2.1.2: Permanent tall emergent marshes 41 0 –Condamine Balonne Pp2.3.1: Permanent floodplain grass marshes 25 0 –Condamine Balonne Rp1.3: Permanent low energy streams 21 0 –Condamine Balonne Pt1.7.2: Intermittent Lignum swamps 7 0 –Condamine Balonne Pt1.5.2: Temporary paperbark swamp 6 0 –
Condamine Balonne Pp2.2.1: Permanent floodplain sedge/grass/forb marshes 6 0 –
Condamine Balonne Pps5: Permanent springs 6 0 –Condamine Balonne Lsp1.1: Permanent saline lakes 3 0 –Condamine Balonne Pp2.2.2: Permanent sedge/grass/forb marshes 1 0 –Condamine Balonne Pt1.2.2: Intermittent Black box swamp 1 0 –Condamine Balonne Ru1: Unspecified river (landform unknown) <1 0 –Edward Wakool Rt1.4: Temporary lowland rivers and streams 6 878 0 –Edward Wakool Rp1.4: Permanent lowland rivers and streams 3 040 0 –Edward Wakool Pt3.1.1: Floodplain clay pans 2 399 0 –Edward Wakool Pt3.1.2: Clay pans 1 217 0 –Edward Wakool Pt1.1.1: Intermittent River red gum floodplain swamp 1 114 0 –Edward Wakool Pt1.2.1: Intermittent Black box floodplain swamp 1 101 0 –Edward Wakool Lt1.1: Temporary lakes 764 0 –Edward Wakool Pp4.1: Permanent floodplain wetland 678 0 –Edward Wakool Pt1.2.2: Intermittent Black box swamp 555 0 –Edward Wakool Pt2.2.2: Temporary sedge/grass/forb marsh 264 0 –Edward Wakool Pt1.6.1: Temporary woodland floodplain swamp 218 0 –Edward Wakool Pt1.6.2: Temporary woodland swamp 212 0 –Edward Wakool Lt2.1: Temporary floodplain lakes 208 0 –Edward Wakool Pt1.1.2: Intermittent River red gum swamps 194 0 –Edward Wakool Pt2.2.1: Temporary sedge/grass/forb floodplain marsh 193 0 –Edward Wakool Pt4.2: Temporary wetland 172 0 –Edward Wakool Pt4.1: Temporary floodplain wetland 114 0 –Edward Wakool Pp4.2: Permanent wetland 98 0 –Edward Wakool Pt1.7.1: Intermittent Lignum floodplain swamp 85 0 –Edward Wakool Pt1.7.2: Intermittent Lignum swamps 78 0 –Edward Wakool Pt2.3.2: Freshwater meadow 76 0 –Edward Wakool Pt2.3.1: Floodplain freshwater meadow 68 0 –Edward Wakool Pt2.1.1: Temporary tall emergent floodplain marsh 43 0 –Edward Wakool Lp1.1: Permanent lakes 37 0 –Edward Wakool Pp2.3.1: Permanent floodplain grass marshes 7 0 –Edward Wakool Pp2.3.2: Permanent grass marshes 6 0 –
2015–16 Basin-scale evaluation of Commonwealth environmental water – Ecosystem Diversity 28
Valley name Australian National Aquatic Ecosystem (ANAE) wetland type
Totalarea (ha)
Influenced by Commonwealth
environmental waterArea (ha) % of total
Edward Wakool Psp4: Permanent saline wetland 6 0 –Edward Wakool Pst1.1: Temporary saline swamp 5 0 –Edward Wakool Lp2.1: Permanent floodplain lakes 4 0 –
Edward Wakool Pp2.2.1: Permanent floodplain sedge/grass/forb marshes 4 0 –
Edward Wakool Pp2.2.2: Permanent sedge/grass/forb marshes 3 0 –Edward Wakool Rt1.3: Temporary low energy streams 2 0 –Goulburn Pt3.1.2: Clay pans 4 179 0 –Goulburn Pt3.1.1: Floodplain clay pans 3 886 0 –Goulburn Pt1.1.1: Intermittent River red gum floodplain swamp 3 715 0 –Goulburn Pt1.1.2: Intermittent River red gum swamps 1 297 0 –Goulburn Lsp2.1: Permanent saline floodplain lakes 1 272 0 –Goulburn Lt1.1: Temporary lakes 1 042 0 –Goulburn Pst4: Temporary saline wetland 968 0 –Goulburn Lp1.1: Permanent lakes 945 0 –Goulburn Lt2.1: Temporary floodplain lakes 799 0 –Goulburn Pt1.6.2: Temporary woodland swamp 701 0 –Goulburn Lt1.2: Temporary lakes with aquatic beds 579 0 –Goulburn Pt2.1.1: Temporary tall emergent floodplain marsh 496 0 –Goulburn Pt2.3.1: Floodplain freshwater meadow 366 0 –Goulburn Pt2.1.2: Temporary tall emergent marsh 215 0 –Goulburn Lp2.1: Permanent floodplain lakes 184 0 –Goulburn Lt2.2: Temporary floodplain lakes with aquatic beds 165 0 –Goulburn Pt1.6.1: Temporary woodland floodplain swamp 155 0 –Goulburn Pt2.2.2: Temporary sedge/grass/forb marsh 153 0 –Goulburn Pt2.3.2: Freshwater meadow 117 0 –Goulburn Pt1.2.2: Intermittent Black box swamp 117 0 –Goulburn Pp4.2: Permanent wetland 91 0 –Goulburn Lst2.1: Temporary saline floodplain lakes 67 0 –Goulburn Pt4.2: Temporary wetland 50 0 –Goulburn Pt2.2.1: Temporary sedge/grass/forb floodplain marsh 31 0 –Goulburn Pp2.1.1: Permanent floodplain tall emergent marshes 29 0 –Goulburn Pst3.2: Salt pans and salt flats 16 0 –Goulburn Pp2.1.2: Permanent tall emergent marshes 8 0 –Goulburn Pt1.2.1: Intermittent Black box floodplain swamp 6 0 –Goulburn Rt1.2: Temporary transitional zone streams 6 0 –Goulburn Rt1.1: Temporary high energy streams 2 0 –Goulburn Pp4.1: Permanent floodplain wetland 1 0 –Goulburn Pps5: Permanent springs <1 0 –Gwydir Rp1.4: Permanent lowland rivers and streams 1 434 577 40.2Gwydir Rt1.4: Temporary lowland rivers and streams 632 188 29.7Gwydir Pt2.1.1: Temporary tall emergent floodplain marsh 42 42 100.0Gwydir Rp1.3: Permanent low energy streams 19 19 100.0Gwydir Lt2.1: Temporary floodplain lakes 108 15 13.9Gwydir Pt1.3.1: Intermittent Coolibah floodplain swamp 12 3 25.0Gwydir Pt1.6.1: Temporary woodland floodplain swamp 10 2 20.0Gwydir Pt1.1.1: Intermittent River red gum floodplain swamp 3 1 33.3Gwydir Rp1.2: Permanent transitional zone streams 853 0 –Gwydir Rp1.1: Permanent high energy streams 636 0 –Gwydir Lt1.1: Temporary lakes 609 0 –Gwydir Pt4.2: Temporary wetland 445 0 –Gwydir Pp4.2: Permanent wetland 224 0 –Gwydir Pt3.1.2: Clay pans 180 0 –Gwydir Pt1.6.2: Temporary woodland swamp 157 0 –Gwydir Lp1.1: Permanent lakes 51 0 –Gwydir Pt1.3.2: Intermittent Coolibah swamp 28 0 –
2015–16 Basin-scale evaluation of Commonwealth environmental water – Ecosystem Diversity 29
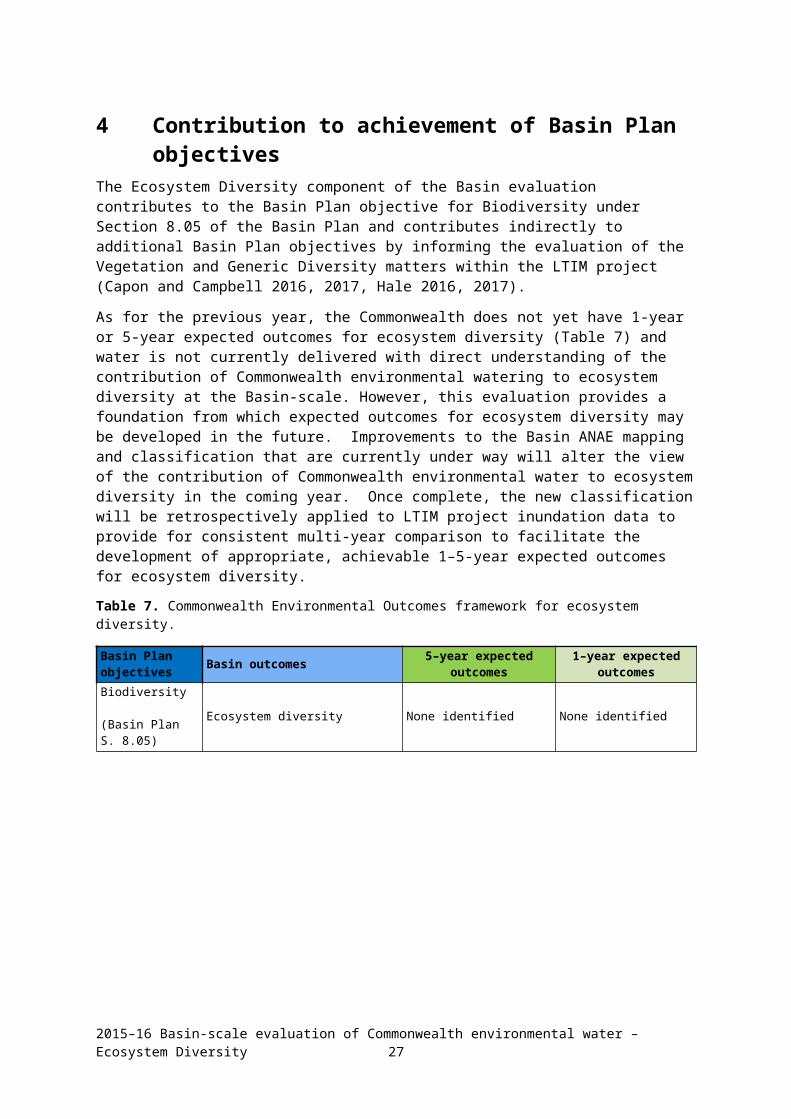
Valley name Australian National Aquatic Ecosystem (ANAE) wetland type
Totalarea (ha)
Influenced by Commonwealth
environmental waterArea (ha) % of total
Gwydir Pt2.2.2: Temporary sedge/grass/forb marsh 13 0 –Gwydir Pp4.1: Permanent floodplain wetland 10 0 –Gwydir Pt3.1.1: Floodplain clay pans 10 0 –Gwydir Pp2.2.2: Permanent sedge/grass/forb marshes 8 0 –Gwydir Pt1.4.2: Intermittent River Cooba swamp 4 0 –Gwydir Pt1.1.2: Intermittent River red gum swamps 3 0 –Gwydir Pp1.1.2: Permanent paperbark swamps 1 0 –Gwydir Rt1.3: Temporary low energy streams 1 0 –Gwydir Pt4.1: Temporary floodplain wetland 1 0 –Gwydir Rt1.2: Temporary transitional zone streams 1 0 –Gwydir Pps5: Permanent springs <1 0 –Kiewa Pt4.2: Temporary wetland 553 0 –Kiewa Pt3.1.2: Clay pans 261 0 –Kiewa Pt2.2.2: Temporary sedge/grass/forb marsh 185 0 –Kiewa Lp1.1: Permanent lakes 44 0 –Kiewa Pt1.6.2: Temporary woodland swamp 42 0 –Kiewa Pt1.1.2: Intermittent River red gum swamps 14 0 –Kiewa Lt1.1: Temporary lakes 8 0 –Kiewa Rp1.1: Permanent high energy streams 2 0 –Kiewa Pp4.2: Permanent wetland 2 0 –Kiewa Pp2.1.2: Permanent tall emergent marshes 1 0 –Kiewa Pps5: Permanent springs <1 0 –Lachlan Pp2.1.1: Permanent floodplain tall emergent marshes 3 440 3 440 100.0Lachlan Lt2.1: Temporary floodplain lakes 21 190 667 3.1Lachlan Pt1.1.1: Intermittent River red gum floodplain swamp 1 615 547 33.9Lachlan Lp2.1: Permanent floodplain lakes 702 534 76.1Lachlan Rp1.4: Permanent lowland rivers and streams 6 019 472 7.8Lachlan Pt1.2.1: Intermittent Black box floodplain swamp 7 299 279 3.8Lachlan Lp1.1: Permanent lakes 5 441 178 3.3Lachlan Pt4.1: Temporary floodplain wetland 8 716 121 1.4Lachlan Pt2.1.1: Temporary tall emergent floodplain marsh 115 100 87.0Lachlan Pt1.2.2: Intermittent Black box swamp 7 610 88 1.2Lachlan Pt4.2: Temporary wetland 13 276 48 0.4Lachlan Pp4.1: Permanent floodplain wetland 652 39 6.0Lachlan Pt2.1.2: Temporary tall emergent marsh 14 14 100.0Lachlan Pt3.1.2: Clay pans 2 106 13 0.6Lachlan Pp2.1.2: Permanent tall emergent marshes 9 9 100.0Lachlan Rt1.4: Temporary lowland rivers and streams 9 804 3 <0.1Lachlan Pt1.7.2: Intermittent Lignum swamps 15 791 0 –Lachlan Lt1.1: Temporary lakes 12 854 0 –Lachlan Pt3.1.1: Floodplain clay pans 12 818 0 –Lachlan Pt2.2.1: Temporary sedge/grass/forb floodplain marsh 7 093 0 –Lachlan Pt1.7.1: Intermittent Lignum floodplain swamp 6 428 0 –Lachlan Pt2.3.1: Floodplain freshwater meadow 2 959 0 –Lachlan Pt2.3.2: Freshwater meadow 2 259 0 –Lachlan Pt1.6.2: Temporary woodland swamp 2 219 0 –
Lachlan Pp2.2.1: Permanent floodplain sedge/grass/forb marshes 1 719 0 –
Lachlan Pt2.2.2: Temporary sedge/grass/forb marsh 1 097 0 –Lachlan Pt1.6.1: Temporary woodland floodplain swamp 1 089 0 –Lachlan Rp1.1: Permanent high energy streams 1 021 0 –Lachlan Pt1.1.2: Intermittent River red gum swamps 583 0 –Lachlan Pp4.2: Permanent wetland 338 0 –Lachlan Rt1.3: Temporary low energy streams 196 0 –Lachlan Rp1.2: Permanent transitional zone streams 191 0 –Lachlan Pp2.2.2: Permanent sedge/grass/forb marshes 100 0 –
2015–16 Basin-scale evaluation of Commonwealth environmental water – Ecosystem Diversity 30

Valley name Australian National Aquatic Ecosystem (ANAE) wetland type
Totalarea (ha)
Influenced by Commonwealth
environmental waterArea (ha) % of total
Lachlan Rt1.2: Temporary transitional zone streams 70 0 –Lachlan Rp1.3: Permanent low energy streams 62 0 –Lachlan Pp2.3.2: Permanent grass marshes 21 0 –Lachlan Pps5: Permanent springs 7 0 –Loddon Pst1.1: Temporary saline swamp 5 949 0 –Loddon Pst3.2: Salt pans and salt flats 4 546 0 –Loddon Pt3.1.2: Clay pans 4 334 0 –Loddon Lp1.1: Permanent lakes 3 894 0 –Loddon Pst4: Temporary saline wetland 3 786 0 –Loddon Lsp1.1: Permanent saline lakes 3 206 0 –Loddon Lst1.1: Temporary saline lakes 2 044 0 –Loddon Lt1.1: Temporary lakes 1 887 0 –Loddon Pt2.3.1: Floodplain freshwater meadow 1 632 0 –Loddon Pt2.3.2: Freshwater meadow 1 162 0 –Loddon Pt1.6.2: Temporary woodland swamp 922 0 –Loddon Pt3.1.1: Floodplain clay pans 903 0 –Loddon Lt2.1: Temporary floodplain lakes 892 0 –Loddon Pt2.2.2: Temporary sedge/grass/forb marsh 728 0 –Loddon Lst2.1: Temporary saline floodplain lakes 329 0 –Loddon Pt1.1.2: Intermittent River red gum swamps 288 0 –Loddon Pt1.6.1: Temporary woodland floodplain swamp 275 0 –Loddon Pt1.1.1: Intermittent River red gum floodplain swamp 261 0 –Loddon Lst1.2: Temporary saline lakes with aquatic beds 181 0 –Loddon Rt1.4: Temporary lowland rivers and streams 131 0 –Loddon Pt4.2: Temporary wetland 112 0 –Loddon Pt1.7.2: Intermittent Lignum swamps 67 0 –Loddon Pt1.2.2: Intermittent Black box swamp 65 0 –Loddon Pt2.1.1: Temporary tall emergent floodplain marsh 54 0 –Loddon Lt2.2: Temporary floodplain lakes with aquatic beds 52 0 –Loddon Lp2.1: Permanent floodplain lakes 49 0 –Loddon Pt4.1: Temporary floodplain wetland 40 0 –Loddon Pt2.2.1: Temporary sedge/grass/forb floodplain marsh 35 0 –Loddon Rp1.4: Permanent lowland rivers and streams 18 0 –Loddon Lp1.2: Permanent lakes with aquatic beds 17 0 –Loddon Lt1.2: Temporary lakes with aquatic beds 9 0 –Loddon Pp2.4.2: Permanent forb marshes 9 0 –Loddon Pp4.2: Permanent wetland 8 0 –Loddon Pp2.2.2: Permanent sedge/grass/forb marshes 7 0 –Loddon Pps5: Permanent springs 4 0 –Lower Darling Lt1.1: Temporary lakes 122 402 0 –Lower Darling Pt4.2: Temporary wetland 69 056 0 –Lower Darling Lt2.1: Temporary floodplain lakes 64 936 0 –Lower Darling Pt4.1: Temporary floodplain wetland 34 578 0 –Lower Darling Lp2.1: Permanent floodplain lakes 9 389 0 –Lower Darling Pt2.3.2: Freshwater meadow 7 130 0 –Lower Darling Pt1.6.2: Temporary woodland swamp 4 311 0 –Lower Darling Rp1.4: Permanent lowland rivers and streams 2 841 0 –Lower Darling Pt3.1.2: Clay pans 1 380 0 –Lower Darling Rt1.4: Temporary lowland rivers and streams 1 180 0 –Lower Darling Pt1.2.2: Intermittent Black box swamp 1 145 0 –Lower Darling Pp4.2: Permanent wetland 1 099 0 –Lower Darling Pt1.2.1: Intermittent Black box floodplain swamp 809 0 –Lower Darling Pt1.1.1: Intermittent River red gum floodplain swamp 803 0 –Lower Darling Pt2.2.2: Temporary sedge/grass/forb marsh 598 0 –Lower Darling Lst1.1: Temporary saline lakes 509 0 –Lower Darling Pt2.3.1: Floodplain freshwater meadow 314 0 –
2015–16 Basin-scale evaluation of Commonwealth environmental water – Ecosystem Diversity 31
Valley name Australian National Aquatic Ecosystem (ANAE) wetland type
Totalarea (ha)
Influenced by Commonwealth
environmental waterArea (ha) % of total
Lower Darling Lp1.1: Permanent lakes 296 0 –Lower Darling Pt1.6.1: Temporary woodland floodplain swamp 107 0 –Lower Darling Pp4.1: Permanent floodplain wetland 96 0 –Lower Darling Pt1.1.2: Intermittent River red gum swamps 76 0 –Lower Darling Pt3.1.1: Floodplain clay pans 75 0 –Lower Darling Pp2.3.2: Permanent grass marshes 26 0 –Lower Darling Pt2.2.1: Temporary sedge/grass/forb floodplain marsh 15 0 –Lower Darling Rp1.1: Permanent high energy streams 8 0 –Lower Darling Rp1.2: Permanent transitional zone streams 2 0 –Lower Murray Lp2.1: Permanent floodplain lakes 93 064 83 401 89.6Lower Murray Ewd1.3.2: Coastal lagoon 20 923 20 923 100.0Lower Murray Pt2.1.2: Temporary tall emergent marsh 7 463 7 456 99.9Lower Murray Pt2.2.1: Temporary sedge/grass/forb floodplain marsh 6 468 6 422 99.3Lower Murray Pt4.1: Temporary floodplain wetland 5 753 4 287 74.5Lower Murray Etd1.3.3: Tide dominated estuary 2 189 2 189 100.0Lower Murray Lsp1.1: Permanent saline lakes 2 674 2 079 77.7Lower Murray Pst1.1: Temporary saline swamp 2 276 1 851 81.3Lower Murray Rp1.4: Permanent lowland rivers and streams 13 297 1 621 12.2Lower Murray Psp4: Permanent saline wetland 1 995 1 305 65.4Lower Murray Pp4.1: Permanent floodplain wetland 4 085 910 22.3Lower Murray Pt3.1.1: Floodplain clay pans 2 080 879 42.3Lower Murray Lst2.1: Temporary saline floodplain lakes 825 825 100.0Lower Murray Pst4: Temporary saline wetland 1 285 736 57.3Lower Murray Pt1: Temporary swamps 3 766 706 18.7Lower Murray Pt2.2.2: Temporary sedge/grass/forb marsh 1 162 655 56.4Lower Murray Pst2.2: Temporary salt marsh 427 412 96.5Lower Murray Rp1: Permanent Streams 1 428 406 28.4Lower Murray Rt1.4: Temporary lowland rivers and streams 1 045 377 36.1Lower Murray Etd1.2.1: Tide dominated saltmarsh 350 350 100.0Lower Murray Ewd1.2.3: Intertidal saltmarsh 166 166 100.0Lower Murray Pst3.2: Salt pans and salt flats 719 163 22.7Lower Murray Ewd1.2.4: Intertidal mudflats and sand bars 131 131 100.0Lower Murray Rt1: Temporary Streams 294 99 33.7Lower Murray Etd1.2.2: Tide dominated mudflats and sandbars 64 64 100.0Lower Murray Pt2.3.1: Floodplain freshwater meadow 971 50 5.1Lower Murray Pt4.2: Temporary wetland 2 269 44 1.9Lower Murray Pt2.1.1: Temporary tall emergent floodplain marsh 49 38 77.6Lower Murray Pt1.2.1: Intermittent Black box floodplain swamp 363 34 9.4Lower Murray Lt1.1: Temporary lakes 21 091 25 0.1Lower Murray Pt1.1.1: Intermittent River red gum floodplain swamp 431 22 5.1Lower Murray Pp2.3.1: Permanent floodplain grass marshes 89 22 24.7Lower Murray Lp1.1: Permanent lakes 11 082 20 0.2Lower Murray Etd1.2.3: Tide dominated forests 19 19 100.0Lower Murray Pt3.1.2: Clay pans 4 940 16 0.3Lower Murray Pt1.7.1: Intermittent Lignum floodplain swamp 2 474 11 0.4Lower Murray Pp2.1.1: Permanent floodplain tall emergent marshes 9 9 100.0Lower Murray Rt1.2: Temporary transitional zone streams 14 7 50.0Lower Murray Etd1.1.1: Tide dominated rocky shoreline 7 7 100.0Lower Murray Lt2.1: Temporary floodplain lakes 9 111 5 0.1Lower Murray Pp4.2: Permanent wetland 104 3 2.9Lower Murray Pt1.7.2: Intermittent Lignum swamps 13 3 23.1Lower Murray Psp2.1: Permanent salt marsh 3 2 66.7Lower Murray Pu1: Unspecified wetland 1 768 0 –Lower Murray Lst1.1: Temporary saline lakes 1 526 0 –Lower Murray Pt1.6.2: Temporary woodland swamp 829 0 –Lower Murray Psp1.1: Saline paperbark swamp 132 0 –
2015–16 Basin-scale evaluation of Commonwealth environmental water – Ecosystem Diversity 32

Valley name Australian National Aquatic Ecosystem (ANAE) wetland type
Totalarea (ha)
Influenced by Commonwealth
environmental waterArea (ha) % of total
Lower Murray Rp1.2: Permanent transitional zone streams 99 0 –Lower Murray Pt1.5.2: Temporary paperbark swamp 83 0 –Lower Murray Pt1.1.2: Intermittent River red gum swamps 77 0 –Lower Murray Pt1.6.1: Temporary woodland floodplain swamp 77 0 –Lower Murray Pp2.2.2: Permanent sedge/grass/forb marshes 45 0 –Lower Murray Rp1.1: Permanent high energy streams 40 0 –Lower Murray Pt1.5.1: Temporary paperbark floodplain swamp 32 0 –Lower Murray Pt1.2.2: Intermittent Black box swamp 27 0 –Lower Murray Pp2.4.1: Permanent floodplain forb marshes 23 0 –Lower Murray Rp1.3: Permanent low energy streams 15 0 –Lower Murray Rt1.1: Temporary high energy streams 10 0 –Lower Murray Pt2.3.2: Freshwater meadow 9 0 –Lower Murray Rt1.3: Temporary low energy streams 3 0 –Lower Murray Pps5: Permanent springs 2 0 –Macquarie Pp4.1: Permanent floodplain wetland 18 093 17 404 96.2Macquarie Pt2.2.1: Temporary sedge/grass/forb floodplain marsh 816 88 10.8Macquarie Pt3.1.2: Clay pans 1 528 45 2.9Macquarie Rp1.4: Permanent lowland rivers and streams 7 058 44 0.6Macquarie Pt2.3.1: Floodplain freshwater meadow 52 32 61.5Macquarie Pp2.1.2: Permanent tall emergent marshes 22 22 100.0Macquarie Pp4.2: Permanent wetland 595 16 2.7Macquarie Pt3.1.1: Floodplain clay pans 580 10 1.7Macquarie Pp2.3.2: Permanent grass marshes 7 7 100.0Macquarie Lt1.1: Temporary lakes 8 290 0 –Macquarie Pt1.1.1: Intermittent River red gum floodplain swamp 5 316 0 –Macquarie Rt1.4: Temporary lowland rivers and streams 2 935 0 –Macquarie Pt1.6.2: Temporary woodland swamp 2 031 0 –Macquarie Rp1.1: Permanent high energy streams 1 817 0 –Macquarie Pt2.2.2: Temporary sedge/grass/forb marsh 1 711 0 –Macquarie Pt1.2.1: Intermittent Black box floodplain swamp 1 635 0 –Macquarie Pt1.3.1: Intermittent Coolibah floodplain swamp 1 434 0 –Macquarie Pt4.1: Temporary floodplain wetland 1 114 0 –Macquarie Lt2.1: Temporary floodplain lakes 968 0 –Macquarie Lp1.1: Permanent lakes 720 0 –Macquarie Rp1.2: Permanent transitional zone streams 458 0 –Macquarie Pt1.6.1: Temporary woodland floodplain swamp 437 0 –Macquarie Pt4.2: Temporary wetland 378 0 –Macquarie Pt1.1.2: Intermittent River red gum swamps 349 0 –Macquarie Pt1.2.2: Intermittent Black box swamp 263 0 –Macquarie Pp2.3.1: Permanent floodplain grass marshes 208 0 –Macquarie Pt1.4.2: Intermittent River Cooba swamp 101 0 –Macquarie Lp2.1: Permanent floodplain lakes 49 0 –Macquarie Pp2.2.2: Permanent sedge/grass/forb marshes 18 0 –Macquarie Pps5: Permanent springs 15 0 –Macquarie Rp1.3: Permanent low energy streams 4 0 –Macquarie Pt1.4.1: Intermittent River Cooba floodplain swamp 3 0 –Macquarie Rt1.3: Temporary low energy streams 1 0 –Macquarie Rt1.1: Temporary high energy streams <1 0 –Macquarie Ru1: Unspecified river (landform unknown) <1 0 –Mitta Mitta Rp1.1: Permanent high energy streams 1 451 0 –Mitta Mitta Pt4.2: Temporary wetland 790 0 –Mitta Mitta Pt1.6.2: Temporary woodland swamp 635 0 –Mitta Mitta Pst4: Temporary saline wetland 622 0 –Mitta Mitta Pt2.2.2: Temporary sedge/grass/forb marsh 361 0 –Mitta Mitta Pp4.2: Permanent wetland 282 0 –Mitta Mitta Pt3.1.2: Clay pans 253 0 –
2015–16 Basin-scale evaluation of Commonwealth environmental water – Ecosystem Diversity 33
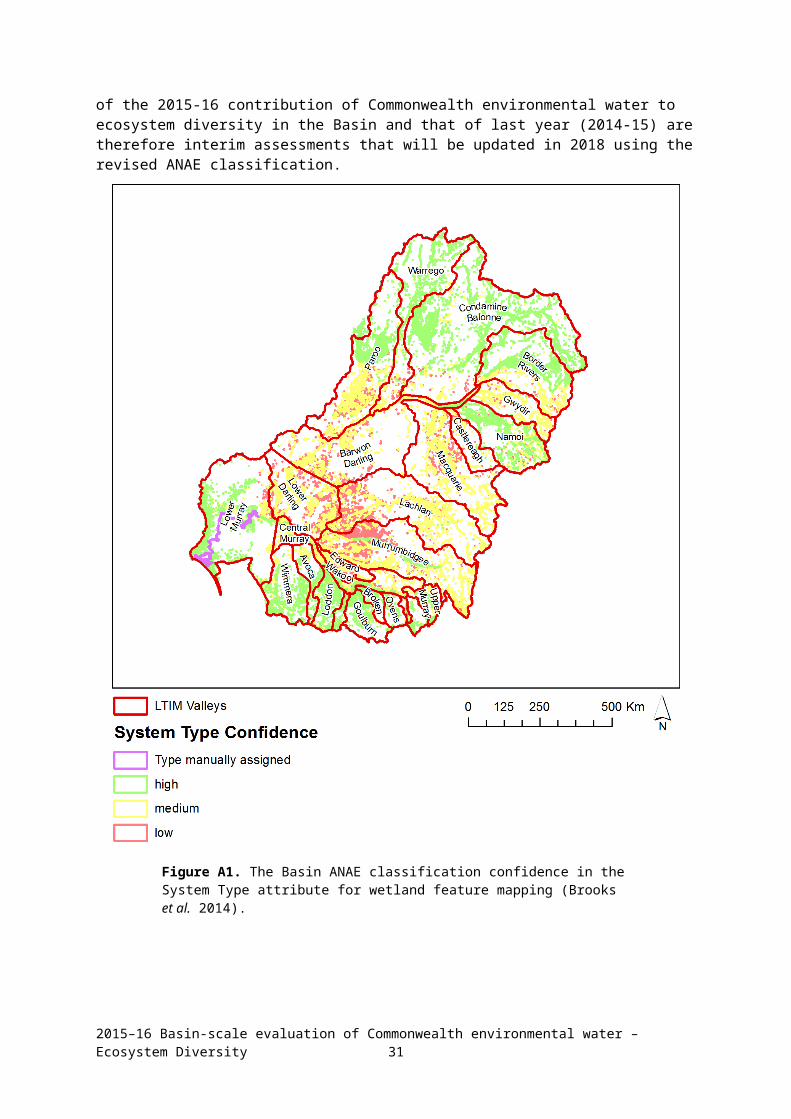
Valley name Australian National Aquatic Ecosystem (ANAE) wetland type
Totalarea (ha)
Influenced by Commonwealth
environmental waterArea (ha) % of total
Mitta Mitta Lt1.1: Temporary lakes 198 0 –Mitta Mitta Lp1.1: Permanent lakes 33 0 –Mitta Mitta Rp1.4: Permanent lowland rivers and streams 10 0 –Mitta Mitta Pp2.2.2: Permanent sedge/grass/forb marshes 1 0 –Murrumbidgee Pt1.1.1: Intermittent River red gum floodplain swamp 7 518 4 740 63.0Murrumbidgee Pt3.1.2: Clay pans 10 579 3 155 29.8Murrumbidgee Pt4.1: Temporary floodplain wetland 8 269 2 595 31.4Murrumbidgee Pt3.1.1: Floodplain clay pans 7 319 1 346 18.4Murrumbidgee Lt1.1: Temporary lakes 28 901 1 004 3.5Murrumbidgee Rp1.4: Permanent lowland rivers and streams 10 569 793 7.5Murrumbidgee Pp4.1: Permanent floodplain wetland 2 747 770 28.0Murrumbidgee Pt1.2.1: Intermittent Black box floodplain swamp 3 841 750 19.5Murrumbidgee Rt1.4: Temporary lowland rivers and streams 13 576 641 4.7Murrumbidgee Lp2.1: Permanent floodplain lakes 787 634 80.6Murrumbidgee Lp1.1: Permanent lakes 493 117 23.7Murrumbidgee Pp2.1.1: Permanent floodplain tall emergent marshes 134 117 87.3Murrumbidgee Lt2.1: Temporary floodplain lakes 1 744 58 3.3Murrumbidgee Rp1.3: Permanent low energy streams 108 5 4.6Murrumbidgee Pt2.2.2: Temporary sedge/grass/forb marsh 20 786 0 –Murrumbidgee Pt4.2: Temporary wetland 14 859 0 –Murrumbidgee Pt2.2.1: Temporary sedge/grass/forb floodplain marsh 4 975 0 –Murrumbidgee Pp4.2: Permanent wetland 4 037 0 –Murrumbidgee Pt1.2.2: Intermittent Black box swamp 3 777 0 –Murrumbidgee Rp1.1: Permanent high energy streams 2 480 0 –Murrumbidgee Pt2.3.2: Freshwater meadow 2 012 0 –Murrumbidgee Pt2.3.1: Floodplain freshwater meadow 1 265 0 –Murrumbidgee Pt1.7.1: Intermittent Lignum floodplain swamp 1 244 0 –Murrumbidgee Pt1.6.2: Temporary woodland swamp 832 0 –Murrumbidgee Rp1.2: Permanent transitional zone streams 713 0 –Murrumbidgee Pt1.6.1: Temporary woodland floodplain swamp 408 0 –Murrumbidgee Pp2.2.2: Permanent sedge/grass/forb marshes 302 0 –Murrumbidgee Pt1.7.2: Intermittent Lignum swamps 220 0 –Murrumbidgee Pp3: Peat bogs and fen marshes 173 0 –Murrumbidgee Pt1.1.2: Intermittent River red gum swamps 167 0 –Murrumbidgee Pt2.1.1: Temporary tall emergent floodplain marsh 154 0 –Murrumbidgee Pp2.3.2: Permanent grass marshes 122 0 –Murrumbidgee Pp2.3.1: Permanent floodplain grass marshes 36 0 –Murrumbidgee Pps5: Permanent springs 19 0 –Murrumbidgee Pt2.1.2: Temporary tall emergent marsh 8 0 –Murrumbidgee Rt1.1: Temporary high energy streams 6 0 –Murrumbidgee Rt1.2: Temporary transitional zone streams 5 0 –
Murrumbidgee Pp2.2.1: Permanent floodplain sedge/grass/forb marshes 1 0 –
Murrumbidgee Ru1: Unspecified river (landform unknown) <1 0 –Namoi Pp4.2: Permanent wetland 9 314 0 –Namoi Pt3.1.2: Clay pans 5 181 0 –Namoi Lp1.1: Permanent lakes 4 208 0 –Namoi Pt4.2: Temporary wetland 3 454 0 –Namoi Lt1.1: Temporary lakes 3 398 0 –Namoi Pt1.6.2: Temporary woodland swamp 3 202 0 –Namoi Rp1.4: Permanent lowland rivers and streams 2 121 0 –Namoi Pp4.1: Permanent floodplain wetland 1 648 0 –Namoi Pt1.2.2: Intermittent Black box swamp 1 161 0 –Namoi Rt1.4: Temporary lowland rivers and streams 889 0 –Namoi Pt1.1.1: Intermittent River red gum floodplain swamp 850 0 –Namoi Rp1.1: Permanent high energy streams 788 0 –
2015–16 Basin-scale evaluation of Commonwealth environmental water – Ecosystem Diversity 34

Valley name Australian National Aquatic Ecosystem (ANAE) wetland type
Totalarea (ha)
Influenced by Commonwealth
environmental waterArea (ha) % of total
Namoi Pt1.1.2: Intermittent River red gum swamps 773 0 –Namoi Pt2.2.2: Temporary sedge/grass/forb marsh 610 0 –Namoi Pt1.3.2: Intermittent Coolibah swamp 602 0 –Namoi Pt1.2.1: Intermittent Black box floodplain swamp 541 0 –Namoi Rp1.2: Permanent transitional zone streams 478 0 –Namoi Pp2.2.2: Permanent sedge/grass/forb marshes 273 0 –Namoi Pt1.6.1: Temporary woodland floodplain swamp 239 0 –Namoi Pt3.1.1: Floodplain clay pans 234 0 –Namoi Pt2.2.1: Temporary sedge/grass/forb floodplain marsh 42 0 –Namoi Pt1.7.2: Intermittent Lignum swamps 16 0 –Namoi Pt4.1: Temporary floodplain wetland 14 0 –Namoi Rp1.3: Permanent low energy streams 11 0 –Namoi Rt1.2: Temporary transitional zone streams 7 0 –Namoi Rt1.3: Temporary low energy streams 3 0 –Namoi Rt1.1: Temporary high energy streams 2 0 –Namoi Pps5: Permanent springs 1 0 –Namoi Ru1: Unspecified river (landform unknown) <1 0 –Ovens Pt3.1.2: Clay pans 1 026 0 –Ovens Pt3.1.1: Floodplain clay pans 594 0 –Ovens Pt2.3.1: Floodplain freshwater meadow 510 0 –Ovens Pt2.3.2: Freshwater meadow 422 0 –Ovens Pt1.1.1: Intermittent River red gum floodplain swamp 368 0 –Ovens Pt1.6.2: Temporary woodland swamp 365 0 –Ovens Pt1.6.1: Temporary woodland floodplain swamp 309 0 –Ovens Lt2.1: Temporary floodplain lakes 162 0 –Ovens Lp2.1: Permanent floodplain lakes 150 0 –Ovens Pt4.1: Temporary floodplain wetland 106 0 –Ovens Pt4.2: Temporary wetland 88 0 –Ovens Pt1.1.2: Intermittent River red gum swamps 83 0 –Ovens Pt2.2.2: Temporary sedge/grass/forb marsh 64 0 –Ovens Lt1.1: Temporary lakes 62 0 –Ovens Lp1.1: Permanent lakes 42 0 –Ovens Pp2.1.1: Permanent floodplain tall emergent marshes 23 0 –Ovens Pp4.1: Permanent floodplain wetland 22 0 –Ovens Lt2.2: Temporary floodplain lakes with aquatic beds 15 0 –Ovens Pt2.2.1: Temporary sedge/grass/forb floodplain marsh 6 0 –Ovens Pp4.2: Permanent wetland 4 0 –Ovens Pp2.2.2: Permanent sedge/grass/forb marshes 3 0 –Ovens Pt2.1.1: Temporary tall emergent floodplain marsh 3 0 –Ovens Pt2.1.2: Temporary tall emergent marsh 2 0 –Ovens Pps5: Permanent springs <1 0 –Paroo Pt1.6.1: Temporary woodland floodplain swamp 159 323 0 –Paroo Lt2.1: Temporary floodplain lakes 49 587 0 –Paroo Pt4.1: Temporary floodplain wetland 25 305 0 –Paroo Lt1.1: Temporary lakes 11 877 0 –Paroo Lsp2.1: Permanent saline floodplain lakes 11 718 0 –Paroo Pt2.1.1: Temporary tall emergent floodplain marsh 10 433 0 –Paroo Rt1.4: Temporary lowland rivers and streams 9 883 0 –Paroo Pt2.2.1: Temporary sedge/grass/forb floodplain marsh 8 259 0 –Paroo Pt1.2.1: Intermittent Black box floodplain swamp 8 117 0 –Paroo Lp1.1: Permanent lakes 8 030 0 –Paroo Pt1.6.2: Temporary woodland swamp 6 977 0 –Paroo Pt4.2: Temporary wetland 6 518 0 –Paroo Pt1.7.1: Intermittent Lignum floodplain swamp 3 428 0 –Paroo Pt2.1.2: Temporary tall emergent marsh 2 608 0 –Paroo Pst2.2: Temporary salt marsh 2 511 0 –
2015–16 Basin-scale evaluation of Commonwealth environmental water – Ecosystem Diversity 35

Valley name Australian National Aquatic Ecosystem (ANAE) wetland type
Totalarea (ha)
Influenced by Commonwealth
environmental waterArea (ha) % of total
Paroo Lp2.1: Permanent floodplain lakes 2 439 0 –Paroo Pt1.3.1: Intermittent Coolibah floodplain swamp 1 888 0 –Paroo Pt2.2.2: Temporary sedge/grass/forb marsh 1 661 0 –Paroo Pp2.1.1: Permanent floodplain tall emergent marshes 654 0 –Paroo Pt1.2.2: Intermittent Black box swamp 466 0 –Paroo Pp4.2: Permanent wetland 461 0 –
Paroo Pp2.2.1: Permanent floodplain sedge/grass/forb marshes 407 0 –
Paroo Lst1.1: Temporary saline lakes 357 0 –Paroo Rt1.1: Temporary high energy streams 311 0 –Paroo Rt1.2: Temporary transitional zone streams 257 0 –Paroo Pp4.1: Permanent floodplain wetland 194 0 –Paroo Rp1.4: Permanent lowland rivers and streams 174 0 –Paroo Pt2.3.1: Floodplain freshwater meadow 81 0 –Paroo Pt1.1.2: Intermittent River red gum swamps 68 0 –Paroo Pst4: Temporary saline wetland 62 0 –Paroo Pt1.3.2: Intermittent Coolibah swamp 44 0 –Paroo Pt1.1.1: Intermittent River red gum floodplain swamp 38 0 –Paroo Pt3.1.2: Clay pans 31 0 –Paroo Pt2.3.2: Freshwater meadow 25 0 –Paroo Lst2.1: Temporary saline floodplain lakes 18 0 –Paroo Lsp1.1: Permanent saline lakes 16 0 –Paroo Pp2.1.2: Permanent tall emergent marshes 11 0 –Paroo Pps5: Permanent springs 9 0 –Upper Murray Pt3.1.2: Clay pans 847 0 –Upper Murray Rt1.4: Temporary lowland rivers and streams 495 0 –Upper Murray Rt1.1: Temporary high energy streams 366 0 –Upper Murray Lt1.1: Temporary lakes 289 0 –Upper Murray Pp4.2: Permanent wetland 273 0 –Upper Murray Pt1.1.2: Intermittent River red gum swamps 253 0 –Upper Murray Pt1.6.2: Temporary woodland swamp 251 0 –Upper Murray Rp1.1: Permanent high energy streams 250 0 –Upper Murray Rt1.2: Temporary transitional zone streams 208 0 –Upper Murray Pt3.1.1: Floodplain clay pans 177 0 –Upper Murray Pt2.2.2: Temporary sedge/grass/forb marsh 129 0 –Upper Murray Lp1.1: Permanent lakes 101 0 –Upper Murray Rp1.2: Permanent transitional zone streams 83 0 –Upper Murray Pt4.2: Temporary wetland 67 0 –Upper Murray Pps5: Permanent springs 63 0 –Upper Murray Rp1.4: Permanent lowland rivers and streams 51 0 –Upper Murray Lp2.1: Permanent floodplain lakes 7 0 –Upper Murray Rp1.3: Permanent low energy streams 2 0 –Upper Murray Pp3: Peat bogs and fen marshes <1 0 –Upper Murray Rt1.3: Temporary low energy streams <1 0 –Warrego Rt1.4: Temporary lowland rivers and streams 52 538 0 –Warrego Pt2.2.1: Temporary sedge/grass/forb floodplain marsh 19 148 0 –Warrego Pt1.6.1: Temporary woodland floodplain swamp 3 575 0 –Warrego Pt2.1.1: Temporary tall emergent floodplain marsh 3 141 0 –Warrego Lp1.1: Permanent lakes 2 916 0 –Warrego Pp4.1: Permanent floodplain wetland 2 460 0 –Warrego Pt4.2: Temporary wetland 2 125 0 –Warrego Lt2.1: Temporary floodplain lakes 2 073 0 –Warrego Pt4.1: Temporary floodplain wetland 2 068 0 –Warrego Pt2.1.2: Temporary tall emergent marsh 1 567 0 –Warrego Pt1.3.1: Intermittent Coolibah floodplain swamp 1 092 0 –Warrego Rt1.1: Temporary high energy streams 1 017 0 –
2015–16 Basin-scale evaluation of Commonwealth environmental water – Ecosystem Diversity 36

Valley name Australian National Aquatic Ecosystem (ANAE) wetland type
Totalarea (ha)
Influenced by Commonwealth
environmental waterArea (ha) % of total
Warrego Rt1.2: Temporary transitional zone streams 984 0 –Warrego Lt1.1: Temporary lakes 913 0 –Warrego Pt1.6.2: Temporary woodland swamp 820 0 –Warrego Pt3.1.1: Floodplain clay pans 708 0 –Warrego Rp1.4: Permanent lowland rivers and streams 586 0 –Warrego Lp2.1: Permanent floodplain lakes 416 0 –Warrego Pt1.3.2: Intermittent Coolibah swamp 73 0 –Warrego Rt1.3: Temporary low energy streams 34 0 –Warrego Rp1.2: Permanent transitional zone streams 23 0 –Warrego Pp4.2: Permanent wetland 18 0 –Warrego Pt1.1.1: Intermittent River red gum floodplain swamp 9 0 –Warrego Pt1.1.2: Intermittent River red gum swamps 2 0 –Warrego Pps5: Permanent springs 2 0 –Warrego Pst1.1: Temporary saline swamp 2 0 –Warrego Pt2.2.2: Temporary sedge/grass/forb marsh 1 0 –Warrego Ru1: Unspecified river (landform unknown) 1 0 –Wimmera Lt1.1: Temporary lakes 26 884 0 –Wimmera Lst2.1: Temporary saline floodplain lakes 5 877 0 –Wimmera Pt3.1.2: Clay pans 4 811 0 –Wimmera Lt2.1: Temporary floodplain lakes 3 951 0 –Wimmera Pst4: Temporary saline wetland 2 922 0 –Wimmera Pt1.6.2: Temporary woodland swamp 2 198 0 –Wimmera Pt1.1.1: Intermittent River red gum floodplain swamp 1 999 0 –Wimmera Pt1.1.2: Intermittent River red gum swamps 1 927 0 –Wimmera Pt2.3.1: Floodplain freshwater meadow 1 571 0 –Wimmera Pst1.1: Temporary saline swamp 1 563 0 –Wimmera Lst1.1: Temporary saline lakes 1 505 0 –Wimmera Lp1.2: Permanent lakes with aquatic beds 817 0 –Wimmera Psp3.1: Permanent seagrass marshes 780 0 –Wimmera Psp4: Permanent saline wetland 732 0 –Wimmera Pt1.6.1: Temporary woodland floodplain swamp 694 0 –Wimmera Pt2.3.2: Freshwater meadow 619 0 –Wimmera Pt3.1.1: Floodplain clay pans 577 0 –Wimmera Pt4.2: Temporary wetland 500 0 –Wimmera Lt2.2: Temporary floodplain lakes with aquatic beds 498 0 –Wimmera Pst2.2: Temporary salt marsh 435 0 –Wimmera Pst3.2: Salt pans and salt flats 423 0 –
Wimmera Lst2.2: Temporary saline floodplain lakes with aquatic beds 391 0 –
Wimmera Lp1.1: Permanent lakes 276 0 –Wimmera Pt1.2.1: Intermittent Black box floodplain swamp 218 0 –Wimmera Lt1.2: Temporary lakes with aquatic beds 216 0 –Wimmera Lp2.2: Permanent floodplain lakes with aquatic beds 161 0 –Wimmera Lp2.1: Permanent floodplain lakes 158 0 –Wimmera Pp4.2: Permanent wetland 97 0 –Wimmera Lst1.2: Temporary saline lakes with aquatic beds 77 0 –Wimmera Pt2.2.2: Temporary sedge/grass/forb marsh 70 0 –Wimmera Pp4.1: Permanent floodplain wetland 69 0 –Wimmera Pt2.1.2: Temporary tall emergent marsh 64 0 –Wimmera Pt2.1.1: Temporary tall emergent floodplain marsh 55 0 –Wimmera Pt1.7.1: Intermittent Lignum floodplain swamp 47 0 –Wimmera Pt1.2.2: Intermittent Black box swamp 31 0 –Wimmera Pp2.4.2: Permanent forb marshes 21 0 –Wimmera Lsp1.1: Permanent saline lakes 20 0 –Wimmera Lsp1.2: Permanent saline lakes with aquatic beds 18 0 –Wimmera Pt4.1: Temporary floodplain wetland 8 0 –
2015–16 Basin-scale evaluation of Commonwealth environmental water – Ecosystem Diversity 37

Valley name Australian National Aquatic Ecosystem (ANAE) wetland type
Totalarea (ha)
Influenced by Commonwealth
environmental waterArea (ha) % of total
Wimmera Pt2.2.1: Temporary sedge/grass/forb floodplain marsh 6 0 –Wimmera Psp1.1: Saline paperbark swamp 5 0 –Wimmera Pp2.4.1: Permanent floodplain forb marshes 3 0 –
2015–16 Basin-scale evaluation of Commonwealth environmental water – Ecosystem Diversity 38

Annex C. ANAE floodplain types inundated by Commonwealth environmental water by valleyFor floodplains, the area inundated by out-of-channel delivery of Commonwealth environmental water is presented in Table C1.
Table C1. Area of each floodplain ecosystem type and the contribution of Commonwealth environmental water to supporting floodplain ecosystem diversity within each valley, sorted by the area inundated with inundation highlighted in blue.
Valley name Australian National Aquatic Ecosystem (ANAE) floodplain type
Totalarea (ha)
Inundated by Commonwealth
environmental waterArea (ha) % of total
Avoca F4: Floodplain with unspecified vegetation 6 896 0 –Avoca F1.8: Black box woodland floodplain 3 947 0 –Avoca F1.12: Woodland floodplain 2 571 0 –Avoca F1.6: Black box forest floodplain 1 625 0 –Avoca F2.4: Shrubland floodplain 130 0 –Avoca F3.1: Upland sedge/forb/grassland floodplain 38 0 –Avoca F2.2: Lignum shrubland floodplain 22 0 –Avoca F3.2: Sedge/forb/grassland floodplain 6 0 –Avoca F2.3: Upland shrubland floodplain 5 0 –Barwon Darling F3.2: Sedge/forb/grassland floodplain 240 395 0 –Barwon Darling F1.10: Coolibah woodland and forest floodplain 93 465 0 –Barwon Darling F1.6: Black box forest floodplain 54 878 0 –Barwon Darling F2.4: Shrubland floodplain 37 069 0 –Barwon Darling F4: Floodplain with unspecified vegetation 20 951 0 –Barwon Darling F1.8: Black box woodland floodplain 10 977 0 –Barwon Darling F1.12: Woodland floodplain 5 923 0 –Barwon Darling F1.2: River red gum forest floodplain 3 889 0 –Barwon Darling F1.4: River red gum woodland floodplain 48 0 –Barwon Darling F2.3: Upland shrubland floodplain 37 0 –Barwon Darling F1.5: Upland black box forest floodplain 12 0 –Barwon Darling F1.7: Upland black box woodland floodplain 11 0 –Border Rivers F1.12: Woodland floodplain 55 700 0 –Border Rivers F1.2: River red gum forest floodplain 21 268 0 –Border Rivers F4: Floodplain with unspecified vegetation 15 059 0 –Border Rivers F1.10: Coolibah woodland and forest floodplain 5 657 0 –Border Rivers F3.2: Sedge/forb/grassland floodplain 4 014 0 –Border Rivers F1.8: Black box woodland floodplain 3 307 0 –Border Rivers F2.4: Shrubland floodplain 250 0 –Broken F1.12: Woodland floodplain 3 792 0 –Broken F4: Floodplain with unspecified vegetation 2 122 0 –Broken F1.4: River red gum woodland floodplain 1 633 0 –Broken F1.8: Black box woodland floodplain 1 272 0 –Broken F3.2: Sedge/forb/grassland floodplain 144 0 –Broken F3.1: Upland sedge/forb/grassland floodplain 45 0 –Broken F1.2: River red gum forest floodplain 14 0 –Broken F2.2: Lignum shrubland floodplain 9 0 –Broken F1.3: Upland River red gum woodland floodplain 8 0 –Campaspe F4: Floodplain with unspecified vegetation 4 0 –Campaspe F1.12: Woodland floodplain 3 0 –Castlereagh F1.8: Black box woodland floodplain 15 331 0 –Castlereagh F1.12: Woodland floodplain 427 0 –Castlereagh F1.10: Coolibah woodland and forest floodplain 418 0 –Castlereagh F2.4: Shrubland floodplain 156 0 –Castlereagh F1.2: River red gum forest floodplain 66 0 –
2015–16 Basin-scale evaluation of Commonwealth environmental water – Ecosystem Diversity 39
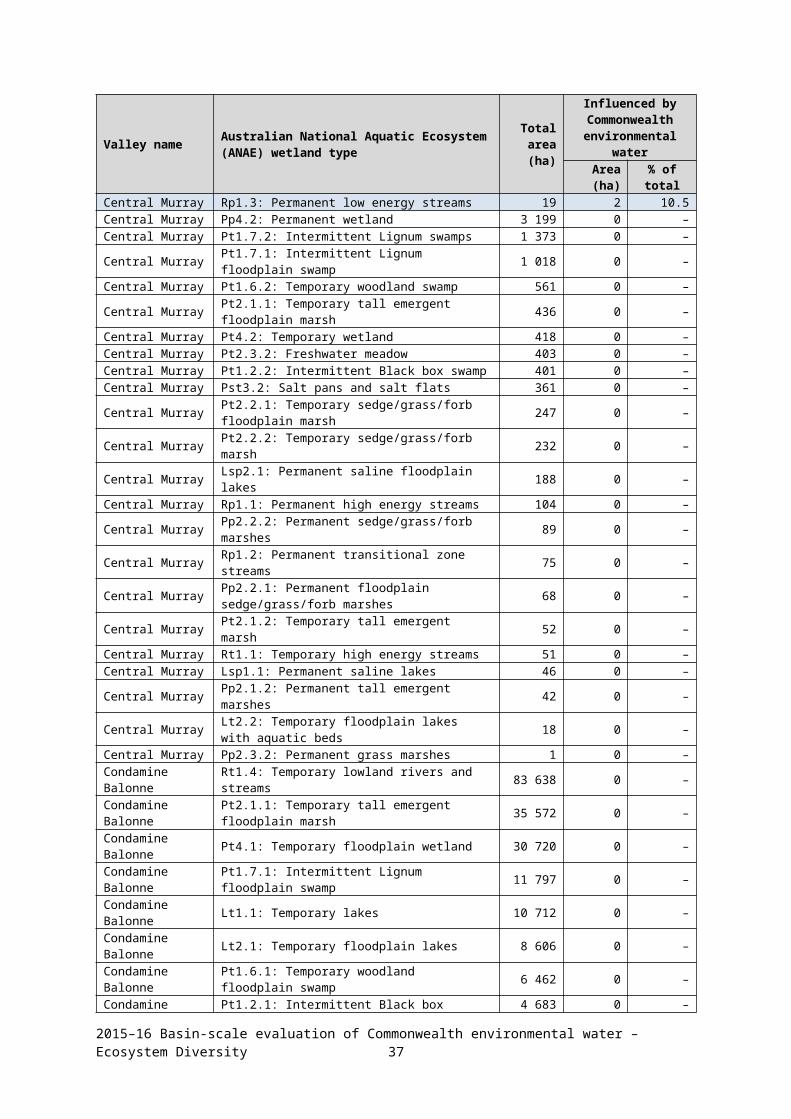
Valley name Australian National Aquatic Ecosystem (ANAE) floodplain type
Totalarea (ha)
Inundated by Commonwealth
environmental waterArea (ha) % of total
Castlereagh F4: Floodplain with unspecified vegetation 50 0 –Central Murray F1.2: River red gum forest floodplain 93 402 5 432 5.8Central Murray F1.4: River red gum woodland floodplain 113 670 4 438 3.9Central Murray F1.8: Black box woodland floodplain 40 047 117 0.3Central Murray F3.2: Sedge/forb/grassland floodplain 2 006 5 0.2Central Murray F4: Floodplain with unspecified vegetation 34 112 4 <0.1Central Murray F1.3: Upland River red gum woodland floodplain 27 4 14.8Central Murray F1.6: Black box forest floodplain 3 885 3 0.1Central Murray F3.1: Upland sedge/forb/grassland floodplain 2 2 100.0Central Murray F2.2: Lignum shrubland floodplain 3 210 0 –Central Murray F1.12: Woodland floodplain 2 203 0 –Central Murray F2.4: Shrubland floodplain 1 105 0 –Central Murray F1.1: Upland river red gum forest floodplain 64 0 –Central Murray F2.3: Upland shrubland floodplain 47 0 –Central Murray F1.7: Upland black box woodland floodplain 16 0 –Condamine Balonne F1.10: Coolibah woodland and forest floodplain 709 056 0 –Condamine Balonne F3.2: Sedge/forb/grassland floodplain 291 601 0 –Condamine Balonne F4: Floodplain with unspecified vegetation 189 245 0 –Condamine Balonne F1.12: Woodland floodplain 80 812 0 –Condamine Balonne F2.4: Shrubland floodplain 23 608 0 –Condamine Balonne F1.8: Black box woodland floodplain 9 427 0 –Condamine Balonne F2.2: Lignum shrubland floodplain 2 087 0 –Condamine Balonne F1.2: River red gum forest floodplain 1 669 0 –Condamine Balonne F3.1: Upland sedge/forb/grassland floodplain 460 0 –Condamine Balonne F1.4: River red gum woodland floodplain 283 0 –Condamine Balonne F2.3: Upland shrubland floodplain 168 0 –Condamine Balonne F1.9: Upland coolibah woodland and forest floodplain 23 0 –Condamine Balonne F1.1: Upland river red gum forest floodplain 1 0 –Edward Wakool F1.8: Black box woodland floodplain 56 406 0 –Edward Wakool F1.4: River red gum woodland floodplain 37 923 0 –Edward Wakool F3.2: Sedge/forb/grassland floodplain 17 171 0 –Edward Wakool F1.2: River red gum forest floodplain 7 726 0 –Edward Wakool F4: Floodplain with unspecified vegetation 6 819 0 –Edward Wakool F1.12: Woodland floodplain 5 923 0 –Edward Wakool F1.6: Black box forest floodplain 328 0 –Edward Wakool F2.4: Shrubland floodplain 258 0 –Edward Wakool F2.2: Lignum shrubland floodplain 177 0 –Edward Wakool F1.1: Upland river red gum forest floodplain 9 0 –Edward Wakool F1.3: Upland River red gum woodland floodplain 1 0 –Goulburn F4: Floodplain with unspecified vegetation 11 834 0 –Goulburn F1.4: River red gum woodland floodplain 9 296 0 –Goulburn F1.2: River red gum forest floodplain 4 712 0 –Goulburn F1.12: Woodland floodplain 2 208 0 –Goulburn F1.3: Upland River red gum woodland floodplain 1 249 0 –Goulburn F3.2: Sedge/forb/grassland floodplain 671 0 –Goulburn F1.8: Black box woodland floodplain 178 0 –Goulburn F2.2: Lignum shrubland floodplain 63 0 –Goulburn F3.1: Upland sedge/forb/grassland floodplain 11 0 –Gwydir F4: Floodplain with unspecified vegetation 31 963 1 119 3.5Gwydir F1.10: Coolibah woodland and forest floodplain 9 337 559 6.0Gwydir F3.2: Sedge/forb/grassland floodplain 5 735 249 4.3Gwydir F1.9: Upland coolibah woodland and forest floodplain 2 690 110 4.1Gwydir F1.12: Woodland floodplain 5 072 33 0.7Gwydir F1.4: River red gum woodland floodplain 127 25 19.7Gwydir F1.2: River red gum forest floodplain 1 023 21 2.1Gwydir F1.1: Upland river red gum forest floodplain 28 5 17.9
2015–16 Basin-scale evaluation of Commonwealth environmental water – Ecosystem Diversity 40

Valley name Australian National Aquatic Ecosystem (ANAE) floodplain type
Totalarea (ha)
Inundated by Commonwealth
environmental waterArea (ha) % of total
Gwydir F1.8: Black box woodland floodplain 38 1 2.6Gwydir F2.4: Shrubland floodplain 221 0 –Gwydir F1.11: River cooba woodland floodplain 143 0 –Gwydir F3.1: Upland sedge/forb/grassland floodplain 36 0 –Kiewa F4: Floodplain with unspecified vegetation 13 0 –Kiewa F1.12: Woodland floodplain 2 0 –Lachlan F1.2: River red gum forest floodplain 26 769 6 596 24.6Lachlan F2.2: Lignum shrubland floodplain 156 027 6 155 3.9Lachlan F1.8: Black box woodland floodplain 50 431 2 227 4.4Lachlan F1.4: River red gum woodland floodplain 15 357 1 955 12.7Lachlan F2.4: Shrubland floodplain 19 626 327 1.7Lachlan F3.2: Sedge/forb/grassland floodplain 44 792 260 0.6Lachlan F4: Floodplain with unspecified vegetation 56 921 0 –Lachlan F1.6: Black box forest floodplain 22 022 0 –Lachlan F1.12: Woodland floodplain 2 398 0 –Lachlan F1.7: Upland black box woodland floodplain 797 0 –Lachlan F1.1: Upland river red gum forest floodplain 289 0 –Lachlan F3.1: Upland sedge/forb/grassland floodplain 141 0 –Lachlan F1.5: Upland black box forest floodplain 43 0 –Lachlan F1.3: Upland River red gum woodland floodplain 28 0 –Lachlan F2.1: Upland lignum shrubland floodplain 27 0 –Lachlan F2.3: Upland shrubland floodplain 18 0 –Loddon F4: Floodplain with unspecified vegetation 20 792 0 –Loddon F1.8: Black box woodland floodplain 6 267 0 –Loddon F3.2: Sedge/forb/grassland floodplain 3 149 0 –Loddon F1.12: Woodland floodplain 1 261 0 –Loddon F2.2: Lignum shrubland floodplain 850 0 –Loddon F1.4: River red gum woodland floodplain 347 0 –Loddon F1.2: River red gum forest floodplain 25 0 –Loddon F3.1: Upland sedge/forb/grassland floodplain 15 0 –Loddon F1.6: Black box forest floodplain 14 0 –Loddon F2.4: Shrubland floodplain 13 0 –Lower Darling F1.6: Black box forest floodplain 88 806 0 –Lower Darling F1.2: River red gum forest floodplain 13 902 0 –Lower Darling F2.4: Shrubland floodplain 10 585 0 –Lower Darling F1.8: Black box woodland floodplain 4 145 0 –Lower Darling F1.12: Woodland floodplain 1 318 0 –Lower Darling F2.2: Lignum shrubland floodplain 599 0 –Lower Darling F4: Floodplain with unspecified vegetation 306 0 –Lower Darling F2.3: Upland shrubland floodplain 139 0 –Lower Darling F3.2: Sedge/forb/grassland floodplain 114 0 –Lower Darling F1.5: Upland black box forest floodplain 39 0 –Lower Darling F1.1: Upland river red gum forest floodplain 32 0 –Lower Darling F3.1: Upland sedge/forb/grassland floodplain 5 0 –Lower Murray F2.4: Shrubland floodplain 83 534 1 450 1.7Lower Murray F1.8: Black box woodland floodplain 11 573 741 6.4Lower Murray F2.2: Lignum shrubland floodplain 37 217 733 2.0Lower Murray F4: Floodplain with unspecified vegetation 6 500 552 8.5Lower Murray F1.4: River red gum woodland floodplain 11 648 336 2.9Lower Murray F1.2: River red gum forest floodplain 8 767 241 2.7Lower Murray F3.2: Sedge/forb/grassland floodplain 2 814 86 3.1Lower Murray F1.3: Upland River red gum woodland floodplain 938 37 3.9Lower Murray F1.7: Upland black box woodland floodplain 495 33 6.7Lower Murray F1.1: Upland river red gum forest floodplain 65 11 16.9Lower Murray F3.1: Upland sedge/forb/grassland floodplain 1 205 9 0.7Lower Murray F2.3: Upland shrubland floodplain 798 9 1.1
2015–16 Basin-scale evaluation of Commonwealth environmental water – Ecosystem Diversity 41

Valley name Australian National Aquatic Ecosystem (ANAE) floodplain type
Totalarea (ha)
Inundated by Commonwealth
environmental waterArea (ha) % of total
Lower Murray F2.1: Upland lignum shrubland floodplain 460 9 2.0Lower Murray F1.12: Woodland floodplain 7 559 6 0.1Lower Murray F1.6: Black box forest floodplain 5 942 0 –Macquarie F3.2: Sedge/forb/grassland floodplain 169 235 4 536 2.7Macquarie F2.4: Shrubland floodplain 26 868 29 0.1Macquarie F1.10: Coolibah woodland and forest floodplain 125 341 0 –Macquarie F1.2: River red gum forest floodplain 24 051 0 –Macquarie F4: Floodplain with unspecified vegetation 6 027 0 –Macquarie F1.8: Black box woodland floodplain 5 414 0 –Macquarie F1.12: Woodland floodplain 4 913 0 –Macquarie F1.4: River red gum woodland floodplain 3 086 0 –Macquarie F1.6: Black box forest floodplain 635 0 –Macquarie F1.11: River cooba woodland floodplain 10 0 –Macquarie F1.1: Upland river red gum forest floodplain 4 0 –Macquarie F1.7: Upland black box woodland floodplain <1 0 –Mitta Mitta F4: Floodplain with unspecified vegetation 67 0 –Mitta Mitta F3.1: Upland sedge/forb/grassland floodplain 19 0 –Murrumbidgee F2.4: Shrubland floodplain 84 100 8 154 9.7Murrumbidgee F1.2: River red gum forest floodplain 58 050 7 219 12.4Murrumbidgee F1.8: Black box woodland floodplain 15 677 1 474 9.4Murrumbidgee F1.4: River red gum woodland floodplain 15 480 883 5.7Murrumbidgee F3.2: Sedge/forb/grassland floodplain 13 644 88 0.6Murrumbidgee F4: Floodplain with unspecified vegetation 21 024 16 0.1Murrumbidgee F1.12: Woodland floodplain 8 025 15 0.2Murrumbidgee F1.1: Upland river red gum forest floodplain 277 2 0.7Murrumbidgee F2.2: Lignum shrubland floodplain 958 0 –Murrumbidgee F3.1: Upland sedge/forb/grassland floodplain 29 0 –Murrumbidgee F1.6: Black box forest floodplain 25 0 –Murrumbidgee F1.3: Upland River red gum woodland floodplain 5 0 –Murrumbidgee F2.3: Upland shrubland floodplain 3 0 –Namoi F1.12: Woodland floodplain 23 594 0 –Namoi F1.8: Black box woodland floodplain 6 943 0 –Namoi F4: Floodplain with unspecified vegetation 4 923 0 –Namoi F1.2: River red gum forest floodplain 3 911 0 –Namoi F2.4: Shrubland floodplain 159 0 –Namoi F1.10: Coolibah woodland and forest floodplain 3 0 –Ovens F1.4: River red gum woodland floodplain 8 540 0 –Ovens F1.2: River red gum forest floodplain 2 140 0 –Ovens F1.12: Woodland floodplain 565 0 –Ovens F4: Floodplain with unspecified vegetation 508 0 –Ovens F3.2: Sedge/forb/grassland floodplain 442 0 –Ovens F3.1: Upland sedge/forb/grassland floodplain 68 0 –Ovens F1.1: Upland river red gum forest floodplain 4 0 –Paroo F3.2: Sedge/forb/grassland floodplain 330 407 0 –Paroo F1.12: Woodland floodplain 290 746 0 –Paroo F1.10: Coolibah woodland and forest floodplain 80 456 0 –Paroo F2.4: Shrubland floodplain 55 870 0 –Paroo F1.6: Black box forest floodplain 16 974 0 –Paroo F1.8: Black box woodland floodplain 1 490 0 –Paroo F2.2: Lignum shrubland floodplain 435 0 –Paroo F1.4: River red gum woodland floodplain 201 0 –Paroo F4: Floodplain with unspecified vegetation 144 0 –Paroo F2.3: Upland shrubland floodplain 90 0 –Paroo F1.9: Upland coolibah woodland and forest floodplain 43 0 –Paroo F3.1: Upland sedge/forb/grassland floodplain 28 0 –Paroo F1.5: Upland black box forest floodplain 19 0 –
2015–16 Basin-scale evaluation of Commonwealth environmental water – Ecosystem Diversity 42

Valley name Australian National Aquatic Ecosystem (ANAE) floodplain type
Totalarea (ha)
Inundated by Commonwealth
environmental waterArea (ha) % of total
Paroo F1.3: Upland River red gum woodland floodplain <1 0 –Upper Murray F4: Floodplain with unspecified vegetation 131 0 –Warrego F1.10: Coolibah woodland and forest floodplain 781 155 0 –Warrego F3.2: Sedge/forb/grassland floodplain 36 883 0 –Warrego F1.12: Woodland floodplain 25 313 0 –Warrego F1.4: River red gum woodland floodplain 5 175 0 –Warrego F2.4: Shrubland floodplain 3 394 0 –Warrego F2.2: Lignum shrubland floodplain 1 404 0 –Warrego F4: Floodplain with unspecified vegetation 522 0 –Warrego F1.8: Black box woodland floodplain 441 0 –Warrego F3.1: Upland sedge/forb/grassland floodplain 154 0 –Warrego F1.3: Upland River red gum woodland floodplain 93 0 –Warrego F1.9: Upland coolibah woodland and forest floodplain 75 0 –Warrego F2.3: Upland shrubland floodplain 49 0 –Wimmera F1.4: River red gum woodland floodplain 3 084 0 –Wimmera F4: Floodplain with unspecified vegetation 3 061 0 –Wimmera F1.12: Woodland floodplain 2 992 0 –Wimmera F1.8: Black box woodland floodplain 1 600 0 –Wimmera F3.2: Sedge/forb/grassland floodplain 802 0 –Wimmera F3.1: Upland sedge/forb/grassland floodplain 184 0 –Wimmera F2.3: Upland shrubland floodplain 165 0 –Wimmera F1.3: Upland River red gum woodland floodplain 164 0 –Wimmera F2.4: Shrubland floodplain 109 0 –Wimmera F1.7: Upland black box woodland floodplain 69 0 –Wimmera F2.2: Lignum shrubland floodplain 68 0 –Wimmera F1.6: Black box forest floodplain 58 0 –
2015–16 Basin-scale evaluation of Commonwealth environmental water – Ecosystem Diversity 43
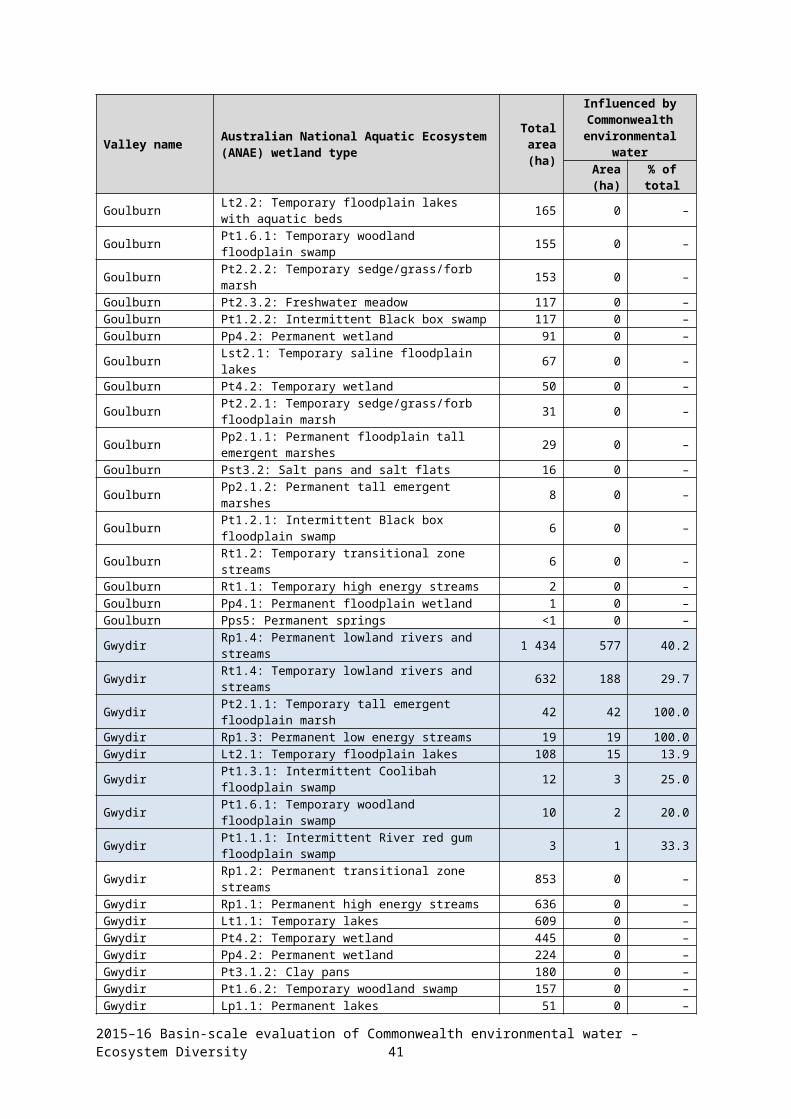
Annex D. ANAE river channel types influenced by Commonwealth environmental water by valleyThe length of river and stream channels of differing ANAE type influenced by the delivery of Commonwealth environmental water is presented in Table D1 as an in indicator of the contribution of Commonwealth environmental water towards ecosystem diversity within each valley. River length measurement is highly dependent on the resolution of the mapping with higher resolution mapping capturing more twists and turns in the river that increase the measured river length along the flow path between two points. The Basin ANAE waterway mapping compiles state data that varies in resolution from 1:70 000 to 1:100 000.
Commonwealth environmental water is typically delivered from storages into lowland rivers. In hilly landscapes and where rivers cut through gorges the ANAE classification often identifies individual river sections as high energy streams. These transition into low energy lowland rivers as the valleys widen and flatten further downstream. The different ANAE types recorded in Table D1 are mostly different ecosystem types identified on the same major river within each valley rather than separate watercourses.
Table D1. Length of river and stream ecosystem types influenced by the delivery of Commonwealth environmental water as represented by the Basin ANAE waterways data set in each valley
Valley name Australian National Aquatic Ecosystem (ANAE) waterway type Length (km)
Avoca – –Barwon Darling Rp1.4: Permanent lowland rivers and streams 2 950Barwon Darling Rt1.4: Temporary lowland rivers and streams 508Border Rivers Rp1.4: Permanent lowland rivers and streams 987Border Rivers Rt1.4: Temporary lowland rivers and streams 639Border Rivers Rt1.1: Temporary high energy streams 88Border Rivers Rp1.2: Permanent transitional zone streams 79Border Rivers Rp1.1: Permanent high energy streams 29Border Rivers Rt1.2: Temporary transitional zone streams 14Broken Rt1.4: Temporary lowland rivers and streams 276Campaspe Rp1.4: Permanent lowland rivers and streams 98Campaspe Rp1.2: Permanent transitional zone streams 28Campaspe Rp1.3: Permanent low energy streams 19Campaspe Rt1.4: Temporary lowland rivers and streams 17Campaspe Rp1.1: Permanent high energy streams 8Campaspe Rt1.2: Temporary transitional zone streams 3Campaspe Rt1.3: Temporary low energy streams 2Castlereagh – –Central Murray Rp1.4: Permanent lowland rivers and streams 2 176Central Murray Rt1.4: Temporary lowland rivers and streams 223Central Murray Rp1.3: Permanent low energy streams 53Central Murray Rp1.2: Permanent transitional zone streams 41Central Murray Rp1.1: Permanent high energy streams 9Central Murray Rt1.1: Temporary high energy streams 5Central Murray Rt1.3: Temporary low energy streams 1Condamine Balonne Rt1.4: Temporary lowland rivers and streams 1 400Condamine Balonne Rp1.4: Permanent lowland rivers and streams 935Edward Wakool Rp1.4: Permanent lowland rivers and streams 969Edward Wakool Rt1.4: Temporary lowland rivers and streams 80Goulburn Rp1.4: Permanent lowland rivers and streams 343Goulburn Rp1.1: Permanent high energy streams 106Goulburn Rp1.2: Permanent transitional zone streams 47Goulburn Rt1.4: Temporary lowland rivers and streams 26Goulburn Rt1.1: Temporary high energy streams 6Goulburn Rt1.3: Temporary low energy streams 5
2015–16 Basin-scale evaluation of Commonwealth environmental water – Ecosystem Diversity 44
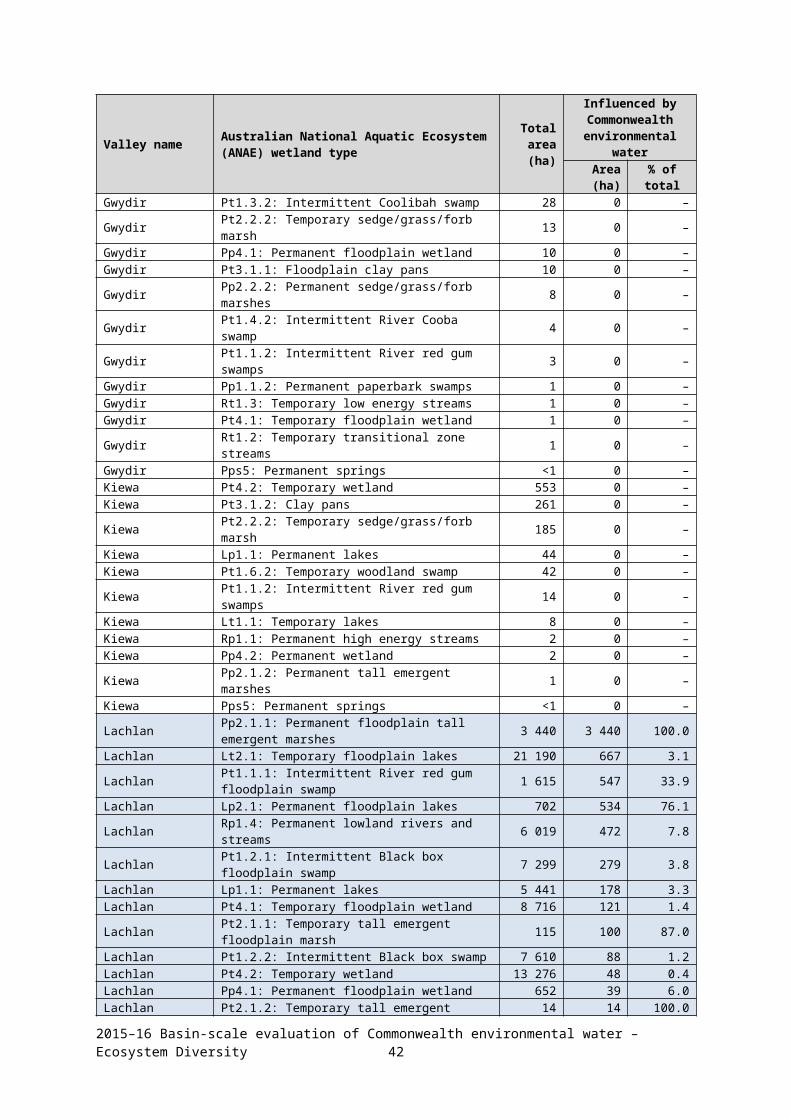
Goulburn Rt1.2: Temporary transitional zone streams 4Gwydir Rp1.4: Permanent lowland rivers and streams 580Gwydir Rt1.4: Temporary lowland rivers and streams 190Gwydir Rp1.2: Permanent transitional zone streams 170Gwydir Rp1.1: Permanent high energy streams 116Gwydir Rp1.3: Permanent low energy streams 44Gwydir Rt1.3: Temporary low energy streams 27Kiewa – –Lachlan Rp1.4: Permanent lowland rivers and streams 1 294Lachlan Rt1.4: Temporary lowland rivers and streams 184Lachlan Rp1.1: Permanent high energy streams 77Lachlan Rp1.2: Permanent transitional zone streams 38Lachlan Rp1.3: Permanent low energy streams 4Loddon Rp1.4: Permanent lowland rivers and streams 463Loddon Rp1.2: Permanent transitional zone streams 52Loddon Rt1.4: Temporary lowland rivers and streams 40Loddon Rt1.2: Temporary transitional zone streams 3Loddon Rp1.1: Permanent high energy streams 2Lower Darling – –Lower Murray Rp1.4: Permanent lowland rivers and streams 991Macquarie Rp1.4: Permanent lowland rivers and streams 598Macquarie Rp1.2: Permanent transitional zone streams 145Macquarie Rp1.1: Permanent high energy streams 72Macquarie Rt1.4: Temporary lowland rivers and streams 14Mitta Mitta – –Murrumbidgee Rp1.4: Permanent lowland rivers and streams 1 590Murrumbidgee Rt1.4: Temporary lowland rivers and streams 121Murrumbidgee Rp1.1: Permanent high energy streams 104Murrumbidgee Rp1.2: Permanent transitional zone streams 29Murrumbidgee Rp1.3: Permanent low energy streams 26Murrumbidgee Rt1.3: Temporary low energy streams 3Murrumbidgee Rt1.2: Temporary transitional zone streams 2Namoi –Ovens Rp1.4: Permanent lowland rivers and streams 295Ovens Rt1.4: Temporary lowland rivers and streams 140Ovens Rt1.1: Temporary high energy streams 55Ovens Rp1.1: Permanent high energy streams 4Ovens Rp1.2: Permanent transitional zone streams 8Ovens Rp1.3: Permanent low energy streams 2Paroo – –Upper Murray – –Warrego Rp1.4: Permanent lowland rivers and streams 302Warrego Rt1.4: Temporary lowland rivers and streams 181Warrego Rt1.2: Temporary transitional zone streams 6Warrego Rp1.3: Permanent low energy streams 4Wimmera – –
2015–16 Basin-scale evaluation of Commonwealth environmental water – Ecosystem Diversity 45